Notebook reviews with Intel UHD Graphics 620 graphics card
NiPoGi CK10 with the Intel Core i7-10810U reviewed: Small office PC offering space for three SSDs
In times of continually rising energy prices, compact PCs are exceptionally popular due to having considerably lower energy consumption than their traditional desktop siblings. With the NiPoGi CK10, we put this small, six core office PC through its paces. It's an extremely quiet device but how snappy is its SoC? In our review, we reveal all you need to know about the Intel Core i7-10810U based NiPoGi CK10.
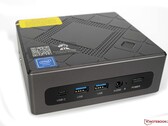
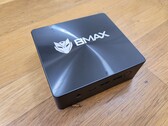
Intel Core i7-10810U, UHD Graphics 620, 468 gIntel Core i5-8260U debut: BMAX B5 Pro G7H8 mini PC review
Can a years old 8th gen Intel CPU keep up with the latest 12th gen options? Surprisingly yes so long as you don't plan on running anything graphics intensive. Its retail price of under $300 USD is hard to pass up for many HTPC setups.
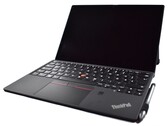
Intel Core i5-8260U, UHD Graphics 620, 369 gLenovo ThinkPad X12 laptop review: Detachable with Intel Core i3 is quite slow
We have already reviewed the Lenovo ThinkPad X12 Detachable with i7, and now we will update our review of the i3 version. There is one thing to say in advance: we cannot recommend the CPU downgrade to the i3.
Intel Core i3-1110G4, UHD Graphics 620, 12.3", 1.1 kgGetac B360 rugged laptop review: Bright 1400-nit touchscreen
The B360 is one of the few 13.3-inch rugged laptops in the market, but it doesn't skimp on accessible features or display quality. However, its use of an older Comet Lake-U processor means owners will be missing out on the more advanced features of Intel Tiger Lake.
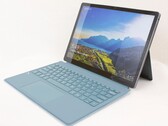
Intel Core i7-10710U, UHD Graphics 620, 13.3", 2.4 kgKUU LeBook 12.6 2-in-1 convertible review: A cheaper Microsoft Surface Pro alternative
There are a lot of Windows 10 tablets to choose from beyond the Microsoft ones. The KUU LeBook is perhaps the closest in terms of visual design and performance while costing potentially hundreds of dollars less, but it misses the mark in a few areas.
Intel Core i7-8550U, UHD Graphics 620, 12.6", 859 gMSI Cubi 5 10M: Intel Core i3-10110U, 27.00"
Review » MSI Cubi 5 10M with Core i3-10110U and 27-inch monitor MD271 in review
Panasonic Toughbook FZ-G2: Intel Core i5-10310U, 10.10", 1.5 kg
Review » Panasonic Toughbook FZ-G2 rugged convertible review: Tablet with removable M.2 PCIe storage
Huawei MateBook X Silver Frost (2020): Intel Core i5-10210U, 13.00", 1 kg
Review » Huawei MateBook X in review: Ultra-thin, extremely light and absolutely silent
Lenovo IdeaPad Flex 5 CB 13IML05 82B80010GE: Intel Core i5-10210U, 13.30", 1.4 kg
Review » Lenovo IdeaPad Flex 5 Chromebook 13IML05 Review: 2-in-1 device with an optional stylus
Acer Chromebook Spin 713 CP713-2W-560V: Intel Core i5-10210U, 13.50", 1.4 kg
Review » Acer Chromebook Spin 713 CP713-2W Review: Touchscreen with a 3:2 aspect ratio
Dell Latitude 12 7210 2-in-1: Intel Core i7-10610U, 12.30", 0.9 kg
Review » Dell Latitude 12 7210 2-in-1 in review: Comet Lake provides better battery life
HP EliteBook x360 1040 G7, i7-10810U: Intel Core i7-10810U, 14.00", 1.4 kg
Review » HP EliteBook x360 1040 G7 Review: A Spectre For Professionals
Prime Computer PrimeMini 5 i7 NUC8v7PNB: Intel Core i7-8665U, 1.3 kg
Review » Prime Computer PrimeMini 5 i7 (Intel Provo Canyon NUC8v7PNB) Mini PC Review: Passively-Cooled Whiskey Lake for Enterprise
Fujitsu LifeBook U9310X: Intel Core i5-10210U, 13.30", 1 kg
Review » Fujitsu Lifebook U9310X - 1 kg business convertible with LTE in review
Dell Latitude 5310-23VP6: Intel Core i5-10310U, 13.30", 1.3 kg
Review » Dell Latitude 5310 2-in-1 convertible in review: 11-hour long-distance runner
Dell Latitude 15 3510 NK2MC: Intel Core i3-10110U, 15.60", 1.9 kg
Review » Dell Latitude 3510 Review: Good Battery Life Despite Small Battery
HP EliteBook x360 1030 G7: Intel Core i7-10810U, 13.30", 1.2 kg
Review » HP EliteBook x360 1030 G7 Convertible Review: A Spectre Dragonfly Hybrid
Dynabook Portégé X40-G-10K: Intel Core i5-10210U, 14.00", 1.3 kg
Review » Dynabook Portégé X40-G in Review: Luxury business notebook offers display protection against unwanted glances
Lenovo Yoga Duet 7 13IML05-82AS000WGE: Intel Core i5-10210U, 13.00", 1.2 kg
Review » Lenovo Yoga Duet 7 Review: Surface Pro 7 competitor with only a few weaknesses
Dell Latitude 7410 Chromebook Enterprise 2-in-1: Intel Core i5-10310U, 14.00", 1.5 kg
Review » Dell Latitude 7410 Chromebook Enterprise 2-in-1 (Core i5-10310U, 16 GB RAM) Review
Fujitsu LifeBook U7310: Intel Core i5-10210U, 13.30", 1.2 kg
Review » Fujitsu LifeBook U7310 Laptop Review: Good 13-inch business laptop without performance ambitions, but with unique selling point
Dell Latitude 7410 Chromebook Enterprise: Intel Core i5-10310U, 14.00", 1.4 kg
Review » Dell Latitude 7410 Chromebook Enterprise (Core i5-10310U, 16 GB RAM) Review
Dynabook Satellite Pro C50-E-105: Intel Core i5-8250U, 15.60", 1.8 kg
Review » Dynabook Satellite Pro C50-E in review: Business notebook with well-hung hardware
Dell Latitude 14 5410-RJ80D: Intel Core i5-10310U, 14.00", 1.6 kg
Review » Dell Latitude 14 5410 laptop review: Restrained by missing AMD Ryzen option
Dell Latitude 15 5510-D90XK: Intel Core i5-10310U, 15.60", 1.8 kg
Review » Dell Latitude 15 5510 laptop review: Office notebook with prepared WWAN
Dell Latitude 5310-GXX0D: Intel Core i5-10310U, 13.30", 1.2 kg
Review » Dell Latitude 5310 in review: Business laptop with long battery life
Zotac ZBOX MI642 Nano: Intel Core i5-10210U, 0.5 kg
Review » Zotac ZBOX MI642 Nano Desktop Hands-On
Lenovo ThinkBook Plus 13 i7: Intel Core i7-10510U, 13.30", 1.4 kg
Review » Lenovo ThinkBook Plus Laptop Review: Unique E-Ink Display Meets Average Hardware
Lenovo ThinkPad X13 Yoga 20SX0004GE: Intel Core i7-10510U, 13.30", 1.3 kg
Review » Lenovo ThinkPad X13 Yoga in review: Extensively equipped business convertible
HP EliteBook 830 G7: Intel Core i7-10810U, 13.30", 1.3 kg
Review » HP EliteBook 830 G7 Laptop Review: Premium for the Mainstream
Asus VivoBook 17 F712FA-AU518T: Intel Core i5-10210U, 17.30", 2.3 kg
Review » Asus VivoBook 17 F712FA Review: Lackluster 17.3-inch laptop for home
Dell Latitude 14 9410 2-in-1 P110G: Intel Core i7-10610U, 14.00", 1.5 kg
Review » Dell Latitude 14 9410 2-in-1 Convertible Review: A Latitude 7400 At Heart
Acer TravelMate P6 P614-51T-G2-72ZU: Intel Core i7-10510U, 14.00", 1.2 kg
Review » Acer TravelMate P6 in review: Lightweight business laptop with long battery life
Acer TravelMate P215-52: Intel Core i7-10510U, 15.60", 1.8 kg
Review » Acer TravelMate P2 TMP215-52 Laptop Review: Affordable Business
Lenovo ThinkPad X13-20T20033GE: Intel Core i5-10210U, 13.30", 1.3 kg
Review » Lenovo ThinkPad X13 Laptop Review: small, light, and 4G compatible
Lenovo ThinkPad T14s-20T00044GE: Intel Core i5-10210U, 14.00", 1.3 kg
Review » Lenovo ThinkPad T14s Gen 1 Laptop Review: The Intel model is the worse choice
Samsung Galaxy Book Ion 13.3: Intel Core i5-10210U, 13.30", 1 kg
Review » Samsung Galaxy Book Ion 13.3 Review: Subnotebook with QLED display
Zotac ZBox MI643: Intel Core i5-10210U, 0.6 kg
Review » Zotac ZBox Edge MI643 Review: Slim and Low-Profile Mini PC
Lenovo ThinkPad X1 Carbon 2020-20U9003BGE: Intel Core i7-10510U, 14.00", 1.1 kg
Review » Lenovo ThinkPad X1 Carbon 2020 Business-Laptop Review: 4K display costs battery runtime
Lenovo ThinkPad X1 Yoga 2020-20UCS03S00: Intel Core i7-10510U, 14.00", 1.3 kg
Review » Lenovo ThinkPad X1 Yoga 2020 Laptop Review: Business convertible with small improvements
Dell Latitude 9510 2-in-1: Intel Core i7-10810U, 15.00", 1.7 kg
Review » Dell Latitude 9510 2-in-1 Review: A 5G 15-inch Convertible That Isn't Huge Or Unwieldy
Dell Latitude 7310: Intel Core i7-10610U, 13.30", 1.2 kg
Review » Dell Latitude 7310 Core i7 Laptop Review: Better Looks, Same Performance
Lenovo ThinkPad T14-20S1S06B00: Intel Core i5-10210U, 14.00", 1.5 kg
Review » Lenovo ThinkPad T14 laptop review: Comet Lake update doesn't add much
Fujitsu Lifebook U939 i5: Intel Core i5-8265U, 13.30", 0.9 kg
Review » Fujitsu Lifebook U939 Laptop Review: A compact business notebook with LTE
Dell Latitude 7410: Intel Core i7-10610U, 14.00", 1.4 kg
Review » Dell Latitude 7410 Laptop Review: The Lenovo X1 Carbon Has Met Its Match
Durabook R11: Intel Core i5-8250U, 11.60", 1.2 kg
Review » Durabook R11 Rugged Tablet Review: A Tough Cookie
Fujitsu Lifebook U939X: Intel Core i5-8265U, 13.30", 1 kg
Review » Fujitsu Lifebook U939X Review: A business convertible with a lot of functionalities
Lenovo ThinkPad X1 Carbon 2020-20UAS04T00: Intel Core i7-10510U, 14.00", 1.1 kg
Review » ThinkPad X1 Carbon 2020 Review: Familiar business laptop with a new power adapter
Asus VivoBook 17 S712FA-DS76: Intel Core i7-10510U, 17.30", 2.3 kg
Review » Asus VivoBook 17 S712FA Laptop Review: Low Weight, Low Price
HP Envy x360 15-dr1679cl: Intel Core i7-10510U, 15.60", 2.1 kg
Review » 2020 HP Envy x360 15 Core i7 Convertible 2-in-1 Review: A Little Too Familiar
Huawei MateBook 13 2020 i5: Intel Core i5-10210U, 13.00", 1.3 kg
Review » Huawei MateBook 13 2020 Subnotebook Review – Comet Lake update without performance benefits
HP ProBook 430 G7-8VU53EA: Intel Core i7-10510U, 13.30", 1.4 kg
Review » HP ProBook 430 G7 Laptop Review: No big improvement with Comet Lake
Asus ZenBook Flip 14 UX463FA-AI039T: Intel Core i5-10210U, 14.00", 1.4 kg
Review » Asus ZenBook Flip 14 UX463FA in review: Classy convertible at a low price
Asus ExpertBook B9450FA, i7-10510U: Intel Core i7-10510U, 14.00", 1 kg
Review » Asus ExpertBook B9450FA Review: Ultra light and high endurance
Dynabook Portege X30L-G1331: Intel Core i5-10210U, 13.30", 0.9 kg
Review » Dynabook Portege X30L-G Laptop Review: A New Lightweight Benchmark
HP 17-by2437ng: Intel Core i3-10110U, 17.30", 2.4 kg
Review » HP 17 Laptop Review: A simple office notebook with a DVD burner
Schenker VIA 14: Intel Core i5-10210U, 14.00", 1.1 kg
Review » Schenker VIA 14 laptop review: Lightweight materials combined with a big battery
Durabook S15ABG2: Intel Core i5-8265U, 15.60", 2.6 kg
Review » Durabook S15AB Rugged Laptop Review
Lenovo ThinkPad X1 Yoga 20SA000GUS: Intel Core i7-10510U, 14.00", 1.3 kg
Review » Lenovo ThinkPad X1 Yoga 4th Gen Core i7 Convertible Review: A ThinkPad X1 Carbon in Disguise
HP Elite Dragonfly-8MK79EA: Intel Core i5-8265U, 13.30", 1.1 kg
Review » HP Elite Dragonfly Business-Convertible Review: Lighter than 1 kg only with the smaller battery
LG Gram 14T90N: Intel Core i7-10510U, 14.00", 1.2 kg
Review » LG Gram 14T90N Convertible Review: A CPU Downgrade
Lenovo ThinkPad X1 Carbon G7 20R1-000YUS: Intel Core i7-10510U, 14.00", 1.2 kg
Review » Lenovo ThinkPad X1 Carbon G7 2020 Laptop Review: Same Look, New Processor
Lenovo ThinkPad L13 Yoga 20R6S00800: Intel Core i5-10210U, 13.30", 1.4 kg
Review » Lenovo ThinkPad L13 Yoga review: Business convertible with good equipment
Acer Chromebook 715 CB715-1WT-527F: Intel Core i5-8350U, 15.60", 2 kg
Review » Acer Chromebook 715 Laptop Review
HP EliteBook x360 1030 G4 7YL44EA: Intel Core i7-8565U, 13.30", 1.3 kg
Review » HP EliteBook x360 1030 G4 Review: Convertible with limited viewing angles
Lenovo ThinkPad T490 20RY0002US: Intel Core i7-10510U, 14.00", 1.5 kg
Review » Lenovo ThinkPad T490 Laptop Review: The Comet Lake-U Update
Lenovo ThinkPad E14 20RA001MGE: Intel Core i5-10210U, 14.00", 1.6 kg
Review » Lenovo ThinkPad E14 Laptop Review: Thin design beats upgradability
Lenovo ThinkBook 14-IML-20RV006TGE: Intel Core i5-10210U, 14.00", 1.6 kg
Review » Lenovo ThinkBook 14 Review: Business Laptop with Great Connectivity
Lenovo Yoga C740-14IML: Intel Core i5-10210U, 14.00", 1.4 kg
Review » Lenovo Yoga C740-14IML Convertible Review: Top-tier Looks, Mid-tier Price
Acer Aspire 5 A514-52: Intel Core i5-10210U, 14.00", 1.7 kg
Review » Acer Aspire 5 A514 Laptop Review: Not Intel Comet Lake at its Best
HP Pavilion x360 14-dh1153ng: Intel Core i5-10210U, 14.00", 1.6 kg
Review » HP Pavilion x360 14 Review: 14-inch convertible with optional pen input
Intel NUC10i7FNH: Intel Core i7-10710U, 0.00", 0.7 kg
Review » Intel Frost Canyon NUC offers 6 cores and 12 threads
Intel NUC10i5FNK: Intel Core i5-10210U, 0.00", 0.5 kg
Review » Intel Frost Canyon NUC with Comet Lake i5 SoC in Review
Acer Extensa 15 EX215-51-56UX: Intel Core i5-10210U, 15.60", 1.9 kg
Review » Acer Extensa 15 EX215-51 in review: Work horse with a disappointing display
HP Pavilion x360 15-dq0065cl: Intel Core i7-8565U, 15.60", 1.9 kg
Review » HP Pavilion x360 15 2019 Convertible Review: Don't Buy This Configuration
Lenovo ThinkBook 15 : Intel Core i5-10210U, 15.60", 1.9 kg
Review » Lenovo ThinkBook 15 Laptop Review: An affordable office device with a Comet Lake processor
Lenovo ThinkCentre M90n-1 Nano IoT: Intel Core i3-8145U, 0.7 kg
Review » Lenovo ThinkCentre M90n-1 Nano IoT Review - Silent desktop with crippled performance
Lenovo Yoga C740-15IML: Intel Core i7-10510U, 15.60", 1.9 kg
Review » Lenovo Yoga C740-15IML Laptop Review: Strong Battery Life, Weak Display
Lenovo ThinkPad X1 Carbon 2019-20QD00M7GE: Intel Core i5-8265U, 14.00", 1.2 kg
Review » Lenovo ThinkPad X1 Carbon 2019 Privacy Guard Review: Business laptop with ePrivacy filter is not perfect
Lenovo ThinkCentre M90n-1 Nano: Intel Core i5-8265U, 0.00", 0.5 kg
Review » Lenovo ThinkCentre M90n Nano Desktop Short Review
Schenker Slim 15 L19: Intel Core i5-10210U, 15.60", 1.6 kg
Review » Schenker Slim 15 Review: Wi-fi 6 laptop doesn't go to full capacity
Acer TravelMate X514-51-511Q: Intel Core i5-8265U, 14.00", 1 kg
Review » Acer TravelMate X514 Laptop Review: A small 14-inch machine with professionals in mind
Dynabook Portégé X30-F-10N: Intel Core i5-8265U, 13.30", 1.1 kg
Review » Dynabook Portégé X30-F laptop review: Light, slim, enduring
Dynabook Portege A30-E-174: Intel Core i7-8550U, 13.30", 1.2 kg
Review » Dynabook Portégé A30-E laptop review: Great display, unstable case
Dell XPS 13 7390 Core i7-10710U: Intel Core i7-10710U, 13.30", 1.2 kg
Review » Dell XPS 13 7390 Core i7-10710U Laptop Review: Faster Than The Core i5 XPS 15
Dynabook Tecra X50-F: Intel Core i7-8665U, 15.60", 1.4 kg
Review » Dynabook Tecra X50 Laptop Review: A light Ultrabook with light endurance
Lenovo ThinkPad L590-20Q70019GE: Intel Core i5-8265U, 15.60", 2 kg
Review » Lenovo ThinkPad L590 Laptop Review: A business laptop with good input devices
Lenovo ThinkPad L580-20LW000VGE: Intel Core i5-8250U, 15.60", 2 kg
Review » Lenovo ThinkPad L580 Laptop Review: Reliable office notebook with a good keyboard
HP EliteBook x360 830 G6: Intel Core i7-8565U, 13.30", 1.5 kg
Review » HP EliteBook x360 830 G6 Laptop Review: HP Convertible impresses in almost every way
Dell Latitude 3400: Intel Core i3-8145U, 14.00", 1.7 kg
Review » Dell Latitude 3400 Laptop Review: An affordable business laptop with long battery life
Dell Latitude 7200: Intel Core i5-8365U, 12.30", 1.2 kg
Review » Dell Latitude 7200 2-in-1 Laptop Review: The hybrid device leaves a good impression despite its yielding keyboard
Panasonic Toughbook FZ-55: Intel Core i5-8365U, 14.00", 2.2 kg
Review » Panasonic Toughbook FZ-55 MK1 Laptop Review
Dell Latitude 7400-8N6DH: Intel Core i7-8665U, 14.00", 1.5 kg
Review » Dell Latitude 7400 Laptop Review: Even the high end is not free from weaknesses
HP Spectre x360 13-ap0312ng: Intel Core i7-8565U, 13.30", 1.3 kg
Review » HP Spectre x360 13 Review: classy convertible foiled by its display
HP EliteBook x360 1030 G3-4QZ12ES: Intel Core i7-8550U, 13.30", 1.3 kg
Review » HP EliteBook x360 1030 G3 Laptop Review: An extremely bright convertible with a matte touchscreen and privacy features
Lenovo ThinkPad X1 Carbon 2019-20QES01L00: Intel Core i7-8565U, 14.00", 1.1 kg
Review » Lenovo ThinkPad X1 Carbon 2019 with Full HD laptop review: Brighter and longer battery life
Asus VivoBook 14 X403FA: Intel Core i5-8265U, 14.00", 1.3 kg
Review » Asus VivoBook 14 X403FA Review: The elegant subnotebook offers a lot of endurance
Dell Latitude 7300-P99G: Intel Core i7-8665U, 13.30", 1.4 kg
Review » Dell Latitude 7300 Laptop Review: business subnotebook falls short of its performance goals
Lenovo ThinkPad L490 20Q6S08600: Intel Core i5-8265U, 14.00", 1.7 kg
Review » Lenovo ThinkPad L490 laptop review: Whiskey Lake disappoints in office laptop
Dell Latitude 5500: Intel Core i7-8665U, 15.60", 1.9 kg
Review » Dell Latitude 5500 Review: A business laptop with many options
Dell Latitude 5300: Intel Core i5-8365U, 13.30", 1.4 kg
Review » Dell Latitude 5300 Laptop Review: A small business laptop with LTE
Dell Inspiron 7390 2-in-1: Intel Core i7-8565U, 13.30", 1.4 kg
Review » Dell Inspiron 7390 2-in-1 Black Edition Convertible Review
Lenovo ThinkPad X1 Yoga 2019-20QGS00A00: Intel Core i7-8565U, 14.00", 1.3 kg
Review » Lenovo ThinkPad X1 Yoga 2019 Laptop Review: Aluminum Unibody & Great Speakers
Lenovo ThinkBook 13s-20R90071GE: Intel Core i5-8265U, 13.30", 1.3 kg
Review » Lenovo ThinkBook 13s Laptop Review: A Business Laptop but no TrackPoint
Lenovo ThinkPad X1 Carbon 2019-20QE000VGE: Intel Core i7-8665U, 14.00", 1.1 kg
Review » Lenovo ThinkPad X1 Carbon 2019 WQHD Live Review: Still the reference among business laptops?
Lenovo Flex 14IWL: Intel Core i5-8265U, 14.00", 1.7 kg
Review » Lenovo Flex 14 (2019, Core i5-8265U) Laptop Review - An average convertible at a good price
Lenovo IdeaPad S940-14IWL: Intel Core i7-8565U, 14.00", 1.2 kg
Review » Lenovo IdeaPad S940 Laptop Review: Slimmer, Lighter, Sleeker
Dell Latitude 13 5300 2-in-1: Intel Core i5-8365U, 13.30", 1.4 kg
Review » Dell Latitude 13 5300 2-in-1 Convertible Review: A ThinkPad X390 Yoga Alternative
Dell Latitude 15 3590: Intel Core i5-8250U, 15.60", 2.1 kg
Review » Dell Latitude 3590 review: Office laptop with major flaws
Lenovo ThinkPad T490-20N2004EGE: Intel Core i5-8265U, 14.00", 1.4 kg
Review » Lenovo ThinkPad T490 Laptop Review: A business laptop with long battery life and an iGPU
Dell Latitude 13 3390: Intel Core i5-8250U, 13.30", 1.6 kg
Review » Dell Latitude 3390 (Core i5-8250U, Full HD, 256 GB SSD) Convertible Review
Lenovo ThinkPad X390 Yoga-20NQS05R00: Intel Core i7-8565U, 13.30", 1.3 kg
Review » Lenovo ThinkPad X390 Yoga (i7, FHD) Convertible Review
Dell Latitude 7400 2-in-1: Intel Core i7-8665U, 14.00", 1.5 kg
Review » Dell Latitude 7400 2-in-1 (i7-8665U) Convertible Review
Huawei Matebook 13-53010FYW: Intel Core i7-8565U, 13.00", 1.3 kg
Review » Huawei MateBook 13 (i7, UHD Graphics 620) Laptop Review
Lenovo ThinkPad E490-20N8000RGE: Intel Core i5-8265U, 14.00", 1.8 kg
Review » Lenovo ThinkPad E490 (i5-8265U, SSD, FHD) Laptop Review
Dell Inspiron 15 5000 5584: Intel Core i7-8565U, 15.60", 1.9 kg
Review » Dell Inspiron 15 5000 5584 (i7-8565U) Laptop Review
Lenovo ThinkPad T490s-20NYS02A00: Intel Core i5-8265U, 14.00", 1.3 kg
Review » Lenovo ThinkPad T490s (i5, Low Power FHD) Laptop Review
Lenovo ThinkPad X390-20Q1S02M00: Intel Core i5-8265U, 13.30", 1.3 kg
Review » Lenovo ThinkPad X390 (i5-8265U, FHD) Laptop Review
VAIO SX14: Intel Core i5-8265U, 14.00", 1 kg
Review » Vaio SX14 (i5-8265U, FHD) Laptop Review
LG Gram 17Z990-R.AAS7U1: Intel Core i7-8565U, 17.00", 1.3 kg
Review » LG Gram 17Z990 (i7-8565U. WQXGA) Laptop Review
HP 250 G7 6HM85ES: Intel Core i5-8265U, 15.60", 1.9 kg
Review » HP 250 G7 (Core i5-8265U, 8 GB RAM, FHD, 512 GB SSD) Laptop Review
Asus VivoBook Flip 14 TP412UA-EC969T: Intel Core i3-8130U, 14.00", 1.5 kg
Review » Asus VivoBook Flip 14 TP412UA (i3-8130U, SSD, FHD) Convertible Review
LG Gram 14Z980-U.AAW5U1: Intel Core i5-8250U, 14.00", 1 kg
Review » LG Gram 14Z980 (i5-8250U) Laptop Review
HP Chromebook x360 14 G1: Intel Core i5-8350U, 14.00", 1.6 kg
Review » HP Chromebook x360 14 G1 (Core i5-8350U, eMMC, FHD) Convertible Review
Lenovo ThinkPad E590-20NC0003GE: Intel Core i7-8565U, 15.60", 1.9 kg
Review » Lenovo ThinkPad E590 (i7-8565U, UHD 620, FHD) Laptop Review
HP ProBook 430 G6-5TJ89EA: Intel Core i5-8265U, 13.30", 1.4 kg
Review » HP ProBook 430 G6 (Core i5-8265U, 8 GB RAM, 256 GB SSD, FHD) Laptop Review
HP ProBook 440 G6-5TK01EA: Intel Core i7-8565U, 14.00", 1.6 kg
Review » HP ProBook 440 G6 (i7, 512 GB, FHD) Laptop Review
Lenovo Ideapad S530-13IWL: Intel Core i5-8265U, 13.30", 1.2 kg
Review » Lenovo IdeaPad S530 (i5-8265U, UHD620) Subnotebook Review
Schenker Slim 15-RE-E19: Intel Core i5-8265U, 15.60", 1.5 kg
Review » Schenker Slim 15 RED (i5-8265U, UHD620) Laptop Review
Dell Inspiron 13 7380: Intel Core i7-8565U, 13.30", 1.4 kg
Review » Dell Inspiron 13 7380 (Core i7-8565U, SSD, FHD) Laptop Review
Lenovo Yoga Chromebook C630-81JX0008UX: Intel Core i5-8250U, 15.60", 2 kg
Review » Lenovo Yoga Chromebook C630 Convertible Review
Lenovo ThinkPad L390-20NR0013GE: Intel Core i5-8265U, 13.30", 1.5 kg
Review » Lenovo ThinkPad L390 (i5-8265U, FHD) Laptop Review
Dell XPS 13 9380 i7 4K: Intel Core i7-8565U, 13.30", 1.2 kg
Review » Dell XPS 13 9380 (i7-8565U, 4K UHD) Laptop Review
Lenovo IdeaPad 730S-13IWL 81JB0004US: Intel Core i5-8265U, 13.30", 1.1 kg
Review » Lenovo IdeaPad 730S-13IWL (i5-8265U, FHD) Laptop Review
HP Elitebook x360 1040 G5: Intel Core i7-8650U, 14.00", 1.4 kg
Review » HP Elitebook x360 1040 G5 (i7-8650U, FHD) Convertible Review
Lenovo ThinkPad L390 Yoga-20NT000XGE: Intel Core i5-8265U, 13.30", 1.5 kg
Review » Lenovo ThinkPad L390 Yoga (Core i5-8265U, 256 GB, FHD) Convertible Review
Acer Swift 5 SF515-51T-76B6: Intel Core i7-8565U, 15.60", 1 kg
Review » Acer Swift 5 SF515-51T (i7-8565U, SSD, FHD) Laptop Review
Tuxedo Book BU1307: Intel Core i7-8550U, 13.30", 1.4 kg
Review » Tuxedo Book BU1307 (Core i7-8550U, UHD 620) Laptop Review
Lenovo V330-14IKB-81B0004MGE: Intel Core i5-8250U, 14.00", 1.7 kg
Review » Lenovo V330-14IKB (i5, FHD) Laptop Review
Asus Zenbook 14 UX433FA-A6018T: Intel Core i5-8265U, 14.00", 1.2 kg
Review » ASUS ZenBook 14 UX433FA (Core i5-8265U, SSD, FHD) Laptop Review
Dell XPS 13 9380 2019: Intel Core i5-8265U, 13.30", 1.2 kg
Review » Dell XPS 13 9380 2019 (i5-8265U, 256GB, UHD) Subnotebook Review
Tuxedo InfinityBook Pro 14: Intel Core i7-8565U, 14.00", 1.4 kg
Review » Tuxedo InfinityBook Pro 14 (i7-8565U, SSD, FHD) Laptop Review
Samsung Notebook 9 NP930QAA: Intel Core i7-8550U, 13.30", 1 kg
Review » Samsung Notebook 9 Pen NP930QAA (i7-8550U) Convertible Review
Acer Swift 3 SF313-51-59SZ: Intel Core i5-8250U, 13.30", 1.3 kg
Review » Acer Swift 3 SF313 (Core i5-8250U, 8 GB, 256 SSD, FHD) Laptop Review
Acer TravelMate X3410-M-866T: Intel Core i7-8550U, 14.00", 1.7 kg
Review » Acer TravelMate X3410 (i7-8550U, 16 GB RAM, 512 GB SSD) Laptop Review
Dell Inspiron 13 7386: Intel Core i7-8565U, 13.30", 1.5 kg
Review » Dell Inspiron 13 7386 2-in-1 Black Edition (i7-8565U, 16 GB RAM, 512 GB SSD) Convertible Review
Lenovo V320-17IKB-81CN000MGE: Intel Core i5-8250U, 17.30", 2.8 kg
Review » Lenovo V320-17IKB (i5-8250U, SSD, FHD) Laptop Review
Lenovo ThinkPad X1 Carbon 2018-20KGS5DU00: Intel Core i7-8550U, 14.00", 1.1 kg
Review » Lenovo ThinkPad X1 Carbon 2018 (matte WQHD, i7) Laptop Review
Dell Inspiron 7486 Chromebook 14 2-in-1: Intel Core i3-8130U, 14.00", 1.8 kg
Review » Dell Inspiron 7486 Chromebook 14 2-in-1 Convertible Review
Lenovo ThinkPad X1 Tablet G3-20KJ001NGE: Intel Core i5-8250U, 13.00", 1.3 kg
Review » Lenovo ThinkPad X1 Tablet 2018 (i5, 3K-IPS) Convertible Review
HP Pavilion x360 14-cd0002ng: Intel Core i3-8130U, 14.00", 1.6 kg
Review » HP Pavilion x360 (Core i3-8130U, 256 GB SSD) Convertible Review
Microsoft Surface Laptop 2-LQN-00004: Intel Core i5-8250U, 13.50", 1.3 kg
Review » Microsoft Surface Laptop 2 (Core i5, 256 GB) Laptop Review
Toshiba Portege X30T-E-109: Intel Core i7-8550U, 13.30", 1.4 kg
Review » Toshiba Portege X30T-E (i7-8550U, UHD620) Laptop Review
Acer Swift 3 SF314-55-31N8: Intel Core i3-8145U, 14.00", 1.5 kg
Review » Acer Swift 3 SF314-55 (i3-8145U, SSD, FHD) Laptop Review
Asus ZenBook 13 UX333FA: Intel Core i5-8265U, 13.30", 1.2 kg
Review » Asus ZenBook 13 UX333FA (i5-8265U) Laptop Review
Lenovo Yoga S730-13IWL: Intel Core i7-8565U, 13.30", 1.1 kg
Review » Lenovo Yoga S730-13IWL (FHD, Core i7-8565U) Laptop Review
Asus VivoBook S13 S330UA-EY034T: Intel Core i7-8550U, 13.30", 1.2 kg
Review » Asus VivoBook S13 S330UA (i7, FHD) Laptop Review
Toshiba Tecra A50-E-110: Intel Core i5-8250U, 15.60", 2 kg
Review » Toshiba Tecra A50-E-110 (Core i5-8250U, 256 GB SSD, 8 GB RAM) Laptop Review
Dell Inspiron 14 5000 5482 2-in-1: Intel Core i7-8565U, 14.00", 1.8 kg
Review » Dell Inspiron 14 5000 5482 2-in-1 (i7-8565U) Convertible Review
Asus ZenBook 14 UX433FA: Intel Core i7-8565U, 14.00", 1.2 kg
Review » Asus ZenBook 14 UX433F (i7-8565U) Laptop Review
Huawei MateBook D 14 W50F: Intel Core i5-8250U, 14.00", 1.5 kg
Review » Huawei MateBook D 14 W50F (Core i5-8250U, 8 GB, 256 GB) Laptop Review
HP EliteBook x360 1030 G3 45X96UT: Intel Core i7-8650U, 13.30", 1.3 kg
Review » HP EliteBook x360 1030 G3 (i7-8650U, FHD) Convertible Review
Microsoft Surface Pro 6, Core i5, 128 GB: Intel Core i5-8250U, 12.30", 0.8 kg
Review » Microsoft Surface Pro 6 (2018) (i5, 128 GB, 8 GB) Convertible Review
Microsoft Surface Pro 6, Core i7, 512 GB: Intel Core i7-8650U, 12.30", 1.1 kg
Review » Microsoft Surface Pro 6 (2018) (Core i7, 512GB, 16GB) Convertible Review
Lenovo Yoga C930-13IKB 81C4: Intel Core i7-8550U, 13.90", 1.4 kg
Review » Lenovo Yoga C930-13IKB (i7-8550U, FHD) Convertible Review
Lenovo Yoga C930-13IKB: Intel Core i5-8250U, 13.90", 1.4 kg
Review » Lenovo Yoga C930-13IKB (i5-8250U, FHD) Convertible Review
Lenovo Yoga 530-14IKB-81EK00CWGE: Intel Core i5-8250U, 14.00", 1.6 kg
Review » Lenovo Yoga 530-14IKB (i5-8250U, 8 GB, 256 GB SSD) Convertible Review
Schenker Slim 14 M18: Intel Core i7-8550U, 14.00", 1.4 kg
Review » Schenker Slim 14 M18 (Clevo N141WU, i7-8550U, UHD620) Laptop Review
Getac S410: Intel Core i7-8550U, 14.00", 3.2 kg
Review » Getac S410 (i5-8550U) Rugged Laptop Review
HP Elite x2 1013 G3-2TT14EA: Intel Core i5-8350U, 13.00", 1.2 kg
Review » HP Elite x2 1013 G3 (i5-8350U, SSD, 3k) 2-in-1 Review
Asus VivoBook Flip 14 TP412UA-DB51T: Intel Core i5-8250U, 14.00", 1.5 kg
Review » Asus VivoBook Flip 14 TP412UA (i5-8250U) Convertible Review
Zotac ZBOX-CI660 Nano: Intel Core i7-8550U, 1.1 kg
Review » Zotac ZBOX-CI660 Nano (i7-8550U) Mini PC Review
HP ProBook x360 440 G1: Intel Core i5-8250U, 14.00", 1.7 kg
Review » HP ProBook x360 440 G1 (i5-8250U, 256GB, FHD, Touch) Convertible Review
Lenovo IdeaPad 330S-15IKB-81F500N5GE: Intel Core i5-8250U, 15.60", 1.9 kg
Review » Lenovo IdeaPad 330S-15IKB (i5-8250U, UHD620) Laptop Review
Asus ZenBook S UX391U: Intel Core i7-8550U, 13.30", 1 kg
Review » Asus ZenBook S UX391U (Core i7, FHD) Laptop Review
Lenovo ThinkPad X1 Carbon G6-20KG0025UK: Intel Core i5-8350U, 14.00", 1.1 kg
Review » Lenovo ThinkPad X1 Carbon G6 2018 (i5-8350U, Full-HD Touch, 256GB) Laptop Review
HP 14-ma0312ng: Intel Core i5-8250U, 14.00", 1.5 kg
Review » HP 14 (i5-8250U, Intel Optane Memory, HD Display) Laptop Review
Lenovo Ideapad 530S-15IKB: Intel Core i5-8250U, 15.60", 1.7 kg
Review » Lenovo Ideapad 530S-15IKB (i5-8250U, FHD) Laptop Review
HP EliteBook x360 1030 G3: Intel Core i5-8250U, 13.30", 1.3 kg
Review » HP EliteBook x360 1030 G3 (i5-8250U. FHD) Convertible Review
Lenovo ThinkPad T580-20L9001AUS: Intel Core i7-8650U, 15.60", 2 kg
Review » Lenovo ThinkPad T580 (i7-8650U, FHD) Laptop Review
LG Gram 15Z980-B.AA78B: Intel Core i7-8550U, 15.60", 1.1 kg
Review » LG Gram 15Z980 (i7-8550U, Full-HD) Laptop Review
HP Pavilion 15-cs0053cl: Intel Core i5-8250U, 15.60", 1.8 kg
Review » HP Pavilion 15-cs0053cl (i5-8250U, HD) Laptop Review
Lenovo Yoga 730-13IKB: Intel Core i7-8550U, 13.30", 1.2 kg
Review » Lenovo Yoga 730-13IKB (i7-8550U, 4K) Convertible Review
Fujitsu Stylistic Q738: Intel Core i5-8350U, 13.30", 1.4 kg
Review » Fujitsu Stylistic Q738 (i5-8350U, UHD620) Convertible Review
Lenovo ThinkPad X380 Yoga-20LH000LUS: Intel Core i5-8250U, 13.30", 1.4 kg
Review » Lenovo ThinkPad X380 Yoga (i5-8250U, FHD) Convertible Review
Lenovo ThinkPad T480-20L50010US: Intel Core i7-8650U, 14.00", 1.6 kg
Review » Lenovo ThinkPad T480 (Core i7-8650U, FHD) Laptop Review
Toshiba Tecra X40-E-10W: Intel Core i5-8250U, 14.00", 1.3 kg
Review » Toshiba Tecra X40-E (i5-8250U, SSD, LTE, FHD) Laptop Review
Fujitsu Lifebook U938: Intel Core i5-8250U, 13.30", 0.9 kg
Review » Fujitsu LifeBook U938 (i5-8250U, LTE, SSD, FHD) Subnotebook Review
Lenovo ThinkPad T480s-20L7002AUS: Intel Core i5-8250U, 14.00", 1.4 kg
Review » Lenovo ThinkPad T480s (i5-8250U, FHD) Laptop Review
Fujitsu LifeBook U728: Intel Core i5-8250U, 12.50", 1.1 kg
Review » Fujitsu LifeBook U728 (i5-8250U, FHD) Laptop Review
HP ProBook 650 G4 3UP57EA: Intel Core i5-8250U, 15.60", 2.2 kg
Review » HP ProBook 650 G4 (i5-8250U, FHD IPS) Laptop Review
Dell Latitude 7490: Intel Core i5-8350U, 14.00", 1.6 kg
Review » Dell Latitude 7490 (i5-8350U, FHD) Laptop Review
Acer Swift 5 SF514-52T-59HY: Intel Core i5-8250U, 14.00", 0.9 kg
Review » Acer Swift 5 SF514 (i5-8250U, UHD 620) Laptop Review
Dell Inspiron 15 5579-9672: Intel Core i5-8250U, 15.60", 2.1 kg
Review » Dell Inspiron 15 5579 (i5-8250U, SSD, IPS, Touch) Convertible Review
Fujitsu Lifebook P728, Core i5-8250U: Intel Core i5-8250U, 12.50", 1.2 kg
Review » Fujitsu LifeBook P728 (i5-8250U, UHD620) Laptop Review
Fujitsu Lifebook T938: Intel Core i5-8250U, 13.30", 1.3 kg
Review » Fujitsu Lifebook T938 (i5-8250U, UHD620) Laptop Review
HP EliteBook 840 G5-3JX61EA: Intel Core i7-8550U, 14.00", 1.5 kg
Review » HP EliteBook 840 G5 (i7-8550U, SSD, FHD) Laptop Review
Dell Latitude 3490: Intel Core i5-8250U, 14.00", 1.8 kg
Review » Dell Latitude 3490 (Core i5, FHD) Laptop Review
Dell Latitude 7390: Intel Core i7-8650U, 13.30", 1.3 kg
Review » Dell Latitude 7390 (Core i7-8650U, Touchscreen) Laptop Review
Dell Latitude 5490: Intel Core i7-8650U, 14.00", 1.7 kg
Review » Dell Latitude 5490 (Core i7-8650U, Touchscreen) Laptop Review
HP EliteBook 830 G5-3JX74EA: Intel Core i7-8550U, 13.30", 1.3 kg
Review » HP EliteBook 830 G5 (i7, FHD, SureView) Laptop Review
Lenovo Yoga 730-13IKB-81CT: Intel Core i5-8250U, 13.30", 1.2 kg
Review » Lenovo Yoga 730-13IKB (i5-8250U, FHD) Convertible Review
Fujitsu LifeBook U758: Intel Core i7-8650U, 15.60", 1.7 kg
Review » Fujitsu LifeBook U758 (i7-8650U, UHD) Laptop Review
Lenovo V330-15IKB: Intel Core i3-7130U, 15.60", 1.8 kg
Review » Lenovo V330-15IKB (i3-7130U, SSD, FHD) Laptop Review
Acer Aspire 3 A315-51-30YA: Intel Core i3-8130U, 15.60", 2.1 kg
Review » Acer Aspire 3 A315-51 (i3-8130U, SSD, FHD) Laptop Review
Fujitsu Lifebook E558 E5580MP581DE: Intel Core i5-8250U, 15.60", 2 kg
Review » Fujitsu LifeBook E558 (i5-8250U, SSD, FHD) Laptop Review
Fujitsu LifeBook U748: Intel Core i5-8250U, 14.00", 1.6 kg
Review » Fujitsu LifeBook U748 (i5-8250U, FHD, Touch) Laptop Review
Dell Latitude 5290: Intel Core i5-8250U, 12.50", 1.4 kg
Review » Dell Latitude 5290 (i5-8250U, HD) Laptop Review
HP EliteBook 850 G5 3JX58EA: Intel Core i5-8250U, 15.60", 1.8 kg
Review » HP EliteBook 850 G5 (i5-8250U, FHD) Laptop Review
Fujitsu Lifebook E548: Intel Core i5-8250U, 14.00", 1.8 kg
Review » Fujitsu LifeBook E548 (i5-8250U, UHD620) Laptop Review
Acer Spin 3 SP314-51-548L: Intel Core i5-8250U, 14.00", 1.7 kg
Review » Acer Spin 3 SP314-51 (i5-8250U, SSD, FHD) Convertible Review
Dell XPS 13 9370 i7 UHD: Intel Core i7-8550U, 13.30", 1.2 kg
Review » Dell XPS 13 9370 (i7-8550U, 4K UHD) Laptop Review
Lenovo ThinkPad L380-20M5000WGE: Intel Core i5-8250U, 13.30", 1.4 kg
Review » Lenovo ThinkPad L380 (i5-8250U, UHD620) Laptop Review
Lenovo ThinkPad X1 Yoga 2018-20LD0015US: Intel Core i5-8250U, 14.00", 1.4 kg
Review » Lenovo ThinkPad X1 Yoga 2018 (Core i5-8250U, FHD) Convertible Review
LG Gram 13Z980-A: Intel Core i5-8250U, 13.30", 1 kg
Review » LG Gram 13Z980-A (i5-8250U) Laptop Review
Dell Latitude 7390: Intel Core i5-8350U, 13.30", 1.3 kg
Review » Dell Latitude 7390 (i5-8350U, SSD 256 GB) Laptop Review
Dell Latitude 7490: Intel Core i7-8650U, 14.00", 1.6 kg
Review » Dell Latitude 7490 (i7-8650U, FHD Touchscreen) Laptop Review
HP EliteBook 840 G5-3JX66EA: Intel Core i5-8250U, 14.00", 1.5 kg
Review » HP EliteBook 840 G5 (i5-8250U, SSD, Full HD) Laptop Review
Lenovo ThinkPad L380 Yoga-20M7001BGE: Intel Core i5-8250U, 13.30", 1.5 kg
Review » Lenovo ThinkPad L380 Yoga (i5-8250U, FHD) Convertible Review
Dell Latitude 5290 2-in-1: Intel Core i5-8350U, 12.30", 1.3 kg
Review » Dell Latitude 5290 2-in-1 (i5-8350U) Convertible Review
HP ProBook 430 G5-3KX72ES: Intel Core i5-8250U, 13.30", 1.5 kg
Review » HP ProBook 430 G5 (i5-8250U, FHD) Laptop Review
Asus ZenBook Flip 14 UX461UA: Intel Core i5-8250U, 14.00", 1.4 kg
Review » Asus ZenBook Flip 14 UX461UA (i5-8250U, SSD, FHD) Convertible Review
Dell Latitude 7390 2-in-1: Intel Core i7-8650U, 13.30", 1.4 kg
Review » Dell Latitude 7390 2-in-1 (i7-8650U, FHD) Convertible Review
Dell Latitude 5590: Intel Core i5-8250U, 15.60", 2 kg
Review » Dell Latitude 5590 (i5-8250U, IPS-FHD) Laptop Review
Lenovo ThinkPad X1 Yoga 2018-20LES01W00: Intel Core i7-8550U, 14.00", 1.4 kg
Review » Lenovo ThinkPad X1 Yoga 2018 (i7-8550U, HDR WQHD) Convertible Review
Lenovo ThinkPad E580-20KSCTO1WW: Intel Core i5-8250U, 15.60", 1.9 kg
Review » Lenovo ThinkPad E580 (i5-8250U, UHD 620, SSD) Laptop Review
Lenovo ThinkPad L480-20LS001AGE: Intel Core i5-8250U, 14.00", 1.7 kg
Review » Lenovo ThinkPad L480 (i5-8250U, UHD 620, IPS, SSD) Laptop Review
Lenovo ThinkPad X380 Yoga 20LJS02W00: Intel Core i7-8550U, 13.30", 1.4 kg
Review » Lenovo ThinkPad X380 Yoga (i7-8550U, FHD) Convertible Review
HP Spectre x360 13-ae048ng: Intel Core i7-8550U, 13.30", 1.3 kg
Review » HP Spectre x360 13t (i7-8550U, FHD, SSD) Laptop Review
Dell Latitude 5490-TD70X: Intel Core i5-8350U, 14.00", 1.7 kg
Review » Dell Latitude 5490 (i5-8350U, FHD) Laptop Review
Lenovo ThinkPad X280-20KES01S00: Intel Core i5-8250U, 12.50", 1.1 kg
Review » Lenovo ThinkPad X280 (i5-8250U, FHD) Laptop Review
Lenovo ThinkPad E480-20KNCTO1WW: Intel Core i5-8250U, 14.00", 1.8 kg
Review » Lenovo ThinkPad E480 (i5-8250U, UHD 620, SSD) Laptop Review
HP ProBook 440 G5-3KX87ES: Intel Core i5-8250U, 14.00", 1.6 kg
Review » HP ProBook 440 G5 (i5-8250U, FHD) Laptop Review
HP ProBook 450 G5-2UB53EA: Intel Core i5-8250U, 15.60", 2.1 kg
Review » HP ProBook 450 G5 (i5-8250U, FHD) Laptop Review
Dell Inspiron 17-5770-0357: Intel Core i5-8250U, 17.30", 2.7 kg
Review » Dell Inspiron 17-5770-0357 (8250U, SSD, HDD, FHD) Laptop Review
HP Spectre 13-af033ng: Intel Core i7-8550U, 13.30", 1.1 kg
Review » HP Spectre 13-af033 (i7-8550U, FHD) Laptop Review
Asus VivoBook Flip 15 TP510UA-E8073T: Intel Core i5-8250U, 15.60", 2.3 kg
Review » Asus VivoBook Flip 15 TP510UA (i5-8250U, SSD, FHD) Convertible Review
Lenovo ThinkPad X1 Carbon 2018-20KGS03900: Intel Core i7-8550U, 14.00", 1.1 kg
Review » Lenovo ThinkPad X1 Carbon 2018 (WQHD HDR, i7) Laptop Review
Lenovo ThinkPad T480s-20L8S02D00: Intel Core i5-8250U, 14.00", 1.4 kg
Review » Lenovo ThinkPad T480s (i5, WQHD) Laptop Review
Lenovo Miix 520-12IKB 20M3000LGE: Intel Core i7-8550U, 12.20", 1.3 kg
Review » Lenovo Miix 520-12IKB (i7-8550U, SSD, WUXGA) Convertible Review
Dell Inspiron 13-5379-9573: Intel Core i5-8250U, 13.30", 1.6 kg
Review » Dell Inspiron 13 5379 (i5-8250U, UHD 620) Convertible Review
HP Spectre x360 13t-ae000: Intel Core i7-8550U, 13.30", 1.3 kg
Review » HP Spectre x360 13t-ae000 (i7-8550U, 4K UHD) Convertible Review
Lenovo Ideapad 720S-13IKB: Intel Core i5-8250U, 13.30", 1.1 kg
Review » Lenovo Ideapad 720S-13IKB (i5-8250U, UHD 620) Laptop Review
Dell XPS 13 9370 i5 UHD: Intel Core i5-8250U, 13.30", 1.2 kg
Review » Dell XPS 13 9370 (i5-8250U, 4K UHD) Laptop Review
Asus VivoBook S14 S406UA-BV023T: Intel Core i5-8250U, 14.00", 1.2 kg
Review » Asus VivoBook S14 S406UA (i5-8250U, SSD, HD) Laptop Review
Dell XPS 13 9370 FHD i5: Intel Core i5-8250U, 13.30", 1.2 kg
Review » Dell XPS 13 9370 (Core i5, FHD) Laptop Review
Schenker Slim 15 L17: Intel Core i7-8550U, 15.60", 2 kg
Review » Schenker Slim 15 L17 (Clevo N751WU, i7-8550U, FHD) Laptop Review
LG Gram 15Z975: Intel Core i5-8250U, 15.60", 1.1 kg
Review » LG Gram 15 (i5-8250U, FHD) Laptop Review
Schenker Slim 14 L17: Intel Core i5-8250U, 14.00", 1.6 kg
Review » Schenker Slim 14 (Clevo N240WU, i5-8250U, UHD 620) Laptop Review
Lenovo Yoga 720-13IKB: Intel Core i7-8550U, 13.30", 1.3 kg
Review » Lenovo Yoga 720-13IKB (i7-8550U, SSD, FHD) Convertible Review
Lenovo Miix 520-12IKB 81CG: Intel Core i5-8250U, 12.20", 1.2 kg
Review » Lenovo Miix 520 (i5-8250U, FHD) Convertible Review
Razer Blade Stealth QHD i7-8550U: Intel Core i7-8550U, 13.30", 1.4 kg
Review » Razer Blade Stealth (QHD i7-8550U) Laptop Review
Dell XPS 13 i5-8250U: Intel Core i5-8250U, 13.30", 1.3 kg
Review » Dell XPS 13 9360R (i5-8250U, QHD) Laptop Review
Acer Spin 5 SP513-52N-54SF: Intel Core i5-8250U, 13.30", 1.5 kg
Review » Acer Spin 5 SP513-52N-54SF (i5-8250U, FHD) Convertible Laptop Review
Dell Inspiron 13 7370: Intel Core i5-8250U, 13.30", 1.4 kg
Review » Dell Inspiron 13 7370 (i5-8250U) Laptop Review
Lenovo Yoga 920-13IKB-80Y7: Intel Core i7-8550U, 13.90", 1.4 kg
Review » Lenovo Yoga 920-13IKB (i7-8550U, FHD) Convertible Review
Tuxedo InfinityBook Pro 13 2017: Intel Core i7-8550U, 13.30", 1.5 kg
Review » Tuxedo InfinityBook Pro 13 2017 (i7-8550U, 500 GB, 32 GB, FHD) Laptop Review
Dell XPS 13 i7-8550U: Intel Core i7-8550U, 13.30", 1.3 kg
Review » Dell XPS 13 (i7-8550U, QHD) Laptop Review
HP Pavilion x360 14-cd0957nd: Intel Core i5-8250U, 14.00", 1.6 kg
External Review » HP Pavilion x360 14-cd0957nd
Durabook R11: Intel Core i5-8250U, 11.60", 1.2 kg
External Review » Durabook R11
HP Spectre x360 13-ap0312ng: Intel Core i7-8565U, 13.30", 1.3 kg
External Review » HP Spectre x360 13-ap0312ng
Medion Akoya E15415-MD62481: Intel Core i5-10210U, 15.60", 1.9 kg
External Review » Medion Akoya E15415-MD62481
Asus ExpertBook P2451FA, i3-10110U: Intel Core i3-10110U, 14.00", 1.5 kg
External Review » Asus ExpertBook P2451FA, i3-10110U
Dell Latitude 15 5510-YKY1M: Intel Core i7-10610U, 15.60", 1.8 kg
External Review » Dell Latitude 15 5510-YKY1M
Huawei MateBook D 15 2020, i5-10210U: Intel Core i5-10210U, 15.60", 1.5 kg
External Review » Huawei MateBook D 15 2020, i5-10210U
HP 14-ck2010tu: Intel Core i5-10210U, 14.00", 1.5 kg
External Review » HP 14-ck2010tu
Honor MagicBook X 15, i3-10110U: Intel Core i3-10110U, 15.60", 1.6 kg
External Review » Honor MagicBook X 15, i3-10110U
MSI Modern 14 B10MW-421XES: Intel Core i5-10210U, 14.00", 1.3 kg
External Review » MSI Modern 14 B10MW-421XES
Asus VivoBook Flip 14 TP412FA-EC641T: Intel Core i3-10110U, 14.00", 1.5 kg
External Review » Asus VivoBook Flip 14 TP412FA-EC641T
Lenovo V15 IML-82NB002RUS: Intel Core i3-10110U, 15.60", 1.9 kg
External Review » Lenovo V15 IML-82NB002RUS
HP EliteBook x360 1030 G7-26K00US: Intel Core i7-10610U, 13.30", 1.2 kg
External Review » HP EliteBook x360 1030 G7-26K00US
Acer TravelMate P6 TMP614-51-G2-788Z: Intel Core i7-10510U, 14.00", 1.1 kg
External Review » Acer TravelMate P6 TMP614-51-G2-788Z
Kuu LeBook 12.6 Core i7-8550U: Intel Core i7-8550U, 12.60", 0.9 kg
External Review » Kuu LeBook 12.6 Core i7-8550U
Panasonic Toughbook FZ-G2: Intel Core i5-10310U, 10.10", 1.5 kg
External Review » Panasonic Toughbook FZ-G2
HP Pavilion x360 14-dh0807nd: Intel Core i5-8265U, 14.00", 1.6 kg
External Review » HP Pavilion x360 14-dh0807nd
Asus VivoBook Flip 14 TP412FA-EC707T: Intel Core i5-10210U, 14.00", 1.5 kg
External Review » Asus VivoBook Flip 14 TP412FA-EC707T
MSI Modern 14 B10MW-604: Intel Core i5-10210U, 14.00", 1.3 kg
External Review » MSI Modern 14 B10MW-604
Lenovo ThinkPad E14-20RA0016S: Intel Core i5-10210U, 14.00", 1.7 kg
External Review » Lenovo ThinkPad E14-20RA0016S
Acer Aspire 5 A514-52-582Y: Intel Core i5-10210U, 14.00", 1.6 kg
External Review » Acer Aspire 5 A514-52-582Y
Asus ExpertBook P2451FA, i5-10210U: Intel Core i5-10210U, 14.00", 1.5 kg
External Review » Asus ExpertBook P2451FA, i5-10210U
Dell Latitude 12 7210 2-in-1, i5-10210U: Intel Core i5-10210U, 12.30", 0.9 kg
External Review » Dell Latitude 12 7210 2-in-1, i5-10210U
Lenovo ThinkPad E14-20RA003WSP: Intel Core i5-10210U, 14.00", 2.2 kg
External Review » Lenovo ThinkPad E14-20RA003WSP
HP 15-dw1023ns: Intel Core i5-10210U, 15.60", 1.8 kg
External Review » HP 15-dw1023ns
Honor MagicBook X 14, i5-10210U: Intel Core i5-10210U, 14.00", 1.4 kg
External Review » Honor MagicBook X 14, i5-10210U
Lenovo IdeaPad 3 14IML-81WA004PPB: Intel Core i5-10210U, 14.00", 1.5 kg
External Review » Lenovo IdeaPad 3 14IML-81WA004PPB
Honor MagicBook X 14, i3-10110U: Intel Core i3-10110U, 14.00", 1.4 kg
External Review » Honor MagicBook X 14, i3-10110U
Honor MagicBook X 15, i5-10210U: Intel Core i5-10210U, 15.60", 1.6 kg
External Review » Honor MagicBook X 15, i5-10210U
Huawei MateBook D 15 2020, i3-10110U: Intel Core i3-10110U, 15.60", 1.5 kg
External Review » Huawei MateBook D 15 2020, i3-10110U
Dell Latitude 12 7210 2-in-1: Intel Core i7-10610U, 12.30", 0.9 kg
External Review » Dell Latitude 12 7210 2-in-1
Asus ZenBook 14 UX434FAC-A5144T: Intel Core i7-10510U, 14.00", 1.2 kg
External Review » Asus ZenBook 14 UX434FAC-A5144T
Lenovo Chromebook Flex 5 13IML05-82B80006UX: Intel Core i3-10110U, 13.30", 1.4 kg
External Review » Lenovo Chromebook Flex 5 13IML05-82B80006UX
HP Chromebook x360 13c-ca0013dx: Intel Core i5-10210U, 13.50", 1.4 kg
External Review » HP Chromebook x360 13c-ca0013dx
Dynabook Portégé X50-G-10V: Intel Core i7-10510U, 15.60", 1.4 kg
External Review » Dynabook Portégé X50-G-10V
Dell Latitude 14 5420, i7-10610U: Intel Core i7-10610U, 14.00", 1.4 kg
External Review » Dell Latitude 14 5420, i7-10610U
Panasonic Toughbook 33 2021: Intel Core i5-10310U, 12.00", 1.5 kg
External Review » Panasonic Toughbook 33 2021
HP Chromebook x360 14c-ca0004nd: Intel Core i5-10210U, 14.00", 1.7 kg
External Review » HP Chromebook x360 14c-ca0004nd
Honor MagicBook Pro, i5-10510U: Intel Core i7-10510U, 16.10", 1.7 kg
External Review » Honor MagicBook Pro, i5-10510U
HP EliteBook x360 1040 1Q6B5ES: Intel Core i5-10210U, 14.00", 1.4 kg
External Review » HP EliteBook x360 1040 1Q6B5ES
Lenovo IdeaPad Flex 5 CB 13IML05-82B80000MX : Intel Core i5-10210U, 13.30", 1.4 kg
External Review » Lenovo IdeaPad Flex 5 CB 13IML05-82B80000MX
Samsung Galaxy Chromebook 2, i3-10110U: Intel Core i3-10110U, 13.30", 1.3 kg
External Review » Samsung Galaxy Chromebook 2, i3-10110U
HP EliteBook x360 1040 G7 1Q6B4ES: Intel Core i7-10710U, 14.00", 1.4 kg
External Review » HP EliteBook x360 1040 G7 1Q6B4ES
Medion Akoya P6645 30026189: Intel Core i5-8265U, 15.60", 1.8 kg
External Review » Medion Akoya P6645 30026189
HP Elite c1030, i7-10610U: Intel Core i7-10610U, 13.50", 1.3 kg
External Review » HP Elite c1030, i7-10610U
Lenovo ThinkPad X13 Yoga-20SX002UGE: Intel Core i5-10210U, 13.30", 1.3 kg
External Review » Lenovo ThinkPad X13 Yoga-20SX002UGE
Lenovo ThinkPad X1 Carbon G8-20U90044UK: Intel Core i7-10510U, 14.00", 1.1 kg
External Review » Lenovo ThinkPad X1 Carbon G8-20U90044UK
Acer Chromebook Spin 713 CP713-2W-59SE: Intel Core i5-10210U, 13.50", 1.4 kg
External Review » Acer Chromebook Spin 713 CP713-2W-59SE
Dell Latitude 14 3410, i7-10510U: Intel Core i7-10510U, 14.00", 1.6 kg
External Review » Dell Latitude 14 3410, i7-10510U
Lenovo ThinkPad X13 Yoga 20SX0004GE: Intel Core i7-10510U, 13.30", 1.3 kg
External Review » Lenovo ThinkPad X13 Yoga 20SX0004GE
HP EliteBook 830 G7, i7-10510U: Intel Core i7-10510U, 13.30", 1.2 kg
External Review » HP EliteBook 830 G7, i7-10510U
Dell Latitude 7310, i5-10310U: Intel Core i5-10310U, 13.30", 1.2 kg
External Review » Dell Latitude 7310, i5-10310U
HP EliteBook x360 1040 G7, i7-10810U: Intel Core i7-10810U, 14.00", 1.4 kg
External Review » HP EliteBook x360 1040 G7, i7-10810U
HP EliteBook 840 G7, i7-10610U: Intel Core i7-10610U, 14.00", 1.2 kg
External Review » HP EliteBook 840 G7, i7-10610U
HP EliteBook x360 830 G7, i7-10510U: Intel Core i7-10510U, 13.30", 1.3 kg
External Review » HP EliteBook x360 830 G7, i7-10510U
Acer Enduro N3 EN314-51W-563C: Intel Core i5-10210U, 14.00", 2 kg
External Review » Acer Enduro N3 EN314-51W-563C
Acer Enduro N3 EN314-51W-78KN: Intel Core i7-10510U, 14.00", 2.5 kg
External Review » Acer Enduro N3 EN314-51W-78KN
HP Spectre 13-ap0690nd x360: Intel Core i5-8265U, 13.30", 1.4 kg
External Review » HP Spectre 13-ap0690nd x360
Asus VivoBook Flip 14 TP412FA-EC381T: Intel Core i3-10110U, 14.00", 1.5 kg
External Review » Asus VivoBook Flip 14 TP412FA-EC381T
Acer Aspire 5 A514-52-531Q: Intel Core i5-10210U, 14.00", 1.7 kg
External Review » Acer Aspire 5 A514-52-531Q
Asus Zenbook 15 UX534FTC-A8094T: Intel Core i7-10510U, 15.60", 1.6 kg
External Review » Asus Zenbook 15 UX534FTC-A8094T
MSI Modern 14 B10MW-050XES: Intel Core i7-10510U, 14.00", 1.3 kg
External Review » MSI Modern 14 B10MW-050XES
MSI Modern 14 B10MW-026XES: Intel Core i7-10510U, 14.00", 1.3 kg
External Review » MSI Modern 14 B10MW-026XES
Lenovo Thinkpad E15-20RD004JSP: Intel Core i5-10210U, 15.60"
External Review » Lenovo Thinkpad E15-20RD004JSP
Lenovo Yoga S730-81J00060EN: Intel Core i7-8565U, 13.30", 1.1 kg
External Review » Lenovo Yoga S730-81J00060EN
Lenovo ThinkPad X1 Yoga-20QF001WSP: Intel Core i5-8265U, 14.00", 1.4 kg
External Review » Lenovo ThinkPad X1 Yoga-20QF001WSP
Lenovo ThinkPad T14s-20T00044GE: Intel Core i5-10210U, 14.00", 1.3 kg
External Review » Lenovo ThinkPad T14s-20T00044GE
Lenovo ThinkPad X1 Carbon 2020-20U9003BGE: Intel Core i7-10510U, 14.00", 1.1 kg
External Review » Lenovo ThinkPad X1 Carbon 2020-20U9003BGE
Lenovo ThinkPad X1 Carbon 2020-20UAS04T00: Intel Core i7-10510U, 14.00", 1.1 kg
External Review » Lenovo ThinkPad X1 Carbon 2020-20UAS04T00
Lenovo IdeaPad Flex 5 CB 13IML05, i5-10210U: Intel Core i5-10210U, 13.30", 1.4 kg
External Review » Lenovo Chromebook Flex 5 13, i5-10210U
Dell Latitude 15 9510, i7-10810U: Intel Core i7-10810U, 15.60", 1.4 kg
External Review » Dell Latitude 15 9510, i7-10810U
Dell Latitude 14 9410 2-in-1, i5-10310U: Intel Core i5-10310U, 14.00", 1.4 kg
External Review » Dell Latitude 14 9410 2-in-1, i5-10310U
Dell Latitude 7410 Chromebook Enterprise: Intel Core i5-10310U, 14.00", 1.4 kg
External Review » Dell Latitude 7410 Chromebook Enterprise
Dell Latitude 14 9410 2-in-1 P110G: Intel Core i7-10610U, 14.00", 1.5 kg
External Review » Dell Latitude 14 9410 2-in-1 P110G
Dell Latitude 14 5410, i7-10610U: Intel Core i7-10610U, 14.00", 1.5 kg
External Review » Dell Latitude 14 5410, i7-10610U
HP EliteBook 840 G7, i5-10210U: Intel Core i5-10210U, 14.00", 1.3 kg
External Review » HP EliteBook 840 G7, i5-10210U
Dell Latitude 5310-GXX0D: Intel Core i5-10310U, 13.30", 1.2 kg
External Review » Dell Latitude 5310-GXX0D
Asus ExpertBook B9450FA-BM0367R: Intel Core i7-10510U, 14.00", 0.9 kg
External Review » Asus ExpertBook B9450FA-BM0367R
HP EliteBook 830 G7: Intel Core i7-10810U, 13.30", 1.3 kg
External Review » HP EliteBook 830 G7
Lenovo ThinkPad L14, i5-10210U: Intel Core i5-10210U, 14.00", 1.6 kg
External Review » Lenovo ThinkPad L14, i5-10210U
Acer Chromebook Spin 713 CP713-2W-51EJ: Intel Core i5-10210U, 13.50", 1.4 kg
External Review » Acer Chromebook Spin 713 CP713-2W-51EJ
Lenovo ThinkBook 13s-IML-20RR0003GE: Intel Core i7-10510U, 13.30", 1.3 kg
External Review » Lenovo ThinkBook 13s-IML-20RR0003GE
Lenovo ThinkPad X1 Yoga 2019-20QF00AEMH: Intel Core i7-8565U, 14.00", 1.4 kg
External Review » Lenovo ThinkPad X1 Yoga 2019-20QF00AEMH
MSI Modern 14 B10RBSW-063XES: Intel Core i7-10510U, 14.00"
External Review » MSI Modern 14 B10RBSW-063XES
Lenovo IdeaPad Flex 5 CB 13IML05-82B80013MH: Intel Celeron 5205U, 13.30", 1.4 kg
External Review » Lenovo IdeaPad Flex 5 CB 13IML05-82B80013MH
Lenovo ThinkPad X1 Yoga 2020-20UB000NUS: Intel Core i7-10610U, 14.00", 1.4 kg
External Review » Lenovo ThinkPad X1 Yoga 2020-20UB000NUS
HP EliteBook 840 G7, i7-10810U: Intel Core i7-10810U, 14.00", 1.2 kg
External Review » HP EliteBook 840 G7, i7-10810U
Dell Latitude 15 3510, i3-10110U: Intel Core i3-10110U, 15.60", 1.9 kg
External Review » Dell Latitude 15 3510, i3-10110U
Acer Enduro N3 EN314-51W-54EA: Intel Core i5-10210U, 14.00", 2 kg
External Review » Acer Enduro N3 EN314-51W-54EA
Lenovo Chromebook C340-15, i3-8130U: Intel Core i3-8130U, 15.60", 2 kg
External Review » Lenovo Chromebook C340-15, i3-8130U
Acer Chromebook 715 CB715-1WT-39HZ: Intel Core i3-8130U, 15.60", 2 kg
External Review » Acer Chromebook 715 CB715-1WT-39HZ
Dell Latitude 15 5510-D90XK: Intel Core i5-10310U, 15.60", 1.8 kg
External Review » Dell Latitude 15 5510-D90XK
Lenovo Yoga Duet 7 13IML05, i7-10510U: Intel Core i7-10510U, 13.00", 0.8 kg
External Review » Lenovo Yoga Duet 7 13IML05, i7-10510U
MSI Modern 14 A10M-1034XES: Intel Core i5-10210U, 14.00", 1.2 kg
External Review » MSI Modern 14 A10M-1034XES
Lenovo Yoga Duet 7 13IML05, i5-10210U: Intel Core i5-10210U, 13.00", 0.8 kg
External Review » Lenovo Yoga Duet 7 13IML05, i5-10210U
Lenovo ThinkBook 13s-20RR0003GE: Intel Core i7-10510U, 13.30", 1.3 kg
External Review » Lenovo ThinkBook 13s-20RR0003GE
HP EliteBook 840 G7-1J6E9EA: Intel Core i7-10710U, 14.00", 1.5 kg
External Review » HP EliteBook 840 G7-1J6E9EA
Asus VivoBook Flip 14 TP412FA-EC369T: Intel Core i5-10210U, 14.00", 1.5 kg
External Review » Asus VivoBook Flip 14 TP412FA-EC369T
Lenovo ThinkPad L13 Yoga 20R5000SUK: Intel Core i7-10510U, 13.30", 1.4 kg
External Review » Lenovo ThinkPad L13 Yoga 20R5000SUK
Lenovo ThinkPad L13 20R3000GGE: Intel Core i7-10510U, 13.30", 1.4 kg
External Review » Lenovo ThinkPad L13 20R3000GGE
Lenovo Ideapad C340-14IMLI7: Intel Core i7-10510U, 14.00", 1.7 kg
External Review » Lenovo Ideapad C340-14IMLI7
Acer Aspire 3 A315-54K: Intel Core i3-8130U, 15.60", 1.9 kg
External Review » Acer Aspire 3 A315-54K
Dell Latitude 9510-P94F: Intel Core i5-10310U, 15.60", 1.5 kg
External Review » Dell Latitude 9510-P94F
Asus VivoBook 14 A412FA i3-10110U: Intel Core i3-10110U, 14.00", 1.4 kg
External Review » Asus VivoBook 14 A412FA i3-10110U
Dell Latitude 9510 2-in-1: Intel Core i7-10810U, 15.00", 1.7 kg
External Review » Dell Latitude 9510 2-in-1
Asus ExpertBook P2451FA, i7-10510U: Intel Core i7-10510U, 14.00", 1.6 kg
External Review » Asus ExpertBook P2451FA, i7-10510U
HP Pro c640 Chromebook, i7-10610U: Intel Core i7-10610U, 14.00", 1.5 kg
External Review » HP Pro c640 Chromebook, i7-10610U
Fujitsu LifeBook U9310X, i7-10610U: Intel Core i7-10610U, 13.30", 1 kg
External Review » Fujitsu LifeBook U9310X, i7-10610U
Lenovo ThinkPad X13-20T20033GE: Intel Core i5-10210U, 13.30", 1.3 kg
External Review » Lenovo ThinkPad X13-20T20033GE
Dell Latitude 7490, i5-8350U: Intel Core i5-8350U, 14.00", 1.4 kg
External Review » Dell Latitude 7490, i5-8350U
Asus VivoBook S14 S412FA-EK678T: Intel Core i5-10210U, 14.00", 1.5 kg
External Review » Asus VivoBook S14 S412FA-EK678T
Acer Chromebook Spin 13 CP713-2W-356L: Intel Core i3-10110U, 13.50", 1.4 kg
External Review » Acer Chromebook Spin 13 CP713-2W-356L
Lenovo ThinkPad X1 Yoga 2020-20UCS03S00: Intel Core i7-10510U, 14.00", 1.3 kg
External Review » Lenovo ThinkPad X1 Yoga 2020-20UCS03S00
Lenovo ThinkPad X1 Carbon G8, Core i7-10610U: Intel Core i7-10610U, 14.00", 1.1 kg
External Review » Lenovo ThinkPad X1 Carbon G8, Core i7-10610U
Acer Aspire 5 A515-54-74MM: Intel Core i7-10510U, 15.60", 1.8 kg
External Review » Acer Aspire 5 A515-54-74MM
Asus VivoBook S14 S433FA-EB491: Intel Core i7-10510U, 14.00", 1.5 kg
External Review » Asus VivoBook S14 S433FA-EB491
Fujitsu LifeBook U9310X, i5-10210U: Intel Core i5-10210U, 13.30", 1 kg
External Review » Fujitsu LifeBook U9310X, i5-10210U
Asus VivoBook S15 S533FA-BQ017T: Intel Core i7-10510U, 15.60", 1.8 kg
External Review » Asus VivoBook S15 S533FA-BQ017T
HP Chromebook x360 14-ca0241ng: Intel Core i3-10110U, 14.00", 1.7 kg
External Review » HP Chromebook x360 14-ca0241ng
Fujitsu LifeBook U7410, i7-10510U: Intel Core i7-10510U, 14.00", 1.5 kg
External Review » Fujitsu LifeBook U7410, i7-10510U
Lenovo ThinkPad T15, i5-10210U: Intel Core i5-10210U, 15.60", 1.9 kg
External Review » Lenovo ThinkPad T15, i5-10210U
Lenovo ThinkPad L15, i5-10210U: Intel Core i5-10210U, 15.60", 2 kg
External Review » Lenovo ThinkPad L15, i5-10210U
Lenovo ThinkPad X13 Yoga 20SX0026US: Intel Core i5-10310U, 13.30", 1.3 kg
External Review » Lenovo ThinkPad X13 Yoga 20SX0026US
Dell Latitude 14 9410-40DHN 2-in-1: Intel Core i7-10610U, 14.00", 1.4 kg
External Review » Dell Latitude 14 9410-40DHN 2-in-1
Acer Chromebook Spin 713 CP713-2W-560V: Intel Core i5-10210U, 13.50", 1.4 kg
External Review » Acer Chromebook Spin 13 CP713-2W-560V
Fujitsu Lifebook U939X: Intel Core i5-8265U, 13.30", 1 kg
External Review » Fujitsu Lifebook U939X
Dell Latitude 7410: Intel Core i7-10610U, 14.00", 1.4 kg
External Review » Dell Latitude 7410
Acer Aspire 3 A317-51-51DW: Intel Core i5-10210U, 17.30", 2.7 kg
External Review » Acer Aspire 3 A317-51-51DW
Dell Vostro 15 3590, i5-10210U: Intel Core i5-10210U, 15.60"
External Review » Dell Vostro 15 3590, i5-10210U
LG Gram 15Z980-B.AA78B: Intel Core i7-8550U, 15.60", 1.1 kg
External Review » LG Gram 15Z980-B.AA78B
Lenovo ThinkPad L13 Yoga 20R5002AUS: Intel Core i5-10310U, 13.30", 1.4 kg
External Review » Lenovo ThinkPad L13 Yoga 20R5002AUS
Lenovo ThinkPad X1 Carbon 2020 i5-10210U: Intel Core i5-10210U, 14.00", 1.1 kg
External Review » Lenovo ThinkPad X1 Carbon 2020 i5-10210U
Lenovo ThinkPad X1 Carbon 2020-20U9005NUS: Intel Core i5-10310U, 14.00", 1.1 kg
External Review » Lenovo ThinkPad X1 Carbon 2020-20U9005NUS
Samsung Galaxy Book Ion 15 NP950XCJ-K01DE: Intel Core i7-10510U, 15.60", 1.3 kg
External Review » Samsung Galaxy Book Ion 15 NP950XCJ-K01DE
Acer Chromebook Spin 13 CP713-2W-76P2: Intel Core i7-10610U, 13.50", 1.4 kg
External Review » Acer Chromebook Spin 13 CP713-2W-76P2
HP 15-dw1002nu: Intel Core i3-10110U, 15.60", 1.8 kg
External Review » HP 15-dw1002nu
Lenovo ThinkBook Plus 13 i5: Intel Core i5-10210U, 13.30", 1.4 kg
External Review » Lenovo ThinkBook Plus 13 i5
Acer Chromebook 715 CB715-1WT-33NB: Intel Core i3-8130U, 15.60", 2 kg
External Review » Acer Chromebook 715 CB715-1WT-33NB
Dell Latitude 7310: Intel Core i7-10610U, 13.30", 1.2 kg
External Review » Dell Latitude 7310
Lenovo ThinkPad L13 Yoga 20R6S00800: Intel Core i5-10210U, 13.30", 1.4 kg
External Review » Lenovo ThinkPad L13 Yoga 20R6S00800
Acer Enduro N7 EN714-51W-559L: Intel Core i5-8250U, 14.00", 2.9 kg
External Review » Acer Enduro N7 EN714-51W-559L
HP 14s-dq0007ns: Intel Core i3-8130U, 14.00", 1.5 kg
External Review » HP 14s-dq0007ns
Acer Aspire 5 A515-54-59W2: Intel Core i5-10210U, 15.60", 1.8 kg
External Review » Acer Aspire 5 A515-54-59W2
HP Pavilion x360 14-dh1012ns: Intel Core i5-10210U, 14.00", 1.6 kg
External Review » HP Pavilion x360 14-dh1012ns
Acer Aspire 3 A317-51-37PX: Intel Core i3-10110U, 17.30", 2.8 kg
External Review » Acer Aspire 3 A317-51-37PX
HP Elitebook x360 1040 G6: Intel Core i5-8265U, 14.00", 1.4 kg
External Review » HP Elitebook x360 1040 G6
MSI Modern 14 A10M-812XES: Intel Core i5-10210U, 14.00", 1.2 kg
External Review » MSI Modern 14 A10M-812XES
Acer Swift 3 SF314-58-59KV: Intel Core i5-10210U, 14.00", 1.5 kg
External Review » Acer Swift 3 SF314-58-59KV
Huawei Matebook D 15 (2018): Intel Core i3-8130U, 15.60", 1.9 kg
External Review » Huawei Matebook D 15 (2018)
HP ProBook 430 G7, i5-10210U: Intel Core i5-10210U, 13.30", 1.5 kg
External Review » HP ProBook 430 G7, i5-10210U
HP Pavilion x360 14-dh1153ng: Intel Core i5-10210U, 14.00", 1.6 kg
External Review » HP Pavilion x360 14-dh1153ng
Samsung Galaxy Book Ion 13.3: Intel Core i5-10210U, 13.30", 1 kg
External Review » Samsung Galaxy Book Ion 13.3
Lenovo IdeaPad Flex 5 CB 13IML05, i3-10110U: Intel Core i3-10110U, 13.30", 1.4 kg
External Review » Lenovo Chromebook Flex 5 13, i3-10110U
MSI PS42 8M-072ES: Intel Core i7-8550U, 14.00", 1.2 kg
External Review » MSI PS42 8M-072ES
MSI Modern 15 A10M-088XES: Intel Core i5-10210U, 15.60", 1.6 kg
External Review » MSI Modern 15 A10M-088XES
Huawei MateBook 13 2020 i5: Intel Core i5-10210U, 13.00", 1.3 kg
External Review » Huawei MateBook 13 2020 i5
Acer Aspire A515-54-36HG: Intel Core i3-10110U, 15.60", 1.8 kg
External Review » Acer Aspire A515-54-36HG
Acer TravelMate P614-51-G2-57MS: Intel Core i5-10210U, 14.00", 1.2 kg
External Review » Acer TravelMate P614-51-G2-57MS
Lenovo ThinkPad L13 Yoga 20R50004GE: Intel Core i5-10210U, 13.30", 1.4 kg
External Review » Lenovo ThinkPad L13 Yoga 20R50004GE
Asus VivoBook S14 S433FA-EB123T: Intel Core i7-10510U, 14.00", 1.5 kg
External Review » Asus VivoBook S14 S433FA-EB123T
Lenovo Yoga C640-13IML-81UE000TUK: Intel Core i3-10110U, 13.30", 1.4 kg
External Review » Lenovo Yoga C640-13IML-81UE000TUK
Asus VivoBook S14 S433FA-EB010T: Intel Core i5-10210U, 14.00", 1.5 kg
External Review » Asus VivoBook S14 S433FA-EB010T
Lenovo ThinkPad E15, i5-10210U: Intel Core i5-10210U, 15.60", 1.9 kg
External Review » Lenovo ThinkPad E15, i5-10210U
HP ProBook 450 G7-8VU93EA: Intel Core i5-10210U, 15.60", 2 kg
External Review » HP ProBook 450 G7-8VU93EA
Asus Chromebook Flip C436FA, i3-10110U: Intel Core i3-10110U, 14.00", 1.2 kg
External Review » Asus Chromebook Flip C436FA, i3-10110U
HP ProBook 440 G7-3C084ES: Intel Core i5-10210U, 14.00", 1.6 kg
External Review » HP ProBook 440 G7-3C084ES
Lenovo Yoga 530-14IKB-81EK00TNGE: Intel Core i5-8250U, 14.00", 1.6 kg
External Review » Lenovo Yoga 530-14IKB-81EK00TNGE
Acer ChromeBook 714 CB714-1WT-52QC: Intel Core i5-8250U, 14.00", 1.6 kg
External Review » Acer ChromeBook 714 CB714-1WT-52QC
Lenovo Chromebook S340-15: Intel Core i3-8130U, 15.60", 2 kg
External Review » Lenovo Chromebook S340-15
Lenovo ThinkBook 14-IML-20RV00BRIH: Intel Core i3-10110U, 14.00", 1.5 kg
External Review » Lenovo ThinkBook 14-IML-20RV00BRIH
Dell Vostro 15 3590, i7-10510U: Intel Core i7-10510U, 15.60", 2 kg
External Review » Dell Vostro 15 3590, i7-10510U
Dynabook Satellite Pro L50-G-151: Intel Core i7-10710U, 15.60", 1.7 kg
External Review » Dynabook Satellite Pro L50-G-151
Lenovo ThinkPad E14 20RA001BGE: Intel Core i7-10510U, 14.00", 1.8 kg
External Review » Lenovo ThinkPad E14 20RA001BGE
Asus VivoBook S15 S533FA-BQ009T: Intel Core i5-10210U, 15.60", 1.8 kg
External Review » Asus VivoBook S15 S533FA-BQ009T
HP Pavilion x360 14-dh1004ns: Intel Core i5-10210U, 14.00", 1.6 kg
External Review » HP Pavilion x360 14-dh1004ns
Lenovo Yoga C740-14IML-81TC006VGE: Intel Core i5-10210U, 14.00", 1.4 kg
External Review » Lenovo Yoga C740-14IML-81TC006VGE
Asus ZenBook Flip 14 UX463FA-AI027T: Intel Core i5-10210U, 14.00", 1.4 kg
External Review » Asus ZenBook Flip 14 UX463FA-AI027T
Huawei MateBook 13 2020: Intel Core i7-10510U, 13.00", 1.3 kg
External Review » Huawei MateBook 13 2020
Lenovo ThinkPad E14 20RA001MGE: Intel Core i5-10210U, 14.00", 1.6 kg
External Review » Lenovo ThinkPad E14 20RA001MGE
Lenovo Yoga S940-14IWL-81Q7003WGE: Intel Core i7-8565U, 14.00", 1.2 kg
External Review » Lenovo Yoga S940-14IWL-81Q7003WGE
Acer Aspire 3 A317-51G-569Z: Intel Core i5-10210U, 17.30", 2.7 kg
External Review » Acer Aspire 3 A317-51G-569Z
LG Gram 14T90N-R.AAS8U1: Intel Core i7-10510U, 14.00", 1.2 kg
External Review » LG Gram 14T90N-R.AAS8U1
HP 15-dw0017ns: Intel Core i5-8265U, 15.60", 1.8 kg
External Review » HP 15-dw0017ns
Asus ZenBook 14 UX431FA-AM149T: Intel Core i5-10210U, 14.00", 1.4 kg
External Review » Asus ZenBook 14 UX431FA-AM149T
Asus ZenBook 14 UX434FAC-A5188T: Intel Core i7-10510U, 14.00", 1.2 kg
External Review » Asus ZenBook 14 UX434FAC-A5188T
Acer Aspire 3 A315-54-52UL: Intel Core i5-10210U, 15.60", 1.9 kg
External Review » Acer Aspire 3 A315-54-52UL
Lenovo ThinkPad T480s-20L7001LMH: Intel Core i7-8550U, 14.00", 1.3 kg
External Review » Lenovo ThinkPad T480s-20L7001LMH
Lenovo Yoga C740-15IML-81TD002MMH: Intel Core i7-10510U, 15.60", 1.9 kg
External Review » Lenovo Yoga C740-15IML-81TD002MMH
HP Envy 13-aq1048tu: Intel Core i5-10210U, 13.30", 1.2 kg
External Review » HP Envy 13-aq1048tu
HP 348 G7-9PH06PA: Intel Core i5-10210U, 14.00", 1.5 kg
External Review » HP 348 G7-9PH06PA
HP Envy 13-aq1004ns: Intel Core i5-10210U, 13.30", 1.3 kg
External Review » HP Envy 13-aq1004ns
Asus VivoBook 14 A412F-EK739T: Intel Core i5-10210U, 14.00", 1.4 kg
External Review » Asus VivoBook 14 A412F-EK739T
Acer Aspire 5 A514-52-713B: Intel Core i7-10510U, 14.00", 1.5 kg
External Review » Acer Aspire 5 A514-52-713B
HP Spectre x360 13-ap0017nl: Intel Core i7-8565U, 13.30", 1.3 kg
External Review » HP Spectre x360 13-ap0017nl
MSI Modern 15 A10M-028: Intel Core i7-10510U, 15.60", 1.6 kg
External Review » MSI Modern 15 A10M-028
Acer TravelMate X3 TMX314-51-M-561H: Intel Core i5-8265U, 14.00", 1.6 kg
External Review » Acer TravelMate X3 TMX314-51-M-561H
Dell Latitude 13 3301, i5-8265U: Intel Core i5-8265U, 13.30", 1.2 kg
External Review » Dell Latitude 3301, i5-8265U
Lenovo V14-IWL-81YB0000GE: Intel Core i3-8145U, 14.00", 1.6 kg
External Review » Lenovo V14-IWL-81YB0000GE
Lenovo Yoga C740-15IML-81TD001MGE: Intel Core i5-10210U, 15.60", 1.9 kg
External Review » Lenovo Yoga C740-15IML-81TD001MGE
HP Envy 13-aq0044nr: Intel Core i7-8565U, 13.30", 1.2 kg
External Review » HP Envy 13-aq0044nr
Acer TravelMate P6 TMP614-51T-G2-59VT: Intel Core i5-10210U, 14.00", 1.2 kg
External Review » Acer TravelMate P6 TMP614-51T-G2-59VT
Asus ZenBook Flip 14 UX463FL-AI025R: Intel Core i7-10510U, 14.00", 1.4 kg
External Review » Asus ZenBook Flip 14 UX463FL-AI025R
Lenovo V15-IWL-81YE0005GE: Intel Core i5-8265U, 15.60", 2.1 kg
External Review » Lenovo V15-IWL-81YE0005GE
Lenovo Yoga C740-15IML: Intel Core i7-10510U, 15.60", 1.9 kg
External Review » Lenovo Yoga C740-15IML
Schenker VIA 14: Intel Core i5-10210U, 14.00", 1.1 kg
External Review » Schenker VIA 14
HP Pavilion x360 14-dh1000ns: Intel Core i7-10510U, 14.00", 1.6 kg
External Review » HP Pavilion x360 14-dh1000ns
HP Pavilion x360 14-dh1011ns: Intel Core i3-10110U, 14.00", 1.6 kg
External Review » HP Pavilion x360 14-dh1011ns
Asus ZenBook 14 UX431FA-AM132T : Intel Core i5-10210U, 14.00", 1.5 kg
External Review » Asus ZenBook 14 UX431FA-AM132T
MSI Modern 14 A10M-669: Intel Core i5-10210U, 14.00", 1.2 kg
External Review » MSI Modern 14 A10M-669
Huawei MateBook X Pro 2020, Core i5-10210U: Intel Core i5-10210U, 13.90", 1.3 kg
External Review » Huawei MateBook X Pro 2020, Core i5-10210U
Lenovo ThinkBook 14-20RV0000MX: Intel Core i7-10510U, 14.00", 1.5 kg
External Review » Lenovo ThinkBook 14-20RV0000MX
HP Envy 13-aq0004np: Intel Core i7-8565U, 13.30", 1.2 kg
External Review » HP Envy 13-aq0004np
HP Elite Dragonfly i5-8365U: Intel Core i5-8365U, 13.30", 1 kg
External Review » HP Elite Dragonfly i5-8365U
Acer Spin 3 SP314-51-58JC: Intel Core i5-8250U, 14.00", 1.7 kg
External Review » Acer Spin 3 SP314-51-58JC
Lenovo ThinkPad X1 Carbon 2019-20QES01L00: Intel Core i7-8565U, 14.00", 1.1 kg
External Review » Lenovo ThinkPad X1 Carbon 2019-20QES01L00
Dell Vostro 15 3590, i3-10110U: Intel Core i3-10110U, 15.60", 2 kg
External Review » Dell Vostro 15 3590, i3-10110U
Dell Latitude 14 5400 Chromebook: Intel Core i5-8365U, 14.00", 1.5 kg
External Review » Dell Latitude 14 5400 Chromebook
Lenovo ThinkPad X1 Yoga 2020-20U9005NUS: Intel Core i5-10310U, 14.00", 1.3 kg
External Review » Lenovo ThinkPad X1 Yoga Gen 5
Lenovo ThinkPad X1 Carbon G8, Core i7-10810U: unknown, 14.00", 1.1 kg
External Review » Lenovo ThinkPad X1 Carbon G8, Core i7-10810U
Dell Inspiron 14 5491-3WDPX, 2-in-1: Intel Core i5-10210U, 14.00", 1.7 kg
External Review » Dell Inspiron 14 5491-3WDPX, 2-in-1
Samsung Galaxy Book Flex Alpha 13 (α): unknown, 13.30", 1.2 kg
External Review » Samsung Galaxy Book Flex Alpha 13 (α)
Lenovo ThinkBook 15 : Intel Core i5-10210U, 15.60", 1.9 kg
External Review » Lenovo ThinkBook 15
Asus VivoBook 14 A412FA-EK343T: Intel Core i5-8265U, 14.00", 1.5 kg
External Review » Asus VivoBook 14 A412FA-EK343T
Lenovo ThinkBook Plus 13 i7: Intel Core i7-10510U, 13.30", 1.4 kg
External Review » Lenovo ThinkBook Plus 13 i7
Asus ExpertBook B9450FA, i7-10510U: Intel Core i7-10510U, 14.00", 1 kg
External Review » Asus ExpertBook B9450FA, i7-10510U
Lenovo ThinkPad X1 Yoga G4-20QG000UGE: Intel Core i7-8665U, 14.00", 1.4 kg
External Review » Lenovo ThinkPad X1 Yoga G4-20QG000UGE
Dell Inspiron 13 7391 2-in-1, i5-10510U: Intel Core i7-10510U, 13.30", 1.4 kg
External Review » Dell Inspiron 13 7391 2-in-1, i5-10510U
Dell Inspiron 14 5490-6C55V: Intel Core i7-10510U, 14.00", 1.5 kg
External Review » Dell Inspiron 14 5490-6C55V
HP Elite Dragonfly-8UY50UT: Intel Core i7-8665U, 13.30", 1.1 kg
External Review » HP Elite Dragonfly-8UY50UT
Asus Chromebook Flip C436FA, i5-10210U: Intel Core i5-10210U, 14.00", 1.1 kg
External Review » Asus Chromebook Flip C436FA, i5-10210U
Samsung Galaxy Chromebook XE930QCA-K01US: Intel Core i5-10210U, 13.30", 1 kg
External Review » Samsung Galaxy Chromebook XE930QCA-K01US
HP Pavilion x360 14m-dh0003dx: Intel Core i5-8265U, 14.00", 1.6 kg
External Review » HP Pavilion x360 14m-dh0003dx
Dell Inspiron 14 7490-99DXP: Intel Core i5-10210U, 14.00", 1.3 kg
External Review » Dell Inspiron 14 7490-99DXP
MSI Prestige 15 A10SC-008ES: Intel Core i7-10710U, 15.60", 1.7 kg
External Review » MSI Prestige 15 A10SC-008ES
Asus ZenBook Flip 13 UX362FA-EL206T: Intel Core i7-8565U, 13.30", 1.3 kg
External Review » Asus ZenBook Flip 13 UX362FA-EL206T
Lenovo Ideapad C340-14IML-81TK001SGE: Intel Core i3-10110U, 14.00", 1.7 kg
External Review » Lenovo Ideapad C340-14IML-81TK001SGE
Acer Extensa 2540-53W6: Intel Core i5-7200U, 15.60", 2.4 kg
External Review » Acer Extensa 2540-53W6
HP Chromebook x360 14-da0500nd: Intel Core i5-8250U, 14.00", 1.7 kg
External Review » HP Chromebook x360 14-da0500nd
Dell Latitude 9510 2in1: Intel Core i5-10210U, 15.60", 1.5 kg
External Review » Dell Latitude 9510 2in1
Asus VivoBook S15 S530FA-EJ335T: Intel Core i7-8565U, 15.60", 1.8 kg
External Review » Asus VivoBook S15 S530FA-EJ335T
Acer Aspire 3 A317-51-58S7: Intel Core i5-10210U, 17.30", 2.7 kg
External Review » Acer Aspire 3 A317-51-58S7
Fujitsu LifeBook U748: Intel Core i5-8250U, 14.00", 1.6 kg
External Review » Fujitsu LifeBook U748
HP Elite Dragonfly-8MK79EA: Intel Core i5-8265U, 13.30", 1.1 kg
External Review » HP Elite Dragonfly-8MK79EA
HP Envy x360 15-dr1038no: Intel Core i7-10510U, 15.60", 2.1 kg
External Review » HP Envy x360 15-dr1038no
Lenovo ThinkBook 13s-IWL-20R90070SP: Intel Core i5-8265U, 13.30", 1.4 kg
External Review » Lenovo ThinkBook 13s-IWL-20R90070SP
Acer TravelMate P6 TP614-51-G2: Intel Core i7-10510U, 14.00", 1.2 kg
External Review » Acer TravelMate P6 TP614-51-G2
Acer Aspire 5 A515-54-735N: Intel Core i7-10510U, 15.60", 1.8 kg
External Review » Acer Aspire 5 A515-54-735N
HP 15-bs182nd: Intel Core i5-8250U, 15.60", 1.9 kg
External Review » HP 15-bs182nd
Lenovo Ideapad 530s-14IKB-81EU00N8SP: Intel Core i5-8250U, 14.00", 1.6 kg
External Review » Lenovo Ideapad 530s-14IKB-81EU00N8SP
Acer Aspire 5 A514-52-570U: Intel Core i5-10210U, 14.00", 1.5 kg
External Review » Acer Aspire 5 A514-52-570U
Asus R521FA-EJ545: Intel Core i7-8565U, 15.60", 1.8 kg
External Review » Asus R521FA-EJ545
HP EliteBook 840 G5 3JX05EA: Intel Core i7-8550U, 14.00", 1.6 kg
External Review » HP EliteBook 840 G5 3JX05EA
Asus VivoBook S15 S532FA-BN086T: Intel Core i5-8265U, 15.60", 1.7 kg
External Review » Asus VivoBook S15 S532FA-BN086T
Dell Latitude 7400-MW4XV 2-in-1: Intel Core i5-8265U, 14.00", 1.5 kg
External Review » Dell Latitude 7400-MW4XV 2-in-1
Dell Vostro 15 5590, i5-10210U: Intel Core i5-10210U, 15.60", 1.7 kg
External Review » Dell Vostro 15 5590, i5-10210U
HP Chromebook x360 14-da0001nf: Intel Core i5-8250U, 14.00", 1.7 kg
External Review » HP Chromebook x360 14-da0001nf
Lenovo Ideapad S145-15IWL-81MV010TSP: Intel Core i5-8265U, 15.60", 1.9 kg
External Review » Lenovo Ideapad S145-15IWL-81MV010TSP
Acer ChromeBook 714 CB714-1WT-36MS: Intel Core i3-8130U, 14.00", 1.5 kg
External Review » Acer ChromeBook 714 CB714-1WT-36MS
Medion Akoya S6445-MD61411: Intel Core i5-8265U, 15.60", 1.8 kg
External Review » Medion Akoya S6445-MD61411
Asus UX410UA-GV426: Intel Core i7-8550U, 14.00", 1.4 kg
External Review » Asus UX410UA-GV426
Asus VivoBook S14 S432FA-EB001T: Intel Core i5-8265U, 14.00", 1.4 kg
External Review » Asus VivoBook S14 S432FA-EB001T
Acer Chromebook 715 CB715-1WT-5368: Intel Core i5-8250U, 15.60", 2 kg
External Review » Acer Chromebook 715 CB715-1WT-5368
Dell Latitude 12 7220 Rugged Extreme, i7-8665U: Intel Core i3-8145U, 11.60", 1.3 kg
External Review » Dell Latitude 12 7220 Rugged Extreme, i7-8665U
Asus F409FA-EK254T: Intel Core i5-8265U, 14.00", 1.5 kg
External Review » Asus F409FA-EK254T
Acer Aspire 3 A315-54K-59N: Intel Core i5-10210U, 15.60", 1.9 kg
External Review » Acer Aspire 3 A315-54K-59N
Asus ZenBook 13 UX333FA-A3283: Intel Core i7-8565U, 13.30", 1.1 kg
External Review » Asus ZenBook 13 UX333FA-A3283
HP Pavilion x360 14-dh0009ns: Intel Core i5-8265U, 14.00", 1.7 kg
External Review » HP Pavilion x360 14-dh0009ns
Asus ZenBook Duo UX481FL-BM040T: Intel Core i5-10210U, 14.00", 1.5 kg
External Review » Asus ZenBook Duo UX481FL-BM040T
Asus ZenBook 14 UX434FAC-A5225T: Intel Core i5-10210U, 14.00", 1.3 kg
External Review » Asus ZenBook 14 UX434FAC-A5225T
Lenovo ThinkBook 14-IML-20RV006TGE: Intel Core i5-10210U, 14.00", 1.6 kg
External Review » Lenovo ThinkBook 14-IML-20RV006TGE
Lenovo ThinkPad X1 Carbon G7-20QD00L1MH: Intel Core i7-8565U, 14.00", 1.1 kg
External Review » Lenovo ThinkPad X1 Carbon G7-20QD00L1MH
HP EliteBook 850 G6-6XE19EA: Intel Core i5-8265U, 15.60", 1.8 kg
External Review » HP EliteBook 850 G6-6XE19EA
Dell XPS 13 7390 Core i7-10510U: Intel Core i7-10510U, 13.30", 1.2 kg
External Review » Dell XPS 13 7390 Core i7-10510U
Lenovo ThinkBook 14-IML-20RV005WGE: Intel Core i7-10510U, 14.00", 1.5 kg
External Review » Lenovo ThinkBook 14-IML-20RV005WGE
Acer Aspire 5 A515-51-50Y5: Intel Core i5-8250U, 15.60", 2.2 kg
External Review » Acer Aspire 5 A515-51-50Y5
Lenovo ThinkPad L490 20Q6S08600: Intel Core i5-8265U, 14.00", 1.7 kg
External Review » Lenovo ThinkPad L490 20Q6S08600
Asus VivoBook S14 S432FL-EB036T: Intel Core i5-8265U, 14.00", 1.5 kg
External Review » Asus VivoBook S14 S432FL-EB036T
MSI Modern 14 A10M-600XES: Intel Core i5-10210U, 14.00", 1.2 kg
External Review » MSI Modern 14 A10M-600XES
HP Pavilion x360 14-dh0007ns: Intel Core i7-8565U, 14.00", 1.6 kg
External Review » HP Pavilion x360 14-dh0007ns
Acer TravelMate X3 TMX3410-MG-59Z5: Intel Core i5-8250U, 14.00", 1.6 kg
External Review » Acer TravelMate X3 TMX3410-MG-59Z5
HP 15-dw0020ns: Intel Core i7-8565U, 15.60", 1.8 kg
External Review » HP 15-dw0020ns
HP 15-dw0018ns: Intel Core i5-8265U, 15.60", 1.8 kg
External Review » HP 15-dw0018ns
Acer Aspire 3 A315-53-561Y: Intel Core i5-8250U, 15.60", 2.1 kg
External Review » Acer Aspire 3 A315-53-561Y
HP 15-dw0019ns: Intel Core i7-8565U, 15.60", 1.8 kg
External Review » HP 15-dw0019ns
Lenovo ThinkBook 13s-IWL-20R9006YMH: Intel Core i5-8265U, 13.30", 1.3 kg
External Review » Lenovo ThinkBook 13s-IWL-20R9006YMH
Medion Akoya S6445-MD61354: Intel Core i7-8565U, 15.60", 1.8 kg
External Review » Medion Akoya S6445-MD61354
Acer Swift 3 SF315-52-37YA: Intel Core i3-8130U, 15.60", 1.8 kg
External Review » Acer Swift 3 SF315-52-37YA
Dell XPS 13 7390 Core i5-10210U: Intel Core i5-10210U, 13.30", 1.3 kg
External Review » Dell XPS 13 7390 Core i5-10210U
Lenovo Ideapad S340-15IWL-81N80038GE: Intel Core i5-8265U, 15.60", 1.8 kg
External Review » Lenovo Ideapad S340-15IWL-81N80038GE
Lenovo IdeaPad Flex 6 14-81EM000KUS: Intel Core i5-8250U, 14.00", 1.7 kg
External Review » Lenovo IdeaPad Flex 6 14-81EM000KUS
Dell Latitude 15 3500-V58YD: Intel Core i5-8265U, 15.60", 2 kg
External Review » Dell Latitude 15 3500-V58YD
Dell Inspiron 13 7391 2-in-1, i5-10210U: Intel Core i5-10210U, 13.30", 1.4 kg
External Review » Dell Inspiron 13 7391 2-in-1, i5-10210U
Lenovo ThinkPad T490-20N3001EGE: Intel Core i5-8250U, 14.00", 1.5 kg
External Review » Lenovo ThinkPad T490-20N3001EGE
Acer TravelMate X5 TMX514-51-7411: Intel Core i7-8565U, 14.00", 1 kg
External Review » Acer TravelMate X5 TMX514-51-7411
Dell XPS 13 7390 Core i7-10710U: Intel Core i7-10710U, 13.30", 1.2 kg
External Review » Dell XPS 13 7390 Core i7-10710U
HP 14-cf1003ns: Intel Core i5-8265U, 14.00", 1.4 kg
External Review » HP 14-cf1003ns
HP 15-DA1057NS: Intel Core i5-8265U, 15.60", 1.8 kg
External Review » HP 15-DA1057NS
HP 15-DA1008NS: Intel Core i5-8265U, 15.60", 1.9 kg
External Review » HP 15-DA1008NS
HP 15-DA1071NS: Intel Core i7-8565U, 15.60", 1.8 kg
External Review » HP 15-DA1071NS
Acer Spin 3 SP314-52-36YC: Intel Core i3-8145U, 14.00", 1.7 kg
External Review » Acer Spin 3 SP314-52-36YC
Acer Aspire 3 A315-53-58FF: Intel Core i5-8250U, 15.60", 2.1 kg
External Review » Acer Aspire 3 A315-53-58FF
Asus ZenBook UX430UA-GV595: Intel Core i7-8550U, 14.00", 1.3 kg
External Review » Asus ZenBook UX430UA-GV595
HP EliteBook x360 1040 G5 5DF84EA: Intel Core i7-8550U, 14.00", 1.4 kg
External Review » HP EliteBook x360 1040 G5 5DF84EA
Acer Aspire 3 A315-53-55FW: Intel Core i5-8250U, 15.60", 2.1 kg
External Review » Acer Aspire 3 A315-53-55FW
Lenovo Ideapad S340-14IWL-81N700HGGE: Intel Core i5-8265U, 14.00", 1.6 kg
External Review » Lenovo Ideapad S340-14IWL-81N700HGGE
Asus ZenBook Duo UX481FA-BM025R: Intel Core i5-10210U, 14.00", 1.5 kg
External Review » Asus ZenBook Duo UX481FA-BM025R
Dell Latitude 14 5400-XCC8G: Intel Core i5-8365U, 14.00", 1.5 kg
External Review » Dell Latitude 14 5400-XCC8G
Asus VivoBook S14 S431FA-EB156T: Intel Core i5-8265U, 14.00", 1.4 kg
External Review » Asus VivoBook S14 S431FA-EB156T
Asus VivoBook S15 S532FA-BN024T: Intel Core i7-8565U, 15.60", 1.8 kg
External Review » Asus VivoBook S15 S532FA-BN024T
Acer Swift 3 SF314-55G-78U1: Intel Core i7-8565U, 14.00", 1.4 kg
External Review » Acer Swift 3 SF314-55G-78U1
Asus VivoBook S15 S530FA-BQ287T: Intel Core i5-8265U, 15.60", 1.8 kg
External Review » Asus VivoBook S15 S530FA-BQ287T
Lenovo Ideapad S145-15IWL-81MV00URLT: Intel Core i3-8145U, 15.60", 1.9 kg
External Review » Lenovo Ideapad S145-15IWL-81MV00URLT
HP Elite Dragonfly-8MK81EA: Intel Core i7-8565U, 13.30", 1 kg
External Review » HP Elite Dragonfly-8MK81EA
HP Envy 13-aq1015TX: Intel Core i5-10210U, 13.30", 1.2 kg
External Review » HP Envy 13-aq1015TX
HP Pavilion 14-ce2002ns: Intel Core i5-8265U, 14.00", 1.6 kg
External Review » HP Pavilion 14-ce2002ns
MSI PS42 Modern 8MO-208XES: Intel Core i5-8265U, 14.00", 1.2 kg
External Review » MSI PS42 Modern 8MO-208XES
Asus ZenBook UX430UA-GV257: Intel Core i5-8250U, 14.00", 1.3 kg
External Review » Asus ZenBook UX430UA-GV257
HP EliteBook 840 G6-6XD76EA: Intel Core i5-8265U, 14.00", 1.5 kg
External Review » HP EliteBook 840 G6-6XD76EA
Medion Akoya S6445-MD61389: Intel Core i5-8265U, 15.60", 1.8 kg
External Review » Medion Akoya S6445-MD61389
Lenovo ThinkPad X1 Yoga 2019-20QGS00A00: Intel Core i7-8565U, 14.00", 1.3 kg
External Review » Lenovo ThinkPad X1 Yoga 2019-20QGS00A00
Lenovo IdeaPad S145-15IWL-81MV00V6SA: Intel Core i3-8145U, 15.60", 1.9 kg
External Review » Lenovo IdeaPad S145-15IWL-81MV00V6SA
Acer Aspire A514-52-516K: Intel Core i5-10210U, 14.00", 1.6 kg
External Review » Acer Aspire A514-52-516K
Asus ZenBook S13 UX392FA-AB021T: Intel Core i7-8565U, 13.90", 1.1 kg
External Review » Asus ZenBook S13 UX392FA-AB021T
HP Spectre x360 15-df1005ng: Intel Core i7-10510U, 15.60", 2.1 kg
External Review » HP Spectre x360 15-df1005ng
Acer Chromebook 715 CB715-1WT-527F: Intel Core i5-8350U, 15.60", 2 kg
External Review » Acer Chromebook 715 CB715-1WT-527F
Lenovo ThinkPad L590-20Q70019GE: Intel Core i5-8265U, 15.60", 2 kg
External Review » Lenovo ThinkPad L590-20Q70019GE
Panasonic Toughpad FZ-55: Intel Core i5-8365U, 15.60", 2.2 kg
External Review » Panasonic Toughpad FZ-55
Lenovo ThinkBook 13s-IWL-20R90072GE: Intel Core i7-8565U, 13.30", 1.3 kg
External Review » Lenovo ThinkBook 13s-IWL-20R90072GE
Asus VivoBook S15 S531FL, i5-8265U: Intel Core i5-8265U, 15.60", 1.8 kg
External Review » Asus VivoBook S15 S531FL, i5-8265U
Lenovo Yoga C740-14IML-81TC002RGE: Intel Core i5-10210U, 14.00", 1.4 kg
External Review » Lenovo Yoga C740-14IML-81TC002RGE
Asus VivoBook S14 S432FA-EB008T: Intel Core i5-8265U, 14.00", 1.4 kg
External Review » Asus VivoBook S14 S432FA-EB008T
Medion Akoya S6445-MD61353: Intel Core i5-8265U, 15.60", 1.8 kg
External Review » Medion Akoya S6445-MD61353
HP 15-DA1009NS: Intel Core i5-8265U, 15.60", 1.8 kg
External Review » HP 15-DA1009NS
Asus ExpertBook P5440FA, i7-8565U: Intel Core i7-8565U, 14.00", 1.2 kg
External Review » Asus ExpertBook P5440FA, i7-8565U
HP Pavilion 14-ce1014tu: Intel Core i3-8145U, 14.00", 1.6 kg
External Review » HP Pavilion 14-ce1014tu
Lenovo ThinkPad X390-20Q1S02M00: Intel Core i5-8265U, 13.30", 1.3 kg
External Review » Lenovo ThinkPad X390-20Q1S02M00
HP EliteBook x360 830 G6-6XE09EA: Intel Core i5-8365U, 13.30", 1.4 kg
External Review » HP EliteBook x360 830 G6-6XE09EA
HP EliteBook 840 G6-7KN32EA: Intel Core i7-8565U, 14.00", 1.5 kg
External Review » HP EliteBook 840 G6-7KN32EA
Dell Latitude 15 5500-RY7PM: Intel Core i5-8265U, 15.60", 1.8 kg
External Review » Dell Latitude 15 5500-RY7PM
Asus ExpertBook P5440FA, i5-8265U: Intel Core i5-8265U, 14.00", 1.2 kg
External Review » Asus ExpertBook P5440FA, i5-8265U
Asus ZenBook Flip 13 UX362FA-EL232T: Intel Core i7-8565U, 13.30", 1.3 kg
External Review » Asus ZenBook Flip 13 UX362FA-EL232T
Acer Chromebook 714 CB714-1WT-32KD: Intel Core i3-8130U, 14.00", 1.6 kg
External Review » Acer Chromebook 714 CB714-1WT-32KD
Panasonic Toughbook FZ-55: Intel Core i5-8365U, 14.00", 2.2 kg
External Review » Panasonic Toughbook FZ-55
Lenovo ThinkPad X1 Carbon G7-20QD003EGE: Intel Core i5-8265U, 14.00", 1.1 kg
External Review » Lenovo ThinkPad X1 Carbon G7-20QD003EGE
Dell Latitude 5300-s014l530013us: Intel Core i7-8665U, 13.30", 1.4 kg
External Review » Dell Latitude 5300-s014l530013us
Dell Inspiron 14 5480-0K0TJ: Intel Core i5-8265U, 14.00", 1.9 kg
External Review » Dell Inspiron 14 5480-0K0TJ
Asus VivoBook 14 X403, i7-8565U: Intel Core i7-8565U, 14.00", 1.3 kg
External Review » Asus VivoBook 14 X403, i7-8565U
Lenovo Yoga C640-13IML-81UE0010GE: Intel Core i7-10510U, 13.30", 1.4 kg
External Review » Lenovo Yoga C640-13IML-81UE0010GE
MSI PS63 Modern 8M-071ES: Intel Core i7-8565U, 15.60", 1.6 kg
External Review » MSI PS63 Modern 8M-071ES
Asus VivoBook S15 S512FA-BR066T: Intel Core i5-8265U, 15.60", 1.6 kg
External Review » Asus VivoBook S15 S512FA-BR066T
Asus VivoBook S14 X412FA-EK314T: Intel Core i5-8265U, 14.00", 1.5 kg
External Review » Asus VivoBook S14 X412FA-EK314T
Microsoft Surface Laptop 2-LQN-00004: Intel Core i5-8250U, 13.50", 1.3 kg
External Review » Microsoft Surface Laptop 2-LQN-00004
HP Pavilion x360 11-ad107tu: Intel Core i3-8130U, 11.60", 1.4 kg
External Review » HP Pavilion x360 11-ad107tu
Asus VivoBook Flip 14 TP412FA-EC924T: Intel Core i3-8145U, 14.00", 1.5 kg
External Review » Asus VivoBook Flip 14 TP412FA-EC924T
Asus VivoBook 14 X403FA: Intel Core i5-8265U, 14.00", 1.3 kg
External Review » Asus VivoBook 14 X403FA
Dell Latitude 5500: Intel Core i7-8665U, 15.60", 1.9 kg
External Review » Dell Latitude 5500
HP Spectre x360 13-ap0000ns: Intel Core i5-8265U, 13.30", 1.4 kg
External Review » HP Spectre x360 13-ap0000ns
Lenovo Yoga C640-13IML-81UE0003GE: Intel Core i5-10210U, 13.30", 1.4 kg
External Review » Lenovo Yoga C640-13IML-81UE0003GE
Asus VivoBook 15 A512FA-BQ113T: Intel Core i3-8145U, 15.60", 1.7 kg
External Review » Asus VivoBook 15 A512FA-BQ113T
HP Envy 13-aq0007nf: Intel Core i5-8265U, 13.30", 1.2 kg
External Review » HP Envy 13-aq0007nf
HP Pavilion 15-cs0814no: Intel Core i5-8250U, 15.60", 1.9 kg
External Review » HP Pavilion 15-cs0814no
HP Envy 13-AQ0007no: Intel Core i7-8565U, 13.30", 1.2 kg
External Review » HP Envy 13-AQ0007no
Asus VivoBook S14 S412FA-EK065T : Intel Core i5-8265U, 14.00", 1.5 kg
External Review » Asus VivoBook S14 S412FA-EK065T
HP Pavilion x360 14-dh0006ns: Intel Core i7-8565U, 14.00", 1.6 kg
External Review » HP Pavilion x360 14-dh0006ns
HP Envy 13-ah1013nw: Intel Core i5-8265U, 13.30", 1.3 kg
External Review » HP Envy 13-ah1013nw
Lenovo Yoga S940-14IWL-496: Intel Core i7-8565U, 14.00", 1.2 kg
External Review » Lenovo Yoga S940-14IWL-496
Dell Latitude 7300-P99G: Intel Core i7-8665U, 13.30", 1.4 kg
External Review » Dell Latitude 7300-P99G
Acer Spin 3 SP314-53N-77AJ: Intel Core i7-8565U, 14.00", 1.7 kg
External Review » Acer Spin 3 SP314-53N-77AJ
Lenovo ThinkPad X1 Carbon 2019-20QE000VGE: Intel Core i7-8665U, 14.00", 1.1 kg
External Review » Lenovo ThinkPad X1 Carbon 2019-20QE000VGE
Fujitsu Lifebook U939X, i7-8665U: Intel Core i7-8665U, 13.30", 1 kg
External Review » Fujitsu Lifebook U939X, i7-8665U
HP Chromebook 15-de0035cl: Intel Core i3-8130U, 15.60", 1.8 kg
External Review » HP Chromebook 15-de0035cl
Lenovo ThinkPad X1 Yoga G4-20QF0024GE: Intel Core i7-8565U, 14.00", 1.4 kg
External Review » Lenovo ThinkPad X1 Yoga G4-20QF0024GE
Acer Aspire 3 A315-53-589C: Intel Core i5-8250U, 15.60", 2.4 kg
External Review » Acer Aspire 3 A315-53-589C
HP Envy 13-aq0002ng: Intel Core i7-8565U, 13.30", 1.2 kg
External Review » HP Envy 13-aq0002ng
Dell Inspiron 13 5370-75K6D: Intel Core i3-8130U, 13.30", 1.4 kg
External Review » Dell Inspiron 13 5370-75K6D
Lenovo Ideapad S340-15IWL-81N800P0GE: Intel Core i3-8145U, 15.60", 1.8 kg
External Review » Lenovo Ideapad S340-15IWL-81N800P0GE
Lenovo Ideapad 330-15IKBR-81DE02RCSP: Intel Core i5-8250U, 15.60", 2.2 kg
External Review » Lenovo Ideapad 330-15IKBR-81DE02RCSP
HP Envy 13-aq0004ns: Intel Core i7-8565U, 13.30", 1.2 kg
External Review » HP Envy 13-aq0004ns
Acer Swift 3 SF314-56-574K: Intel Core i5-8265U, 14.00", 1.5 kg
External Review » Acer Swift 3 SF314-56-574K
HP 15-da1614nd: Intel Core i5-8265U, 15.60", 1.8 kg
External Review » HP 15-da1614nd
Acer TravelMate P6 TMP614-51T-737H: Intel Core i7-8565U, 14.00", 1.2 kg
External Review » Acer TravelMate P6 TMP614-51T-737H
Lenovo ThinkBook 13s-IWL-20R9005LUS: Intel Core i5-8265U, 13.30", 1.3 kg
External Review » Lenovo ThinkBook 13s-IWL-20R9005LUS
Dell Latitude 7200 2-in-1 (i7-8365U): Intel Core i5-8365U, 12.30", 0.9 kg
External Review » Dell Latitude 7200 2-in-1 (i7-8365U)
Dell Latitude 7200 2-in-1 (i7-8665U): Intel Core i7-8665U, 12.30", 0.9 kg
External Review » Dell Latitude 7200 2-in-1 (i7-8665U)
Acer Aspire 5 A515-54-30BQ: Intel Core i3-8145U, 15.60", 1.8 kg
External Review » Acer Aspire 5 A515-54-30BQ
Dell Latitude 13 5300 2-in-1: Intel Core i5-8365U, 13.30", 1.4 kg
External Review » Dell Latitude 13 5300 2-in-1
Dell Inspiron 7390 2-in-1: Intel Core i7-8565U, 13.30", 1.4 kg
External Review » Dell Inspiron 7390 2-in-1
Acer TravelMate P6 TMP614-51T-54UV: Intel Core i5-8265U, 14.00", 1.2 kg
External Review » Acer TravelMate P6 TMP614-51T-54UV
Asus VivoBook 15 R564U-EJ122T: Intel Core i5-8250U, 15.60", 1.7 kg
External Review » Asus VivoBook 15 R564U-EJ122T
Asus Zenbook S13 UX392FA-AB017T : Intel Core i5-8265U, 13.90", 1.1 kg
External Review » Asus Zenbook S13 UX392FA-AB017T
Acer Spin 5 SP513-53N-550T: Intel Core i5-8265U, 13.30", 1.5 kg
External Review » Acer Spin 5 SP513-53N-550T
HP Elite x2 1013 G3-6BB82UT: Intel Core i7-8650U, 13.00", 1.2 kg
External Review » HP Elite x2 1013 G3-6BB82UT
Dell Latitude 13 3300-DN86T: Intel Core i5-8250U, 13.30", 1.6 kg
External Review » Dell Latitude 13 3300-DN86T
Dell Latitude 14 5400-NJVXR: Intel Core i5-8265U, 14.00", 1.5 kg
External Review » Dell Latitude 14 5400-NJVXR
Dell Latitude 7400-FM7VX: Intel Core i5-8265U, 14.00", 1.4 kg
External Review » Dell Latitude 7400-FM7VX
VAIO SX12-VJS121X0211A: Intel Core i7-8565U, 12.50", 0.9 kg
External Review » VAIO SX12-VJS121X0211A
Lenovo ThinkPad L390-20NR0013GE: Intel Core i5-8265U, 13.30", 1.5 kg
External Review » Lenovo ThinkPad L390-20NR0013GE
Lenovo Yoga Chromebook C630-81JX0004US: Intel Core i3-8130U, 15.60", 2.1 kg
External Review » Lenovo Yoga Chromebook C630-81JX0004US
Asus VivoBook 14 X412FJ-EK215T: Intel Core i3-8145U, 14.00", 1.5 kg
External Review » Asus VivoBook 14 X412FJ-EK215T
Fujitsu Lifebook U939X, i5-8365U: Intel Core i5-8365U, 13.30", 1 kg
External Review » Fujitsu Lifebook U939X, i5-8365U
Acer Aspire 5 A515-52-35TB: Intel Core i3-8145U, 15.60", 1.8 kg
External Review » Acer Aspire 5 A515-52-35TB
HP 14-df0023cl: Intel Core i3-8130U, 14.00", 1.4 kg
External Review » HP 14-df0023cl
Acer Aspire 5 A515-54-51DJ: Intel Core i5-8265U, 15.60", 1.8 kg
External Review » Acer Aspire 5 A515-54-51DJ
HP Chromebook x360 14 G1-6BV87UA: Intel Core i7-8650U, 14.00", 1.6 kg
External Review » HP Chromebook x360 14 G1-6BV87UA
Lenovo ThinkPad T590-20N4000DPB: Intel Core i7-8565U, 15.60", 1.8 kg
External Review » Lenovo ThinkPad T590-20N4000DPB
Lenovo Ideapad C340-15IWL-81N5000WGE: Intel Core i5-8265U, 15.60", 2.2 kg
External Review » Lenovo Ideapad C340-15IWL-81N5000WGE
HP Pavilion x360 14-dh0220ng: Intel Core i5-8265U, 14.00", 1.6 kg
External Review » HP Pavilion x360 14-dh0220ng
Lenovo ThinkPad T490s-20NX000APB: Intel Core i5-8265U, 14.00", 1.4 kg
External Review » Lenovo ThinkPad T490s-20NX000APB
HP Pavilion 15-cs2010tx: Intel Core i5-8265U, 15.60", 1.9 kg
External Review » HP Pavilion 15-cs2010tx
Dell Latitude 7400-2RH81 2-in-1: Intel Core i5-8365U, 14.00", 1.4 kg
External Review » Dell Latitude 7400-2RH81 2-in-1
Dell Latitude 3400: Intel Core i3-8145U, 14.00", 1.7 kg
External Review » Dell Latitude 14 3400-5157
Dell Inspiron 13 7386-3MVN4: Intel Core i7-8565U, 13.30", 1.5 kg
External Review » Dell Inspiron 13 7386-3MVN4
Dell XPS 13 9380-9NDKJ: Intel Core i3-8145U, 13.30", 1.3 kg
External Review » Dell XPS 13 9380-9NDKJ
Asus VivoBook 14 X403FA, i3-8145U: Intel Core i3-8145U, 14.00", 1.3 kg
External Review » Asus VivoBook X403FA, i3-8145U
Asus VivoBook 14 X412FA-EK295T: Intel Core i5-8265U, 14.00", 1.5 kg
External Review » Asus VivoBook 14 X412FA-EK295T
LG Gram 13Z990-G: Intel Core i5-8265U, 13.30", 1 kg
External Review » LG Gram 13Z990-G
Lenovo Ideapad 330-15IKBR-81DE01P2SP: Intel Core i7-8550U, 15.60", 2.2 kg
External Review » Lenovo Ideapad 330-15IKBR-81DE01P2SP
HP Spectre x360 13-ap0018nf: Intel Core i7-8565U, 13.30", 1.4 kg
External Review » HP Spectre x360 13-ap0018nf
Fujitsu Lifebook U939: Intel Core i7-8665U, 13.30", 0.9 kg
External Review » Fujitsu Lifebook U939
Asus Vivobook S14 S412DA-EK025T: Intel Core i5-8265U, 14.00", 1.4 kg
External Review » Asus Vivobook S14 S412DA-EK025T
HP Pavilion 14-ce1001ng: Intel Core i3-8145U, 14.00", 1.6 kg
External Review » HP Pavilion 14-ce1001ng
Acer Aspire 3 A315-54-56KY: Intel Core i5-8265U, 15.60", 1.9 kg
External Review » Acer Aspire 3 A315-54-56KY
HP 348 G5: Intel Core i5-8250U, 14.00", 1.5 kg
External Review » HP 348 G5
Lenovo ThinkBook 13s-20R90071GE: Intel Core i5-8265U, 13.30", 1.3 kg
External Review » Lenovo ThinkBook 13s-20R90071GE
Lenovo Flex 14IWL: Intel Core i5-8265U, 14.00", 1.7 kg
External Review » Lenovo Flex 14IWL
LG Gram 15Z990-V.AA52B: Intel Core i5-8265U, 15.60", 1.1 kg
External Review » LG Gram 15Z990-V.AA52B
Acer Aspire 3 A315-53-58EJ: Intel Core i5-8250U, 15.60", 2.1 kg
External Review » Acer Aspire 3 A315-53-58EJ
Lenovo Ideapad S145-15IWL-81MV005NSP: Intel Core i3-8145U, 15.60", 1.9 kg
External Review » Lenovo Ideapad S145-15IWL-81MV005NSP
Lenovo Ideapad 330-15IKBR-81DE01D5SP: Intel Core i5-8250U, 15.60", 2.2 kg
External Review » Lenovo Ideapad 330-15IKBR-81DE01D5SP
Lenovo Ideapad S145-15IWL-81MV00B6GE: Intel Core i3-8145U, 15.60", 1.9 kg
External Review » Lenovo Ideapad S145-15IWL-81MV00B6GE
MSI PS42 Modern 8MO-023ES: Intel Core i7-8565U, 14.00", 1.2 kg
External Review » MSI PS42 Modern 8MO-023ES
HP Pavilion x360 14-dh0103tu: Intel Core i3-8145U, 14.00", 1.6 kg
External Review » HP Pavilion x360 14-dh0103tu
Asus Vivobook 14 X409F-EK138T: Intel Core i5-8265U, 14.00", 1.6 kg
External Review » Asus X409F-EK138T
MSI PS42 Modern 8MO: Intel Core i5-8265U, 14.00", 1.2 kg
External Review » MSI PS42 Modern 8MO
Asus Vivobook 15 X509FA-EJ239T: Intel Core i5-8265U, 15.60", 1.9 kg
External Review » Asus Vivobook X509FA-EJ239T
Asus VivoBook 14 A412FA: Intel Core i3-8145U, 14.00", 1.5 kg
External Review » Asus VivoBook 14 A412FA
Dell Inspiron 14 3480: Intel Core i5-8265U, 14.00", 1.7 kg
External Review » Dell Inspiron 14 3480
Dell Inspiron 14 N3476: Intel Core i5-8250U, 14.00", 2 kg
External Review » Dell Inspiron 14 N3476
Dell Vostro 15 5581-F6VF1: Intel Core i5-8265U, 15.60", 1.9 kg
External Review » Dell Vostro 15 5581-F6VF1
HP Envy 13-aq0001ng: Intel Core i5-8265U, 13.30", 1.2 kg
External Review » HP Envy 13-aq0001ng
Asus Vivobook S14 S430FA-EB069T: Intel Core i3-8145U, 14.00", 1.4 kg
External Review » Asus Vivobook S14 S430FA-EB069T
HP Envy 13-ah1001ng: Intel Core i5-8265U, 13.30", 1.3 kg
External Review » HP Envy 13-ah1001ng
Dell Vostro 15 3580: Intel Core i7-8565U, 15.60", 2.2 kg
External Review » Dell Vostro 15 3580
Lenovo ThinkPad Yoga X390-20NN0026GE: Intel Core i5-8265U, 13.30", 1.3 kg
External Review » Lenovo ThinkPad Yoga X390-20NN0026GE
Dell Latitude 7400-8N6DH: Intel Core i7-8665U, 14.00", 1.5 kg
External Review » Dell Latitude 7400-8N6DH
HP Spectre x360 13-ap0101tu: Intel Core i7-8565U, 13.30", 1.3 kg
External Review » HP Spectre x360 13-ap0101tu
Lenovo ThinkPad E490-20N8000RGE: Intel Core i5-8265U, 14.00", 1.8 kg
External Review » Lenovo ThinkPad E490-20N8000RGE
Lenovo Ideapad 530s-14IKBR-81EU00N7SP: Intel Core i5-8250U, 14.00", 1.6 kg
External Review » Lenovo Ideapad 530s-14IKBR-81EU00N7SP
Acer Spin 3 SP314-51-548L: Intel Core i5-8250U, 14.00", 1.7 kg
External Review » Acer Spin 3 SP314-51-548L
Asus ZenBook 13 UX333FA-A3070T: Intel Core i5-8265U, 13.30", 1.1 kg
External Review » Asus ZenBook 13 UX333FA-A3070T
Medion Ultrafino S6445-MD61351: Intel Core i3-8145U, 15.60", 1.7 kg
External Review » Medion Ultrafino S6445-MD61351
HP EliteBook x360 1040 G5-5SR13EAABD: Intel Core i7-8550U, 14.00", 1.4 kg
External Review » HP EliteBook x360 1040 G5-5SR13EAABD
Lenovo ThinkPad T490s-20NX000EMC: Intel Core i7-8565U, 14.00", 1.4 kg
External Review » Lenovo ThinkPad T490s-20NX000EMC
Toshiba Portege X30T-E-109: Intel Core i7-8550U, 13.30", 1.4 kg
External Review » Toshiba Portege X30T-E-109
Dell Latitude 7400 2-in-1: Intel Core i7-8665U, 14.00", 1.5 kg
External Review » Dell Latitude 7400 2-in-1
Lenovo IdeaPad S940-14IWL: Intel Core i7-8565U, 14.00", 1.2 kg
External Review » Lenovo IdeaPad S940-14IWL
Asus VivoBook S14 F403FA-EB114T: Intel Core i7-8565U, 14.00", 1.3 kg
External Review » Asus VivoBook S14 F403FA-EB114T
Lenovo ThinkPad X390-20Q0003VGE: Intel Core i7-8565U, 13.30", 1.3 kg
External Review » Lenovo ThinkPad X390-20Q0003VGE
Lenovo ThinkPad T490-20N2004AGE: Intel Core i7-8565U, 14.00", 1.5 kg
External Review » Lenovo ThinkPad T490-20N2004AGE
Lenovo ThinkPad T490-20N20049GE: Intel Core i7-8565U, 14.00", 1.5 kg
External Review » Lenovo ThinkPad T490-20N20049GE
HP Envy x360 15m-dr0012dx: Intel Core i7-8565U, 15.60", 2.1 kg
External Review » HP Envy x360 15m-dr0012dx
Asus VivoBook 14 K403FA: Intel Core i5-8265U, 14.00", 1.3 kg
External Review » Asus VivoBook K403FA
Lenovo Ideapad C340-14IWL-81N4001MGE: Intel Core i5-8265U, 14.00", 1.7 kg
External Review » Lenovo Ideapad C340-14IWL-81N4001MGE
HP Pavilion 14-ce1003ng: Intel Core i5-8265U, 14.00", 1.6 kg
External Review » HP Pavilion 14-ce1003ng
Acer Swift 3 SF314-56-544M: Intel Core i5-8265U, 14.00", 1.6 kg
External Review » Acer Swift 3 SF314-56-544M
Toshiba Portege Z30-E-12L: Intel Core i7-8550U, 13.30", 1.2 kg
External Review » Toshiba Portege Z30-E-12L
Medion Akoya S6445-30025468: Intel Core i5-8265U, 15.60", 1.8 kg
External Review » Medion Akoya S6445-30025468
Asus VivoBook S14 S430FA-EB061: Intel Core i5-8265U, 14.00", 1.4 kg
External Review » Asus VivoBook S14 S430FA-EB061
Lenovo Ideapad S145-14IWL-81MU0089GE: Intel Core i3-8145U, 14.00", 1.6 kg
External Review » Lenovo Ideapad S145-14IWL-81MU0089GE
Asus Zenbook UX433FA-A6113T: Intel Core i5-8265U, 14.00", 1.2 kg
External Review » Asus Zenbook UX433FA-A6113T
Asus Zenbook UX333FA-A4011T: Intel Core i5-8265U, 13.30", 1.2 kg
External Review » Asus Zenbook UX333FA-A4011T
Asus Zenbook Flip 13 UX362FA-EL099T: Intel Core i5-8265U, 13.30", 1.3 kg
External Review » Asus Zenbook Flip 13 UX362FA-EL099T
HP Chromebook x360 14 G1: Intel Core i5-8350U, 14.00", 1.6 kg
External Review » HP Chromebook x360 14 G1
Acer Swift 3 SF313-51-873X: Intel Core i7-8550U, 13.30", 1.2 kg
External Review » Acer Swift 3 SF313-51-873X
Asus VivoBook Flip 14 TP410UA-EC479T: Intel Core i5-8250U, 14.00", 1.6 kg
External Review » Asus VivoBook Flip 14 TP410UA-EC479T
Lenovo Yoga 730-13IWL-81JR006AMH: Intel Core i5-8265U, 13.30", 1.2 kg
External Review » Lenovo Yoga 730-13IWL-81JR006AMH
Acer TravelMate X3 TMX3410-M-54G3: Intel Core i5-8250U, 14.00", 1.6 kg
External Review » Acer TravelMate X3 TMX3410-M-54G3
Toshiba Tecra X40-E-10W: Intel Core i5-8250U, 14.00", 1.3 kg
External Review » Toshiba Tecra X40-E-10W
Huawei MateBook D 14 W50F: Intel Core i5-8250U, 14.00", 1.5 kg
External Review » Huawei MateBook D 14 W50F
Lenovo ThinkPad X390 Yoga-20NQS05R00: Intel Core i7-8565U, 13.30", 1.3 kg
External Review » Lenovo ThinkPad X390 Yoga-20NQS05R00
VAIO SX14: Intel Core i5-8265U, 14.00", 1 kg
External Review » VAIO SX14
LG Gram 17Z990-R.AAS7U1: Intel Core i7-8565U, 17.00", 1.3 kg
External Review » LG Gram 17Z990-R.AAS7U1
Asus VivoBook S13 S330UA-EY637T: Intel Core i5-8250U, 13.30", 1.2 kg
External Review » Asus VivoBook S13 S330UA-EY637T
Medion Akoya S6445-30025466: Intel Core i7-8565U, 15.60", 1.8 kg
External Review » Medion Akoya S6445-30025466
Acer Aspire 5 A515-52-78YZ: Intel Core i7-8565U, 15.60", 1.8 kg
External Review » Acer Aspire 5 A515-52-78YZ
Dell Vostro 14 5481: Intel Core i5-8265U, 14.00", 1.6 kg
External Review » Dell Vostro 14 5481
HP Spectre 13-af000nw: Intel Core i5-8250U, 13.30", 1.1 kg
External Review » HP Spectre 13-af000nw
Asus ZenBook 14 RX433FA-A5157R: Intel Core i5-8265U, 14.00", 1.1 kg
External Review » Asus ZenBook 14 RX433FA-A5157R
HP Pavilion x360 14-CD006NW: Intel Core i5-8250U, 14.00", 1.6 kg
External Review » HP Pavilion x360 14-CD006NW
Acer TravelMate X5 TMX514-51T-703H: Intel Core i7-8565U, 14.00", 1 kg
External Review » Acer TravelMate X5 TMX514-51T-703H
HP Spectre x360 13-ap0000nt: Intel Core i5-8265U, 13.30", 1.4 kg
External Review » HP Spectre x360 13-ap0000nt
Asus VivoBook 15 X512FA-BQ064T: Intel Core i5-8265U, 15.60", 1.7 kg
External Review » Asus VivoBook 15 X512FA-BQ064T
Acer Swift 3 SF314-56-347L: Intel Core i3-8145U, 14.00", 4.6 kg
External Review » Acer Swift 3 SF314-56-347L
HP 250 G7-6HM83ESABD: Intel Core i5-8265U, 15.60", 1.8 kg
External Review » HP 250 G7-6HM83ESABD
Asus VivoBook S14 S430FA-EB145T: Intel Core i3-8145U, 14.00", 1.4 kg
External Review » Asus VivoBook S14 S430FA-EB145T
Asus Pro B9440FA-GV0004R: Intel Core i7-8565U, 14.00", 1.1 kg
External Review » Asus Pro B9440FA-GV0004R
Huawei Matebook D 15-53010FDQ: Intel Core i5-8250U, 15.60", 1.9 kg
External Review » Huawei Matebook D 15-53010FDQ
HP ProBook 430 G6-5TL26EAABD: Intel Core i5-8265U, 13.30", 1.5 kg
External Review » HP ProBook 430 G6-5TL26EAABD
Acer Chromebook Spin 13 CP713-1WN-52TK: Intel Core i5-8250U, 13.50", 1.5 kg
External Review » Acer Chromebook Spin 13 CP713-1WN-52TK
Lenovo Ideapad 330-15IKBR-81DE019TPB: Intel Core i5-8250U, 15.60", 2.2 kg
External Review » Lenovo Ideapad 330-15IKBR-81DE019TPB
Dell XPS 13 9380 2019: Intel Core i5-8265U, 13.30", 1.2 kg
External Review » Dell XPS 13 9380 2019
Medion Akoya S4401-MD61268: Intel Core i5-8250U, 14.00", 1.8 kg
External Review » Medion Akoya S4401-MD61268
Medion Akoya S6445-30025467: Intel Core i3-8145U, 15.60", 1.8 kg
External Review » Medion Akoya S6445-30025467
Medion Akoya S6445-30025464: Intel Core i3-8145U, 15.60", 1.8 kg
External Review » Medion Akoya S6445-30025464
Asus ZenBook 14 UX433FA-A5090T: Intel Core i5-8265U, 14.00", 1.1 kg
External Review » Asus ZenBook 14 UX433FA-A5090T
Asus VivoBook S13 S330UA-EY034T: Intel Core i7-8550U, 13.30", 1.2 kg
External Review » Asus VivoBook S13 S330UA-EY034T
Acer Spin 3 SP314-51-532E: Intel Core i5-8250U, 14.00", 1.7 kg
External Review » Acer Spin 3 SP314-51-532E
HP ProBook 450 G6-6HM61ES: Intel Core i5-8265U, 15.60", 2 kg
External Review » HP ProBook 450 G6-6HM61ES
Trekstor Vaio SX14-VJS141C11L: Intel Core i7-8565U, 14.00", 1 kg
External Review » Trekstor Vaio SX14-VJS141C11L
Asus VivoBook S13 S330FA-EY044T: Intel Core i3-8145U, 13.30", 1.2 kg
External Review » Asus VivoBook S13 S330FA-EY044T
Acer Aspire 5 A515-51-52L5: Intel Core i5-8250U, 15.60", 2.2 kg
External Review » Acer Aspire 5 A515-51-52L5
Acer Aspire 3 A315-53-317G: Intel Core i3-8130U, 15.60", 2.1 kg
External Review » Acer Aspire 3 A315-53-317G
Lenovo ThinkPad L390 Yoga-20NT000XGE: Intel Core i5-8265U, 13.30", 1.5 kg
External Review » Lenovo ThinkPad L390 Yoga-20NT000XGE
Acer Swift 5 SF515-51T-75A1: Intel Core i7-8565U, 15.60", 1 kg
External Review » Acer Swift 5 SF515-51T-75A1
Lenovo Yoga Chromebook C630 81JX0005MX: Intel Core i5-8250U, 15.60", 1.9 kg
External Review » Lenovo Yoga Chromebook C630 81JX0005MX
Acer TravelMate X5 TMX514-51-511Q: Intel Core i5-8265U, 14.00", 1 kg
External Review » Acer TravelMate X5 TMX514-51-511Q
HP Spectre x360 13-ap0180nd: Intel Core i5-8265U, 13.30", 1.3 kg
External Review » HP Spectre x360 13-ap0180nd
HP 15-da1015ns: Intel Core i5-8265U, 15.60", 1.8 kg
External Review » HP 15-da1015ns
Lenovo Yoga 730-15IKB-81CU0056PB: Intel Core i7-8550U, 15.60", 1.9 kg
External Review » Lenovo Yoga 730-15IKB-81CU0056PB
Acer Swift 5 SF515-51T-73HQ: Intel Core i7-8565U, 15.60", 1 kg
External Review » Acer Swift 5 SF515-51T-73HQ
MSI PS63 Modern 8M-080CZ: Intel Core i7-8565U, 15.60", 1.6 kg
External Review » MSI PS63 Modern 8M-080CZ
Asus ZenBook 13 UX333FA-A3076T: Intel Core i7-8565U, 13.30", 1.1 kg
External Review » Asus ZenBook 13 UX333FA-A3076T
HP Pavilion x360 14-cd1042tx: Intel Core i7-8565U, 14.00", 1.6 kg
External Review » HP Pavilion x360 14-cd1042tx
Acer Swift 5 SF515-51T-507P: Intel Core i5-8265U, 15.60", 1 kg
External Review » Acer Swift 5 SF515-51T-507P
HP ProBook 440 G6-5TK03EA: Intel Core i5-8265U, 14.00", 1.6 kg
External Review » HP ProBook 440 G6-5TK03EA
Microsoft Surface Pro 6, Core i5, 256 GB: Intel Core i5-8250U, 12.30", 0.8 kg
External Review » Microsoft Surface Pro 6, Core i5, 256 GB
Acer Swift 5 SF514-53T-75UE: Intel Core i7-8565U, 14.00", 1 kg
External Review » Acer Swift 5 SF514-53T-75UE
Acer Swift 5 SF514-53T-573Y: Intel Core i5-8265U, 14.00", 1 kg
External Review » Acer Swift 5 SF514-53T-573Y
Acer Spin 3 SP314-52-31FP: Intel Core i3-8145U, 14.00", 1.7 kg
External Review » Acer Spin 3 SP314-52-31FP
Acer Swift 5 SF515-51T-58UX: Intel Core i5-8265U, 15.60", 1 kg
External Review » Acer Swift 5 SF515-51T-58UX
Asus Zenbook Flip 15 UX562FD 90NB0JS1-M01230: Intel Core i5-8265U, 15.60", 1.9 kg
External Review » Asus Zenbook Flip 15 UX562FD 90NB0JS1-M01230
HP 17-by1001ng: Intel Core i5-8250U, 17.30", 2.5 kg
External Review » HP 17-by1001ng
Lenovo Ideapad 720S-13IKBR-81BV0098SP: Intel Core i5-8250U, 13.30", 1.5 kg
External Review » Lenovo Ideapad 720S-13IKBR-81BV0098SP
HP Envy 13-ah0005ns: Intel Core i7-8550U, 13.30", 1.3 kg
External Review » HP Envy 13-ah0005ns
HP EliteBook x360 1030 G3 4LT83AW: Intel Core i5-8350U, 13.30", 1.3 kg
External Review » HP EliteBook x360 1030 G3 4LT83AW
HP Chromebook x360 14-da0300nd: Intel Core i3-8130U, 14.00", 1.7 kg
External Review » HP Chromebook x360 14-da0300nd
Acer Aspire 5 A515-52-5981: Intel Core i5-8265U, 15.60", 1.9 kg
External Review » Acer Aspire 5 A515-52-5981
HP Elitebook x360 1040 G5: Intel Core i7-8650U, 14.00", 1.4 kg
External Review » HP Elitebook x360 1040 G5
HP Spectre x360 13-ap0003ns: Intel Core i7-8565U, 13.30", 1.3 kg
External Review » HP Spectre x360 13-ap0003ns
Asus VivoBook S14 S430FN-EB136T: Intel Core i5-8265U, 14.00", 1.4 kg
External Review » Asus VivoBook S14 S430FN-EB136T
HP 15-da0039ns: Intel Core i5-8250U, 15.60", 2.1 kg
External Review » HP 15-da0039ns
Lenovo Yoga 530-14IKB-81EK00SNMX: Intel Core i5-8250U, 14.00", 1.7 kg
External Review » Lenovo Yoga 530-14IKB-81EK00SNMX
Acer Swift 5 SF515-51T-552D: Intel Core i5-8265U, 15.60", 1 kg
External Review » Acer Swift 5 SF515-51T-552D
Acer TravelMate X3 TMX3410-M-50QD: Intel Core i5-8250U, 14.00", 1.6 kg
External Review » Acer TravelMate X3 TMX3410-M-50QD
Acer Chromebook Spin 13 CP713-1WN-5979: Intel Core i5-8250U, 13.50", 1.6 kg
External Review » Acer Chromebook Spin 13 CP713-1WN-5979
Acer Chromebook Spin 13 CP713-1WN-39C5: Intel Core i3-8130U, 13.50", 1.5 kg
External Review » Acer Chromebook Spin 13 CP713-1WN-39C5
Huawei Matebook 13-53010FYW: Intel Core i7-8565U, 13.00", 1.3 kg
External Review » Huawei Matebook 13-53010FYW
Huawei MateBook 13-53010HBV: Intel Core i5-8265U, 13.00", 1.3 kg
External Review » Huawei MateBook 13-53010HBV
Lenovo IdeaPad Flex 5 15-1570-81CA001QUS: Intel Core i7-8550U, 15.60", 2 kg
External Review » Lenovo Flex 5 15-1570-81CA001QUS
Lenovo Ideapad 330S-15IKB-81F5010MIN: Intel Core i3-8130U, 15.60", 1.9 kg
External Review » Lenovo Ideapad 330S-15IKB-81F5010MIN
Lenovo Yoga Chromebook C630-81JX0008UX: Intel Core i5-8250U, 15.60", 2 kg
External Review » Lenovo Yoga Chromebook C630-81JX0008UX
Lenovo IdeaPad 730S-13IWL 81JB0004US: Intel Core i5-8265U, 13.30", 1.1 kg
External Review » Lenovo IdeaPad 730S-13IWL 81JB0004US
HP 15q-ds1000TU: Intel Core i5-8250U, 15.60", 2 kg
External Review » HP 15q-ds1000TU
Dell Inspiron 7486 Chromebook 14 2-in-1: Intel Core i3-8130U, 14.00", 1.8 kg
External Review » Dell Inspiron 7486 Chromebook 14 2-in-1
Fujitsu Lifebook E558-E5580MP580DE: Intel Core i5-8250U, 15.60", 2 kg
External Review » Fujitsu Lifebook E558-E5580MP580DE
HP Spectre x360 13-ap0900nz: Intel Core i7-8565U, 13.30", 1.3 kg
External Review » HP Spectre x360 13-ap0900nz
HP Spectre x360 13-ap0104ng: Intel Core i5-8265U, 13.30", 1.3 kg
External Review » HP Spectre x360 13-ap0104ng
Acer Swift 3 SF314-55-31N8: Intel Core i3-8145U, 14.00", 1.5 kg
External Review » Acer Swift 3 SF314-55-31N8
Lenovo IdeaPad 330S-15IKB-81F500N5GE: Intel Core i5-8250U, 15.60", 1.9 kg
External Review » Lenovo IdeaPad 330S-15IKB-81F500N5GE
Acer TravelMate X3 TMX3410-M-50NL: Intel Core i5-8250U, 14.00", 1.6 kg
External Review » Acer TravelMate X3 TMX3410-M-50NL
HP EliteBook x360 1030 G3-4QY22EA: Intel Core i7-8550U, 13.30", 1.3 kg
External Review » HP EliteBook x360 1030 G3-4QY22EA
Lenovo Yoga C730-15: Intel Core i5-8265U, 15.60", 1.9 kg
External Review » Lenovo Yoga C730-15
Lenovo ThinkPad X1 Carbon G7: Intel Core i7-8565U, 14.00", 1.1 kg
External Review » Lenovo ThinkPad X1 Carbon G7
Lenovo ThinkPad X1 Yoga 2019: Intel Core i5-8265U, 14.00", 1.4 kg
External Review » Lenovo ThinkPad X1 Yoga 2019
Lenovo Yoga S940-14IWL: Intel Core i7-8565U, 13.90", 1.2 kg
External Review » Lenovo Yoga S940-14IWL
Acer Swift 5 SF515-51T-7828: Intel Core i7-8565U, 15.60", 1 kg
External Review » Acer Swift 5 SF515-51T-7828
Samsung Notebook 9 Pro 13 inch 2019: Intel Core i7-8565U, 13.30", 1.3 kg
External Review » Samsung Notebook 9 Pro 13 inch 2019
Acer Aspire A515-53-330E: Intel Core i3-8145U, 15.60", 2 kg
External Review » Acer Aspire A515-53-330E
Acer Aspire A515-53-50ZD: Intel Core i5-8265U, 15.60", 2 kg
External Review » Acer Aspire A515-53-50ZD
HP Pavilion 14-ce0004nm: Intel Core i3-8130U, 14.00", 1.7 kg
External Review » HP Pavilion 14-ce0004nm
Asus Zenbook 14 UX433FA-A6018T: Intel Core i5-8265U, 14.00", 1.2 kg
External Review » Asus Zenbook 14 UX433FA-A6018T
Asus Vivobook X407UA-BV489T: Intel Core i5-8250U, 14.00", 1.5 kg
External Review » Asus Vivobook X407UA-BV489T
LG Gram 14 14T990-U.AAS8U1, 2-in-1: Intel Core i7-8565U, 14.00", 1.2 kg
External Review » LG Gram 14 14T990-U.AAS8U1, 2-in-1
Dell XPS 13 9370-1CNW5: Intel Core i7-8550U, 13.30", 1.3 kg
External Review » Dell XPS 13 9370-1CNW5
Dell Inspiron 15 3576-3504BLK: Intel Core i3-8130U, 15.60", 2.3 kg
External Review » Dell Inspiron 15 3576-3504BLK
Acer Chromebook 13 CB713-1W-56VY: Intel Core i5-8250U, 13.50", 1.6 kg
External Review » Acer Chromebook 13 CB713-1W-56VY
Lenovo Yoga 730-15IWL-81JS000EGE: Intel Core i5-8265U, 15.60", 1.9 kg
External Review » Lenovo Yoga 730-15IWL-81JS000EGE
Asus ZenBook S UX391UA-EG007R: Intel Core i7-8550U, 13.30", 1 kg
External Review » Asus ZenBook S UX391UA-EG007R
Lenovo ThinkPad X1 Carbon G6-20KH003BMD: Intel Core i7-8550U, 14.00", 1.1 kg
External Review » Lenovo ThinkPad X1 Carbon G6-20KH003BMD
Lenovo ThinkPad X1 Yoga-20LD002MMD: Intel Core i7-8550U, 14.00", 1.4 kg
External Review » Lenovo ThinkPad X1 Yoga-20LD002MMD
Asus ZenBook 14 UX433FA-A60225T: Intel Core i5-8265U, 14.00", 1.2 kg
External Review » Asus ZenBook 14 UX433FA-A60225T
Lenovo Yoga 730-13IKB-81CT0075SP: Intel Core i7-8550U, 13.30", 1.2 kg
External Review » Lenovo Yoga 730-13IKB-81CT0075SP
HP Pavilion 13-an0001ns: Intel Core i7-8565U, 13.30", 1.3 kg
External Review » HP Pavilion 13-an0001ns
Acer Swift 5 SF515-51T-52YA: Intel Core i5-8265U, 15.60", 1 kg
External Review » Acer Swift 5 SF515-51T-52YA
Asus VivoBook S14 S430UA-EB065T: Intel Core i5-8250U, 14.00", 1.4 kg
External Review » Asus VivoBook S14 S430UA-EB065T
Lenovo Ideapad 530s-14IKBR-81EU00C5SP: Intel Core i7-8550U, 14.00", 1.6 kg
External Review » Lenovo Ideapad 530s-14IKBR-81EU00C5SP
Lenovo Yoga C930-13IKB-81C4004AMX: Intel Core i5-8250U, 13.90", 1.4 kg
External Review » Lenovo Yoga C930-13IKB-81C4004AMX
Dell XPS 13 9380 i7 4K: Intel Core i7-8565U, 13.30", 1.2 kg
External Review » Dell XPS 13 9380 i7 4K
Acer Chromebook 13 CB713-1W-50YY: Intel Core i5-8250U, 13.50", 1.6 kg
External Review » Acer Chromebook 13 CB713-1W-50YY
Lenovo Yoga C930-13IKB-81C4008TPB : Intel Core i7-8550U, 13.90", 1.4 kg
External Review » Lenovo Yoga C930-13IKB-81C4008TPB
Dell Inspiron 13 5370 CN537008: Intel Core i5-8250U, 13.30", 1.4 kg
External Review » Dell Inspiron 13 5370 CN537008
HP Envy 13-ah0007ns: Intel Core i7-8550U, 13.30", 1.3 kg
External Review » HP Envy 13-ah0007ns
Lenovo Ideapad 330S-15IKBR-81F500V5SP: Intel Core i5-8250U, 15.60", 1.9 kg
External Review » Lenovo Ideapad 330S-15IKBR-81F500V5SP
Acer Swift 3 SF313-51-59SZ: Intel Core i5-8250U, 13.30", 1.3 kg
External Review » Acer Swift 3 SF313-51-59SZ
Asus ZenBook S UX391UA-ET013R: Intel Core i7-8550U, 13.30", 1 kg
External Review » Asus ZenBook S UX391UA-ET013R
Dell XPS 13 9380 2019 FHD: Intel Core i7-8565U, 13.30", 1.2 kg
External Review » Dell XPS 13 9380
Lenovo Ideapad 720-13IKBR-81C3008YSP: Intel Core i5-8250U, 13.30", 1.3 kg
External Review » Lenovo Ideapad 720-13IKBR-81C3008YSP
HP 15-da1013ns: Intel Core i5-8265U, 15.60", 1.8 kg
External Review » HP 15-da1013ns
Lenovo Yoga S730-13-81J0000AMX: Intel Core i7-8565U, 13.30", 1.1 kg
External Review » Lenovo Yoga S730-13-81J0000AMX
Toshiba Portege X30-E-11F: Intel Core i7-8550U, 13.30", 1.1 kg
External Review » Toshiba Portege X30-E-11F
Dell Inspiron 14 5000 5482 2-in-1: Intel Core i7-8565U, 14.00", 1.8 kg
External Review » Dell Inspiron 14 5000 5482 2-in-1
Asus VivoBook S14 S406UA-BV121T: Intel Core i5-8250U, 14.00", 1.2 kg
External Review » Asus VivoBook S14 S406UA-BV121T
Asus ZenBook 13 UX333FA: Intel Core i5-8265U, 13.30", 1.2 kg
External Review » Asus ZenBook 13 UX333FA
Acer Spin 5 SP513-52N-85LZ: Intel Core i7-8550U, 13.30", 1.5 kg
External Review » Acer Spin 5 SP513-52N-85LZ
HP Spectre x360 13-ap0001ns: Intel Core i7-8565U, 13.30", 1.4 kg
External Review » HP Spectre x360 13-ap0001ns
Asus ZenBook UX430UA-GV408T: Intel Core i5-8250U, 14.00", 1.3 kg
External Review » Asus ZenBook UX430UA-GV408T
Lenovo Ideapad 330-15IKBR-81DE0208SP: Intel Core i5-8250U, 15.60", 2.2 kg
External Review » Lenovo Ideapad 330-15IKBR-81DE0208SP
Asus ZenBook 13 UX331UA-EG120T: Intel Core i5-8250U, 13.30", 1.1 kg
External Review » Asus ZenBook 13 UX331UA-EG120T
Huawei MateBook D 14 W50F-53010CQB: Intel Core i5-8250U, 14.00", 1.5 kg
External Review » Huawei MateBook D W50F 53010CQB
Acer Swift 5 SF515-51T-76B6: Intel Core i7-8565U, 15.60", 1 kg
External Review » Acer Swift 5 SF515-51T-70UX
Acer Spin 5 SP513-52NP-870E: Intel Core i7-8550U, 13.30", 1.5 kg
External Review » Acer Spin 5 SP513-52NP-870E
Asus ZenBook 14 UX433FA: Intel Core i7-8565U, 14.00", 1.2 kg
External Review » Asus ZenBook 14 UX433FA
Acer Chromebook 13 CB713-1W-57G8: Intel Core i5-8250U, 13.50", 1.6 kg
External Review » Acer Chromebook 13 CB713-1W-57G8
Acer Swift 5 SF515-51T-73Q7: Intel Core i7-8565U, 15.60", 1 kg
External Review » Acer Swift 5 SF515-51T-73Q7
Asus Zenbook 14 UX433FA-A6102T: Intel Core i7-8565U, 14.00", 1.2 kg
External Review » Asus Zenbook 14 UX433FA-A6102T
Acer Swift 5 SF514-52TP-812J: Intel Core i7-8550U, 14.00", 1 kg
External Review » Acer Swift 5 SF514-52TP-812J
Lenovo Yoga 530-14IKBR-81EK00FYSP: Intel Core i5-8250U, 14.00", 1.6 kg
External Review » Lenovo Yoga 530-14IKBR-81EK00FYSP
HP Pavilion 13-an0000ns: Intel Core i5-8265U, 13.30", 1.3 kg
External Review » HP Pavilion 13-an0000ns
Lenovo Ideapad 330-15IKBR-81DE019CSP: Intel Core i3-8130U, 15.60", 2.2 kg
External Review » Lenovo Ideapad 330-15IKBR-81DE019CSP
Lenovo Yoga 720-13IKBR-81C30090SP: Intel Core i5-8250U, 13.30", 1.3 kg
External Review » Lenovo Yoga 720-13IKBR-81C30090SP
Asus ZenBook UX430UA-GV362T: Intel Core i7-8550U, 14.00", 1.3 kg
External Review » Asus ZenBook UX430UA-GV362T
HP Pavilion x360 14-ba138ns: Intel Core i5-8250U, 14.00", 1.7 kg
External Review » HP Pavilion x360 14-ba138ns
HP Pavilion x360 15-cr0930nd: Intel Core i3-8130U, 15.60", 2.1 kg
External Review » HP Pavilion x360 15-cr0930nd
LG Gram 17Z990-R.AAS8U1: Intel Core i7-8565U, 17.00", 1.3 kg
External Review » LG Gram 17Z990-R.AAS8U1
Dell Latitude 5290-F9YR0 2-in-1: Intel Core i5-8250U, 12.30", 1.3 kg
External Review » Dell Latitude 5290-F9YR0 2-in-1
HP EliteBook x360 1030 G3 45X96UT: Intel Core i7-8650U, 13.30", 1.3 kg
External Review » HP EliteBook x360 1030 G3 45X96UT
Acer Spin 5 SP513-52NP-583A: Intel Core i5-8250U, 13.30", 1.5 kg
External Review » Acer Spin 5 SP513-52NP-583A
LG Gram 14Z980-G.AA52B: Intel Core i5-8250U, 14.00", 1 kg
External Review » LG Gram 14Z980-G.AA52B
HP Pavilion x360 14-cd0010ns: Intel Core i5-8250U, 14.00", 1.6 kg
External Review » HP Pavilion x360 14-cd0010ns
Asus Vivobook 15 X540UB-GQ352T: Intel Core i5-8250U, 14.00", 1.9 kg
External Review » Asus Vivobook 15 X540UB-GQ352T
Lenovo Yoga 920-13IKBR-80Y7005YSP: Intel Core i7-8550U, 13.90", 1.4 kg
External Review » Lenovo Yoga 920-13IKBR-80Y7005YSP
Asus K540UA-GQ676T: Intel Core i7-8550U, 15.60", 2 kg
External Review » Asus K540UA-GQ676T
Lenovo Yoga 730-13IKB-81CT0080GE: Intel Core i7-8550U, 13.30", 1.1 kg
External Review » Lenovo Yoga 730-13IKB-81CT0080GE
Lenovo Yoga C930-13IKB: Intel Core i5-8250U, 13.90", 1.4 kg
External Review » Lenovo Yoga C930-13IKB
Dell Inspiron 14 5482-XDD07: Intel Core i3-8145U, 14.00", 1.9 kg
External Review » Dell Inspiron 14 5482-XDD07
HP Elite x2 1013 G3-2TT14EA: Intel Core i5-8350U, 13.00", 1.2 kg
External Review » HP Elite x2 1013 G3-2TT14EA
Lenovo Yoga C930-13IKB-81C4002WMH: Intel Core i7-8550U, 13.90", 1.4 kg
External Review » Lenovo Yoga C930-13IKB-81C4002WMH
Lenovo ThinkPad T480s-20L7002AUS: Intel Core i5-8250U, 14.00", 1.4 kg
External Review » Lenovo ThinkPad T480s-20L7002AUS
Acer Chromebook Spin 13 CP713-1WN-54GA: Intel Core i5-8250U, 13.50", 1.5 kg
External Review » Acer Chromebook Spin 13 CP713-1WN-54GA
Lenovo Yoga C930-13IKB-81C4003UGE: Intel Core i7-8550U, 13.90", 1.4 kg
External Review » Lenovo Yoga C930-13IKB-81C4003UGE
HP Spectre x360 13-ae015nd: Intel Core i7-8550U, 13.30", 1.3 kg
External Review » HP Spectre x360 13-ae015nd
Asus Vivobook S15 S530UA-BQ290T: Intel Core i5-8250U, 15.60", 1.8 kg
External Review » Asus Vivobook S15 S530UA-BQ290T
Acer Chromebook Spin 13 CP713-1WN-55HT: Intel Core i5-8250U, 13.50", 1.5 kg
External Review » Acer Chromebook Spin 13 CP713-1WN-55HT
Acer Swift 3 SF314-54-524Y: Intel Core i5-8250U, 14.00", 1.5 kg
External Review » Acer Swift 3 SF314-54-524Y
Asus ZenBook 13 UX331UA-AS51: Intel Core i5-8250U, 13.30", 1.1 kg
External Review » Asus ZenBook 13 UX331UA-AS51
Lenovo Yoga C930-13IKB-81EQ000HGE: Intel Core i7-8550U, 13.90", 1.4 kg
External Review » Lenovo Yoga C930-13IKB-81EQ000HGE
Microsoft Surface Pro 6, Core i7, 512 GB: Intel Core i7-8650U, 12.30", 1.1 kg
External Review » Microsoft Surface Pro 6, Core i7, 512 GB
Lenovo Yoga C930-13IKB 81C4: Intel Core i7-8550U, 13.90", 1.4 kg
External Review » Lenovo Yoga C930-13IKB 81C4
Lenovo Ideapad 720S-13IKB-81BV005AGE: Intel Core i7-8550U, 13.30", 1.1 kg
External Review » Lenovo Ideapad 720S-13IKB-81BV005AGE
Microsoft Surface Pro 6 i5 256GB: Intel Core i5-8250U, 12.30", 1.1 kg
External Review » Microsoft Surface Pro 6 i5 256GB
Lenovo ThinkPad X1 Carbon 2018-20KGS03800: Intel Core i7-8550U, 14.00"
External Review » Lenovo ThinkPad X1 Carbon 2018-20KGS03800
Dell Inspiron 13 7380 CN73803: Intel Core i5-8265U, 13.30", 1.4 kg
External Review » Dell Inspiron 13 7380 CN73803
Lenovo Yoga 530-14IKBR-81EK00FXSP: Intel Core i7-8550U, 14.00", 1.7 kg
External Review » Lenovo Yoga 530-14IKBR-81EK00FXSP
Lenovo Ideapad 530S-14IKB-81EU00C6SP: Intel Core i5-8250U, 14.00", 1.5 kg
External Review » Lenovo Ideapad 530S-14IKB-81EU00C6SP
HP Pavilion x360 14-CD0007NS: Intel Core i5-8250U, 14.00", 1.6 kg
External Review » HP Pavilion x360 14-CD0007NS
HP 15-da0044ns: Intel Core i5-8250U, 15.60", 2 kg
External Review » HP 15-da0044ns
HP Pavilion 13-an0370nd: Intel Core i5-8265U, 13.30", 1.3 kg
External Review » HP Pavilion 13-an0370nd
Asus Vivobook Flip 14 TP412UA-EC057T: Intel Core i3-8130U, 14.00", 1.5 kg
External Review » Asus Vivobook Flip 14 TP412UA-EC057T
Microsoft Surface Laptop 2, i7 (JKQ-00069): Intel Core i7-8650U, 13.50", 1.3 kg
External Review » Microsoft Surface Laptop 2, i7 (JKQ-00069)
HP Chromebook x360 14-da0021nr: Intel Core i3-8130U, 14.00", 1.7 kg
External Review » HP Chromebook x360 14-da0021nr
HP Pavilion 14-ce0820nd: Intel Core i5-8250U, 14.00", 1.6 kg
External Review » HP Pavilion 14-ce0820nd
Lenovo Ideapad 330S-14IKB-81F400PGGE: Intel Core i5-8250U, 14.00", 1.7 kg
External Review » Lenovo Ideapad 330S-14IKB-81F400PGGE
Medion Akoya S6425-MD61072: Intel Core i5-8250U, 15.60", 2 kg
External Review » Medion Akoya S6425-MD61072
Acer Swift 3 SF314-54-38W3: Intel Core i3-8130U, 14.00", 1.6 kg
External Review » Acer Swift 3 SF314-54-38W3
Asus ZenBook S UX391UA-ET012T: Intel Core i7-8550U, 13.30", 1 kg
External Review » Asus ZenBook S UX391UA-ET012T
Lenovo Yoga 730-13IKB-81CT: Intel Core i5-8250U, 13.30", 1.2 kg
External Review » Lenovo Yoga 730-13IKB-81CT
Asus Zenbook UX331UA-EG029T: Intel Core i7-8550U, 13.30", 1.1 kg
External Review » Asus Zenbook UX331UA-EG029T
MSI PS42 8M-064: Intel Core i5-8250U, 14.00", 1.2 kg
External Review » MSI PS42 8M-064
Lenovo Yoga 530-14IKB-81EK00CWGE: Intel Core i5-8250U, 14.00", 1.6 kg
External Review » Lenovo Yoga 530-14IKB-81EK00CWGE
Lenovo Ideapad 330S-15IKB-81F500MGGE: Intel Core i3-8130U, 15.60", 1.9 kg
External Review » Lenovo Ideapad 330S-15IKB-81F500MGGE
Microsoft Surface Laptop 2: Intel Core i5-8250U, 13.50", 1.4 kg
External Review » Microsoft Surface Laptop 2
Lenovo Ideapad 520S-14IKBR-81BL007SSP: Intel Core i5-8250U, 14.00", 1.7 kg
External Review » Lenovo Ideapad 520S-14IKBR-81BL007SSP
Lenovo Ideapad 330-15IKBR-81DE013QSP: Intel Core i5-8250U, 15.60", 2.2 kg
External Review » Lenovo Ideapad 330-15IKBR-81DE013QSP
Lenovo Yoga 520-14IKBR-81C8008DSP: Intel Core i5-8250U, 14.00", 1.8 kg
External Review » Lenovo Yoga 520-14IKBR-81C8008DSP
Lenovo Ideapad 520S-14IKBR-81BL007VSP: Intel Core i7-8550U, 14.00", 1.7 kg
External Review » Lenovo Ideapad 520S-14IKBR-81BL007VSP
Lenovo Yoga 720-13IKBR-81C3008VSP: Intel Core i5-8250U, 13.30", 1.3 kg
External Review » Lenovo Yoga 720-13IKBR-81C3008VSP
Medion Akoya S6425-MD61073: Intel Core i5-8250U, 15.60", 1.9 kg
External Review » Medion Akoya S6425-MD61073
HP ProBook 450 G5-2UB53EA: Intel Core i5-8250U, 15.60", 2.1 kg
External Review » HP ProBook 450 G5-2UB53EA
HP Envy 13-AH0002NS: Intel Core i5-8250U, 13.30", 1.3 kg
External Review » HP Envy 13-AH0002NS
Asus Vivobook S14 S406UA-BV041T: Intel Core i5-8250U, 14.00", 1.2 kg
External Review » Asus Vivobook S14 S406UA-BV041T
Lenovo V330-15IKB-81AX00FGGE: Intel Core i5-8250U, 15.60", 2 kg
External Review » Lenovo V330-15IKB-81AX00FGGE
Asus VivoBook S15 S530UA-DB51-YL: Intel Core i5-8250U, 15.60", 1.8 kg
External Review » Asus VivoBook S15 S530UA-DB51-YL
Microsoft Surface Pro 6, Core i5, 128 GB: Intel Core i5-8250U, 12.30", 0.8 kg
External Review » Microsoft Surface Pro 6, Core i5, 128 GB
Lenovo ThinkPad X1 Carbon G6-20KG003BGE: Intel Core i7-8550U, 14.00", 1.1 kg
External Review » Lenovo ThinkPad X1 Carbon G6-20KG003BGE
Dell Inspiron 14 5482, 2-in-1: Intel Core i5-8265U, 14.00", 1.8 kg
External Review » Dell Inspiron 14 5482, 2-in-1
Lenovo Yoga Chromebook C630-81JX0002UK: Intel Core i5-8250U, 15.60", 1.9 kg
External Review » Lenovo Yoga Chromebook C630-81JX0002UK
Dell Inspiron 13 7386 2-in-1: Intel Core i5-8265U, 13.30", 1.4 kg
External Review » Dell Inspiron 13 7386 2-in-1
Dell Inspiron 14 Chromebook 2-in-1: Intel Core i3-8130U, 14.00", 1.7 kg
External Review » Dell Inspiron 14 Chromebook 2-in-1
Lenovo ThinkPad T480s-20L7001YUS: Intel Core i7-8650U, 14.00", 1.4 kg
External Review » Lenovo ThinkPad T480s-20L7001YUS
Asus Zenbook S UX391UA-EG047T: Intel Core i7-8550U, 13.30", 1.1 kg
External Review » Asus Zenbook S UX391UA-EG047T
Asus VivoBook S13 X330UN: Intel Core i3-8130U, 13.30", 1.2 kg
External Review » Asus VivoBook S13 X330UN
HP Spectre x360 13-ae046ng: Intel Core i7-8550U, 13.30", 1.3 kg
External Review » HP Spectre x360 13-ae046ng
Lenovo ThinkPad X1 Carbon G6-20KH0079GE: Intel Core i5-8250U, 14.00", 1.1 kg
External Review » Lenovo ThinkPad X1 Carbon G6-20KH0079GE
HP Envy 13-ah0004ng: Intel Core i5-8250U, 13.30", 1.3 kg
External Review » HP Envy 13-ah0004ng
Acer Swift 5 SF514-52TP-546Q: Intel Core i5-8250U, 14.00", 1 kg
External Review » Acer Swift 5 SF514-52TP-546Q
Dell Vostro 14 5471-PJ1PN: Intel Core i5-8250U, 14.00", 1.7 kg
External Review » Dell Vostro 14 5471-PJ1PN
Lenovo ThinkPad P52s-20LB000PMH: Intel Core i7-8550U, 15.60", 2 kg
External Review » Lenovo ThinkPad P52s-20LB000PMH
Medion Akoya S6425: Intel Core i3-8130U, 15.60", 2 kg
External Review » Medion Akoya S6425
Acer Spin 5 SP513-52N-55NV: Intel Core i5-8250U, 13.30", 1.5 kg
External Review » Acer Spin 5 SP513-52N-55NV
Lenovo ThinkPad E480-20KN001QGE: Intel Core i5-8250U, 14.00", 1.8 kg
External Review » Lenovo ThinkPad E480-20KN001QGE
HP Pavilion x360 14-cd0087tu: Intel Core i5-8250U, 14.00", 1.6 kg
External Review » HP Pavilion x360 14-cd0087tu
LG Gram 14Z980-G.AA52A1: Intel Core i5-8250U, 14.00", 1 kg
External Review » LG Gram 14Z980-G.AA52A1
HP Pavilion x360 14-cd0008ns: Intel Core i5-8250U, 14.00", 1.6 kg
External Review » HP Pavilion x360 14-cd0008ns
HP 15-da0045ns: Intel Core i5-8250U, 15.60", 1.8 kg
External Review » HP 15-da0045ns
HP Pavilion 15-cs0053cl: Intel Core i5-8250U, 15.60", 1.8 kg
External Review » HP Pavilion 15-cs0053cl
Asus VivoBook 15 X542UA-GO946T: Intel Core i5-8250U, 15.60", 2.3 kg
External Review » Asus VivoBook 15 X542UA-GO946T
Asus Zenbook S UX391UA-EG007T: Intel Core i7-8550U, 13.30", 1 kg
External Review » Asus Zenbook S UX391UA-EG007T
Fujitsu Lifebook S938: Intel Core i5-8250U, 13.30", 1.3 kg
External Review » Fujitsu Lifebook S938
Lenovo Yoga 530-14IKB-81EK00G9MH: Intel Core i7-8550U, 14.00", 1.7 kg
External Review » Lenovo Yoga 530-14IKB-81EK00G9MH
HP Pavilion x360 14-cd0650nd: Intel Core i5-8250U, 14.00", 1.6 kg
External Review » HP Pavilion x360 14-cd0650nd
Lenovo IdeaPad 720-15IKBR 81C7001VPB: Intel Core i5-8250U, 15.60", 2.1 kg
External Review » Lenovo IdeaPad 720-15IKBR 81C7001VPB
Asus VivoBook Flip TP412UA-EC053T: Intel Core i5-8250U, 14.00", 1.6 kg
External Review » Asus VivoBook Flip TP412UA-EC053T
Acer Swift 3 SF314-54-54LB: Intel Core i5-8250U, 14.00", 1.8 kg
External Review » Acer Swift 3 SF314-54-54LB
Acer Aspire 5 A515-51-58HD: Intel Core i5-8250U, 15.60", 2.2 kg
External Review » Acer Aspire 5 A515-51-58HD
Acer Aspire E5-576-392H: Intel Core i3-8130U, 15.60", 2.4 kg
External Review » Acer Aspire E5-576-392H
Acer Aspire S 24 S24-880: Intel Core i5-8250U, 23.80", 1.3 kg
External Review » Acer Aspire S 24 S24-880
HP Envy 13-ah0700ng: Intel Core i5-8250U, 13.30", 1.2 kg
External Review » HP Envy 13-ah0700ng
Asus ZenBook Flip 13 UX362FA: Intel Core i7-8565U, 13.30", 1.3 kg
External Review » Asus ZenBook Flip 13 UX362FA
HP 15-da0049ns: Intel Core i5-8250U, 15.60", 1.8 kg
External Review » HP 15-da0049ns
LG Gram 13Z980-G: Intel Core i5-8250U, 13.30", 1 kg
External Review » LG Gram 13Z980-G
Toshiba Tecra X40-E-10U: Intel Core i7-8550U, 14.00", 1.3 kg
External Review » Toshiba Tecra X40-E-10U
Lenovo Thinkpad X1 Carbon G6 2018-20KH006DSP: Intel Core i5-8250U, 14.00", 1.1 kg
External Review » Lenovo Thinkpad X1 Carbon G6 2018-20KH006DSP
Acer Aspire 5 A517-51-5577: Intel Core i5-8250U, 17.30", 2.9 kg
External Review » Acer Aspire 5 A517-51-5577
Lenovo Yoga 720-13IKB-80X6005BSP: Intel Core i5-7200U, 13.30", 1.3 kg
External Review » Lenovo Yoga 720-13IKB-80X6005BSP
Lenovo Ideapad 520S-14IKBR-81BL007PSP: Intel Core i7-8550U, 14.00", 1.7 kg
External Review » Lenovo Ideapad 520S-14IKBR-81BL007PSP
HP Envy 13-ah0100nd: Intel Core i5-8250U, 13.30", 1.3 kg
External Review » HP Envy 13-ah0100nd
Lenovo Yoga 520-14IKB-80X800WMMH: Intel Core i3-7130U, 14.00", 1.7 kg
External Review » Lenovo Yoga 520-14IKB-80X800WMMH
Lenovo Yoga 530-14IKB-81EK00E1MH: Intel Core i5-8250U, 15.60", 1.7 kg
External Review » Lenovo Yoga 530-14IKB-81EK00E1MH
Asus Zenbook UX430UA-GV265T: Intel Core i5-8250U, 14.00", 1.3 kg
External Review » Asus Zenbook UX430UA-GV265T
Asus K406UA-BM230T: Intel Core i7-8550U, 14.00", 1.2 kg
External Review » Asus K406UA-BM230T
Lenovo Yoga 730-13IKB: Intel Core i7-8550U, 13.30", 1.2 kg
External Review » Lenovo Yoga 730-13IKB
Acer Aspire 3 A315-39: Intel Core i3-8130U, 15.60", 2.1 kg
External Review » Acer Aspire 3 A315-39
Lenovo ThinkPad T580-20L9001YGE: Intel Core i5-8250U, 15.60", 2.1 kg
External Review » Lenovo ThinkPad T580-20L9001YGE
HP Envy 13-ah0001ng: Intel Core i7-8550U, 13.30", 1.3 kg
External Review » HP Envy 13-ah0001ng
HP EliteBook x360 1030 G3: Intel Core i5-8250U, 13.30", 1.3 kg
External Review » HP EliteBook x360 1030 G3
HP EliteBook x2 1013 G3-4YJ16UT: Intel Core i7-8650U, 13.30", 1.2 kg
External Review » HP EliteBook x2 1013 G3-4YJ16UT
Lenovo ThinkPad X1 Yoga 2018-20LE002CMH: Intel Core i5-8350U, 14.00", 1.4 kg
External Review » Lenovo ThinkPad X1 Yoga 2018-20LE002CMH
Lenovo ThinkPad T480s-20L7001NGE: Intel Core i7-8550U, 14.00", 1.4 kg
External Review » Lenovo ThinkPad T480s-20L7001NGE
HP EliteBook 840 G5-3JX09EA: Intel Core i7-8550U, 14.00", 1.5 kg
External Review » HP EliteBook 840 G5-3JX09EA
Lenovo ThinkPad T580-20L9001AUS: Intel Core i7-8650U, 15.60", 2 kg
External Review » Lenovo ThinkPad T580-20L9001AUS
Asus VivoBook F510UA-AH51: Intel Core i5-8250U, 15.60", 1.7 kg
External Review » Asus VivoBook F510UA-AH51
Toshiba Tecra X40-E-BTO: Intel Core i7-8650U, 14.10", 1.3 kg
External Review » Toshiba Tecra X40-E-BTO
Sony Vaio S11-VJS1121: Intel Core i7-8550U, 13.30", 0.9 kg
External Review » Sony Vaio S11-VJS1121
Sony Vaio S13-VJS132X0511S: Intel Core i7-8550U, 13.30", 1.1 kg
External Review » Sony Vaio S13-VJS132X0511S
LG Gram 14Z980-A.AAS7U1: Intel Core i7-8550U, 14.00", 1 kg
External Review » LG Gram 14Z980-A.AAS7U1
Lenovo Ideapad 530S-14IKB-81EU00CJUK: Intel Core i5-8250U, 14.10", 1.5 kg
External Review » Lenovo Ideapad 530S-14IKB-81EU00CJUK
Lenovo IdeaPad 330S-14IKB-81F5001RUS: Intel Core i3-8130U, 14.10", 1.7 kg
External Review » Lenovo IdeaPad 330S-14IKB-81F5001RUS
Lenovo ThinkPad X1 Tablet G3-20KJ001NGE: Intel Core i5-8250U, 13.00", 1.3 kg
External Review » Lenovo ThinkPad X1 Tablet G3-20KJ001NGE
HP EliteBook 830 G5-3PZ05UT: Intel Core i7-8650U, 13.30", 1.3 kg
External Review » HP EliteBook 830 G5-3PZ05UT
HP EliteBook 840 G5-3WD97UT: Intel Core i7-8650U, 14.00", 1.5 kg
External Review » HP EliteBook 840 G5-3WD97UT
Asus VivoBook Flip 14 TP412UA-EC115T: Intel Core i7-8550U, 14.10", 1.5 kg
External Review » Asus VivoBook Flip 14 TP412UA-EC115T
Acer Swift 5 SF514 15.6 inch: Intel Core i7-8550U, 15.60", 1 kg
External Review » Acer Swift 5 SF514 15.6 inch
Toshiba Portege X30-E-11U: Intel Core i7-8550U, 13.30", 1.1 kg
External Review » Toshiba Portege X30-E-11U
Lenovo ThinkPad X380 Yoga-20LH0018US: Intel Core i7-8650U, 13.30", 1.4 kg
External Review » Lenovo ThinkPad X380 Yoga-20LH0018US
Acer Spin 3 SP314-51-38XK: Intel Core i3-8130U, 14.00", 1.7 kg
External Review » Acer Spin 3 SP314-51-38XK
Acer Aspire E5-476-50SZ: Intel Core i5-8250U, 14.00", 1.9 kg
External Review » Acer Aspire E5-476-50SZ
Fujitsu Stylistic Q738: Intel Core i5-8350U, 13.30", 1.4 kg
External Review » Fujitsu Stylistic Q738
Asus VivoBook S14 S406UA-BV023T: Intel Core i5-8250U, 14.00", 1.2 kg
External Review » Asus VivoBook S14 S406UA-BV023T
Acer Spin 5 SP513-52N-54SF: Intel Core i5-8250U, 13.30", 1.5 kg
External Review » Acer Spin 5 SP513-52N-54SF
HP Spectre 13-af005nl: Intel Core i7-8550U, 13.30", 1.1 kg
External Review » HP Spectre 13-af005nl
HP Elitebook 840 G5 3JX27EA: Intel Core i5-8250U, 14.00", 1.5 kg
External Review » HP Elitebook 840 G5 3JX27EA
HP Spectre 13-AF000NS: Intel Core i7-8550U, 13.30", 1.1 kg
External Review » HP Spectre 13-AF000NS
Lenovo Yoga 720-13IKBR-81C3008YSP: Intel Core i5-8250U, 13.30", 1.3 kg
External Review » Lenovo Yoga 720-13IKBR-81C3008YSP
Lenovo Ideapad 320S-14IKBR-81BN0055SP: Intel Core i5-8250U, 14.00", 1.7 kg
External Review » Lenovo Ideapad 320S-14IKBR-81BN0055SP
HP Pavilion x360 14-cd0006ns: Intel Core i3-8130U, 14.00", 1.6 kg
External Review » HP Pavilion x360 14-cd0006ns
Dell Inspiron 15 5570 cn57005: Intel Core i5-8250U, 15.60", 2.2 kg
External Review » Dell Inspiron 15 5570 cn57005
Acer Spin 5 SP513-52N-5210: Intel Core i5-8250U, 13.30", 1.6 kg
External Review » Acer Spin 5 SP513-52N-5210
Acer Spin 3-314-51-54WS: Intel Core i5-8250U, 14.00", 1.7 kg
External Review » Acer Spin 3-314-51-54WS
Asus Zenbook S UX391UA-EG022T: Intel Core i7-8550U, 13.30", 1.1 kg
External Review » Asus Zenbook S UX391UA-EG022T
Lenovo Thinkpad L380-20M50013SP: Intel Core i5-8250U, 13.30", 1.5 kg
External Review » Lenovo Thinkpad L380-20M50013SP
Lenovo Thinkpad L380 Yoga-20M7001BS: Intel Core i5-8250U, 13.30", 1.6 kg
External Review » Lenovo Thinkpad L380 Yoga-20M7001BS
Lenovo Yoga 520-14IKBR-81C8008VSP: Intel Core i5-8250U, 14.00", 1.8 kg
External Review » Lenovo Yoga 520-14IKBR-81C8008VSP
Lenovo Thinkpad T480-20L50000SP: Intel Core i5-8250U, 14.00", 1.7 kg
External Review » Lenovo Thinkpad T480-20L50000SP
HP Elitebook 850 G5-3JX13EA: Intel Core i5-8250U, 15.60", 1.8 kg
External Review » HP Elitebook 850 G5-3JX13EA
Asus VivoBook 15 X542UA-GQ266T: Intel Core i5-8250U, 15.60", 2.3 kg
External Review » Asus VivoBook 15 X542UA-GQ266T
Lenovo ThinkPad X1 Carbon 2018-20KHCTO1WW: Intel Core i7-8550U, 14.00", 1.2 kg
External Review » Lenovo ThinkPad X1 Carbon 2018-20KHCTO1WW
Lenovo ThinkPad L580-20LW000VMH: Intel Core i5-8250U, 15.60", 2 kg
External Review » Lenovo ThinkPad L580-20LW000VMH
Lenovo Ideapad 520S-14IKBR-81BL005YMH: Intel Core i5-8250U, 14.00", 1.7 kg
External Review » Lenovo Ideapad 520S-14IKBR-81BL005YMH
Acer Swift 5 SF514-52T-831Y: Intel Core i7-8550U, 14.00", 1 kg
External Review » Acer Swift 5 SF514-52T-831Y
HP EliteBook 850 G5 3JX58EA: Intel Core i5-8250U, 15.60", 1.8 kg
External Review » HP EliteBook 850 G5 3JX58EA
Lenovo ThinkPad L380-20M5000WGE: Intel Core i5-8250U, 13.30", 1.4 kg
External Review » Lenovo ThinkPad L380-20M5000WGE
Lenovo ThinkPad L480-20LS001AGE: Intel Core i5-8250U, 14.00", 1.7 kg
External Review » Lenovo ThinkPad L480-20LS001AGE
Lenovo ThinkPad T480-20L50010US: Intel Core i7-8650U, 14.00", 1.6 kg
External Review » Lenovo ThinkPad T480-20L50010US
HP EliteBook 840 G5-3JX66EA: Intel Core i5-8250U, 14.00", 1.5 kg
External Review » HP EliteBook 840 G5-3JX66EA
Asus VivoBook Flip 15 TP510UA-E8073T: Intel Core i5-8250U, 15.60", 2.3 kg
External Review » Asus VivoBook Flip 15 TP510UA-E8073T
LG Gram 14Z980-U.AAW5U1: Intel Core i5-8250U, 14.00", 1 kg
External Review » LG Gram 14Z980-U.AAW5U1
Fujitsu Lifebook T938: Intel Core i5-8250U, 13.30", 1.3 kg
External Review » Fujitsu Lifebook T938
Asus ZenBook S UX391U: Intel Core i7-8550U, 13.30", 1 kg
External Review » Asus ZenBook S UX391U
HP EliteBook 830 G5-3JX74EA: Intel Core i7-8550U, 13.30", 1.3 kg
External Review » HP EliteBook 830 G5-3JX74EA
Lenovo ThinkPad L580-20LW000VGE: Intel Core i5-8250U, 15.60", 2 kg
External Review » Lenovo ThinkPad L580-20LW000VGE
Acer Swift 3 SF315-52-58HG: Intel Core i5-8250U, 15.60", 1.8 kg
External Review » Acer Swift 3 SF315-52-58HG
Lenovo ThinkPad X1 Carbon 2018-20KH0039MC: Intel Core i7-8550U, 14.00", 1.1 kg
External Review » Lenovo ThinkPad X1 Carbon 2018-20KH0039MC
Lenovo ThinkPad E580-20KS0064MC: Intel Core i5-8250U, 15.60", 2.1 kg
External Review » Lenovo ThinkPad E580-20KS0064MC
Acer Swift 5 SF514-52T-56ZX: Intel Core i5-8250U, 14.00", 1 kg
External Review » Acer Swift 5 SF514-52T-56ZX
Asus Zenbook UX331UAL-EG050T: Intel Core i5-8250U, 13.30", 1 kg
External Review » Asus Zenbook UX331UAL-EG050T
Lenovo V330-15IKB-81AX00CNSP: Intel Core i5-8250U, 15.60", 2 kg
External Review » Lenovo V330-15IKB-81AX00CNSP
Lenovo Yoga 920-13IKB-80Y7008RSP: Intel Core i5-8250U, 13.90", 1.4 kg
External Review » Lenovo Yoga 920-13IKB-80Y7008RSP
Lenovo Ideapad 520S-14IKB-81BL0080SP: Intel Core i7-8550U, 14.00", 1.7 kg
External Review » Lenovo Ideapad 520S-14IKB-81BL0080SP
Lenovo Thinkpad E580 20KS004FSP: Intel Core i5-8250U, 15.60", 2.1 kg
External Review » Lenovo Thinkpad E580 20KS004FSP
HP ENVY 13-ad113ns: Intel Core i7-8550U, 13.30", 1.3 kg
External Review » HP ENVY 13-ad113ns
LG Gram 15Z980-G.AA52: Intel Core i5-8250U, 15.60", 1.1 kg
External Review » LG Gram 15Z980-G.AA52
Dell Inspiron 17-5770-0357: Intel Core i5-8250U, 17.30", 2.7 kg
External Review » Dell Inspiron 17-5770-0357
Lenovo V330-14IKB-81B0004MGE: Intel Core i5-8250U, 14.00", 1.7 kg
External Review » Lenovo V330-14IKB-81B0004MGE
LG Gram 13Z980-A: Intel Core i5-8250U, 13.30", 1 kg
External Review » LG Gram 13Z980-A
Dell Latitude 15 3590-6HFKG: Intel Core i5-8250U, 15.60", 2.1 kg
External Review » Dell Latitude 15 3590-6HFKG
HP ProBook 440 G5-3KX87ES: Intel Core i5-8250U, 14.00", 1.6 kg
External Review » HP ProBook 440 G5-3KX87ES
HP Spectre 13-af008tu: Intel Core i5-8250U, 13.30", 1.1 kg
External Review » HP Spectre 13-af008tu
HP Spectre 13-af090tu: Intel Core i7-8550U, 13.30", 1.1 kg
External Review » HP Spectre 13-af090tu
Lenovo ThinkPad X380 Yoga-20LH000NGE: Intel Core i5-8250U, 13.30", 1.4 kg
External Review » Lenovo ThinkPad X380 Yoga-20LH000NGE
Lenovo ThinkPad X280-20KF0022US: Intel Core i5-8350U, 12.50", 1.1 kg
External Review » Lenovo ThinkPad X280-20KF0022US
Lenovo Ideapad 720S-13IKB-81BV0058GE: Intel Core i7-8550U, 13.30", 1.1 kg
External Review » Lenovo Ideapad 720S-13IKB-81BV0058GE
Lenovo ThinkPad X1 Carbon G6-20KH006MGE: Intel Core i7-8550U, 14.00", 1.1 kg
External Review » Lenovo ThinkPad X1 Carbon G6-20KH006MGE
Lenovo Ideapad 520-15IKBR-81BF008MMH: Intel Core i5-8250U, 15.60", 2.2 kg
External Review » Lenovo Ideapad 520-15IKBR-81BF008MMH
Lenovo Thinkpad E580-20KS001QMH: Intel Core i7-8550U, 15.60", 2.1 kg
External Review » Lenovo Thinkpad E580-20KS001QMH
Acer Swift 5 SF5-14-52T-580N: Intel Core i5-8250U, 14.00", 1 kg
External Review » Acer Swift 5 SF5-14-52T-580N
Asus ZenBook UX430UAR PURE14: Intel Core i7-8550U, 14.00", 1.3 kg
External Review » Asus ZenBook UX430UAR PURE14
Dell Inspiron 13 5370-0583: Intel Core i5-8250U, 13.30", 1.4 kg
External Review » Dell Inspiron 13 5370-0583
HP EliteBook 840 G5-3JX61EA: Intel Core i7-8550U, 14.00", 1.5 kg
External Review » HP EliteBook 840 G5-3JX61EA
Dell Inspiron 15 5579-9689: Intel Core i7-8550U, 15.60", 2.1 kg
External Review » Dell Inspiron 15-5579-9689
Asus Zenbook UX331UA-90NB0GZ2-M02380: Intel Core i5-8250U, 13.30", 1.1 kg
External Review » Asus Zenbook UX331UA-90NB0GZ2-M02380
Acer Chromebook Spin 13 CP713-1W: Intel Core i5-8250U, 13.50", 1.5 kg
External Review » Acer Chromebook Spin 13 CP713-1W
Lenovo Thinkpad E580-20KS003GHV: Intel Core i5-8250U, 15.60", 2.1 kg
External Review » Lenovo Thinkpad E580-20KS003GHV
Fujitsu Lifebook U938: Intel Core i5-8250U, 13.30", 0.9 kg
External Review » Fujitsu Lifebook U938
Dell Latitude 5490: Intel Core i7-8650U, 14.00", 1.7 kg
External Review » Dell Latitude 5490
HP ENVY 13-ad107ns: Intel Core i5-8250U, 13.30", 1.3 kg
External Review » HP ENVY 13-ad107ns
Lenovo Ideapad 320-15IKB-81BG00HASP: Intel Core i5-8250U, 15.60", 2.2 kg
External Review » Lenovo Ideapad 320-15IKB-81BG00HASP
Asus ZenBook 3 Deluxe UX490UAR-BE094T: Intel Core i5-8250U, 14.00", 1.1 kg
External Review » Asus ZenBook 3 Deluxe UX490UAR-BE094T
Lenovo ThinkPad E480-20KNCTO1WW: Intel Core i5-8250U, 14.00", 1.8 kg
External Review » Lenovo ThinkPad E480-20KNCTO1WW
Dell Vostro 14 5471: Intel Core i5-8250U, 14.00", 1.7 kg
External Review » Dell Vostro 14 5471
Acer Swift 5 SF514-52T-56JV: Intel Core i5-8250U, 14.00", 0.9 kg
External Review » Acer Swift 5 SF514-52T-56JV
Dell Latitude 3490: Intel Core i5-8250U, 14.00", 1.8 kg
External Review » Dell Latitude 3490
Dell Latitude 7490: Intel Core i7-8650U, 14.00", 1.6 kg
External Review » Dell Latitude 7490
Lenovo ThinkPad L380 Yoga-20M7001BGE: Intel Core i5-8250U, 13.30", 1.5 kg
External Review » Lenovo ThinkPad L380 Yoga-20M7001BGE
Acer Aspire E5-476-3675: Intel Core i3-8130U, 14.00", 1.9 kg
External Review » Acer Aspire E5-476-3675
Asus Zenbook 13 UX331UAL-EG020TS: Intel Core i7-8550U, 13.30", 1 kg
External Review » Asus Zenbook 13 UX331UAL-EG020TS
Asus ZenBook Flip 14 UX461UA: Intel Core i5-8250U, 14.00", 1.4 kg
External Review » Asus ZenBook Flip 14 UX461UA
Lenovo ThinkPad X1 Yoga 2018-20LD0015US: Intel Core i5-8250U, 14.00", 1.4 kg
External Review » Lenovo ThinkPad X1 Yoga 2018-20LD0015US
Lenovo Ideapad 520S-14IKBR-81BL007MSP: Intel Core i5-8250U, 14.00", 1.7 kg
External Review » Lenovo Ideapad 520S-14IKBR-81BL007MSP
HP Spectre x360 13-ae000ns: Intel Core i5-8250U, 13.30", 1.3 kg
External Review » HP Spectre x360 13-ae000ns
HP Envy 13-ad110ns: Intel Core i5-8250U, 13.30", 1.2 kg
External Review » HP Envy 13-ad110ns
Lenovo Yoga 920-13IKB-80Y80029GE Star Wars: Intel Core i5-8250U, 13.30", 1.4 kg
External Review » Lenovo Yoga 920-13IKB-80Y80029GE Star Wars
HP ProBook 430 G5-3KY87EA: Intel Core i5-8250U, 13.30", 1.5 kg
External Review » HP ProBook 430 G5-3KY87EA
Lenovo Yoga 520-14IKB-81C8001DGE: Intel Core i5-8250U, 14.00", 1.8 kg
External Review » Lenovo Yoga 520-14IKB-81C8001DGE
Lenovo ThinkPad X280-20KF001HMC: Intel Core i7-8550U, 12.50", 1.3 kg
External Review » Lenovo ThinkPad X280-20KF001HMC
Acer Aspire 3 A315-51-30YA: Intel Core i3-8130U, 15.60", 2.1 kg
External Review » Acer Aspire 3 A315-51-30YA
Asus UX410UA-GV354T: Intel Core i5-8250U, 14.00", 1.4 kg
External Review » Asus UX410UA-GV354T
Lenovo ThinkPad X280-20KF001UUS: Intel Core i7-8650U, 12.50", 1.1 kg
External Review » Lenovo ThinkPad X280-20KF001UUS
Lenovo ThinkPad T480-20L50011US: Intel Core i5-8350U, 14.00", 1.8 kg
External Review » Lenovo ThinkPad T480-20L50011US
Lenovo ThinkPad X280-20KES01S00: Intel Core i5-8250U, 12.50", 1.1 kg
External Review » Lenovo ThinkPad X280-20KES01S00
Acer Swift 5 SF514-52T-82WQ: Intel Core i7-8550U, 14.00", 1 kg
External Review » Acer Swift 5 SF514-52T-82WQ
Asus Zenbook UX430UA-GV259T: Intel Core i5-8250U, 14.00", 1.3 kg
External Review » Asus Zenbook UX430UA-GV259T
Lenovo ThinkPad T480-20L5000AMC: Intel Core i7-8550U, 14.00", 1.7 kg
External Review » Lenovo ThinkPad T480-20L5000AMC
Lenovo Yoga 920 Vibes Edition: Intel Core i7-8550U, 13.90", 1.4 kg
External Review » Lenovo Yoga 920 Vibes Edition
HP Spectre x360 13-ae010tu: Intel Core i7-8550U, 13.30", 1.3 kg
External Review » HP Spectre x360 13-ae010tu
Dell Latitude 15 5590-K7G13: Intel Core i7-8650U, 15.60", 2 kg
External Review » Dell Latitude 15 5590-K7G13
Dell Latitude 7390-XPWYP 2-in-1: Intel Core i5-8250U, 13.30", 1.4 kg
External Review » Dell Latitude 7390-XPWYP 2-in-1
Lenovo V330-15IKB-81AX00CCUK: Intel Core i7-8550U, 15.60", 1.8 kg
External Review » Lenovo V330-15IKB-81AX00CCUK
Fujitsu Lifebook P728, Core i7-8650U: Intel Core i7-8650U, 12.50", 1.2 kg
External Review » Fujitsu Lifebook P728, Core i7-8650U
Dell XPS 13 9370 i7 UHD: Intel Core i7-8550U, 13.30", 1.2 kg
External Review » Dell XPS 13 9370 i7 UHD
Fujitsu Lifebook E558, i5-8350U: Intel Core i5-8350U, 15.60", 2 kg
External Review » Fujitsu Lifebook E558, i5-8350U
Lenovo ThinkPad X280-20KF001GGE: Intel Core i7-8550U, 12.50", 1.1 kg
External Review » Lenovo ThinkPad X280-20KF001GGE
Dell Latitude 7390-93KC3: Intel Core i7-8650U, 13.30", 1.3 kg
External Review » Dell Latitude 7390-93KC3
Dell Latitude 5490-T5Y8D: Intel Core i7-8650U, 14.00", 1.7 kg
External Review » Dell Latitude 5490-T5Y8D
Lenovo Yoga 730-13: Intel Core i5-8250U, 13.30", 1.2 kg
External Review » Lenovo Yoga 730-13
Lenovo Yoga 530-14: Intel Core i5-8250U, 14.00", 1.6 kg
External Review » Lenovo Yoga 530-14
Toshiba Portege X30-E-12H: Intel Core i7-8650U, 13.30", 1.1 kg
External Review » Toshiba Portege X30-E-12H
Asus Zenbook Flip S UX370UA-C4331T: Intel Core i5-8250U, 13.30", 1.1 kg
External Review » Asus Zenbook Flip S UX370UA-C4331T
Acer Spin 5 SP513-52N-862L: Intel Core i7-8550U, 13.30", 1.5 kg
External Review » Acer Spin 5 SP513-52N-862L
Acer Aspire 5 A517-51-54UG: Intel Core i5-8250U, 17.30", 2.9 kg
External Review » Acer Aspire 5 A517-51-54UG
Samsung Notebook 7 Spin NP730QAA-K01US: Intel Core i5-8250U, 13.30", 1.5 kg
External Review » Samsung Notebook 7 Spin NP730QAA-K01US
Asus ZenBook Flip S UX370UA-C4217T: Intel Core i7-8550U, 13.30", 1.1 kg
External Review » Asus ZenBook Flip S UX370UA-C4217T
Lenovo ThinkPad X1 Carbon G6-20KG0027GE: Intel Core i7-8650U, 14.00", 1.3 kg
External Review » Lenovo ThinkPad X1 Carbon G6-20KG0027GE
Lenovo ThinkPad X1 Yoga 2018-20LD0017US: Intel Core i7-8650U, 14.00", 1.4 kg
External Review » Lenovo ThinkPad X1 Yoga 2018-20LD0017US
Lenovo ThinkPad X1 Carbon G6-20KG0039GE: Intel Core i7-8550U, 14.00", 1.1 kg
External Review » Lenovo ThinkPad X1 Carbon G6-20KG0039GE
Dell Latitude 5290 2-in-1: Intel Core i5-8350U, 12.30", 1.3 kg
External Review » Dell Latitude 5290 2-in-1
HP 15-bs127NS: Intel Core i5-8250U, 15.60", 1.9 kg
External Review » HP 15-BS127NS
HP Spectre 13-af033ng: Intel Core i7-8550U, 13.30", 1.1 kg
External Review » HP Spectre 13-af033ng
HP Probook 440 G5-2RS30EA: Intel Core i5-8250U, 14.00", 1.7 kg
External Review » HP Probook 440 G5-2RS30EA
HP ProBook 430 G5-2SY09EA: Intel Core i5-8250U, 13.30", 1.5 kg
External Review » HP ProBook 430 G5-2SY09EA
HP 15-bs119ns: Intel Core i5-8250U, 15.60", 1.9 kg
External Review » HP 15-bs119ns
Acer Swift 5 SF514-52T-54QZ: Intel Core i5-8250U, 14.00", 1 kg
External Review » Acer Swift 5 SF514-52T-54QZ
Acer Spin 3 SP314-51-53XS: Intel Core i5-8250U, 14.00", 1.7 kg
External Review » Acer Spin 3 SP314-51-53XS
Acer Swift 5 SF514-52T-565H: Intel Core i5-8250U, 14.00", 1 kg
External Review » Acer Swift 5 SF514-52T-565H
Lenovo ThinkPad T480s-20L8S02D00: Intel Core i5-8250U, 14.00", 1.4 kg
External Review » Lenovo ThinkPad T480s-20L8S02D00
HP ProBook 430 G5-3KY85EA: Intel Core i5-8250U, 13.30", 1.5 kg
External Review » HP ProBook 430 G5-3KY85EA
LG Gram 15Z980-A.AAS7U1: Intel Core i7-8550U, 15.60", 1.1 kg
External Review » LG Gram 15Z980-A.AAS7U1
Acer Spin 5 SP513-52N-58WW: Intel Core i5-8250U, 13.30", 1.5 kg
External Review » Acer Spin 5 SP513-52N-58WW
Dell Latitude 7390: Intel Core i5-8350U, 13.30", 1.3 kg
External Review » Dell Latitude 7390
Lenovo ThinkPad X1 Carbon 2018-20KGS03900: Intel Core i7-8550U, 14.00", 1.1 kg
External Review » Lenovo ThinkPad X1 Carbon 2018-20KGS03900
Asus ZenBook 13 UX331UA-EG013T: Intel Core i5-8250U, 13.30", 1.1 kg
External Review » Asus ZenBook 13 UX331UA-EG013T
Dell Inspiron 13-7373: Intel Core i5-8250U, 13.30", 1.5 kg
External Review » Dell Inspiron 13-7373
Dell Inspiron 15-7573: Intel Core i5-8250U, 15.60", 2.3 kg
External Review » Dell Inspiron 15-7573
Lenovo Thinkpad X1 Tablet Gen. 3 (2018): Intel Core i7-8550U, 13.00", 1.3 kg
External Review » Lenovo Thinkpad X1 Tablet Gen. 3 (2018)
Lenovo ThinkPad X1 Yoga 2018-20LES01W00: Intel Core i7-8550U, 14.00", 1.4 kg
External Review » Lenovo ThinkPad X1 Yoga 2018-20LES01W00
Lenovo Yoga 720-13IKB-81C3008RGE: Intel Core i5-8250U, 13.30", 1.3 kg
External Review » Lenovo Yoga 720-13IKB-81C3008RGE
Dell XPS 13 9370 FHD i5: Intel Core i5-8250U, 13.30", 1.2 kg
External Review » Dell XPS 13 9370 FHD i5
Dell Latitude 7390 2-in-1: Intel Core i7-8650U, 13.30", 1.4 kg
External Review » Dell Latitude 7390 2-in-1
HP Envy x360 15-bp180nz: Intel Core i7-8550U, 15.60", 2.1 kg
External Review » HP Envy x360 15-bp180nz
Acer Swift 5 SF514-52T-51MW: Intel Core i5-8250U, 14.00", 1 kg
External Review » Acer Swift 5 SF514-52T-51MW
Lenovo Yoga 920-13IKB-80Y7003JMX: Intel Core i5-8250U, 13.90", 1.4 kg
External Review » Lenovo Yoga 920-13IKB-80Y7003JMX
Asus ZenBook Flip 14 UX461UA-E1112T: Intel Core i7-8550U, 14.00", 1.4 kg
External Review » Asus ZenBook Flip 14 UX461UA-E1112T
HP Pavilion 15-ck003nb: Intel Core i5-8250U, 15.60", 1.9 kg
External Review » HP Pavilion 15-ck003nb
Acer Swift 5 SF514-52T-8673: Intel Core i7-8550U, 14.00", 1 kg
External Review » Acer Swift 5 SF514-52T-8673
Dell XPS 13 i5-8250U: Intel Core i5-8250U, 13.30", 1.3 kg
External Review » Dell XPS 13 i5-8250U
Dell XPS 13 CNX37001: Intel Core i5-8250U, 13.30", 1.2 kg
External Review » Dell XPS 13 CNX37001
HP Spectre 13-ae001nf x360: Intel Core i5-8250U, 13.30", 1.3 kg
External Review » HP Spectre 13-ae001nf x360
Lenovo Miix 520-12IKB 20M3000LGE: Intel Core i7-8550U, 12.20", 1.3 kg
External Review » Lenovo Miix 520-12IKB 20M3000LGE
HP Spectre 13-af030nd: Intel Core i7-8550U, 13.30", 1.1 kg
External Review » HP Spectre 13-af030nd
Lenovo Yoga 520-14IKBR-81C8005HMH: Intel Core i7-8550U, 14.00", 1.7 kg
External Review » Lenovo Yoga 520-14IKBR-81C8005HMH
Lenovo ThinkPad E580-20KSCTO1WW: Intel Core i5-8250U, 15.60", 1.9 kg
External Review » Lenovo ThinkPad E580-20KSCTO1WW
Lenovo Yoga 920-13IKB-80Y7003MX: Intel Core i7-8550U, 13.90", 1.4 kg
External Review » Lenovo Yoga 920-13IKB-80Y7003MX
Dell Inspiron 13-5379-9573: Intel Core i5-8250U, 13.30", 1.6 kg
External Review » Dell Inspiron 13-5379-9573
Acer Swift 5 SF514-52T-52ZU: Intel Core i5-8250U, 14.00", 1 kg
External Review » Acer Swift 5 SF514-52T-52ZU
HP Spectre 13-af008nc : Intel Core i7-8550U, 13.30", 1.1 kg
External Review » HP Spectre 13-af008nc
HP Pavilion 14-bf109ns: Intel Core i5-8250U, 14.00", 1.5 kg
External Review » HP Pavilion 14-bf109ns
HP Pavilion 14-ba135ns x360: Intel Core i5-8250U, 14.00", 1.6 kg
External Review » HP Pavilion 14-ba135ns x360
Dell Inspiron 13 7370: Intel Core i5-8250U, 13.30", 1.4 kg
External Review » Dell Inspiron 13 7370
HP Pavilion 15-ck000NS: Intel Core i5-8250U, 15.60", 1.8 kg
External Review » HP Pavilion 15-CK000NS
Lenovo Ideapad 520-15IKBR-81BF004GSP: Intel Core i7-8550U, 15.60", 2.2 kg
External Review » Lenovo Ideapad 520-15IKBR-81BF004GSP
Lenovo Yoga 920-13IKB-80Y80032CK Star Wars Special Edition: Galactic Empire: Intel Core i5-8250U, 13.90", 1.4 kg
External Review » Lenovo Yoga 920-13IKB-80Y80032CK Star Wars Special Edition: Galactic Empire
Samsung Notebook 9 Pro NP940X3N-K01US: Intel Core i7-8550U, 13.30", 1.3 kg
External Review » Samsung Notebook 9 Pro NP940X3N-K01US
Acer Swift 3 SF314-52-517Z: Intel Core i5-8250U, 14.00", 1.6 kg
External Review » Acer Swift 3 SF314-52-517Z
Dell XPS 13 9370, i7-8550U: Intel Core i7-8550U, 13.30", 1.2 kg
External Review » Dell XPS 13 9370, i7-8550U
Dell Inspiron 15 5579-9672: Intel Core i5-8250U, 15.60", 2.1 kg
External Review » Dell Inspiron 15 5579-9672
Dell Inspiron 13 5379-9658: Intel Core i7-8550U, 13.30", 1.7 kg
External Review » Dell Inspiron 13 5379-9658
Dell Inspiron 15 5579: Intel Core i7-8550U, 15.60", 2.1 kg
External Review » Dell Inspiron 15 5579
Dell Inspiron 13 7373-0866: Intel Core i7-8550U, 13.30", 1.5 kg
External Review » Dell Inspiron 13 7373-0866
HP Spectre x360 13-ae041ng: Intel Core i7-8550U, 13.30", 1.3 kg
External Review » HP Spectre x360 13-ae041ng
Asus ZenBook UX430UA-GV334T: Intel Core i5-8250U, 14.00", 1.3 kg
External Review » Asus ZenBook UX430UA-GV334T
Lenovo Ideapad 720S-13IKB: Intel Core i5-8250U, 13.30", 1.1 kg
External Review » Lenovo Ideapad 720S-13IKB
Lenovo ThinkPad X1 Carbon G6-20KG0025UK: Intel Core i5-8250U, 14.00", 1.1 kg
External Review » Lenovo ThinkPad X1 Carbon G6
Dell XPS 13 9370 i5 UHD: Intel Core i5-8250U, 13.30", 1.2 kg
External Review » Dell XPS 13 9370 i5 UHD
Dell Inspiron 13 5379-9573: Intel Core i5-8250U, 13.30", 1.7 kg
External Review » Dell Inspiron 13 5379-9573
HP Envy 13-ad106ns: Intel Core i5-8250U, 13.30", 1.2 kg
External Review » HP Envy 13-ad106ns
Asus ZenBook Flip S UX370UA-C4184T: Intel Core i7-8550U, 13.30", 1.1 kg
External Review » Asus ZenBook Flip S UX370UA-C4184T
Asus ZenBook UX430UA-GV266T: Intel Core i7-8550U, 14.00", 1.3 kg
External Review » Asus ZenBook UX430UA-GV266T
Lenovo Miix 520-12IKB 81CG: Intel Core i5-8250U, 12.20", 1.2 kg
External Review » Lenovo Miix 520-12IKB 81CG
Lenovo Yoga 920 13-80Y70066US: Intel Core i7-8550U, 13.90", 1.4 kg
External Review » Lenovo Yoga 920 14-80Y70066US
HP Spectre 13-Af008Ur: Intel Core i7-8550U, 13.30", 1.1 kg
External Review » HP Spectre 13-Af008Ur
HP ProBook 430 G5: Intel Core i7-8550U, 13.30", 1.4 kg
External Review » HP ProBook 430 G5
HP Spectre 13-AF000no : Intel Core i5-8250U, 13.30", 1.1 kg
External Review » HP Spectre 13-AF000no
Lenovo Yoga 920-13-80Y70058CK: Intel Core i7-8550U, 13.90", 1.4 kg
External Review » Lenovo Yoga 920-13-80Y70058CK
Lenovo Yoga 920-13-80Y7007RMX: Intel Core i7-8550U, 13.90", 1.4 kg
External Review » Lenovo Yoga 920-13-80Y7007RMX
HP Envy 13t-1YU00AV: Intel Core i7-8550U, 13.30", 1.3 kg
External Review » HP Envy 13t-1YU00AV
Dell Inspiron 13-7370 2-in-1: Intel Core i5-8250U, 13.30", 1.5 kg
External Review » Dell Inspiron 13-7370 2-in-1
Asus ZenBook UX330UA-AH55: Intel Core i5-8250U, 13.30", 1.2 kg
External Review » Asus ZenBook UX330UA-AH55
Asus ZenBook UX430UA-DH74: Intel Core i7-8550U, 14.00", 1.3 kg
External Review » Asus ZenBook UX430UA-DH74
HP Spectre 13-af006nf: Intel Core i7-8550U, 13.30", 1.1 kg
External Review » HP Spectre 13-af006nf
Razer Blade Stealth QHD i7-8550U: Intel Core i7-8550U, 13.30", 1.4 kg
External Review » Razer Blade Stealth QHD i7-8550U
Acer Swift 3 SF314-52-55UF: Intel Core i5-8250U, 14.00", 1.6 kg
External Review » Acer Swift 3 SF314-52-55UF
HP Envy 13-ad101ns: Intel Core i5-8250U, 13.30", 1.4 kg
External Review » HP Envy 13-ad101ns
HP Envy 13-ad112nd: Intel Core i5-8250U, 13.30", 1.3 kg
External Review » HP Envy 13-ad112nd
Acer Spin 5 SP515-51N-54WQ: Intel Core i5-8250U, 15.60", 2.2 kg
External Review » Acer Spin 5 SP515-51N-54WQ
Acer Spin 5 SP513-52N-856S: Intel Core i7-8550U, 13.30", 1.6 kg
External Review » Acer Spin 5 SP513-52N-856S
HP Spectre 13-ae006no x360: Intel Core i7-8550U, 13.30", 1.3 kg
External Review » HP Spectre 13-ae006no x360
Dell Inspiron 13 7373: Intel Core i7-8550U, 13.30", 1.5 kg
External Review » Dell Inspiron 13 7373
Dell XPS 13 9360R MMH8D: Intel Core i7-8550U, 13.30", 1.2 kg
External Review » Dell XPS 13 9360R MMH8D
Asus Vivobook S15 S510UA-BR409T: Intel Core i5-8250U, 15.60", 1.5 kg
External Review » Asus Vivobook S15 S510UA-BR409T
HP Spectre 13-ae001ns x360: Intel Core i7-8550U, 13.30", 1.3 kg
External Review » HP Spectre 13-ae001ns x360
HP Spectre 13-af002ng: Intel Core i7-8550U, 13.30", 1.1 kg
External Review » HP Spectre 13-af002ng
HP Spectre x360 13-ae010nd: Intel Core i7-8550U, 13.30", 1.3 kg
External Review » HP Spectre x360 13-ae010nd
Dell XPS 13 9360 CNX93R02: Intel Core i7-8550U, 13.30", 1.2 kg
External Review » Dell XPS 13 9360 CNX93R02
Lenovo Ideapad 520s-14IKB-81BL005RMH: Intel Core i5-8250U, 14.00", 1.7 kg
External Review » Lenovo Ideapad 520s-14IKB-81BL005RMH
Dell XPS 13 9360-5563: Intel Core i7-8550U, 13.30", 1.3 kg
External Review » Dell XPS 13 9360-5563
Lenovo IdeaPad 320s-13IKB 81AK001VRK: Intel Core i5-8250U, 13.30", 1.2 kg
External Review » Lenovo IdeaPad 320s-13IKB 81AK001VRK
Asus ZenBook 3 Deluxe UX490UAR-BE087T: Intel Core i7-8550U, 14.00", 1.2 kg
External Review » Asus ZenBook 3 Deluxe UX490UAR-BE087T
Dell XPS 13 i7-8550U: Intel Core i7-8550U, 13.30", 1.3 kg
External Review » Dell XPS 13 i7-8550U
Dell Xps 13 9360-9962: Intel Core i7-8550U, 13.30", 1.2 kg
External Review » Dell Xps 13 9360-9962
Lenovo Yoga 920-13IKB-80Y7: Intel Core i7-8550U, 13.90", 1.4 kg
External Review » Lenovo Yoga 920-13IKB-80Y7
Acer Spin 5 SP515-51N: Intel Core i5-8250U, 15.60", 2.2 kg
External Review » Acer Spin 5 SP515-51N
Dell Inspiron 13 7370-9665: Intel Core i5-8250U, 13.30", 1.4 kg
External Review » Dell Inspiron 13-7370-9665
Lenovo Yoga 920-13IKB-80Y70035GE: Intel Core i7-8550U, 13.90", 1.4 kg
External Review » Lenovo Yoga 920-13IKB-80Y70035GE
Acer Spin 5 SP513-52N-566U: Intel Core i5-8250U, 13.30"
External Review » Acer Spin 5 SP513-52N-566U
Acer Swift 5 SF514-52T-59HY: Intel Core i5-8250U, 14.00", 1 kg
External Review » Acer Swift 5 SF514-52T-59HY
Acer Swift 3 SF314-52-584F : Intel Core i5-8250U, 14.00", 1.7 kg
External Review » Acer Swift 3 SF314-52-584F
Acer Spin 5 SP513-52N-566U: Intel Core i5-8250U, 13.30"
Article » Intel 8th gen Kaby Lake-R vs 7th gen Kaby Lake performance comparison
Lenovo Yoga 730-13IKB: Intel Core i7-8550U, 13.30", 1.2 kg
» YouTuber puts mechanical keyboard in his 13-inch Lenovo Yoga laptop after original one failed twice
Lenovo Yoga 730-13IKB-81CT: Intel Core i5-8250U, 13.30", 1.2 kg
» YouTuber puts mechanical keyboard in his 13-inch Lenovo Yoga laptop after original one failed twice
Lenovo IdeaPad Flex 5 CB 13IML05 82B80010GE: Intel Core i5-10210U, 13.30", 1.4 kg
» Lenovo Ideapad Flex 5 CB 13ILM05: 2-in-1 Chromebook with a replaceable SSD
Acer Chromebook Spin 713 CP713-2W-560V: Intel Core i5-10210U, 13.50", 1.4 kg
» Acer Chromebook Spin 713: 2-in-1 Chromebook with 3 video outputs
Dell Latitude 12 7210 2-in-1: Intel Core i7-10610U, 12.30", 0.9 kg
» Dell's Surface Pro 7 competitor ranges from quiet to silent
HP EliteBook x360 1040 G7, i7-10810U: Intel Core i7-10810U, 14.00", 1.4 kg
» The HP EliteBook x360 1040 G7 is one of the best convertibles money can buy if you don't care about its weak UHD graphics
Dell Latitude 5310-23VP6: Intel Core i5-10310U, 13.30", 1.3 kg
» Dell's Latitude 5310 2-in-1 surpasses the 11-hour mark
Dell Latitude 15 3510 NK2MC: Intel Core i3-10110U, 15.60", 1.9 kg
» Dell equips its Latitude 3510 with a disappointing display
HP EliteBook x360 1030 G7: Intel Core i7-10810U, 13.30", 1.2 kg
» The EliteBook x360 1030 G7 is one of HP's best subnotebook convertibles, but it's time to make the jump to 16:10
Lenovo Yoga Duet 7 13IML05-82AS000WGE: Intel Core i5-10210U, 13.00", 1.2 kg
» Lenovo Yoga Duet 7 can't keep up with the Microsoft Surface Pro 7's price-to-performance ratio
Dell Latitude 14 5410-RJ80D: Intel Core i5-10310U, 14.00", 1.6 kg
» The Dell Latitude 14 5410 is a great work tool - but unfortunately it doesn't offer an AMD Ryzen 4000 option
Dell Latitude 5310-GXX0D: Intel Core i5-10310U, 13.30", 1.2 kg
» Dell is mainly doing a model update with the Latitude 5310
Dell Latitude 15 5510-D90XK: Intel Core i5-10310U, 15.60", 1.8 kg
» Dell Latitude 15 5510: Either-or with mass storage
Lenovo ThinkBook Plus 13 i7: Intel Core i7-10510U, 13.30", 1.4 kg
» Lenovo ThinkBook Plus does not have much to offer besides its e-ink display
Lenovo ThinkPad X13 Yoga 20SX0004GE: Intel Core i7-10510U, 13.30", 1.3 kg
» ThinkPad X13 Yoga: Intel update wouldn't have been necessary this year
HP EliteBook 830 G7: Intel Core i7-10810U, 13.30", 1.3 kg
» HP EliteBook 830 G7 impresses in almost every aspect except one
Asus VivoBook 17 F712FA-AU518T: Intel Core i5-10210U, 17.30", 2.3 kg
» The Asus VivoBook 17 F712FA only has a weak battery
Dell Latitude 14 9410 2-in-1 P110G: Intel Core i7-10610U, 14.00", 1.5 kg
» Dell Latitude 9410 2-in-1 or HP EliteBook x360? One factor might be the deal breaker
Acer TravelMate P6 P614-51T-G2-72ZU: Intel Core i7-10510U, 14.00", 1.2 kg
» Business laptop with touchscreen display: The Acer TravelMate P6 P614-51T-G2
Acer TravelMate P215-52: Intel Core i7-10510U, 15.60", 1.8 kg
» Humiliatingly for Intel, an underperforming Core i7-10510U runs slower than the two-year old Core i5-8250U
Lenovo ThinkPad X13-20T20033GE: Intel Core i5-10210U, 13.30", 1.3 kg
» Lenovo ThinkPad X13: nothing new even with the new Intel CPU
Lenovo ThinkPad T14s-20T00044GE: Intel Core i5-10210U, 14.00", 1.3 kg
» Review of the ThinkPad T14s with an Intel Comet Lake chip also highlights AMD's supremacy
Samsung Galaxy Book Ion 13.3: Intel Core i5-10210U, 13.30", 1 kg
» Samsung Galaxy Book Ion 13.3: Small, But Noisy
Lenovo ThinkPad X1 Carbon 2020-20U9003BGE: Intel Core i7-10510U, 14.00", 1.1 kg
» Lenovo ThinkPad X1 Carbon 2020: The 4K display suffers from PWM flickering
Lenovo ThinkPad X1 Yoga 2020-20UCS03S00: Intel Core i7-10510U, 14.00", 1.3 kg
» Testing out the Lenovo ThinkPad X1 Yoga 2020 Laptop with a Comet Lake U SoC
Dell Latitude 9510 2-in-1: Intel Core i7-10810U, 15.00", 1.7 kg
» Our first Core i7-10810U benchmarks are in and they are not great
Lenovo ThinkPad X13-20T20033GE: Intel Core i5-10210U, 13.30", 1.3 kg
» First benchmarks: AMD Ryzen 4000 excels in the Lenovo ThinkPad X13 Gen 1
Dell Latitude 7310: Intel Core i7-10610U, 13.30", 1.2 kg
» Older Dell Latitude 7300 Core i7 runs just as fast as the newer Latitude 7310 Core i7
Lenovo ThinkPad T14-20S1S06B00: Intel Core i5-10210U, 14.00", 1.5 kg
» Lenovo ThinkPad T14 with Intel CPU runs very hot in the test
Fujitsu Lifebook U939 i5: Intel Core i5-8265U, 13.30", 0.9 kg
» Fujitsu Lifebook U939: An ultra-light business laptop
Dell Latitude 7410: Intel Core i7-10610U, 14.00", 1.4 kg
» Dell Latitude 7410 vs. Latitude 7400: Is Newer Really Better?
Durabook R11: Intel Core i5-8250U, 11.60", 1.2 kg
» Durabook re-launches the fully-rugged Durabook R11 tablet for a starting price of $1849 USD
Huawei MateBook 13 2020 i5: Intel Core i5-10210U, 13.00", 1.3 kg
» MateBook 13: This is the best chipset for the Huawei laptop
Lenovo ThinkPad X1 Carbon 2020-20UAS04T00: Intel Core i7-10510U, 14.00", 1.1 kg
» Lenovo ThinkPad X1 Carbon 2020: Just get the 2019 model and save some money
Asus VivoBook 17 S712FA-DS76: Intel Core i7-10510U, 17.30", 2.3 kg
» When fast actually means slow: some Asus VivoBook 17 laptops may be suffering from a huge performance bug
Lenovo ThinkPad T14-20S1S06B00: Intel Core i5-10210U, 14.00", 1.5 kg
» Lenovo's new ThinkPads T14 & T15 without working Turbo Boost
HP Envy x360 15-dr1679cl: Intel Core i7-10510U, 15.60", 2.1 kg
» The HP Envy x360 15 makes it way too difficult for owners to add more RAM
Lenovo ThinkPad X1 Carbon 2020-20UAS04T00: Intel Core i7-10510U, 14.00", 1.1 kg
» Overview of upcoming ThinkPad reviews for the next couple of weeks
Huawei MateBook 13 2020 i5: Intel Core i5-10210U, 13.00", 1.3 kg
» Huawei wastes potential with the MateBook 13 2020
Asus ZenBook Flip 14 UX463FA-AI039T: Intel Core i5-10210U, 14.00", 1.4 kg
» Asus ZenBook Flip 14: Quality for less than 1,000 Euros
Asus ExpertBook B9450FA, i7-10510U: Intel Core i7-10510U, 14.00", 1 kg
» Asus ExpertBook B9: Ultra light comes at a price
Dynabook Portege X30L-G1331: Intel Core i5-10210U, 13.30", 0.9 kg
» Dynabook Portege X30L-G is one of the lightest Comet Lake-U laptops you can get right now
HP 17-by2437ng: Intel Core i3-10110U, 17.30", 2.4 kg
» Dark, Poor Contrast, Unstable Viewing Angles - The display of the HP 17 disappoints
Lenovo ThinkPad X1 Yoga 20SA000GUS: Intel Core i7-10510U, 14.00", 1.3 kg
» PSA: Check your Lenovo ThinkPad X1 Yoga for light bleed and dead pixels
LG Gram 14T90N: Intel Core i7-10510U, 14.00", 1.2 kg
» Apparently, LG thinks it's okay to sell a 10th gen Core i7 laptop that's slower than the 7th gen Core i5 model
HP Elite Dragonfly-8MK79EA: Intel Core i5-8265U, 13.30", 1.1 kg
» HP's Elite Dragonfly is a very good business convertible
Lenovo ThinkPad X1 Carbon G7 20R1-000YUS: Intel Core i7-10510U, 14.00", 1.2 kg
» PSA: Update your Lenovo ThinkPad X1 Carbon BIOS or be prepared to wait 6 hours for a full charge
HP EliteBook x360 1030 G4 7YL44EA: Intel Core i7-8565U, 13.30", 1.3 kg
» HP EliteBook x360 1030 G4: When security hampers productivity
Lenovo ThinkPad L13 Yoga 20R6S00800: Intel Core i5-10210U, 13.30", 1.4 kg
» Lenovo ThinkPad L13 Yoga - business convertible with slight weaknesses
Lenovo ThinkPad T490 20RY0002US: Intel Core i7-10510U, 14.00", 1.5 kg
» Buying a Lenovo ThinkPad T490? Skip the 2020 model and go with the 2019 model instead
Lenovo ThinkPad E14 20RA001MGE: Intel Core i5-10210U, 14.00", 1.6 kg
» Thinner design of the Lenovo ThinkPad E14 costs features
Lenovo Yoga C740-14IML: Intel Core i5-10210U, 14.00", 1.4 kg
» Lenovo Yoga C740-14: Great mid-ranger but with spongy keys
Lenovo ThinkBook 14-IML-20RV006TGE: Intel Core i5-10210U, 14.00", 1.6 kg
» Lenovo ThinkBook 14 drops the display ball
Acer Extensa 15 EX215-51-56UX: Intel Core i5-10210U, 15.60", 1.9 kg
» Only single-channel RAM - review of the Acer Extensa 15 EX215-51
HP Pavilion x360 14-dh1153ng: Intel Core i5-10210U, 14.00", 1.6 kg
» The HP Pavilion x360 14-dh convertible supports the HP Pen that can be purchased separately
Acer Aspire 5 A514-52: Intel Core i5-10210U, 14.00", 1.7 kg
» Acer Aspire 5 with Core i5 Comet Lake-U might have a huge performance bug
HP Pavilion x360 15-dq0065cl: Intel Core i7-8565U, 15.60", 1.9 kg
» We wasted $1000 on a HP Pavilion x360 15 so you don't have to
Lenovo ThinkBook 15 : Intel Core i5-10210U, 15.60", 1.9 kg
» Lenovo ThinkBook 15: A budget Comet Lake office laptop that falls short of expectations
Lenovo ThinkPad X1 Carbon 2019-20QD00M7GE: Intel Core i5-8265U, 14.00", 1.2 kg
» Lenovo's Privacy Guard ePrivacy Filter is not very effective
Lenovo ThinkPad L580-20LW000VGE: Intel Core i5-8250U, 15.60", 2 kg
» Lenovos ThinkPad L580 is a good office notebook
HP Elite Dragonfly i5-8365U: Intel Core i5-8365U, 13.30", 1 kg
» HP Elite Dragonfly is a beautified EliteBook x360 1030, will offer features missing on the Dell XPS 13 7390 2-in-1
Lenovo ThinkPad T490s-20NYS02A00: Intel Core i5-8265U, 14.00", 1.3 kg
» ThinkPad T490s and X390: Brighter, more accurate and better contrast
Lenovo ThinkPad X1 Carbon 2018-20KGS5DU00: Intel Core i7-8550U, 14.00", 1.1 kg
» The best display for the ThinkPad X1 Carbon – All panels in comparison
Dell XPS 13 9370 i5 UHD: Intel Core i5-8250U, 13.30", 1.2 kg
» The XPS 13 9370 has some of the slowest display response times for an Ultrabook