Dell Latitude 7390 2-in-1 (i7-8650U, FHD) Convertible Review
As the trend toward more stylish and luxurious business-grade laptops continues to gain momentum, we’ve witnessed even more mainstream traits finding integration in the business segment. In keeping with this tangible shift, the 2018 follow-up to Dell’s well-received Latitude 7380 (or, more accurately, the Latitude 7389) comes in two different flavors: a conventional laptop (the Latitude 7390) and a Yoga-esque convertible in the vein of the XPS 13 2-in-1, appropriately renamed the Latitude 7390 2-in-1. Today, we’ve got the latter in our labs for testing. How does it stand up to the rigors of everyday business life?
One thing is for certain: this $2,109 device is not for the financially faint of heart. This is, as are its other 7000-series counterparts, a top-quality business-grade workhorse built to handle the usual tasks with ease and offer all the maintainability and connectivity expected of laptops in its class. Inside our review unit, we find an Intel Core i7-8650U CPU, 16 GB of LPDDR3 RAM, a 500 GB NVMe SSD, and an FHD (1920x1080) IPS touchscreen display.
A few top competitors include the Lenovo ThinkPad X1 Carbon 2018, Toshiba Portege A30-D-139, and Asus ZenBook 13 UX331UN. The Latitude 7390 2-in-1 is the smallest of the bunch—but can it match the performance of its peers?
Case
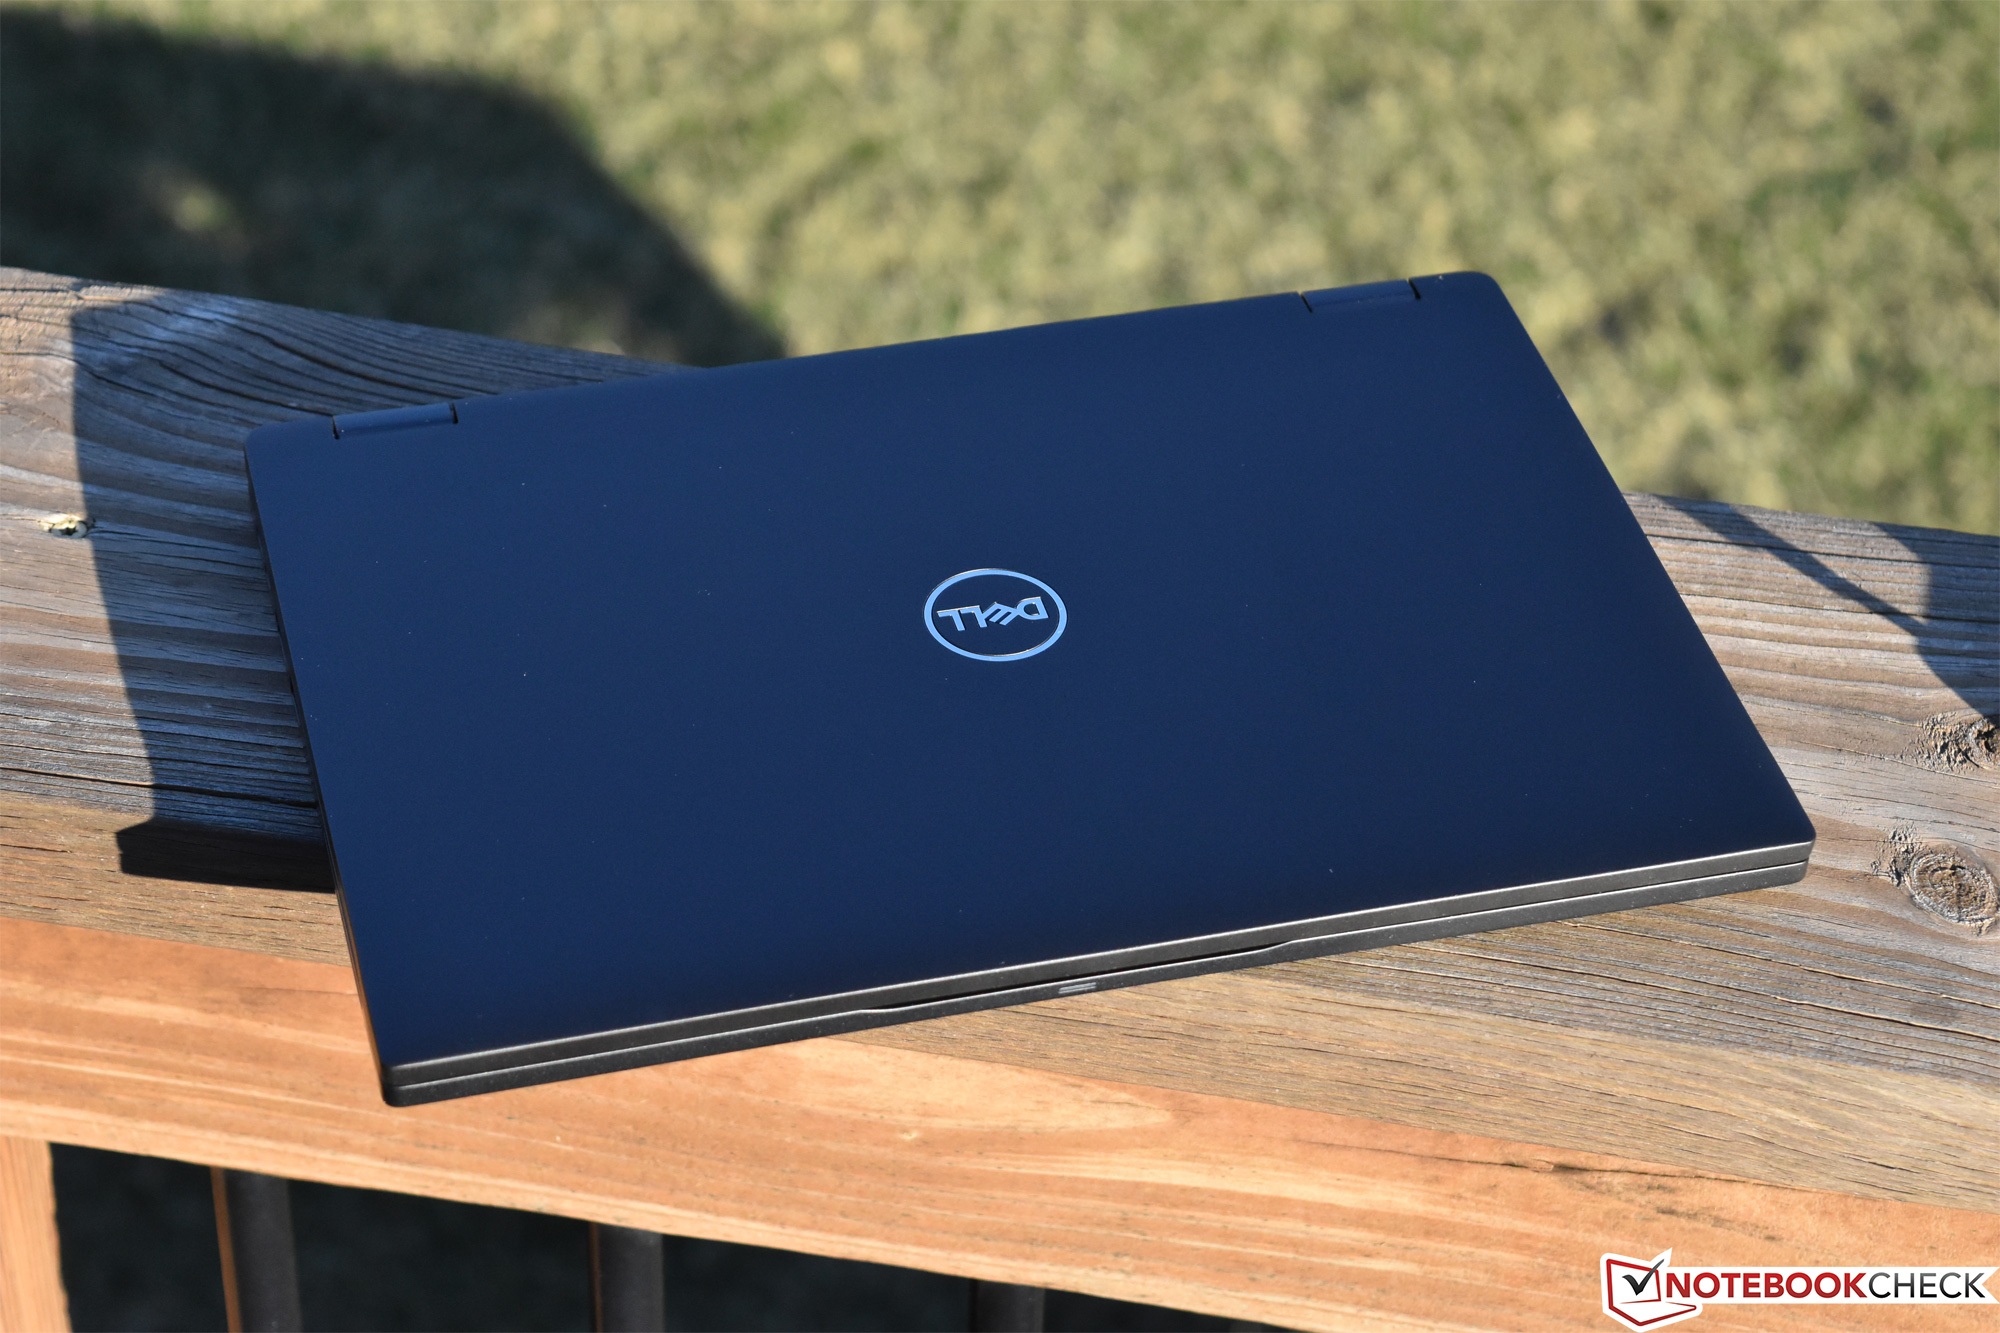
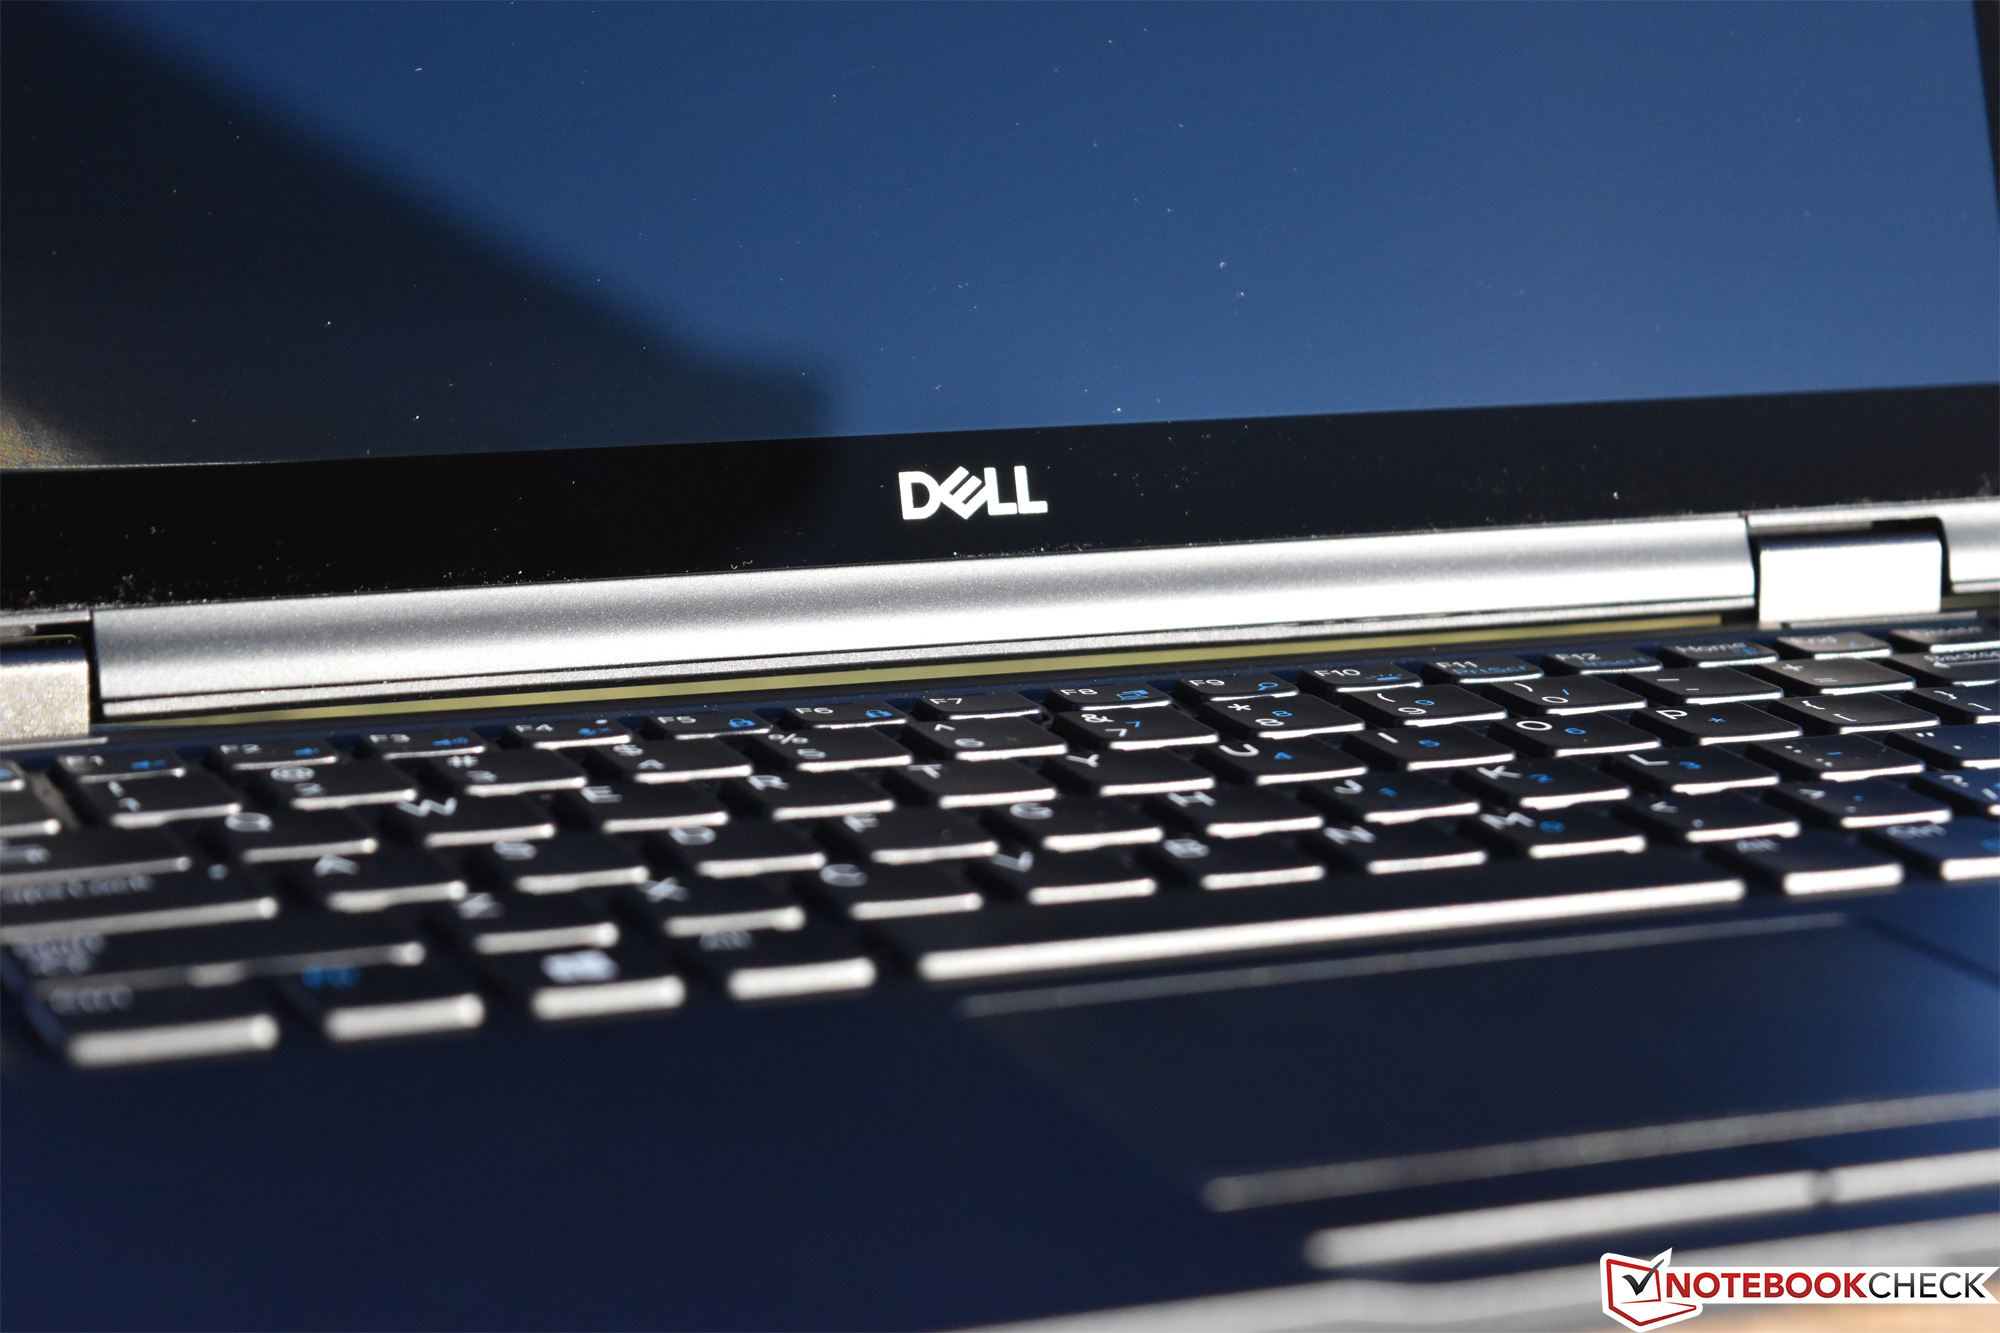
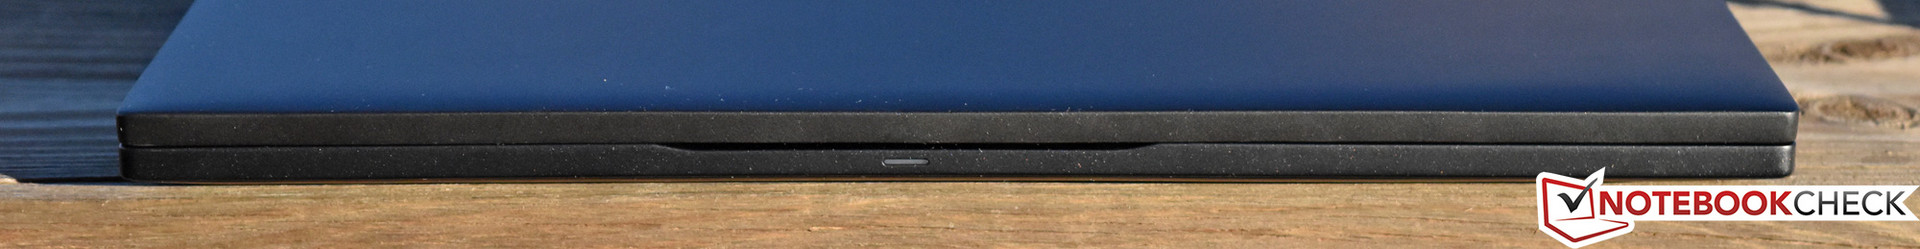
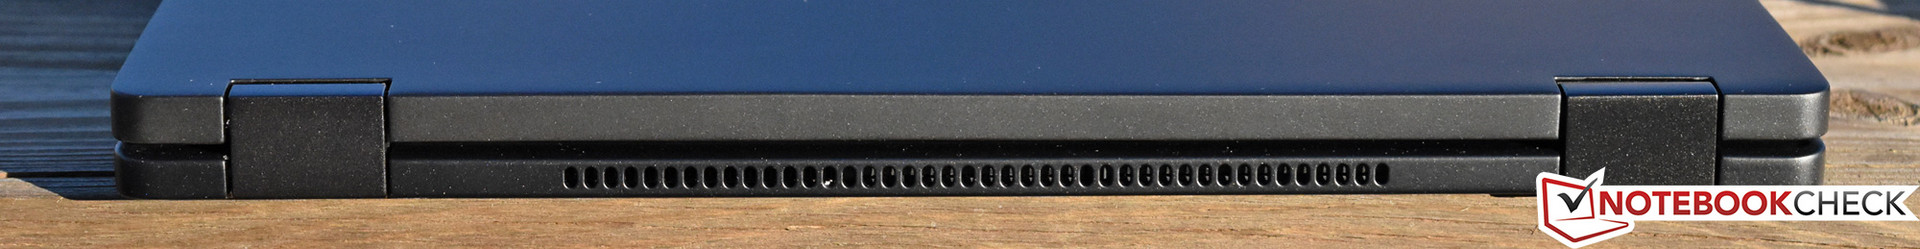
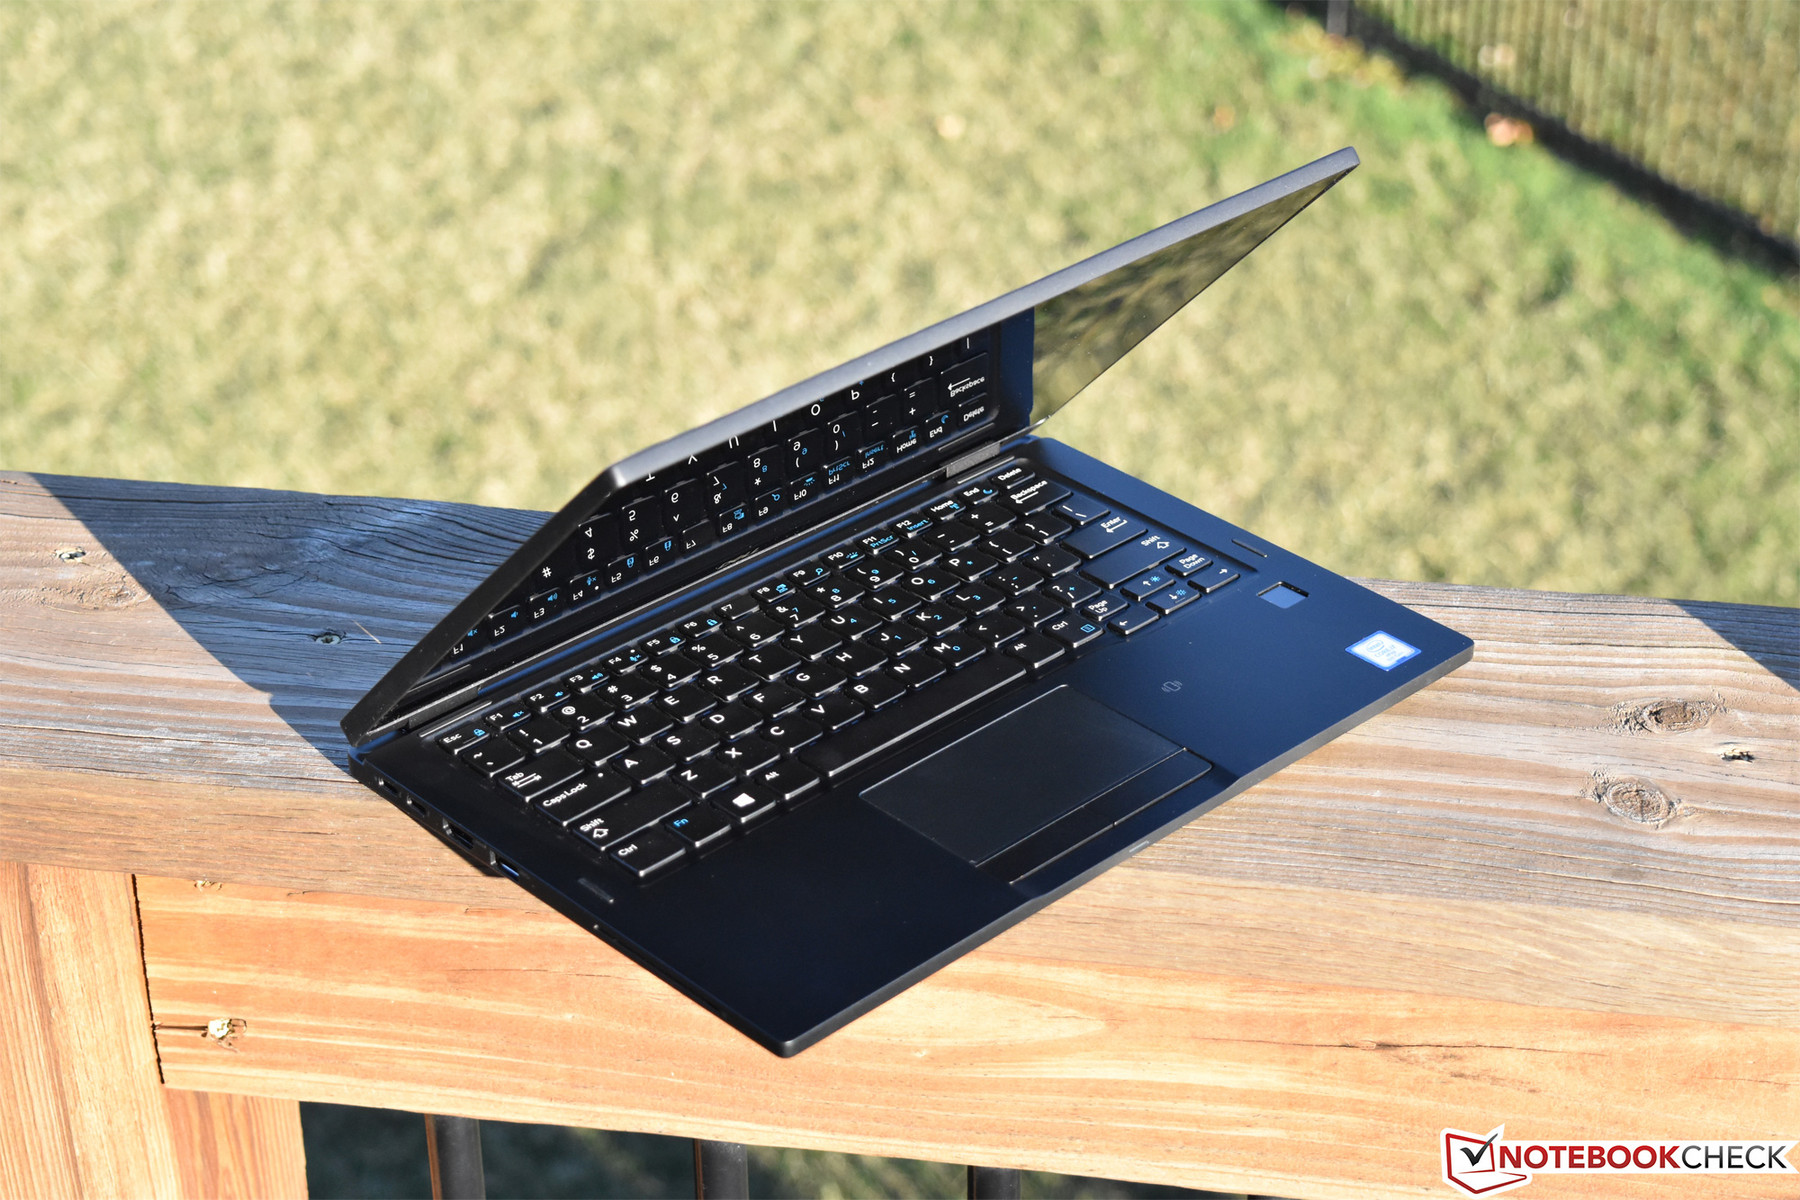
Built from sturdy magnesium and coated with Dell’s familiar soft-touch matte black paint, the 7390 2-in-1 certainly fits in with its brethren right from the first glance. As previously mentioned, it’s more of an update of the Latitude 7389 2-in-1 than it is a direct successor to the 7380 (the vanilla Latitude 7390 assumes that lofty responsibility instead). Like the XPS 13 laptops, although newer Latitude machines have adopted the central hinge design, the 2-in-1 flavors necessarily maintain more conventional split hinges. A few other telltale artifacts of the design also separate the 2-in-1 from its traditional siblings—most notably, rubber pads on the top of the base unit to help protect the unit when positioned in Stand Mode, a couple of minor modifications to the underside, and a much thicker display lid that comprises nearly half the total height of the laptop.
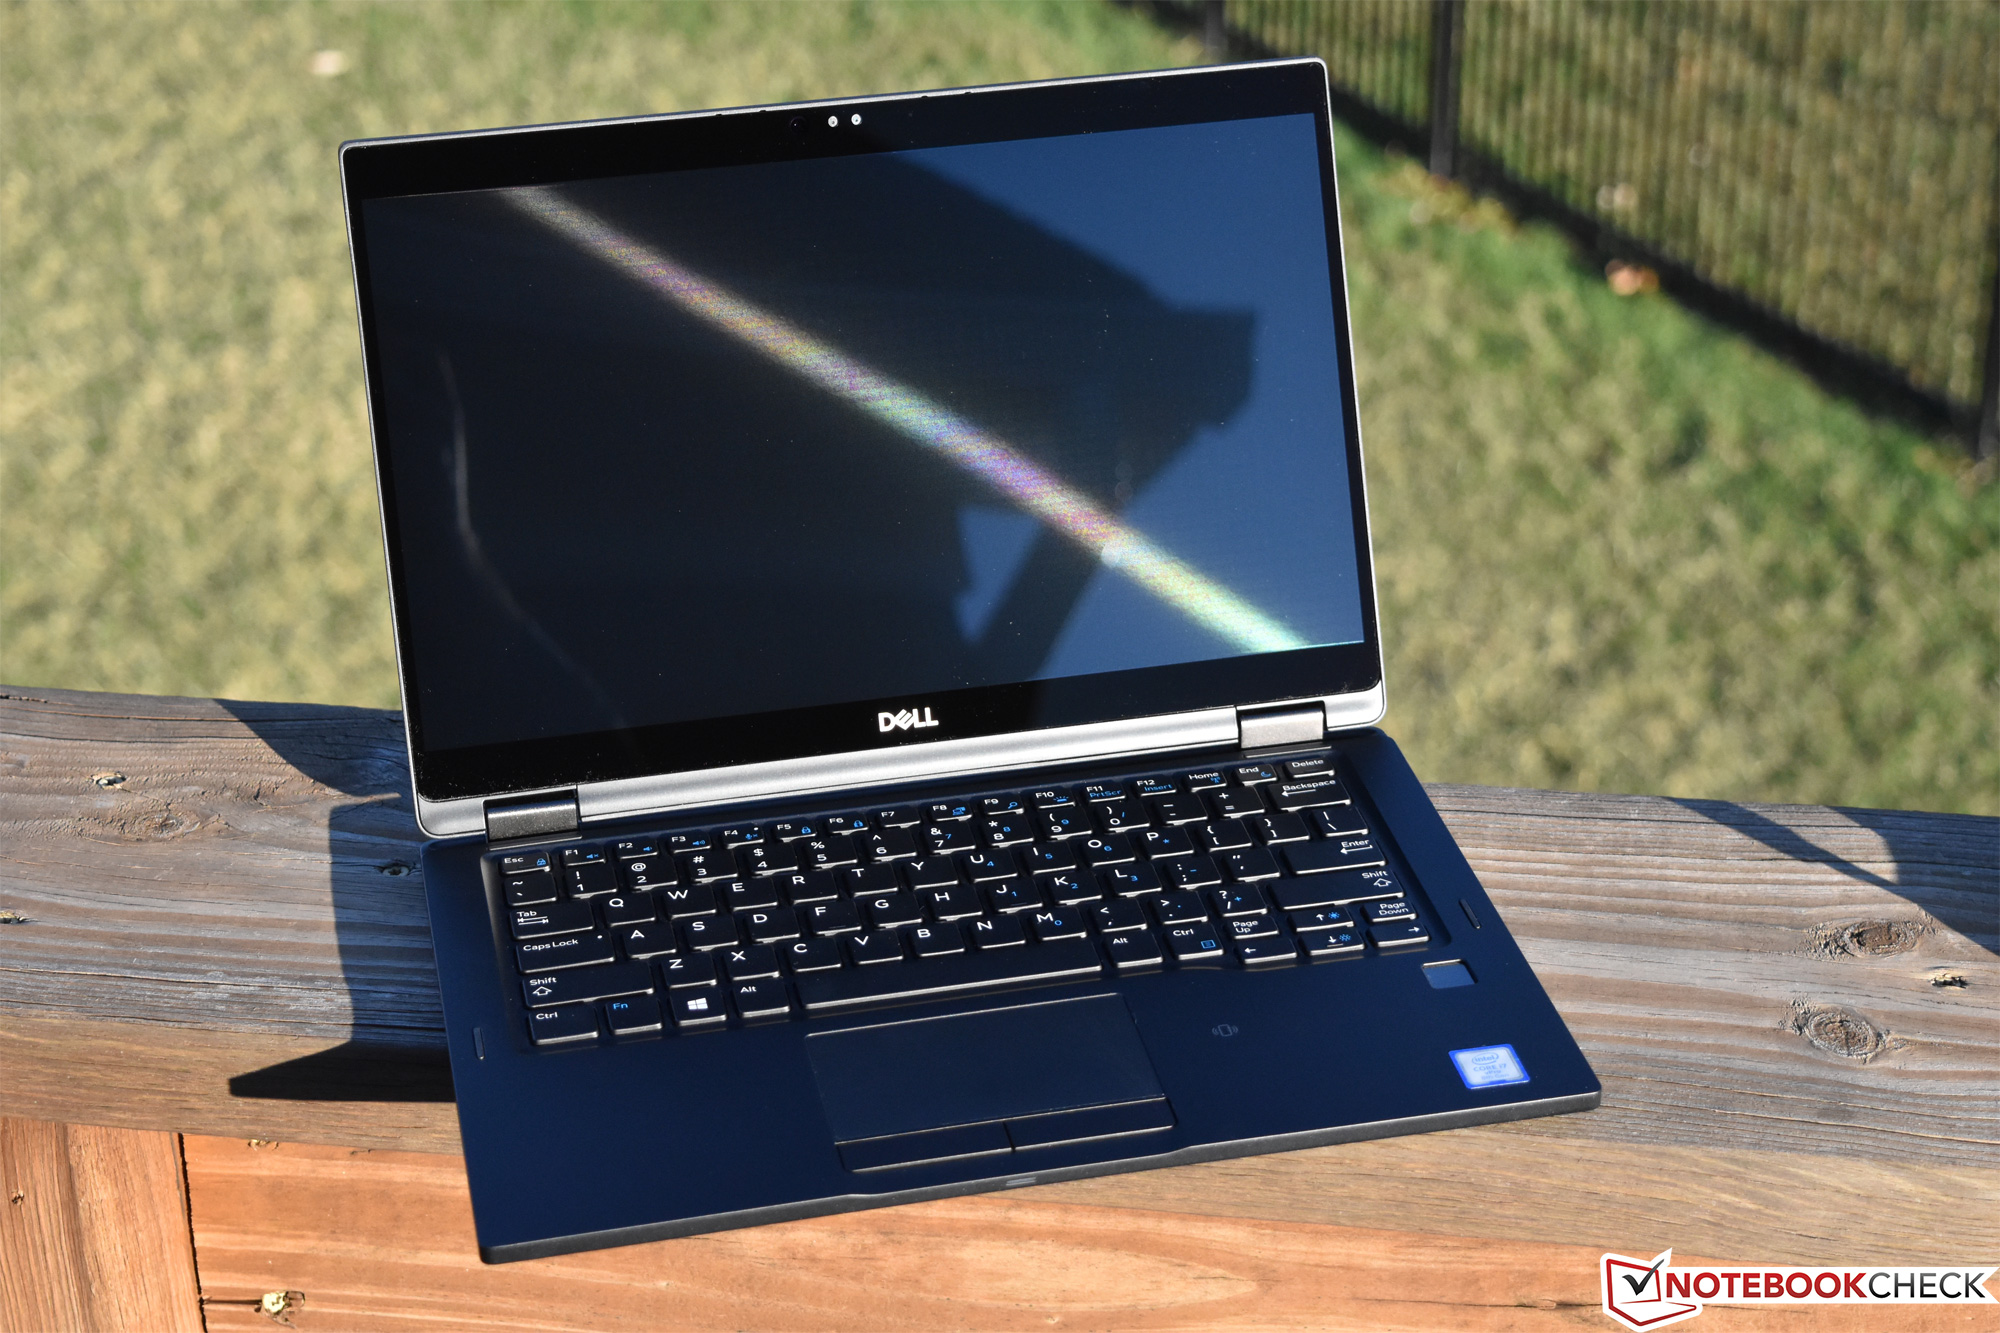
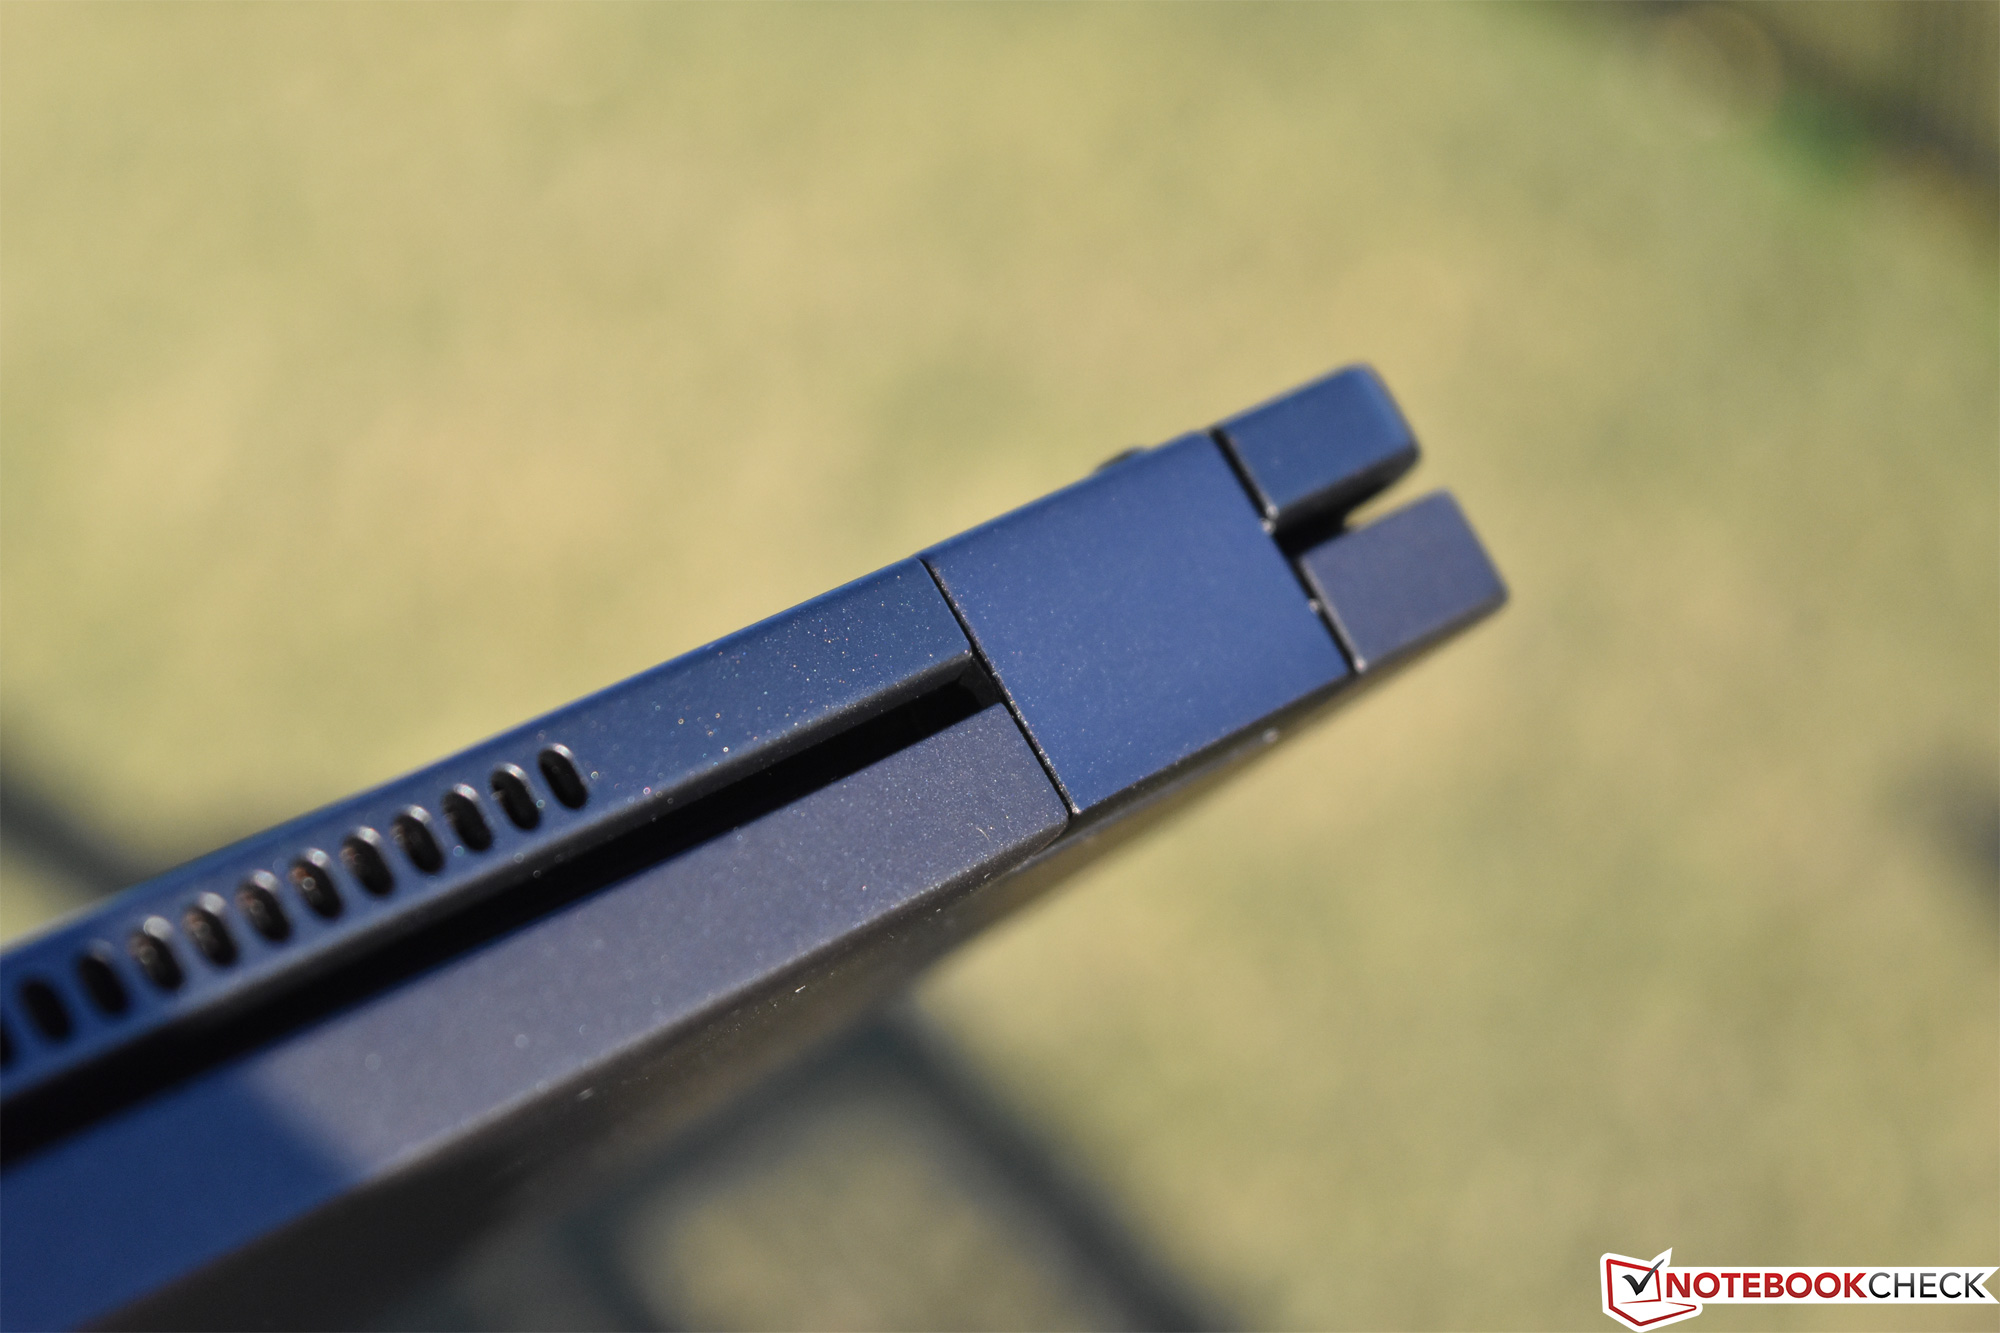
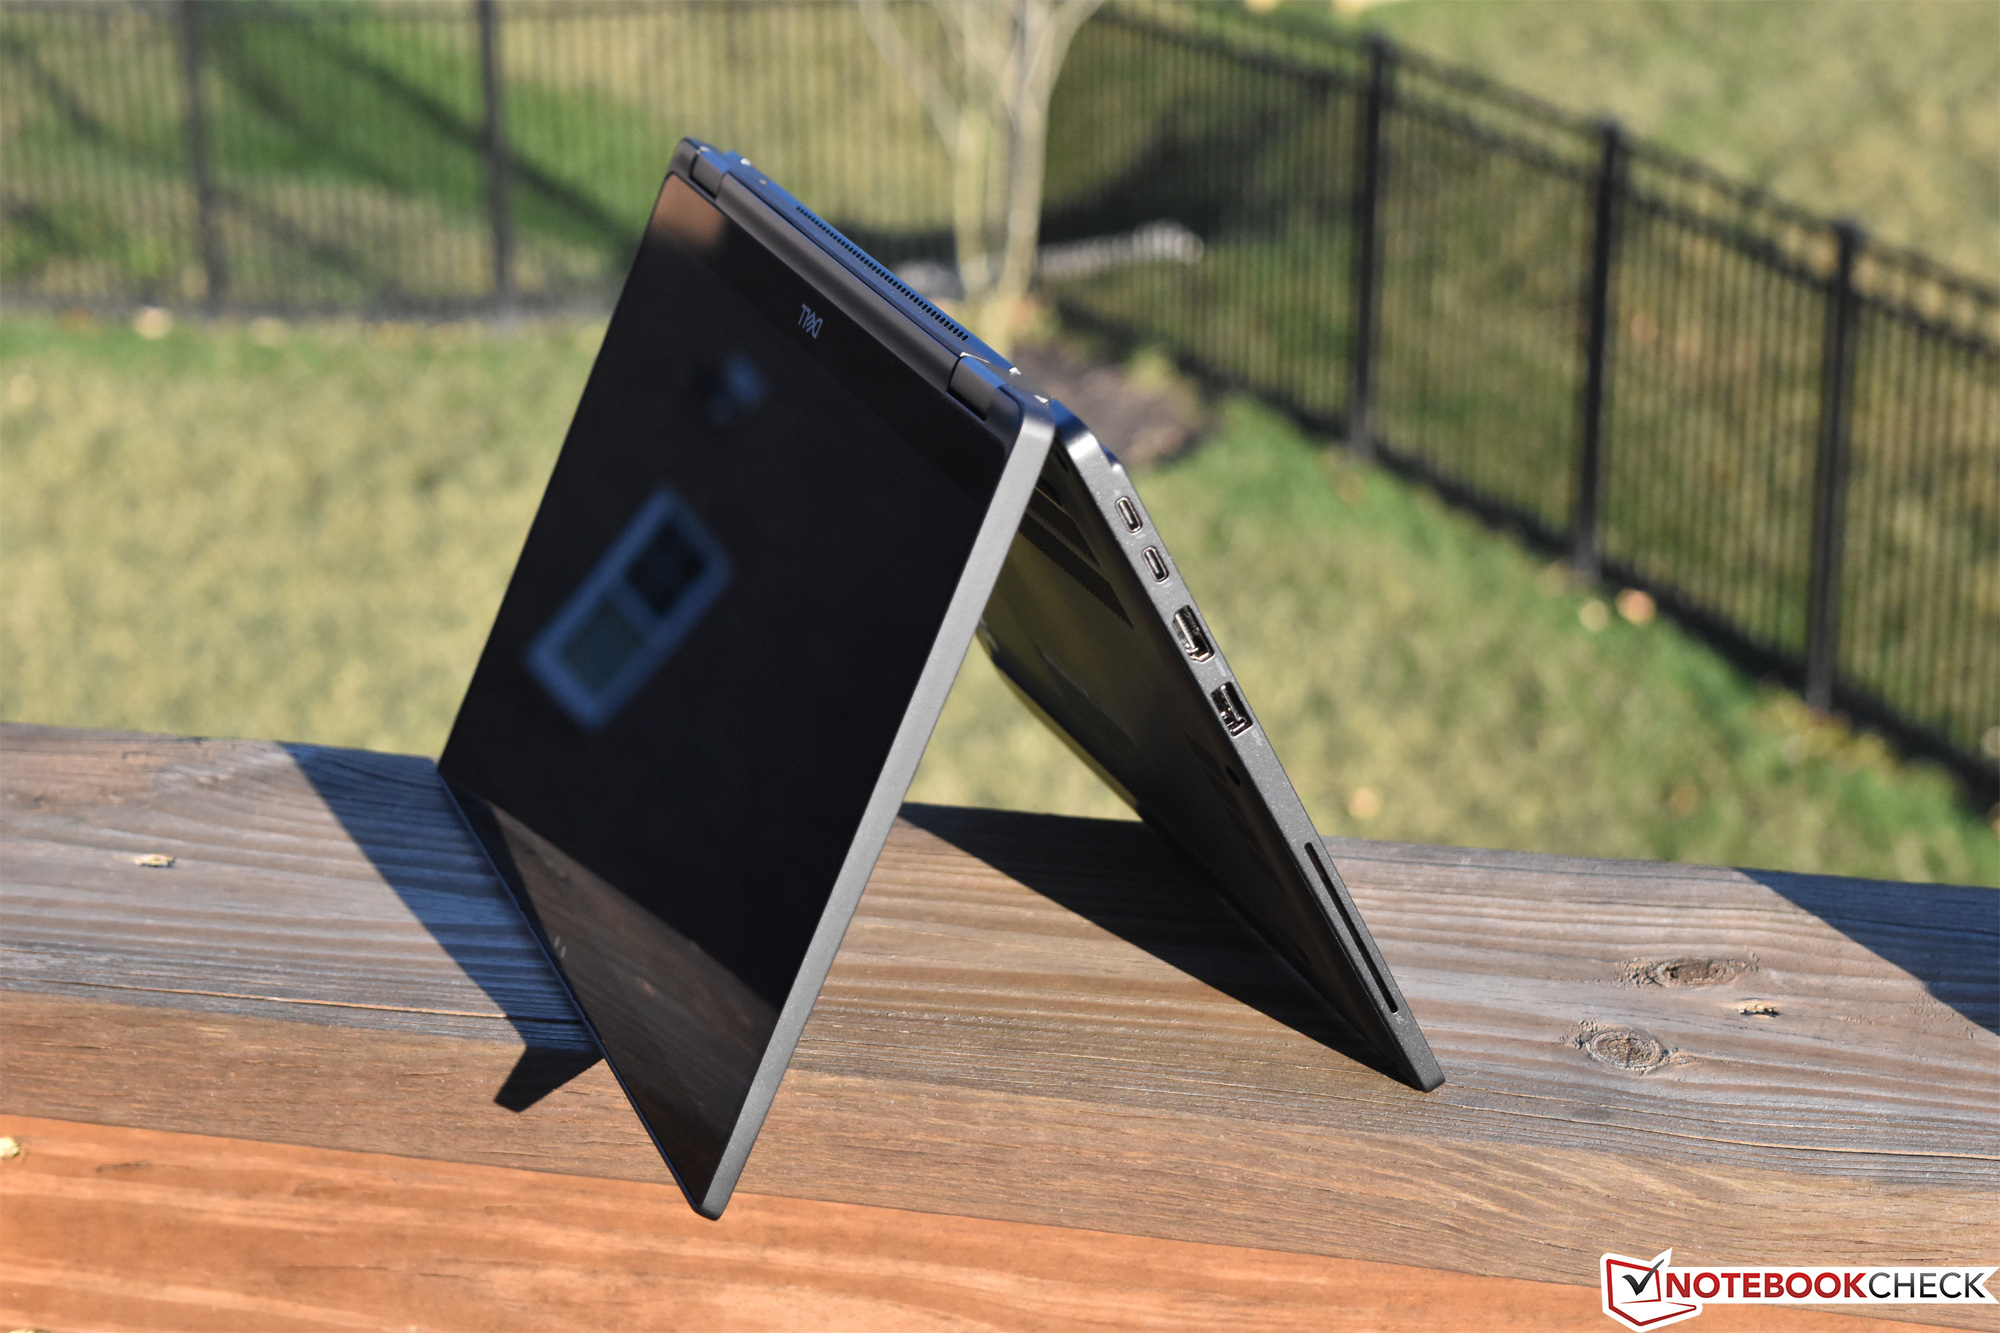
At just 306 x 211 mm, its footprint is officially the smallest of all the devices in our comparison field; it effectively crams a 13.3-inch display into the chassis of a typical 12.5-inch machine. While the result carries obvious aesthetic benefits, the weight really hasn’t seen much improvement: at 1.442 kg, the Latitude 7390 2-in-1 is some 300 grams heavier than the Lenovo ThinkPad X1 Carbon (1.126 kg). Fortunately, as a corollary, the durability doesn’t seem to have been materially affected by the shrunken footprint: there is little to no flex across the breadth of the base unit, and the thicker-than-average display lid resists pressure from behind and twisting with ease. It’s also impossible to open without two hands, however, thanks both to its weight and the extremely tight hinges.
There is one other negative we should mention here: thanks to the uncommonly high relative weight of the display lid, the machine feels less stable on the lap than its traditional non-convertible 7390 laptop counterpart. It’s unlikely that the machine would fall over, but it’s certain to be less comfortable in mobile circumstances, such as while traveling. Fortunately, even if it did fall, it’s likely to survive—as usual, the design has undergone around 17 different MIL STD 810G durability tests, ranging from environmental temperature, dust, and wind conditions to short drop tests from a number of different angles.
Connectivity
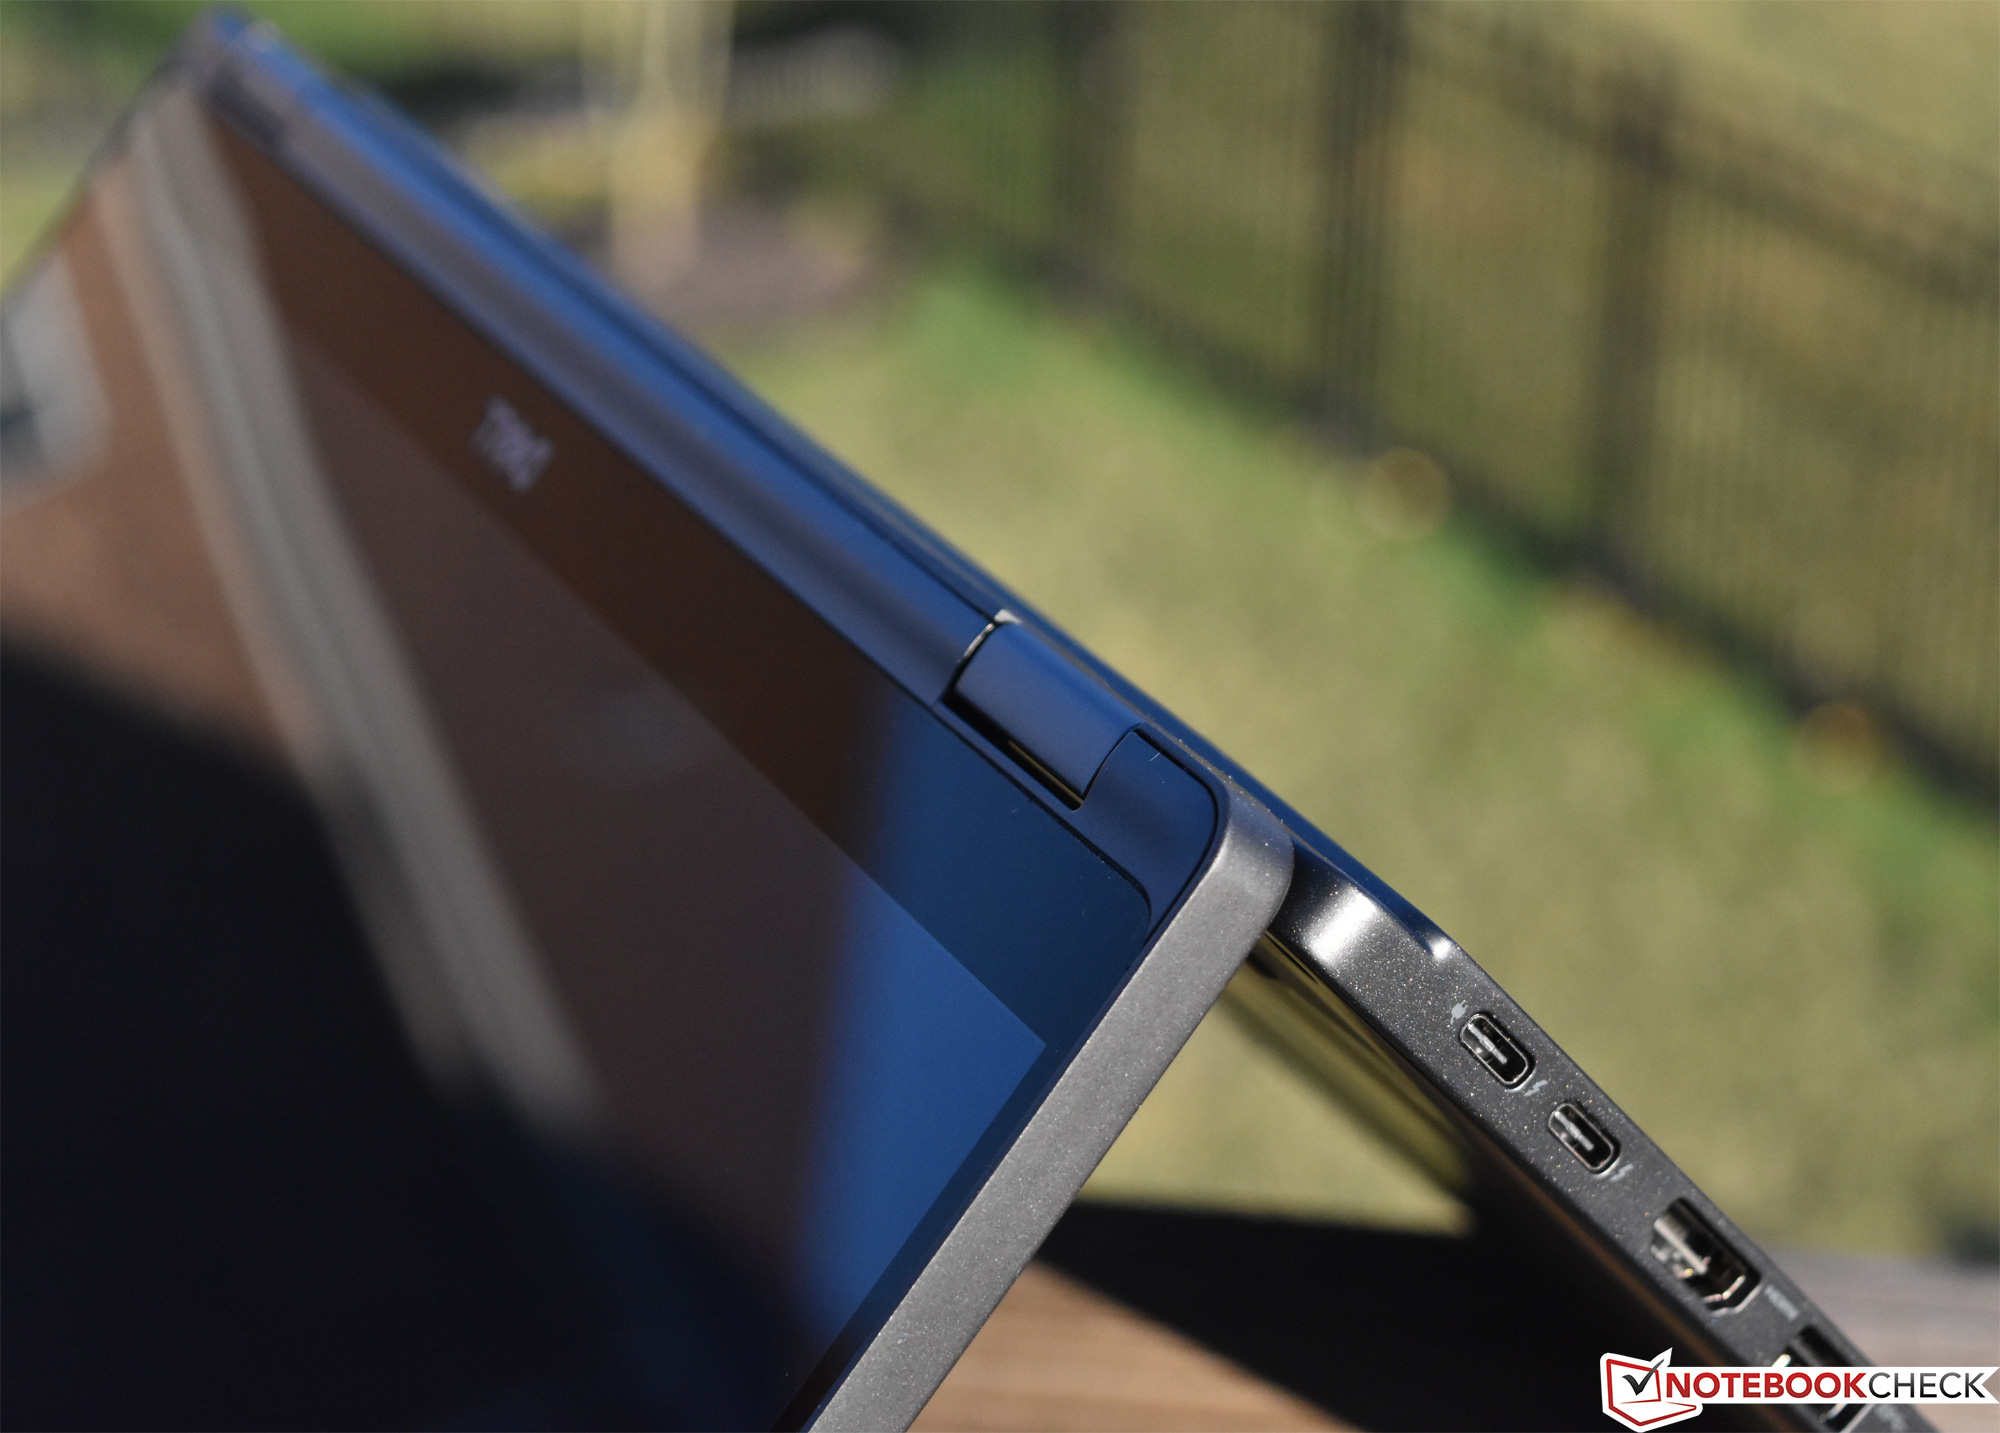
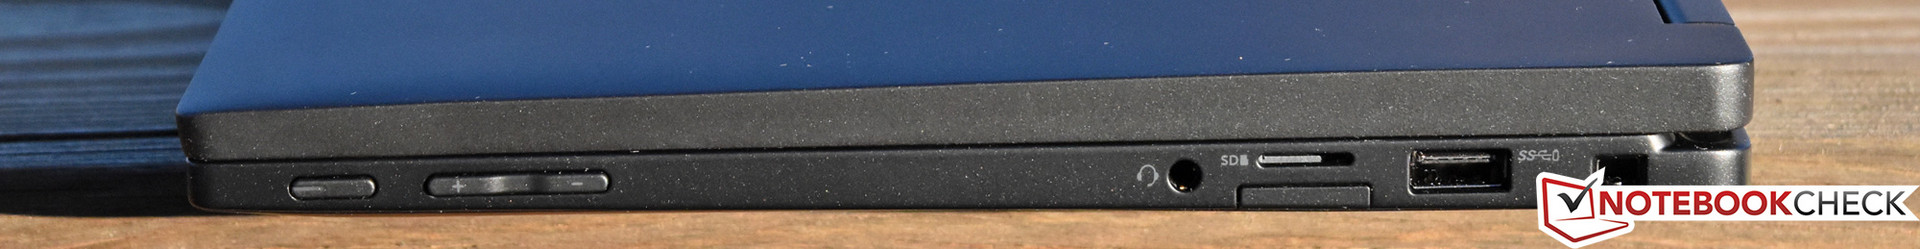
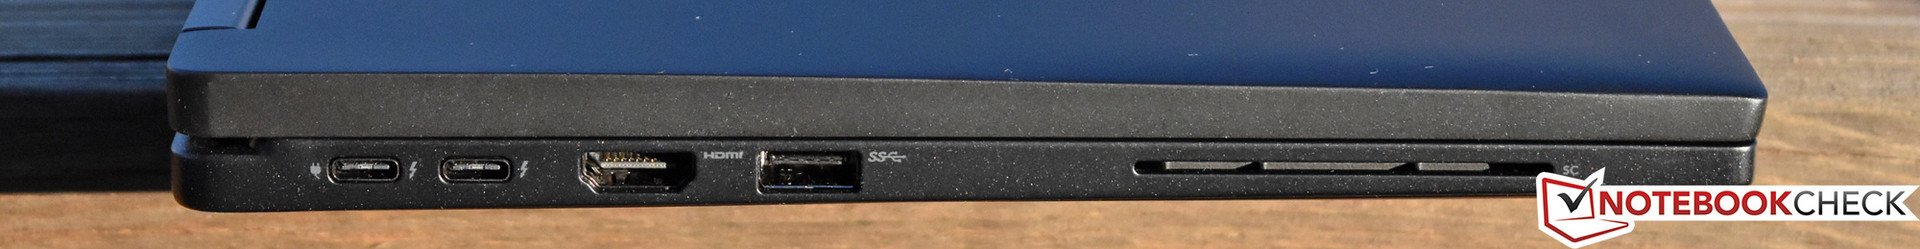
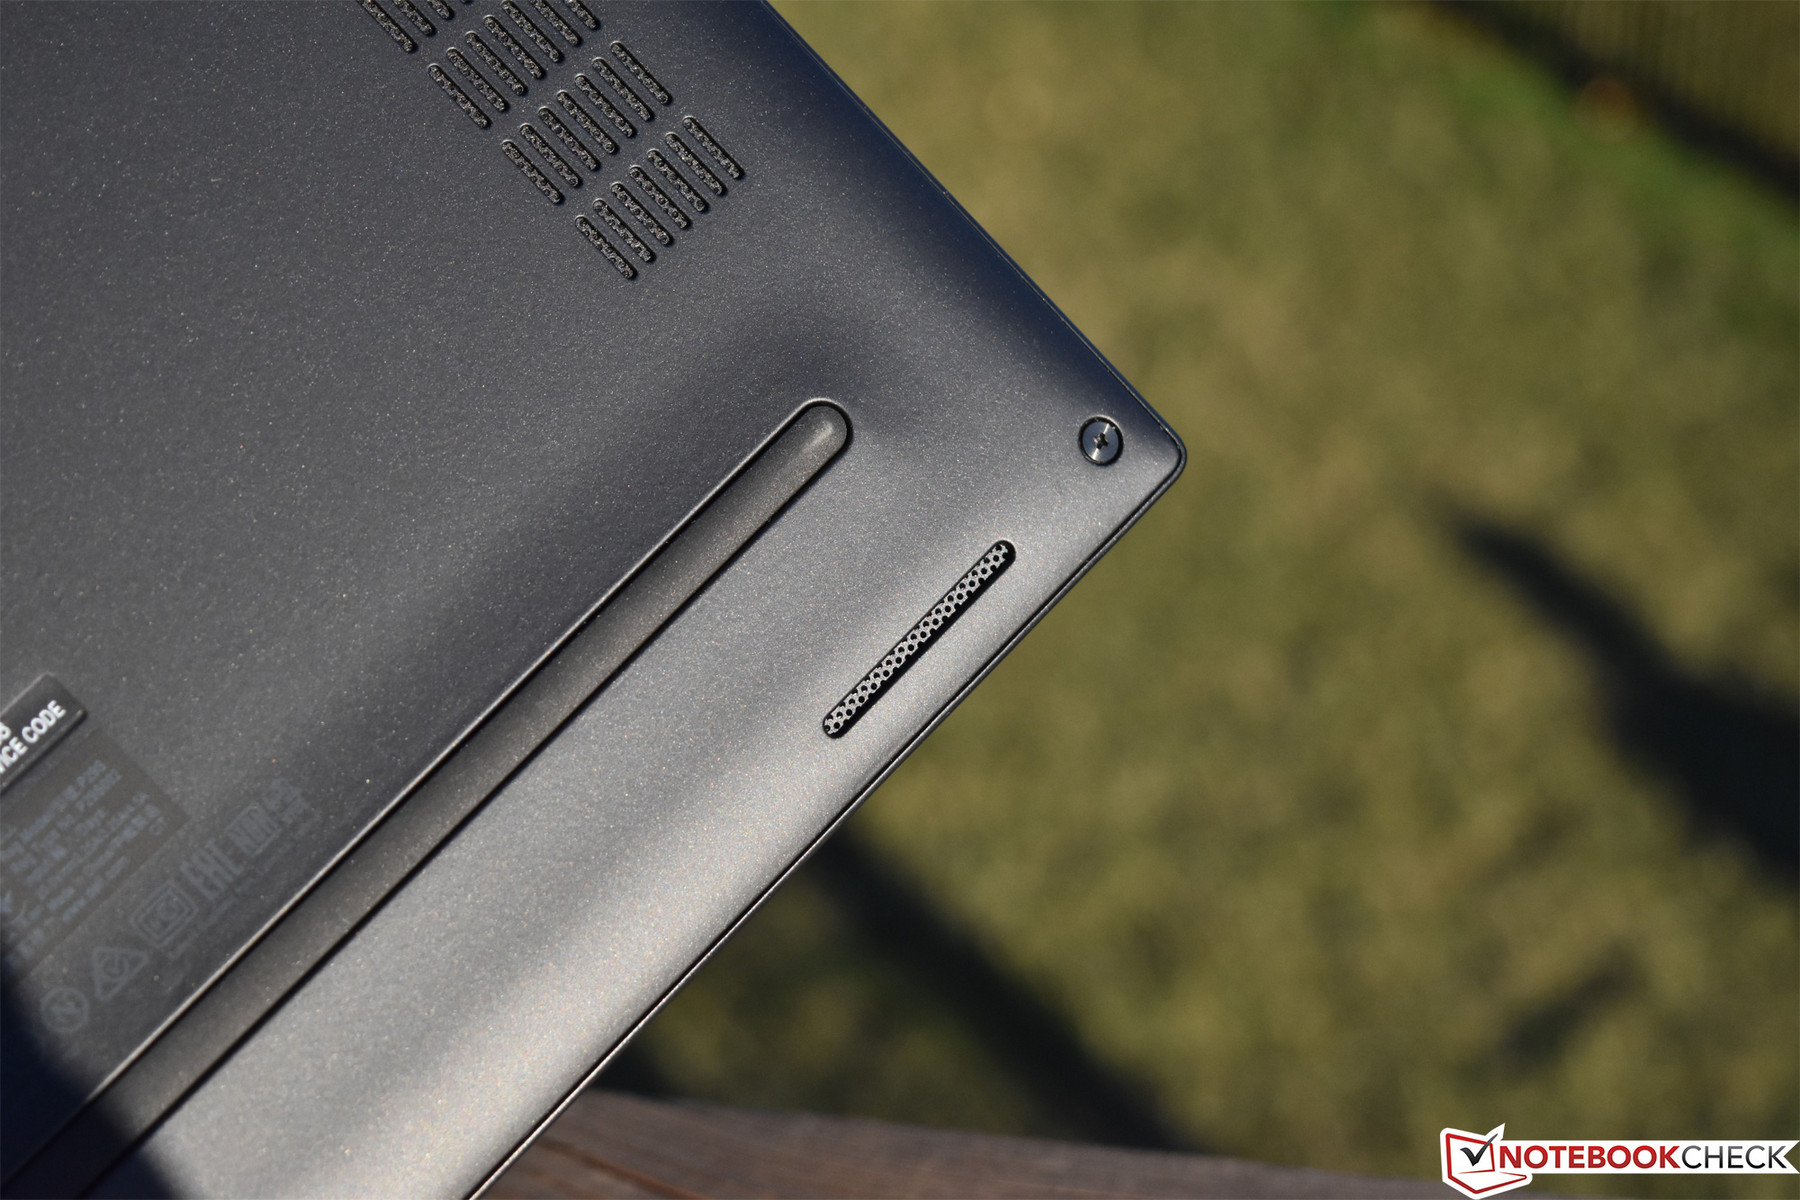
The 7390 2-in-1 features a fairly robust selection of ports for a laptop in its class—and far more than the average consumer-grade convertible. Apart from two conventional USB 3.0 Type-A ports (one powered), there are also two Thunderbolt/USB Type-C 3.1 Gen 2 ports (one of which doubles as the charging port), an HDMI port, 3.5 mm audio jack, smart card reader, Kensington Lock port, a SIM card port, and even a microSD port. That’s a lot of options for a machine of this size, and apart from the conspicuous lack of Ethernet, the bevy of choices position it squarely alongside other, larger business models.
SD Card Reader
Speaking of the SD card reader, the Latitude 7390’s performance is excellent on this front. We measured scores well above the class average and comparable to the top-end performance of the X1 Carbon 2018. See our graphs below for full details.
| SD Card Reader | |
| average JPG Copy Test (av. of 3 runs) | |
| Lenovo ThinkPad X1 Carbon 2018-20KGS03900 (Toshiba Exceria Pro M501) | |
| Dell Latitude 7390 2-in-1 (Toshiba Exceria Pro M501 UHS-II) | |
| Dell Latitude 13 7380 (Toshiba Exceria Pro SDXC 64 GB UHS-II) | |
| Toshiba Portege A30-D-139 (Toshiba Exceria Pro SDXC 64 GB UHS-II) | |
| Asus ZenBook 13 UX331UN (Toshiba Exceria Pro M501 microSDXC 64GB) | |
| Average of class Office (19.8 - 198.5, n=22, last 2 years) | |
| maximum AS SSD Seq Read Test (1GB) | |
| Dell Latitude 7390 2-in-1 (Toshiba Exceria Pro M501 UHS-II) | |
| Lenovo ThinkPad X1 Carbon 2018-20KGS03900 (Toshiba Exceria Pro M501) | |
| Dell Latitude 13 7380 (Toshiba Exceria Pro SDXC 64 GB UHS-II) | |
| Toshiba Portege A30-D-139 (Toshiba Exceria Pro SDXC 64 GB UHS-II) | |
| Asus ZenBook 13 UX331UN (Toshiba Exceria Pro M501 microSDXC 64GB) | |
| Average of class Office (27.4 - 249, n=21, last 2 years) | |
Communication
The Intel Dual Band Wireless-AC 8265 WiFi adapter included in our test unit is also what powers every single other device in our comparison field today. Leveraging this popular card, the Latitude 7390 posts respectable numbers (639 MBit/s receive and 495 MBit/s transfer) when communicating with our Linksys EA8500.
Security (business devices)
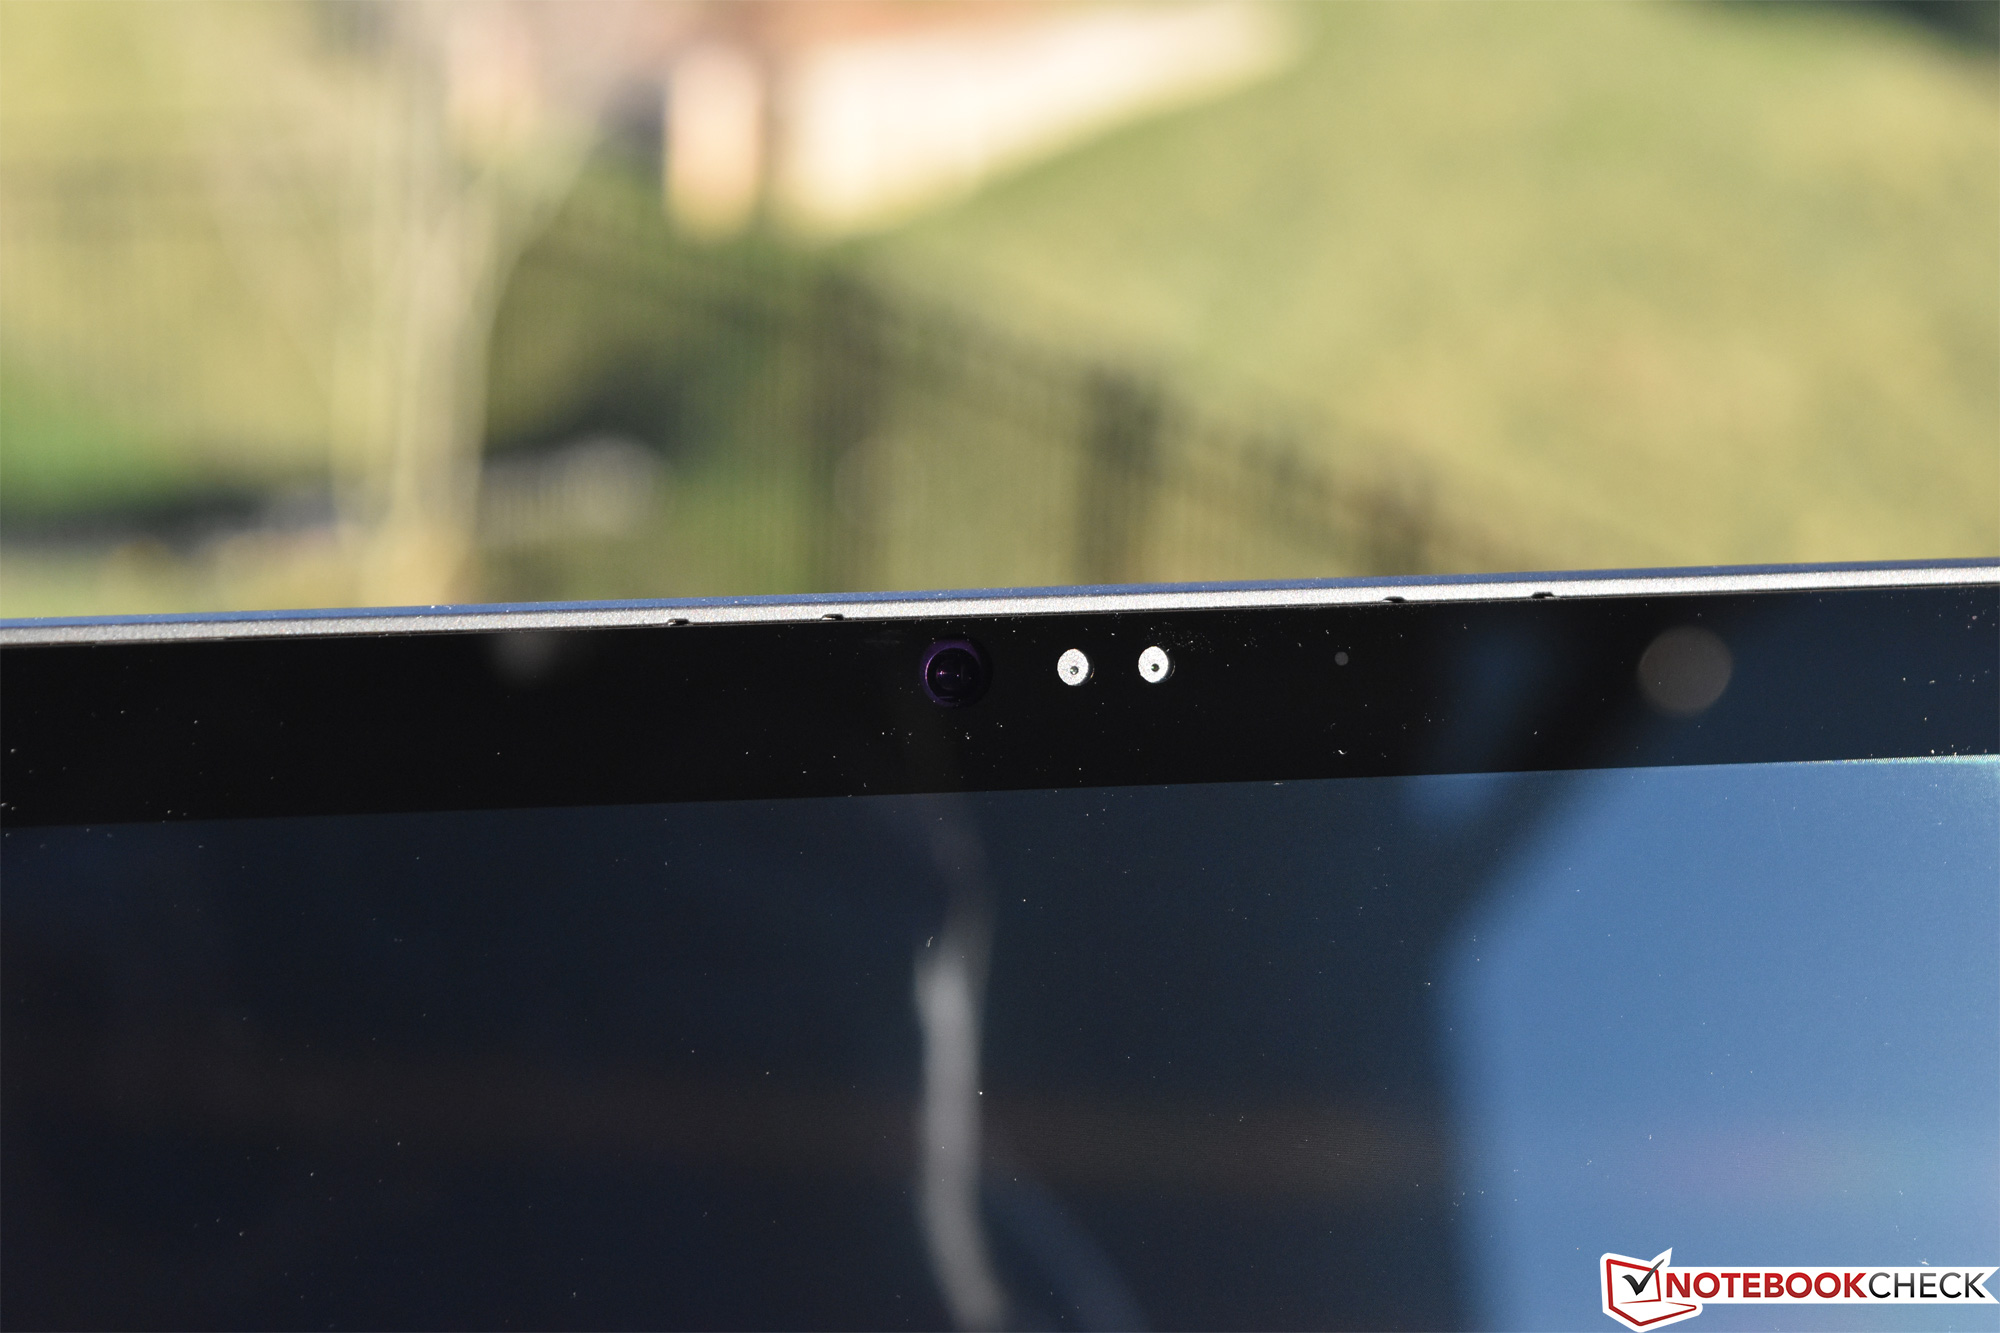
Various options for enterprise-grade security exist for Latitude 7390 configurations, some of which include a touch fingerprint reader, FIPS 201 contacted smart card reader, contactless smart card/NFC5 capability, and Windows Hello compatible Face IR camera. Our review unit includes all these options. During our testing period, Windows Hello worked well and the fingerprint reader was quick. We didn't test the smart card reader or NFC.
Accessories
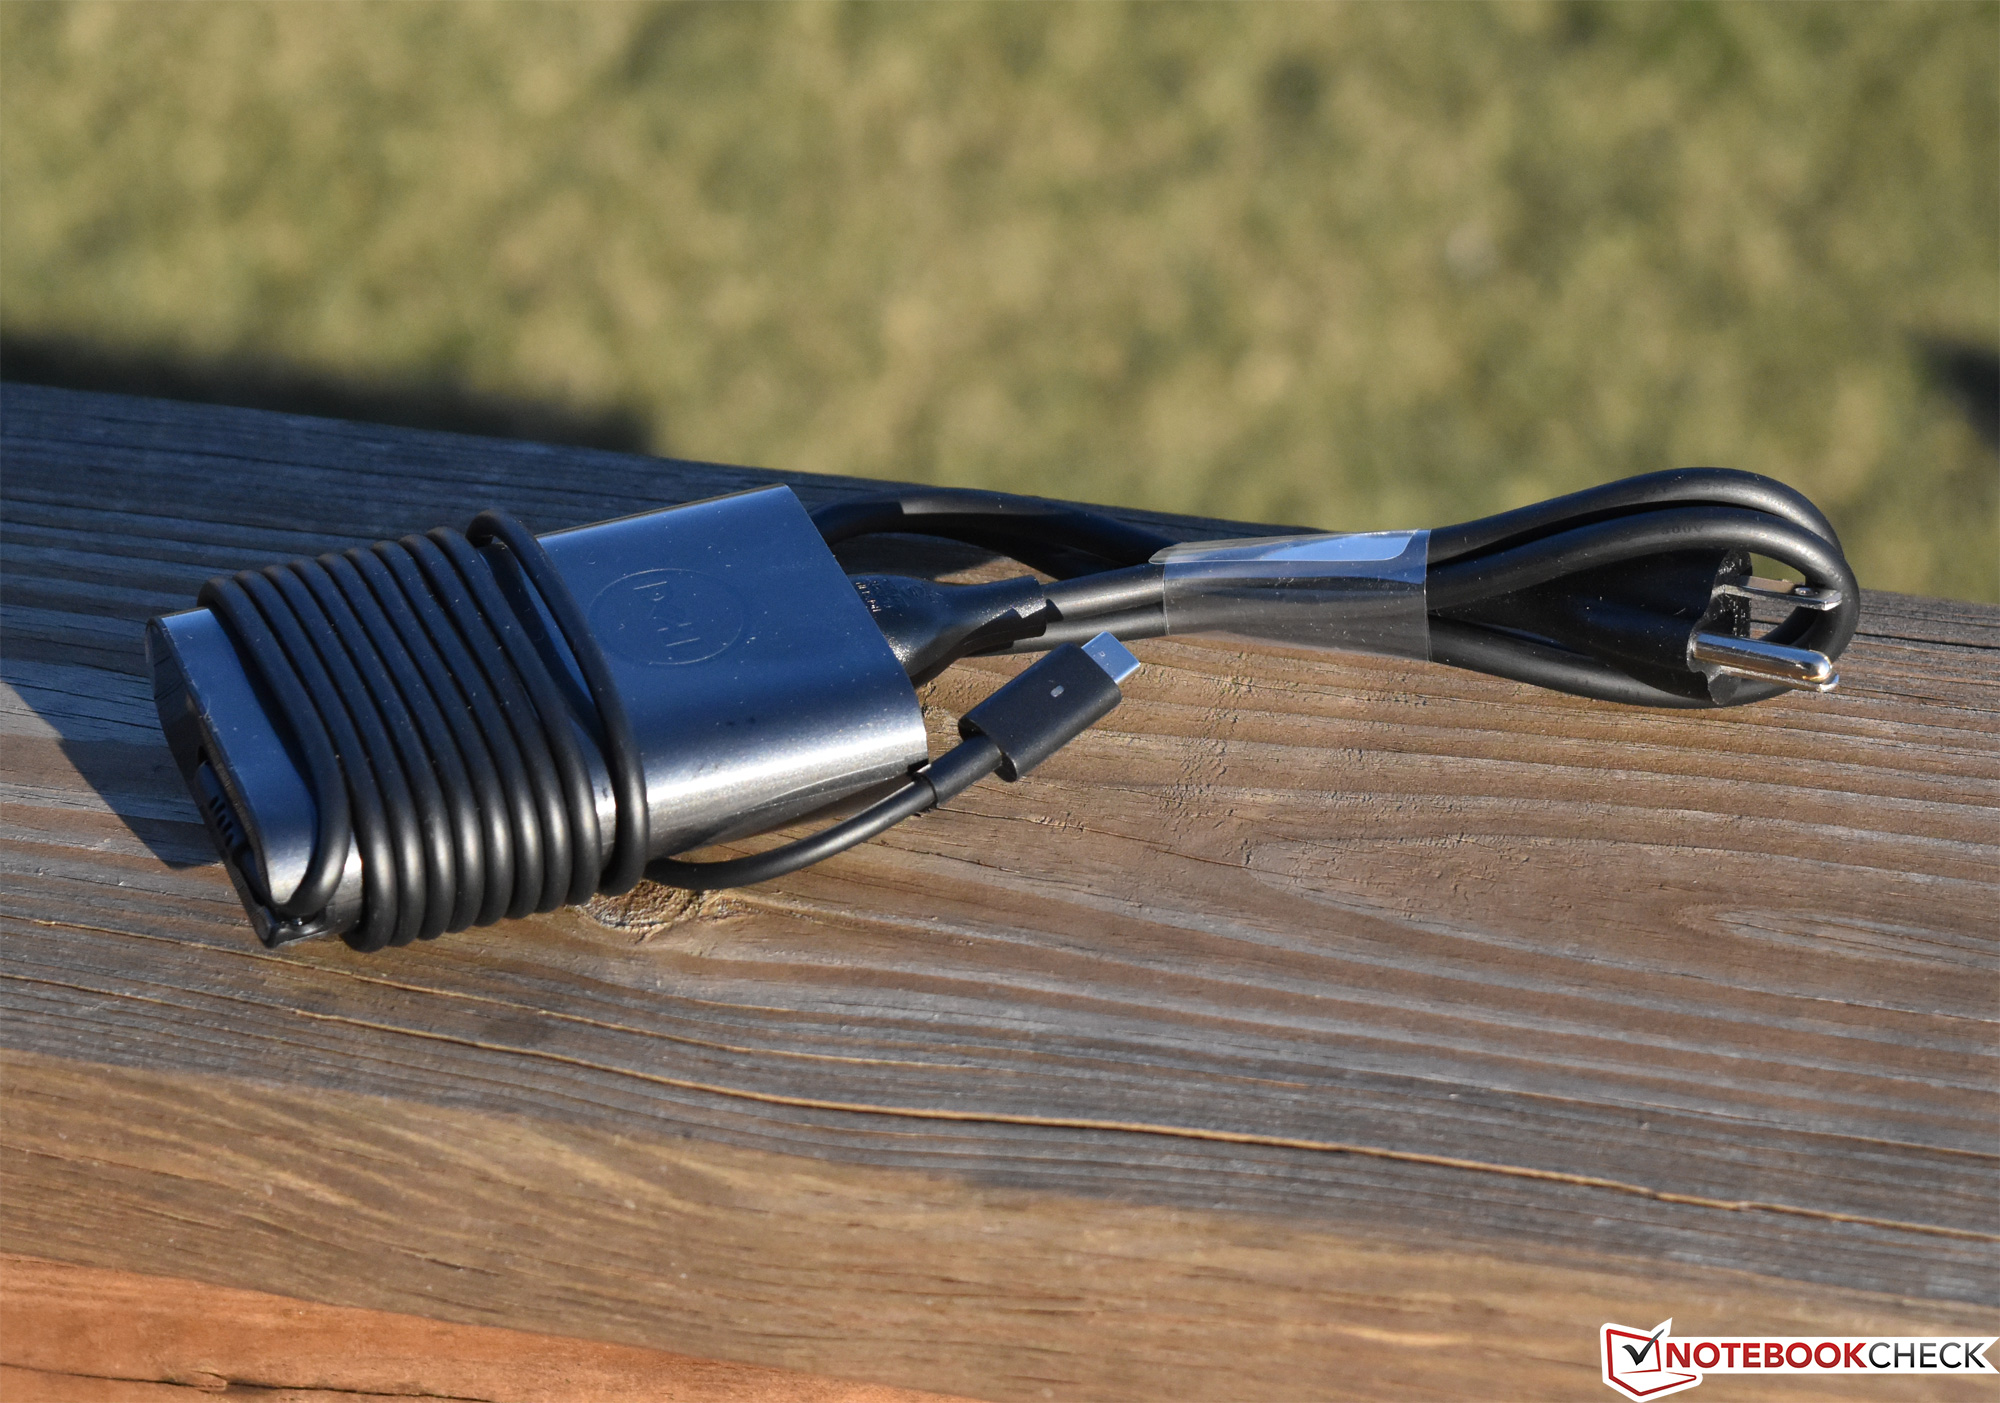
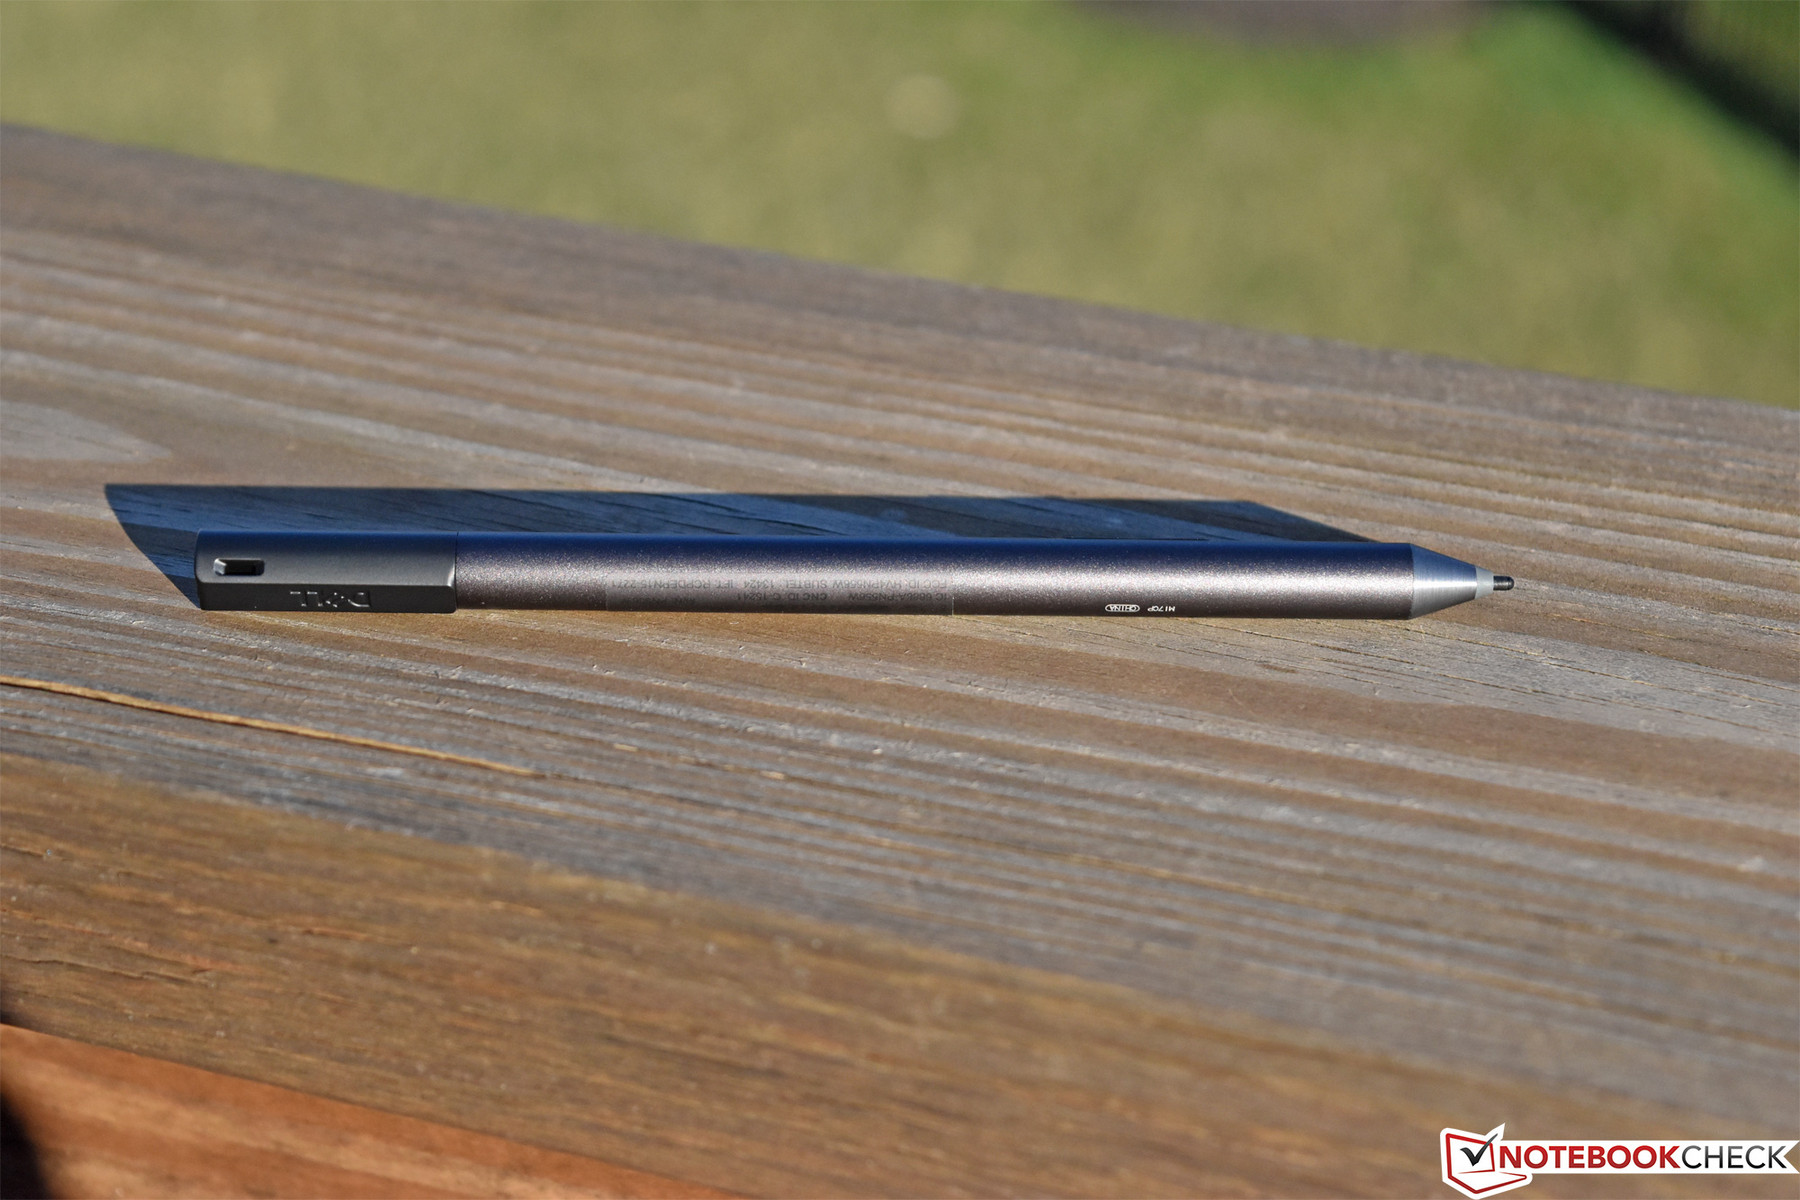
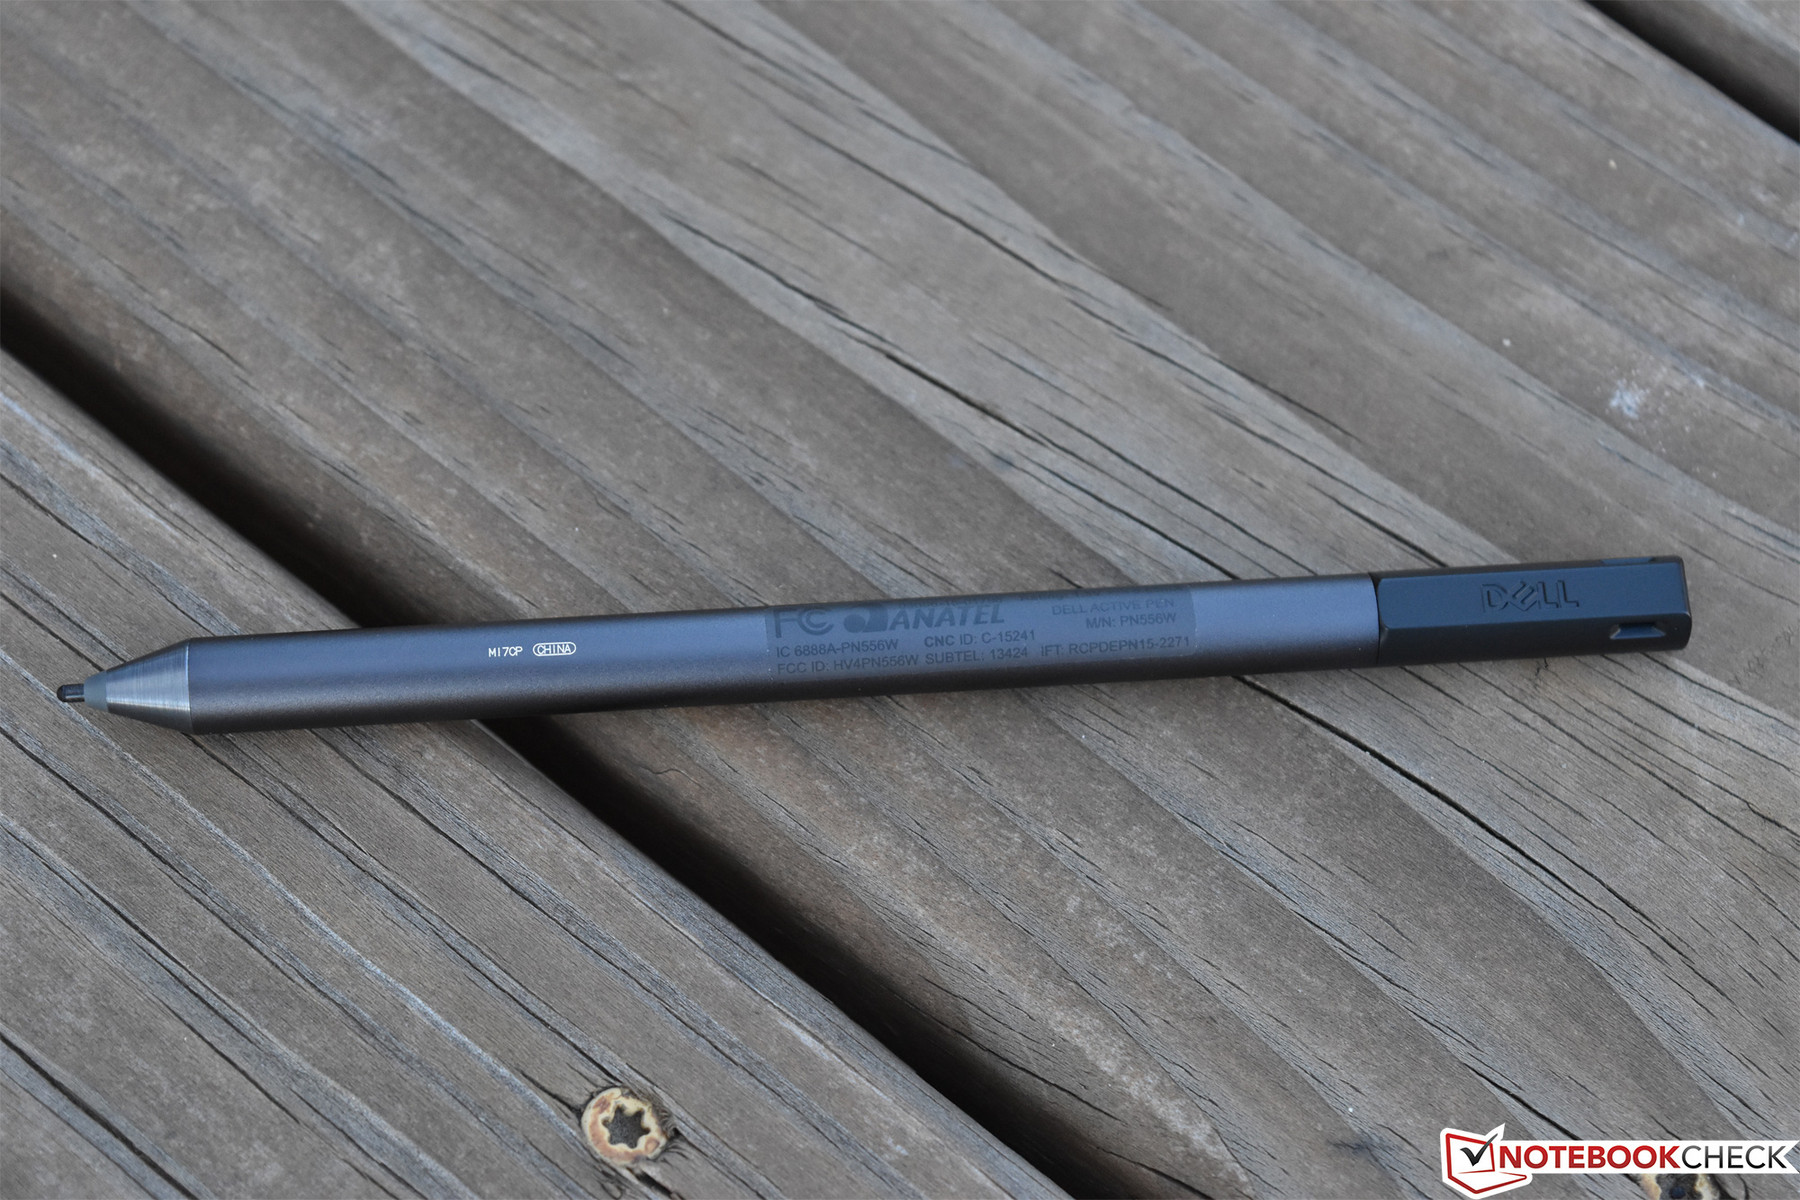
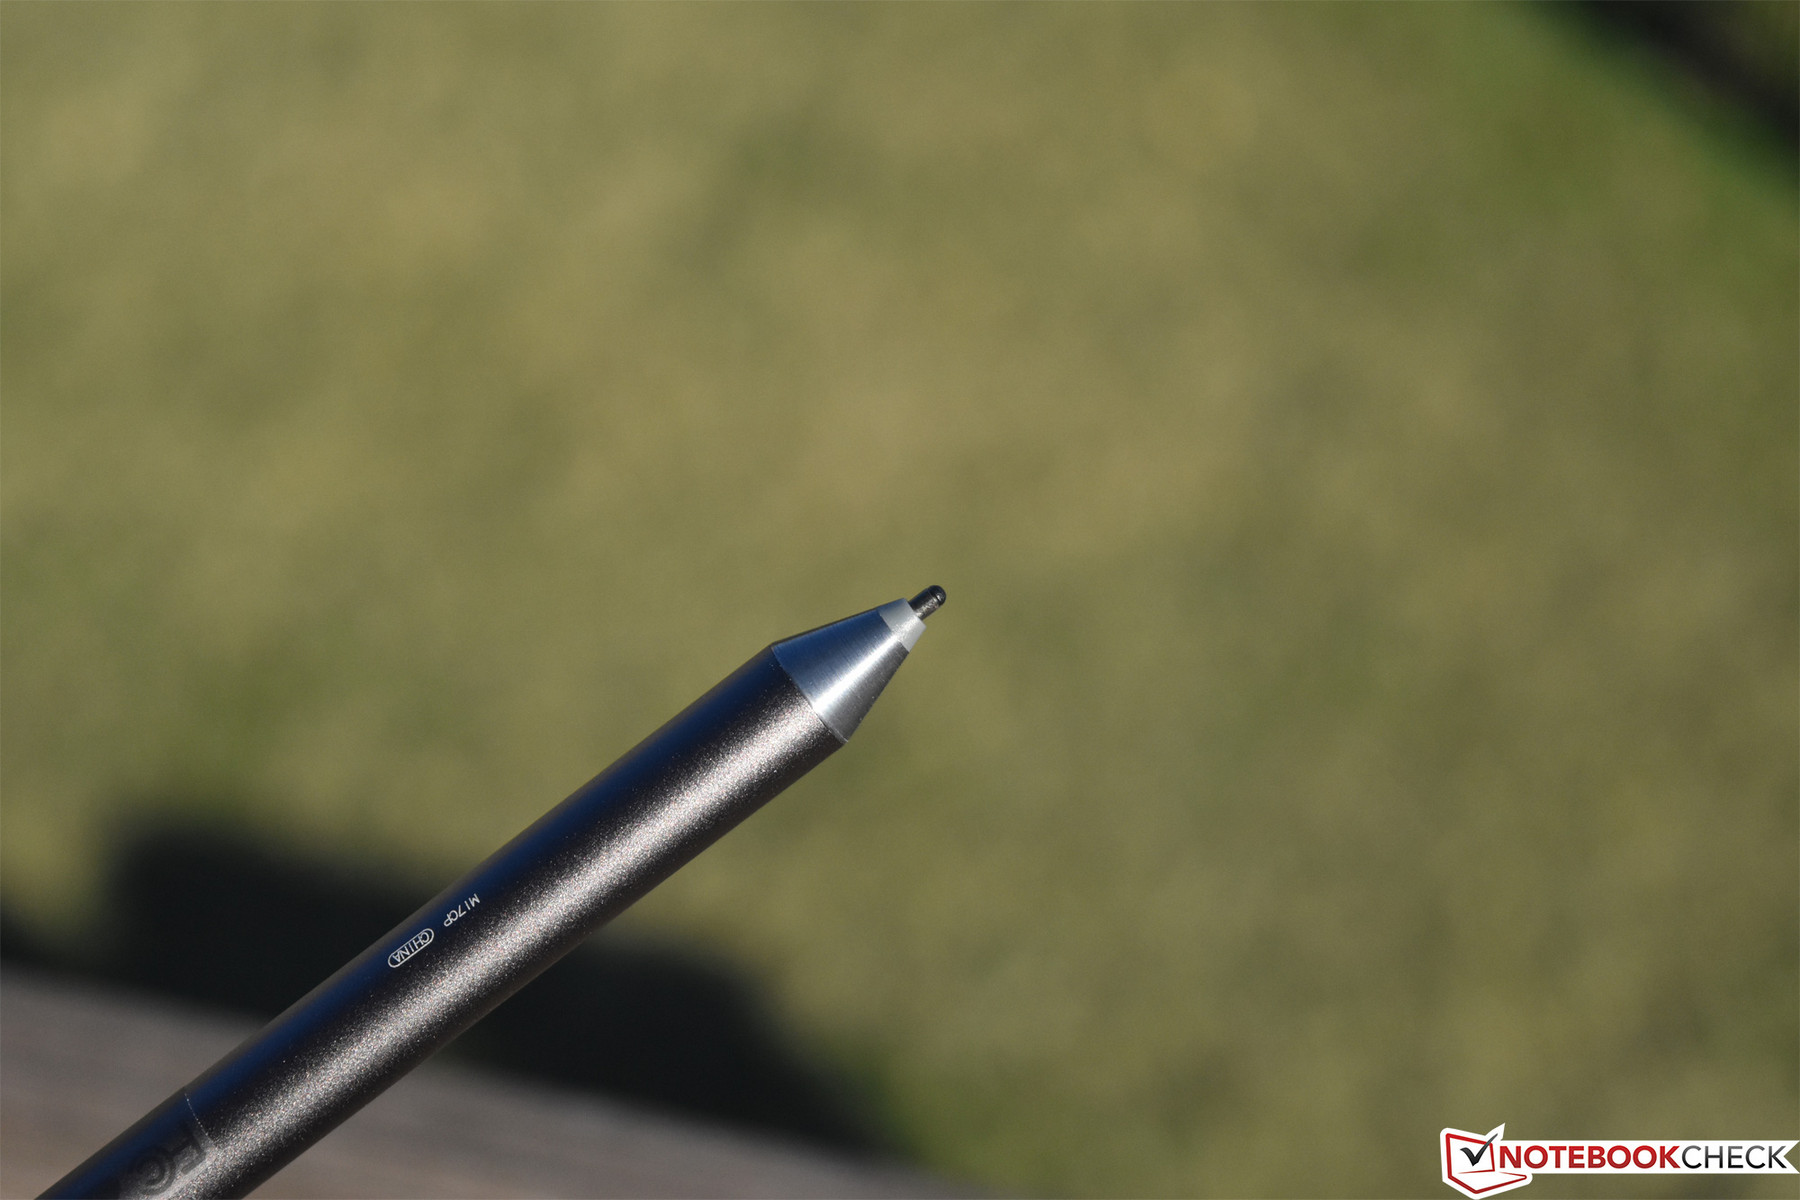
The Latitude 7390 2-in-1 includes a 65 W USB Type-C power adapter. Our review unit also shipped with a Dell Active Pen ($35 MSRP), which is a WACOM-powered accessory. We’ve covered this product in the past, and nothing has changed since; for much more detail about it, please see our review of the Latitude 5285 here.
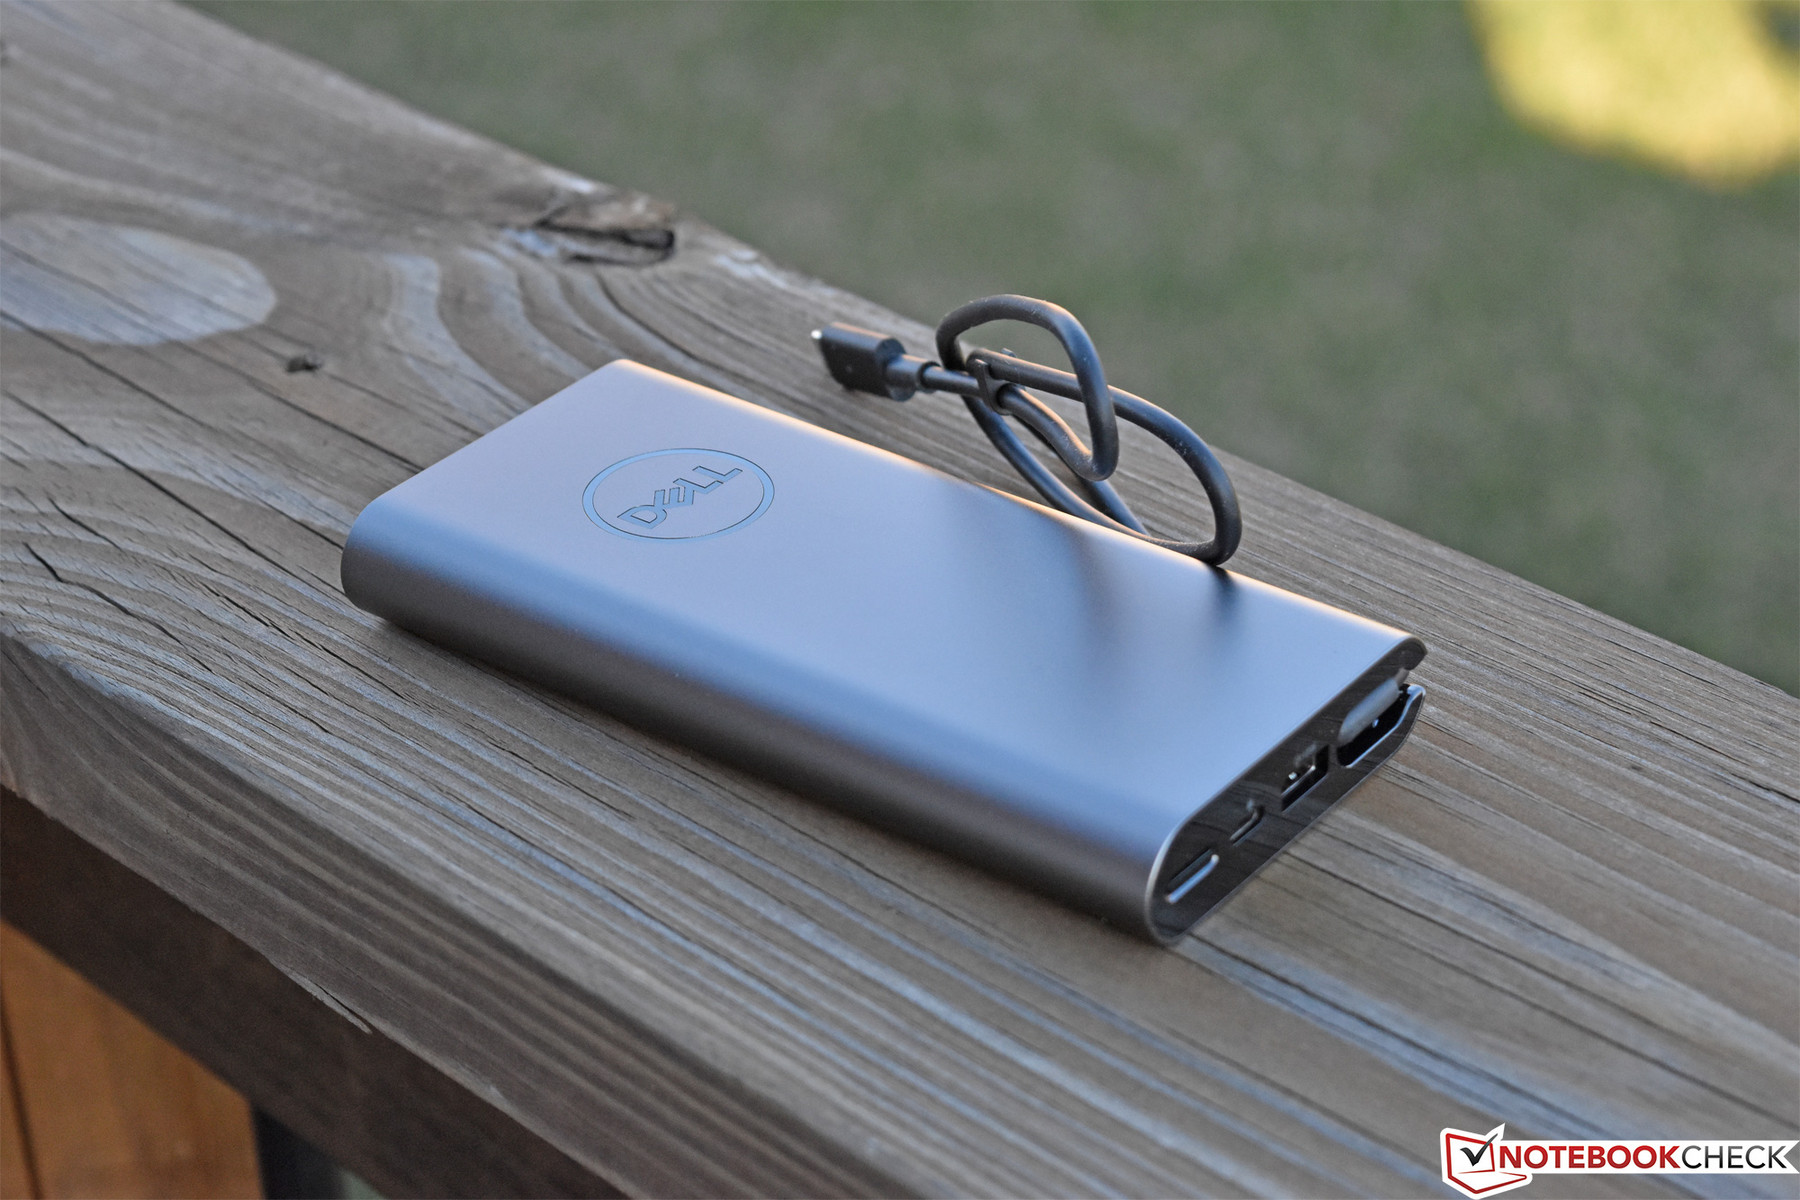
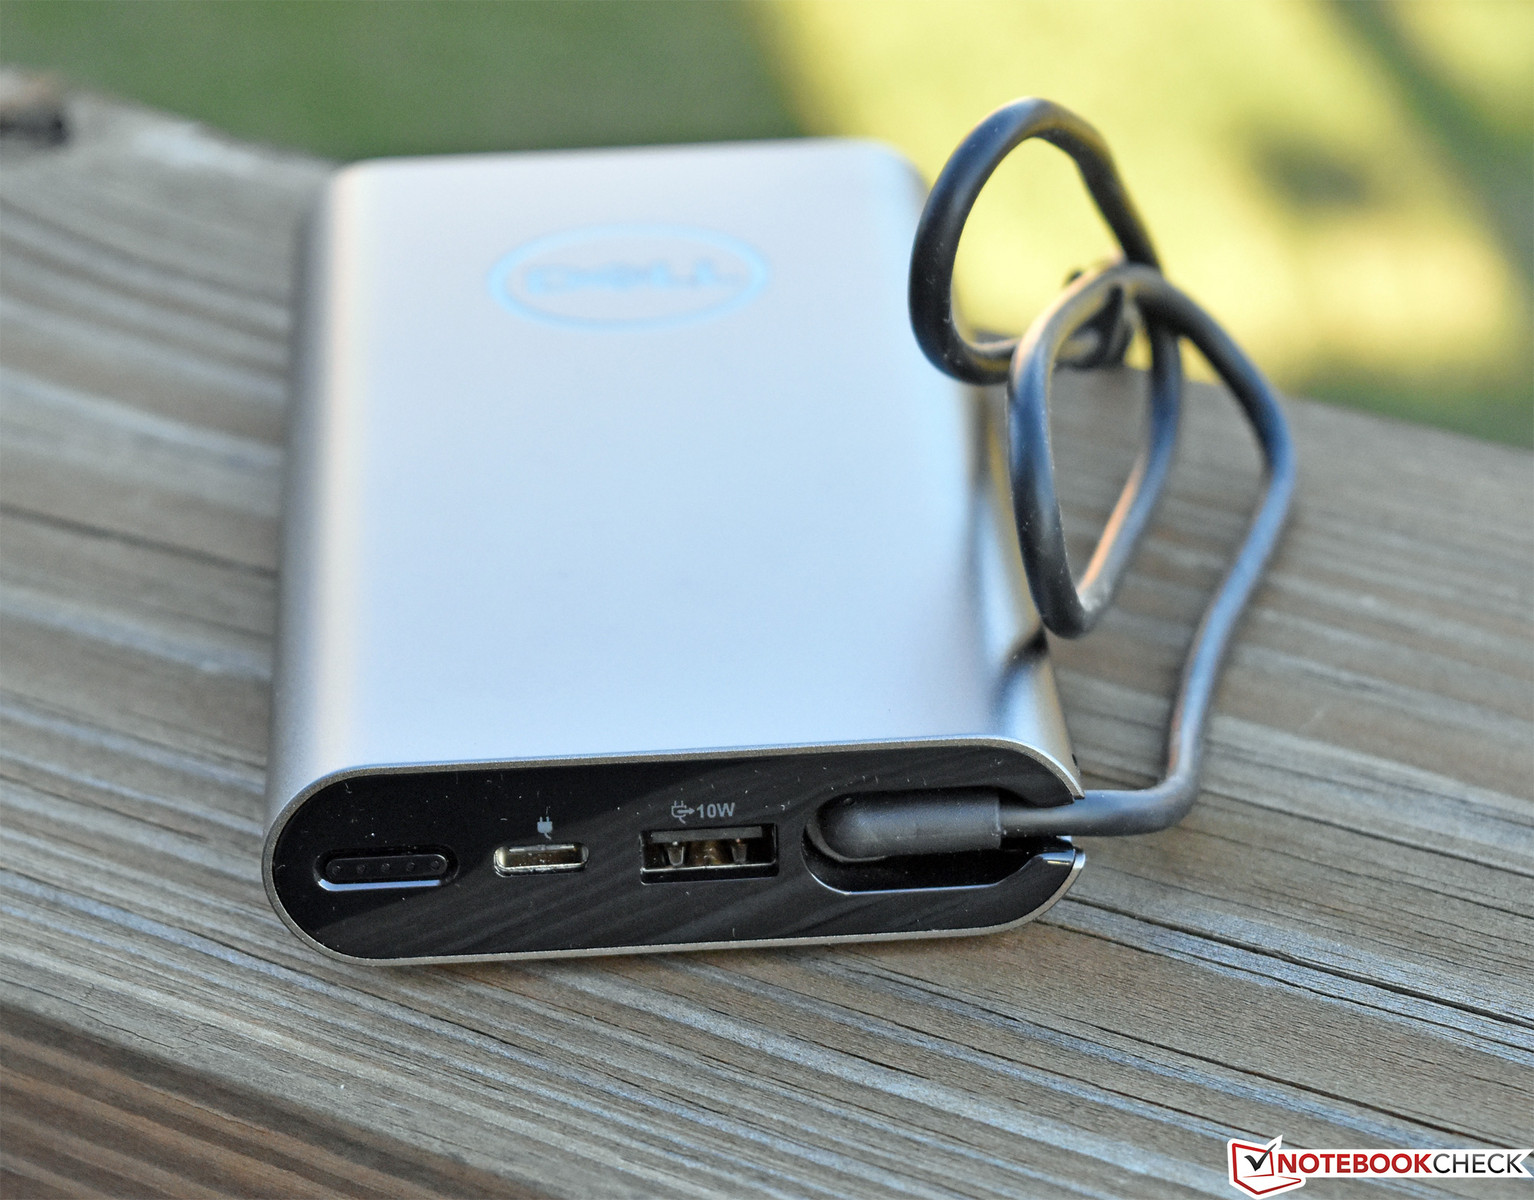
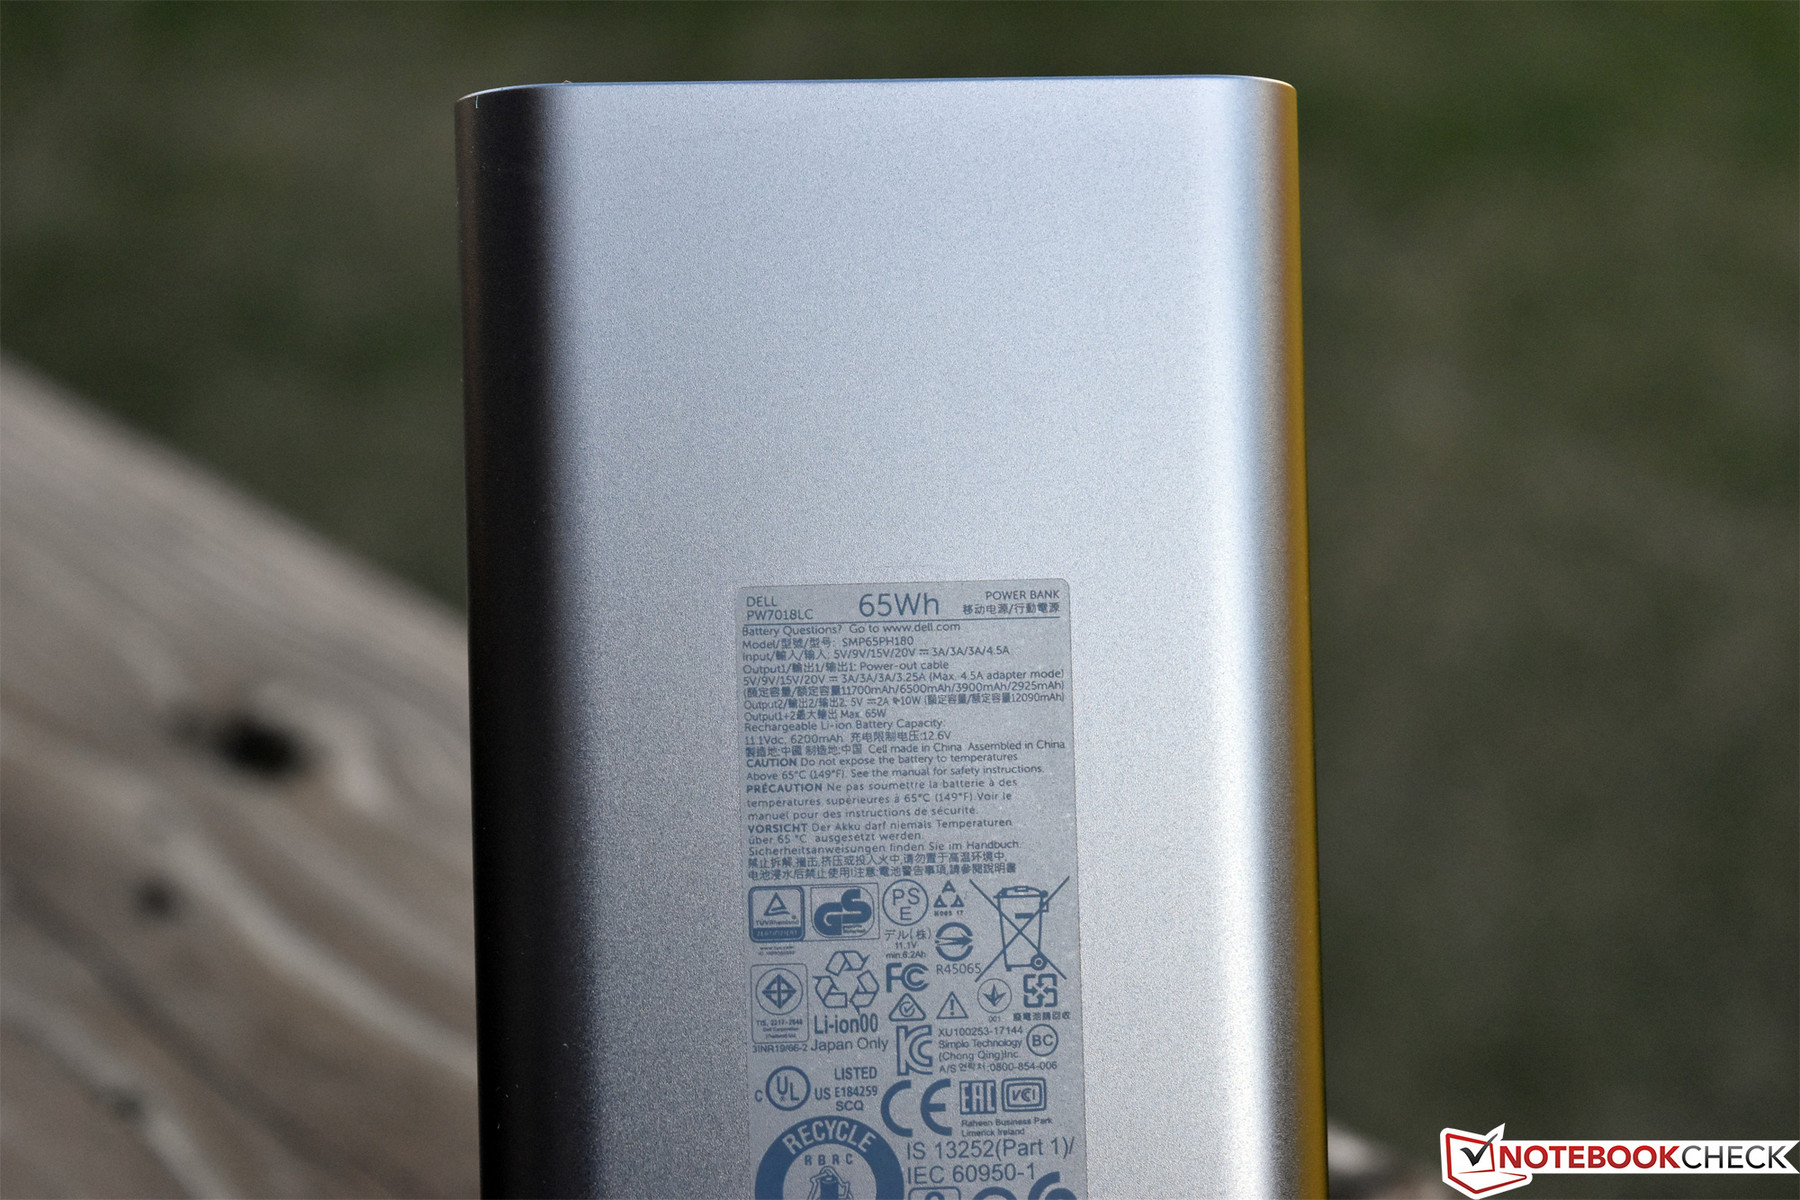
One other accessory we received is the Dell Notebook Power Bank Plus ($150 MSRP). This is (more than) a portable charger which provides up to 65 W of power to any connected accessory (including Dell's Latitude 5000 and 7000 lineup of machines—any which accept power over USB-C technically)—with a capacity of 65 Wh. That translates to 6200 mAh at 10.5 V, which is enough to charge the typical mobile roughly four times (or Dell's Latitude 7390 2-in-1 fully once). The exterior of the adapter is aluminum and more closely matches the styling of, say, the XPS line of laptops—but it still looks appropriately-matched to the high-end business models as well (silver aluminum never goes out of style). It’s possible to charge both a laptop and a phone simultaneously, and the devices can even be charged while the Power Bank itself is being charged.
Perhaps even cooler, though, is that the (traditional) USB Type-B port on the adapter serves a dual purpose: it also functions as a hub. Not only does it charge any connected device, but it facilitates communication with the connected laptop as well. Thanks to its versatile and intelligent design, despite the Notebook Power Bank’s steep price, we think it’s a very useful gadget that many business travelers would likely find convenient on a trip.
Maintenance
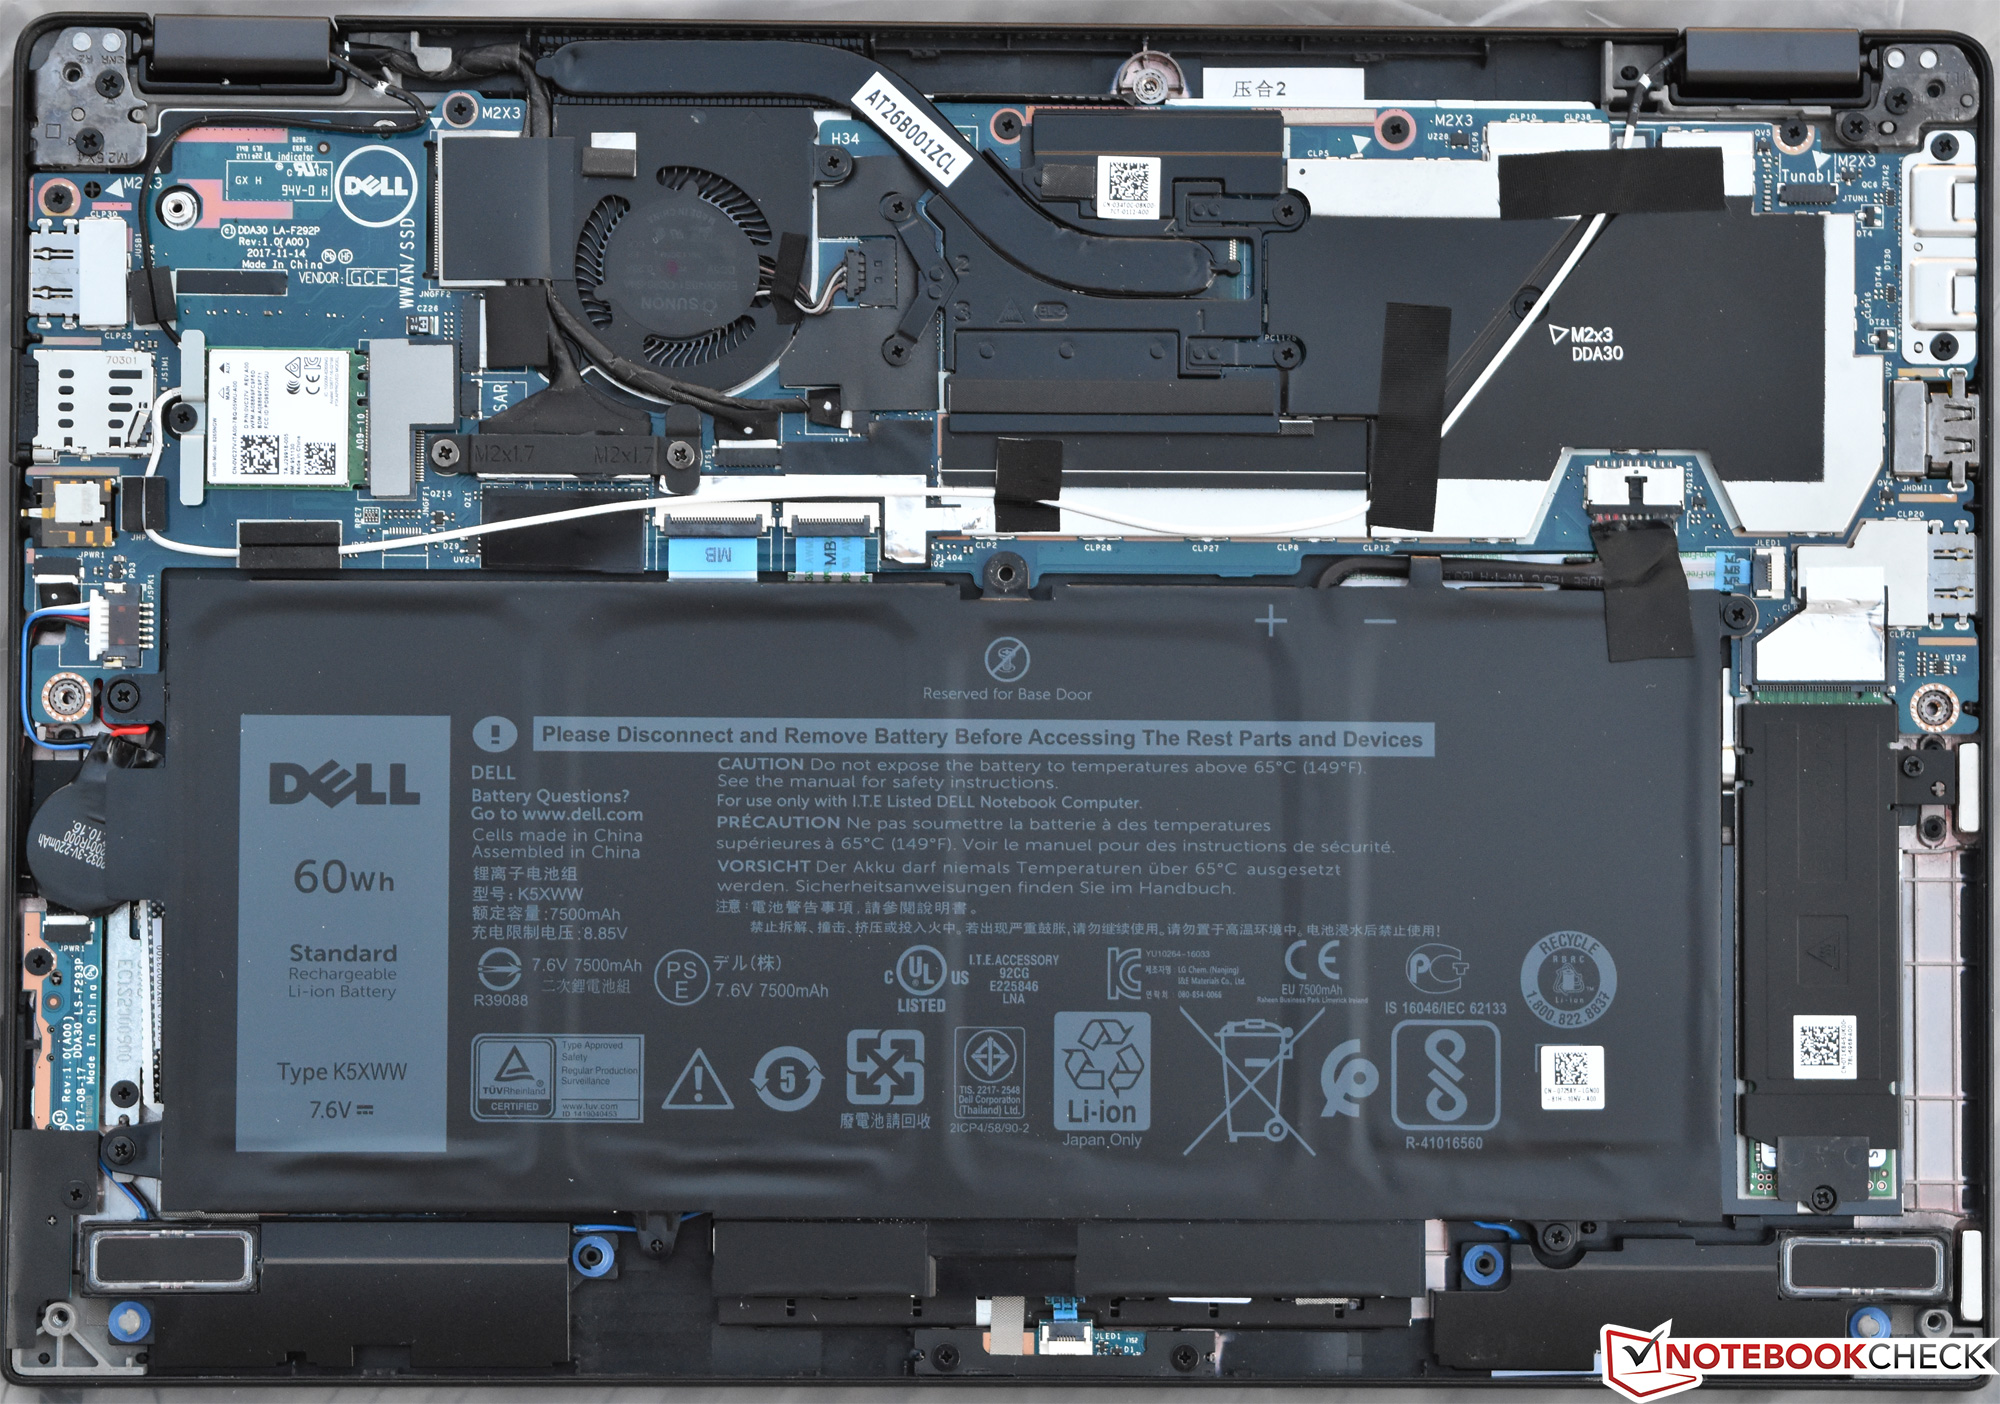
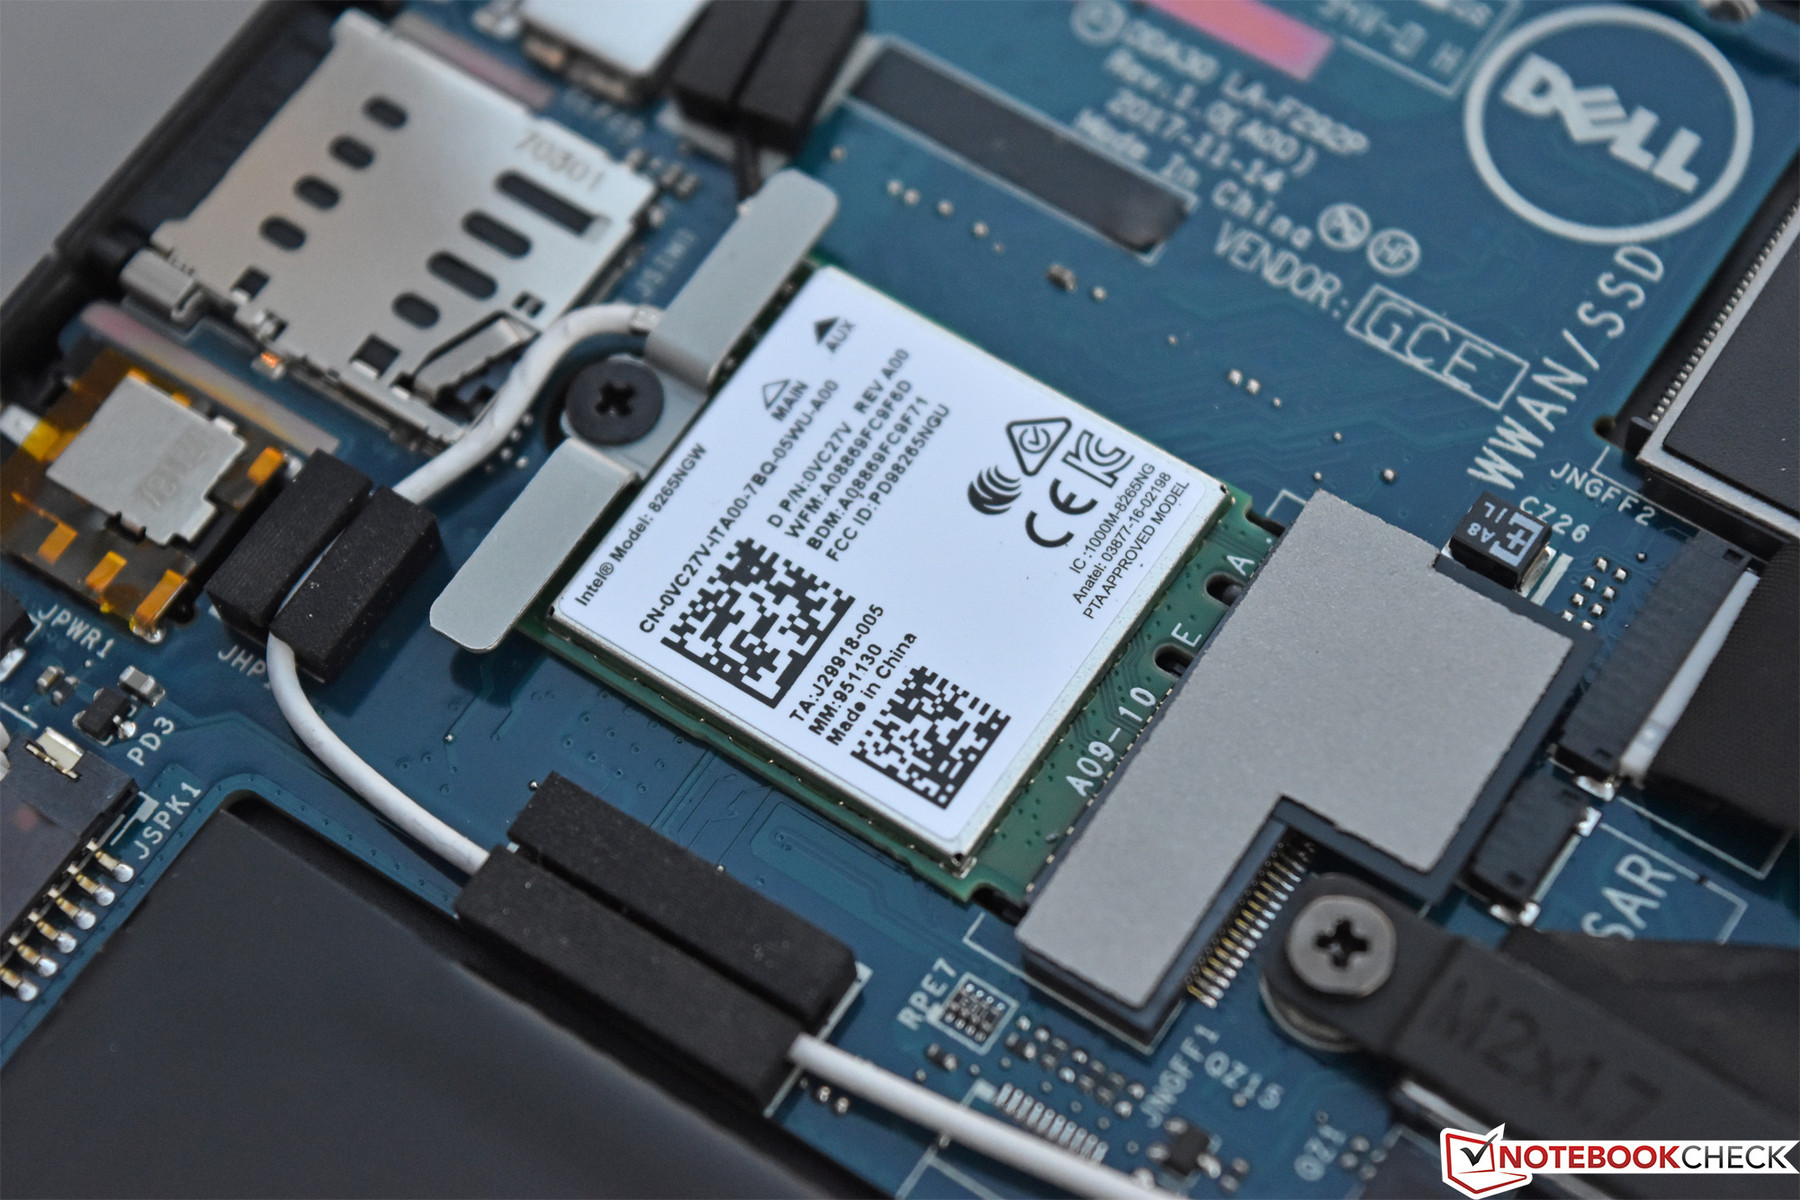
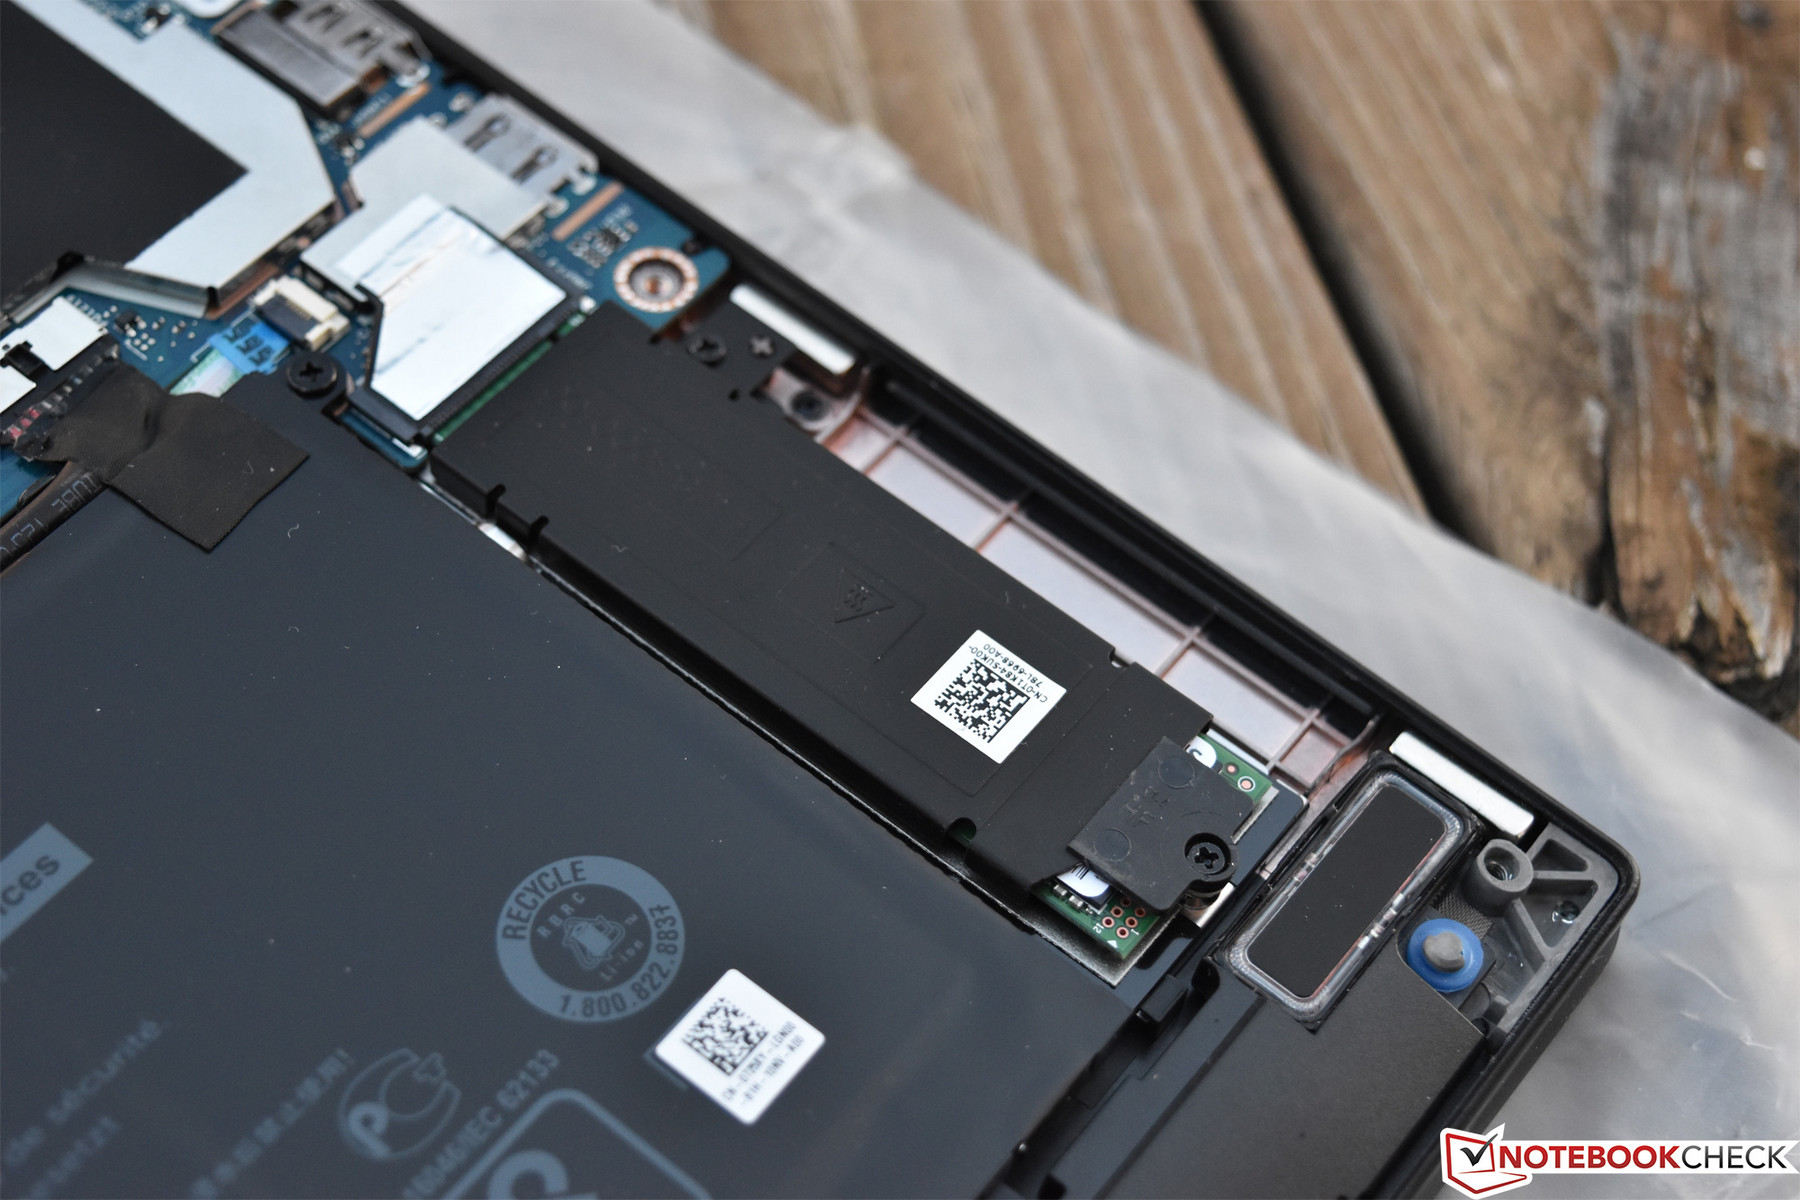
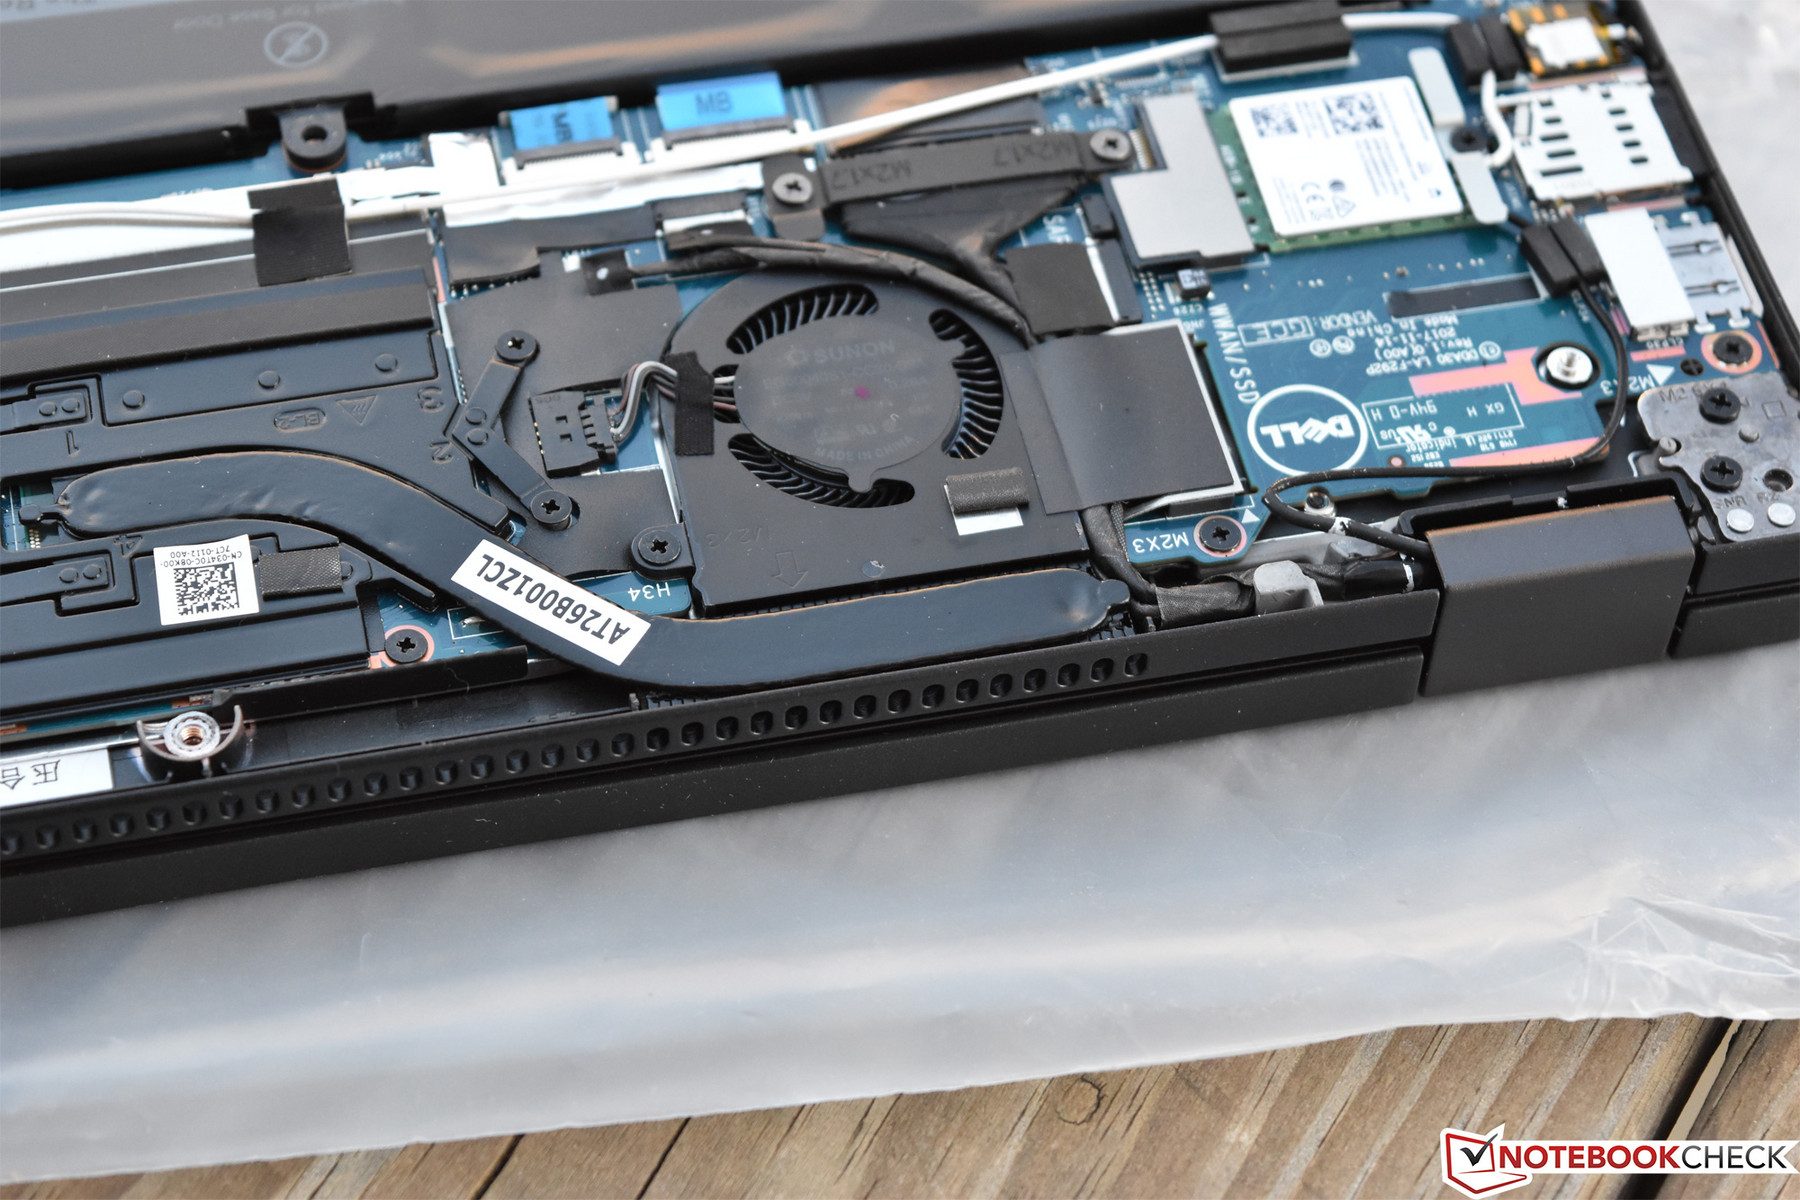
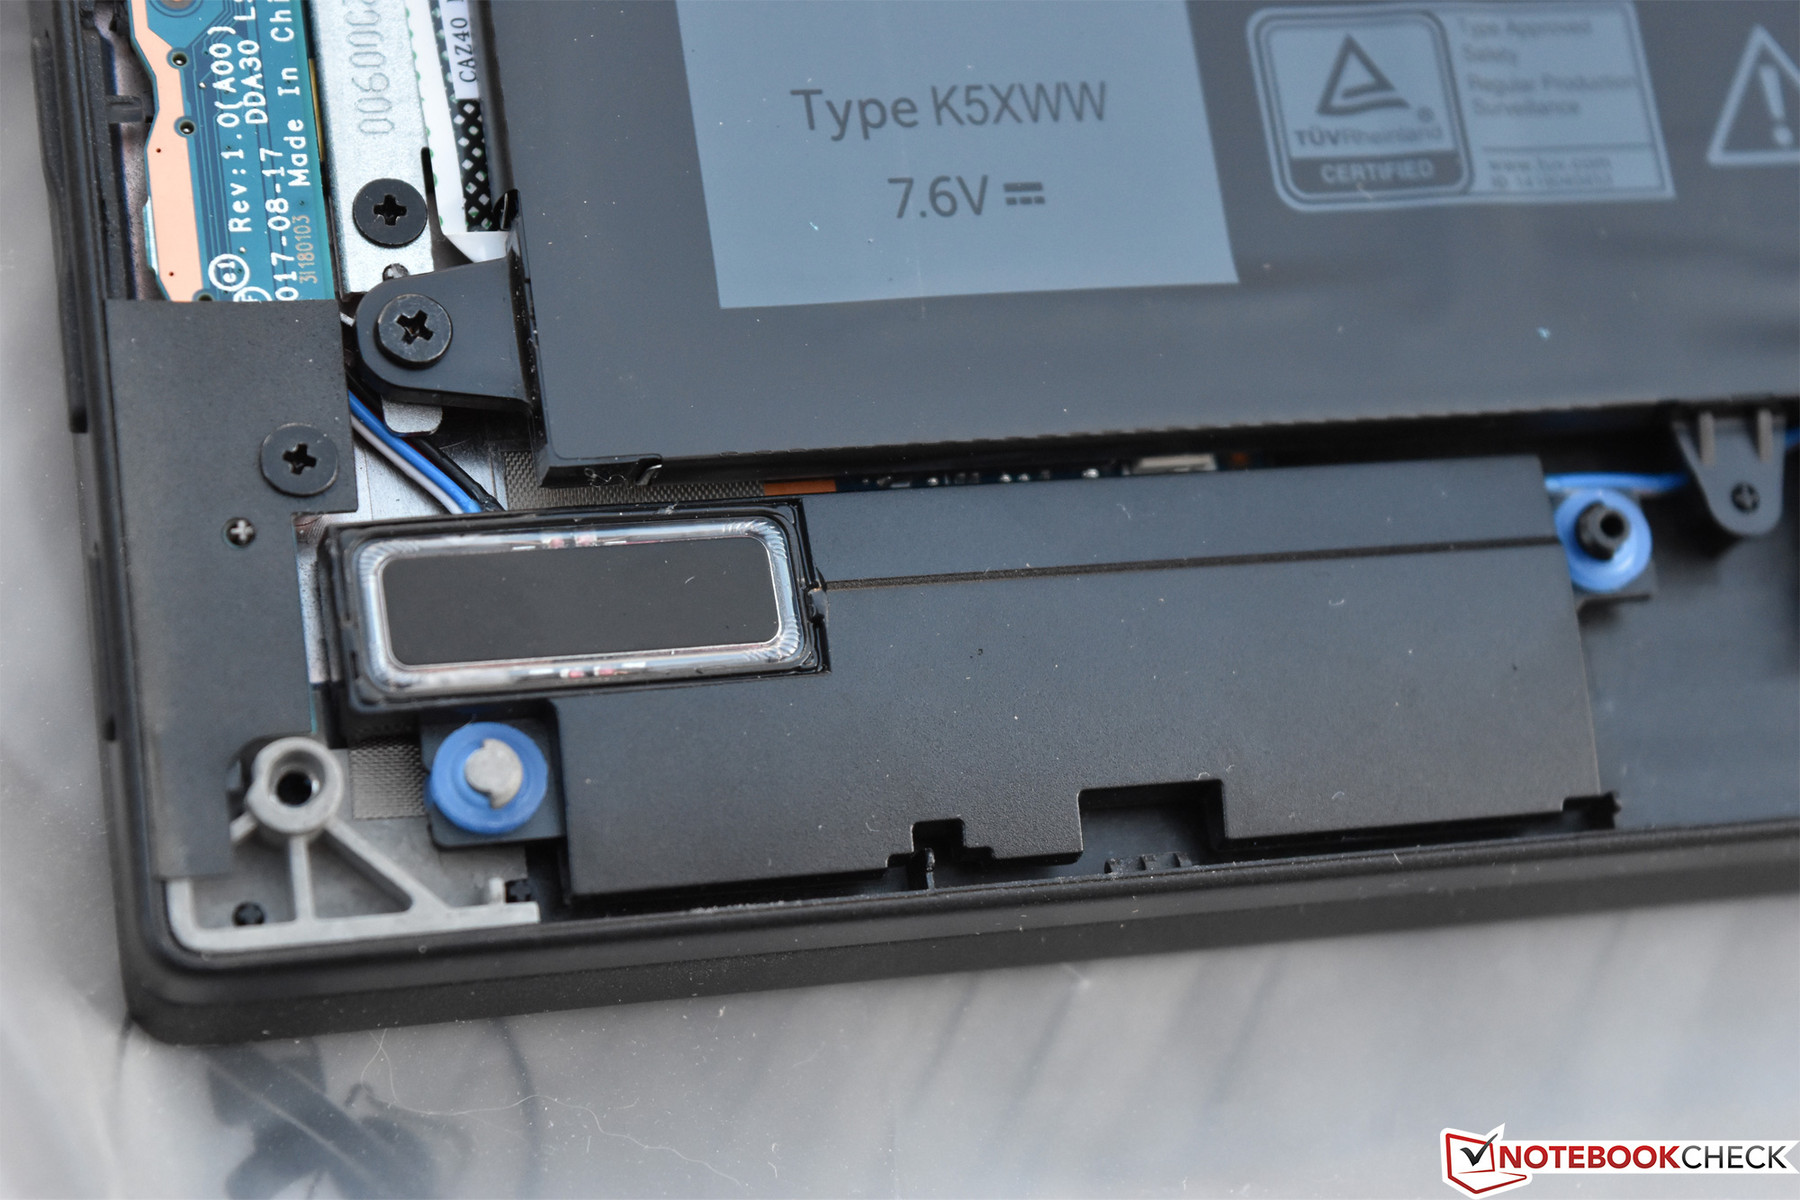
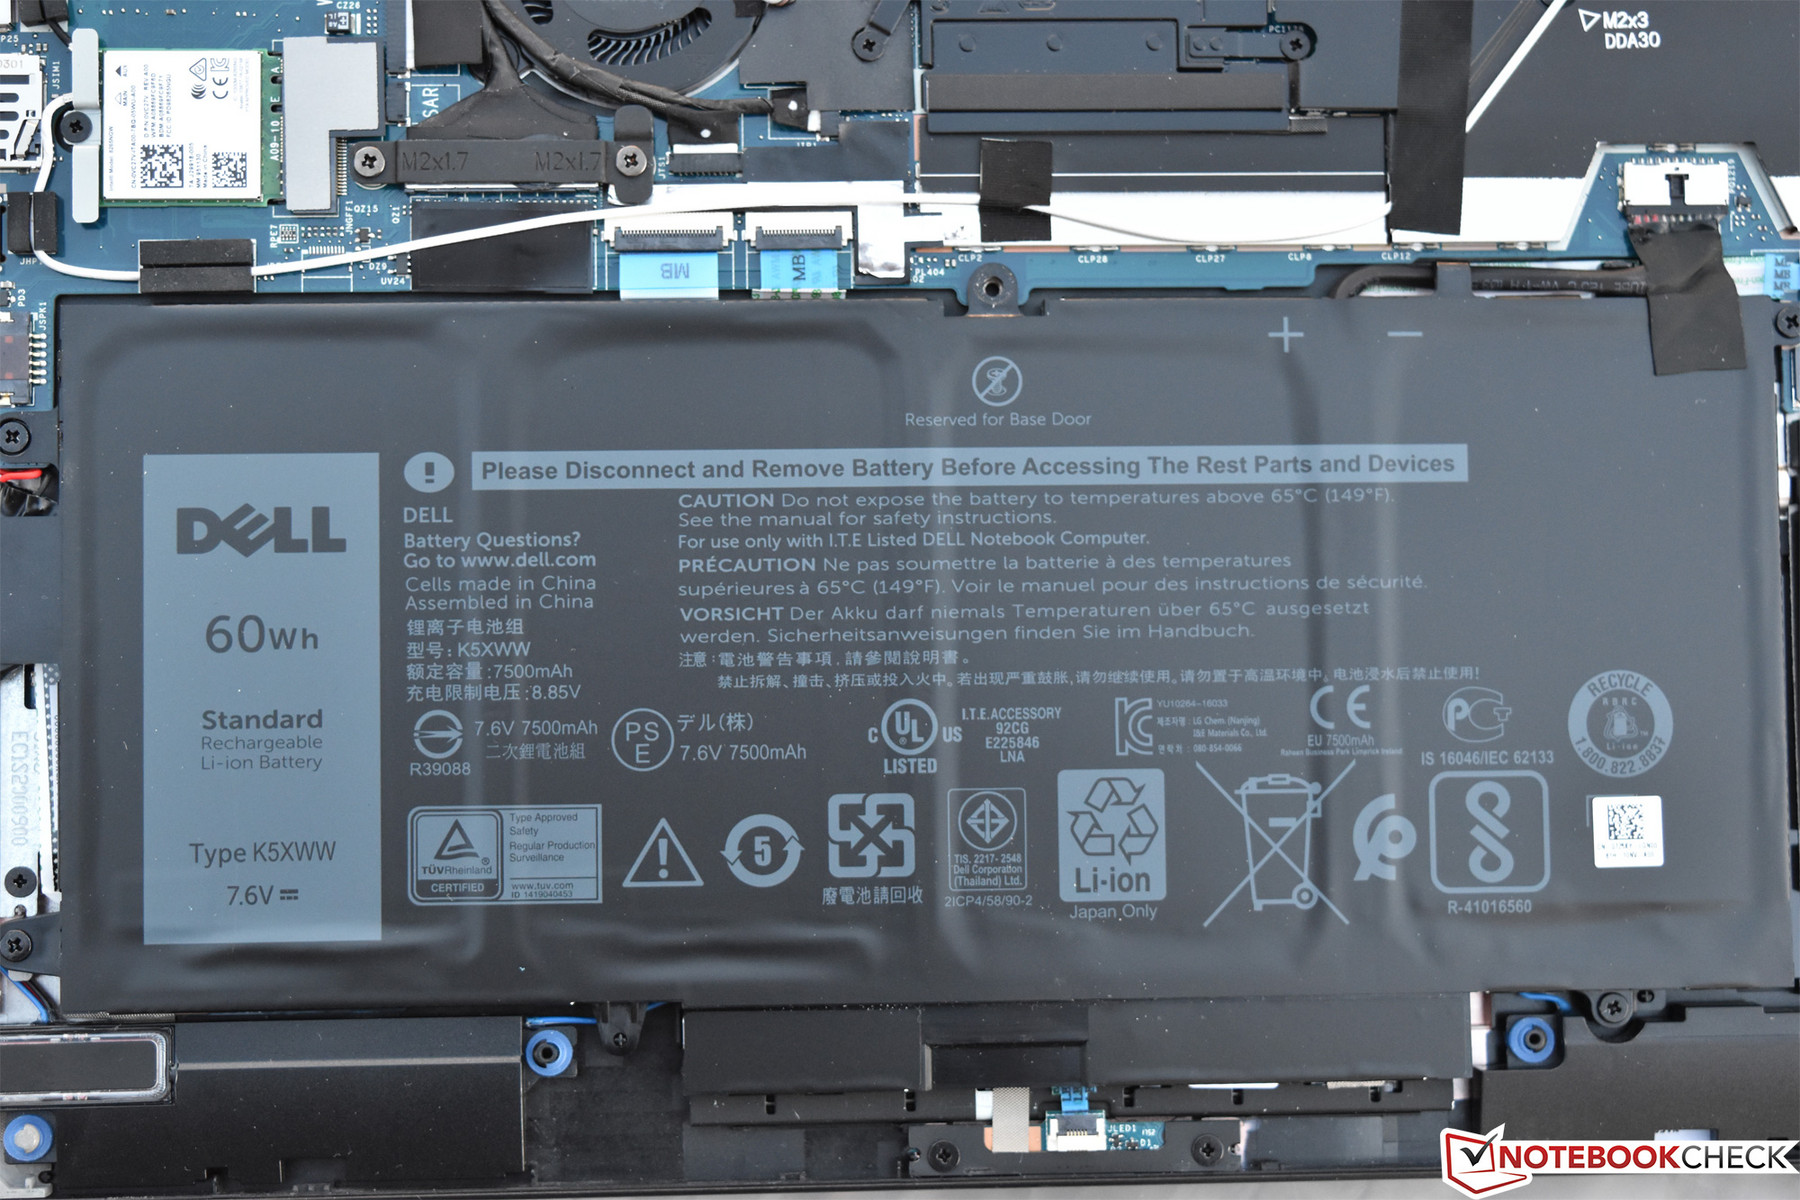
As it ought to be with any business machine, maintenance is a breeze. Eight captive screws securing the bottom cover to the underside of base unit are the only thing that stand between the user and all of the internal components—and, barring the RAM (which is soldered to the board), nearly everything else is easily replaceable. This includes the battery, M.2/NVMe SSD, WLAN card, CMOS battery, cooling fan, and speaker assembly. The only serious negative—and it’s not new to this model—is the fact that the keyboard and touchpad are extremely difficult to replace should either meet an unfortunate fate.

Warranty
Our Latitude 7390 2-in-1 review unit came with an affiliated 1-year depot warranty. Many Latitude 7000 series machines include a standard 3-year on-site warranty, however, and warranty upgrades are always available if the user chooses to pay a premium for better or longer service.
Please see our Guarantees, Return Policies and Warranties FAQ for country-specific information.
Input Devices
Keyboard
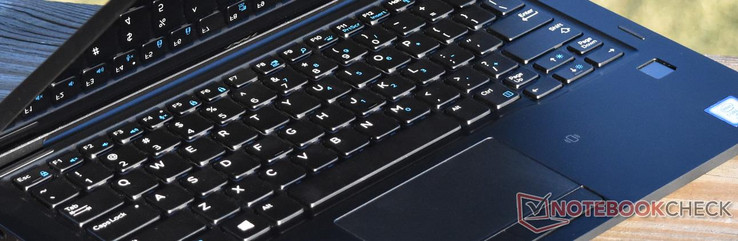
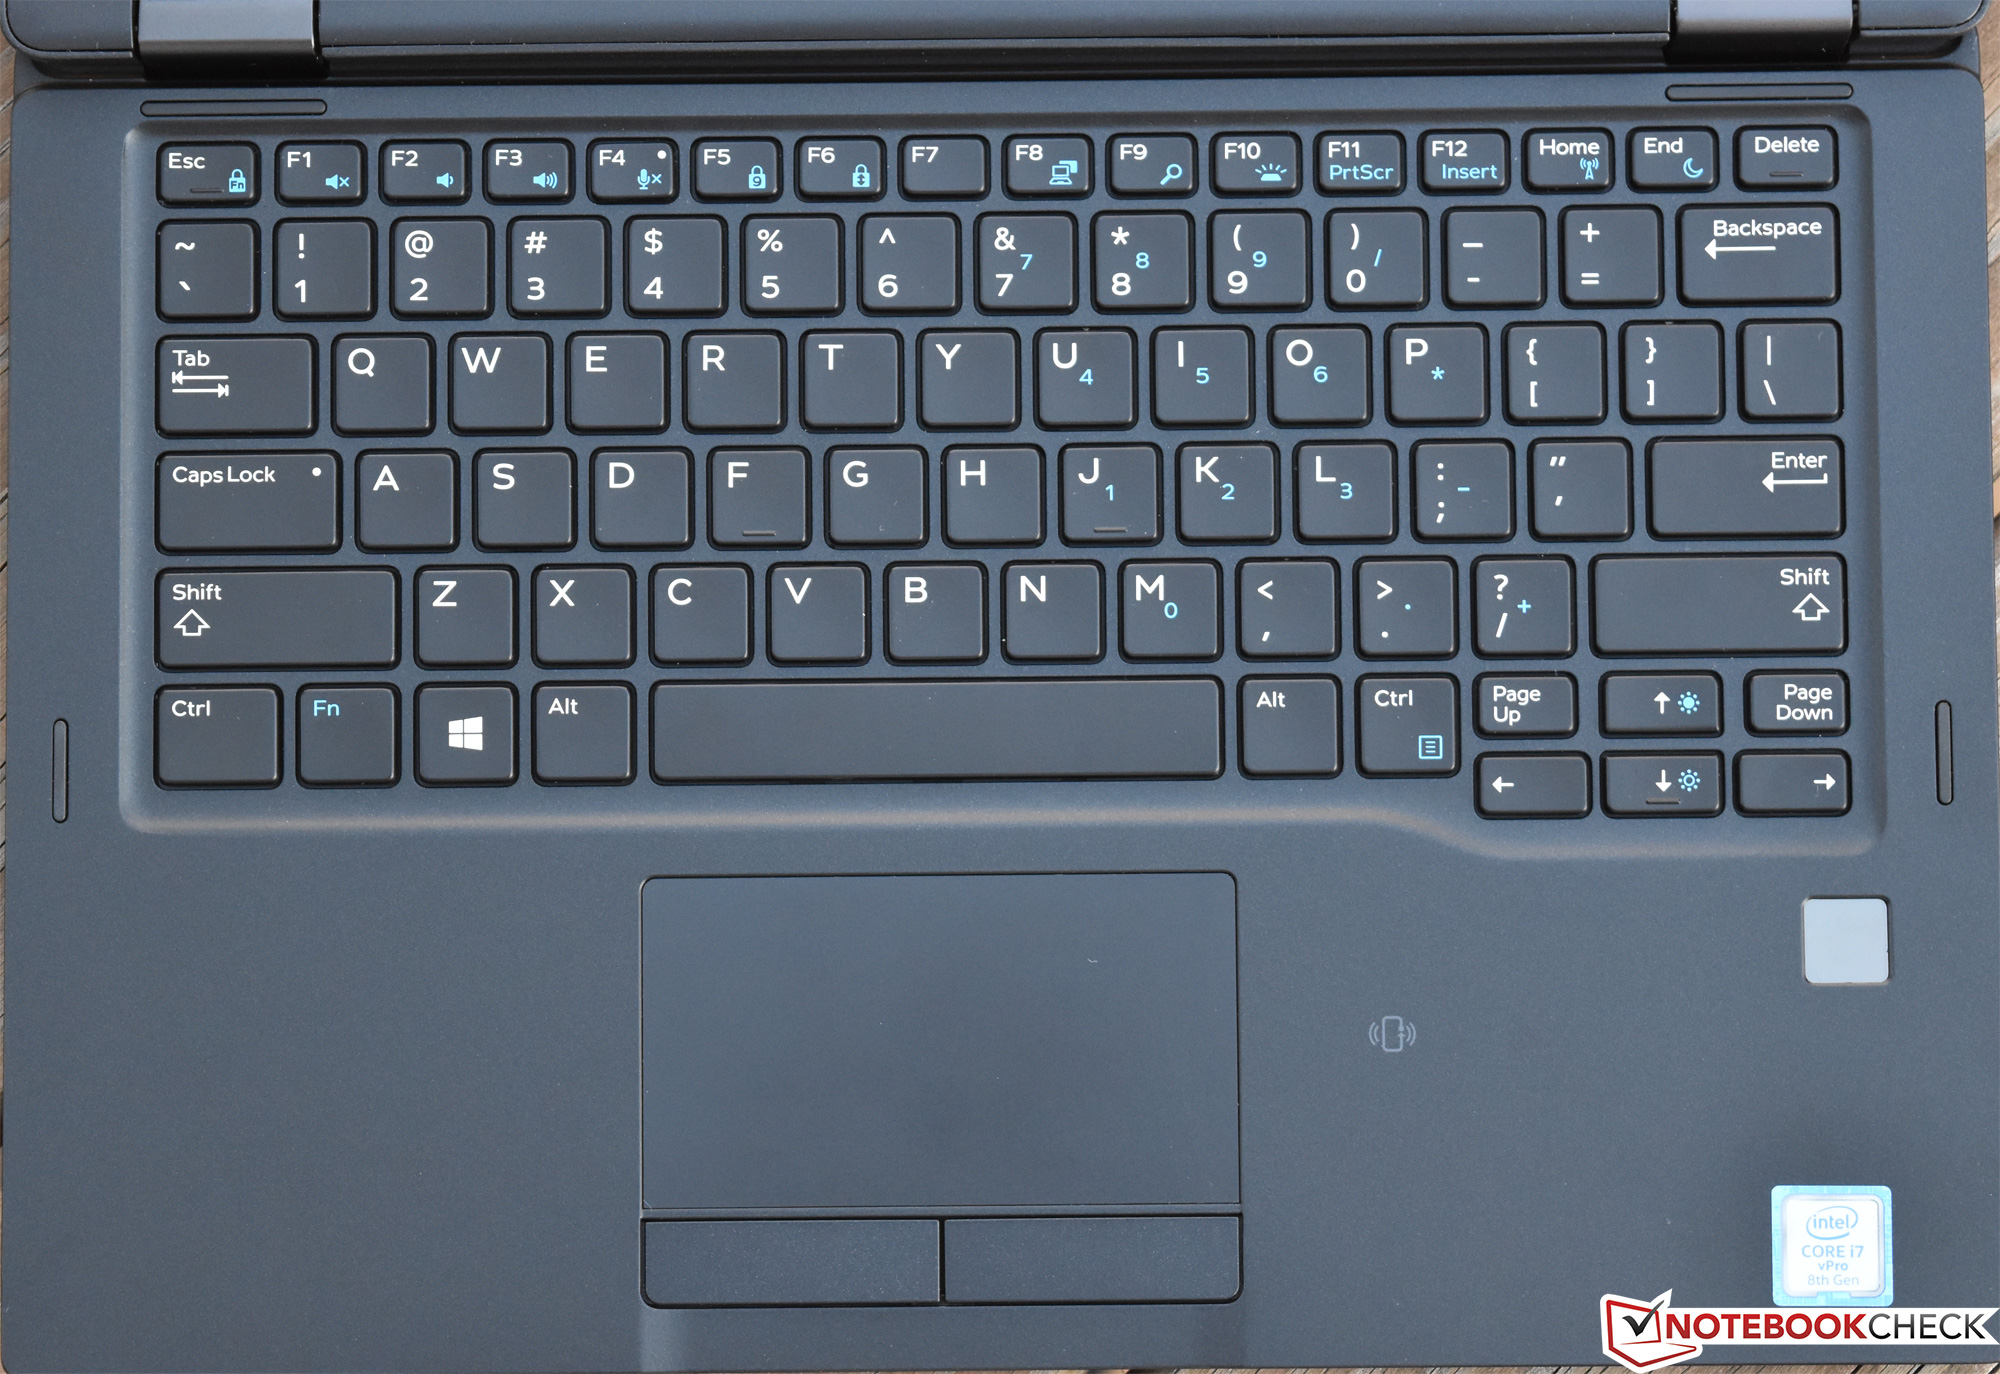
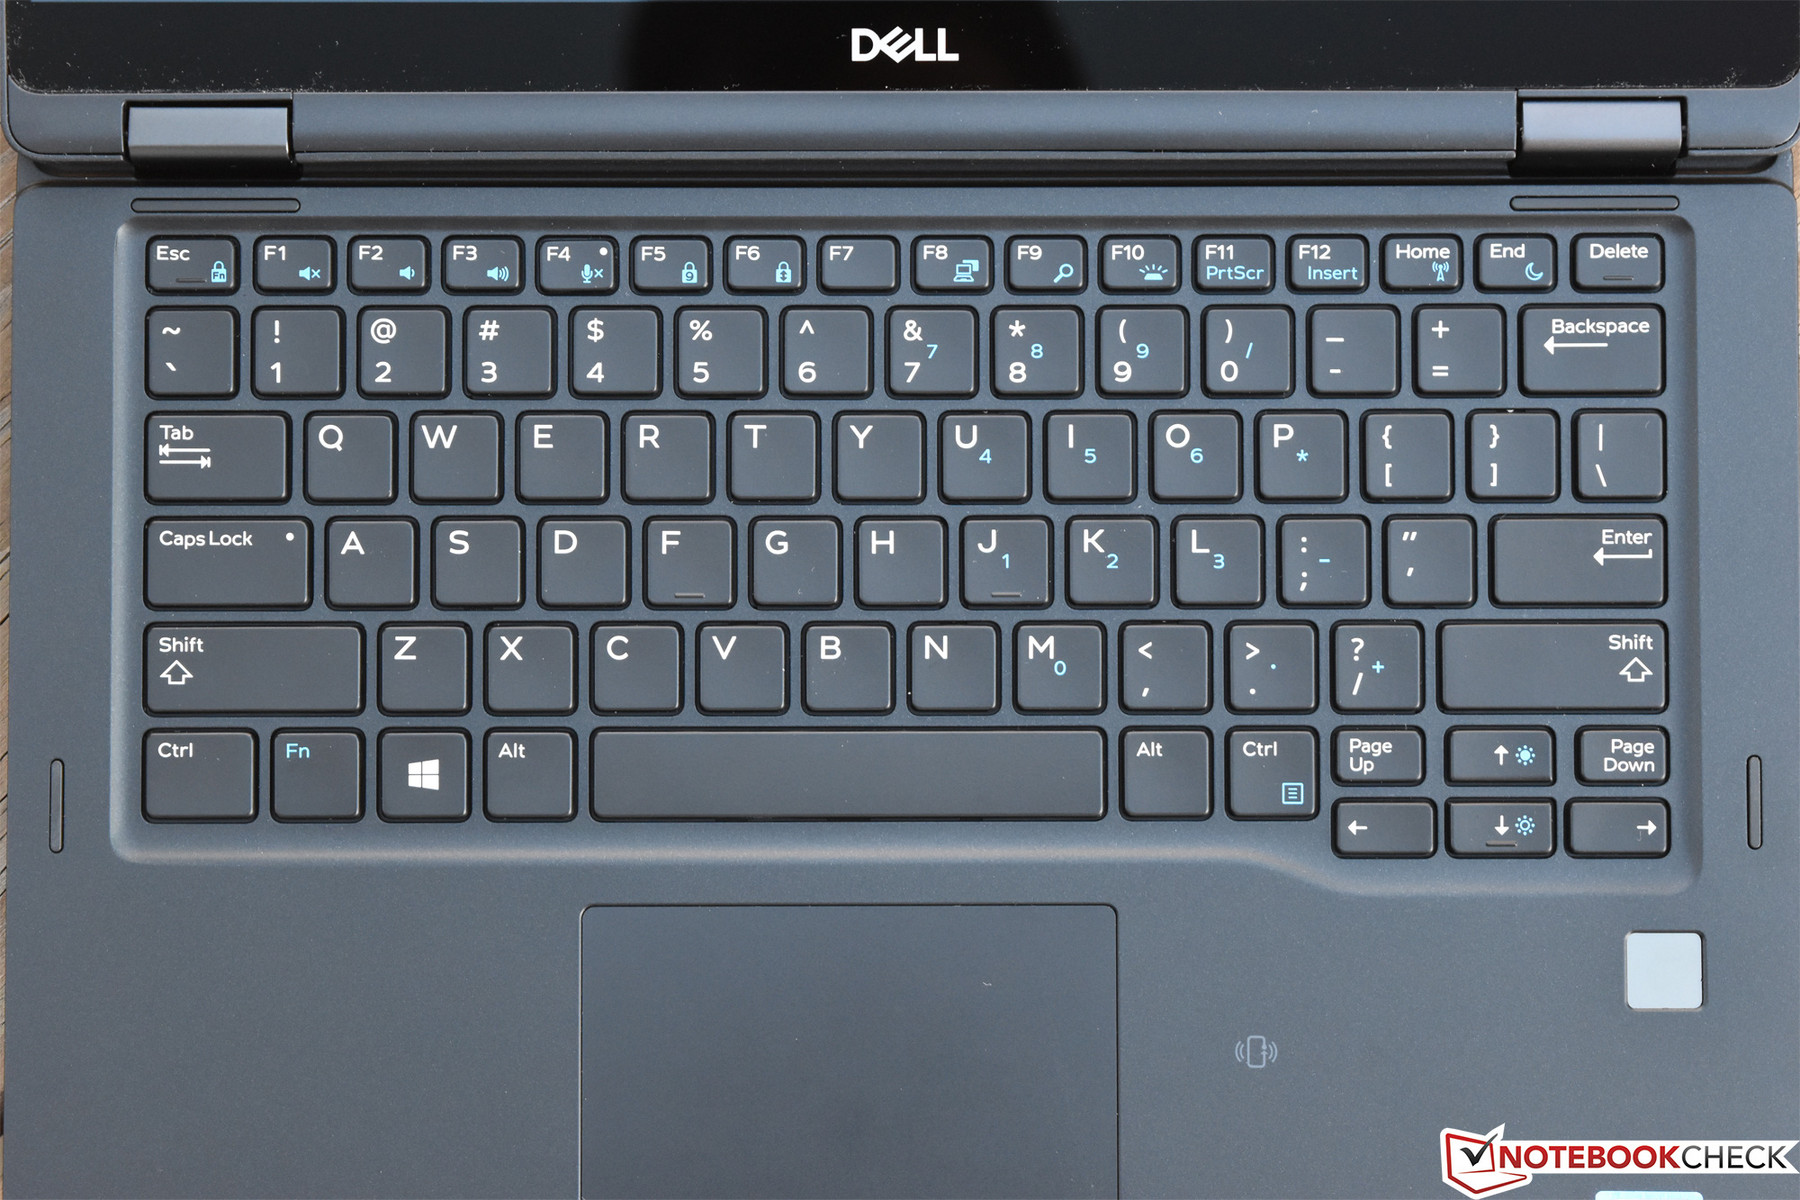
The keyboard is excellent overall, featuring very good key travel and feedback along with well-tuned actuation force. The layout and spacing are both immediately familiar, and the white key labels are easy to read against the black surroundings (not to mention the backlighting, which can be adjusted to two different brightness levels as well as switched off). The keys are tightly-affixed and feature no conspicuous rattle or clatter; their operation is relatively quiet in spite of the stronger feedback.
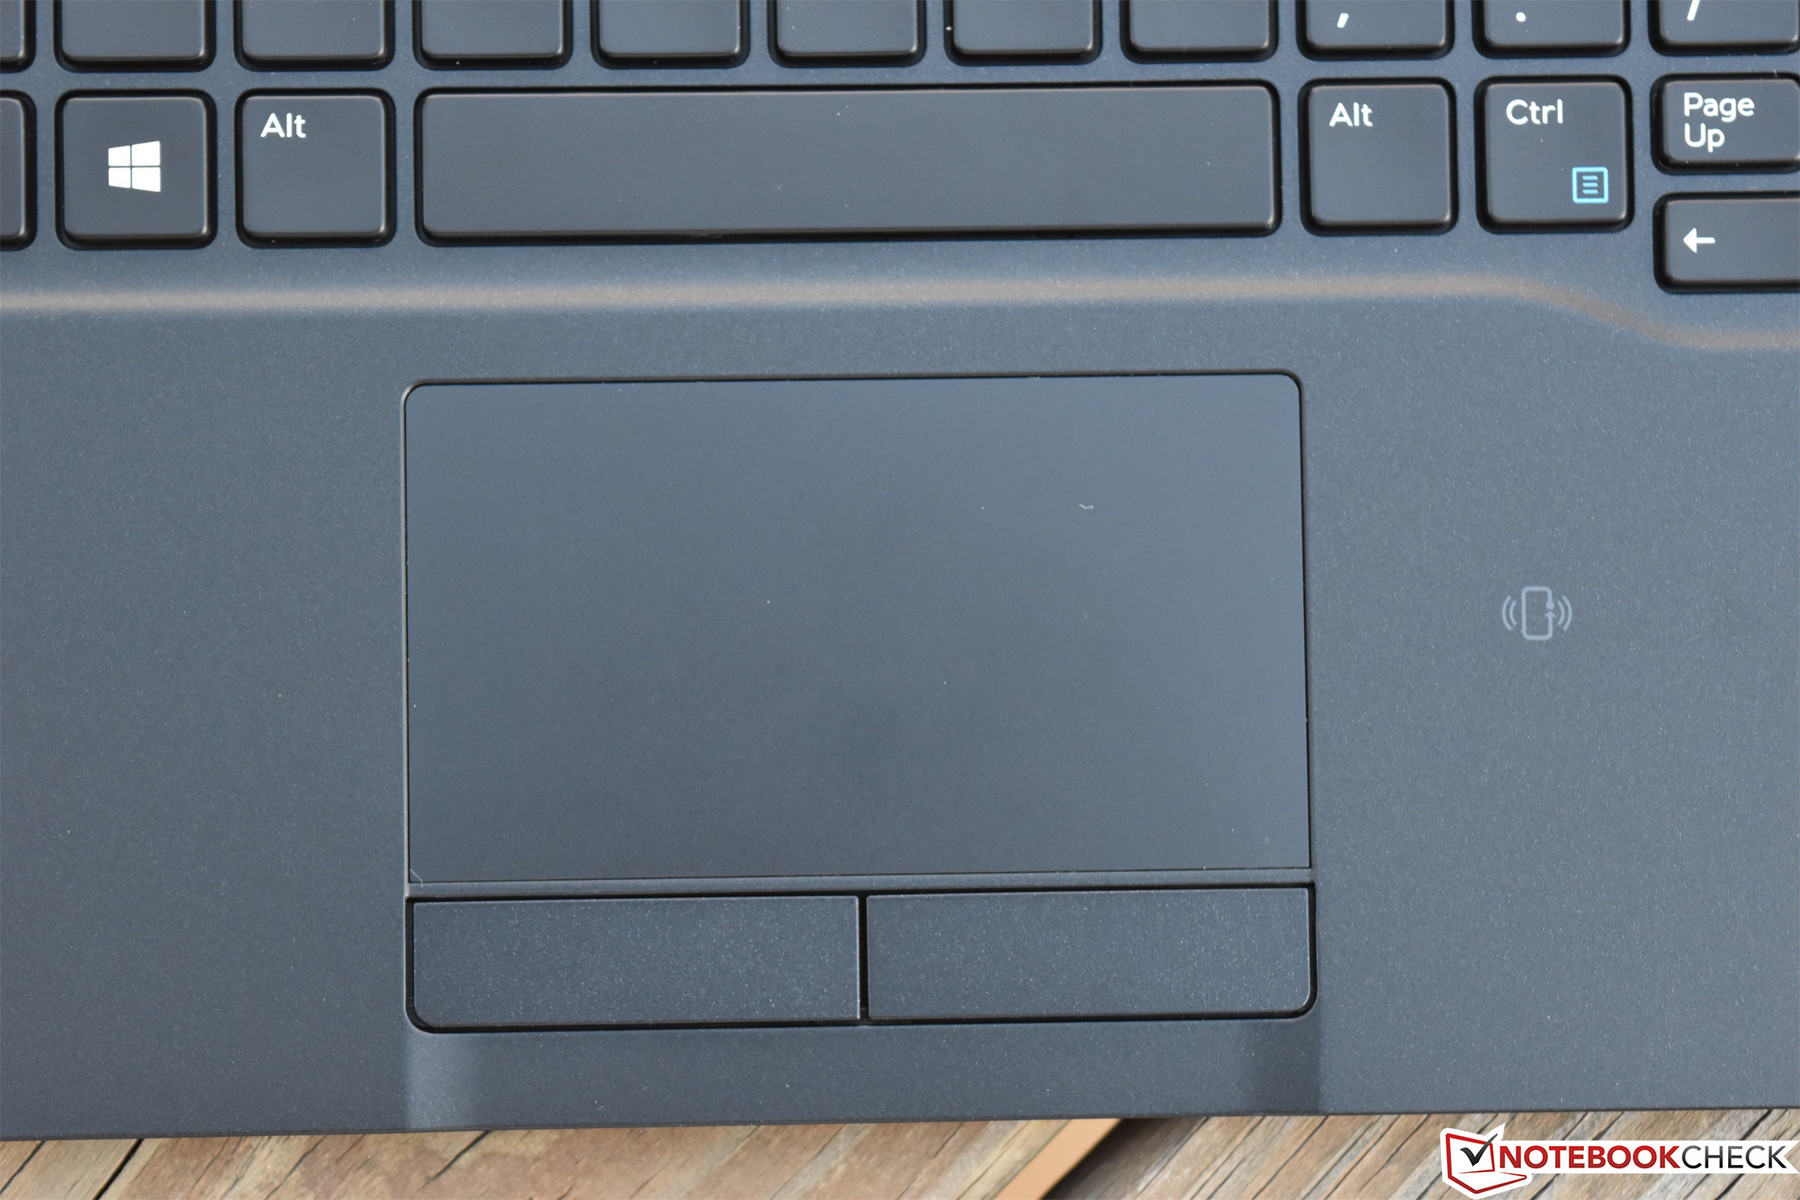
Touchpad
The Alps touchpad is above average overall. It’s not our favorite (given the choice, we prefer the feel of some other Precision touchpads with smooth glass surfaces, such as that of the XPS 13), but the separate physical buttons are always appreciated, and the gestures and pointer motion gave us little to criticize throughout our time with it.
Touchscreen
Of course, every Latitude 7390 2-in-1 features a touchscreen. We experienced no problems with it during our review period.
Display
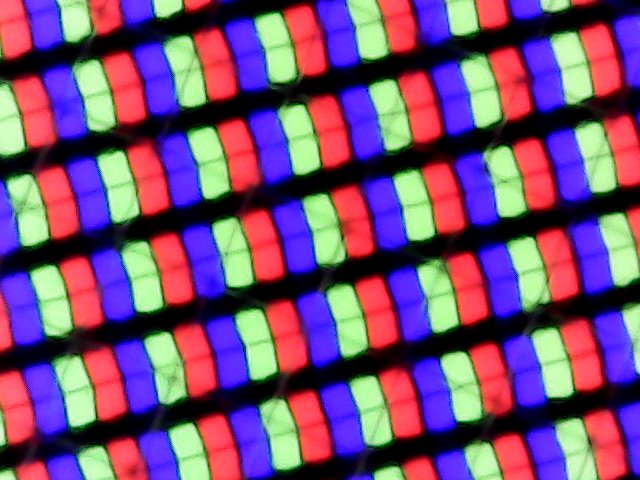
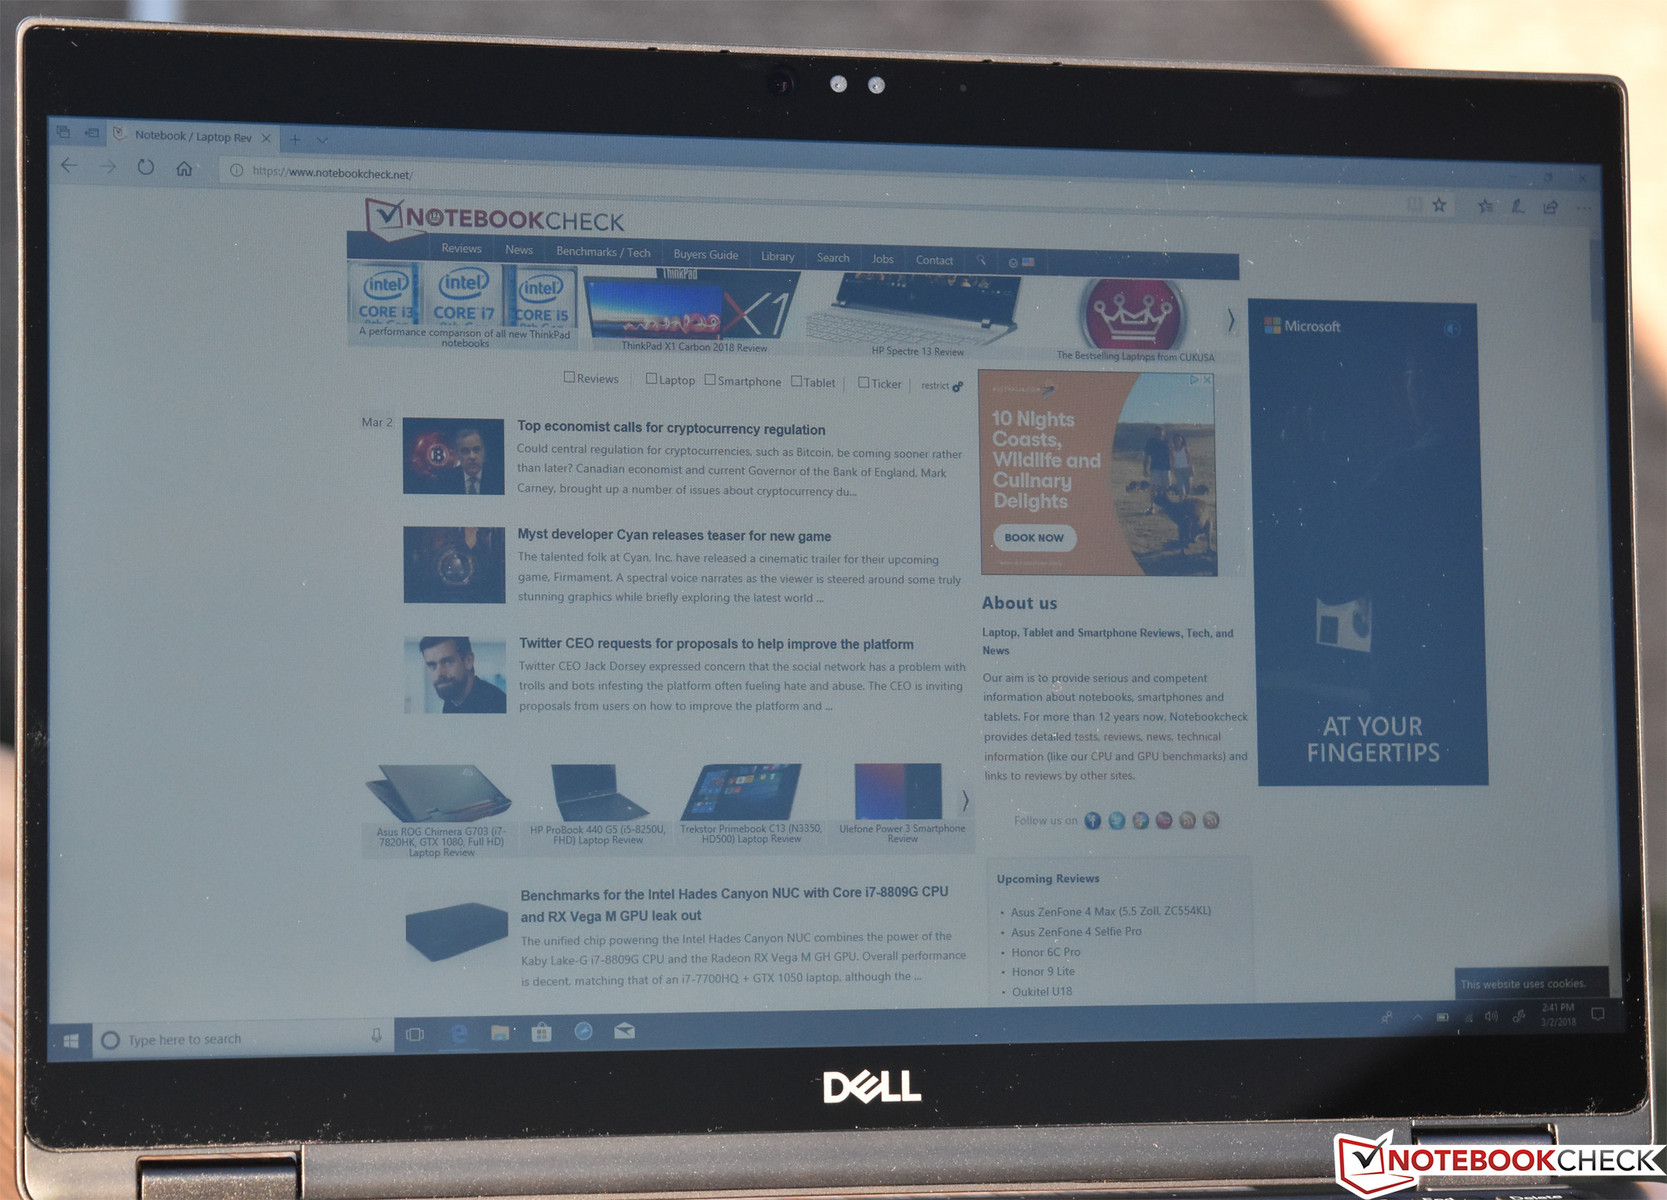
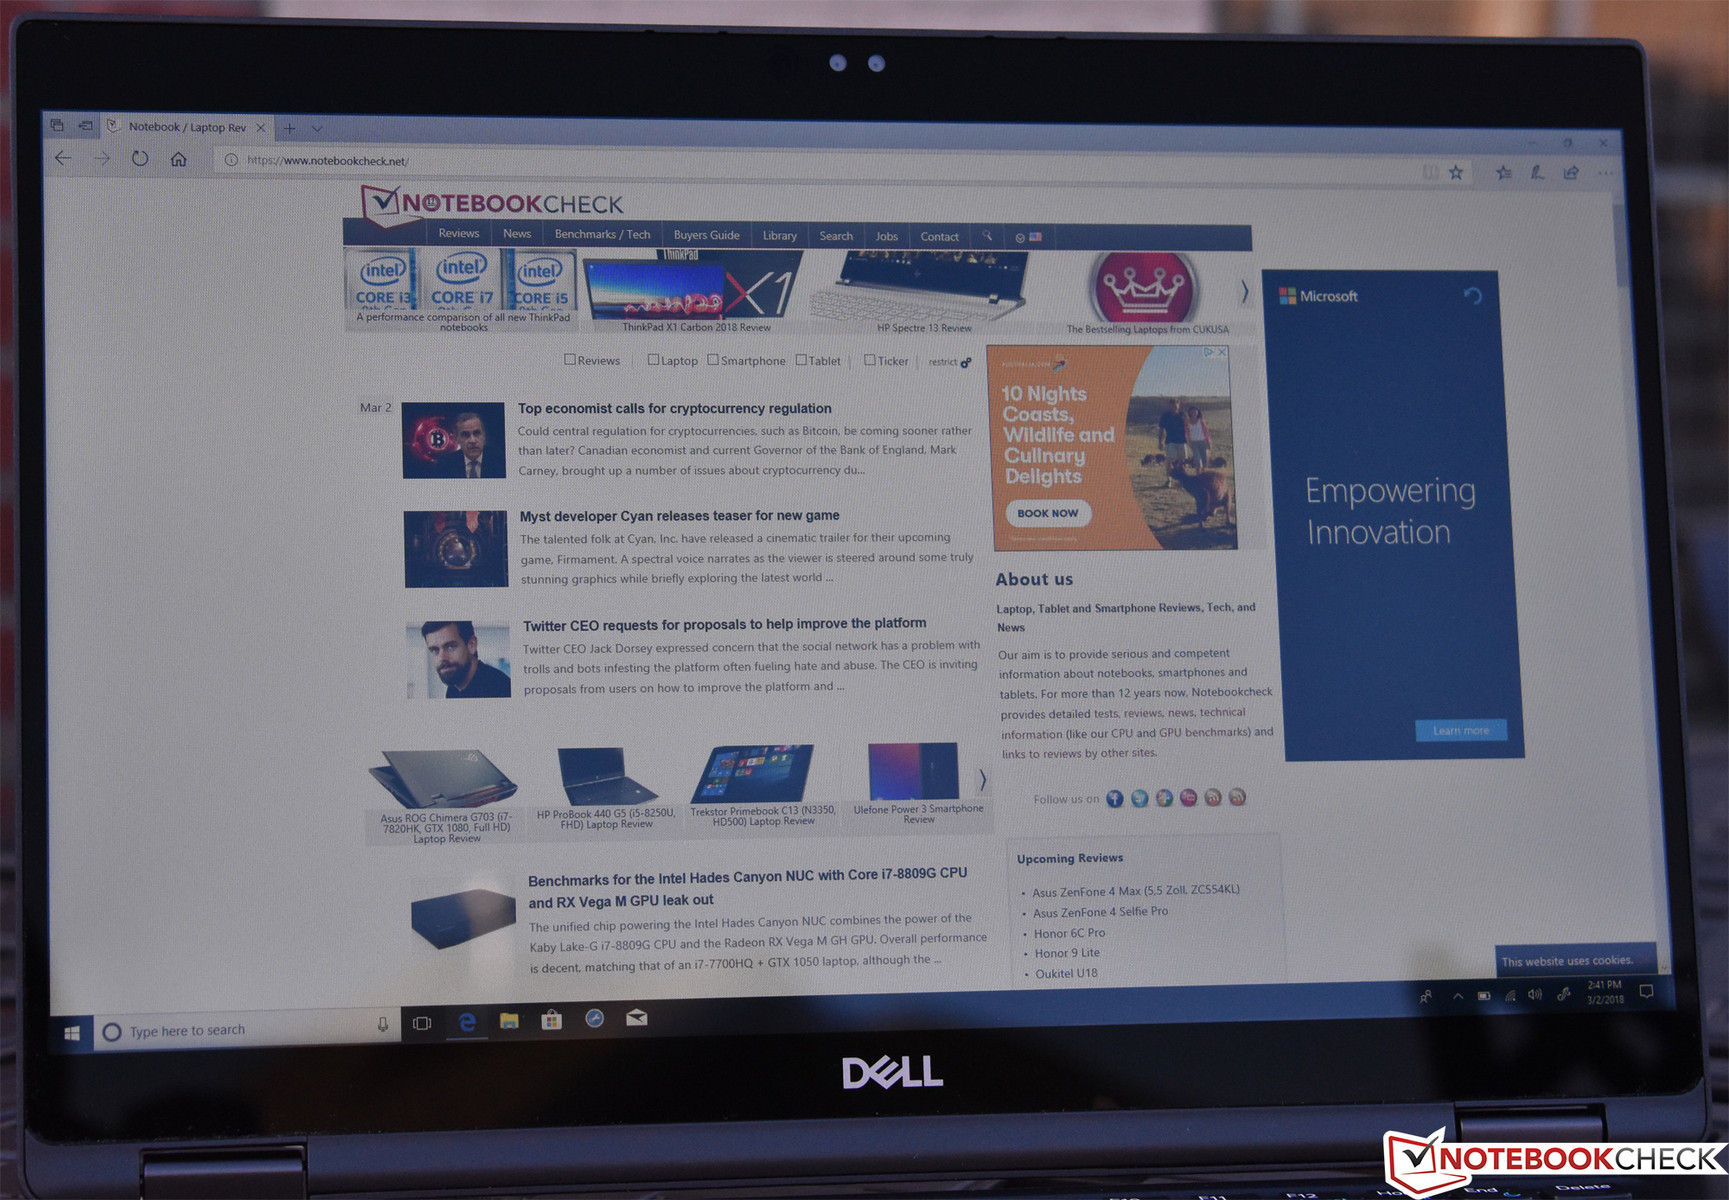
A single display option exists for the Latitude 7390 2-in-1: a 13.3-inch FHD (1920x1080) IPS touchscreen display covered with Corning Gorilla Glass 4. Although Dell refers to the display finish as “anti-reflective” and “anti-smudge”, in our experience it was actually highly reflective. As we mentioned above, the Dell Active Pen is also compatible with the screen. Subjectively, the panel seems fairly bright with good contrast. The PPI of 166 is hardly remarkable, but it’s practical for general use.
| |||||||||||||||||||||||||
Brightness Distribution: 83 %
Center on Battery: 318.2 cd/m²
Contrast: 1061:1 (Black: 0.3 cd/m²)
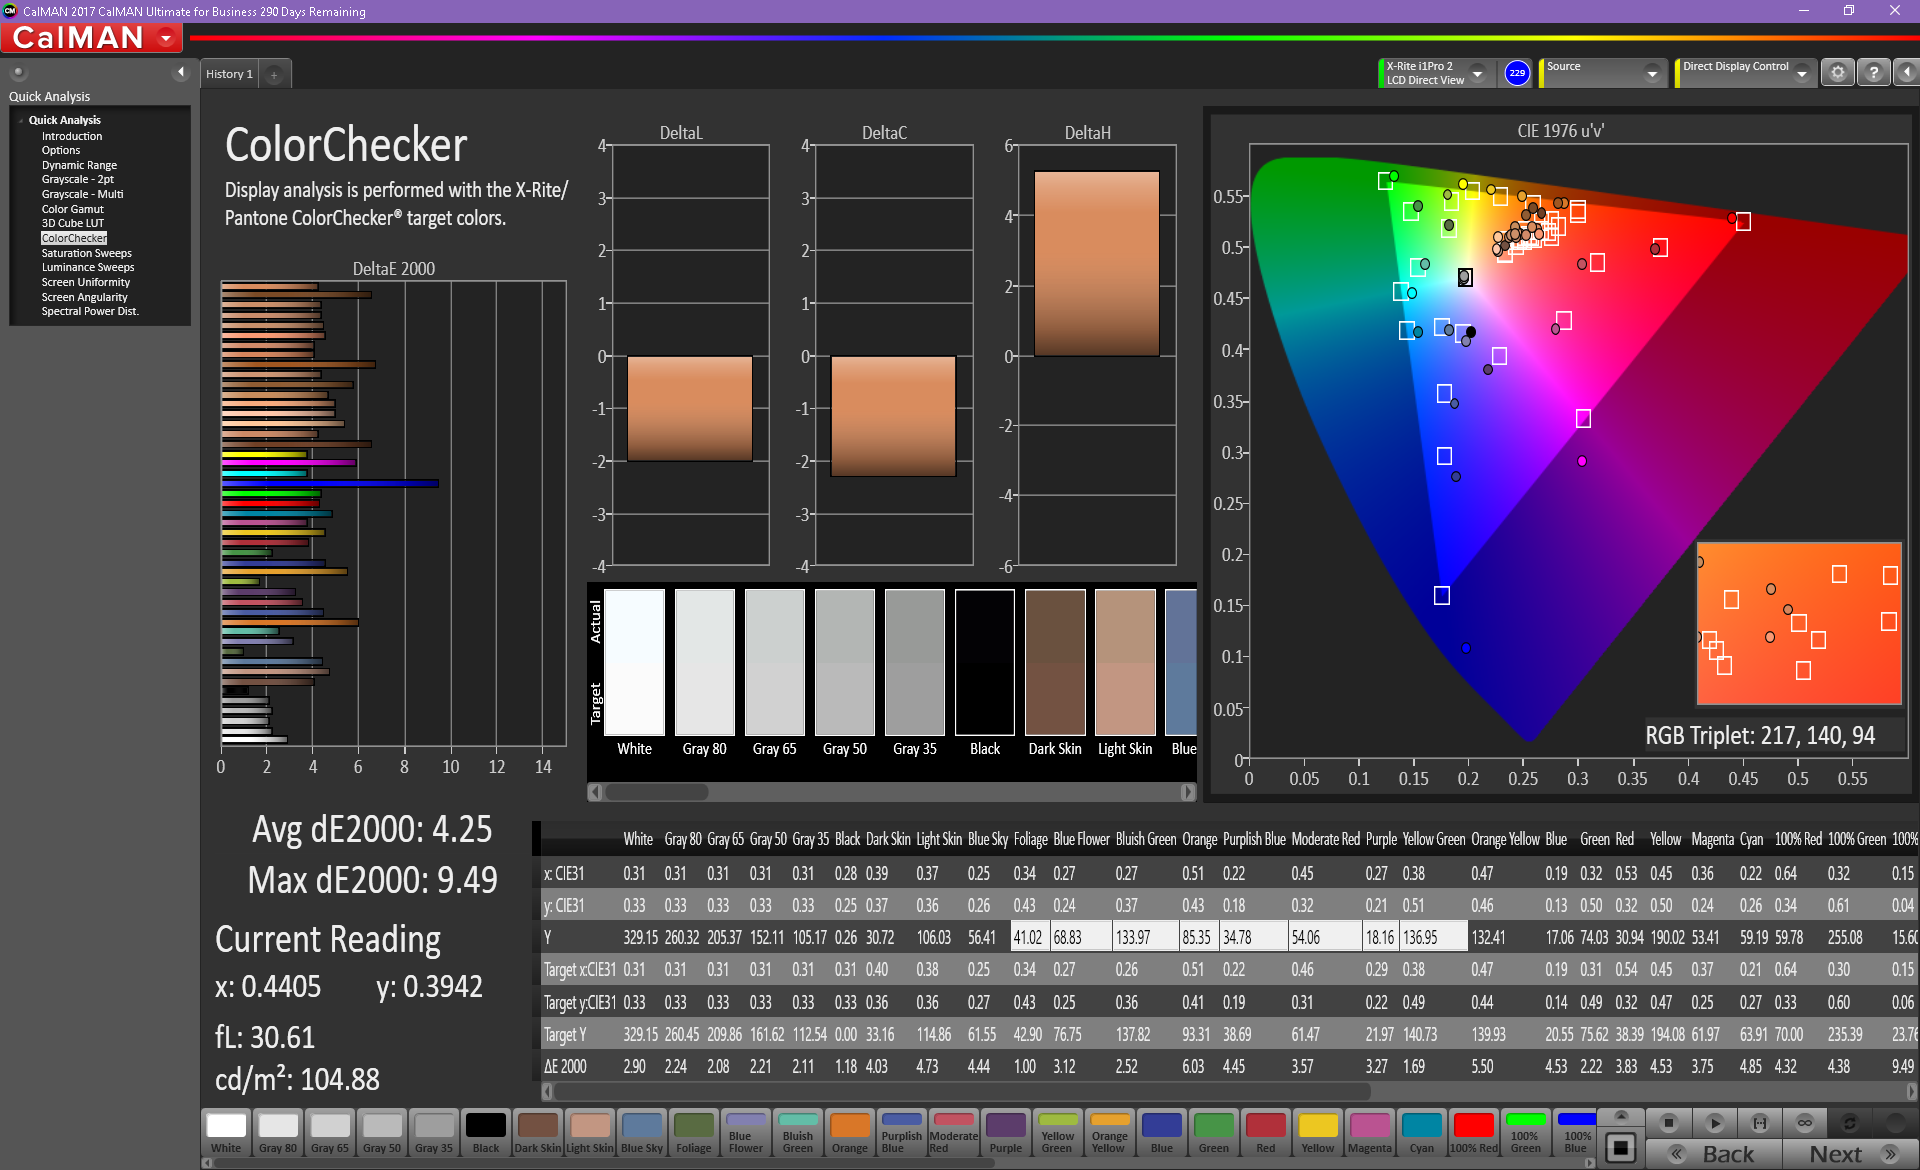
ΔE ColorChecker Calman: 4.25 | ∀{0.5-29.43 Ø4.71}
calibrated: 4.38
ΔE Greyscale Calman: 2.1 | ∀{0.09-98 Ø4.96}
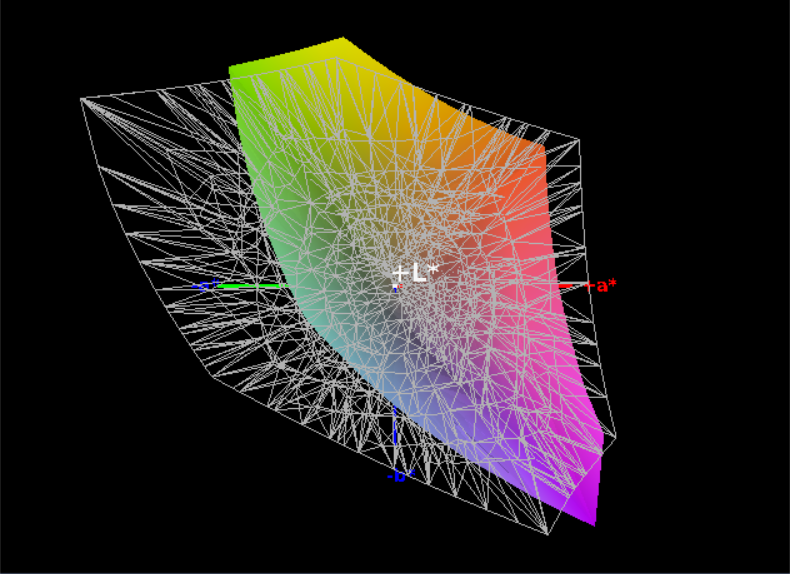
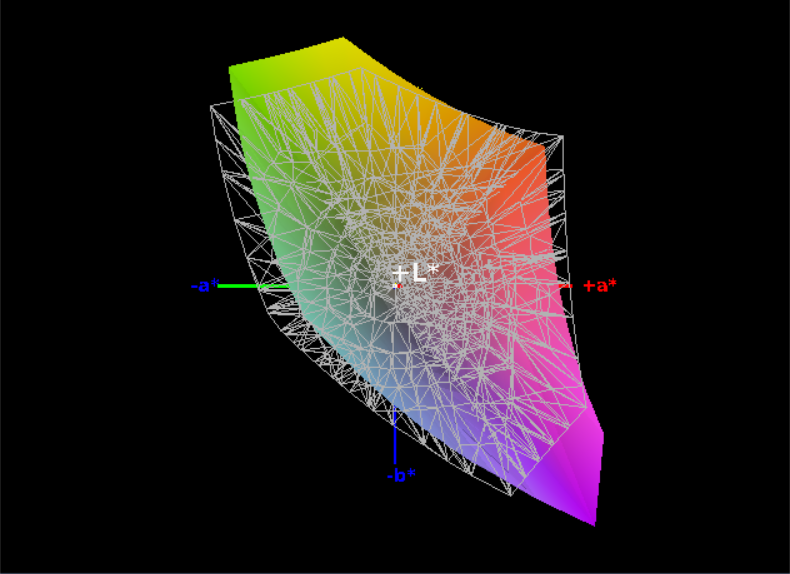
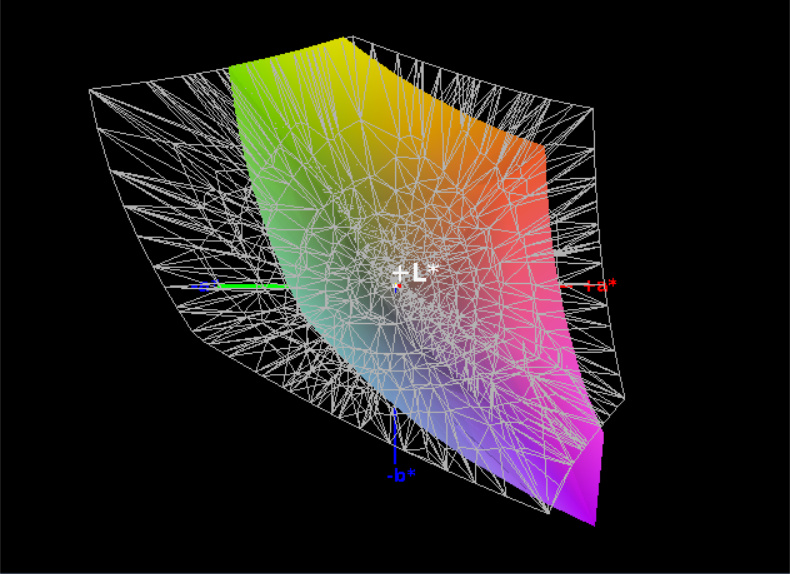
85% sRGB (Argyll 1.6.3 3D)
56% AdobeRGB 1998 (Argyll 1.6.3 3D)
62.9% AdobeRGB 1998 (Argyll 3D)
86.1% sRGB (Argyll 3D)
62.5% Display P3 (Argyll 3D)
Gamma: 2.311
CCT: 6588 K
| Dell Latitude 7390 2-in-1 AUO462D, IPS, 13.3", 1920x1080 | Dell Latitude 13 7380 LGD0589, IPS, 13.3", 1920x1080 | Lenovo ThinkPad X1 Carbon 2018-20KGS03900 B140QAN02.0, IPS, 14", 2560x1440 | HP Elitebook 1040 G4-2XU40UT Chi Mei CMN14D7, IPS, 14", 1920x1080 | Asus ZenBook 13 UX331UN AU Optronics B133HAN04.9, IPS, 13.3", 1920x1080 | Toshiba Portege A30-D-139 Toshiba TOS508F, IPS, 13.3", 1920x1080 | |
|---|---|---|---|---|---|---|
| Display | 6% | 38% | 10% | 1% | 11% | |
| Display P3 Coverage (%) | 62.5 | 65.5 5% | 87.7 40% | 66.8 7% | 63.3 1% | 68 9% |
| sRGB Coverage (%) | 86.1 | 91.8 7% | 100 16% | 97.1 13% | 86.7 1% | 98.1 14% |
| AdobeRGB 1998 Coverage (%) | 62.9 | 65.8 5% | 99.9 59% | 69 10% | 63.4 1% | 70 11% |
| Response Times | 17% | -17% | 16% | 16% | 10% | |
| Response Time Grey 50% / Grey 80% * (ms) | 48.8 ? | 34 ? 30% | 59.2 ? -21% | 34.4 ? 30% | 44 ? 10% | 40 ? 18% |
| Response Time Black / White * (ms) | 30.4 ? | 29.6 ? 3% | 34.4 ? -13% | 30 ? 1% | 24 ? 21% | 30 ? 1% |
| PWM Frequency (Hz) | 26040 ? | 208 ? | ||||
| Screen | -31% | 36% | -3% | 1% | -10% | |
| Brightness middle (cd/m²) | 318.2 | 317 0% | 578 82% | 295.9 -7% | 329 3% | 319 0% |
| Brightness (cd/m²) | 312 | 295 -5% | 533 71% | 287 -8% | 306 -2% | 296 -5% |
| Brightness Distribution (%) | 83 | 87 5% | 84 1% | 87 5% | 86 4% | 88 6% |
| Black Level * (cd/m²) | 0.3 | 0.3 -0% | 0.38 -27% | 0.23 23% | 0.3 -0% | 0.28 7% |
| Contrast (:1) | 1061 | 1057 0% | 1521 43% | 1287 21% | 1097 3% | 1139 7% |
| Colorchecker dE 2000 * | 4.25 | 6.3 -48% | 1.9 55% | 2.83 33% | 4.07 4% | 4.04 5% |
| Colorchecker dE 2000 max. * | 9.49 | 10.4 -10% | 3.8 60% | 7.34 23% | 7.05 26% | 8.09 15% |
| Colorchecker dE 2000 calibrated * | 4.38 | 0.8 82% | ||||
| Greyscale dE 2000 * | 2.1 | 7.8 -271% | 3 -43% | 5.2 -148% | 2.76 -31% | 5.5 -162% |
| Gamma | 2.311 95% | 1.81 122% | 2.14 103% | 2.28 96% | 2.56 86% | 2.4 92% |
| CCT | 6588 99% | 7120 91% | 6377 102% | 7056 92% | 6915 94% | 7198 90% |
| Color Space (Percent of AdobeRGB 1998) (%) | 56 | 61 9% | 88.8 59% | 63 13% | 56 0% | 64 14% |
| Color Space (Percent of sRGB) (%) | 85 | 92 8% | 100 18% | 97 14% | 86 1% | 98 15% |
| Total Average (Program / Settings) | -3% /
-17% | 19% /
30% | 8% /
2% | 6% /
3% | 4% /
-3% |
* ... smaller is better
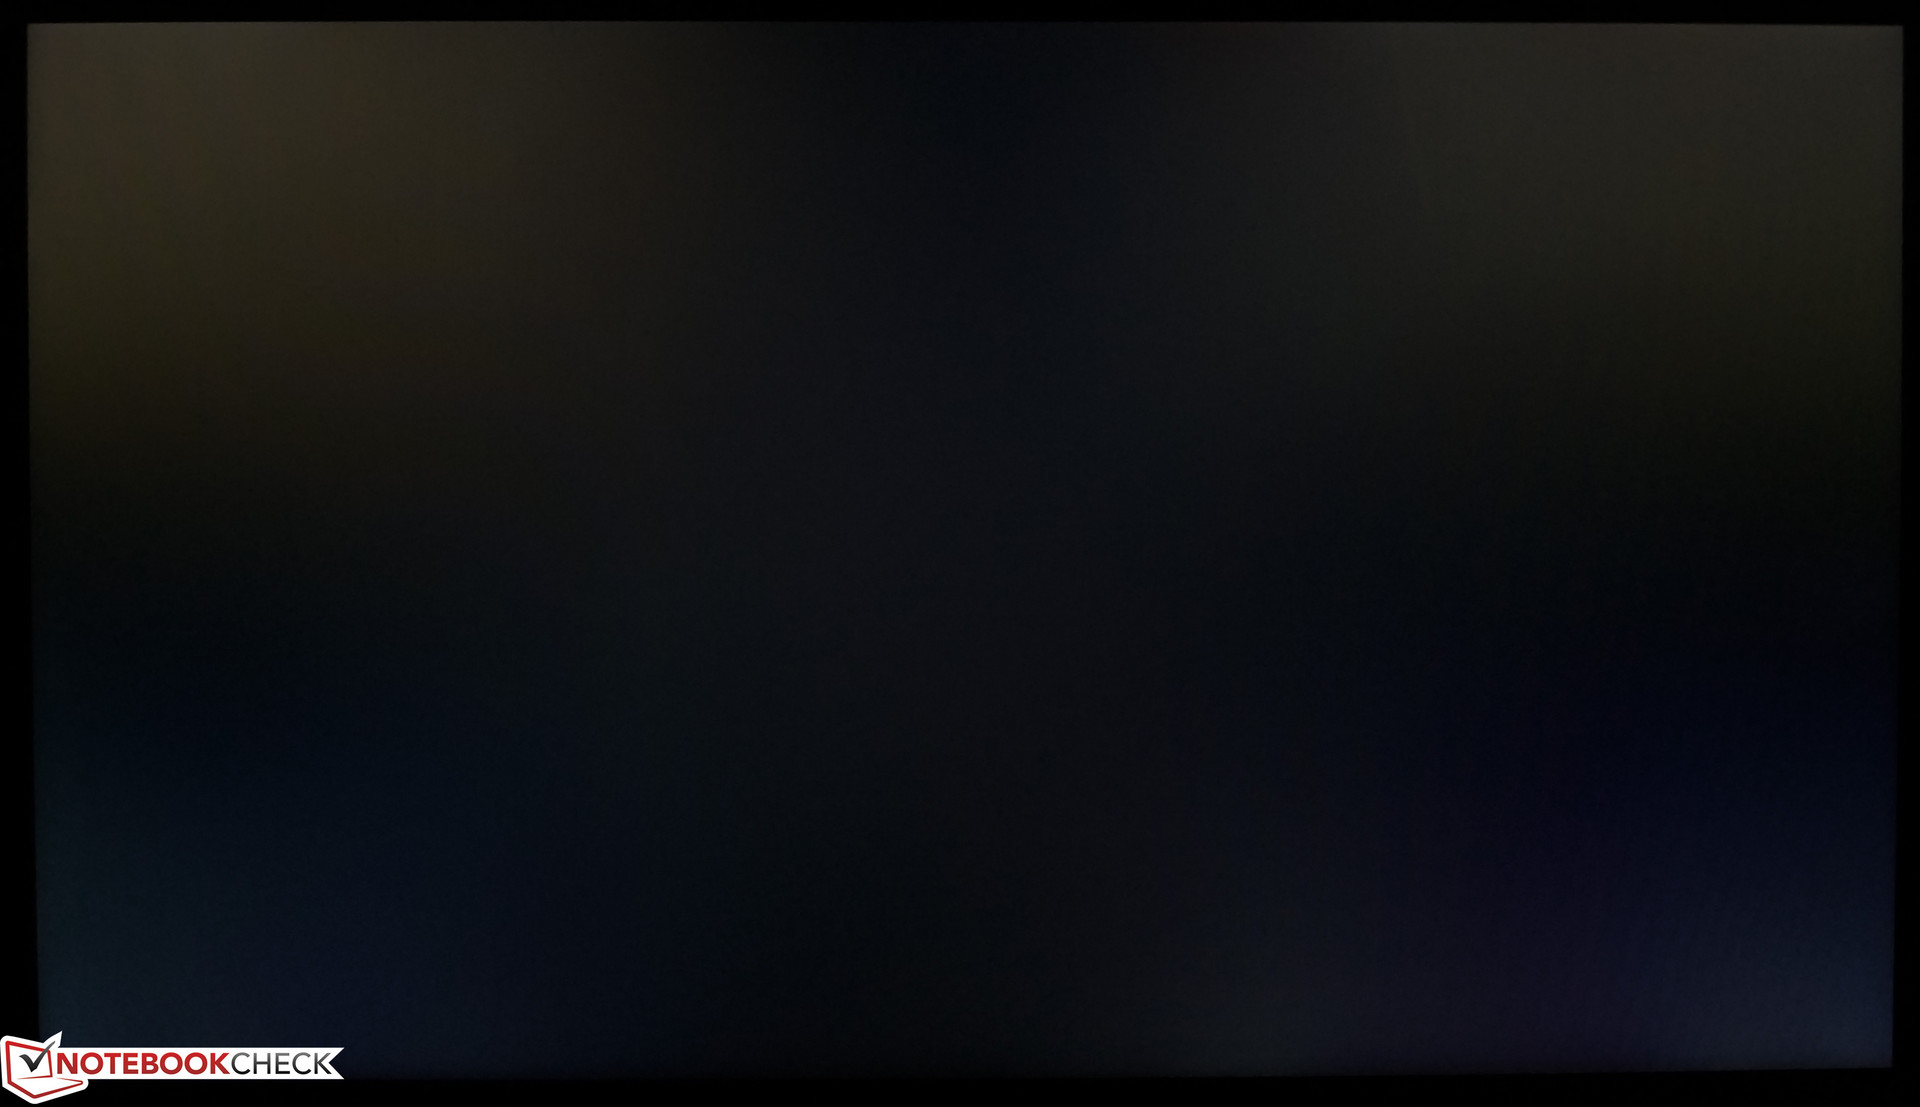
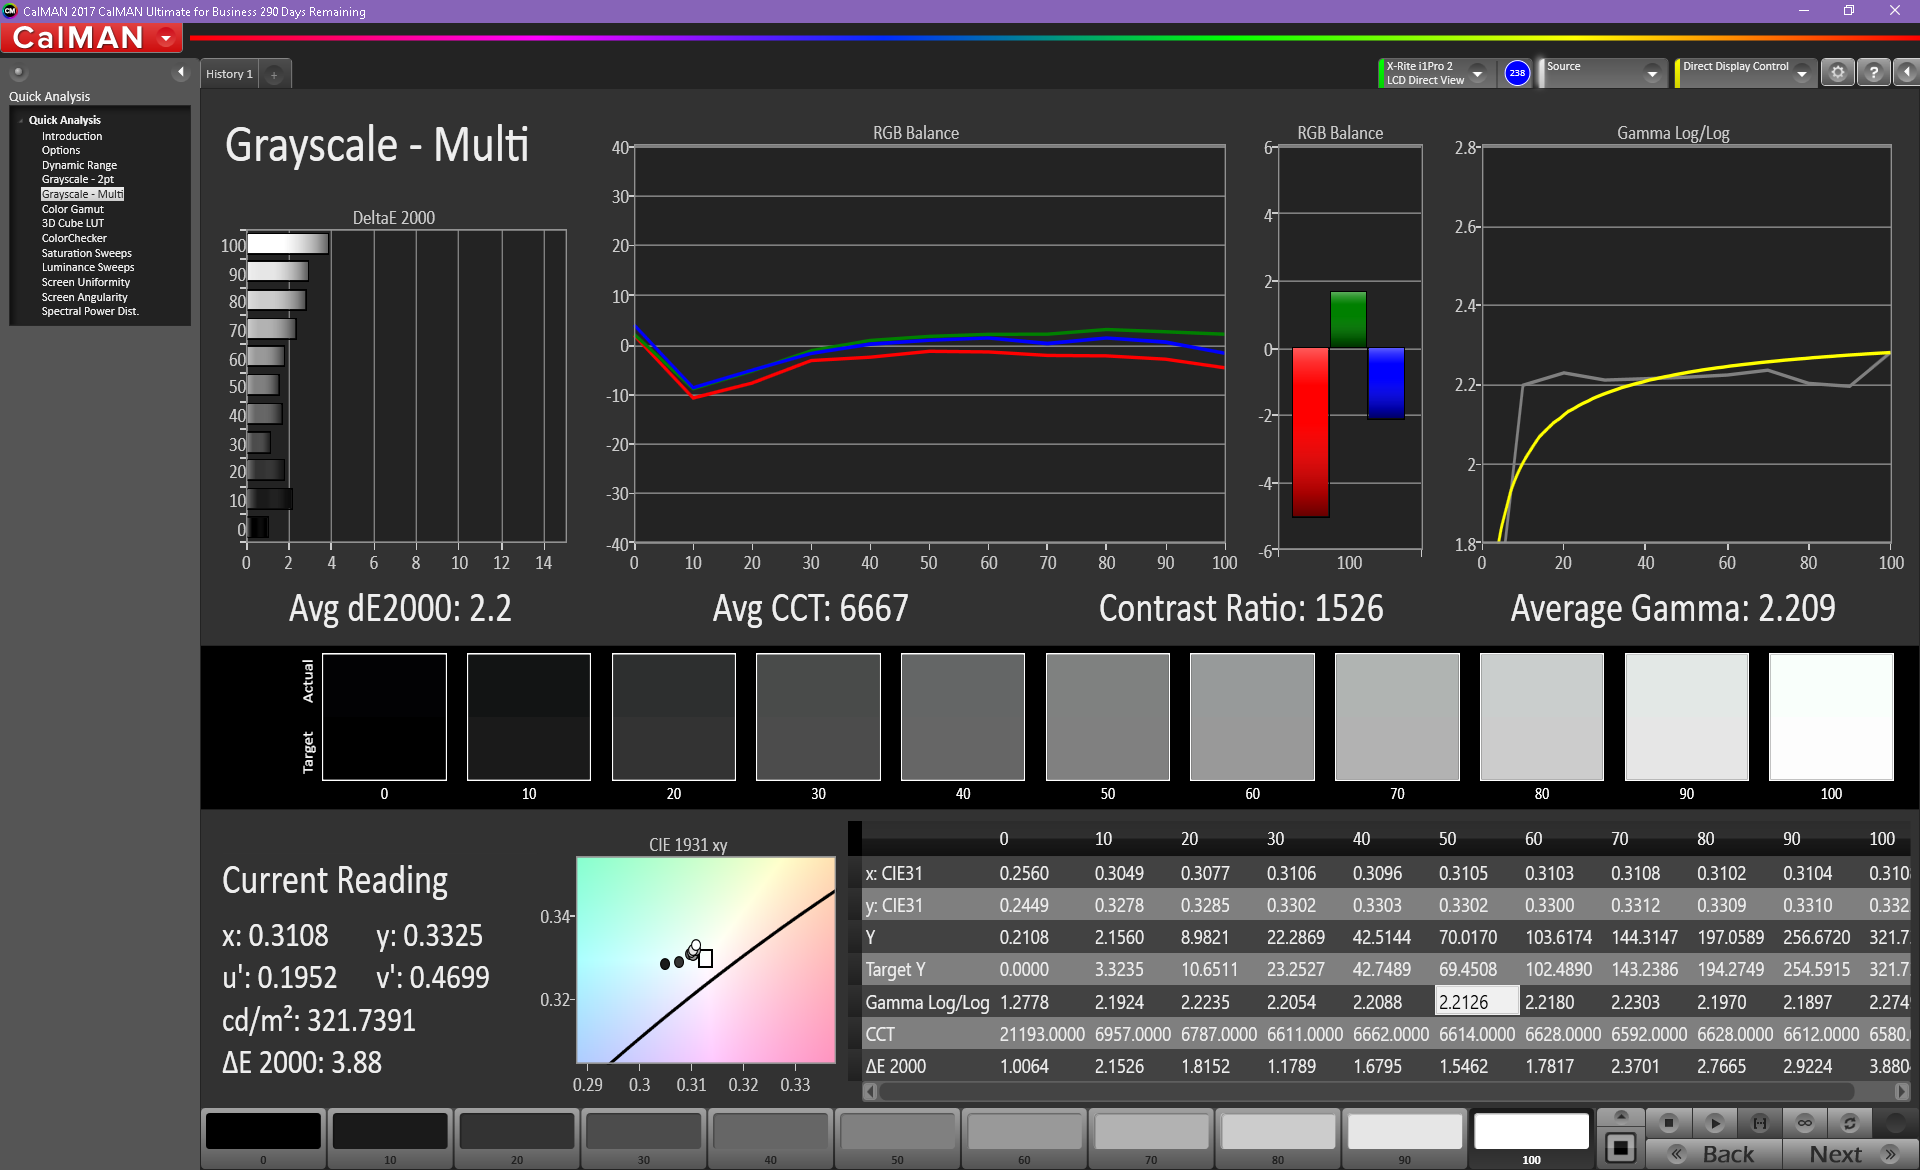
We measured an average brightness of 312 cd/m², which is decent. A low black value of 0.3 cd/m², meanwhile, leads to a strong contrast ratio of 1061:1. Illumination across the panel is relatively even; we calculated a brightness distribution of 83%, with the top center quadrant nearly 60 cd/m² brighter than the dimmest (lower left) quadrant. As usual, in reality, even such seemingly pronounced differences in luminosity are very difficult to notice.
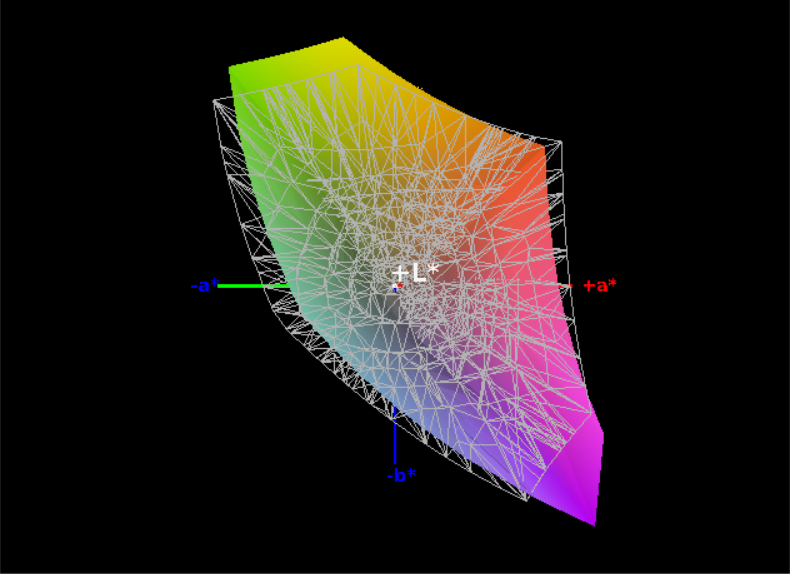
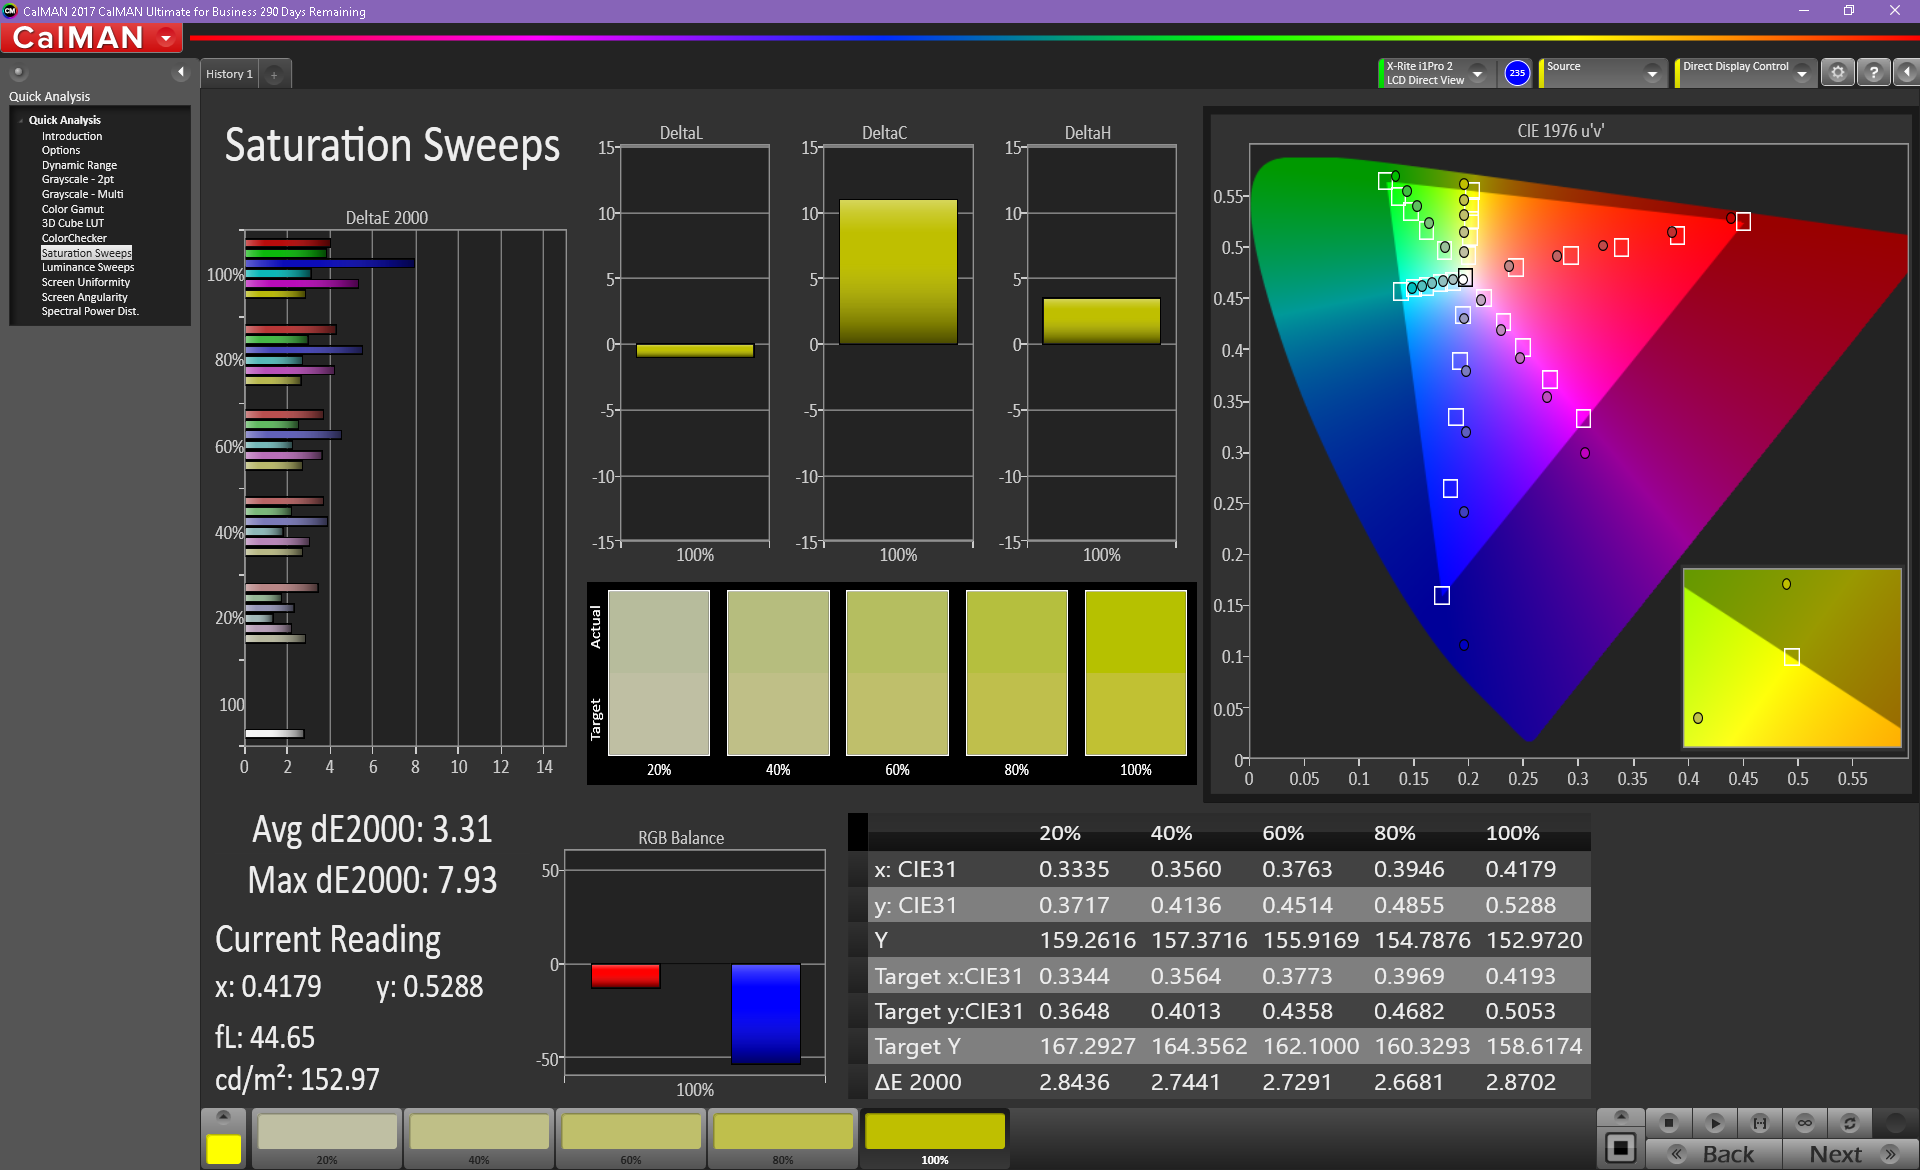
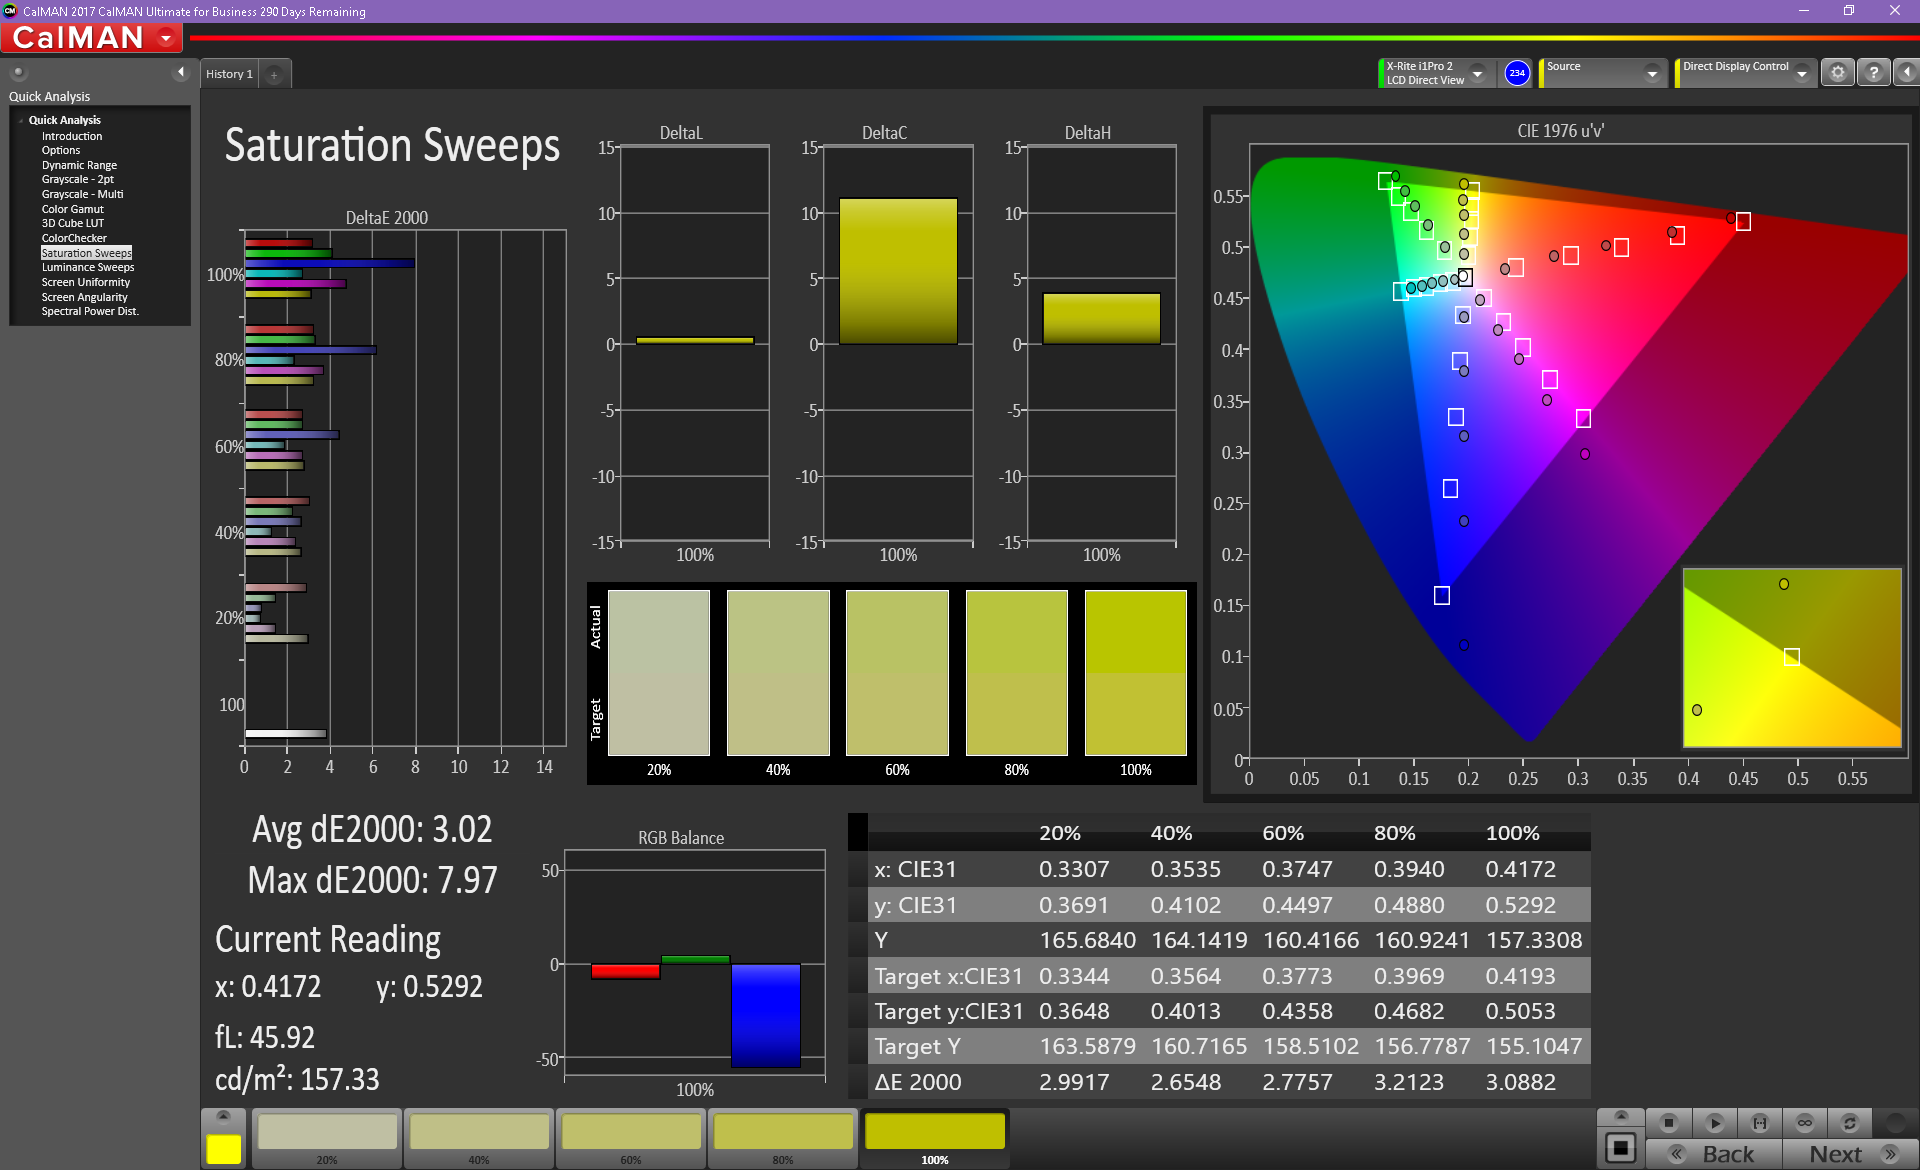
The panel manages 85% coverage of the sRGB spectrum, which is acceptable, but hardly impressive and below that of all of the competitors in our field. By far the best for color coverage is the ThinkPad X1 Carbon 2018, which not only completely covers the sRGB spectrum, but also posts 89% AdobeRGB coverage.
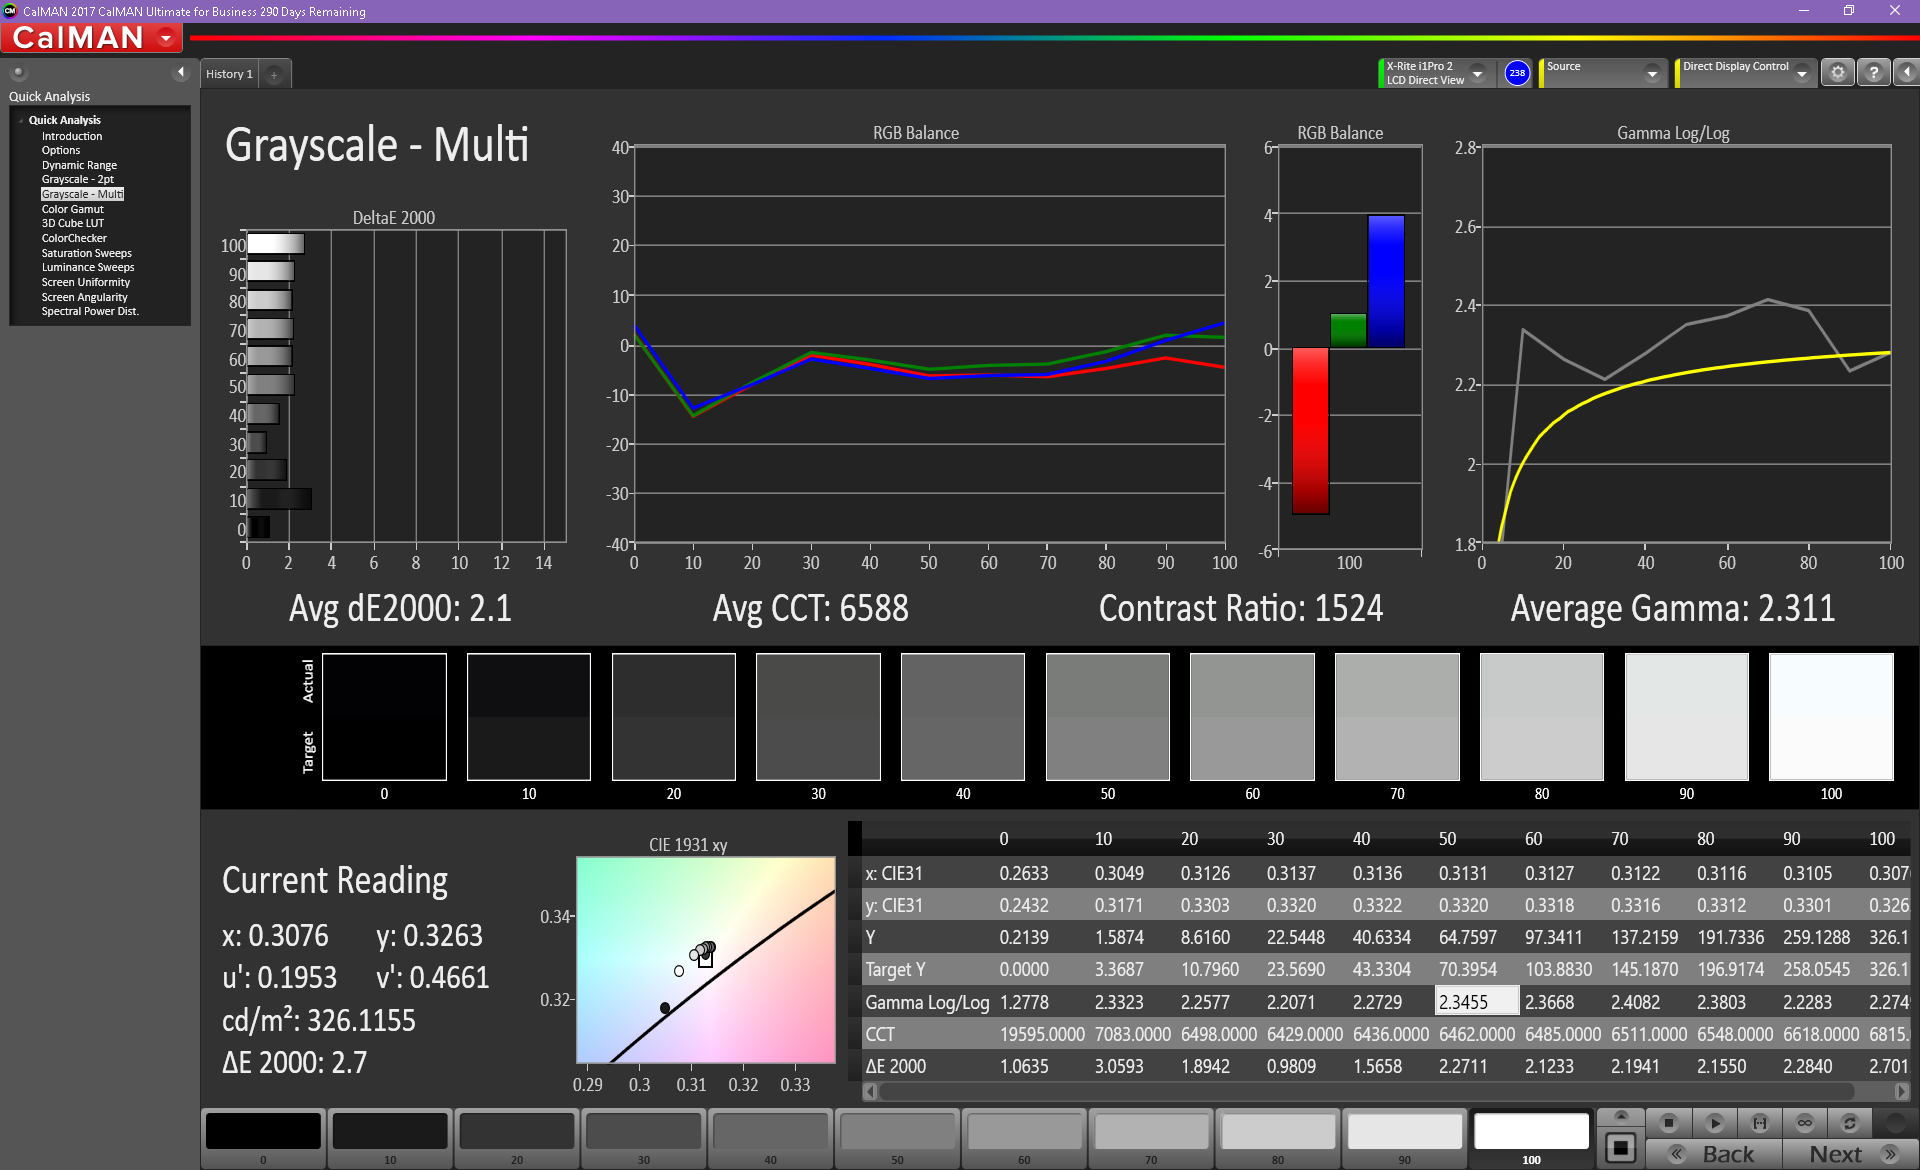
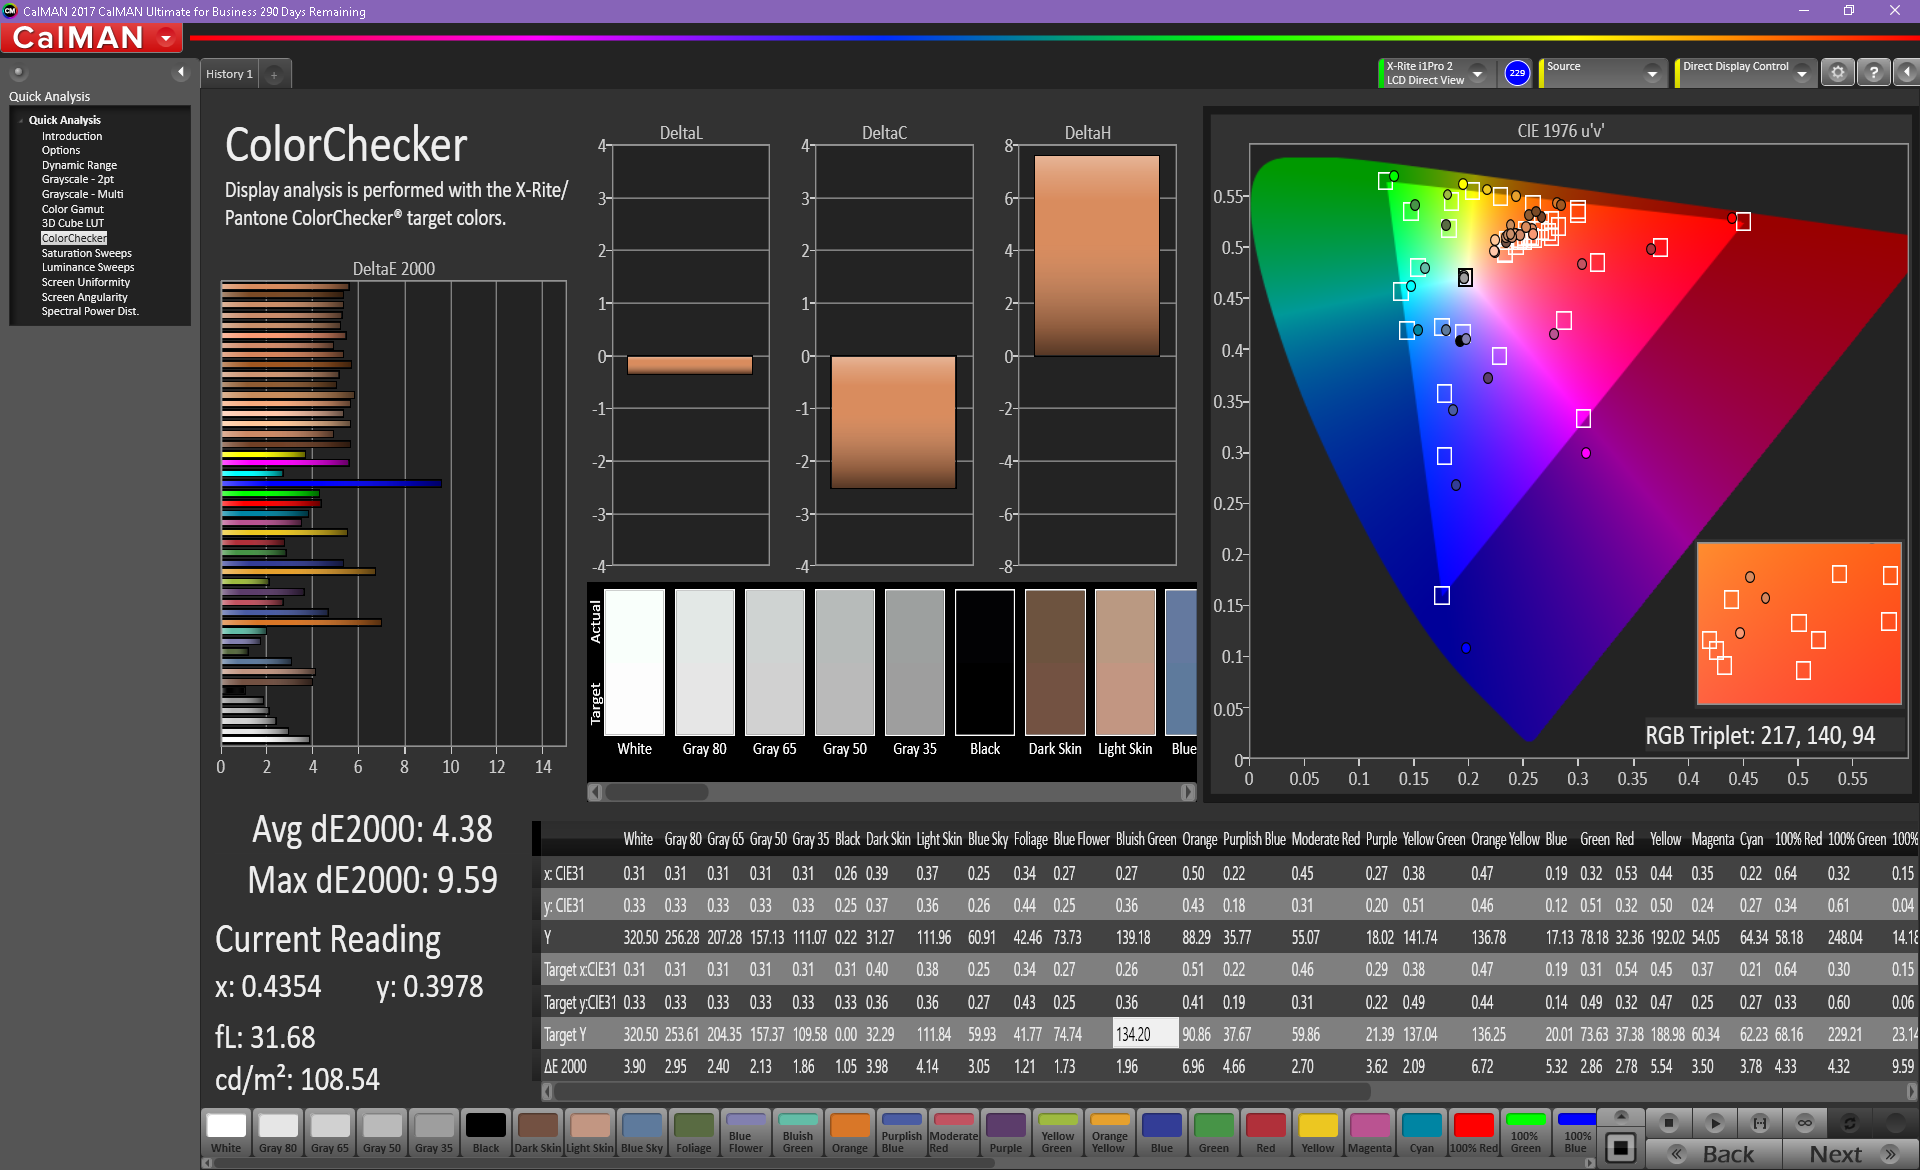
Color accuracy out of the box isn’t offensive, but it’s not great, either. Using CalMAN, we measured Colorchecker and Greyscale DeltaE averages of 4.25 and 2.1 respectively, with a Colorchecker DeltaE max of 9.49 (blue). At least the Total Gamma of 2.311 and CCT Average of 6588 are very close to ideal.
Display Response Times
| ↔ Response Time Black to White | ||
|---|---|---|
| 30.4 ms ... rise ↗ and fall ↘ combined | ↗ 16.4 ms rise | 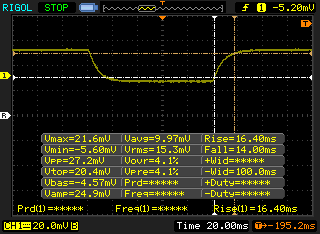 |
| ↘ 14 ms fall | ||
| The screen shows slow response rates in our tests and will be unsatisfactory for gamers. In comparison, all tested devices range from 0.1 (minimum) to 240 (maximum) ms. » 82 % of all devices are better. This means that the measured response time is worse than the average of all tested devices (19.8 ms). | ||
| ↔ Response Time 50% Grey to 80% Grey | ||
| 48.8 ms ... rise ↗ and fall ↘ combined | ↗ 23.6 ms rise | 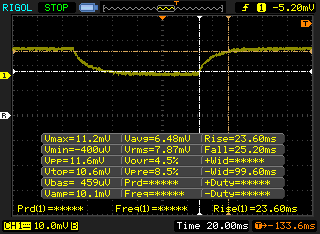 |
| ↘ 25.2 ms fall | ||
| The screen shows slow response rates in our tests and will be unsatisfactory for gamers. In comparison, all tested devices range from 0.165 (minimum) to 636 (maximum) ms. » 84 % of all devices are better. This means that the measured response time is worse than the average of all tested devices (30.9 ms). | ||
Screen Flickering / PWM (Pulse-Width Modulation)
| Screen flickering / PWM not detected | 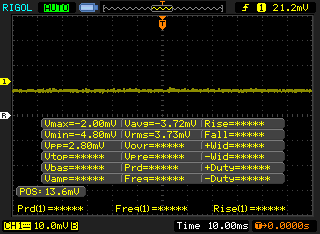 | ||
In comparison: 52 % of all tested devices do not use PWM to dim the display. If PWM was detected, an average of 7741 (minimum: 5 - maximum: 343500) Hz was measured. | |||
Response times are relatively slow, but our tests did not detect any PWM at any brightness level.
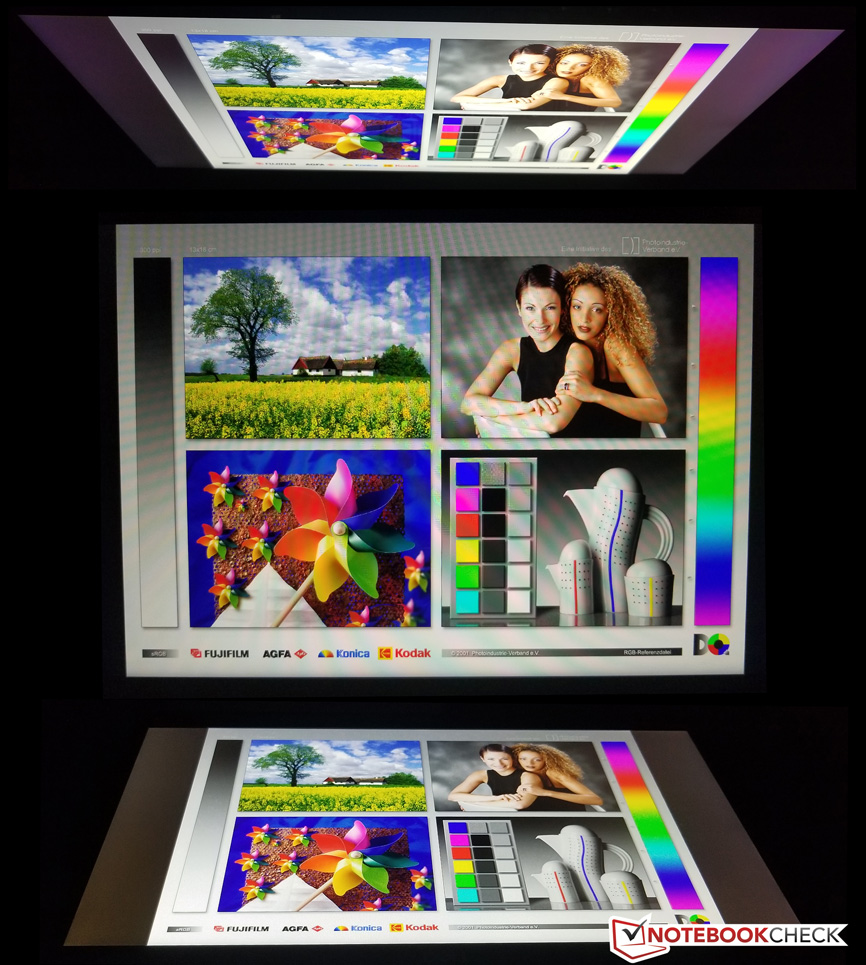
Outdoors, the screen is difficult to see in any brighter environment (in spite of the brightness and contrast) thanks to the glossy finish. Viewing angles from the IPS panel are excellent, but reflections make it difficult to enjoy them in many circumstances.
Performance
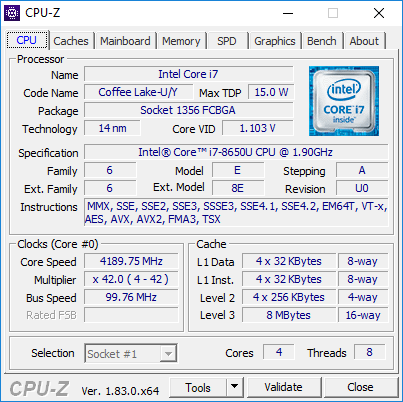
The Dell Latitude 7390 2-in-1 can be outfitted with a range of Intel processors spanning all the way from 7th-generation Core i3 to 8th-generation Core i7 models; RAM configurations range between 4 and 16 GB (all LPDDR3, soldered). Our particular review unit came configured with the top-end Intel Core i7-8650U, 16 GB RAM, and a 500 GB NVMe SSD. With specs like those, we ought to expect very good performance.
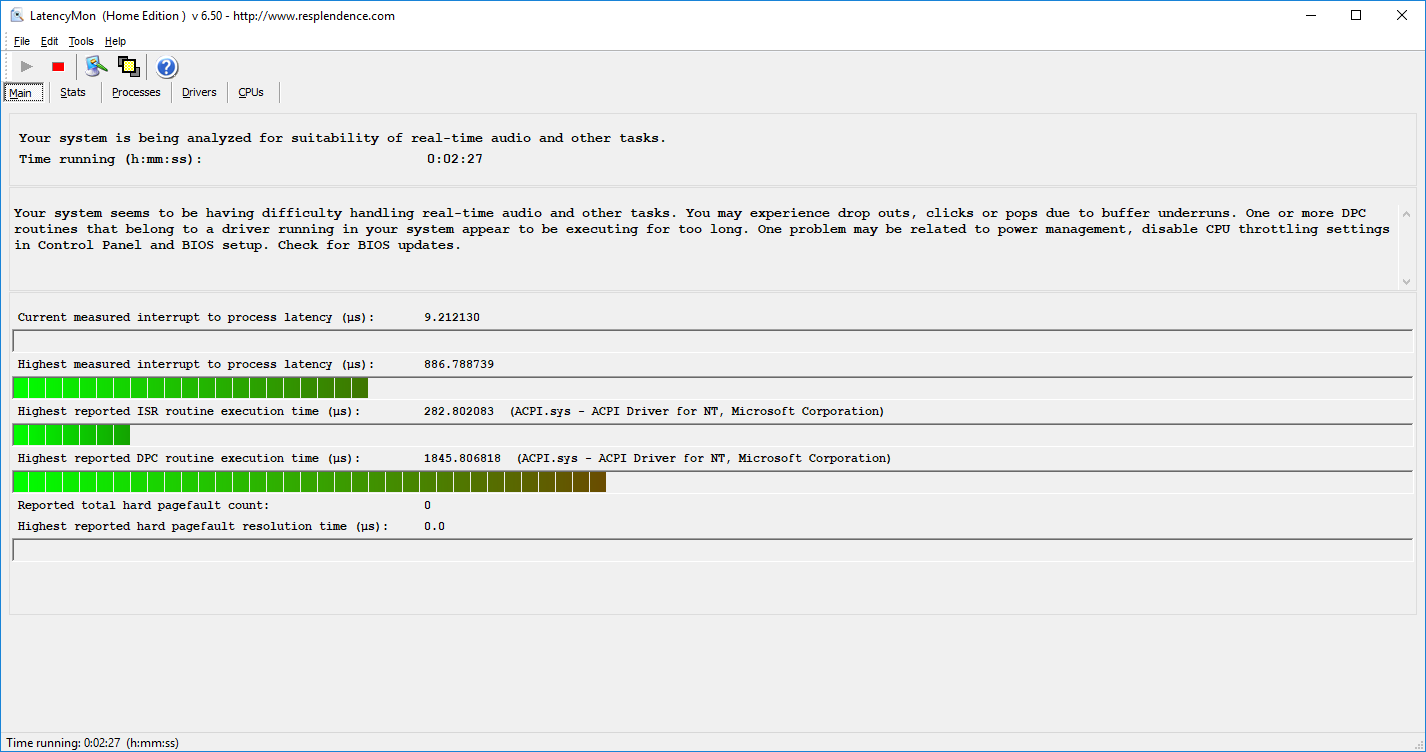
Performance is not reduced when running unplugged; a secondary run of 3DMark 11 actually produced a score slightly higher than that of our original run (1649). LatencyMon detected only occasional jumps in latency, and although it isn’t ideal, it’s not likely to affect much in actual use.
Processor
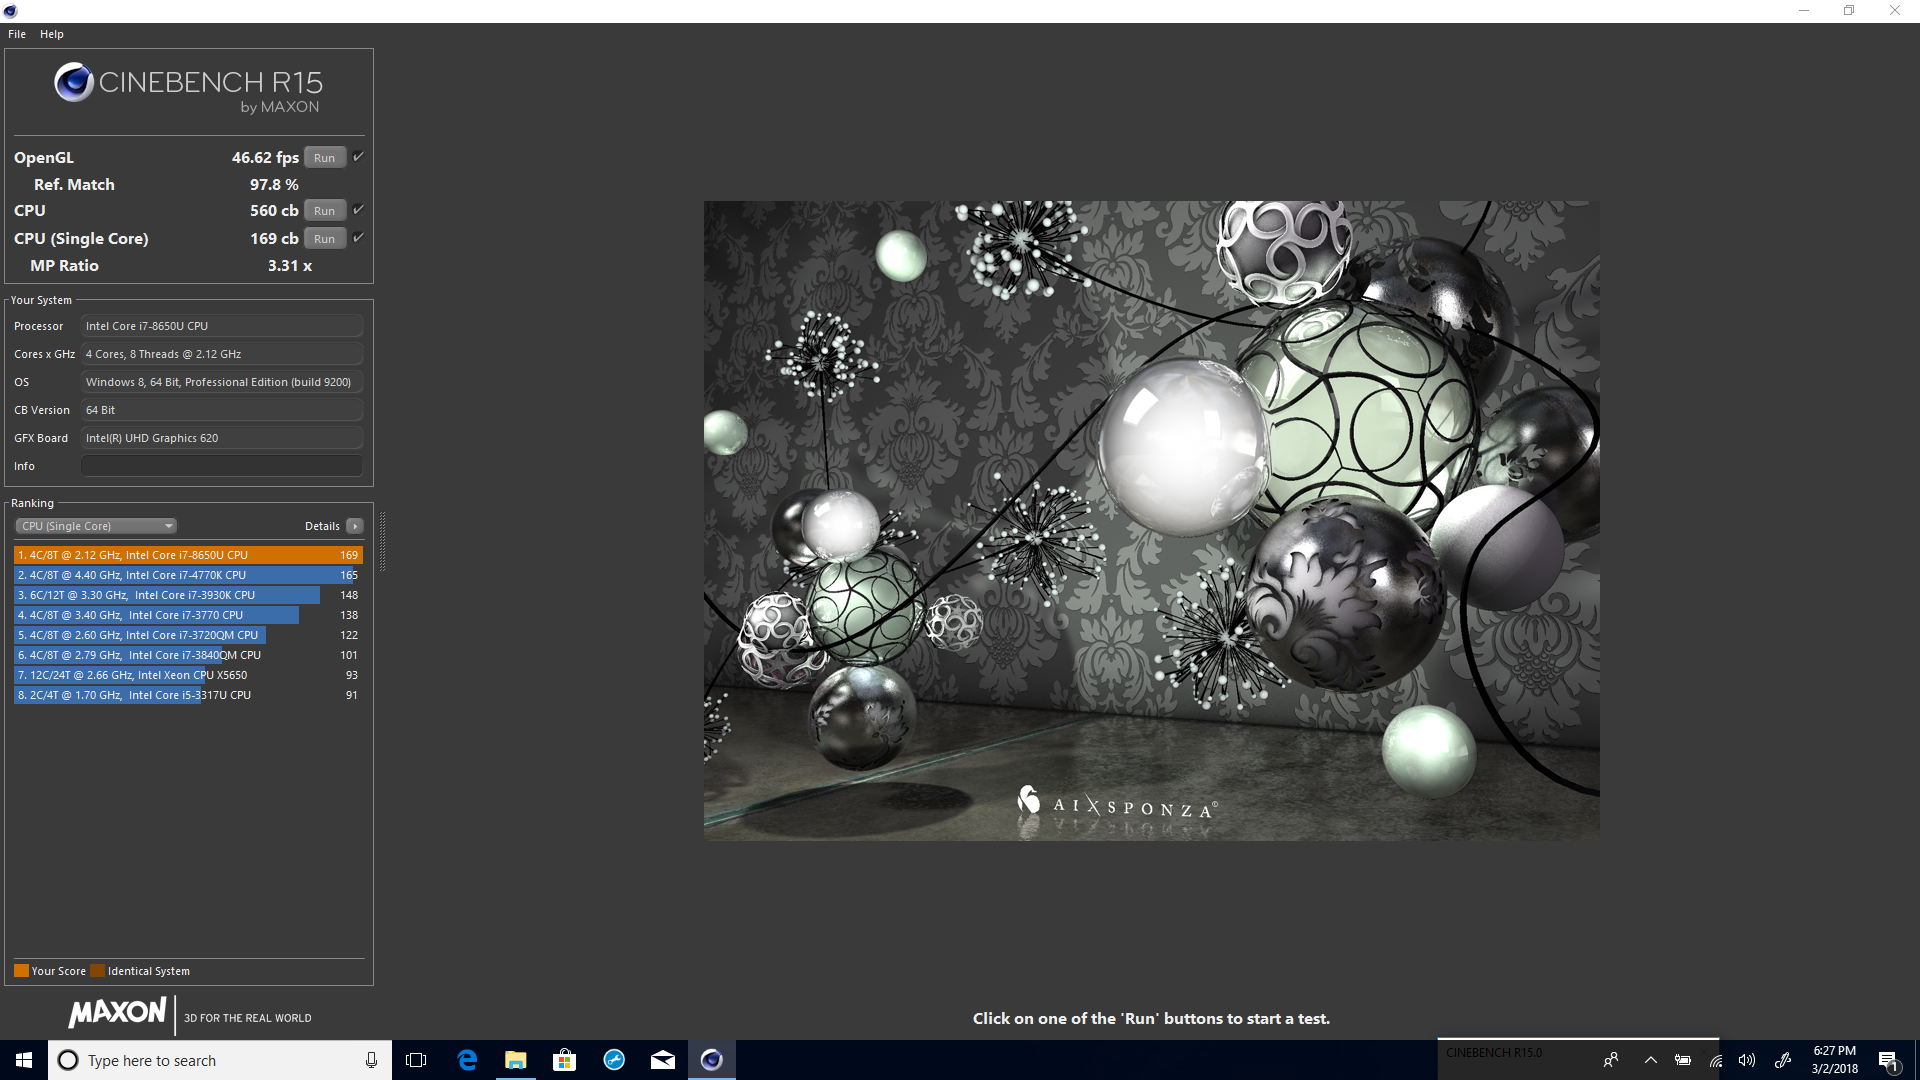
The Intel Core i7-8650U is a quad-core CPU with a base frequency of 1.9 GHz and a Turbo Clock rate of up to 4.2 GHz. Throughout our early testing of this chip, we’ve seen a lot of situations where it can’t maintain high performance over a relatively short sustained period of time, however, which has long brought into question its value versus the less expensive, yet often equally (or better!) performing Core i5 models. Various options are available for configuration in the Latitude 7390 2-in-1, so it’ll be interesting to see how our test results pan out here.
Our tests show that this is indeed a very fast CPU; scores are miles ahead of the Latitude 13 7380 and Portege A30, which are equipped (respectively) with 7th-gen Core i7 and i3 CPUs. But sure enough, performance of the i7-8650U is only marginally ahead of the 8th-gen Core i5 models in today’s tests, with an initial result in Cinebench R15 multi-CPU of 560 (later, we managed 584 in a second cold run), and a drop thereafter into the 540-550 range, which is below the median score we’ve recorded for the i5-8250U. The advantages become more prevalent in single-core performance, where the 7390 2-in-1 posts a Cinenbench R15 score of 169 (the median for the Core i5-8250U is 144). The same trend holds true across the rest of our processor benchmarks as well (for instance, the wPrime score of 302.8 seconds is actually slower than the median score of the Core i5-8250U, 299.1 seconds—but the 7390 2-in-1 beats out every other machine in the superPi single-threaded tests).
What does this mean? Quite simply, it yet again suggests that the 8th-generation Core i7 is not a good investment to power this machine—unless the user only deals in single-threaded applications. Instead, users should opt for a lower-powered Core i5, where they’ll not only find better multi-core performance, but a lower price, to boot.
| wPrime 2.10 - 1024m | |
| Dell Latitude 13 7380 | |
| Average of class Office (208 - 675, n=8, last 2 years) | |
| HP Elitebook 1040 G4-2XU40UT | |
| Dell Latitude 7390 2-in-1 | |
| Average Intel Core i7-8650U (268 - 335, n=3) | |
* ... smaller is better
System Performance
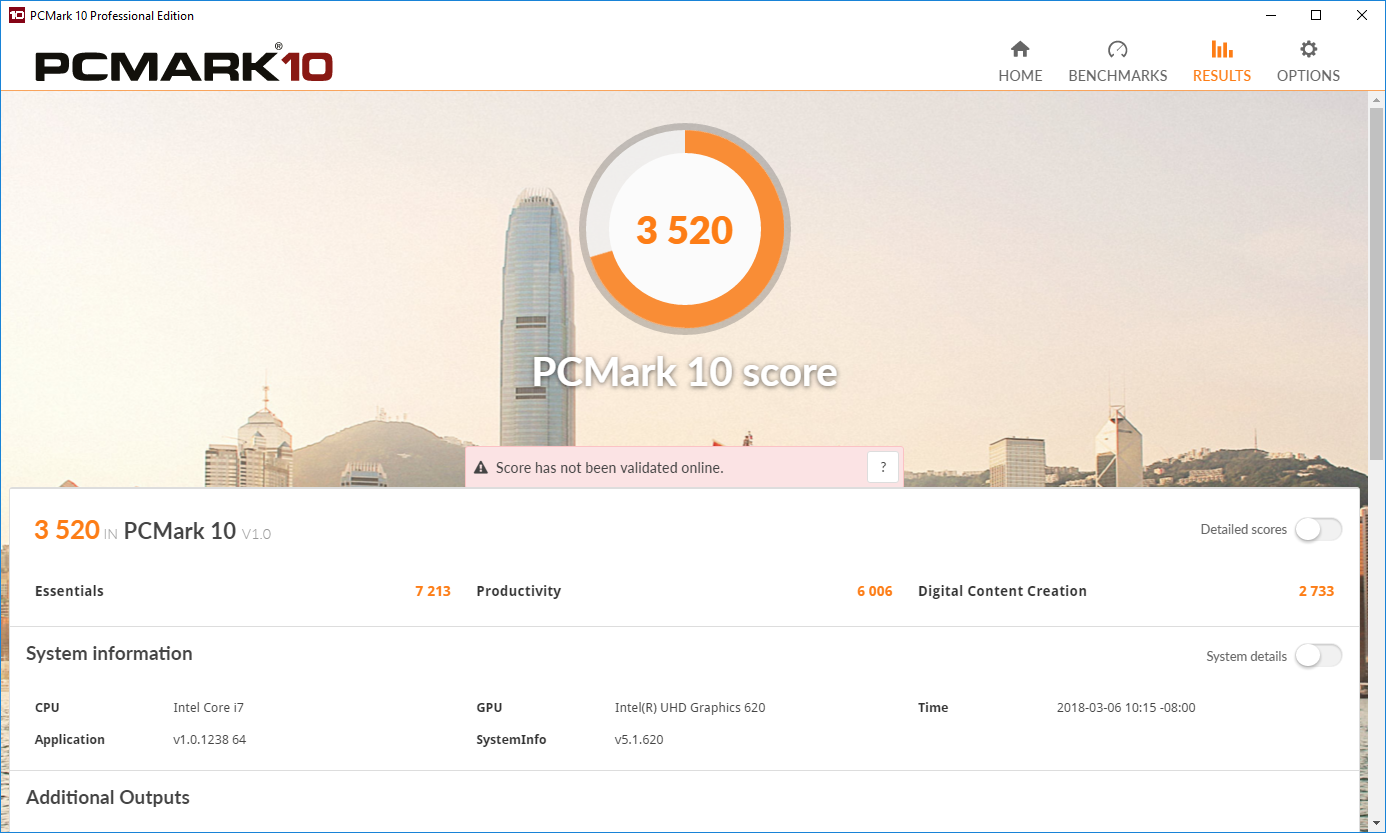
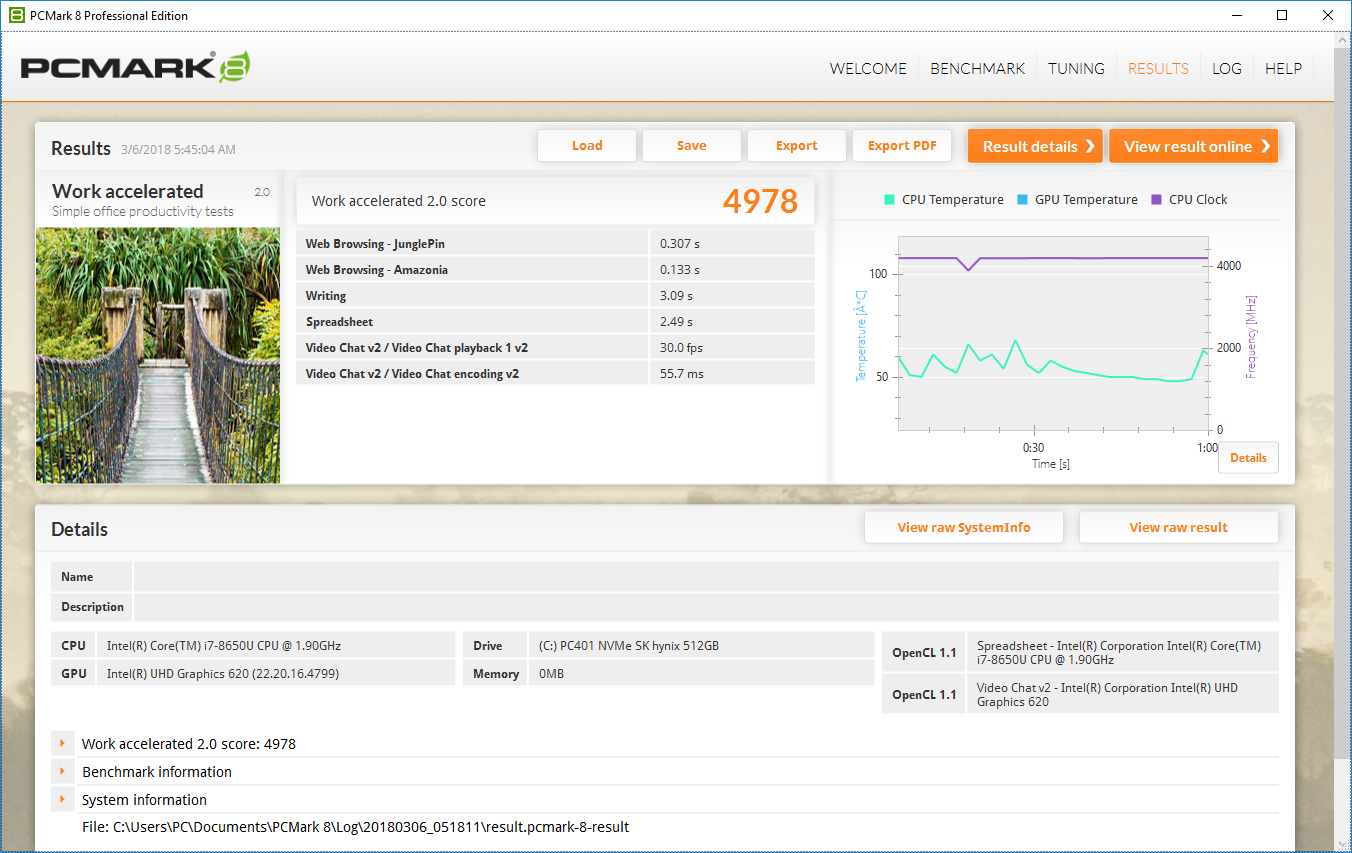
Regardless of processor choice, however, general system performance isn’t likely to disappoint anyone. Scores of 3760 points and 4978 points in PCMark 8 Home and Work Score Accelerated are within a few percentage points of similarly-equipped machines (with the HP Elitebook only winning by a wider margin in Home Accelerated thanks to its higher-powered 35 W TDP Core i7-7820HQ CPU).
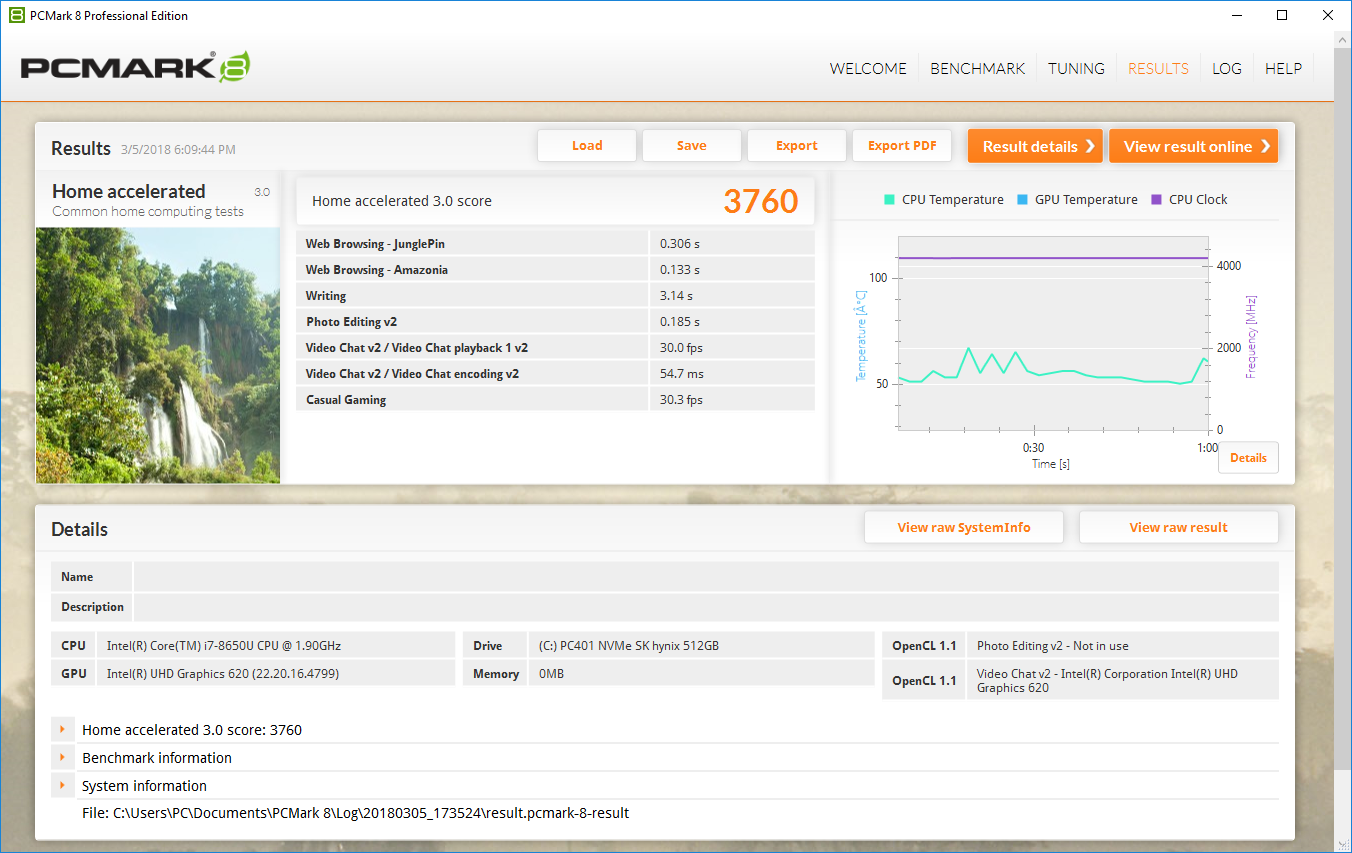
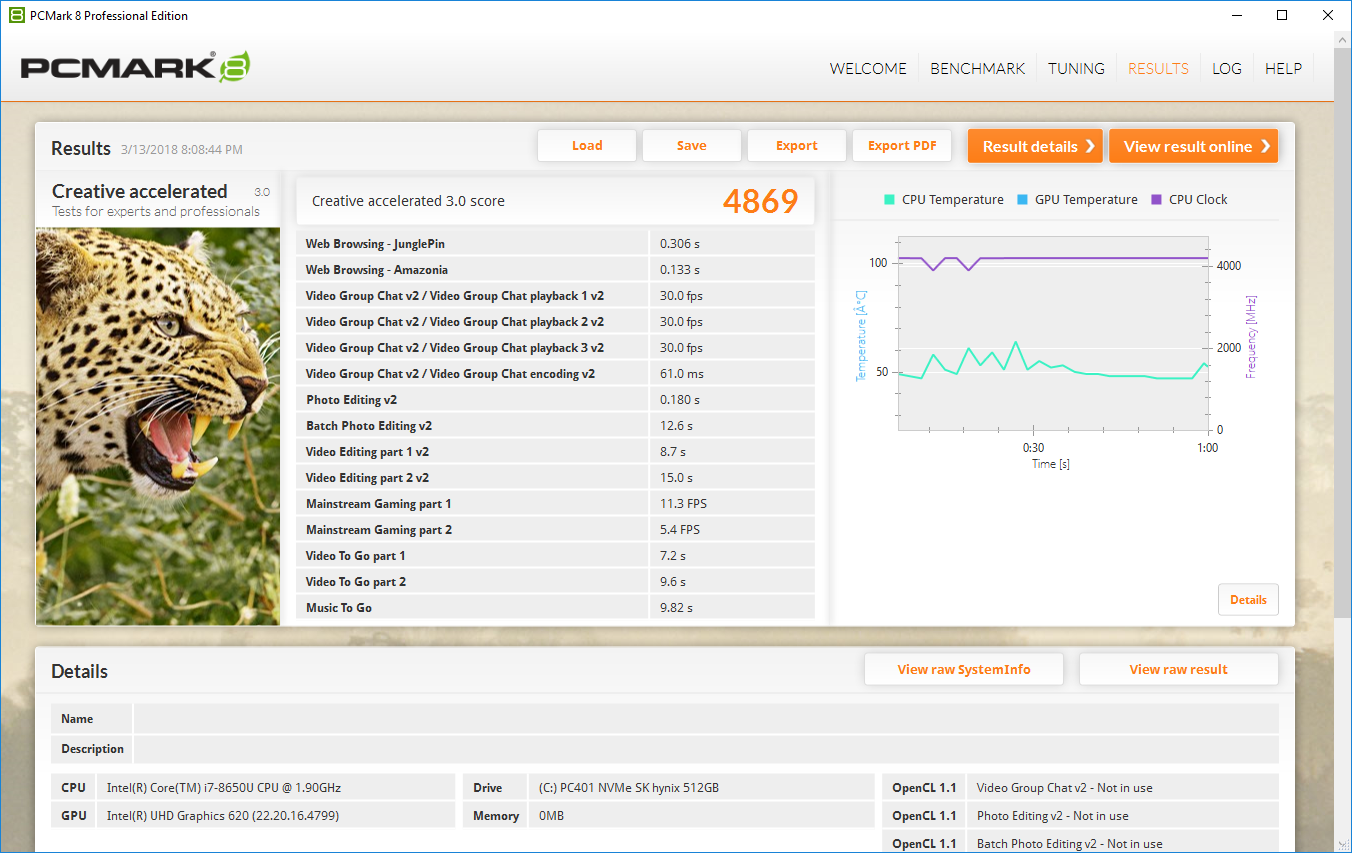
| PCMark 8 Home Score Accelerated v2 | 3760 points | |
| PCMark 8 Creative Score Accelerated v2 | 4869 points | |
| PCMark 8 Work Score Accelerated v2 | 4978 points | |
| PCMark 10 Score | 3520 points | |
Help | ||
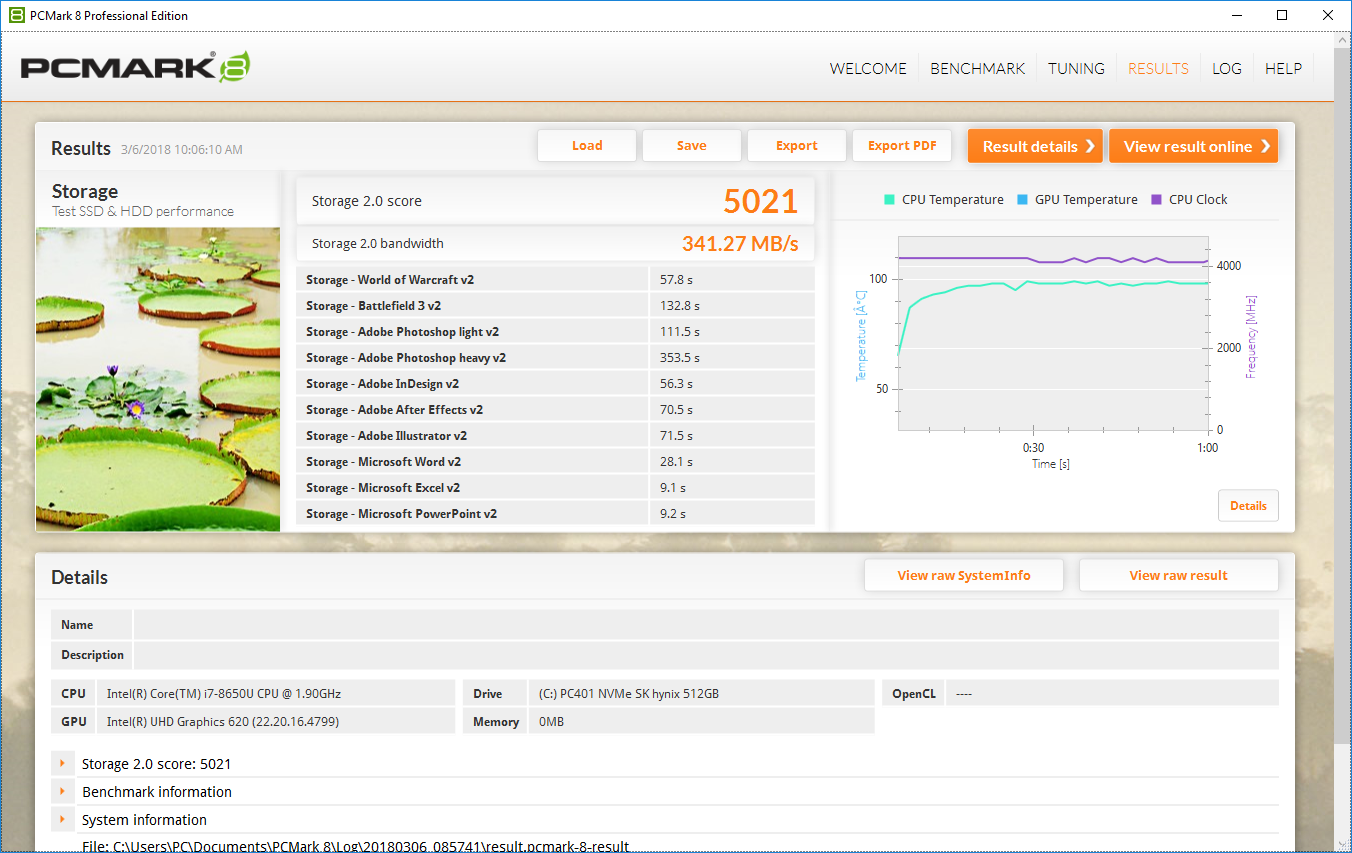
Storage Devices
The Latitude 7390 2-in-1 can be preconfigured with M.2 solid-state drives ranging between 128 GB and 1 TB in capacity (both SATA and NVMe/PCIe drives are available). But the truly interesting part is that a secondary M.2 2230 slot is also available, which can accommodate smaller models ranging up to 256 GB in capacity. This effectively renders dual-storage configurations possible on a machine that’s far smaller than most others with that capability.
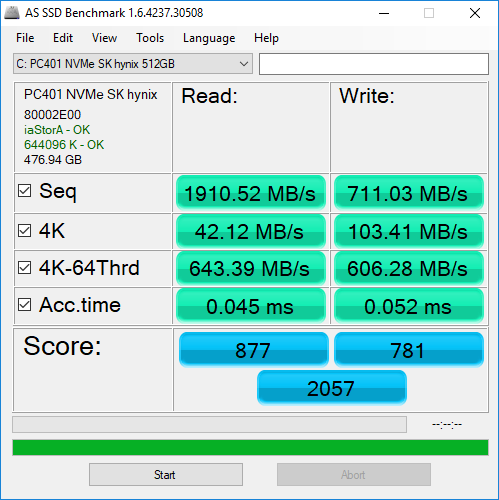
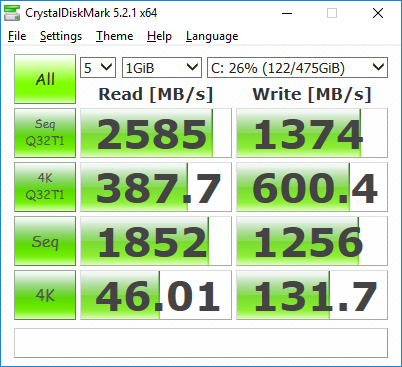
Our unit included an SK hynix PC401 512 GB NVMe SSD, a drive whose performance can’t compete with the top models from Samsung, but which still is better than any available SATA option. Read/write scores of 877 / 781 in AS SSD are decent, though definitely on the low end for an NVMe model. With the ease of upgrading, aftermarket solutions should be a simple and immediate consideration for 7390 2-in-1 owners.
| Dell Latitude 7390 2-in-1 SK hynix PC401 NVMe 500 GB | Lenovo ThinkPad X1 Carbon 2018-20KGS03900 Samsung SSD PM981 MZVLB512HAJQ | HP Elitebook 1040 G4-2XU40UT Toshiba XG4 NVMe (THNSN5512GPUK) | Asus ZenBook 13 UX331UN SK Hynix HFS256G39TND-N210A | Toshiba Portege A30-D-139 Toshiba SG5 THNSNK128GVN8 | |
|---|---|---|---|---|---|
| AS SSD | 65% | -12% | -80% | -91% | |
| Copy Game MB/s (MB/s) | 473.6 | 1107 134% | 394.2 -17% | 154.1 -67% | |
| Copy Program MB/s (MB/s) | 223.5 | 460.2 106% | 133.7 -40% | 129.7 -42% | |
| Copy ISO MB/s (MB/s) | 1377 | 1247 -9% | 534 -61% | 192.4 -86% | |
| Score Total (Points) | 2057 | 3529 72% | 2299 12% | 991 -52% | 650 -68% |
| Score Write (Points) | 781 | 1801 131% | 848 9% | 323 -59% | 163 -79% |
| Score Read (Points) | 877 | 1168 33% | 979 12% | 445 -49% | 330 -62% |
| Access Time Write * (ms) | 0.052 | 0.027 48% | 0.038 27% | 0.23 -342% | 0.085 -63% |
| Access Time Read * (ms) | 0.045 | 0.029 36% | 0.105 -133% | 0.09 -100% | 0.2 -344% |
| 4K-64 Write (MB/s) | 606 | 1529 152% | 662 9% | 233.1 -62% | 83.7 -86% |
| 4K-64 Read (MB/s) | 643 | 876 36% | 782 22% | 368.4 -43% | 257.8 -60% |
| 4K Write (MB/s) | 103.4 | 134.3 30% | 100.1 -3% | 68.9 -33% | 66.8 -35% |
| 4K Read (MB/s) | 42.12 | 52.4 24% | 38.49 -9% | 27.98 -34% | 21.64 -49% |
| Seq Write (MB/s) | 711 | 1376 94% | 863 21% | 213.7 -70% | 128.6 -82% |
| Seq Read (MB/s) | 1911 | 2396 25% | 1585 -17% | 483.7 -75% | 502 -74% |
* ... smaller is better

GPU Performance
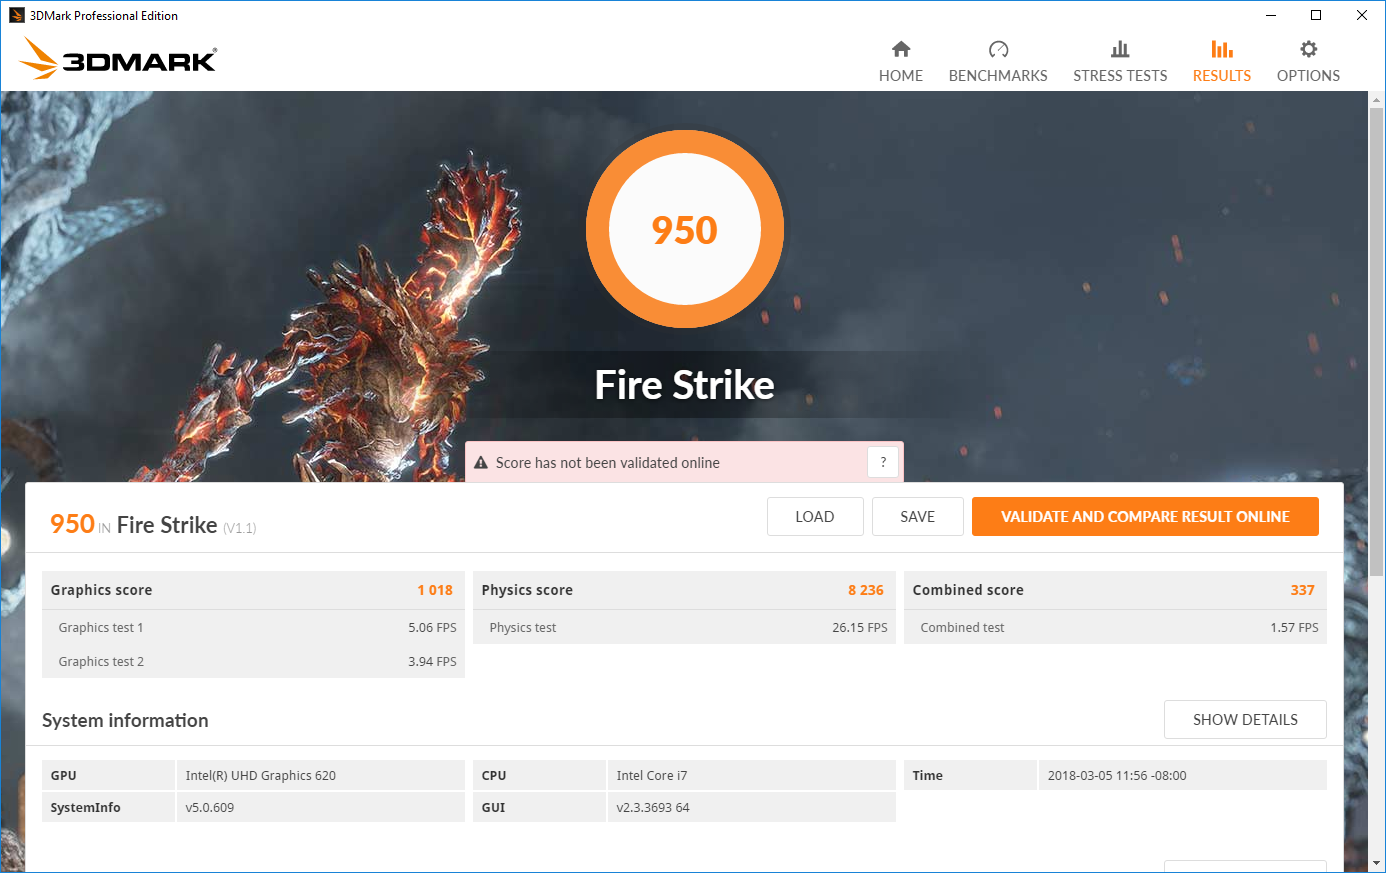
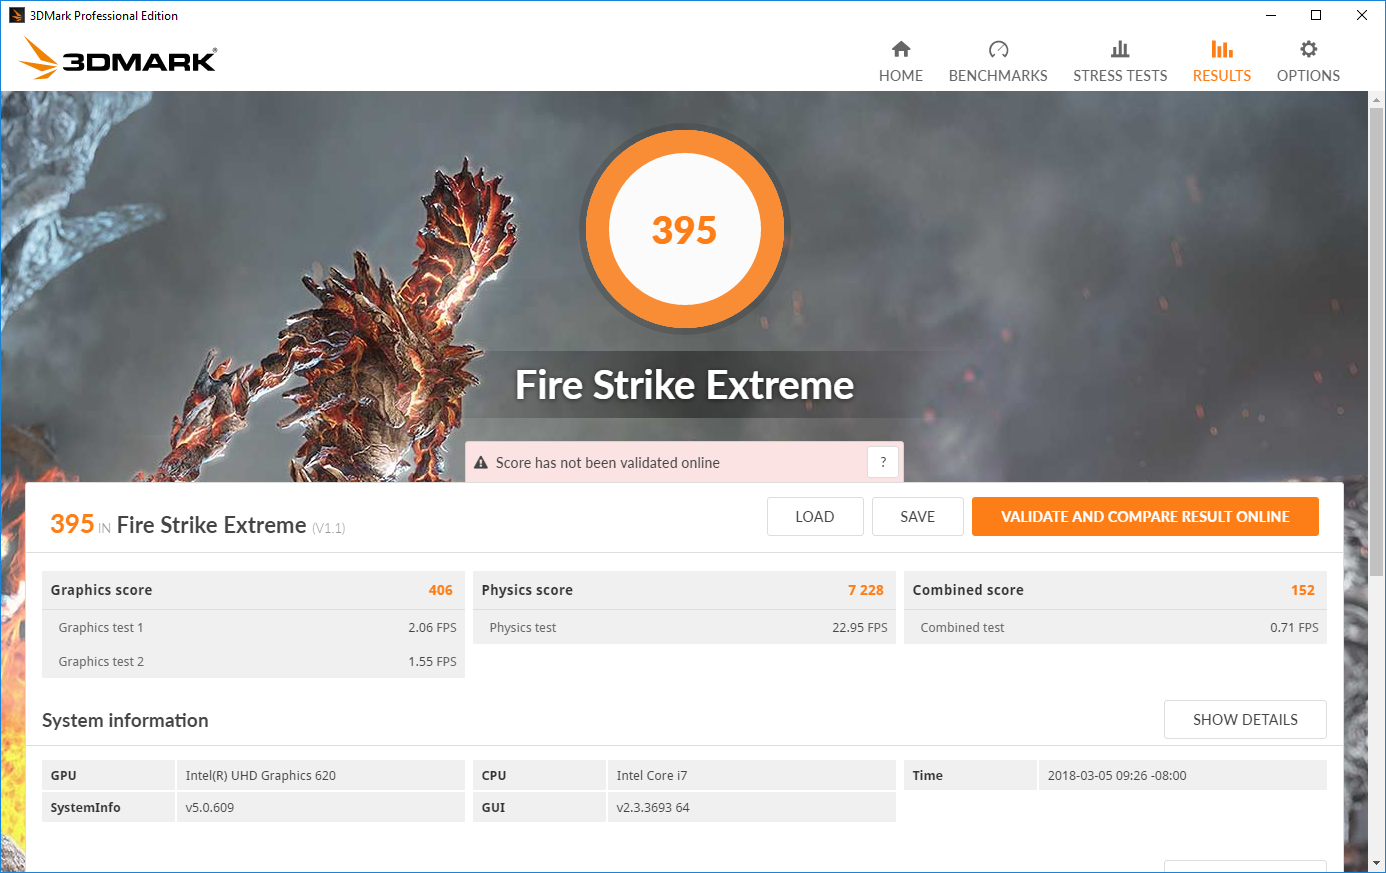
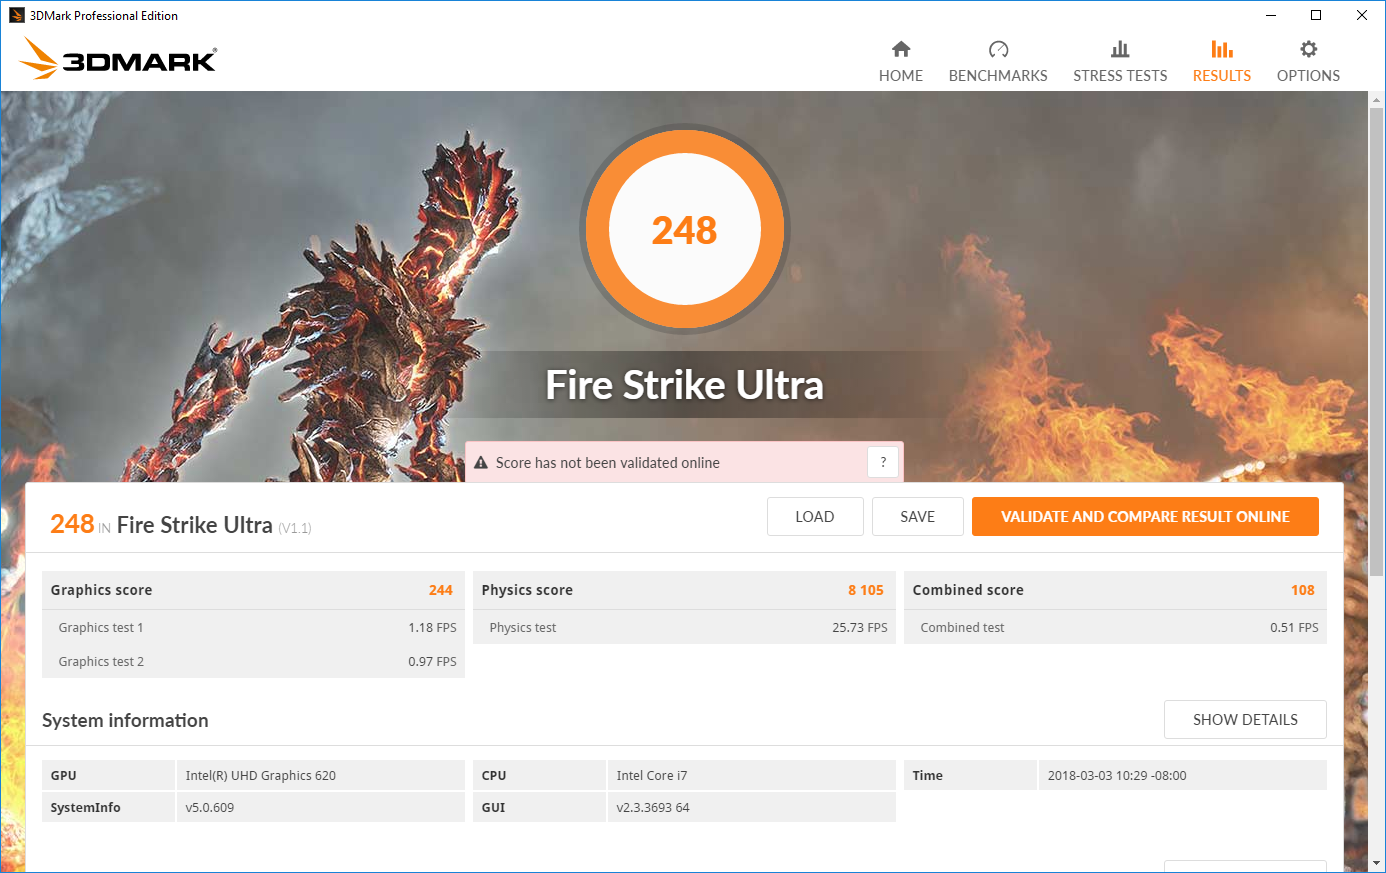
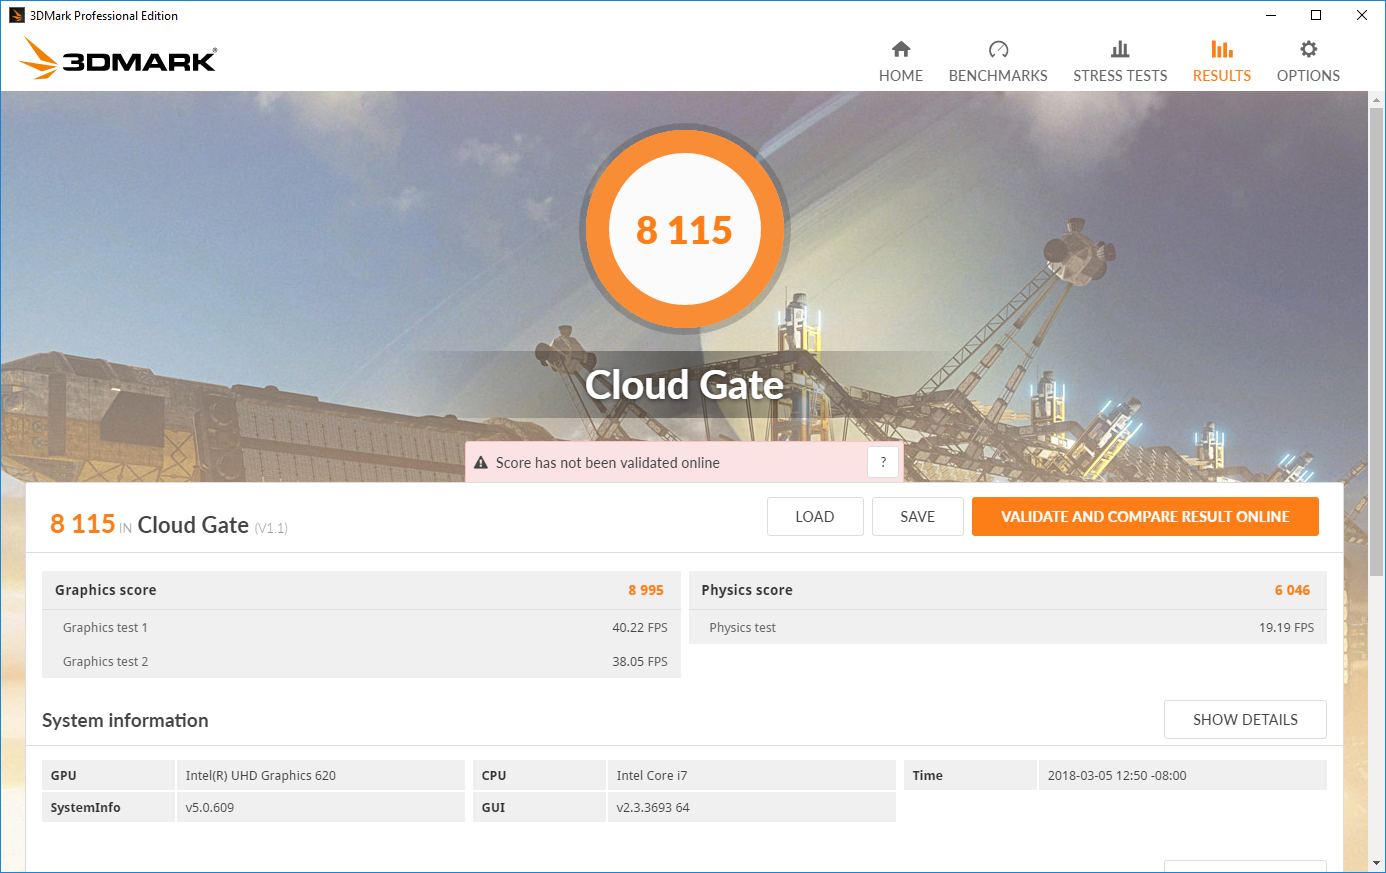
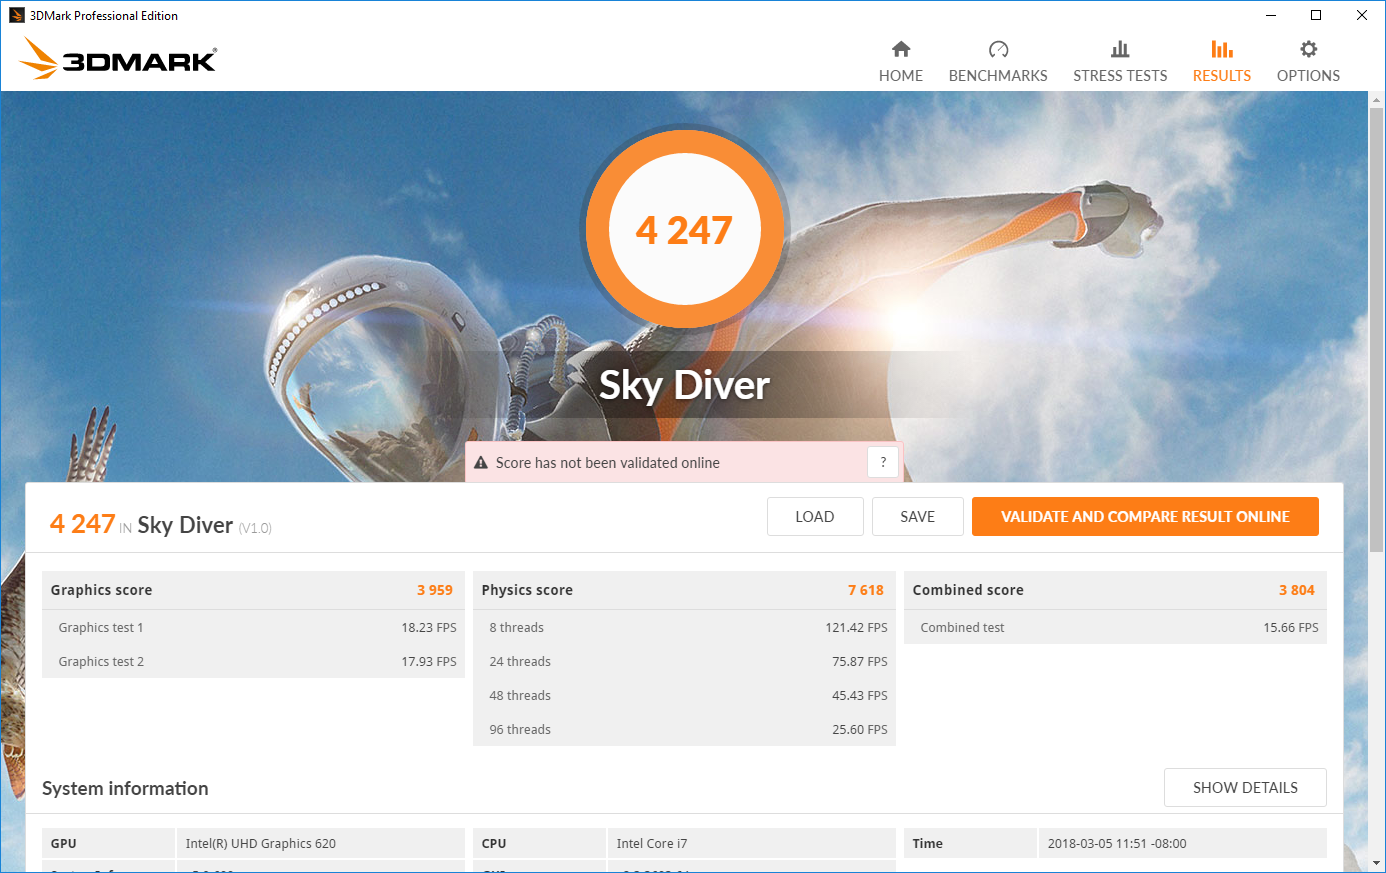
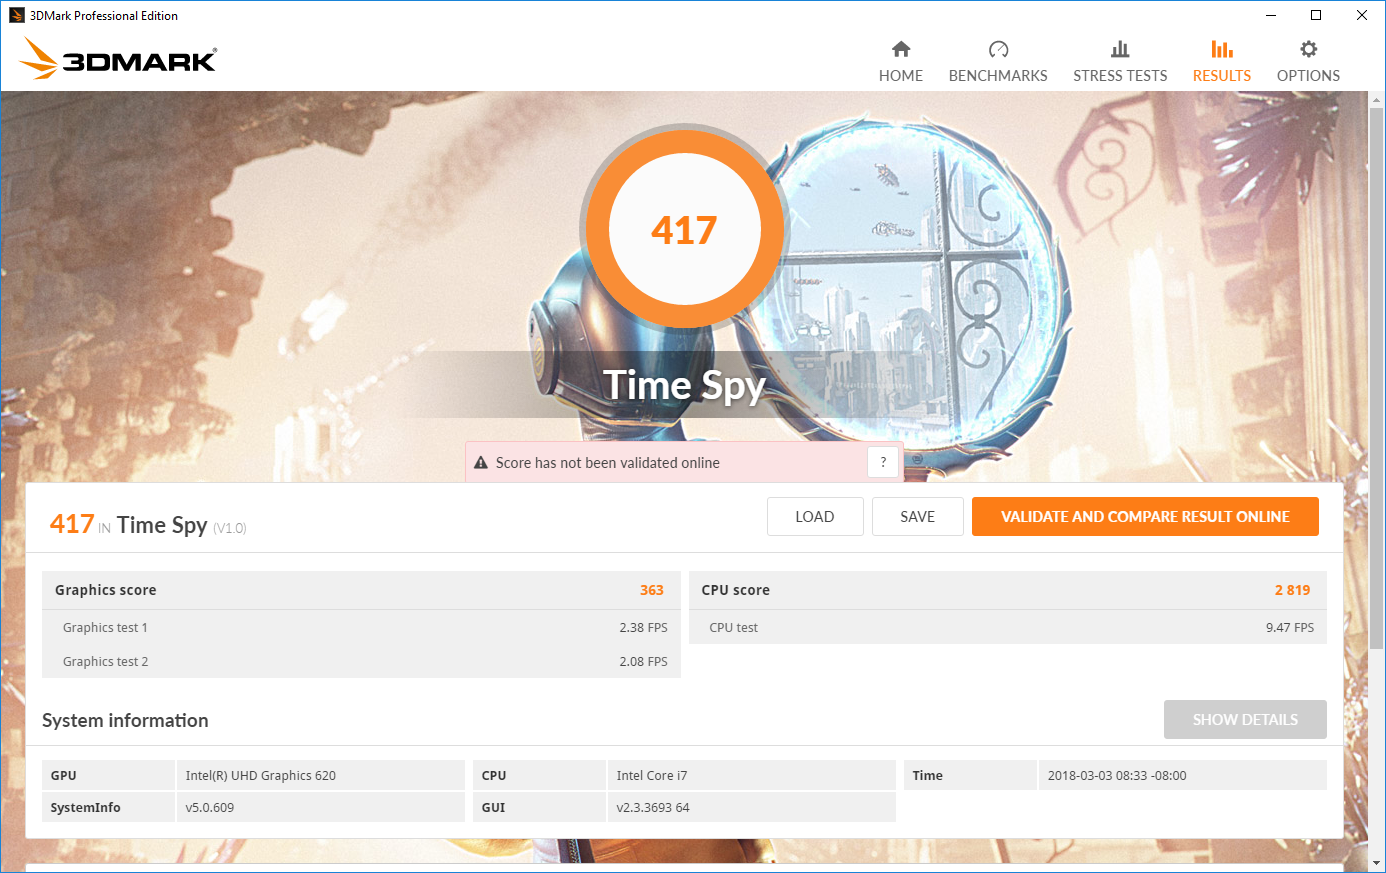
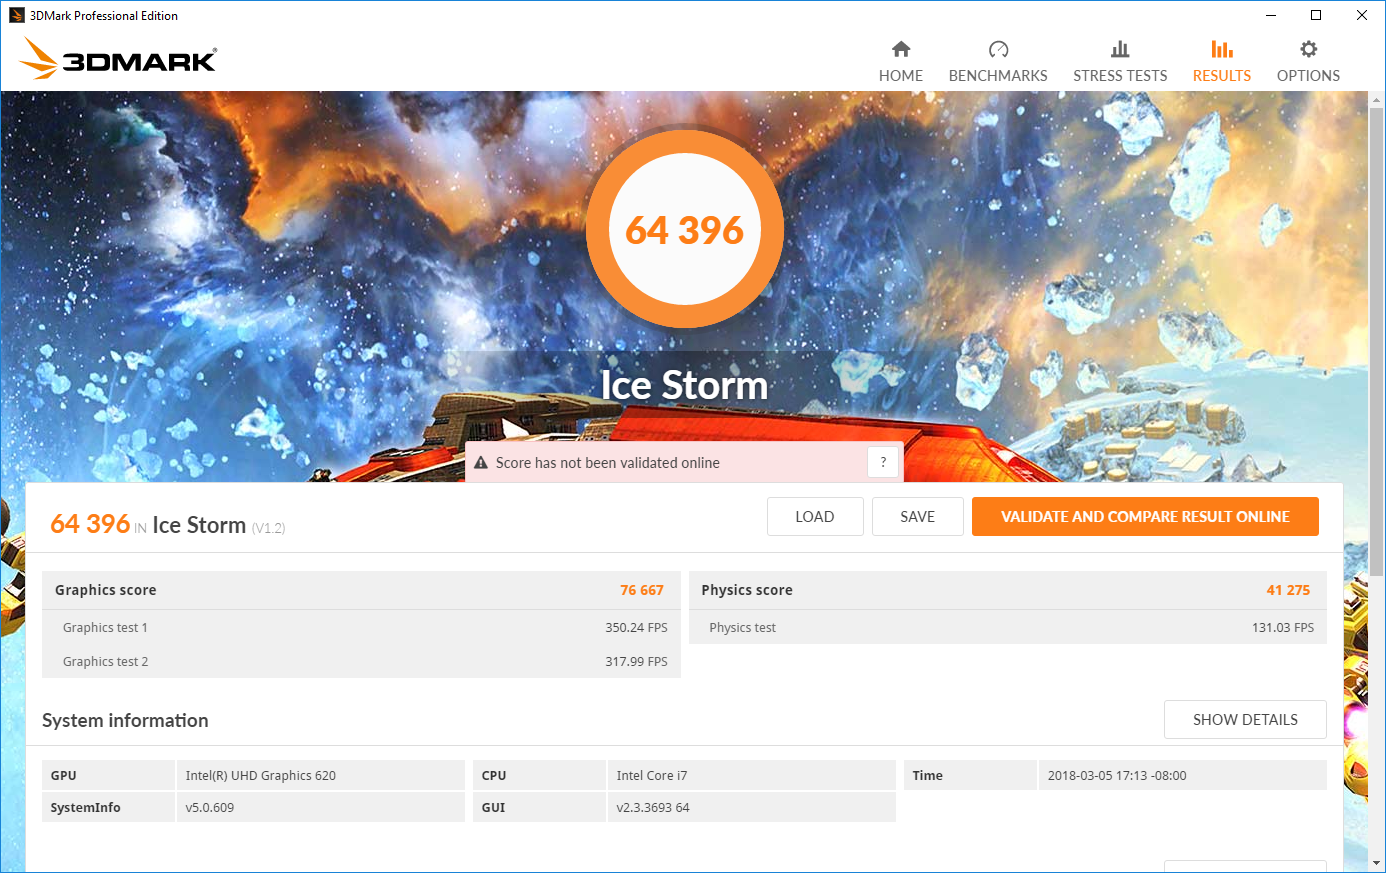
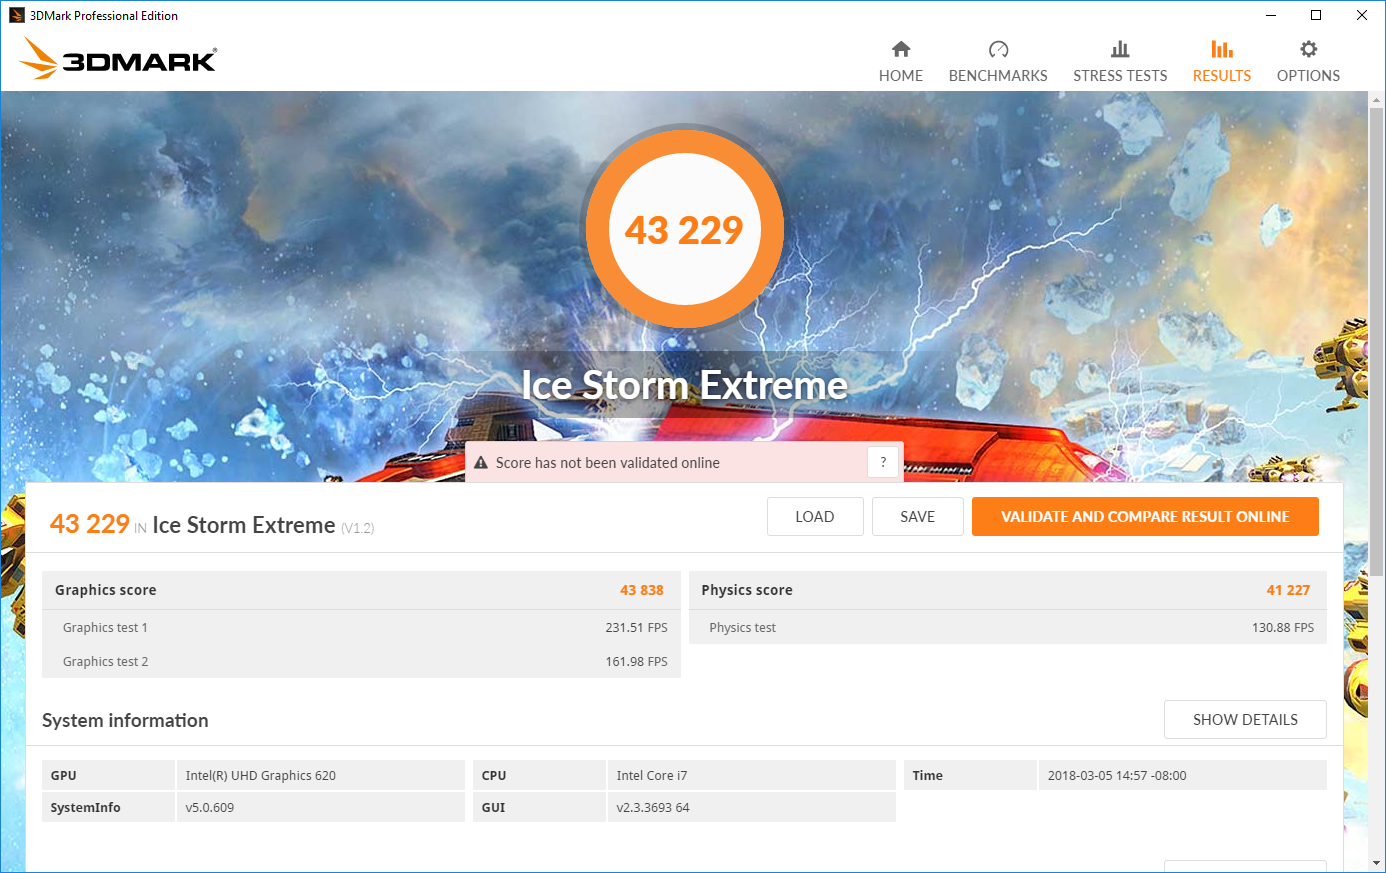
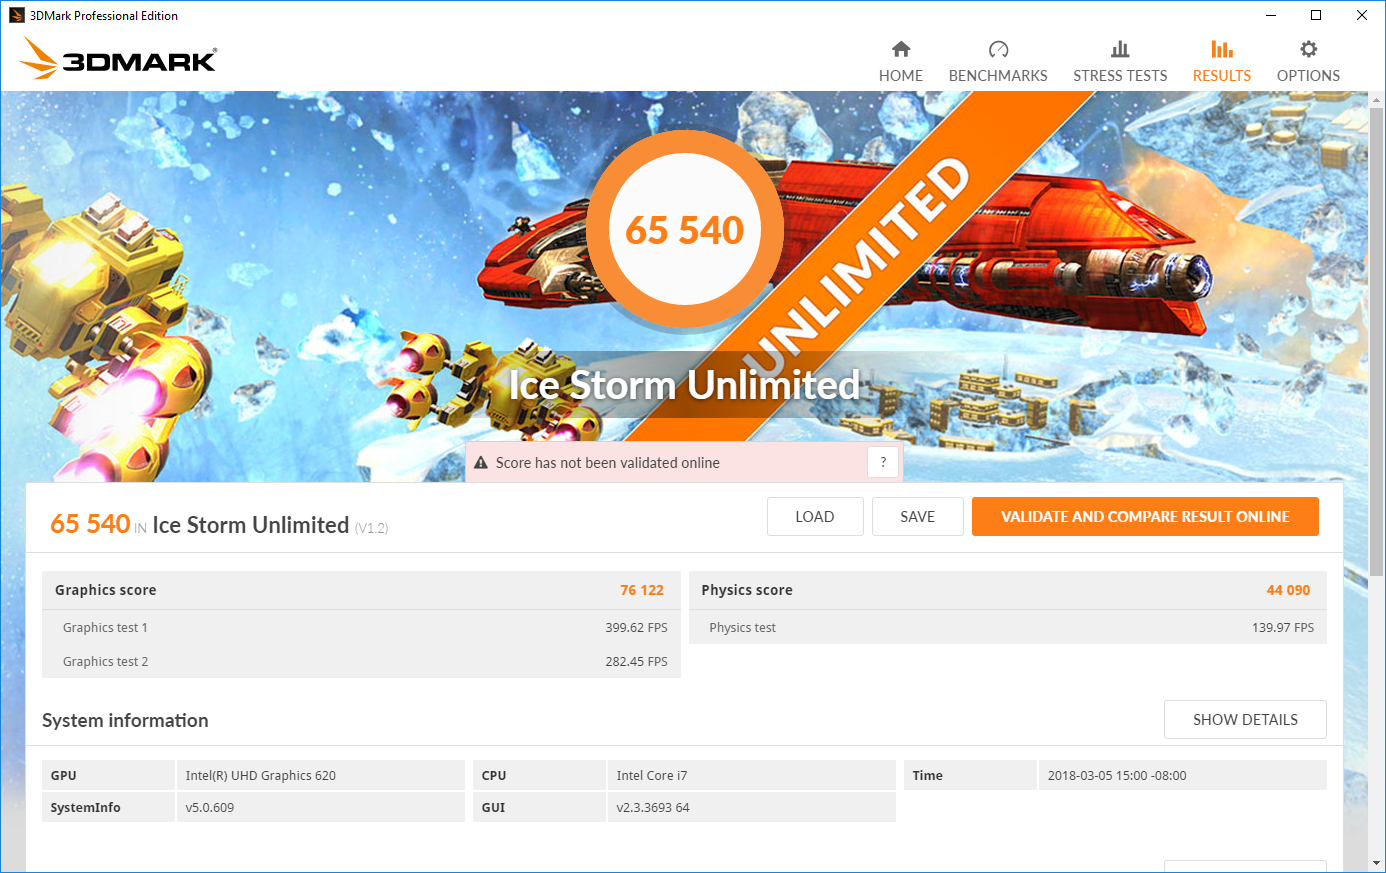
Of course, the Latitude 7390 2-in-1 isn’t designed to be a GPU powerhouse—and given the constraints we’ve witnessed previously with regard to CPU performance, we shouldn’t expect much better out of the integrated Intel UHD Graphics 620 GPU. Still, results were within a few percentage points of the average for the adapter, which is acceptable even if not particularly exciting. The Asus ZenBook 13 UX331UN has an enormous advantage in these tests thanks to its incorporation of dedicated NVIDIA GeForce MX150 graphics alongside the CPU.
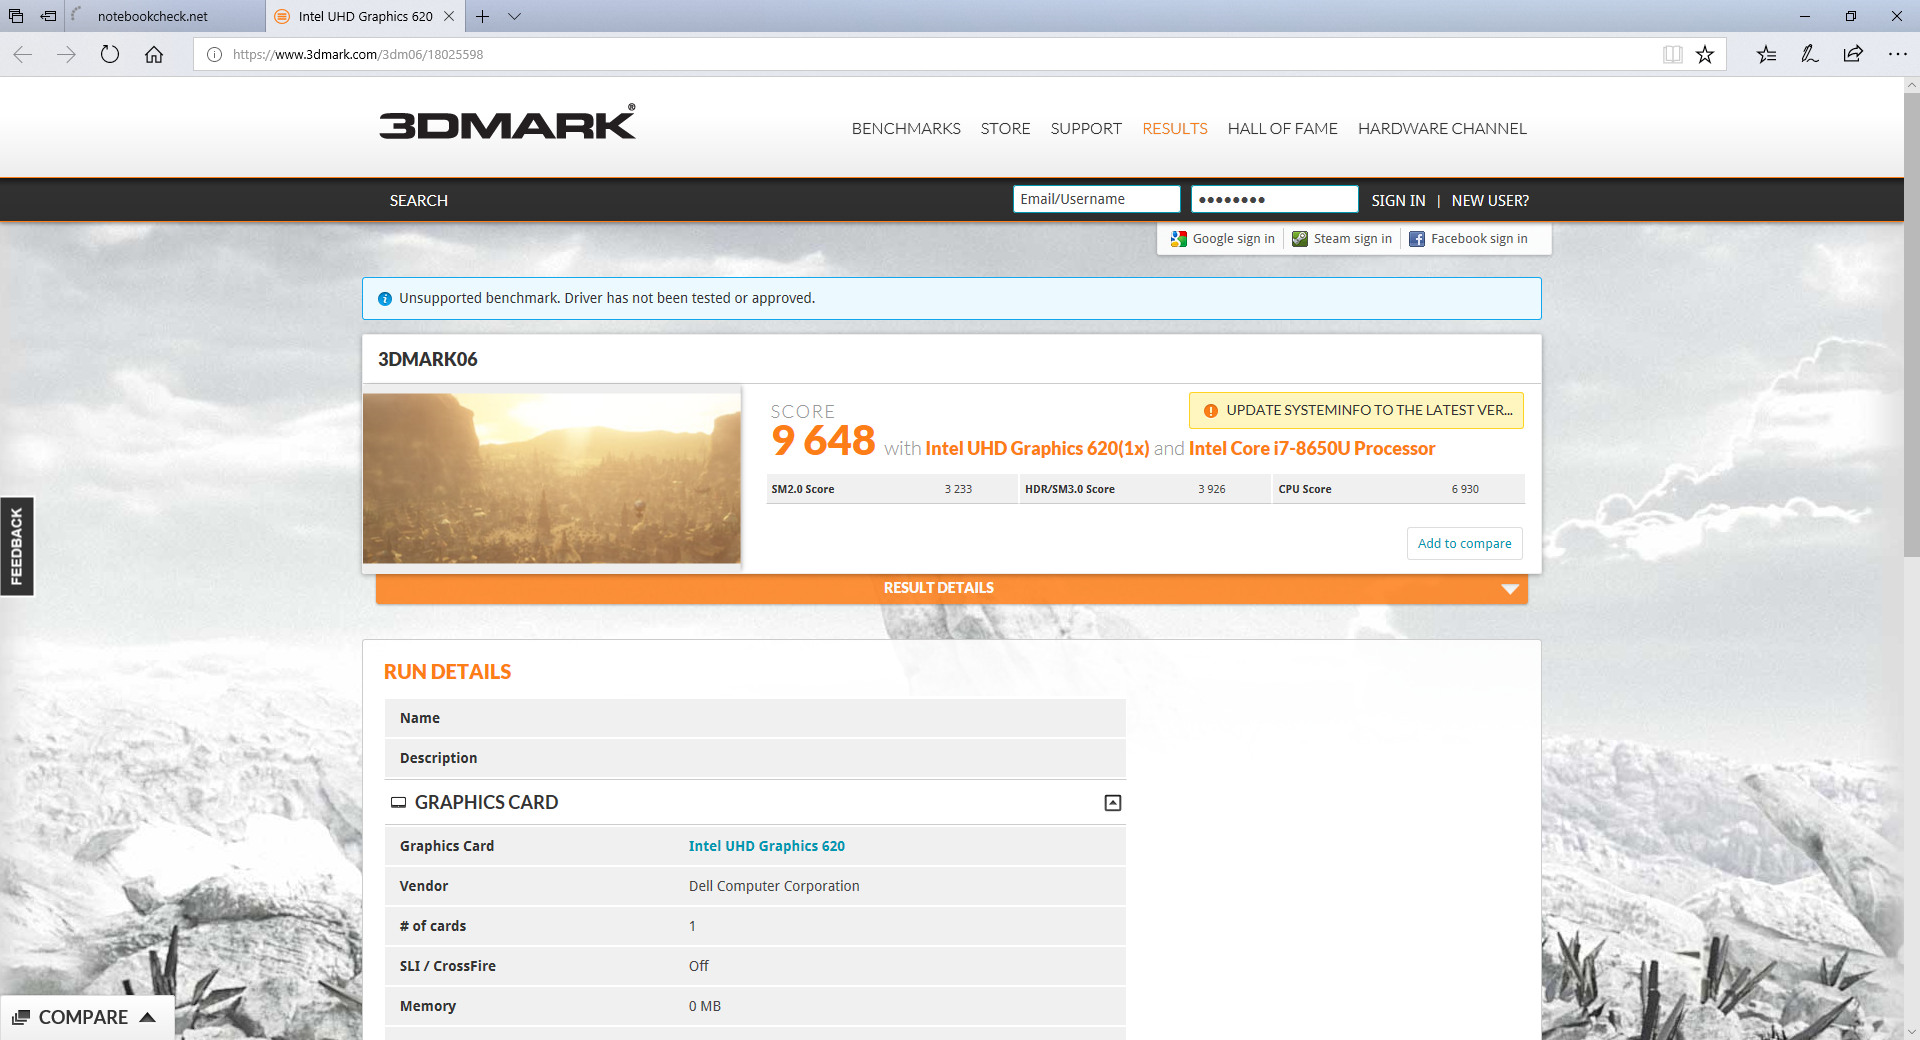
| 3DMark 06 Standard Score | 9648 points | |
| 3DMark 11 Performance | 1808 points | |
| 3DMark Ice Storm Standard Score | 64396 points | |
| 3DMark Cloud Gate Standard Score | 8115 points | |
| 3DMark Fire Strike Score | 950 points | |
| 3DMark Fire Strike Extreme Score | 395 points | |
Help | ||
| low | med. | high | ultra | |
|---|---|---|---|---|
| BioShock Infinite (2013) | 56 | 33 | 27 | 10 |
Stress Test
It’s become a bit of a trend in our reviews of 8th-generation Core i7 laptops that the Stress Test section holds some sort of priceless explanatory capability—since so many of the machines we’ve reviewed with these chips seem to suffer the same fate of near-immediate drops in multi-core performance. And the common variable among them all, as you might expect, is temperature.
Here today, we (unsurprisingly) witness similar behavior from the Latitude 7390 2-in-1. Within seconds the CPU core temperatures have risen into the 80s C before eventually peaking at 88 degrees. At this point, the CPU has already sacrificed its base frequency down to the 2.6 GHz mark to try and support sustainable temperatures going forward. This explains the sudden drop in performance (and the failure to recover to levels exceeding that of a Core i5-8250U).
GPU stress isn’t quite as troublesome, though clock rates can’t maintain the Boost Frequency of 1150 MHz. Instead, we see them stable at 1000 MHz, with temperatures sticking at the 83 °C mark.
Combined system stress produces unmanageable power conditions for the laptop; CPU frequency drops all the way to 1.4 GHz and the GPU clock rate slips to 850 MHz.
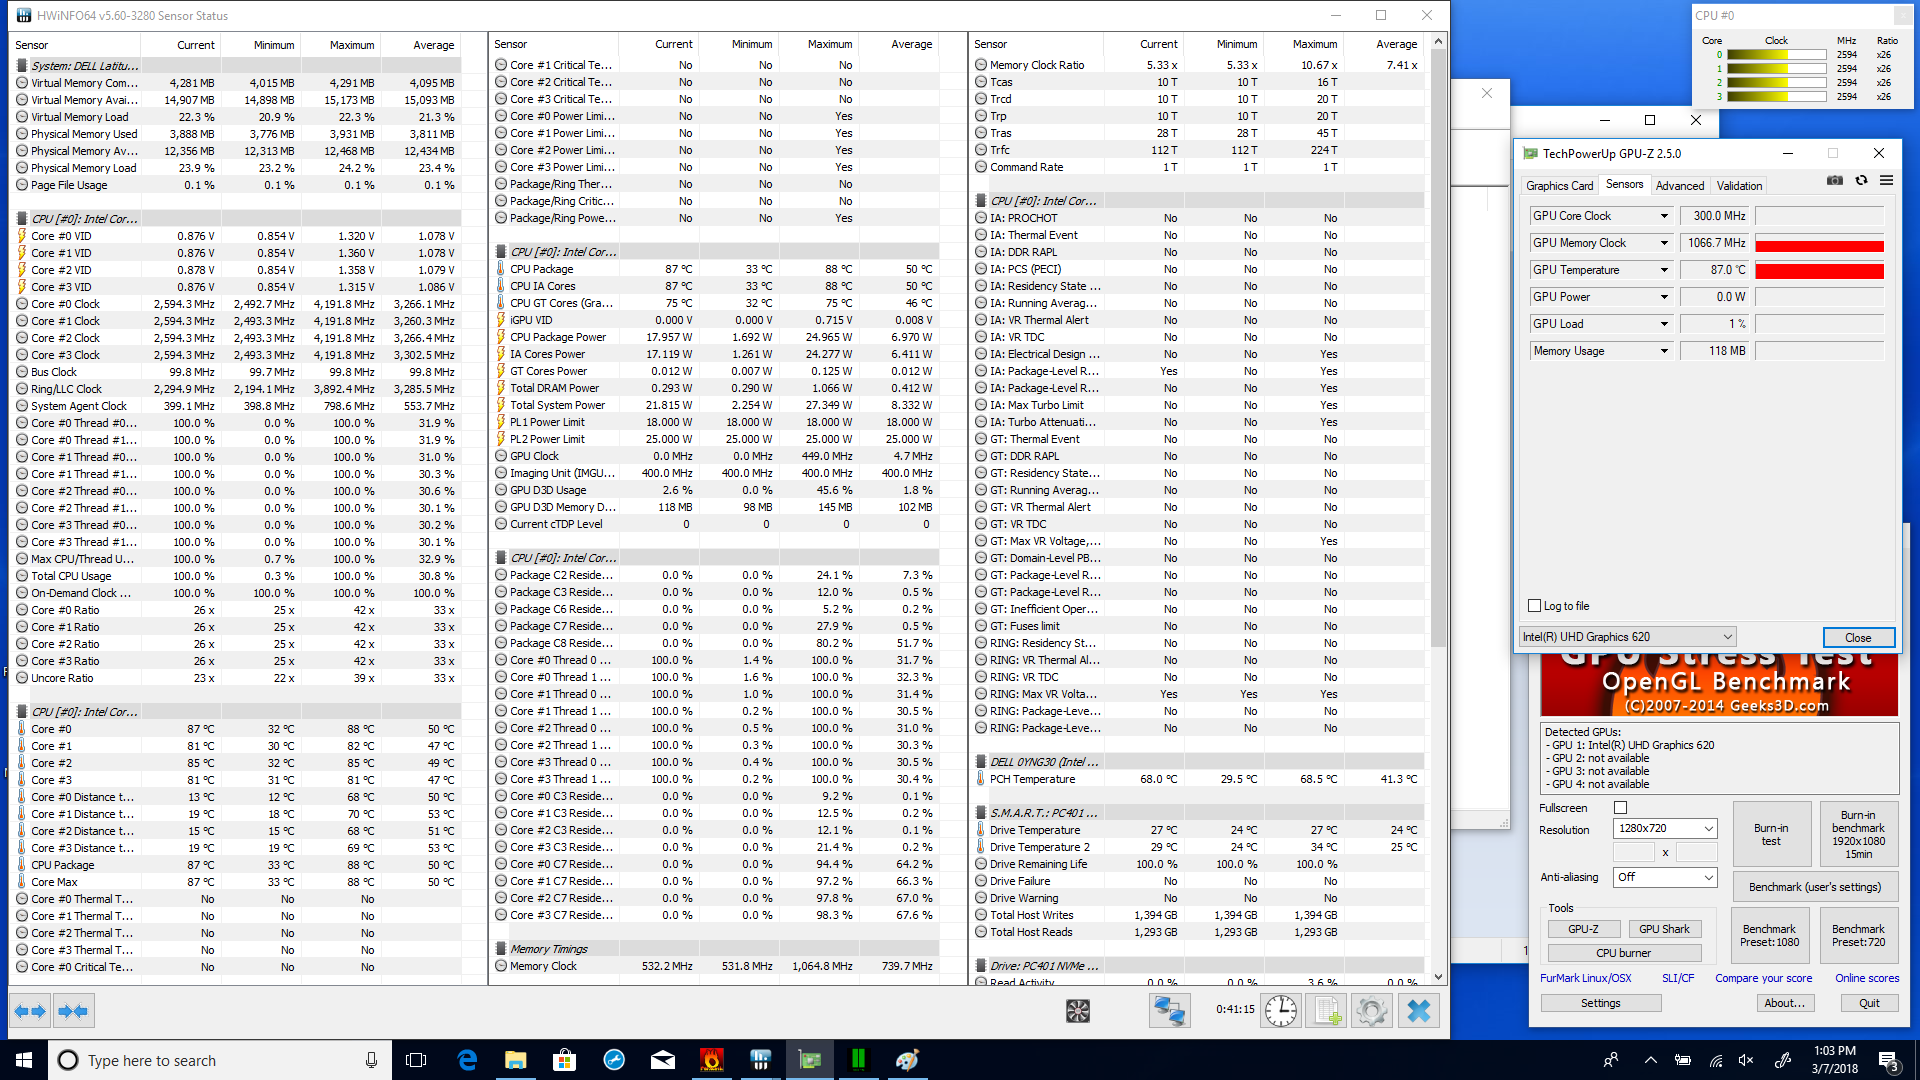
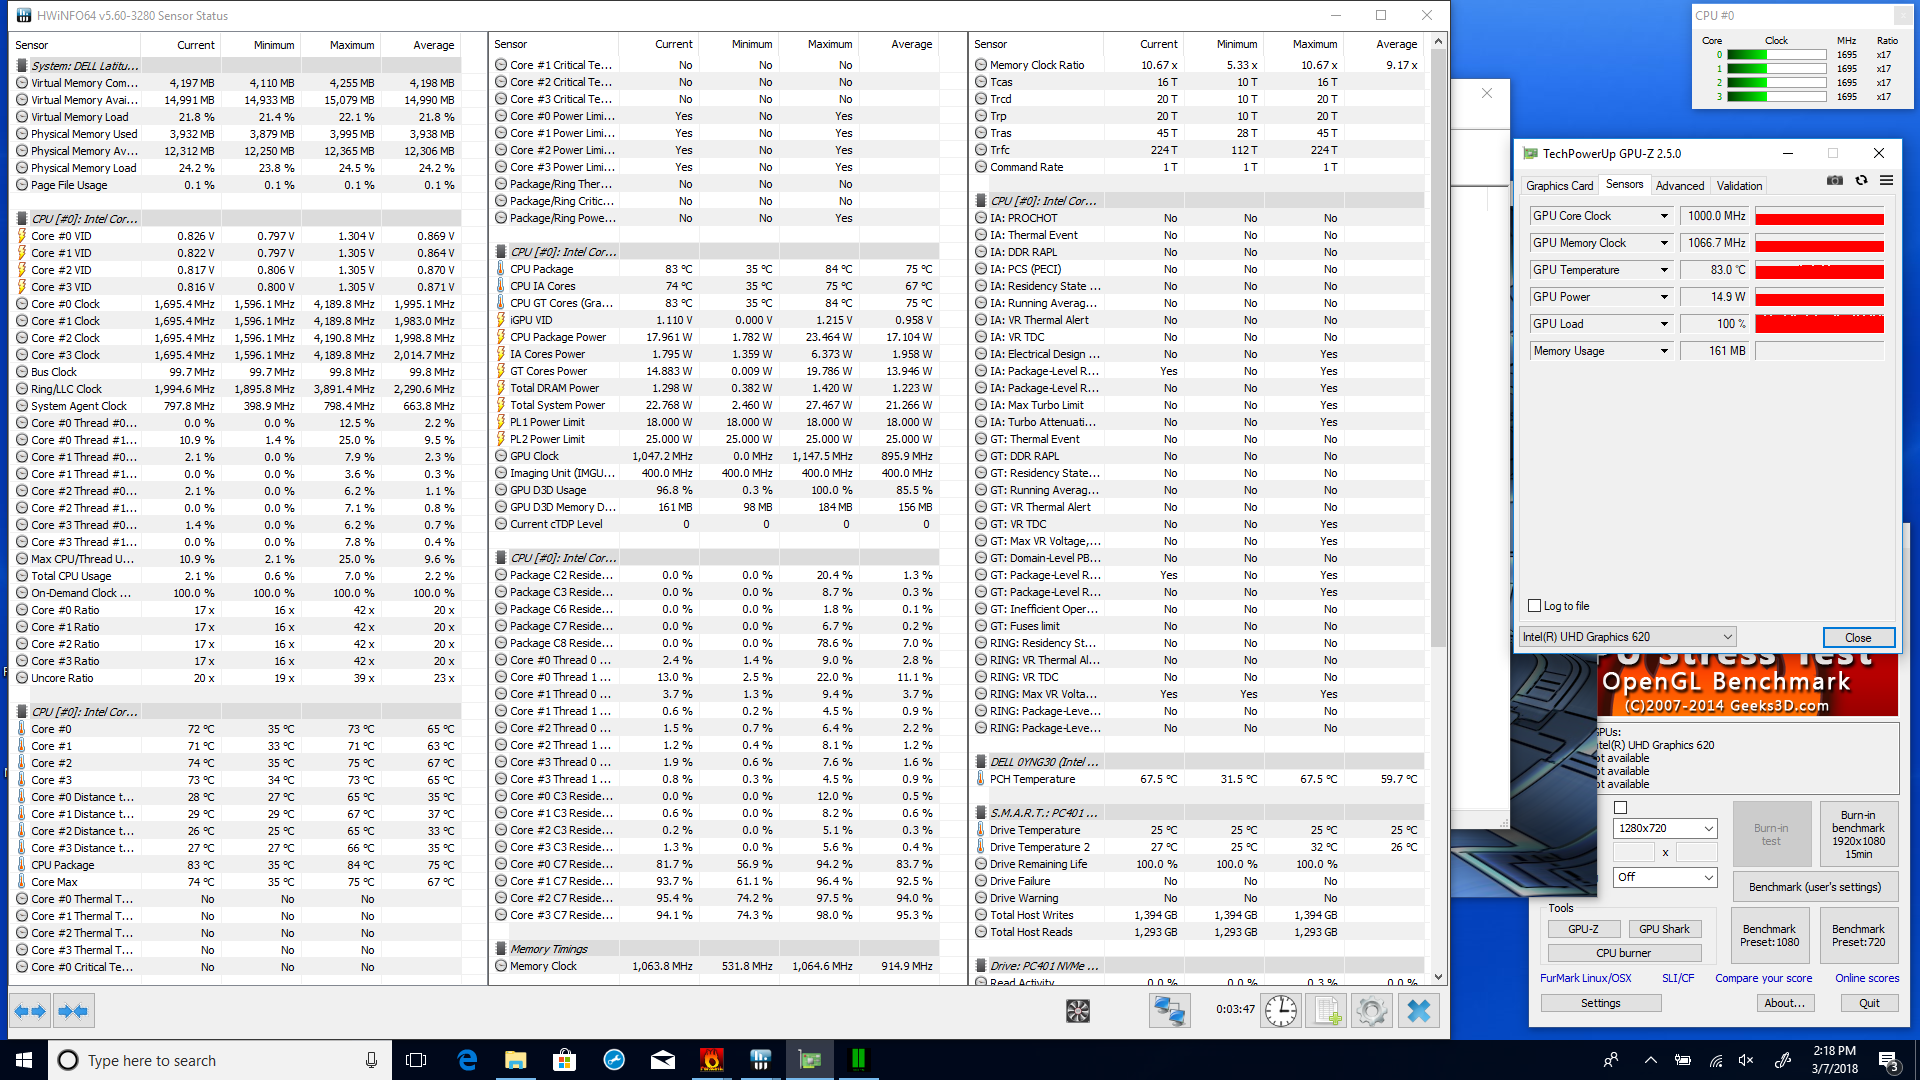
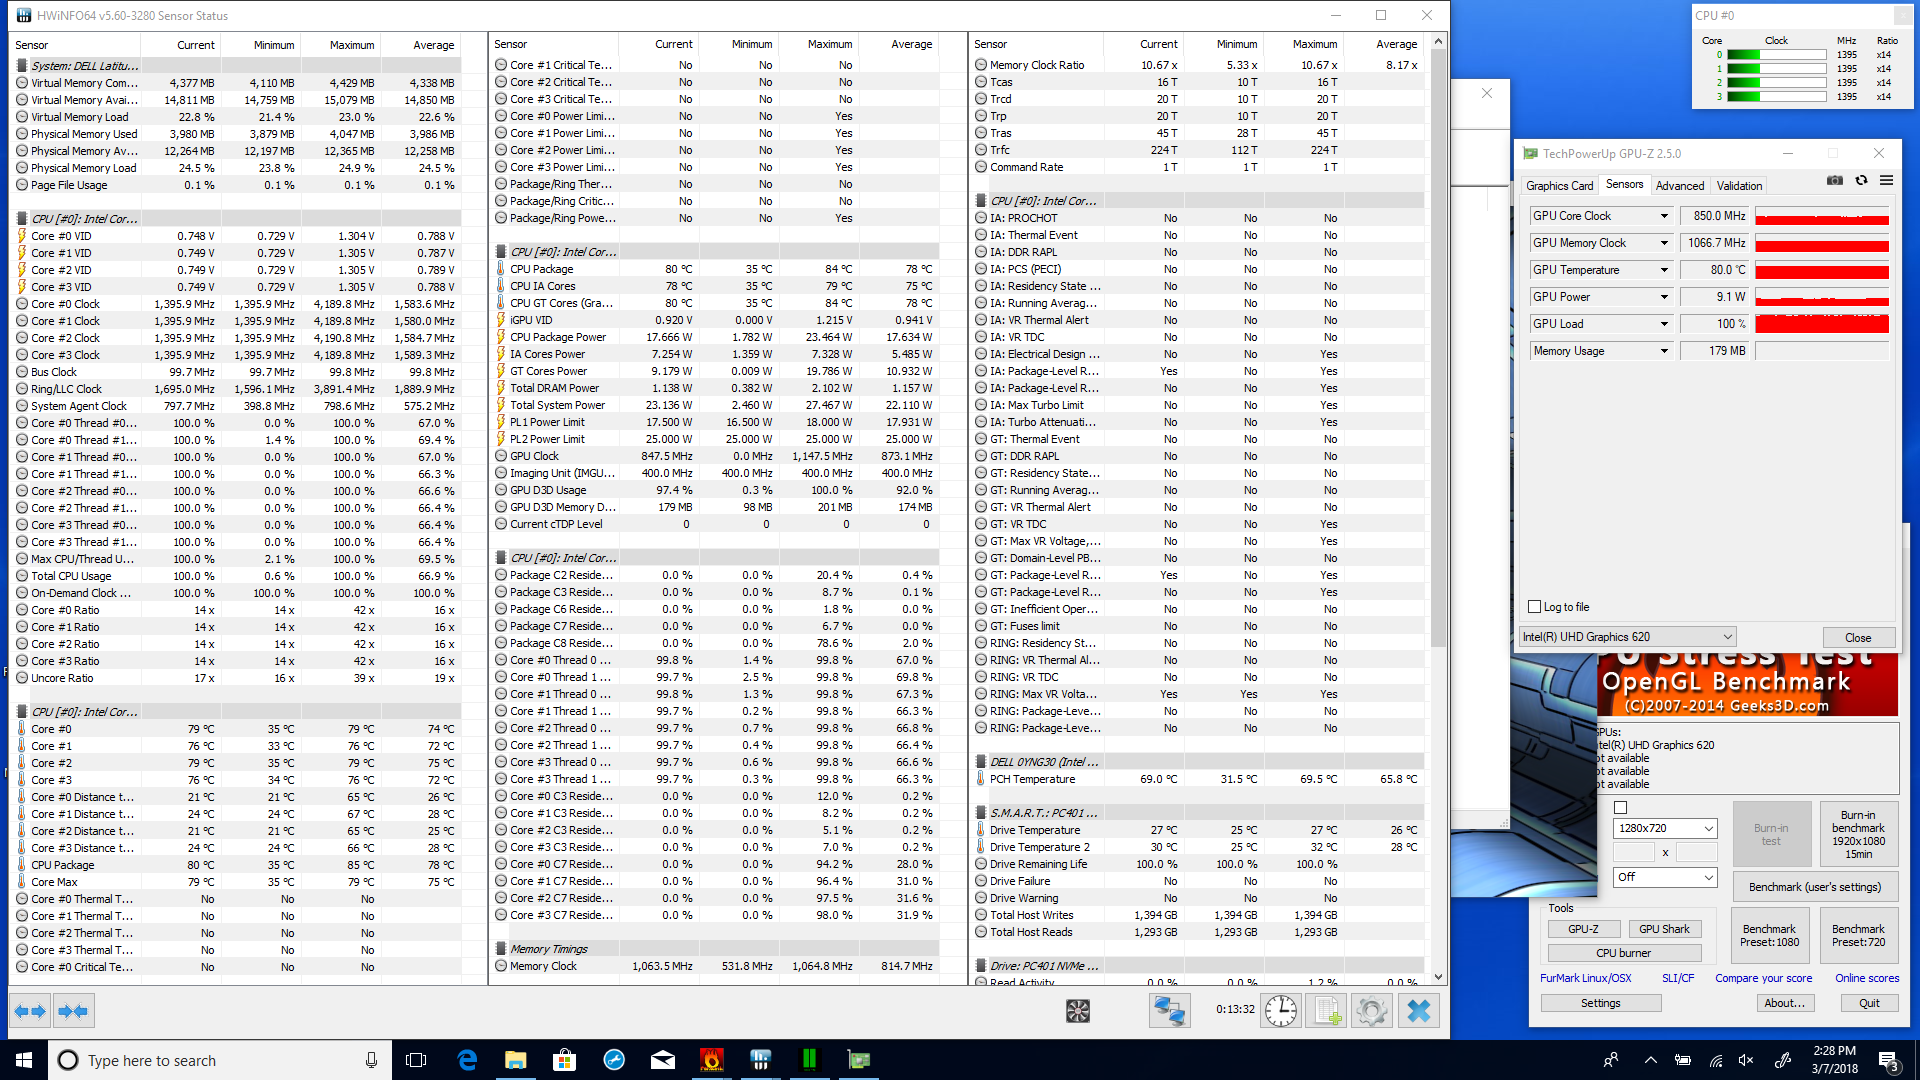
| CPU Clock (GHz) | GPU Clock (MHz) | Average CPU Temperature (°C) | Average GPU Temperature (°C) | |
| Prime95 Stress | 2.6 | - | 84 | - |
| FurMark Stress | - | 1000 | - | 83 |
| Prime95 + FurMark Stress | 1.4 | 850 | 78 | 80 |
Emissions
System Noise
Under typical conditions, the Dell Latitude 7390 2-in-1 is either silent or very close to it. During our testing, the fan didn’t even kick on under most moderate loads unless they lasted for an extended period of time. We actually initially recorded a load average value of effectively zero (adjusted for 28.2 dB(A) environmental noise), but after a while we eventually heard the fan power up and generate some 32 dB(A) of relatively unobtrusive noise.
Load maximum is definitely noticeable if and when that level is ever reached, however: the fan can get fairly noisy at 41.6 dB(A), and its higher pitch makes it relatively annoying to endure under these conditions. However, we should stress that it’s very unlikely that this scenario (which is synthetically provoked in our labs during measurements) would be encountered during normal use by most office and home users. Only extremely slight electrical noise was detectable from our review unit; at a distance of greater than 12 inches, it was almost imperceptible.
Noise level
| Idle |
| 28.2 / 28.2 / 28.2 dB(A) |
| Load |
| 32 / 41.6 dB(A) |
 | ||
30 dB silent 40 dB(A) audible 50 dB(A) loud |
||
min: | ||
| Dell Latitude 7390 2-in-1 UHD Graphics 620, i7-8650U, SK hynix PC401 NVMe 500 GB | Dell Latitude 13 7380 HD Graphics 620, i7-7600U, Samsung PM961 MZVLW256HEHP | Lenovo ThinkPad X1 Carbon 2018-20KGS03900 UHD Graphics 620, i5-8550U, Samsung SSD PM981 MZVLB512HAJQ | HP Elitebook 1040 G4-2XU40UT HD Graphics 630, i7-7820HQ, Toshiba XG4 NVMe (THNSN5512GPUK) | Asus ZenBook 13 UX331UN GeForce MX150, i5-8550U, SK Hynix HFS256G39TND-N210A | Toshiba Portege A30-D-139 HD Graphics 620, i3-7100U, Toshiba SG5 THNSNK128GVN8 | |
|---|---|---|---|---|---|---|
| Noise | 3% | -3% | 2% | -8% | -7% | |
| off / environment * (dB) | 28.2 | 28 1% | 28.9 -2% | 28.2 -0% | 30.13 -7% | 30 -6% |
| Idle Minimum * (dB) | 28.2 | 28 1% | 28.9 -2% | 28.2 -0% | 30.13 -7% | 30 -6% |
| Idle Average * (dB) | 28.2 | 28 1% | 28.9 -2% | 28.2 -0% | 30.3 -7% | 30 -6% |
| Idle Maximum * (dB) | 28.2 | 29.6 -5% | 32.5 -15% | 28.2 -0% | 30.3 -7% | 30 -6% |
| Load Average * (dB) | 32 | 30.6 4% | 35.1 -10% | 33.3 -4% | 39.2 -23% | 39.3 -23% |
| Load Maximum * (dB) | 41.6 | 35.4 15% | 35.1 16% | 35.3 15% | 41 1% | 38.3 8% |
* ... smaller is better
Temperature
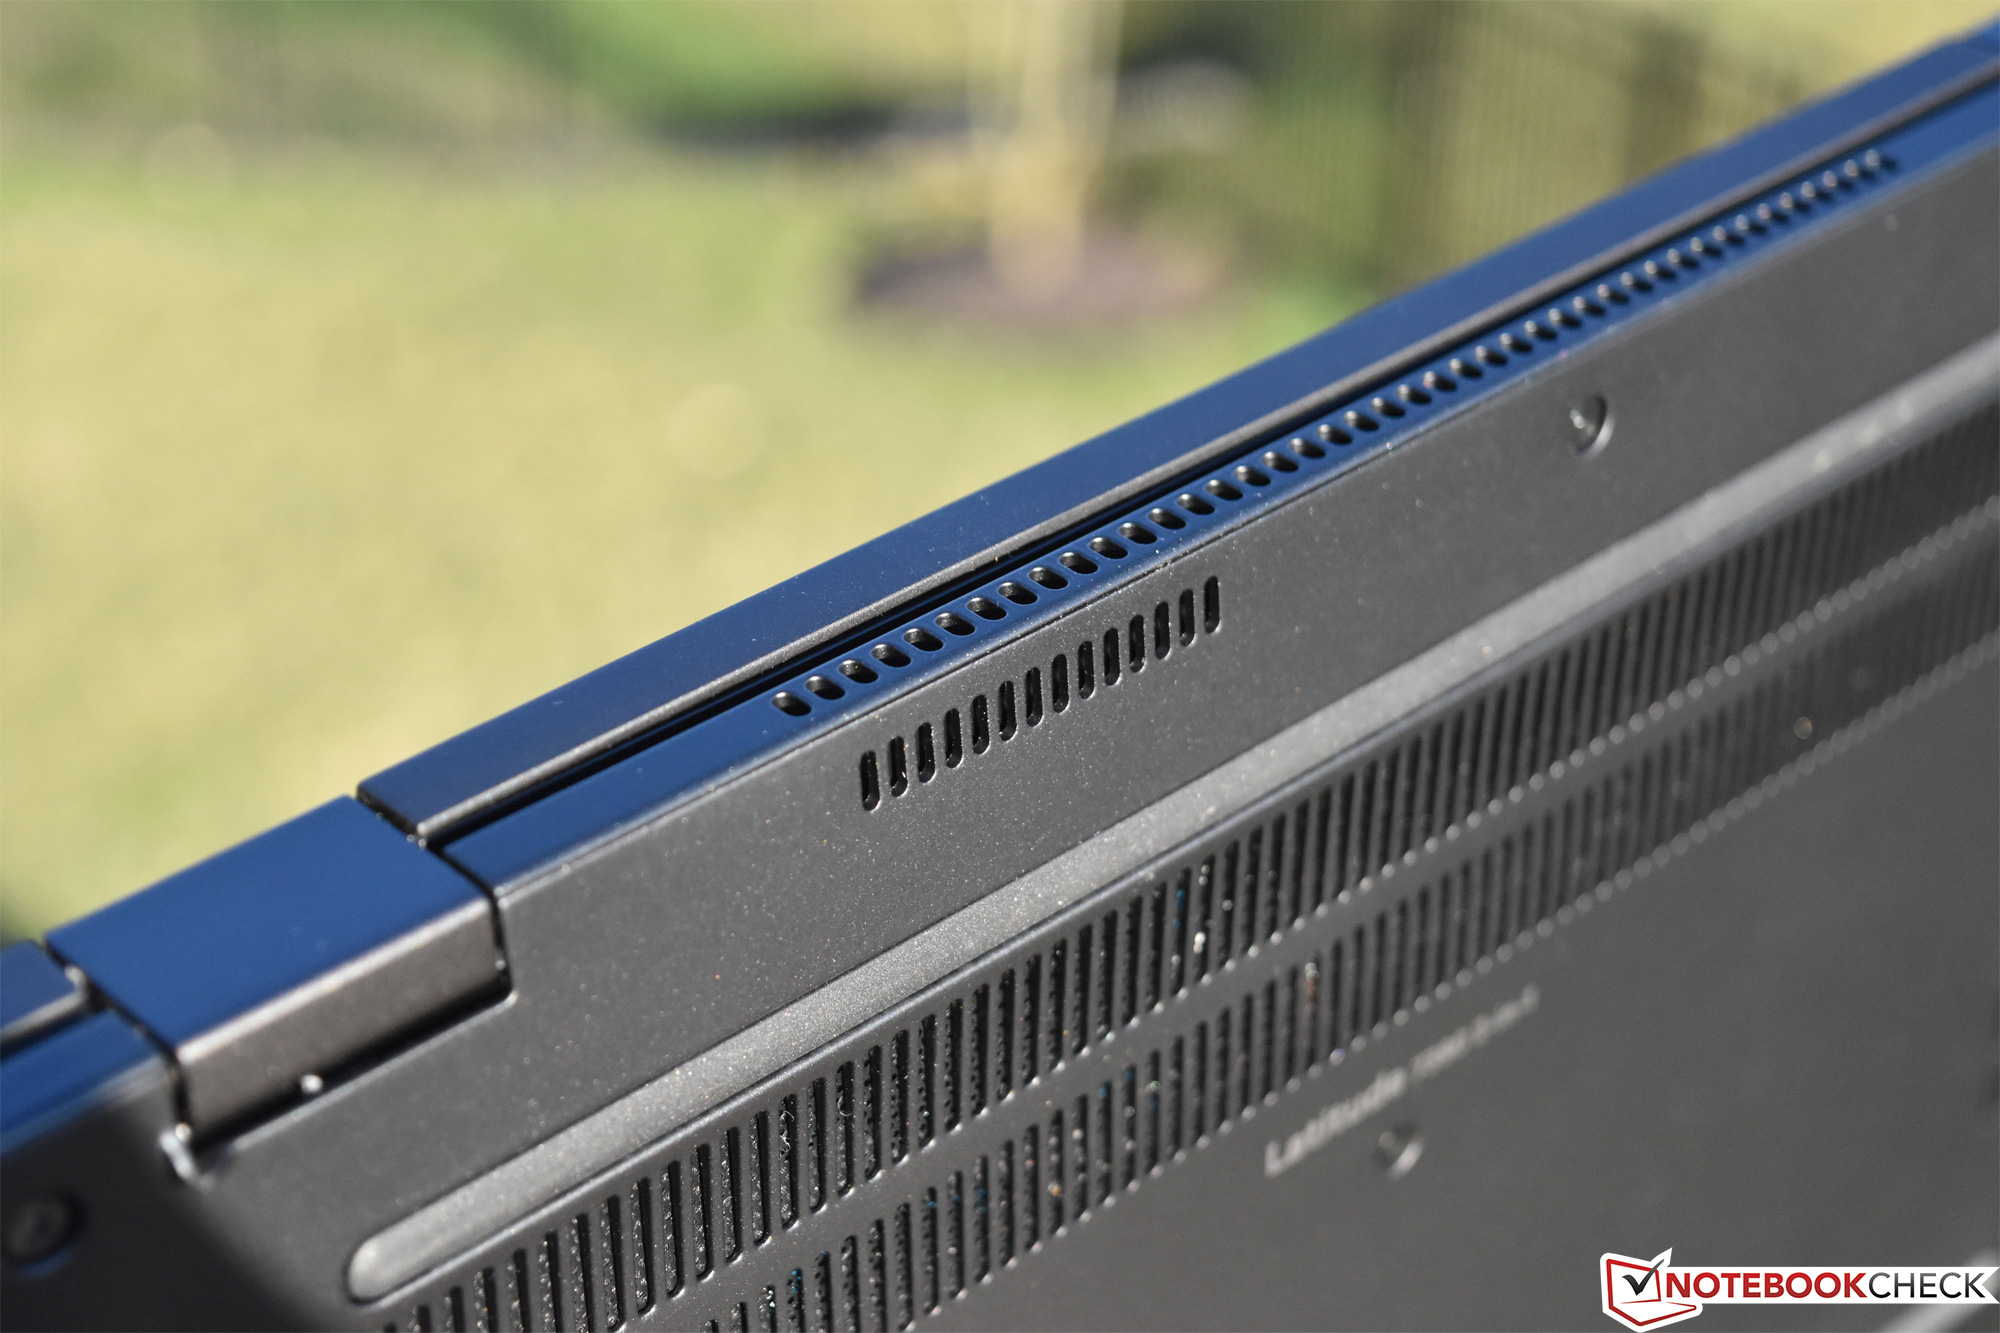
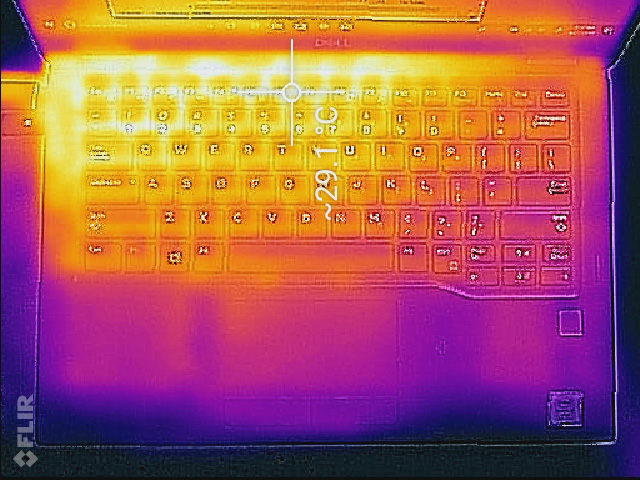
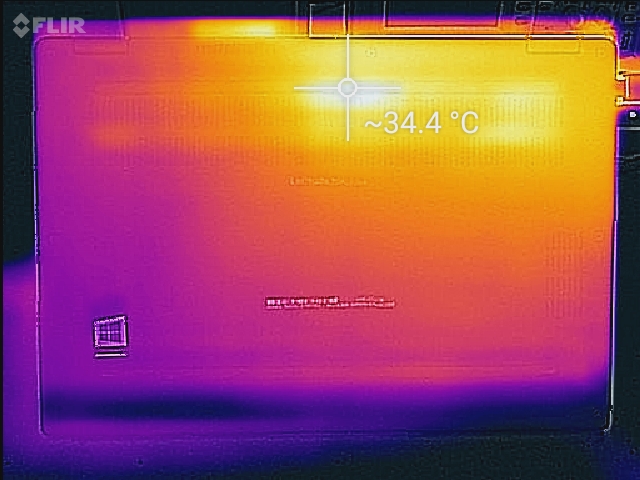
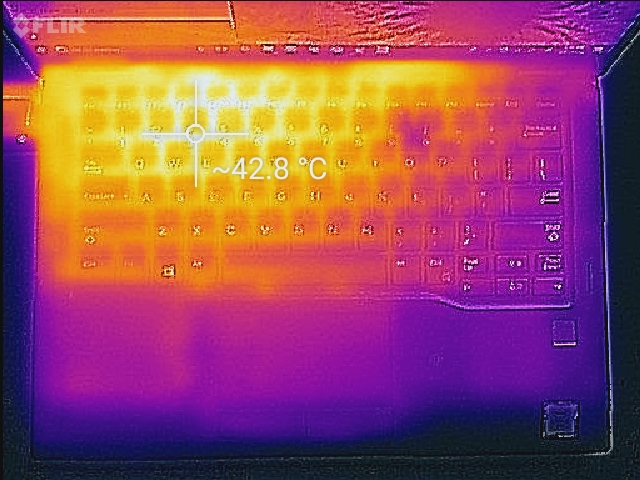
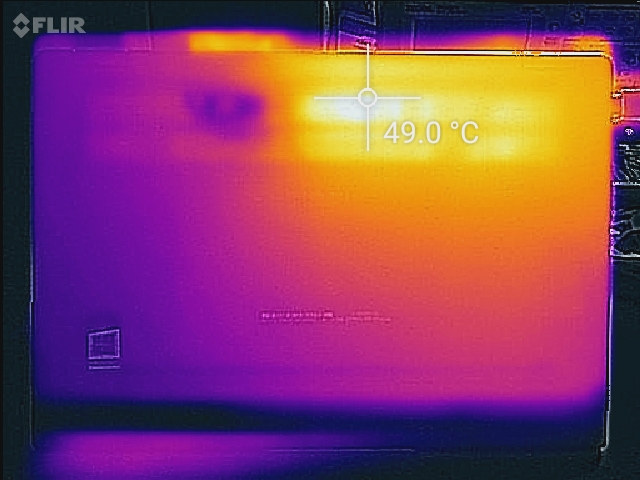
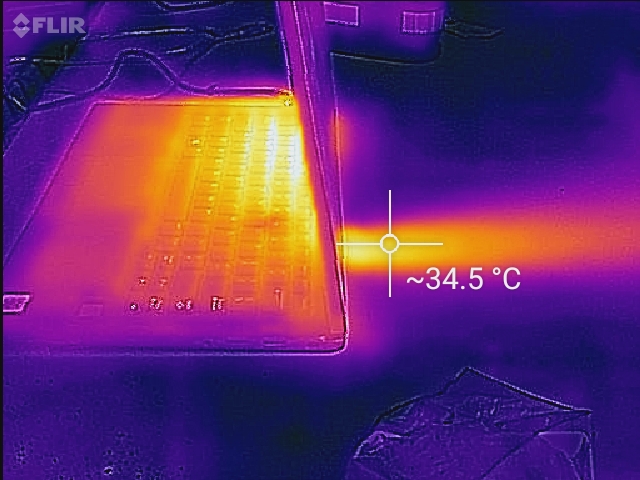
Barring a couple of hot spots (50.6 °C) in the rear-center and rear-right of the device, the Latitude does a fairly good job of managing its heat. The keyboard remains mostly cool in nearly all normal conditions, and under load, it still doesn’t rise to uncomfortable levels (just a bit warm). Average load temperatures of 33 °C / 35.8 °C on top/bottom under load can’t compete with the likes of the Toshiba or Asus ZenBook, but they’re not terribly bothersome either.
(±) The maximum temperature on the upper side is 44 °C / 111 F, compared to the average of 34.3 °C / 94 F, ranging from 21.2 to 62.5 °C for the class Office.
(-) The bottom heats up to a maximum of 50.6 °C / 123 F, compared to the average of 36.8 °C / 98 F
(+) In idle usage, the average temperature for the upper side is 25.2 °C / 77 F, compared to the device average of 29.5 °C / 85 F.
(+) The palmrests and touchpad are cooler than skin temperature with a maximum of 27.4 °C / 81.3 F and are therefore cool to the touch.
(±) The average temperature of the palmrest area of similar devices was 27.6 °C / 81.7 F (+0.2 °C / 0.4 F).
Speakers
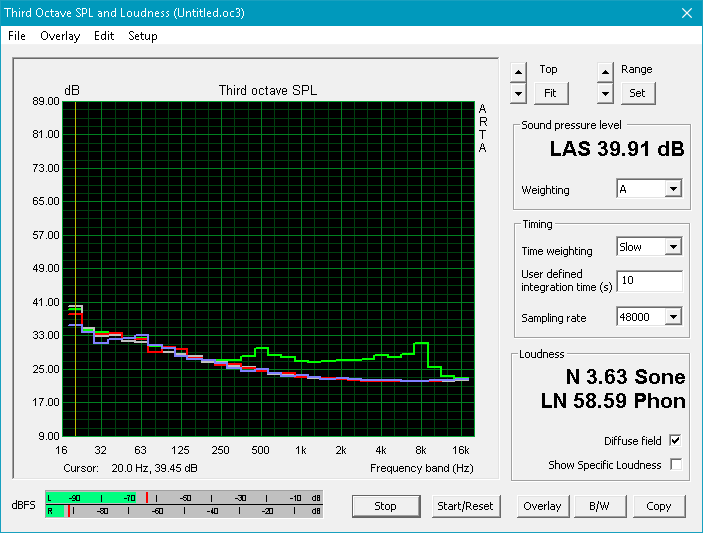
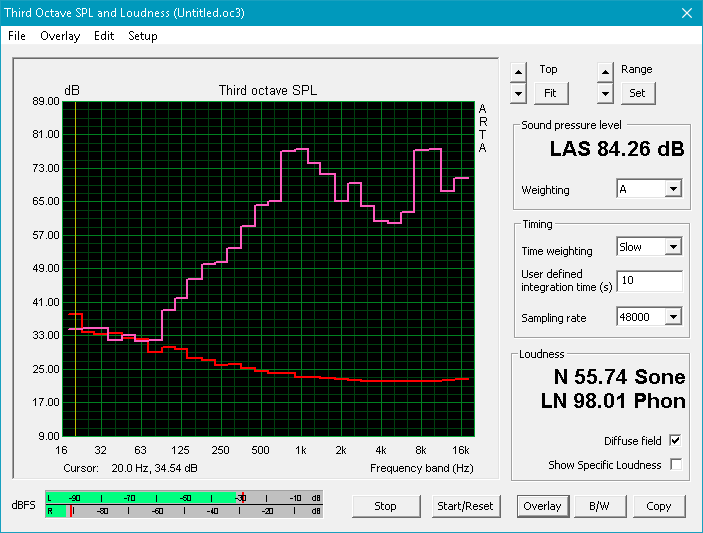
The Latitude 7390 2-in-1 lacks the more impressive audio capabilities of some of its larger predecessors in the Latitude 7000 series. While the speakers do get rather loud at 84.26 dB, they manage almost no bass and the shape of their output is average at best. At higher volumes, although we didn't notice any rattling or vibration from the casing, the frequency balance does suffer notably and mids are even more accentuated (at the expense of lows). It will suffice for office use, but competitors such as the Lenovo X1 Carbon do an overall better job.
Dell Latitude 7390 2-in-1 audio analysis
(+) | speakers can play relatively loud (84.3 dB)
Bass 100 - 315 Hz
(-) | nearly no bass - on average 17.1% lower than median
(±) | linearity of bass is average (9% delta to prev. frequency)
Mids 400 - 2000 Hz
(±) | higher mids - on average 6.4% higher than median
(±) | linearity of mids is average (11.1% delta to prev. frequency)
Highs 2 - 16 kHz
(±) | higher highs - on average 6% higher than median
(±) | linearity of highs is average (11% delta to prev. frequency)
Overall 100 - 16.000 Hz
(±) | linearity of overall sound is average (22.8% difference to median)
Compared to same class
» 63% of all tested devices in this class were better, 8% similar, 29% worse
» The best had a delta of 7%, average was 21%, worst was 53%
Compared to all devices tested
» 68% of all tested devices were better, 5% similar, 27% worse
» The best had a delta of 4%, average was 23%, worst was 134%
Lenovo ThinkPad X1 Carbon 2018-20KGS03900 audio analysis
(+) | speakers can play relatively loud (83.6 dB)
Bass 100 - 315 Hz
(-) | nearly no bass - on average 25.9% lower than median
(±) | linearity of bass is average (9.8% delta to prev. frequency)
Mids 400 - 2000 Hz
(+) | balanced mids - only 3.8% away from median
(±) | linearity of mids is average (9% delta to prev. frequency)
Highs 2 - 16 kHz
(+) | balanced highs - only 2.1% away from median
(+) | highs are linear (4% delta to prev. frequency)
Overall 100 - 16.000 Hz
(±) | linearity of overall sound is average (18.7% difference to median)
Compared to same class
» 35% of all tested devices in this class were better, 6% similar, 59% worse
» The best had a delta of 7%, average was 21%, worst was 53%
Compared to all devices tested
» 43% of all tested devices were better, 8% similar, 49% worse
» The best had a delta of 4%, average was 23%, worst was 134%
Frequency Comparison (Checkbox selectable!)
Graph 1: Pink Noise 100% Vol.; Graph 2: Audio off
Energy Management
Power Consumption
One area in which the Latitude absolutely beats its peers is that of power consumption. Here, we measured just 5.7 W while idling (average), with a load average of still just 29.5 W. This is (unsurprisingly) closely comparable to last year’s Latitude 7380 and quite a bit lower than some competitors, such as the ThinkPad X1 Carbon (idle/load average: 8.9/47.5 W) and EliteBook 1040 G4 (idle/load average: 7/41.2 W). It should hopefully translate to long battery runtimes… let’s see.
| Off / Standby | |
| Idle | |
| Load |
|
Key:
min: | |
| Dell Latitude 7390 2-in-1 i7-8650U, UHD Graphics 620, SK hynix PC401 NVMe 500 GB, IPS, 1920x1080, 13.3" | Dell Latitude 13 7380 i7-7600U, HD Graphics 620, Samsung PM961 MZVLW256HEHP, IPS, 1920x1080, 13.3" | Lenovo ThinkPad X1 Carbon 2018-20KGS03900 i5-8550U, UHD Graphics 620, Samsung SSD PM981 MZVLB512HAJQ, IPS, 2560x1440, 14" | HP Elitebook 1040 G4-2XU40UT i7-7820HQ, HD Graphics 630, Toshiba XG4 NVMe (THNSN5512GPUK), IPS, 1920x1080, 14" | Asus ZenBook 13 UX331UN i5-8550U, GeForce MX150, SK Hynix HFS256G39TND-N210A, IPS, 1920x1080, 13.3" | Toshiba Portege A30-D-139 i3-7100U, HD Graphics 620, Toshiba SG5 THNSNK128GVN8, IPS, 1920x1080, 13.3" | |
|---|---|---|---|---|---|---|
| Power Consumption | -1% | -60% | -60% | -9% | -10% | |
| Idle Minimum * (Watt) | 2.6 | 3.2 -23% | 3.8 -46% | 5.1 -96% | 2.2 15% | 3.2 -23% |
| Idle Average * (Watt) | 5.7 | 5.5 4% | 8.9 -56% | 7 -23% | 5 12% | 6.8 -19% |
| Idle Maximum * (Watt) | 6 | 6.1 -2% | 11.9 -98% | 11.7 -95% | 8 -33% | 8 -33% |
| Load Average * (Watt) | 29.2 | 29.5 -1% | 47.5 -63% | 41.2 -41% | 33 -13% | 30.4 -4% |
| Load Maximum * (Watt) | 38.8 | 32 18% | 52.5 -35% | 56.9 -47% | 49.4 -27% | 28 28% |
* ... smaller is better
Battery Life
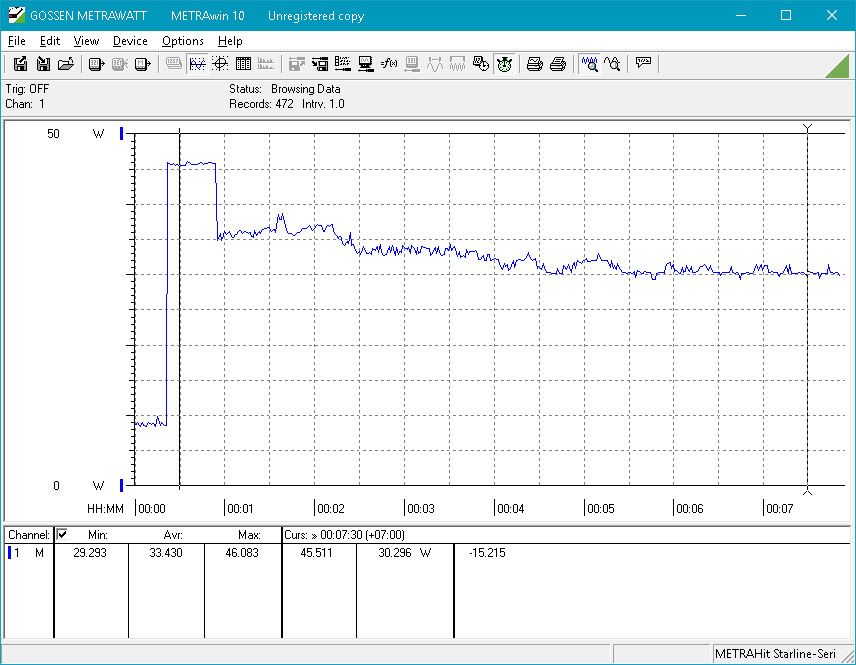
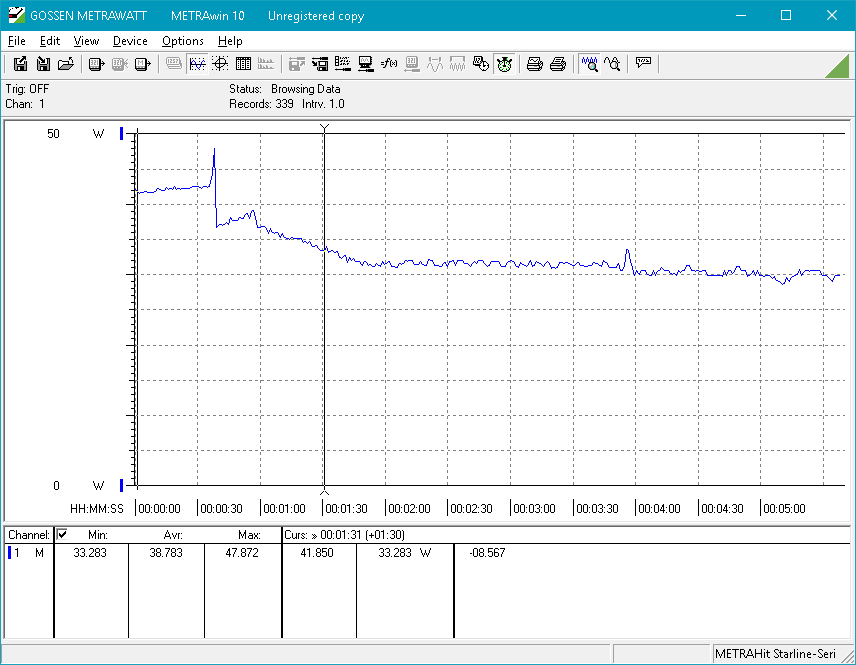
Compared with its predecessor (the Latitude 7380), the 7390 2-in-1’s battery has not grown in size at 60 Wh. Runtimes are a bit less, however; we measured a Wi-Fi surfing battery life of 9 hours and 13 minutes, which is still very good overall (though short of the 7380’s 10 hours and 30 minutes). Under load, the machine expired after 2 hours and 15 minutes, this time within just six minutes of the 7380’s result (2:21). Compared with its other peers, the 7390 2-in-1 is comparable in this category.
| Dell Latitude 7390 2-in-1 i7-8650U, UHD Graphics 620, 60 Wh | Dell Latitude 13 7380 i7-7600U, HD Graphics 620, 60 Wh | Lenovo ThinkPad X1 Carbon 2018-20KGS03900 i5-8550U, UHD Graphics 620, 57 Wh | HP Elitebook 1040 G4-2XU40UT i7-7820HQ, HD Graphics 630, 67 Wh | Asus ZenBook 13 UX331UN i5-8550U, GeForce MX150, 50 Wh | Toshiba Portege A30-D-139 i3-7100U, HD Graphics 620, 45 Wh | |
|---|---|---|---|---|---|---|
| Battery runtime | 9% | -14% | -5% | -12% | 11% | |
| WiFi v1.3 (h) | 9.2 | 10.5 14% | 8.7 -5% | 11.1 21% | 9 -2% | 9.1 -1% |
| Load (h) | 2.3 | 2.4 4% | 1.8 -22% | 1.6 -30% | 1.8 -22% | 2.8 22% |
Pros
Cons
Verdict
The Latitude 7390 2-in-1 is a well-built, sturdy, attractive machine with very good input devices and quick general system performance. It also features great connectivity options, easy maintenance, and a smaller-than-average footprint for its class. Particularly impressive is the option of dual-storage, made possible by the vacant WWAN slot, which can also accommodate an M.2/NVMe 2230 SSD. However, while CPU performance is still quite a bit faster than comparable machines from the previous generation, we see little justification for the Core i7 configuration we received as a review unit. Instead, unless single-threaded applications are the only items on the agenda, we’d recommend springing for a less expensive Core i5 configuration instead.
The Latitude 7390 2-in-1 is a well-built, sturdy, attractive machine with very good input devices and quick general system performance. However, it does have its share of drawbacks, and it certainly isn’t a small investment—so before diving in, we’d highly recommend surveying the landscape.
Elsewhere, the 7390 2-in-1 is also hobbled by a few other question marks. Only glossy touchscreens are available for configuration, and none of them is particularly impressive in the realm of color coverage—at least, not compared to category leaders such as the ThinkPad X1 Carbon. The NVMe SSD we received in our unit could hardly keep up with top-tier drives such as Samsung’s counterparts. The machine is fairly heavy for its size and, thanks to its thicker and comparably heavier display lid, it doesn’t feel quite as stable on the lap as we’d like. And lastly, there’s always the question of whether most people in business truly need the convertible functionality provided by these Yoga-style derivatives. Dell already has a perfectly capable, extremely well-balanced offering in the vanilla Latitude 7380 (and, though we’ve yet to review it, we’d presume also the 7390)—and it can be equipped with an anti-glare display, it’s lighter, and it feels more stable overall on a surface.
Other machines worth considering (apart from the conventional Latitude 7380/7390) are the excellent ThinkPad X1 Carbon 2018 and Asus Zenbook 13 UX331UN. At $2,109 (as configured), the Latitude 7390 2-in-1 certainly isn’t a small investment—so before diving in, we’d highly recommend surveying the landscape.
Dell Latitude 7390 2-in-1
- 03/20/2018 v6 (old)
Steve Schardein
Price comparison
