ASUS ZenBook 13 UX331UN (i7-8550, GeForce MX150, SSD, FHD) Laptop Review
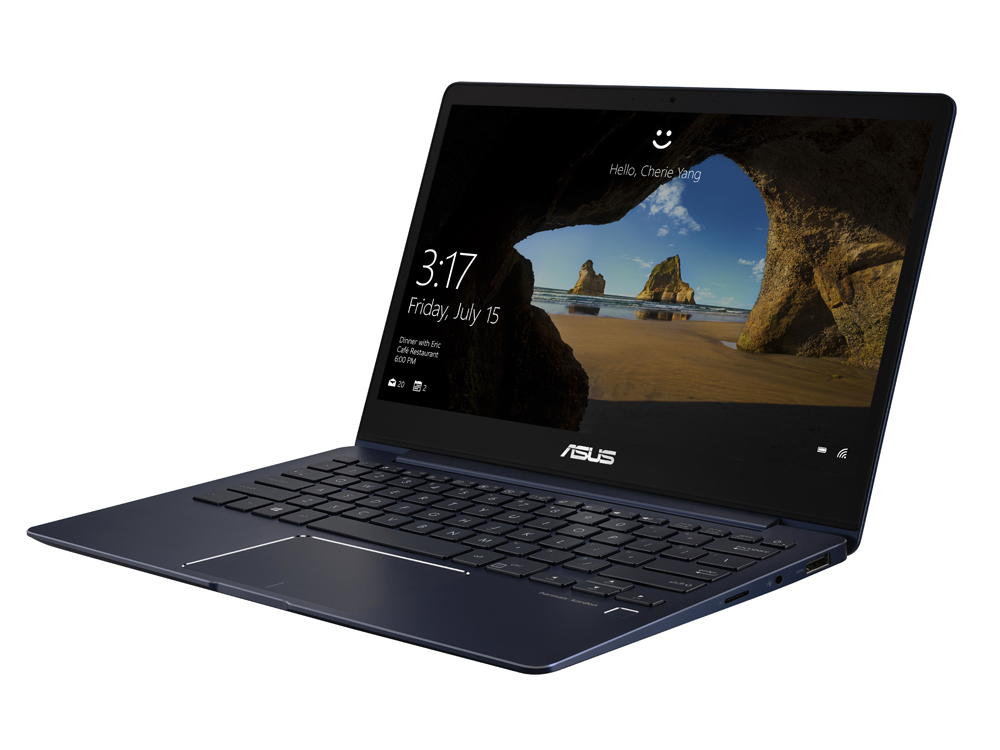
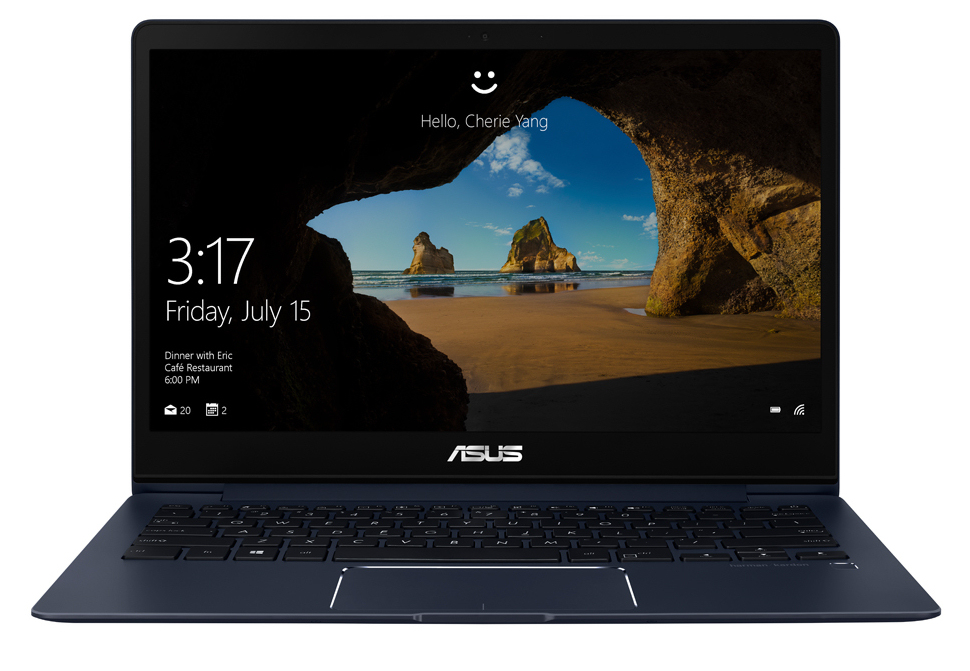
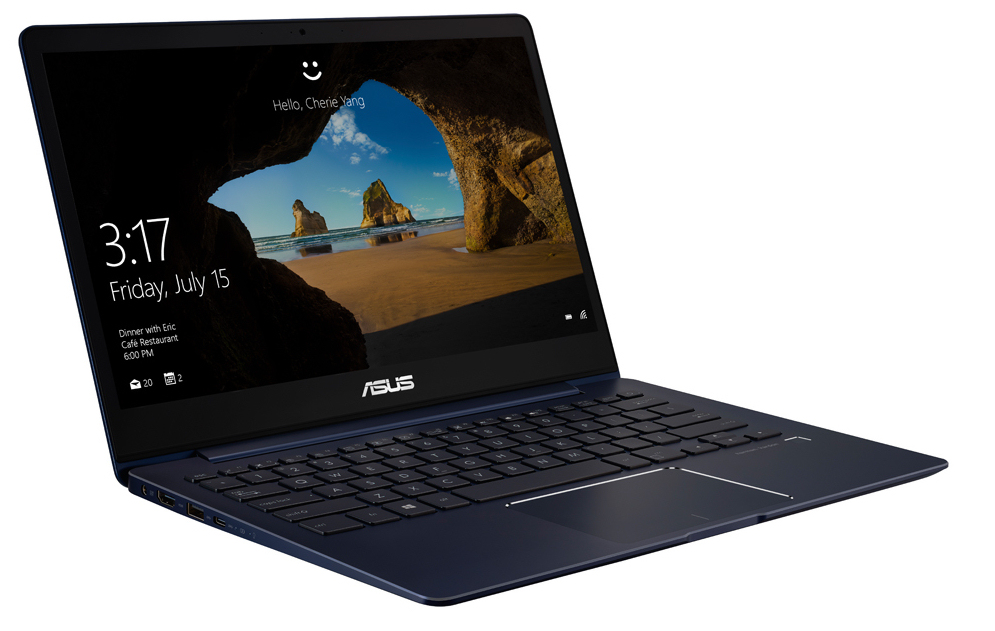
The ASUS ZenBook 13 is a sleek, compact, 13.3-inch Ultrabook. Onboard are a quad-core Core i7-8550U processor and a GeForce MX150 dedicated graphics card. We reviewed the ZenBook’s practically identical sibling earlier this year; so much of the device has already been covered by us. As such, we will not comment on the case, connectivity, input devices, screen or the speakers in this review. Information about these can be read in our review of the other ZenBook 13. We have chosen the Lenovo IdeaPad 720S-13IKB, HP Envy 13, Dell XPS 9370, and the MacBook Air 13 as comparison devices.
Communication
| SD Card Reader | |
| average JPG Copy Test (av. of 3 runs) | |
| Dell XPS 13 9370 FHD i5 (Toshiba Exceria Pro M501 64 GB UHS-II) | |
| Apple MacBook Air 13.3" 1.8 GHz (2017) (Toshiba Exceria Pro SDXC 64 GB UHS-II) | |
| Average of class Subnotebook (23.7 - 188, n=9, last 2 years) | |
| Asus ZenBook 13 UX331UN (Toshiba Exceria Pro M501) | |
| HP Envy 13-ad006ng (Toshiba Exceria Pro SDXC 64 GB UHS-II) | |
| Asus ZenBook 13 UX331UN (Toshiba Exceria Pro M501 microSDXC 64GB) | |
| maximum AS SSD Seq Read Test (1GB) | |
| Dell XPS 13 9370 FHD i5 (Toshiba Exceria Pro M501 64 GB UHS-II) | |
| Average of class Subnotebook (24.9 - 195, n=8, last 2 years) | |
| Apple MacBook Air 13.3" 1.8 GHz (2017) (Toshiba Exceria Pro SDXC 64 GB UHS-II) | |
| Asus ZenBook 13 UX331UN (Toshiba Exceria Pro M501 microSDXC 64GB) | |
| Asus ZenBook 13 UX331UN (Toshiba Exceria Pro M501) | |
| HP Envy 13-ad006ng (Toshiba Exceria Pro SDXC 64 GB UHS-II) | |
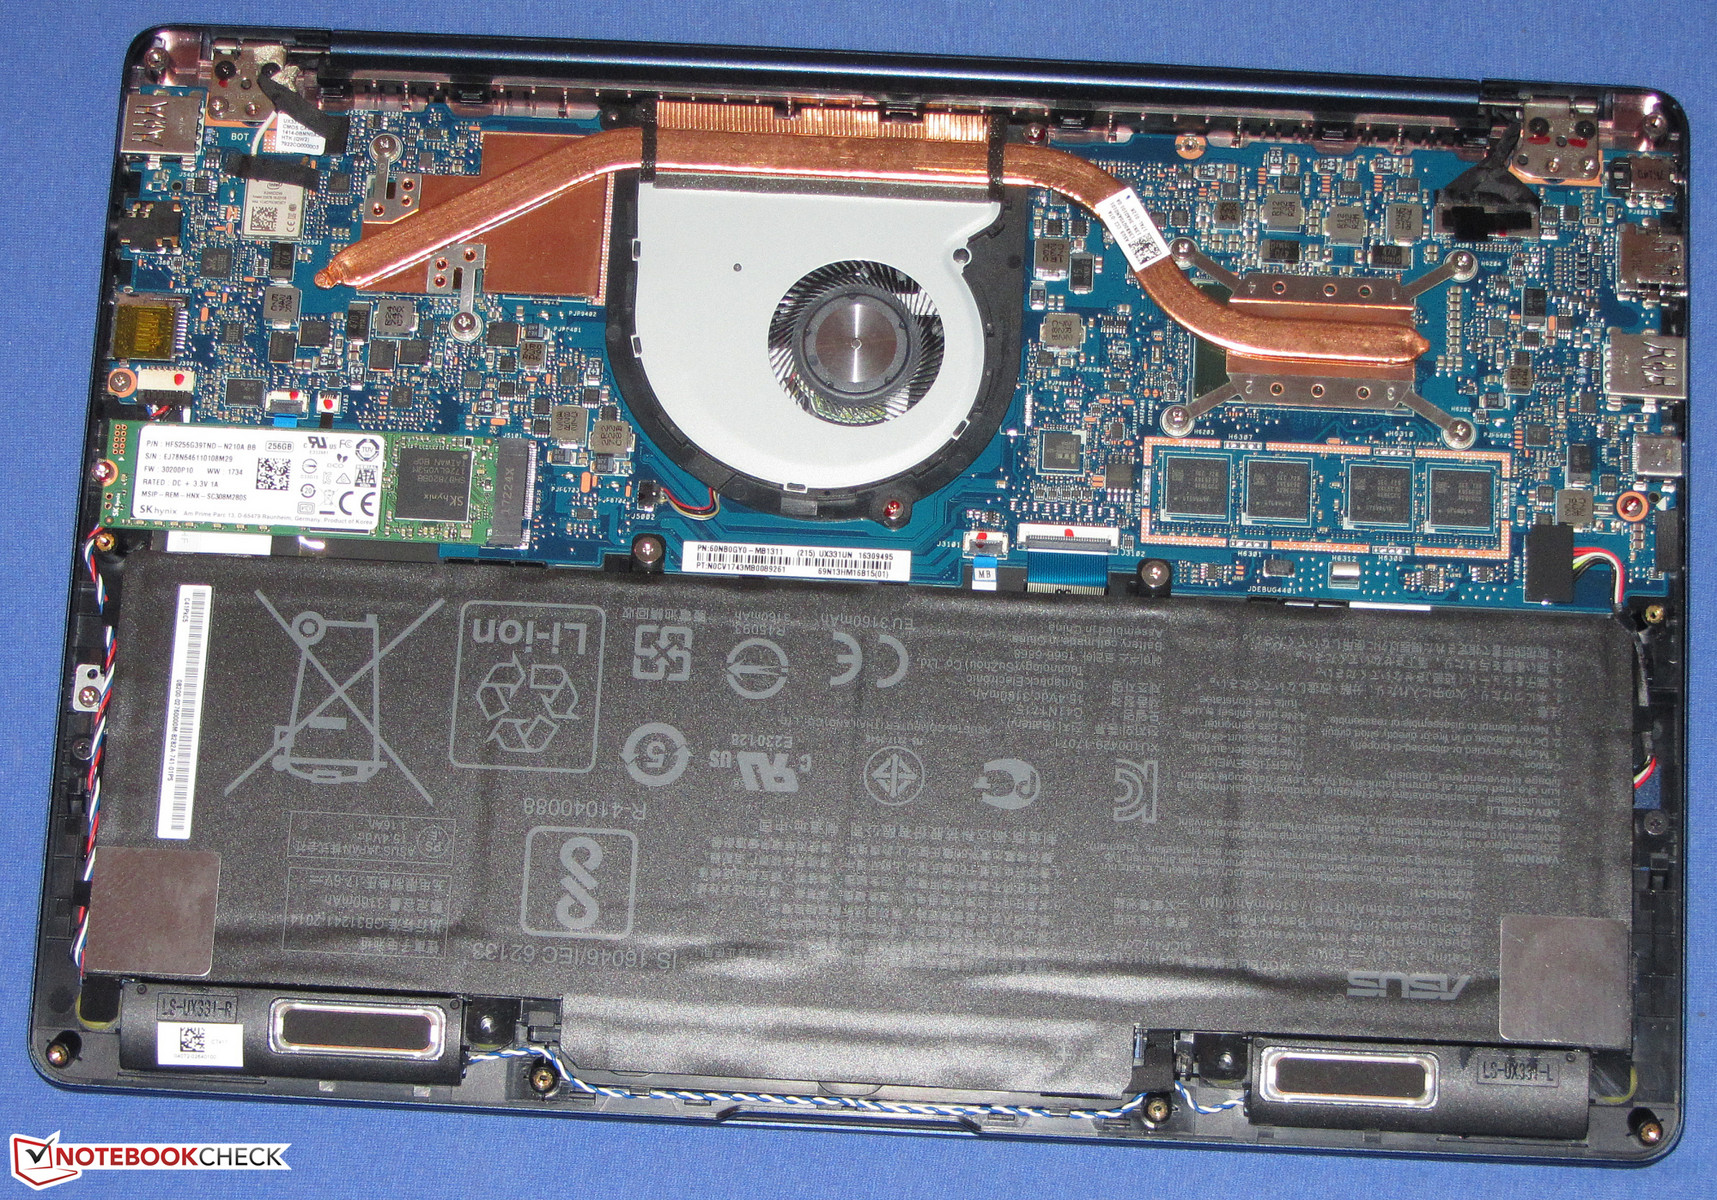
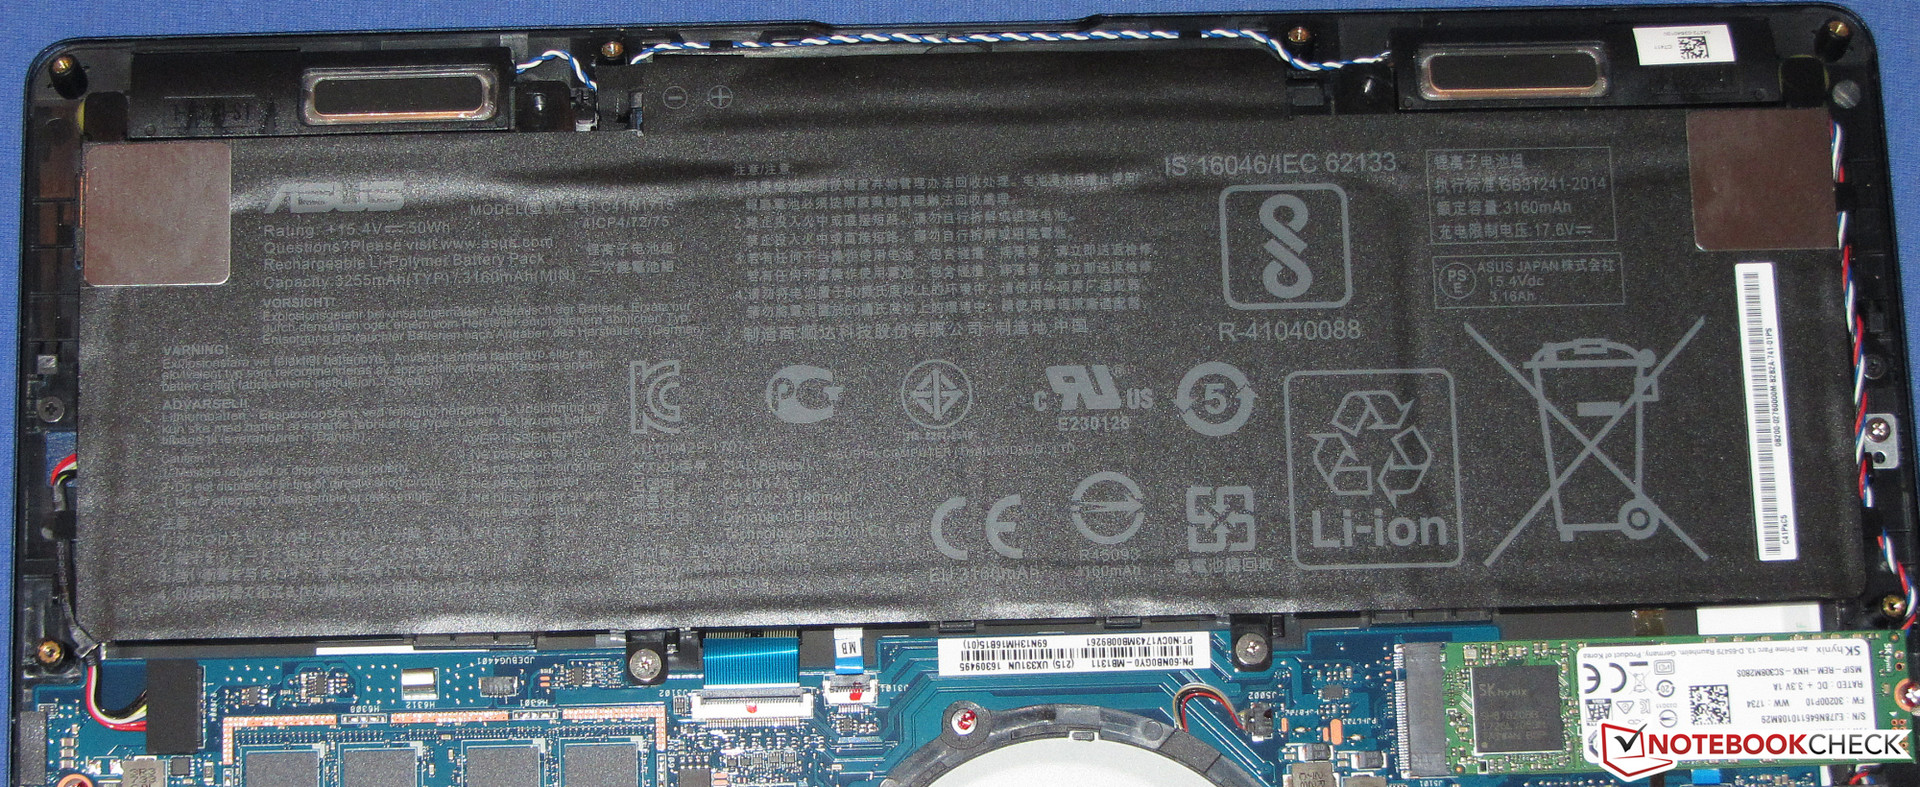
Maintenance
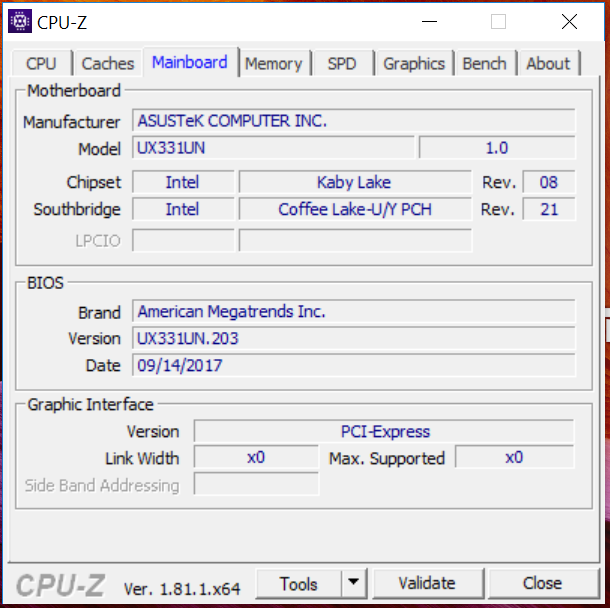
The ZenBook can be repaired and maintained by unscrewing the bottom case from the chassis. There are screws hidden under two rubber feet in addition to the visible screws. The bottom case can only be removed by completely unscrewing these and the other screws. Doing so gives access to the components, of which the battery, SSD, Wi-Fi card, and the fan are user replaceable while the CPU, GPU and RAM are soldered to the motherboard.
Display

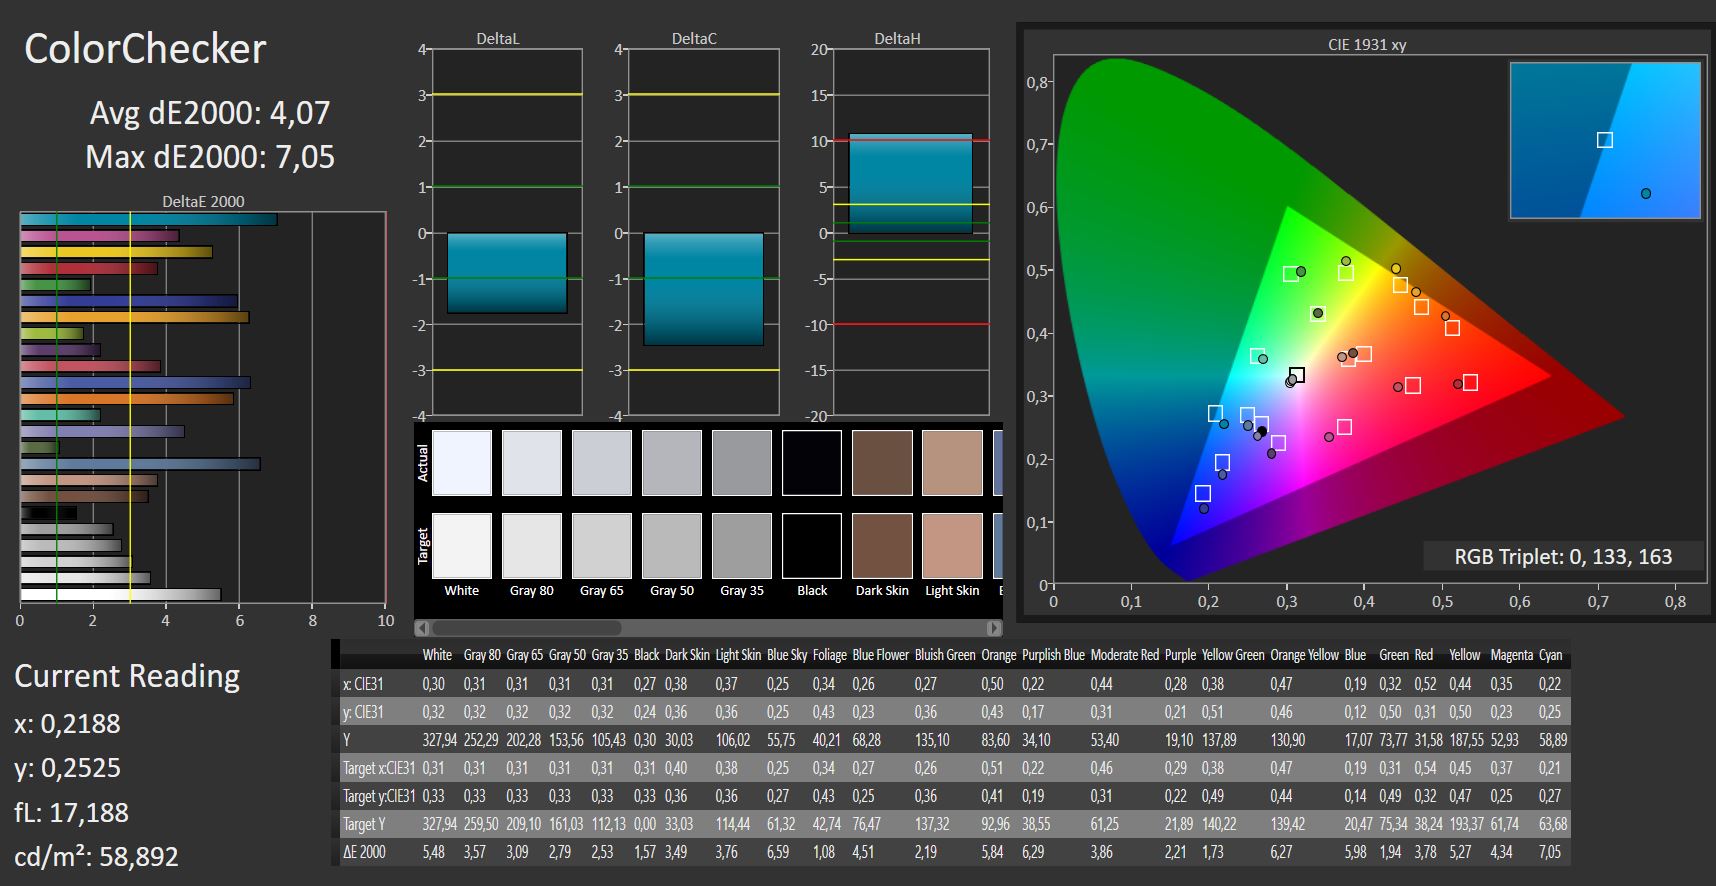
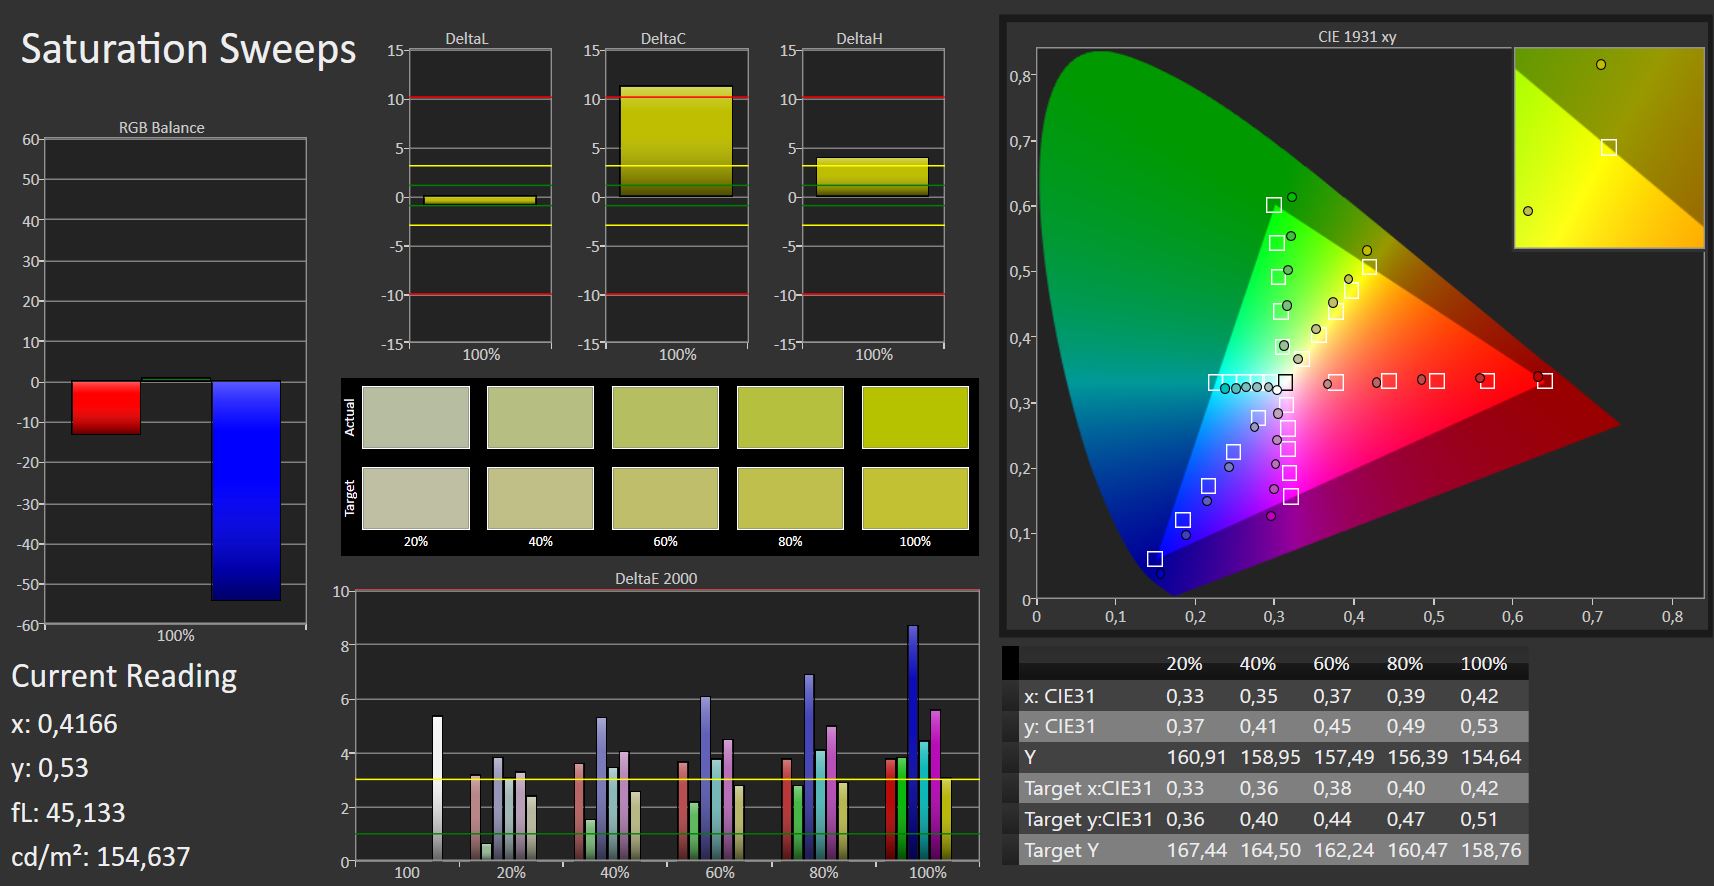
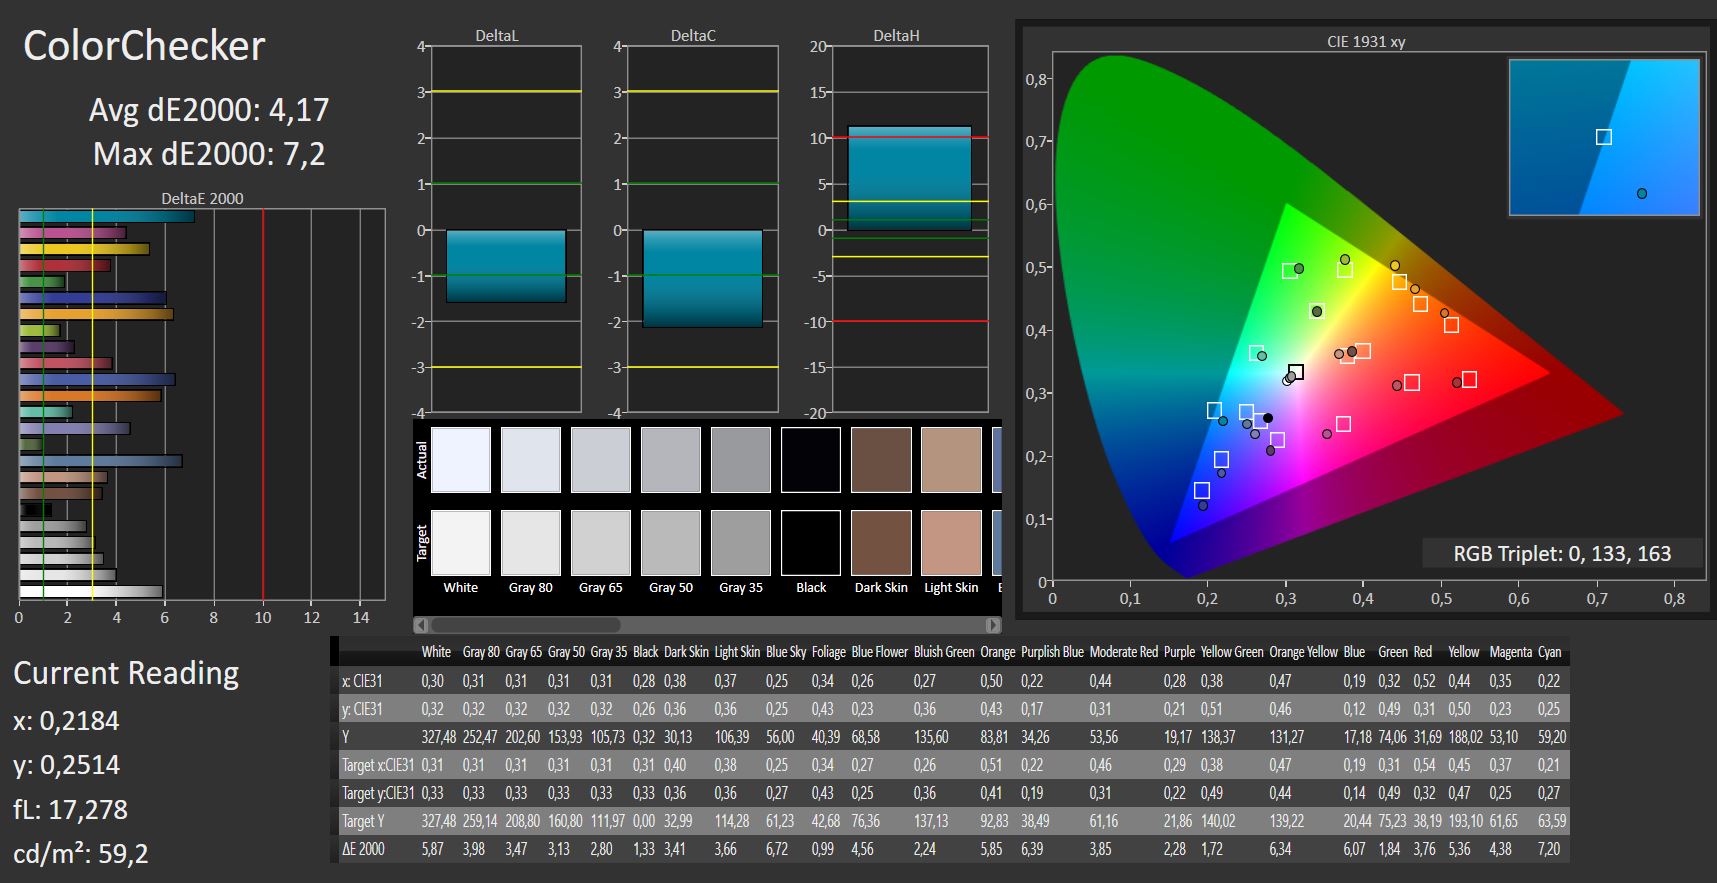
The ZenBook has the same Full-HD display as can be found in its sibling. The IPS panel is bright, with good contrast, stable viewing angles, and no PWM flicker. These exact values vary marginally between the two models, but this is to be expected as no two display panels are identical.
There is one observable difference though, which is that on battery our test device has a lower maximum brightness than when it is charging. This is not replicated by the UX331UA’s sibling.
| |||||||||||||||||||||||||
Brightness Distribution: 86 %
Center on Battery: 277 cd/m²
Contrast: 1097:1 (Black: 0.3 cd/m²)
ΔE ColorChecker Calman: 4.07 | ∀{0.5-29.43 Ø4.71}
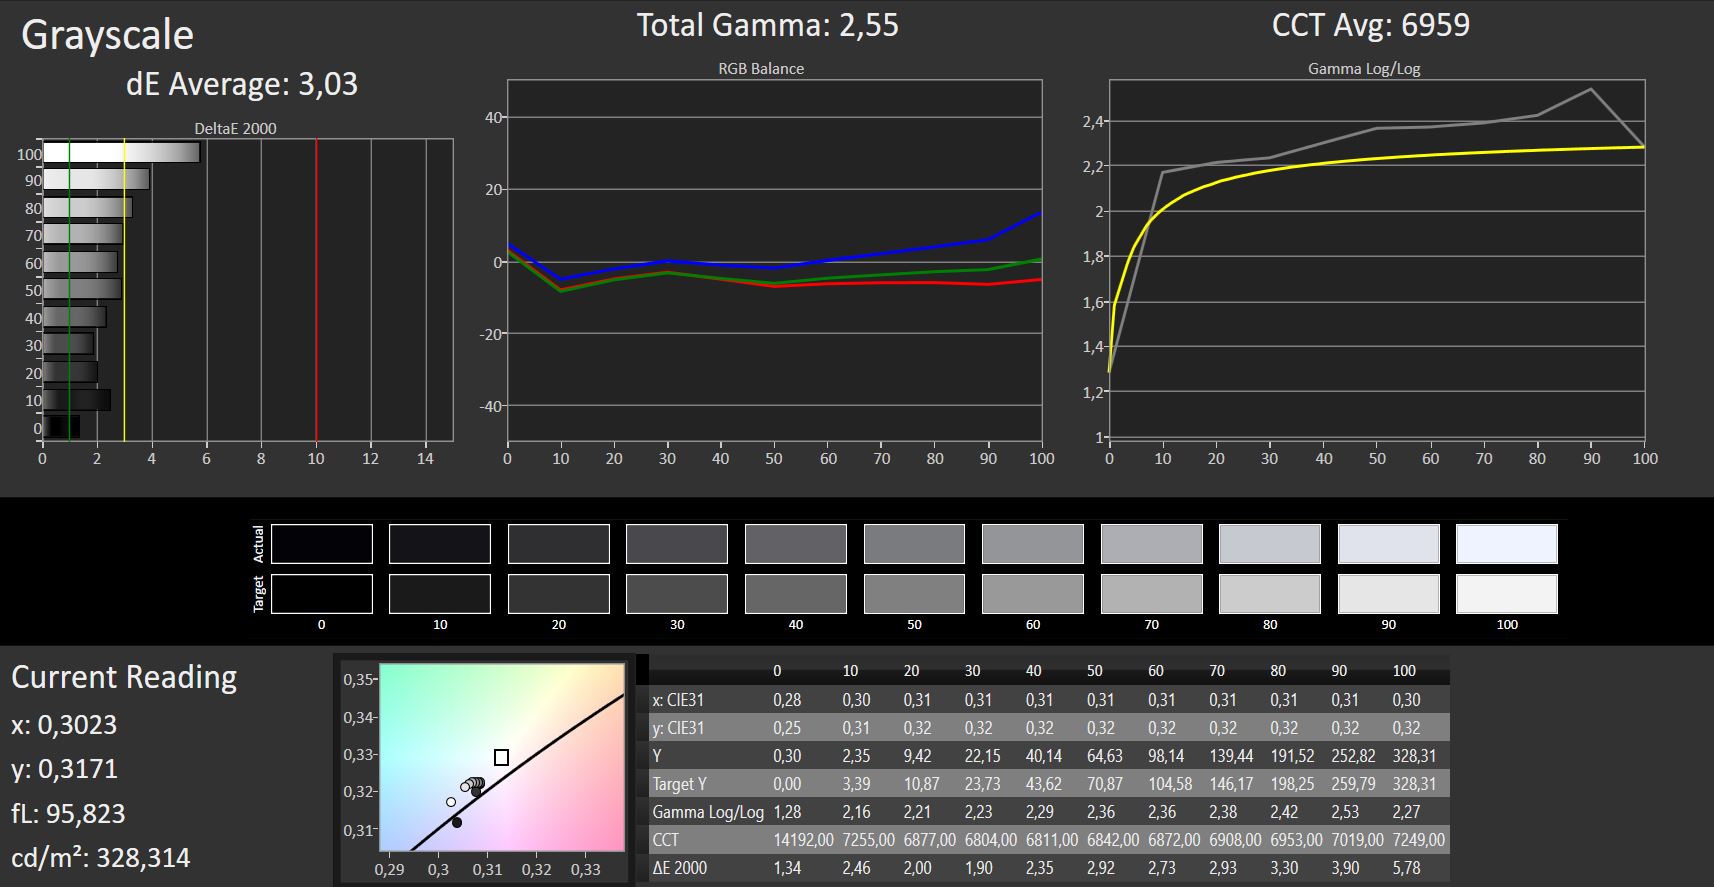
ΔE Greyscale Calman: 2.76 | ∀{0.09-98 Ø4.96}
86% sRGB (Argyll 1.6.3 3D)
56% AdobeRGB 1998 (Argyll 1.6.3 3D)
63.4% AdobeRGB 1998 (Argyll 3D)
86.7% sRGB (Argyll 3D)
63.3% Display P3 (Argyll 3D)
Gamma: 2.56
CCT: 6915 K
| Asus ZenBook 13 UX331UN IPS, 1920x1080, 13.3" | Asus ZenBook 13 UX331UN IPS LED, 1920x1080, 13.3" | Lenovo Ideapad 720S-13IKB IPS, 1920x1080, 13.3" | Dell XPS 13 9370 FHD i5 IPS, 1920x1080, 13.3" | HP Envy 13-ad006ng IPS LED, 1920x1080, 13.3" | Apple MacBook Air 13.3" 1.8 GHz (2017) TN LED, 1440x900, 13.3" | |
|---|---|---|---|---|---|---|
| Display | 5% | -3% | 10% | 2% | ||
| Display P3 Coverage (%) | 63.3 | 65.4 3% | 64.3 2% | 68.9 9% | 66.8 6% | |
| sRGB Coverage (%) | 86.7 | 93.1 7% | 82.3 -5% | 96.6 11% | 86.3 0% | |
| AdobeRGB 1998 Coverage (%) | 63.4 | 66.4 5% | 60.2 -5% | 69.6 10% | 63.1 0% | |
| Response Times | 10% | 8% | -66% | -21% | -19% | |
| Response Time Grey 50% / Grey 80% * (ms) | 44 ? | 22.4 ? 49% | 35 ? 20% | 62.4 ? -42% | 48 ? -9% | 52.4 ? -19% |
| Response Time Black / White * (ms) | 24 ? | 31.2 ? -30% | 25 ? -4% | 45.6 ? -90% | 32 ? -33% | 28.4 ? -18% |
| PWM Frequency (Hz) | 131000 ? | 1008 ? | 1000 ? | 58000 | ||
| Screen | -4% | -21% | 10% | -18% | ||
| Brightness middle (cd/m²) | 329 | 338 3% | 335 2% | 428 30% | 281 -15% | |
| Brightness (cd/m²) | 306 | 321 5% | 303 -1% | 405 32% | 264 -14% | |
| Brightness Distribution (%) | 86 | 90 5% | 85 -1% | 87 1% | 83 -3% | |
| Black Level * (cd/m²) | 0.3 | 0.35 -17% | 0.46 -53% | 0.26 13% | 0.23 23% | |
| Contrast (:1) | 1097 | 966 -12% | 728 -34% | 1646 50% | 1222 11% | |
| Colorchecker dE 2000 * | 4.07 | 4.2 -3% | 5.09 -25% | 3.8 7% | 4.83 -19% | |
| Colorchecker dE 2000 max. * | 7.05 | 6.5 8% | 11.92 -69% | 7.2 -2% | 8.89 -26% | |
| Greyscale dE 2000 * | 2.76 | 3.9 -41% | 3.23 -17% | 4.4 -59% | 6.63 -140% | |
| Gamma | 2.56 86% | 2.43 91% | 2.18 101% | 2.21 100% | 1.85 119% | |
| CCT | 6915 94% | 7144 91% | 6214 105% | 7067 92% | 6794 96% | |
| Color Space (Percent of AdobeRGB 1998) (%) | 56 | 60.4 8% | 54 -4% | 62.8 12% | 56 0% | |
| Color Space (Percent of sRGB) (%) | 86 | 93.1 8% | 82 -5% | 96.4 12% | 86 0% | |
| Total Average (Program / Settings) | 4% /
-0% | -5% /
-13% | -15% /
-0% | -12% /
-15% | -19% /
-19% |
* ... smaller is better
Screen Flickering / PWM (Pulse-Width Modulation)
| Screen flickering / PWM not detected | ||
In comparison: 52 % of all tested devices do not use PWM to dim the display. If PWM was detected, an average of 7754 (minimum: 5 - maximum: 343500) Hz was measured. | ||


Display Response Times
| ↔ Response Time Black to White | ||
|---|---|---|
| 24 ms ... rise ↗ and fall ↘ combined | ↗ 13 ms rise | 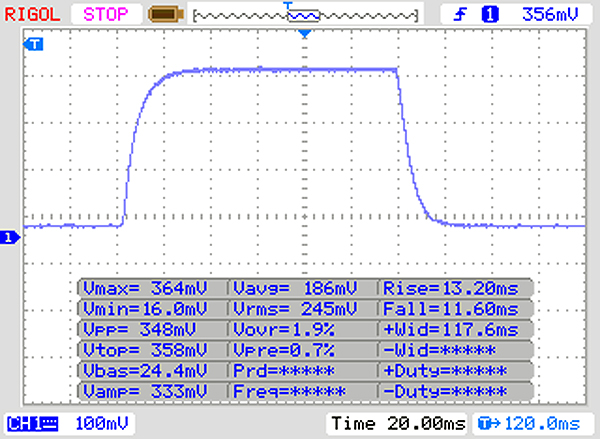 |
| ↘ 11 ms fall | ||
| The screen shows good response rates in our tests, but may be too slow for competitive gamers. In comparison, all tested devices range from 0.1 (minimum) to 240 (maximum) ms. » 54 % of all devices are better. This means that the measured response time is worse than the average of all tested devices (19.8 ms). | ||
| ↔ Response Time 50% Grey to 80% Grey | ||
| 44 ms ... rise ↗ and fall ↘ combined | ↗ 22 ms rise | 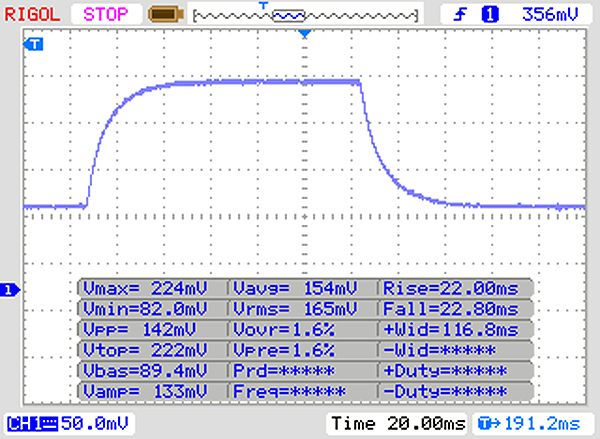 |
| ↘ 22 ms fall | ||
| The screen shows slow response rates in our tests and will be unsatisfactory for gamers. In comparison, all tested devices range from 0.165 (minimum) to 636 (maximum) ms. » 73 % of all devices are better. This means that the measured response time is worse than the average of all tested devices (31 ms). | ||
Performance
The ZenBook 13 is a sleek, 13.3-inch Ultrabook that offers more than enough power for Office and Internet applications. The dedicated graphics card is powerful enough to play games on the ZenBook too. Prices for the device start at €960 (~$1174), with our test device costing approximately €1,200 (~$1468) at the time of writing.
Test conditions
In terms of power options, the ZenBook 13 comes with just a ‘Balanced’ mode. There are no ‘High Performance’ or ‘Low Power’ modes. These cannot be created later nor are there any power management options in the UEFI menu. All tests were therefore carried out with the ‘Balanced’ mode enabled.
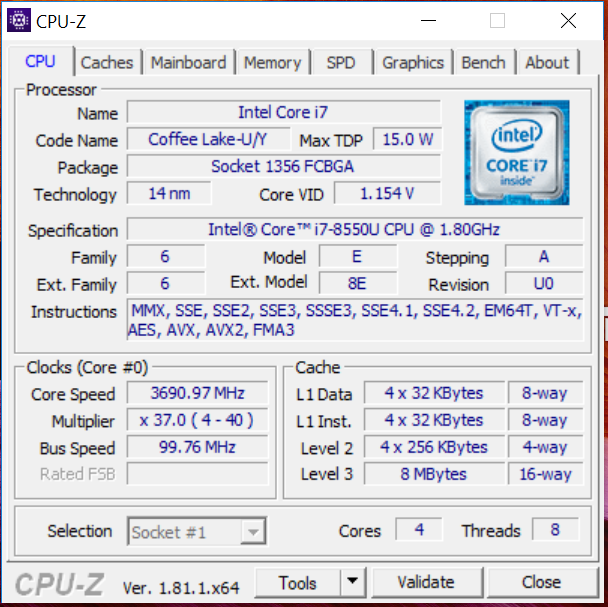
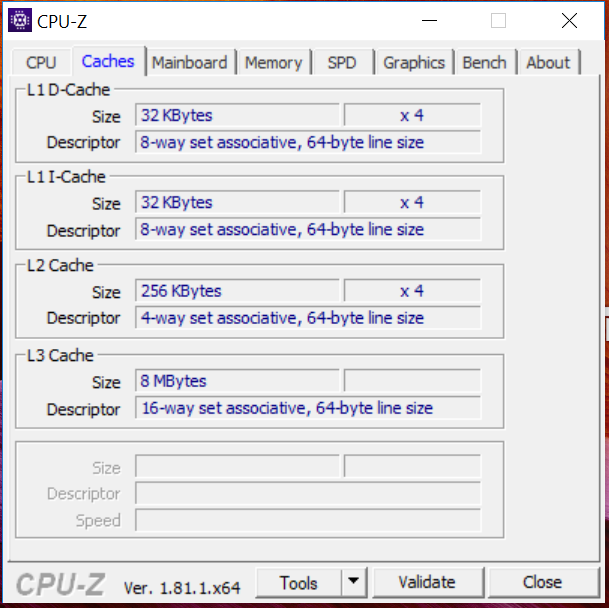
Processor
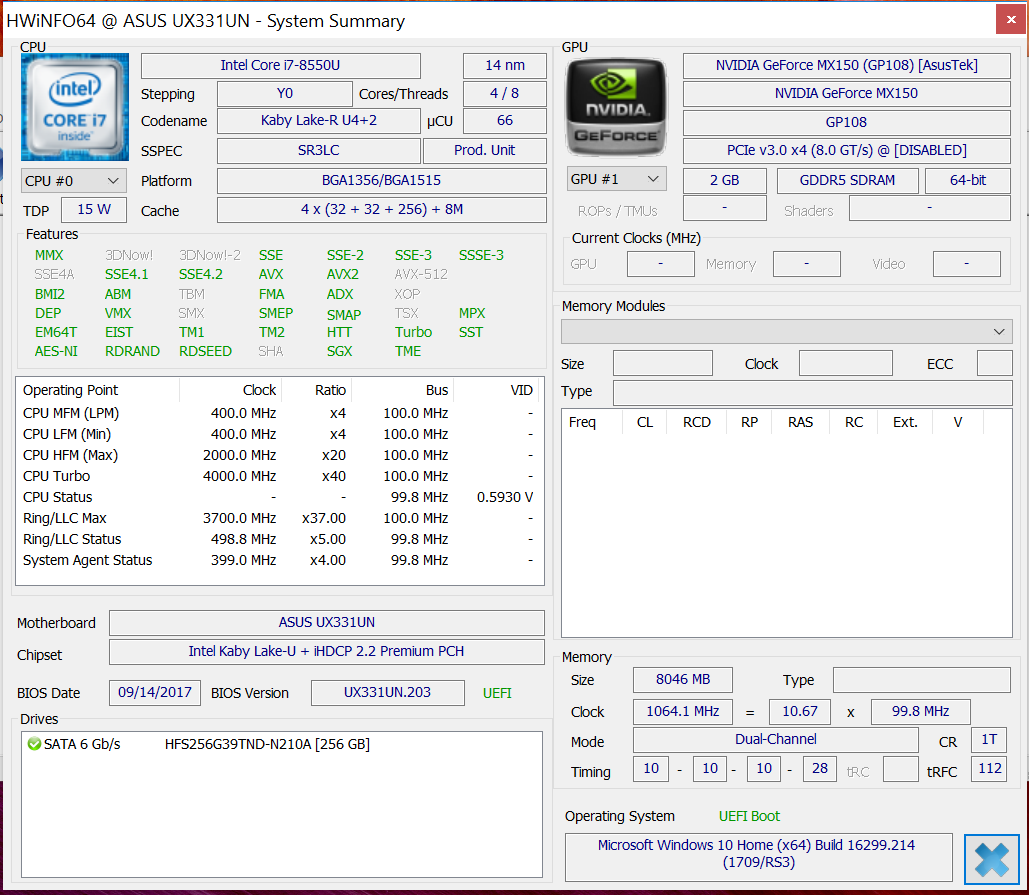
The ZenBook is powered by an Intel Core i7-8550U Kaby Lake R quad-core processor. The i7-8550U is an ultra-low voltage (ULV) CPU that has a 15 W thermal design power (TDP) and supports Hyperthreading. Hyperthreading allows two threads to be processed per core, meaning that the i7-8550U has a total of eight threads across its four cores. The CPU has a base clock of 1.8 GHz that with Turbo Boost can be temporarily increased up to 4 GHz.
When running multi-thread Cinebench benchmarks the i7-8550U initially runs at between 3 and 3.3 GHz. After a few seconds this then drops to between 2.6 and 2.8 GHz. In single-thread tests, the processor operates at speeds between 3.3 and 4 GHz. Bear in mind that this is only true when the ZenBook is charging. If on battery, CPU speeds will drop to between 1.5 and 1.9 GHz for single-thread tests with speeds for multi-thread tests dropping to between 1.5 and 2.7 GHz.
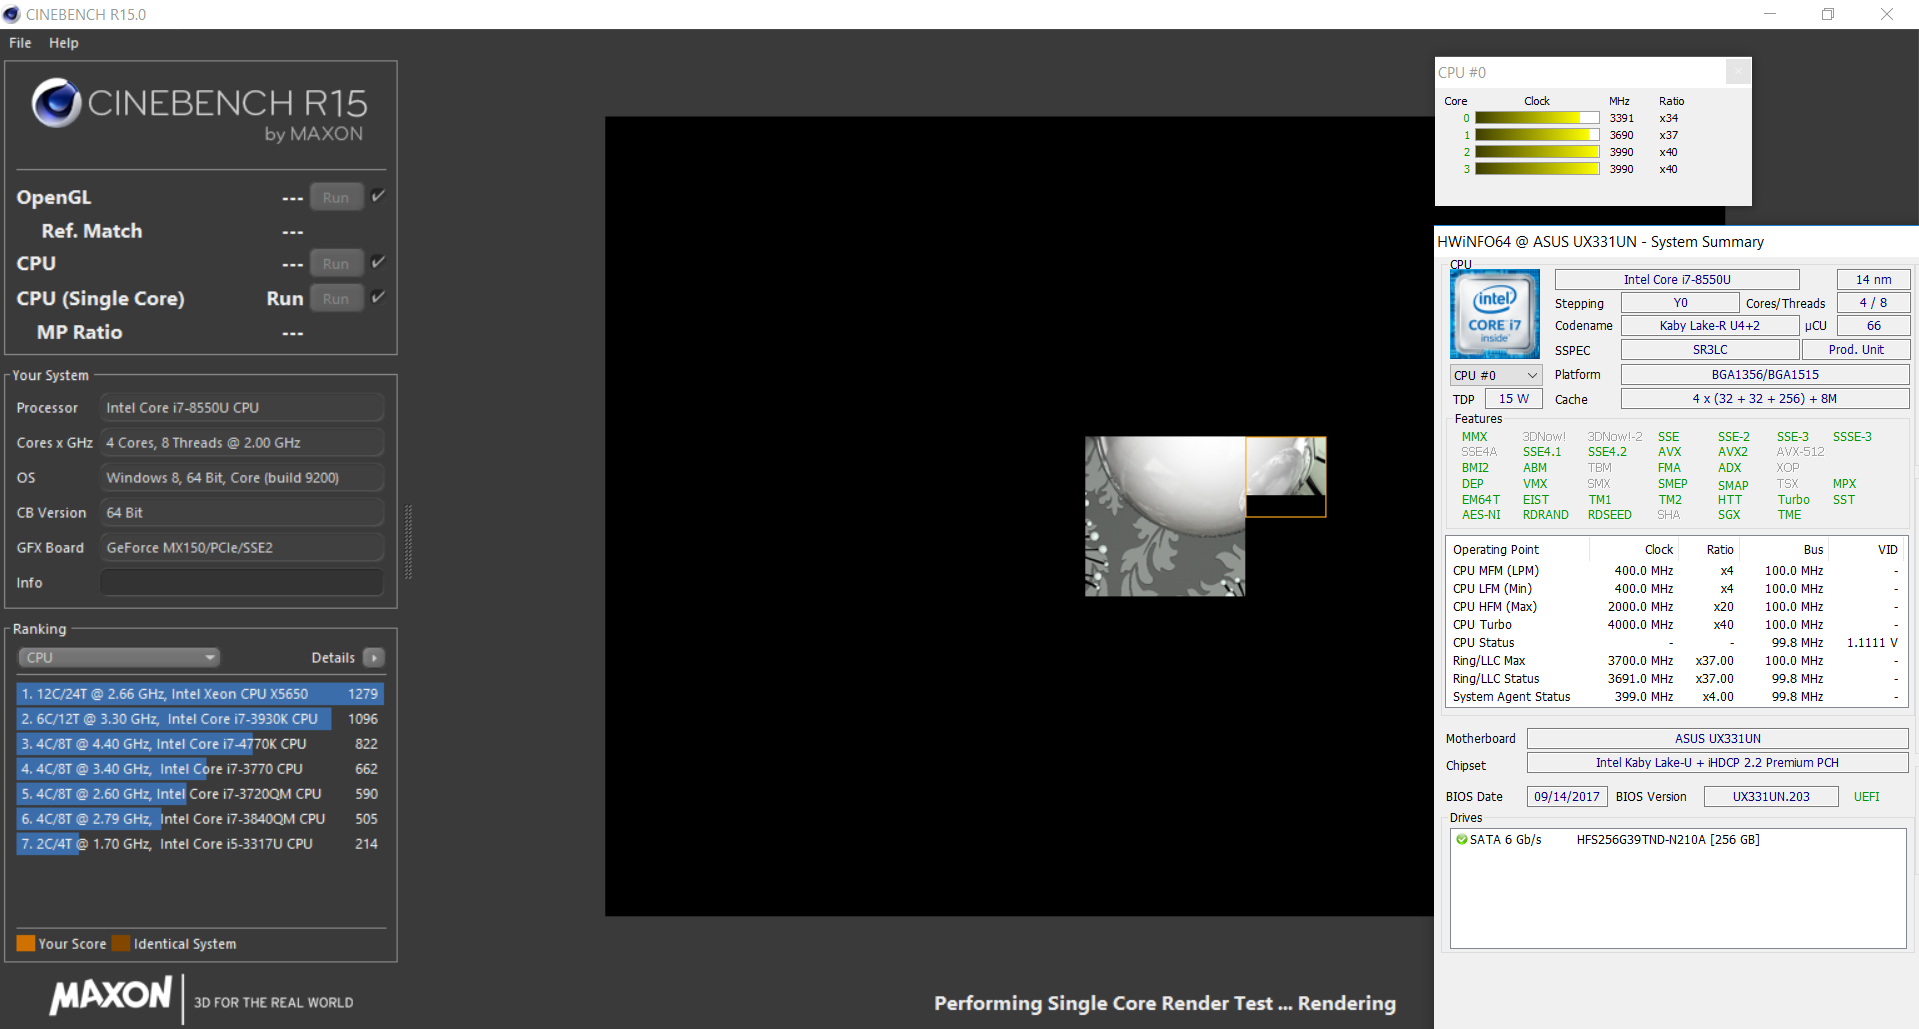
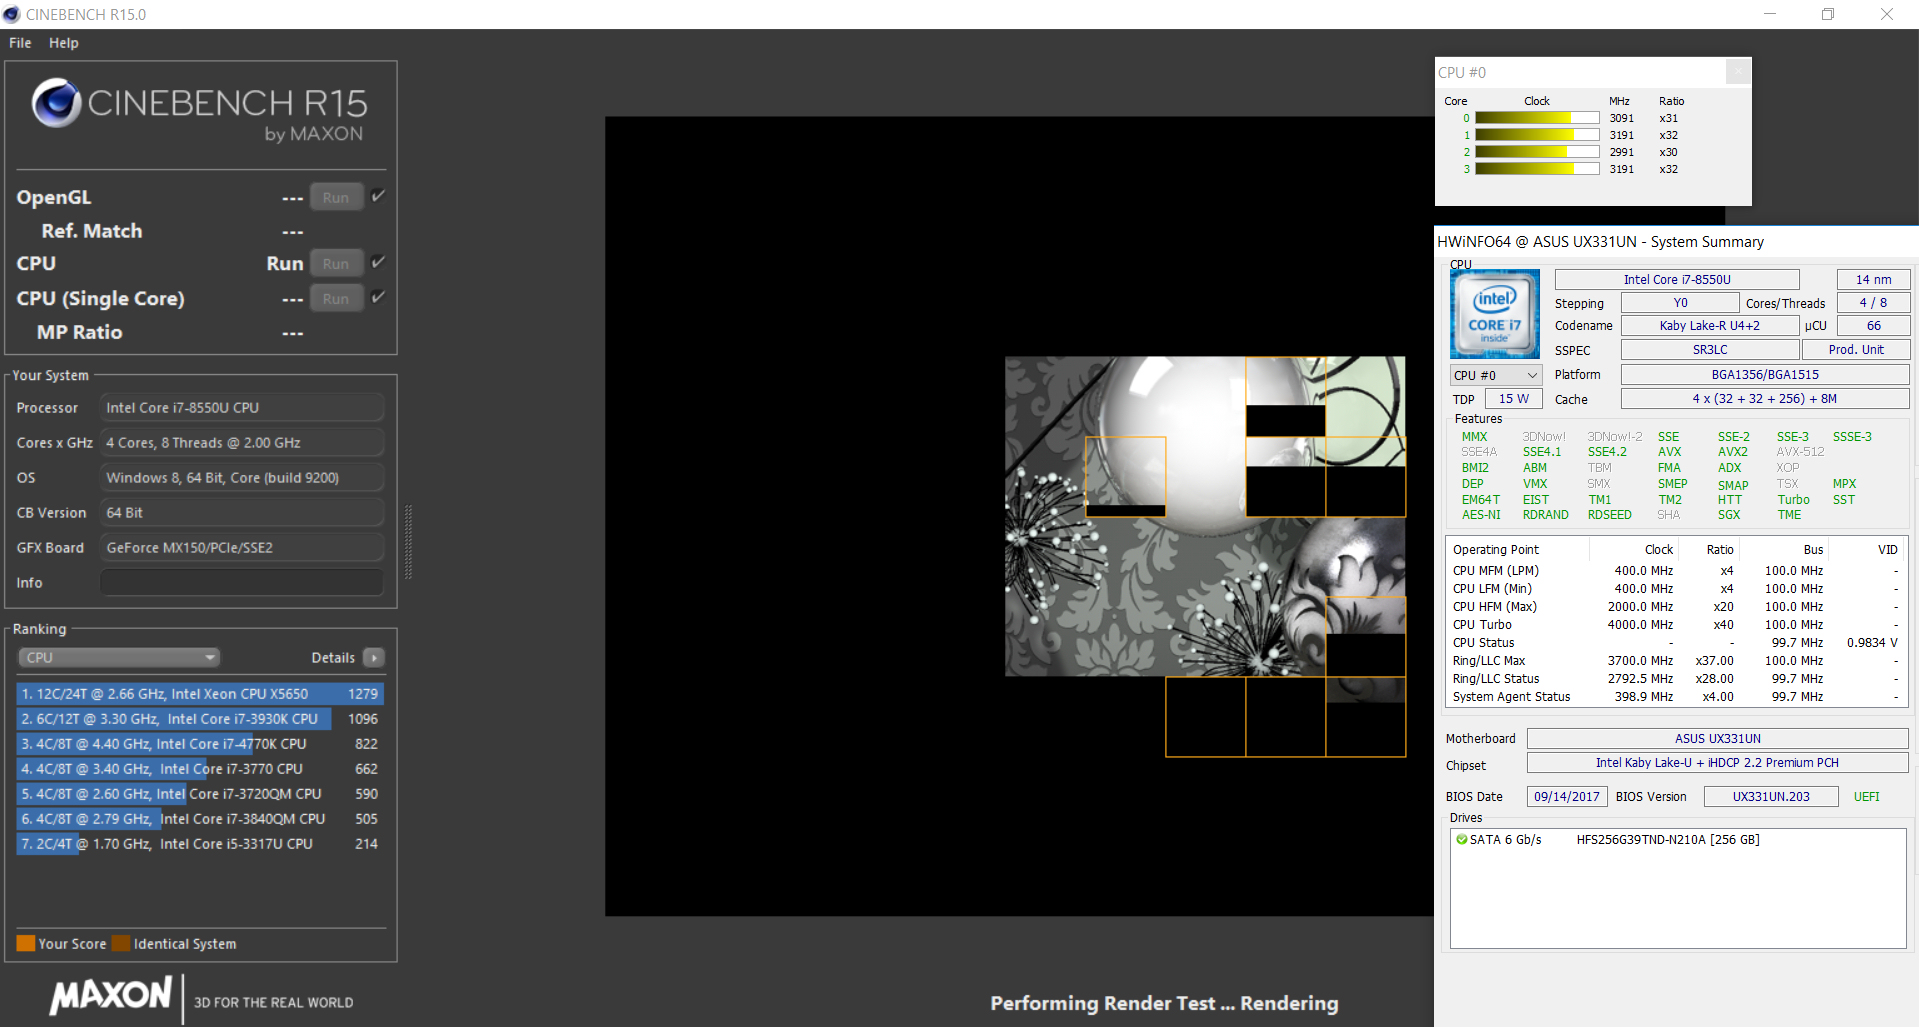
We also tested whether the Turbo Boost consistently runs when the ZenBook is charging by running a multi-thread Cinebench R15 test on a thirty-minute loop. Our results show that while Turbo Boost does permanently run when the device is under full load and charging, the speeds to which the processor is boosted vary significantly. Turbo Boost does not keep the processor at a fixed speed for any length of time.
It is worth bearing in mind that the results of our CPU tests are typical for the Core i7-8550U, and the ZenBook is not atypical in this regard.
| Geekbench 3 | |
| 32 Bit Single-Core Score | |
| Average of class Subnotebook (n=1last 2 years) | |
| Lenovo Miix 520-12IKB 20M3000LGE | |
| Asus ZenBook 13 UX331UN | |
| Acer Swift 3 SF314-52G-89SL | |
| Average Intel Core i7-8550U (2471 - 4020, n=12) | |
| Acer Aspire 5 A517-51G-80L | |
| 64 Bit Multi-Core Score | |
| Acer Aspire 5 A517-51G-80L | |
| Average Intel Core i7-8550U (11637 - 14030, n=2) | |
| Octane V2 - Total Score | |
| Average of class Subnotebook (35801 - 142020, n=28, last 2 years) | |
| Acer Aspire 5 A517-51G-80L (EDGE: 40.15063.674.0) | |
| Asus ZenBook 13 UX331UN (Edge 41) | |
| Asus ZenBook 13 UX331UN (Edge) | |
| Dell XPS 13 9370 FHD i5 (Edge 41.15399.15.0) | |
| Average Intel Core i7-8550U (17296 - 42043, n=39) | |
| HP Envy 13-ad006ng (Edge) | |
| Lenovo Ideapad 720S-13IKB | |
| Mozilla Kraken 1.1 - Total | |
| HP Envy 13-ad006ng (Edge) | |
| Average Intel Core i7-8550U (877 - 2114, n=45) | |
| Dell XPS 13 9370 FHD i5 (Edge 41.15399.15.0) | |
| Lenovo Ideapad 720S-13IKB | |
| Acer Aspire 5 A517-51G-80L (EDGE: 40.15063.674.0) | |
| Asus ZenBook 13 UX331UN (Edge) | |
| Asus ZenBook 13 UX331UN (Edge 41) | |
| Average of class Subnotebook (234 - 1104, n=60, last 2 years) | |
| JetStream 1.1 - 1.1 Total | |
| Acer Swift 3 SF314-52G-89SL (Edge 40) | |
| Acer Aspire 5 A517-51G-80L (EDGE: 40.15063.674.0) | |
| Lenovo Miix 520-12IKB 20M3000LGE (Edge 41) | |
| Asus ZenBook 13 UX331UN (Edge) | |
| Asus ZenBook 13 UX331UN (Edge 41) | |
| Dell XPS 13 9370 FHD i5 (Edge 41.15399.15.0) | |
| Average Intel Core i7-8550U (141.9 - 288, n=61) | |
| Average of class Subnotebook (n=1last 2 years) | |
| HP Envy 13-ad006ng (Edge) | |
| Lenovo Ideapad 720S-13IKB | |
* ... smaller is better
System Performance
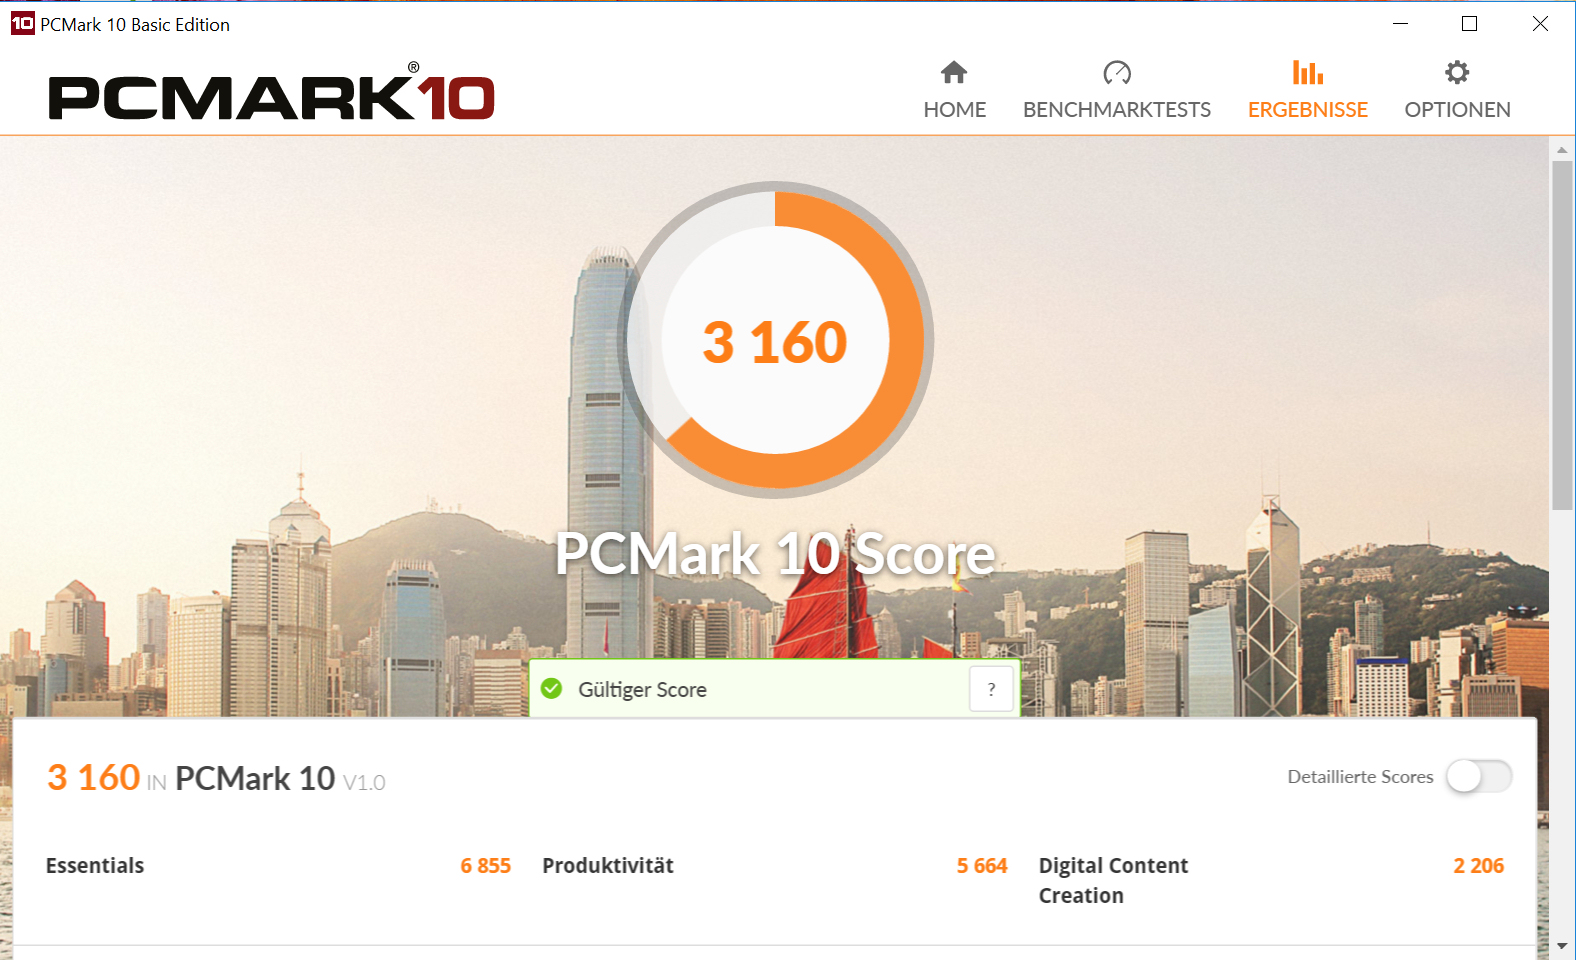
Benchmarks confirm our initial thoughts that the ZenBook runs smoothly. The results from our PCMark benchmarks are very good, but it is not possible to overclock the device to improve performance.
| PCMark 7 Score | 5647 points | |
| PCMark 8 Home Score Accelerated v2 | 3780 points | |
| PCMark 8 Creative Score Accelerated v2 | 4765 points | |
| PCMark 8 Work Score Accelerated v2 | 4811 points | |
| PCMark 10 Score | 3160 points | |
Help | ||
Storage devices
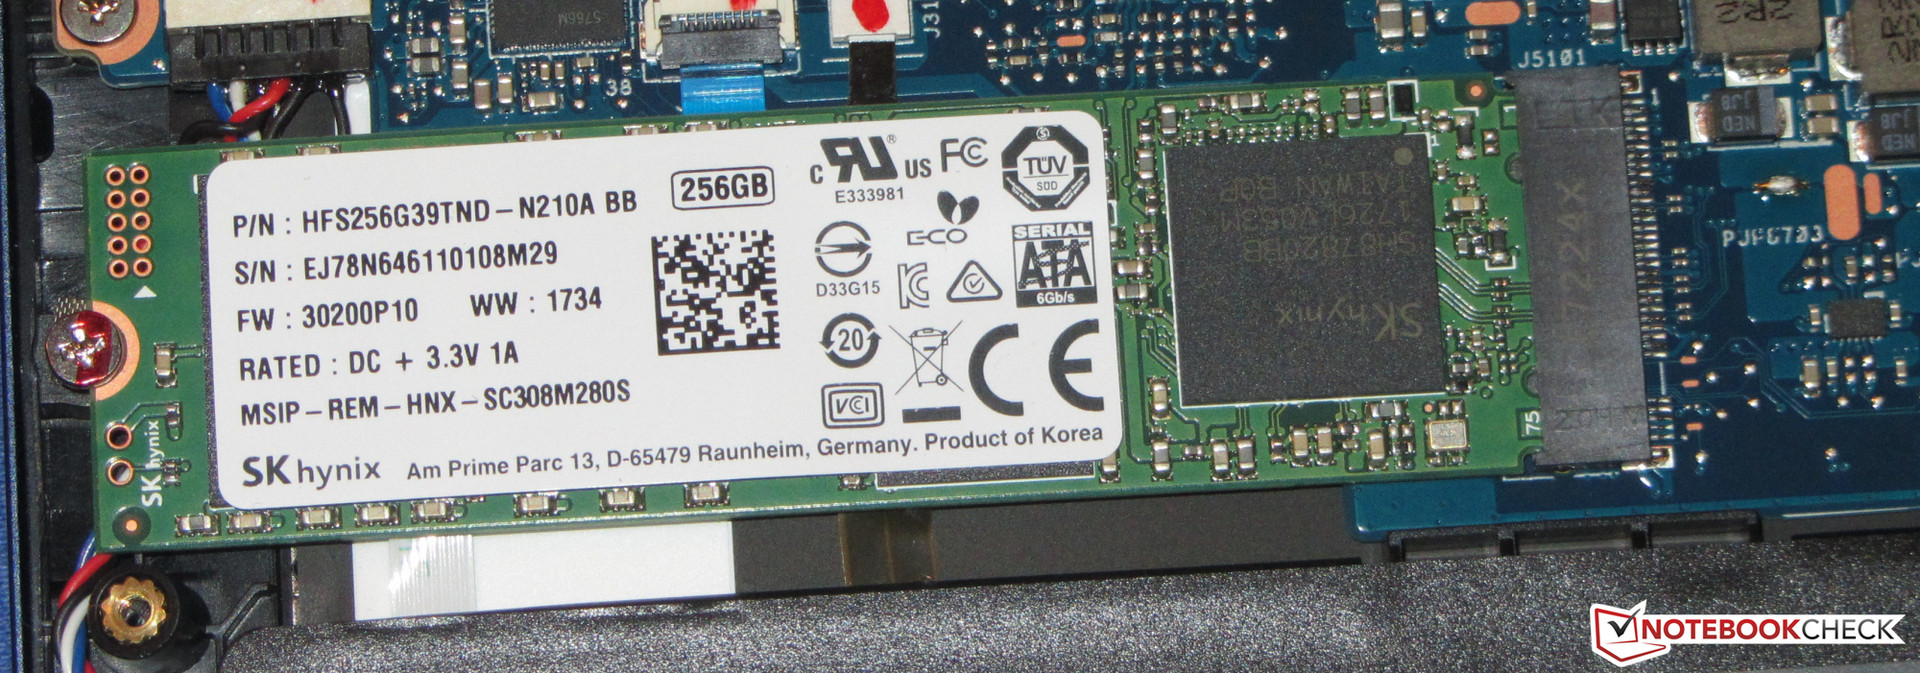
The ZenBook comes with an M.2-2280 SSD from SK Hynix with 256 GB of storage, of which around 200 GB is usable. It is a SATA III drive that has good transfer speeds.
According to ASUS’ website, the M.2-2280 slot supports both SATA III and NVMe SSDs. NVMe drives support faster transfer speeds than SATA III, using four lanes of PCI Express 3.0. Replacing the pre-installed SATA III drive would shorten load times and make the ZenBook feel snappier than it already does.

| Asus ZenBook 13 UX331UN SK Hynix HFS256G39TND-N210A | Asus ZenBook 13 UX331UN SanDisk SD8SN8U512G1002 | Lenovo Ideapad 720S-13IKB Samsung PM961 MZVLW256HEHP | Dell XPS 13 9370 FHD i5 Toshiba XG5 KXG50ZNV256G | HP Envy 13-ad006ng Toshiba NVMe THNSN5256GPUK | Apple MacBook Air 13.3" 1.8 GHz (2017) Apple SSD SM0128G | Average SK Hynix HFS256G39TND-N210A | |
|---|---|---|---|---|---|---|---|
| CrystalDiskMark 3.0 | 5% | 146% | 93% | 39% | 88% | -1% | |
| Read Seq (MB/s) | 435.6 | 430.6 -1% | 1674 284% | 1875 330% | 1019 134% | 1390 219% | 482 ? 11% |
| Write Seq (MB/s) | 263 | 424.1 61% | 1191 353% | 352.7 34% | 195.4 -26% | 731 178% | 246 ? -6% |
| Read 512 (MB/s) | 258.1 | 275 7% | 658 155% | 840 225% | 735 185% | 899 248% | 328 ? 27% |
| Write 512 (MB/s) | 256.6 | 369.8 44% | 852 232% | 353.9 38% | 172.3 -33% | 715 179% | 243 ? -5% |
| Read 4k (MB/s) | 30.37 | 28.04 -8% | 51.8 71% | 34.18 13% | 34.5 14% | 16.29 -46% | 28 ? -8% |
| Write 4k (MB/s) | 78.6 | 53.5 -32% | 114.9 46% | 127.5 62% | 109.4 39% | 27.17 -65% | 74.8 ? -5% |
| Read 4k QD32 (MB/s) | 356.8 | 322.9 -10% | 349.2 -2% | 381.8 7% | 494.6 39% | 300.9 -16% | 323 ? -9% |
| Write 4k QD32 (MB/s) | 257.2 | 211.9 -18% | 332.2 29% | 339.9 32% | 161.3 -37% | 273.7 6% | 220 ? -14% |
Graphics card
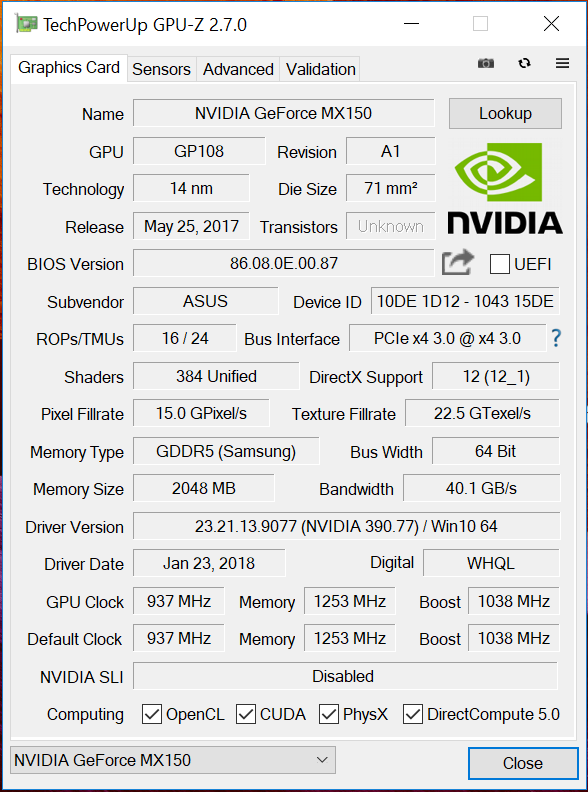
The ZenBook comes with an Nvidia GeForce MX150. The mid-range graphics card is the mobile version of the GeForce GT 1030. The GPU supports DirectX 12 and operates at a base clock of 937 MHz, which can be boosted up to 1,607 MHz. It also has 2,048 MB of GDDR5 memory.
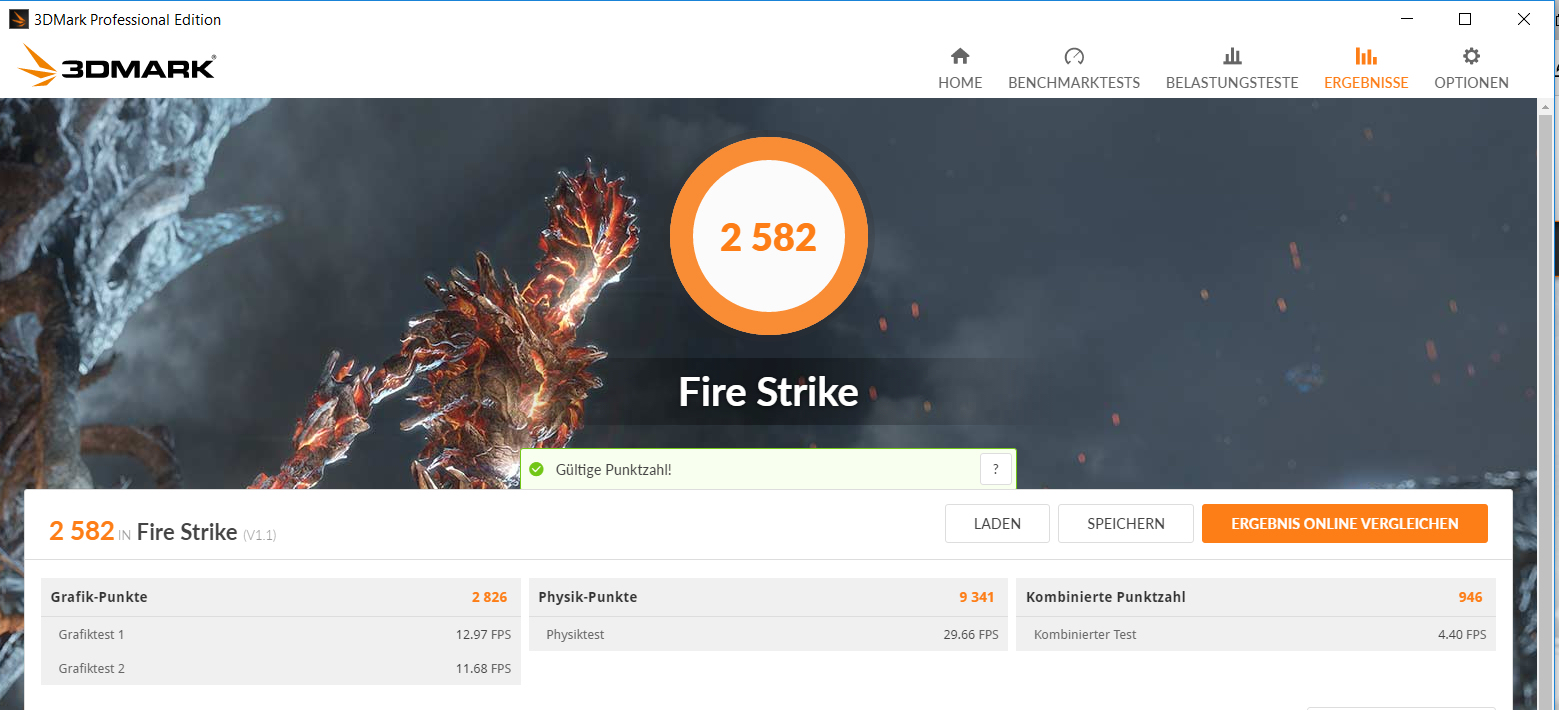
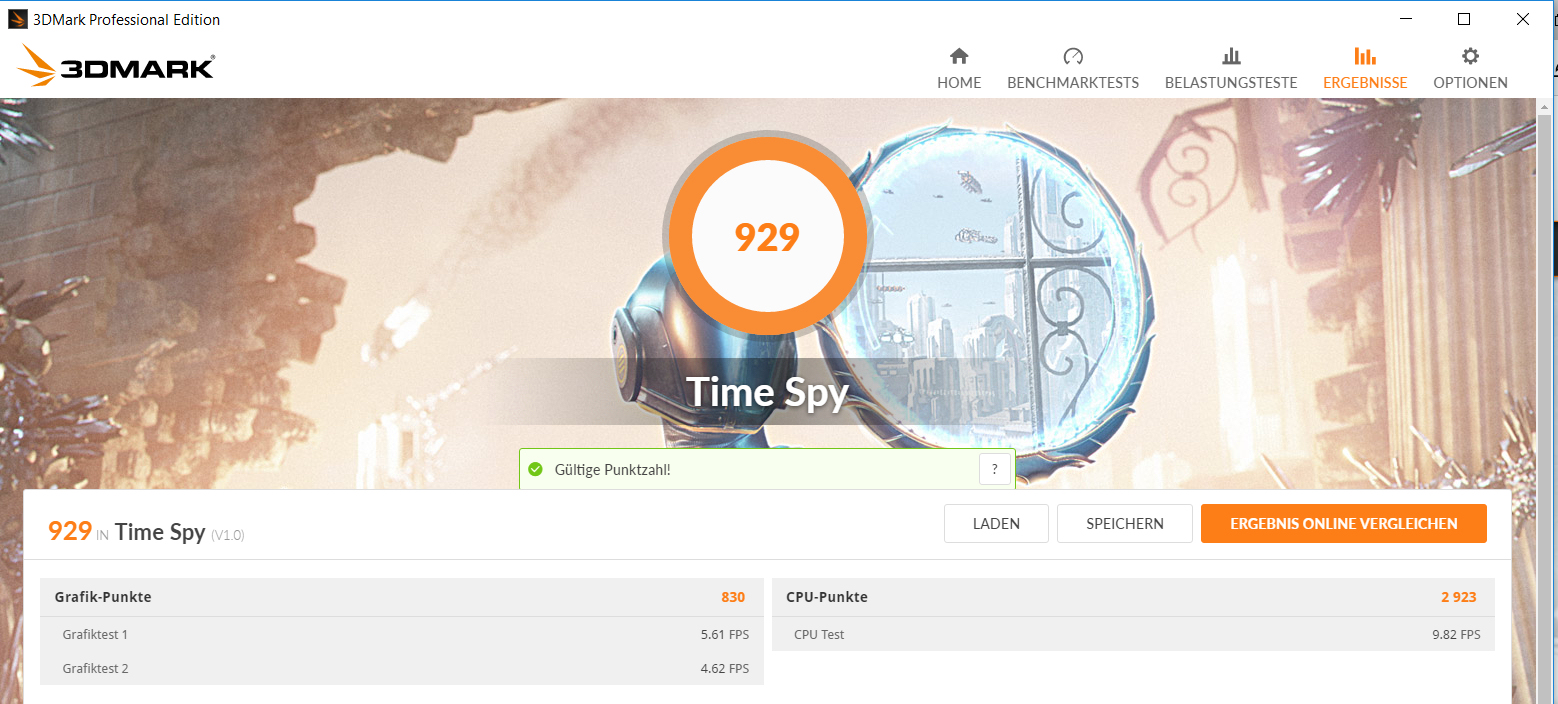
3DMark benchmark scores are disappointing, with the ZenBook being well behind the competition. For example, the Acer Swift 3 SF315-51G-57E5 achieves almost a twelve percent higher maximum clock speed of 1,798 MHz and approximately a fifty-eight percent higher base clock speed of 1,469 MHz. ASUS has factory underclocked the GeForce MX150 to avoid it overheating as there is not enough space in the ZenBook’s case to adequately cool it at full speed.
Likewise, the HP Envy 13-ad006ng and the Lenovo IdeaPad 320S-13IKB fail to take advantage of the GeForce MX150’s full performance. Therefore, limiting graphics performance due to inadequate cooling is not a ZenBook exclusive issue.

| 3DMark 06 Standard Score | 12911 points | |
| 3DMark 11 Performance | 3779 points | |
| 3DMark Cloud Gate Standard Score | 13058 points | |
| 3DMark Fire Strike Score | 2582 points | |
| 3DMark Fire Strike Extreme Score | 1257 points | |
| 3DMark Time Spy Score | 929 points | |
Help | ||
| Geekbench 4.0 - Compute OpenCL Score | |
| Acer Swift 3 SF314-52G-89SL | |
| Acer Swift 3 SF315-51G-57E5 | |
| Acer Aspire 5 A515-51G-51RL | |
| Average NVIDIA GeForce MX150 (41337 - 47999, n=8) | |
| Asus ZenBook 13 UX331UN | |
| ComputeMark v2.1 - 1024x600 Normal, Score | |
| Average of class Subnotebook (944 - 10728, n=11, last 2 years) | |
| Acer Aspire 5 A515-51G-51RL | |
| Average NVIDIA GeForce MX150 (2256 - 2856, n=9) | |
| Asus ZenBook 13 UX331UN | |
| GFXBench (DX / GLBenchmark) 2.7 | |
| 1920x1080 T-Rex Offscreen | |
| Average of class Subnotebook (81 - 915, n=7, last 2 years) | |
| Acer Aspire 5 A515-51G-51RL | |
| Average NVIDIA GeForce MX150 (203 - 284, n=4) | |
| Asus ZenBook 13 UX331UN | |
| T-Rex Onscreen | |
| Average of class Subnotebook (54.3 - 794, n=7, last 2 years) | |
| Asus ZenBook 13 UX331UN | |
| Acer Aspire 5 A515-51G-51RL | |
| Average NVIDIA GeForce MX150 (59.8 - 210, n=4) | |
| GFXBench 3.0 | |
| 1920x1080 1080p Manhattan Offscreen | |
| Average of class Subnotebook (206 - 591, n=6, last 2 years) | |
| Acer Aspire 5 A515-51G-51RL | |
| Average NVIDIA GeForce MX150 (121.5 - 148.7, n=4) | |
| Asus ZenBook 13 UX331UN | |
| on screen Manhattan Onscreen OGL | |
| Average of class Subnotebook (60 - 338, n=6, last 2 years) | |
| Asus ZenBook 13 UX331UN | |
| Acer Aspire 5 A515-51G-51RL | |
| Average NVIDIA GeForce MX150 (57.9 - 112.7, n=4) | |
| GFXBench 3.1 | |
| 1920x1080 Manhattan ES 3.1 Offscreen | |
| Average of class Subnotebook (157.5 - 336, n=6, last 2 years) | |
| Acer Aspire 5 A515-51G-51RL | |
| Average NVIDIA GeForce MX150 (85.1 - 111.5, n=4) | |
| Asus ZenBook 13 UX331UN | |
| on screen Manhattan ES 3.1 Onscreen | |
| Average of class Subnotebook (60 - 222, n=6, last 2 years) | |
| Acer Aspire 5 A515-51G-51RL | |
| Asus ZenBook 13 UX331UN | |
| Average NVIDIA GeForce MX150 (49 - 92.1, n=4) | |
| GFXBench | |
| 1920x1080 Car Chase Offscreen | |
| Average of class Subnotebook (107.4 - 260, n=8, last 2 years) | |
| Acer Aspire 5 A515-51G-51RL | |
| Average NVIDIA GeForce MX150 (52.9 - 75.4, n=4) | |
| Asus ZenBook 13 UX331UN | |
| on screen Car Chase Onscreen | |
| Average of class Subnotebook (50.5 - 154.5, n=8, last 2 years) | |
| Acer Aspire 5 A515-51G-51RL | |
| Average NVIDIA GeForce MX150 (31.8 - 63.1, n=4) | |
| Asus ZenBook 13 UX331UN | |
Gaming Performance
Most modern games can be played in HD (1,366 x 768) at low to medium quality, while games with lower system requirements can be played at higher settings. Factory underclocking the GPU affects frame rates though with similarly equipped notebooks, such as the Lenovo IdeaPad 320-15IKBRN and the Acer Swift 3 SF315-51G, achieving between twenty to thirty percent higher frame rates than the ZenBook. Despite the factory underclocking, the ZenBook still performs better than GeForce 940MX notebooks.
| low | med. | high | ultra | |
|---|---|---|---|---|
| Tomb Raider (2013) | 188.2 | 105.2 | 70.9 | 34.2 |
| BioShock Infinite (2013) | 98.1 | 78.9 | 71.7 | 27.8 |
| The Witcher 3 (2015) | 46.4 | 28.1 | 15.6 | 9.6 |
| Metal Gear Solid V (2015) | 60 | 60 | 38.8 | 25.2 |
| Just Cause 3 (2015) | 35.8 | 34.2 | 22.9 | 20 |
| Dishonored 2 (2016) | 36.4 | 20.1 | 19.4 | 14.4 |
| The Evil Within 2 (2017) | 25.6 | 14.2 | 13 | 12 |
| ELEX (2017) | 37.2 | 22.2 | 17.2 | 12.2 |
| Destiny 2 (2017) | 48.4 | 28.2 | 22.8 | 11.9 |
| Call of Duty WWII (2017) | 62.2 | 52.9 | 28.6 | 17.9 |
| Need for Speed Payback (2017) | 39.9 | 25.8 | 20.6 | 19.7 |
| Star Wars Battlefront 2 (2017) | 52.1 | 20.7 | 17.9 | 15.9 |
| Final Fantasy XV Benchmark (2018) | 28.3 | 13.8 | 8.2 |
| Tomb Raider - 1366x768 High Preset AA:FX AF:8x | |
| Average NVIDIA GeForce MX150 (70.9 - 87.2, n=4) | |
| Asus ZenBook 13 UX331UN | |
| Acer TravelMate P259-MG-71UU | |
| Dell XPS 13 9370 FHD i5 | |
| Star Wars Battlefront 2 - 1280x720 Low Preset | |
| Average NVIDIA GeForce MX150 (52.1 - 102, n=3) | |
| Asus ZenBook 13 UX331UN | |
| HP Pavilion 15-cc107ng | |
Emissions
System Noise
The fan is usually quiet when the system is idling, although this is not the case at medium load, where fan noise measured up to 39.2 db(A), further increasing to 41 dB(A) during our stress tests. While the fan noise is bearable, we suspect that such volumes would be distracting if someone were trying to concentrate.
Noise level
| Idle |
| 30.13 / 30.3 / 30.3 dB(A) |
| Load |
| 39.2 / 41 dB(A) |
 | ||
30 dB silent 40 dB(A) audible 50 dB(A) loud |
||
min: | ||
| Asus ZenBook 13 UX331UN i5-8550U, GeForce MX150 | Asus ZenBook 13 UX331UN i5-8550U, GeForce MX150 | Lenovo Ideapad 720S-13IKB i5-8250U, UHD Graphics 620 | Dell XPS 13 9370 FHD i5 i5-8250U, UHD Graphics 620 | HP Envy 13-ad006ng i7-7500U, GeForce MX150 | |
|---|---|---|---|---|---|
| Noise | -1% | 5% | 7% | 3% | |
| off / environment * (dB) | 30.13 | 29.6 2% | 30.13 -0% | 29.1 3% | 30.5 -1% |
| Idle Minimum * (dB) | 30.13 | 29.6 2% | 30.13 -0% | 29.1 3% | 30.5 -1% |
| Idle Average * (dB) | 30.3 | 29.6 2% | 30.13 1% | 29.1 4% | 30.5 -1% |
| Idle Maximum * (dB) | 30.3 | 29.6 2% | 30.9 -2% | 29.1 4% | 30.5 -1% |
| Load Average * (dB) | 39.2 | 41.7 -6% | 34.7 11% | 32.2 18% | 37.3 5% |
| Load Maximum * (dB) | 41 | 43.5 -6% | 33.3 19% | 37.3 9% | 34.2 17% |
| Witcher 3 ultra * (dB) | 43.5 | 37.3 |
* ... smaller is better
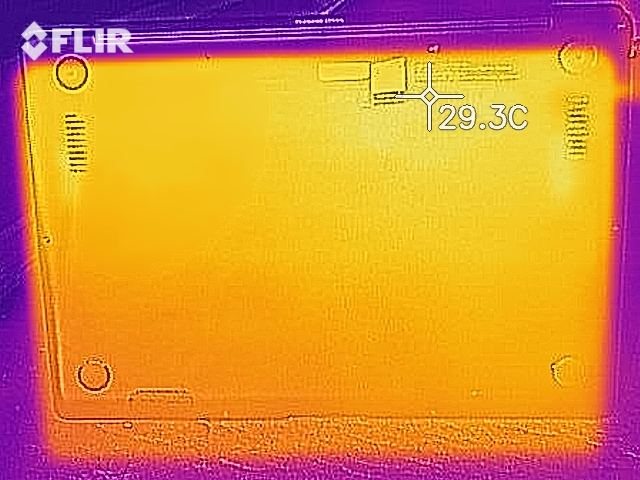
Temperature
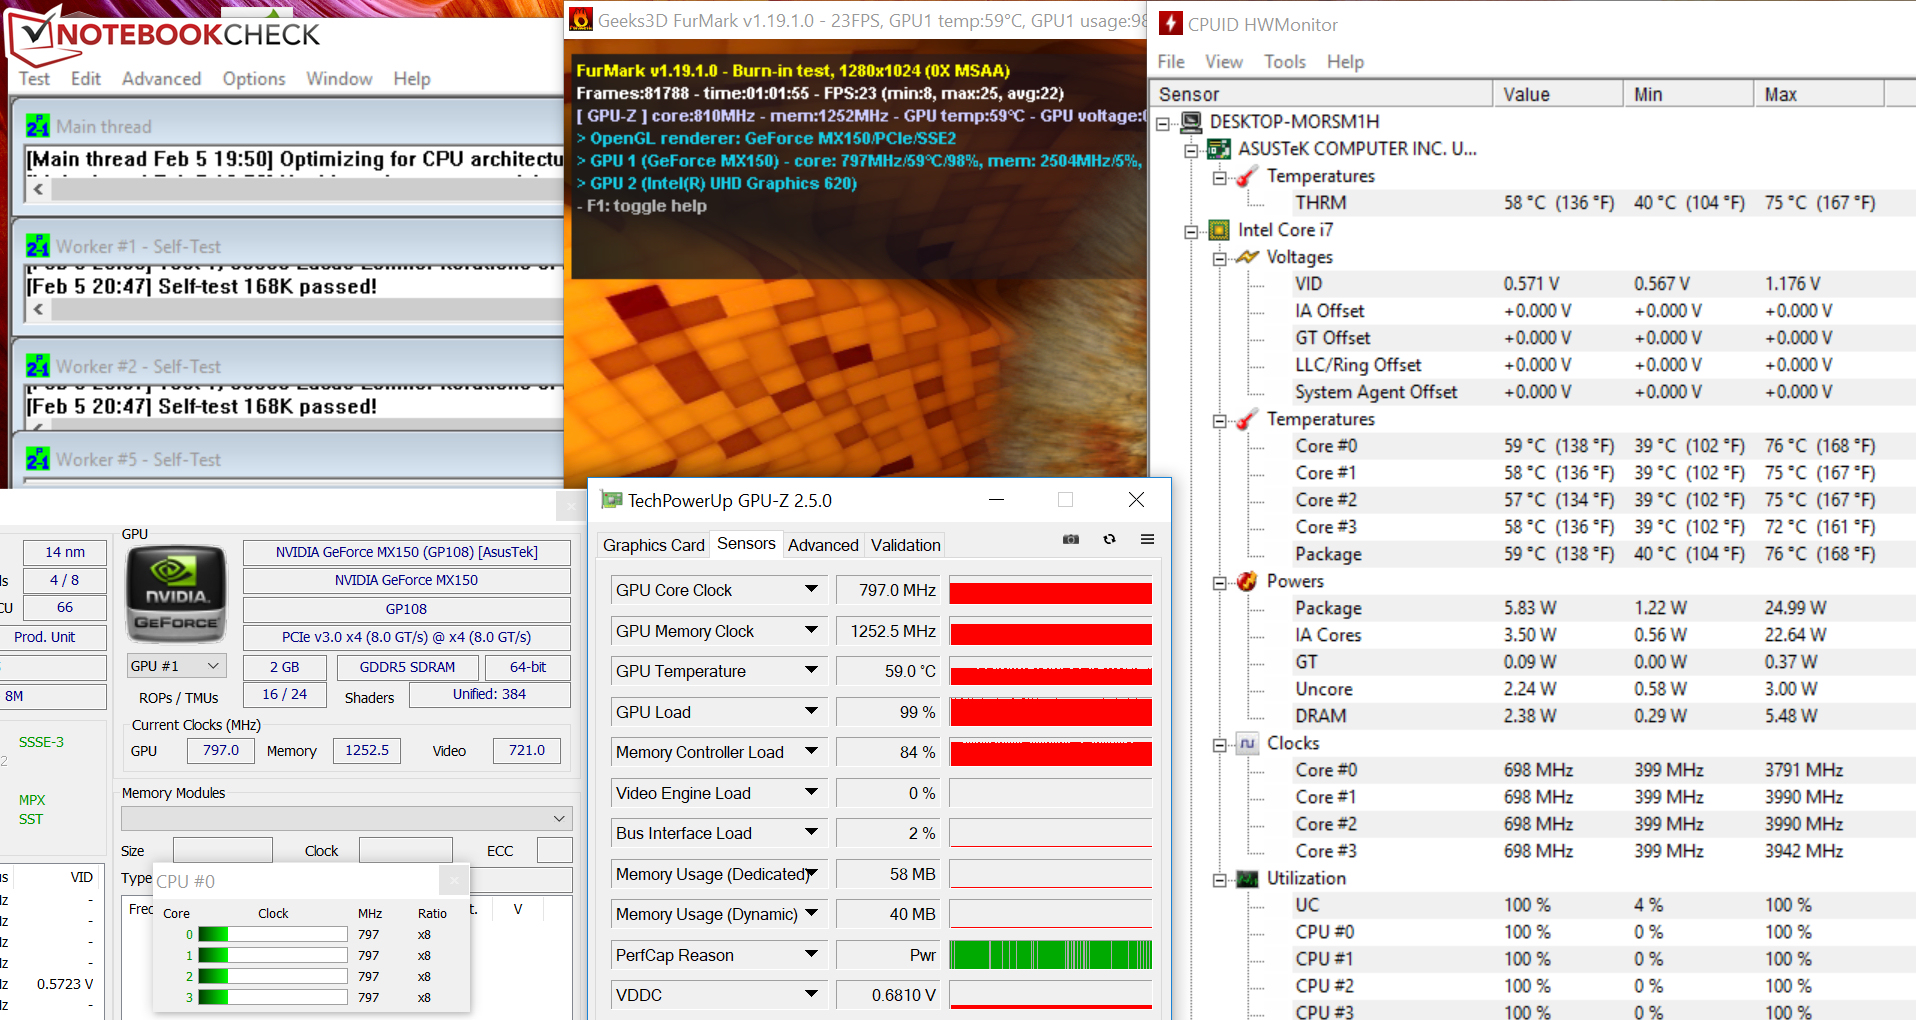
During our Prime95 and FurMark one-hour stress tests, the ZenBook performed equally well on charge as it did on battery. Processor speeds vary between 1.2 and 2.7 GHZ for the first ten minutes before dropping to and remaining at between 800 and 900 MHz. This throttling is not replicated with the graphics card, which started the stress tests at between 600 and 800 MHz, before stabilizing at 800 MHz.
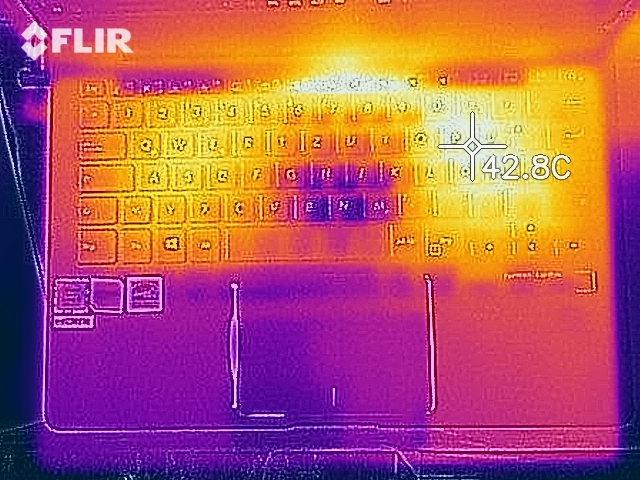
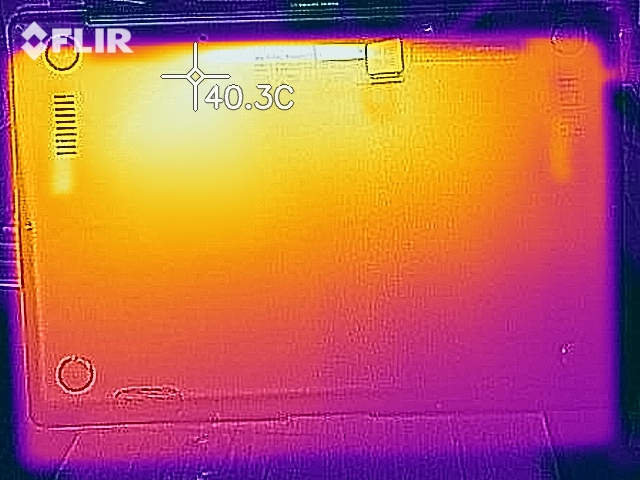
Notably, our test device stayed relatively cool during our stress tests, with surface temperatures remaining below 40 °C (104 °F).
(+) The maximum temperature on the upper side is 39.3 °C / 103 F, compared to the average of 35.9 °C / 97 F, ranging from 21.4 to 59 °C for the class Subnotebook.
(+) The bottom heats up to a maximum of 36.5 °C / 98 F, compared to the average of 39.2 °C / 103 F
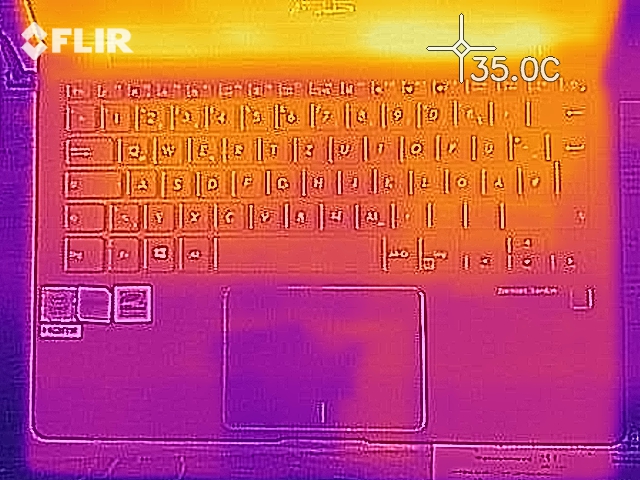
(+) In idle usage, the average temperature for the upper side is 27.9 °C / 82 F, compared to the device average of 30.8 °C / 87 F.
(+) The palmrests and touchpad are cooler than skin temperature with a maximum of 29.7 °C / 85.5 F and are therefore cool to the touch.
(±) The average temperature of the palmrest area of similar devices was 28.2 °C / 82.8 F (-1.5 °C / -2.7 F).
| Asus ZenBook 13 UX331UN i5-8550U, GeForce MX150 | Asus ZenBook 13 UX331UN i5-8550U, GeForce MX150 | Lenovo Ideapad 720S-13IKB i5-8250U, UHD Graphics 620 | Dell XPS 13 9370 FHD i5 i5-8250U, UHD Graphics 620 | HP Envy 13-ad006ng i7-7500U, GeForce MX150 | Apple MacBook Air 13.3" 1.8 GHz (2017) 5350U, HD Graphics 6000 | |
|---|---|---|---|---|---|---|
| Heat | 8% | -5% | 0% | 10% | -3% | |
| Maximum Upper Side * (°C) | 39.3 | 40.9 -4% | 43.6 -11% | 44.2 -12% | 41.6 -6% | 42.8 -9% |
| Maximum Bottom * (°C) | 36.5 | 38.1 -4% | 42 -15% | 45.5 -25% | 33.4 8% | 41.5 -14% |
| Idle Upper Side * (°C) | 30 | 23.9 20% | 28.6 5% | 24.1 20% | 23.1 23% | 27.6 8% |
| Idle Bottom * (°C) | 28.3 | 23.1 18% | 28.2 -0% | 23.2 18% | 24.1 15% | 26.9 5% |
* ... smaller is better
Speakers
Asus ZenBook 13 UX331UN audio analysis
(-) | not very loud speakers (67.9 dB)
Bass 100 - 315 Hz
(±) | reduced bass - on average 13% lower than median
(+) | bass is linear (6.8% delta to prev. frequency)
Mids 400 - 2000 Hz
(+) | balanced mids - only 2.7% away from median
(+) | mids are linear (3.6% delta to prev. frequency)
Highs 2 - 16 kHz
(+) | balanced highs - only 0.9% away from median
(+) | highs are linear (2.7% delta to prev. frequency)
Overall 100 - 16.000 Hz
(±) | linearity of overall sound is average (15.2% difference to median)
Compared to same class
» 34% of all tested devices in this class were better, 5% similar, 61% worse
» The best had a delta of 5%, average was 18%, worst was 53%
Compared to all devices tested
» 22% of all tested devices were better, 4% similar, 74% worse
» The best had a delta of 4%, average was 23%, worst was 134%
Apple MacBook 12 (Early 2016) 1.1 GHz audio analysis
(+) | speakers can play relatively loud (83.6 dB)
Bass 100 - 315 Hz
(±) | reduced bass - on average 11.3% lower than median
(±) | linearity of bass is average (14.2% delta to prev. frequency)
Mids 400 - 2000 Hz
(+) | balanced mids - only 2.4% away from median
(+) | mids are linear (5.5% delta to prev. frequency)
Highs 2 - 16 kHz
(+) | balanced highs - only 2% away from median
(+) | highs are linear (4.5% delta to prev. frequency)
Overall 100 - 16.000 Hz
(+) | overall sound is linear (10.2% difference to median)
Compared to same class
» 7% of all tested devices in this class were better, 2% similar, 90% worse
» The best had a delta of 5%, average was 18%, worst was 53%
Compared to all devices tested
» 5% of all tested devices were better, 1% similar, 94% worse
» The best had a delta of 4%, average was 23%, worst was 134%
Frequency Comparison (Checkbox selectable!)
Power management
Energy consumption
We measured the ZenBook drawing 8 W at idle, which makes our test device slightly thirstier than its sibling. Additionally, at the start of our stress tests the ZenBook briefly drew 49.4 W. This power consumption varies in accordance with CPU clock speed fluctuations. The power supply is rated at 65 W.
| Off / Standby | |
| Idle | |
| Load |
|
Key:
min: | |
| Asus ZenBook 13 UX331UN i5-8550U, GeForce MX150 | Asus ZenBook 13 UX331UN i5-8550U, GeForce MX150 | Lenovo Ideapad 720S-13IKB i5-8250U, UHD Graphics 620 | Dell XPS 13 9370 FHD i5 i5-8250U, UHD Graphics 620 | HP Envy 13-ad006ng i7-7500U, GeForce MX150 | Apple MacBook Air 13.3" 1.8 GHz (2017) 5350U, HD Graphics 6000 | |
|---|---|---|---|---|---|---|
| Power Consumption | -9% | -26% | -8% | -16% | -11% | |
| Idle Minimum * (Watt) | 2.2 | 2.7 -23% | 3.9 -77% | 3.14 -43% | 2.8 -27% | 3.4 -55% |
| Idle Average * (Watt) | 5 | 5.3 -6% | 7.7 -54% | 5.22 -4% | 5.8 -16% | 6.3 -26% |
| Idle Maximum * (Watt) | 8 | 6.2 22% | 10.4 -30% | 6 25% | 7.7 4% | 7 12% |
| Load Average * (Watt) | 33 | 37.6 -14% | 33.3 -1% | 38.5 -17% | 48 -45% | 34.5 -5% |
| Load Maximum * (Watt) | 49.4 | 60.1 -22% | 34 31% | 50.4 -2% | 48 3% | 40 19% |
| Witcher 3 ultra * (Watt) | 35 |
* ... smaller is better
Battery Life
The ZenBook has a runtime of eight hours and fifty-eight minutes in our practical Wi-Fi test when set at 150 cd/m². During this test we simulate the effective load created by loading websites. Similarly, the ZenBook lasts eight hours and fifty-four minutes in our video test. For this test we play the short film Big Buck Bunny on a continuous loop with H.264 encoding at a resolution of 1,920 x 1,080. The Wi-Fi modules are disabled and the brightness is set to 150 cd/m².
While the battery life is good, it lags behind its sibling. We subsequently found out that our test device has a battery wear rate of 7.4 percent, which goes some way toward explaining the battery time differences between the two ZenBook models.
| Asus ZenBook 13 UX331UN i5-8550U, GeForce MX150, 50 Wh | Asus ZenBook 13 UX331UN i5-8550U, GeForce MX150, 50 Wh | Lenovo Ideapad 720S-13IKB i5-8250U, UHD Graphics 620, 46 Wh | Dell XPS 13 9370 FHD i5 i5-8250U, UHD Graphics 620, 52 Wh | HP Envy 13-ad006ng i7-7500U, GeForce MX150, 51 Wh | Apple MacBook Air 13.3" 1.8 GHz (2017) 5350U, HD Graphics 6000, 54 Wh | |
|---|---|---|---|---|---|---|
| Battery runtime | 5% | -7% | 25% | -6% | 18% | |
| Reader / Idle (h) | 20.7 | 22 6% | 17.3 -16% | 23.6 14% | 20 -3% | |
| H.264 (h) | 8.9 | 9.6 8% | 13.9 56% | 7.9 -11% | ||
| WiFi v1.3 (h) | 9 | 8.4 -7% | 10.1 12% | 10.7 19% | 7.1 -21% | 10.6 18% |
| Load (h) | 1.8 | 2 11% | 1.5 -17% | 2 11% | 2 11% |
Verdict
Pros
Cons
The ASUS ZenBook 13 scores highly by fitting both a powerful CPU and GPU into a compact chassis. This comes at a cost though, as the case dimensions precluded ASUS from including a cooling system that could adequately cool the device. Among other things, ASUS have compromised on GPU performance to circumvent this cooling issue.
Despite this, the ZenBook is a still a good all-rounder that plays games comfortably.
Considering the compact design, the ZenBook remains relatively cool under load, which is a positive. The fan is usually quiet when the device is idling, but it is clearly audible when the device starts to be tested. Users who are looking for a quiet and powerful device would therefore probably be unhappy with the ZenBook.
Given the ZenBook’s price, we would have expected ASUS to include an NVMe drive rather than the slower SATA III drive that comes with the ZenBook. This would have been possible too, as ASUS’ website says that the M.2-2280 slot supports both NVMe and SATA III. The IPS display is respectable with decent viewing angels, good contrast and adequate brightness. Moreover, we liked the backlit keyboard and were impressed by the long battery life.
The I/O will not blow anyone away. It would have been good had ASUS included a Thunderbolt 3 port rather than the USB 3.1 Gen 1 Type C port. Doing so would have allowed the ZenBook to be charged by USB C, which would certainly have increased the ZenBook’s appeal and further future proofed it.
Asus ZenBook 13 UX331UN
- 10/26/2019 v7 (old)
Sascha Mölck
Price comparison

