Apple MacBook Air 13 2017 Laptop (1.8 GHz) Review

For the original German review, see here.
Without much ado, Apple’s oldest piece of hardware has been quietly updated. And with that, all hope for a higher resolution display is gone. It almost seems as if Apple is making final preparations for the MacBook Air’s retirement rather than upgrading it from the bottom up. Most probably, this is due to their recent product strategy. Still, the Air is the most affordable path into Apple’s universe. At only $999, the MacBook Air with its 13.3-display (1440x900), 1.8 GHz dual-core processor, 8 GB of RAM, and a whopping 128 GB SSD is a true steal (this sentence may contain traces of irony). Unfortunately, at this price it does not include an IPS panel with decent viewing angles, and even lacks Apple’s Force Touch touchpad.
It thus makes sense that Apple has refrained from making a public announcement of what can only be described as continued life support for its Air lineup. Kudos to Apple though, for keeping the Air around for yet another year, and thereby satisfying the still surprisingly high demand and, most importantly, managing to continue selling it at a high profit. Convincing people to purchase this particular notebook in 2017 is a feat that only Apple is capable of pulling off.
We have picked the basic entry-level model for $999 for our test. It has only recently been bumped to 1.8 GHz and equipped with a faster 128 GB SSD, but is otherwise identical to its predecessor. Thus, we will not discuss the case, connectivity, and its input devices in this review and would like to refer you to our MacBook Air 13 2015 review instead. We did, however, take another look at the display using our new measuring equipment, and whether the bump in performance also induced changes in emissions and battery life.
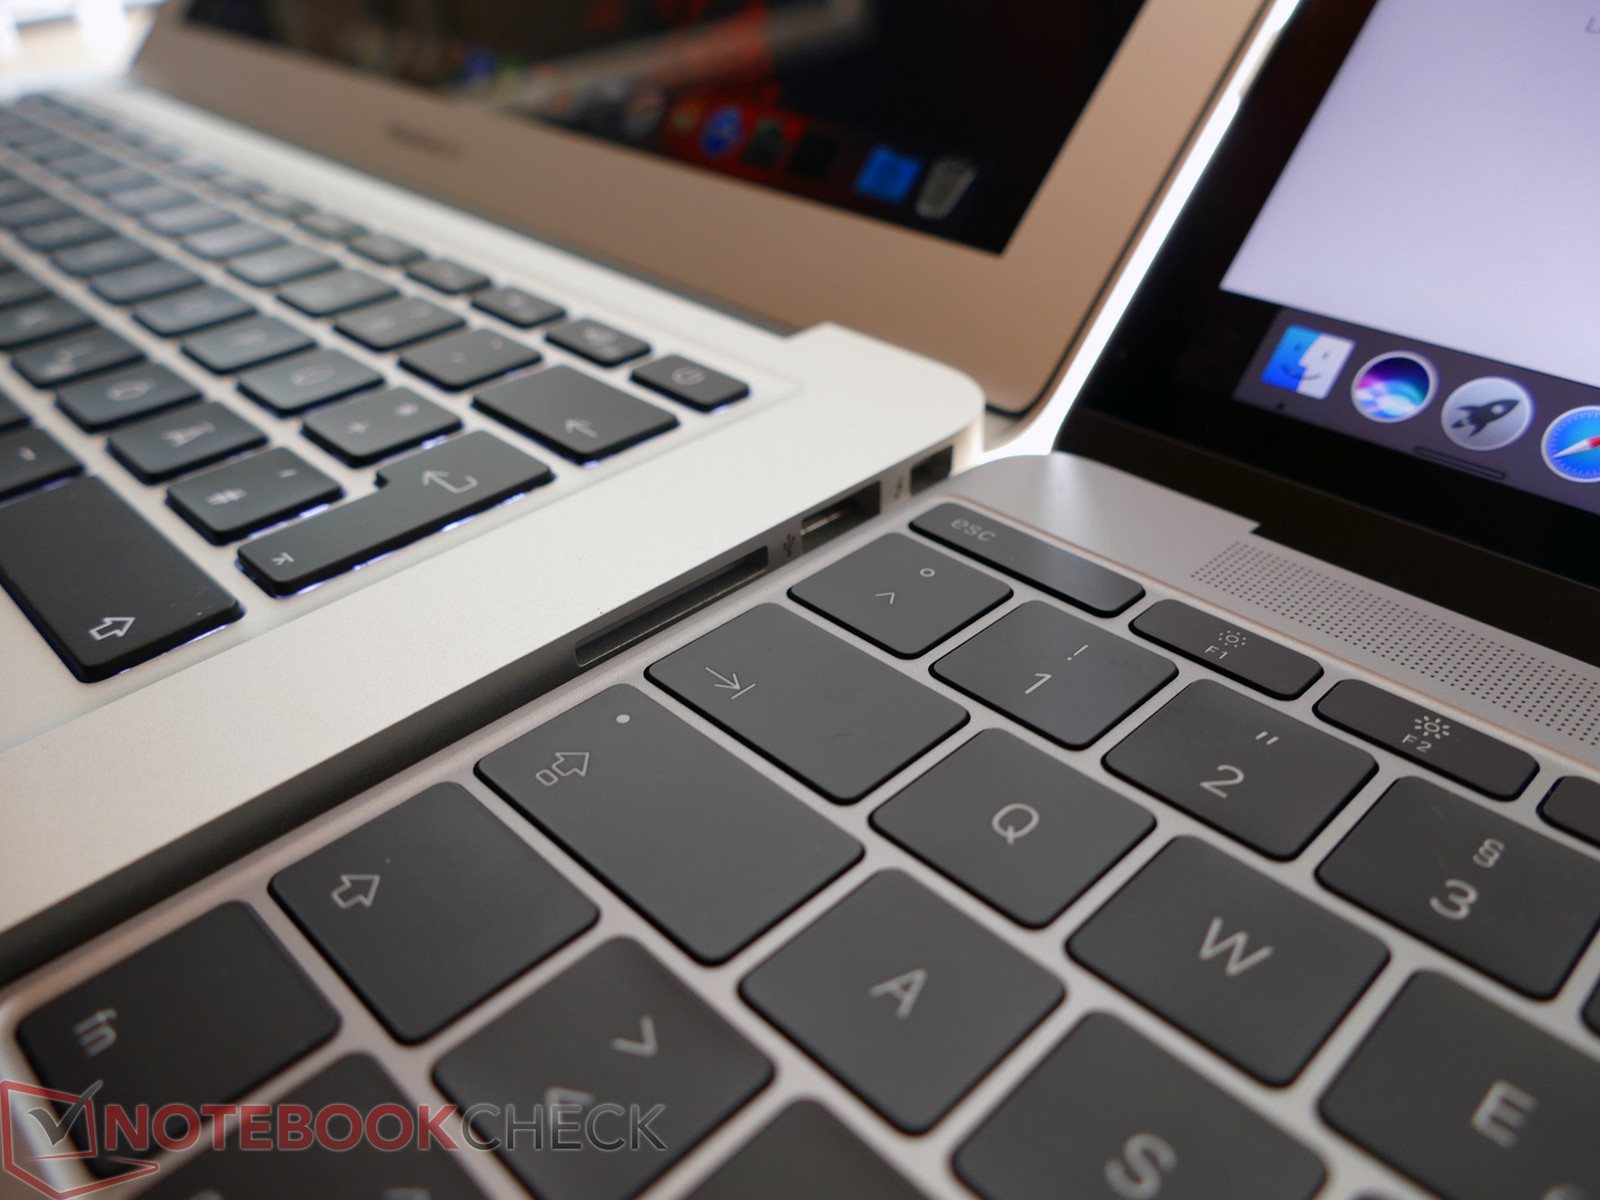
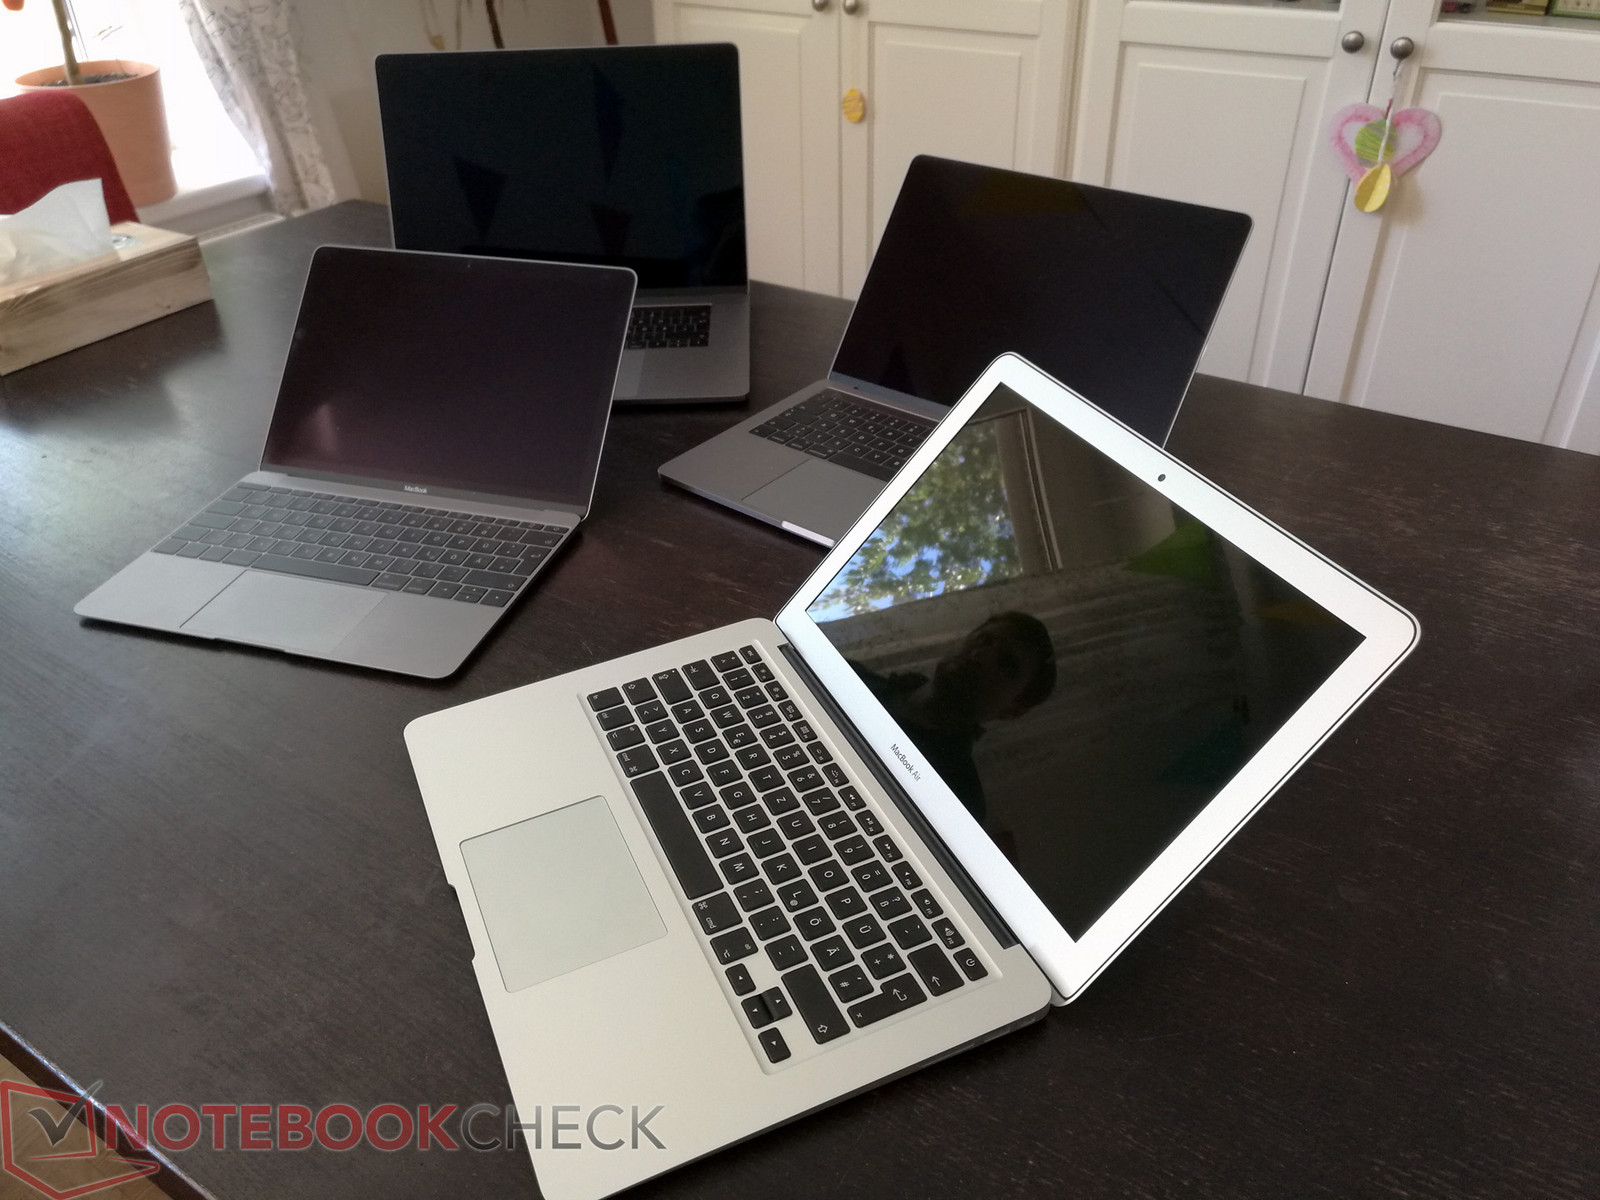
Our size comparison clearly shows that in terms of size, we have seen massive improvements in the last seven years. Even the much more powerful MacBook Pro 13 has now become smaller and slimmer than the MacBook Air 13, and its weight is almost identical. In this price range, several Windows notebooks are also capable of beating the MacBook Air 13 hands down when it comes to size and thickness. Build quality and touch and feel are still top notch, though.
Connectivity – Fast Wi-Fi and Card Reader
Our size comparison clearly shows that in terms of size, we have seen massive improvements in the last seven years. Even the much more powerful MacBook Pro 13 has now become smaller and thinner than the MacBook Air 13, and its weight is almost identical. In this price range, several Windows notebooks are also capable of beating the MacBook Air 13 hands down when it comes to size and thickness. Build quality and touch and feel are still top notch, though.
SD Card Reader
Since we were not testing integrated card readers back when we last reviewed the MacBook Air 13, we did it this time. Long story short: the Air achieved a transfer speed of 88 MB/s.
| SD Card Reader | |
| average JPG Copy Test (av. of 3 runs) | |
| Dell XPS 13 9360 FHD i5 | |
| Apple MacBook Air 13.3" 1.8 GHz (2017) | |
| Asus Zenbook UX310UA-FC347T iGP | |
| maximum AS SSD Seq Read Test (1GB) | |
| Dell XPS 13 9360 FHD i5 | |
| Apple MacBook Air 13.3" 1.8 GHz (2017) | |
| Asus Zenbook UX310UA-FC347T iGP | |
Communication
Our Wi-Fi performance test is also new, and did not exist during our last review of the MacBook Air 13 back in 2015. In a standardized setup, we measure maximum transfer speeds both transmitting and receiving data. At 686 and 692 MB/s, respectively, the MacBook Air 13 performed exceptionally well in this test. The more expensive MacBook 12 did not perform any better, only the much more expensive new MacBook Pro 13 managed to outperform the Air 13 by a significant margin. With several thick concrete walls between the notebook and the Wi-Fi router, the Air 13 performed just as well as the new MacBook Pro 15, with the MacBook 12 falling behind and the MacBook Pro 13 once again outperforming its competitors.
Display – Last Decade’s TN Technology
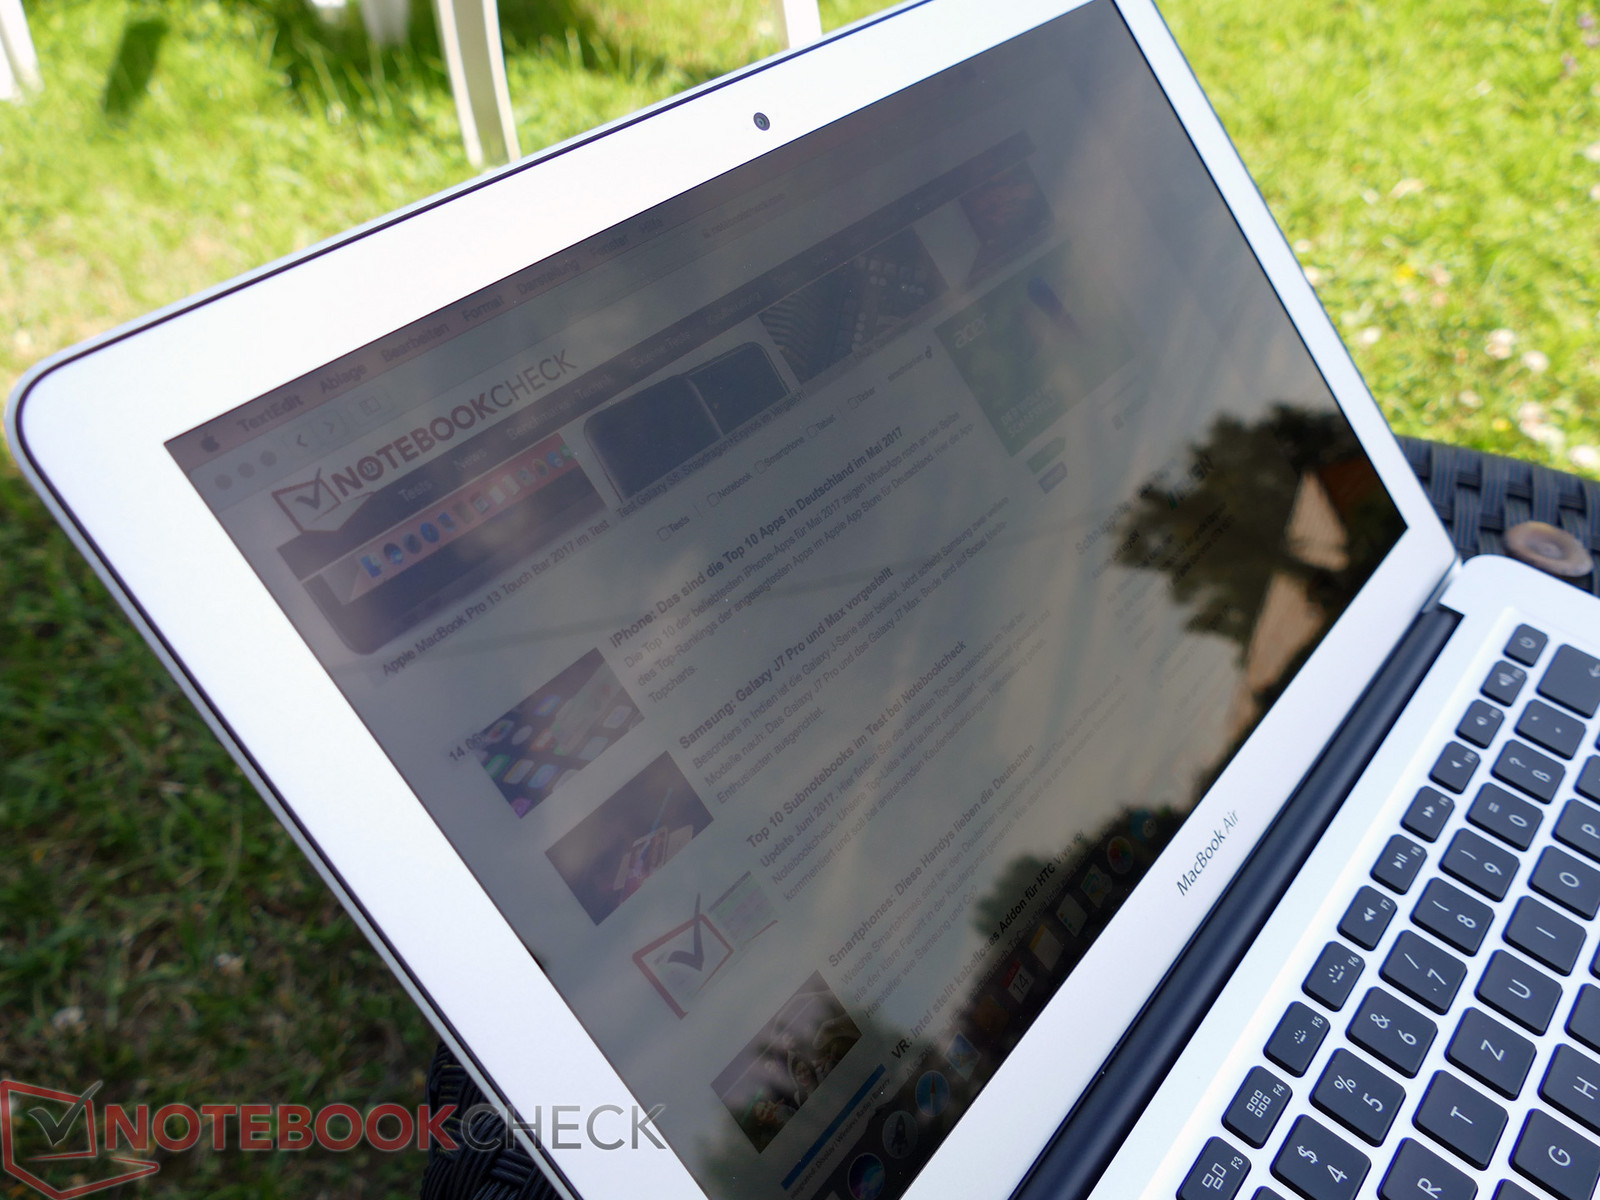
Evidently, Apple is still equipping its Air with the well-known 13.3-inch TN panel with a highly reflective coating. At this size, its resolution of only 1440x900 translates to a pixel density 128 PPI, which is not only fairly low when compared to Apple’s own Retina displays, for example its 227 PPI 13-inch MacBook Pro, but also the 1920x1080 FHD panels that have become more common in the last few years. The comparison with the MacBook 12, with its 12-inch 2304x1440 resolution (226 PPI) display, makes it painfully obvious how outdated and terrible the Air’s display really is, and how crisp and clear a panel can be in 2017. This is most obvious when looking at text, where the Air’s lack of sharpness results in blurry shading along the edges. Thus, we would absolutely recommend a higher resolution display for those of you who work with and look at text all day long.
Since our new at-random brightness measurements did not deviate significantly from our previous ones, the following details are taken directly out of the MacBook Air 13 2015 review.
| |||||||||||||||||||||||||
Brightness Distribution: 82 %
Center on Battery: 327 cd/m²
Contrast: 812:1 (Black: 0.405 cd/m²)
ΔE ColorChecker Calman: 3.96 | ∀{0.5-29.43 Ø4.73}
ΔE Greyscale Calman: 3.51 | ∀{0.09-98 Ø4.97}
59.8% sRGB (Argyll 1.6.3 3D)
38.4% AdobeRGB 1998 (Argyll 1.6.3 3D)
41.51% AdobeRGB 1998 (Argyll 3D)
59.8% sRGB (Argyll 3D)
40.1% Display P3 (Argyll 3D)
Gamma: 3.83
CCT: 6711 K
| Apple MacBook Air 13.3" 1.8 GHz (2017) 1440x900, 13.3" | Apple MacBook Air 13 inch 2015-03 Apple APP9CF0, , 1440x900, 13.3" | Apple MacBook 12 (Early 2016) 1.1 GHz APPA027, , 2304x1440, 12" | Apple MacBook Pro 13 2016 (2.9 GHz) APPA033, , 2560x1600, 13.3" | Dell XPS 13 9360 FHD i5 Sharp SHP1449 LQ133M1, , 1920x1080, 13.3" | Dell XPS 13 9360 QHD+ i7 Sharp SHP144A, , 3200x1800, 13.3" | |
|---|---|---|---|---|---|---|
| Display | ||||||
| Display P3 Coverage (%) | 40.1 | 66.8 | 99.2 | 48.94 | 62.8 | |
| sRGB Coverage (%) | 59.8 | 95.4 | 99.9 | 73.3 | 89.4 | |
| AdobeRGB 1998 Coverage (%) | 41.51 | 68 | 87.6 | 50.5 | 64.6 | |
| Response Times | 7% | -39% | 10% | 7% | ||
| Response Time Grey 50% / Grey 80% * (ms) | 52.4 ? | 41.2 ? 21% | 47.2 ? 10% | 32.8 ? 37% | 43.6 ? 17% | |
| Response Time Black / White * (ms) | 28.4 ? | 30.4 ? -7% | 53 ? -87% | 33.2 ? -17% | 29.2 ? -3% | |
| PWM Frequency (Hz) | 58000 | |||||
| Screen | ||||||
| Brightness middle (cd/m²) | 329 | 387 | 569 | 351.2 | 396.2 | |
| Black Level * (cd/m²) | 0.405 | 0.47 | 0.56 | 0.195 | 0.266 | |
| Brightness (cd/m²) | 310 | 358 | 542 | 325 | 357 | |
| Brightness Distribution (%) | 82 | 88 | 90 | 89 | 84 | |
| Contrast (:1) | 812 | 823 | 1016 | 1801 | 1489 | |
| Colorchecker dE 2000 * | 3.96 | 1.6 | 1.4 | 7.4 | 3.9 | |
| Colorchecker dE 2000 max. * | 7.51 | 4 | 2.9 | 9.08 | 7.58 | |
| Greyscale dE 2000 * | 3.51 | 1 | 1.8 | 6.71 | 4.16 | |
| Gamma | 3.83 57% | 2.26 97% | 2.16 102% | 2.74 80% | 2.31 95% | |
| CCT | 6711 97% | 6680 97% | 6877 95% | 7222 90% | 6514 100% | |
| Color Space (Percent of AdobeRGB 1998) (%) | 38.4 | 61.6 | 78.4 | 50.48 | 57.5 | |
| Color Space (Percent of sRGB) (%) | 59.8 | 82.2 | 99.3 | 73.31 | 88.7 | |
| Total Average (Program / Settings) | 7% /
7% | -39% /
-39% | 10% /
10% | 7% /
7% |
* ... smaller is better
When the MacBook Air was first introduced, TN panels were still quite common. Unfortunately, the latest iteration still features the exact same TN panel, which means significantly reduced viewing angles on the one hand, but also lower response times on the other. With our new measuring equipment, we have found the black-to-white response time to be 28.4 milliseconds, and grey-to-grey took only 52.4 milliseconds. Thus, the Air’s panel does not really stand out when compared to the MacBook 12’s much more modern IPS panel.
Thanks to our new equipment, we were also able to detect PWM flickering at reduced display brightness levels at a very high 58 kHz and hence, it should not be of any concern.
Display Response Times
| ↔ Response Time Black to White | ||
|---|---|---|
| 28.4 ms ... rise ↗ and fall ↘ combined | ↗ 18.4 ms rise | 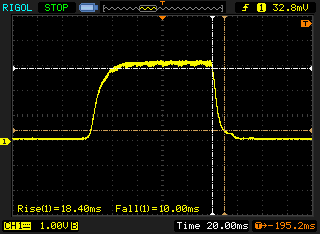 |
| ↘ 10 ms fall | ||
| The screen shows relatively slow response rates in our tests and may be too slow for gamers. In comparison, all tested devices range from 0.1 (minimum) to 240 (maximum) ms. » 75 % of all devices are better. This means that the measured response time is worse than the average of all tested devices (19.9 ms). | ||
| ↔ Response Time 50% Grey to 80% Grey | ||
| 52.4 ms ... rise ↗ and fall ↘ combined | ↗ 30.4 ms rise | 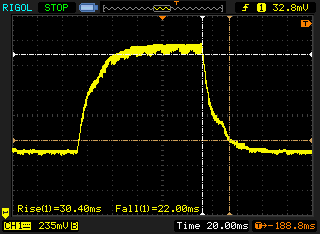 |
| ↘ 22 ms fall | ||
| The screen shows slow response rates in our tests and will be unsatisfactory for gamers. In comparison, all tested devices range from 0.165 (minimum) to 636 (maximum) ms. » 89 % of all devices are better. This means that the measured response time is worse than the average of all tested devices (31.1 ms). | ||
Screen Flickering / PWM (Pulse-Width Modulation)
| Screen flickering / PWM detected | 58000 Hz | 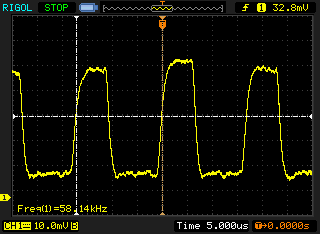 | |
The display backlight flickers at 58000 Hz (worst case, e.g., utilizing PWM) . The frequency of 58000 Hz is quite high, so most users sensitive to PWM should not notice any flickering. In comparison: 52 % of all tested devices do not use PWM to dim the display. If PWM was detected, an average of 7798 (minimum: 5 - maximum: 343500) Hz was measured. | |||
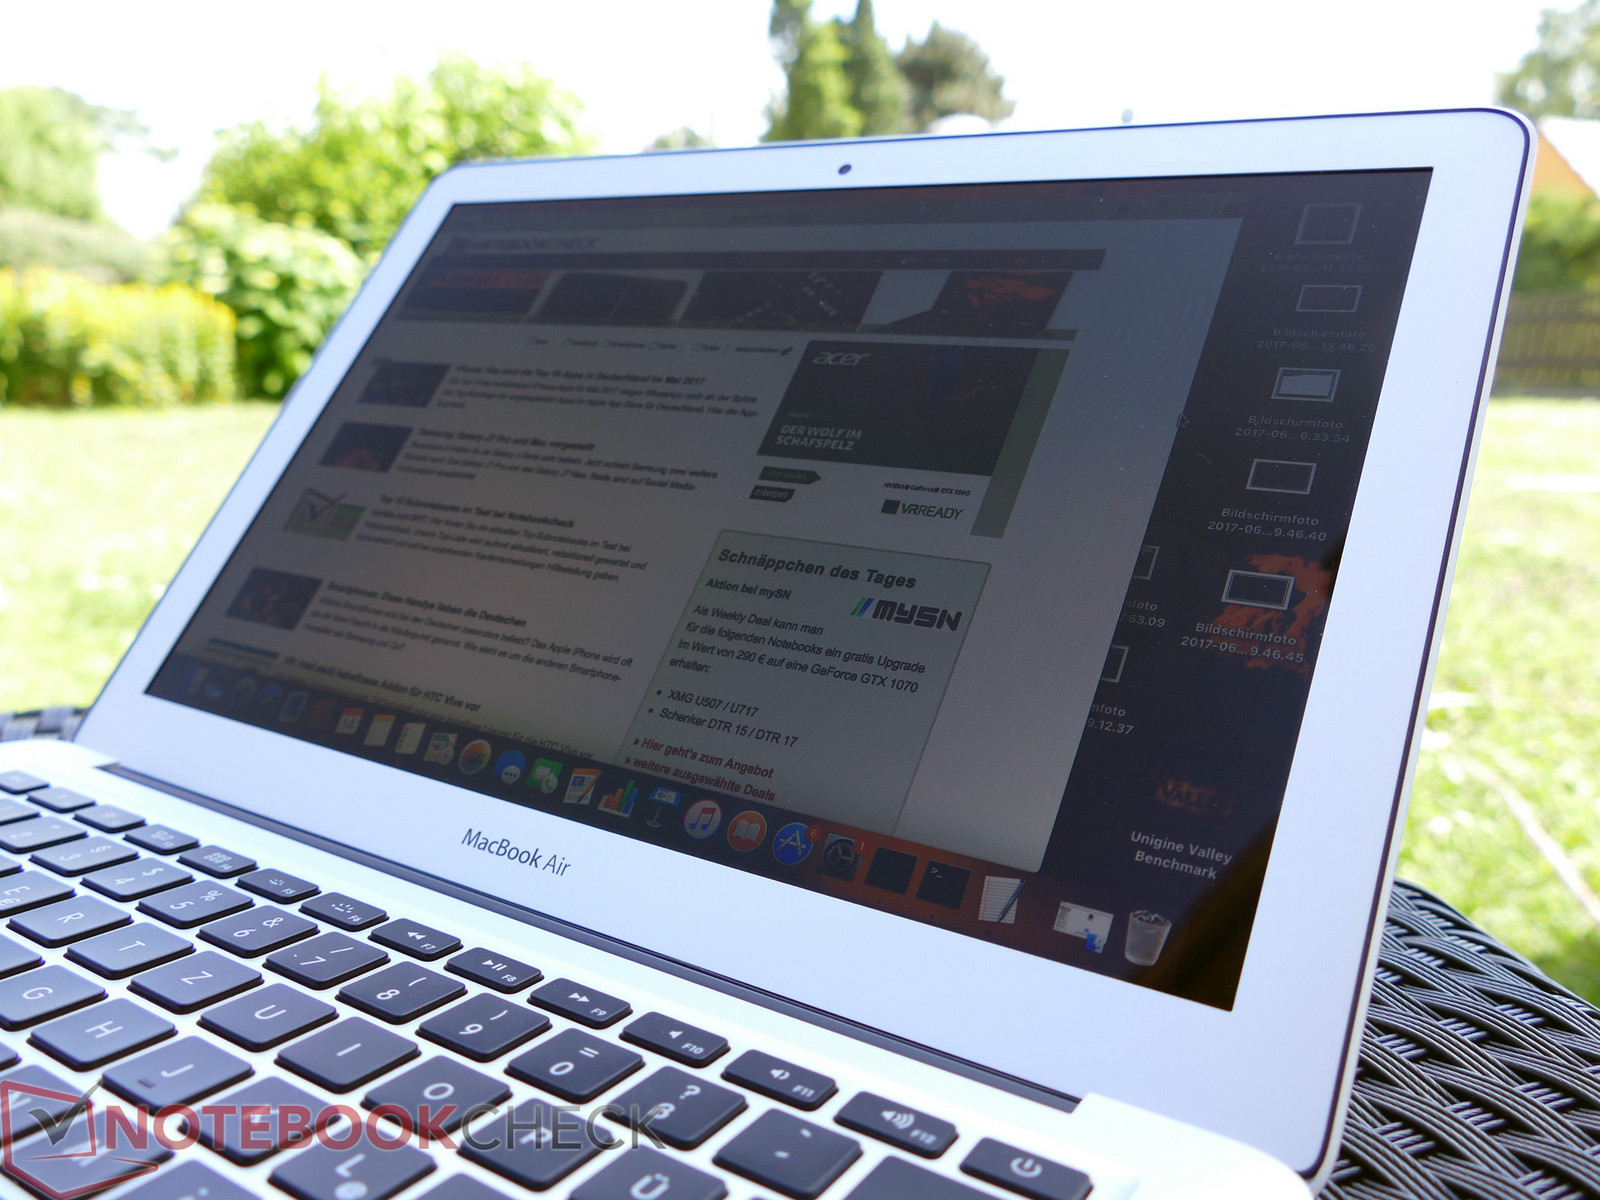
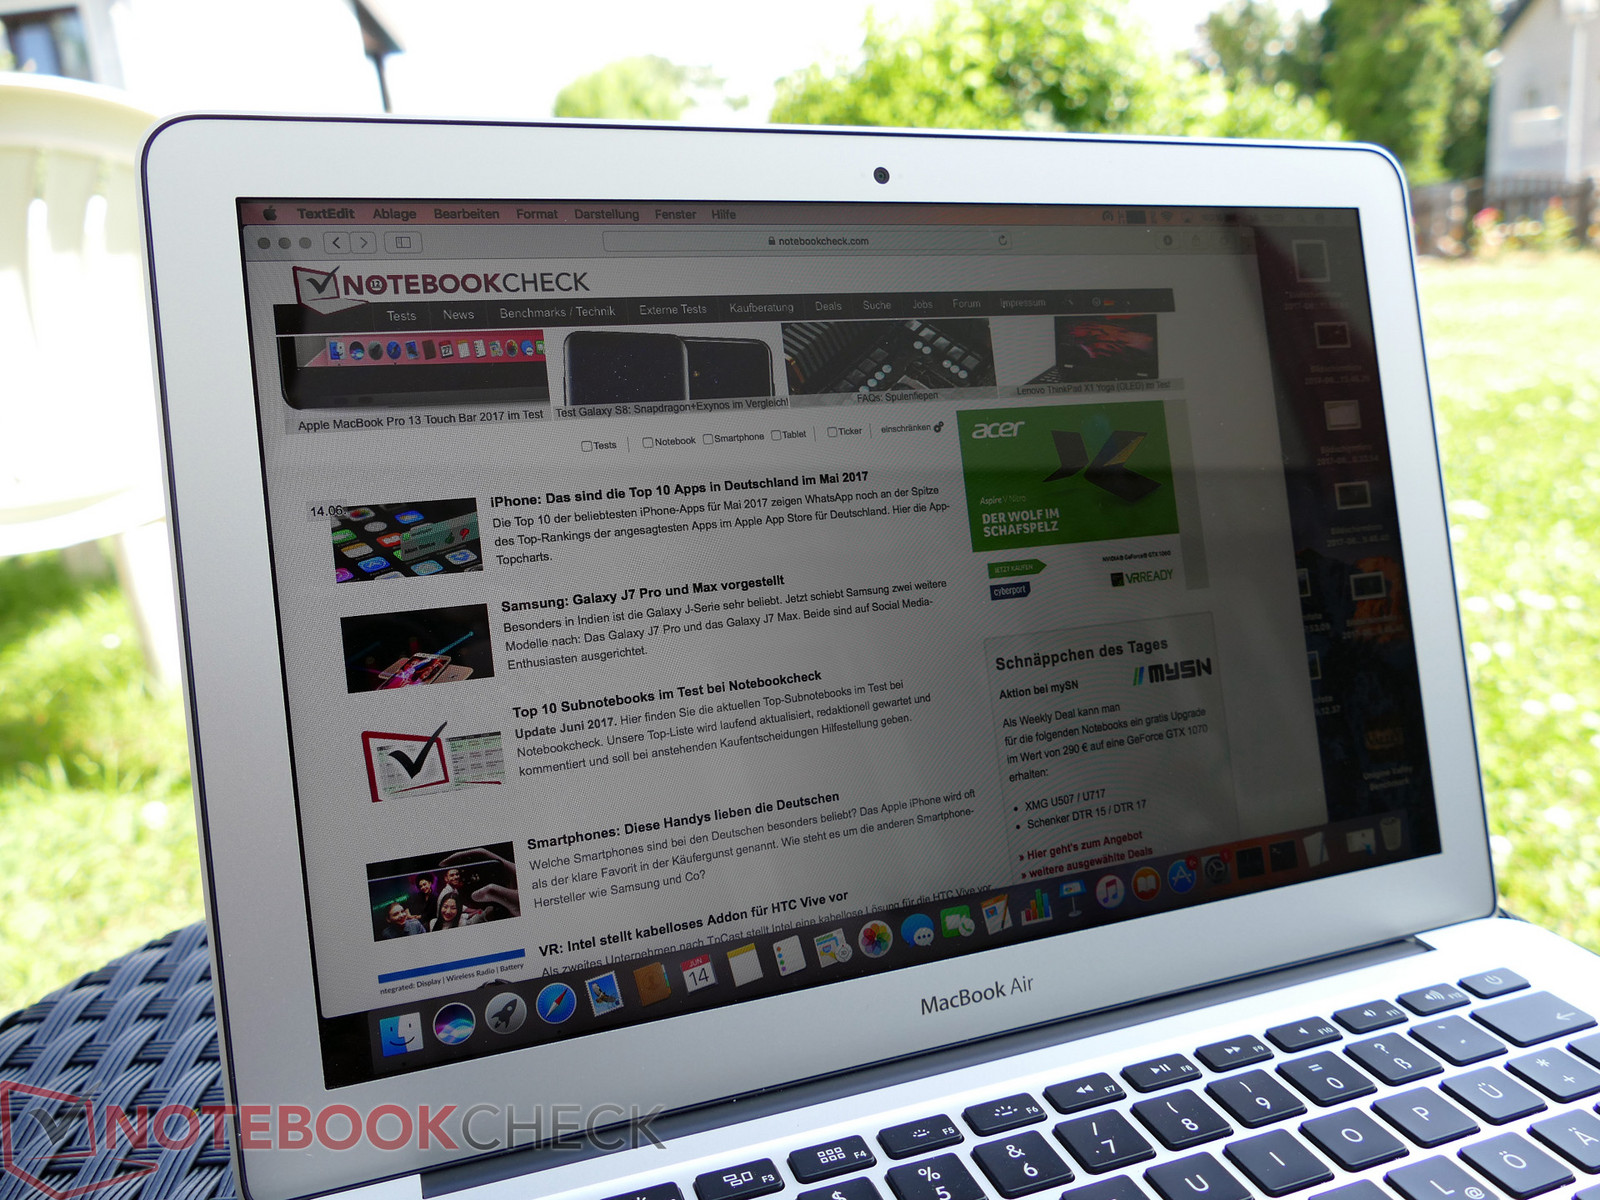
These days, notebooks in the Air’s price range are usually equipped with IPS panels. The Air 13, however, is not. Thus, it suffers from significant color and brightness distortions that TN panels are famous for, and vertical viewing angles are very poor. Those of you who are used to either smartphone or notebook IPS panels will suffer immensely. Horizontal viewing angles are somewhat better. Combined with the highly reflective coating, the poor viewing angles make it very difficult to find an ideal display position and angle.
Performance – Old, but Proven.
Let us talk about the one aspect, where the new Air 13 has actually improved over the previous model. Apple still uses bottom shelf CPUs and continues to equip its Air with Intel’s Broadwell CPUs, and the i5-5250U (1.6 GHz) from the previous generation has been replaced with an i5-5350U (1.8 GHz). This translates to a “massive” 200 MHz, or 12.5%, performance bump! In terms of graphics card, the trusty Intel HD Graphics 6000 remains Apple’s flavor of the month.
Processor
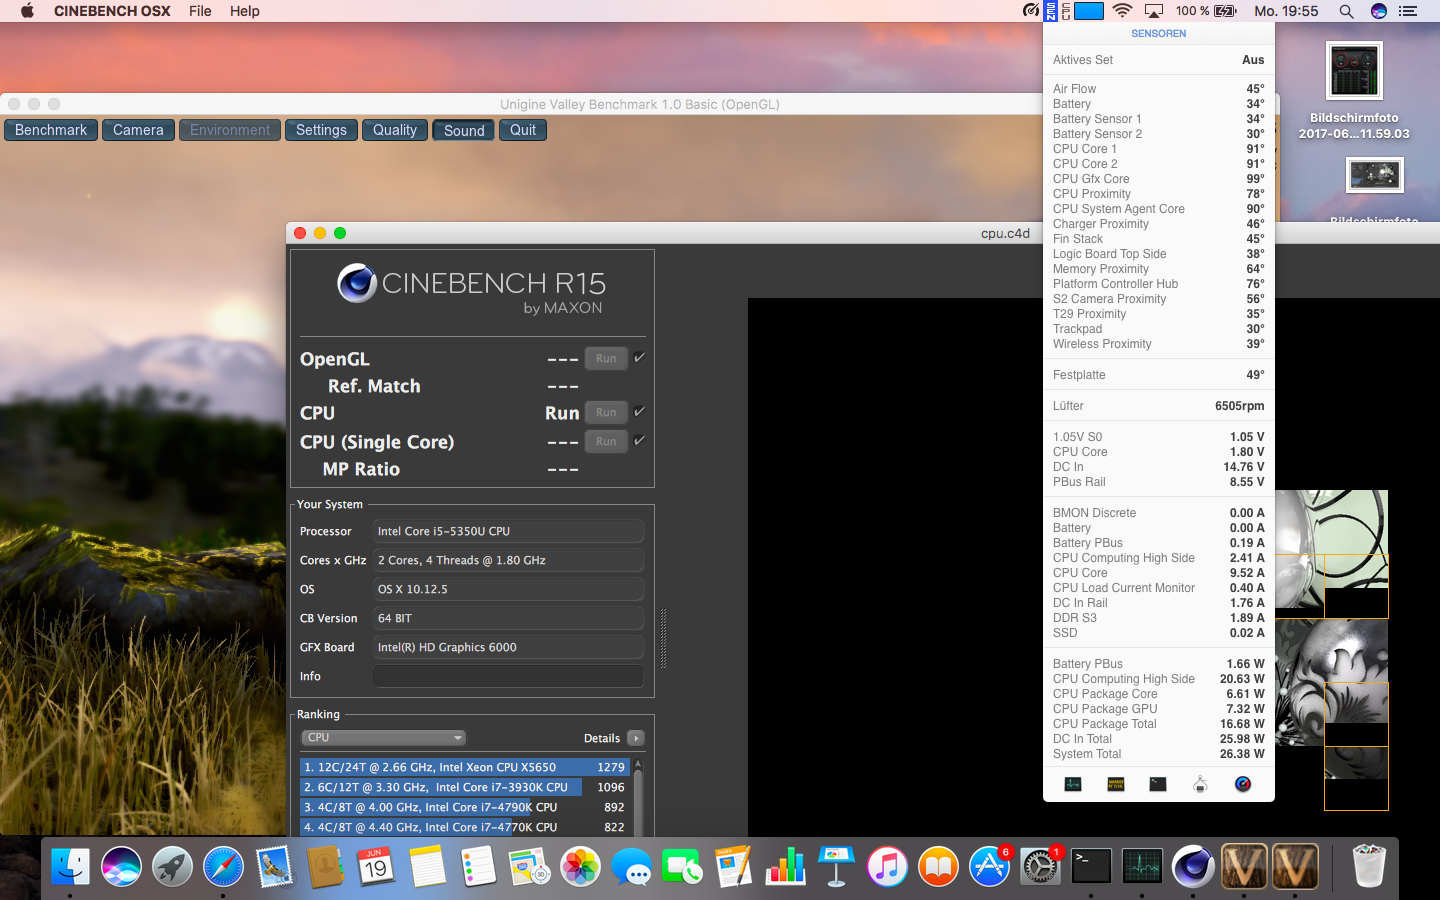
Taking a closer look at the benchmarks, we were surprised to see the new i5-equipped MacBook Air 2017 perform almost exactly as well as the Core i7 model from two years ago. It scored 116 points in Cinebench single-core test (2015 i7: 112 points). Given that Apple is still offering the 2.2 GHz Core i7 processor for an extra $150, we suspect that the performance difference between the two models is, at this point, negligible.
In the multi-core test, the Core i7-5650U model was slightly faster than our newer i5-model (296 vs. 277 points). Given the rather insignificant difference between the two, the optional i7 upgrade is most probably not worth the price. The fact, that Apple’s latest MacBook 12 with its passively cooled Core m3-7Y32 CPU performed almost as well in both tests was a surprise, to say the least. This, however, changed under sustained load, where the m3 began throttling after a while.
| Cinebench R15 | |
| CPU Single 64Bit | |
| Asus Zenbook UX310UA-FC347T iGP | |
| Apple MacBook Pro 13 2016 (2.9 GHz) | |
| Dell Inspiron 13 5378-0K46 | |
| Apple MacBook Air 13.3" 1.8 GHz (2017) | |
| Apple MacBook Air 13 inch 2015-03 | |
| Apple MacBook 12 (Early 2016) 1.3 GHz | |
| CPU Multi 64Bit | |
| Asus Zenbook UX310UA-FC347T iGP | |
| Apple MacBook Pro 13 2016 (2.9 GHz) | |
| Dell Inspiron 13 5378-0K46 | |
| Apple MacBook Air 13 inch 2015-03 | |
| Apple MacBook Air 13.3" 1.8 GHz (2017) | |
| Apple MacBook 12 (Early 2016) 1.3 GHz | |
Speaking of which, one of the essential aspects of perceived performance is not only how well a system performs under short bursts of load, but more importantly whether or not it is capable of maintaining that high level of performance for prolonged periods of time, for example when rendering a video. We simulate this by running Cinebench multi-core test in a loop for at least 30-minute, and our conclusion for the MacBook Air 2017 is that even after 20 reruns, the scores remained at their high initial level.
System Performance
Once again, in PCMark 8 the performance of the newer i5-equipped 2017 model was quite similar to the older, i7-equipped 2015 MacBook Air. The MacBook 12 fell behind, and not surprisingly the much more expensive MacBook Pro performed better in this test.
Subjectively speaking, the MacBook Air 13 is a highly portable internet machine most notable for its 16:10 display aspect ratio. Apple seeks to steer those who require more power, towards the MacBook Pro 13 that starts at $1299.
| PCMark 8 Home Score Accelerated v2 | 3396 points | |
| PCMark 8 Creative Score Accelerated v2 | 4264 points | |
| PCMark 8 Work Score Accelerated v2 | 4371 points | |
| PCMark 10 Score | 2523 points | |
Help | ||
Storage Devices
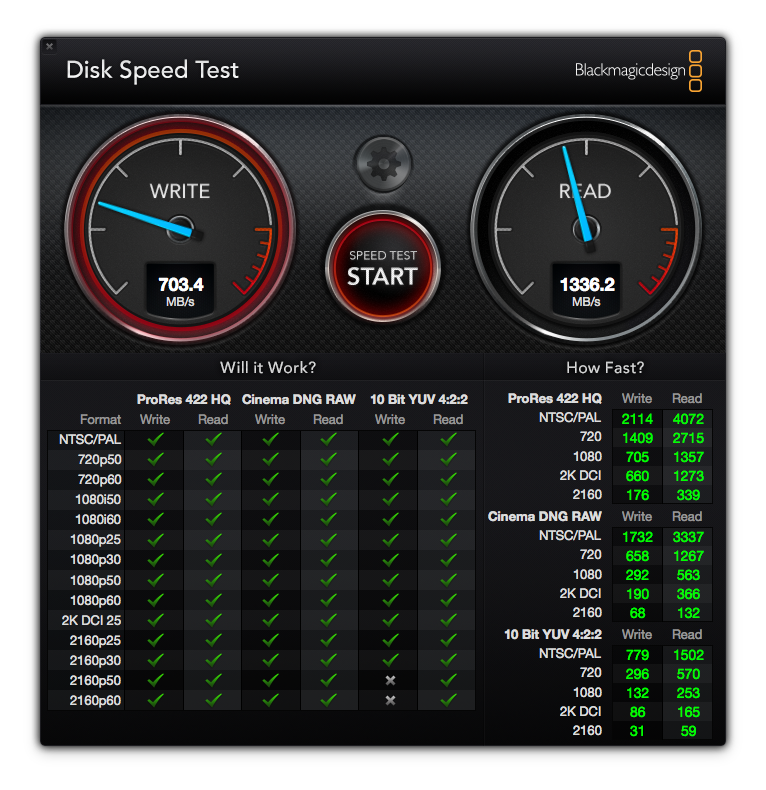
Sequential read speeds of the Air’s entry-level 128 GB SSD are only slightly lower than the MacBook Pro’s, however write performance is abysmal in comparison. It performed surprisingly well in the 4k tests, though. For a simple internet and office notebook, the 128 GB SSD should suffice. Or, rather, has to suffice, because the upgrade to the next tier SSD (256 GB) will set you back a whopping $200. A hefty price tag, given that a 500 GB Samsung 960 EVO SSD only costs $220, and outperforms Apple’s SSD to boot. Apples and Oranges though, because as we all know you cannot install an m.2 SSD in Apple’s laptops. Still, it serves to highlight Apple’s highly questionable upgrade policy and prices.
| Apple MacBook Air 13.3" 1.8 GHz (2017) Apple SSD SM0128G | Apple MacBook Pro 13 2017 Touchbar i5 Apple SSD AP0256 | Apple MacBook Pro 15 2017 (2.8 GHz, 555) Apple SSD SM0256L | Apple MacBook 12 2017 Apple SSD AP0256 | Dell XPS 13 9360 FHD i7 Iris Toshiba XG4 NVMe (THNSN5512GPUK) | Asus Zenbook UX3430UQ-GV012T SanDisk SD8SN8U512G1002 | |
|---|---|---|---|---|---|---|
| CrystalDiskMark 3.0 | 19% | 35% | -5% | 73% | -3% | |
| Read Seq (MB/s) | 1390 | 1540 11% | 1557 12% | 955 -31% | 1314 -5% | 500 -64% |
| Write Seq (MB/s) | 731 | 1353 85% | 1505 106% | 899 23% | 617 -16% | 457.4 -37% |
| Read 512 (MB/s) | 899 | 926 3% | 968 8% | 658 -27% | 1058 18% | 345.6 -62% |
| Write 512 (MB/s) | 715 | 698 -2% | 1124 57% | 579 -19% | 502 -30% | 415 -42% |
| Read 4k (MB/s) | 16.29 | 9.92 -39% | 10.76 -34% | 9.721 -40% | 37.31 129% | 28.34 74% |
| Write 4k (MB/s) | 27.17 | 10.74 -60% | 12.87 -53% | 12.78 -53% | 133.6 392% | 56.8 109% |
| Read 4k QD32 (MB/s) | 300.9 | 618 105% | 631 110% | 521 73% | 425.1 41% | 311.3 3% |
| Write 4k QD32 (MB/s) | 273.7 | 403.8 48% | 468.4 71% | 370.1 35% | 431.3 58% | 251.1 -8% |

Graphics Card
In order to determine the Air’s GPU performance, we have decided to run our regular 3DMark benchmarks under Windows via Bootcamp. We had to manually update Intel’s drivers prior to running the tests. Compared to the i7-powered 2015 Air, the new 2017 Air performed slightly better despite the fact that it still features the exact same GPU. Intel’s current Kaby Lake HD Graphics 620 was only slightly faster, and both got hammered by the Pro’s Iris Plus Graphics 650 GPU. The MacBook Pro 15 features a dedicated GPU, and therefore offers even more graphics power.
| 3DMark 11 Performance | 1591 points | |
| 3DMark Cloud Gate Standard Score | 5878 points | |
Help | ||
Gaming Performance
Running some older PC games once again proved that the Air’s GPU performance has not really improved significantly over the last few years. Older Windows games will only run smoothly on the lowest details. The only halfway suitable gaming laptop made by Apple would be the MacBook Pro 15, with its dedicated Radeon Pro 555 GPU that performed about as well as a GTX 950M, and only slightly worse than the newer MX150 (GT 1030). All in all, these are still only mid-range GPUs, and do not stand a chance against a current gaming GPU, such as the GeForce GTX 1060. Apple and gaming – not a smart move.
| low | med. | high | ultra | |
|---|---|---|---|---|
| BioShock Infinite (2013) | 42.9 | 26.4 |
Emissions – Mostly Quiet and Cool
System Noise
Apple and low system noise, on the other hand, go together very well. Using iStat Menus, we found the fan to be running at a low 1200 RPM when idle or under low to medium load. It was completely inaudible, though, and even our microphones failed to detect any noise. Running office applications and browsing the web is thus once again a completely silent experience. Only after prolonged periods of high load, such as running games, does the fan finally kick in. Overall, it remains very quiet, and when using the MacBook Air 13 as intended by Apple it remains completely silent. That said, we found absolutely no difference between the current and the 2015 model of the MacBook Air in terms of noise.

Temperature
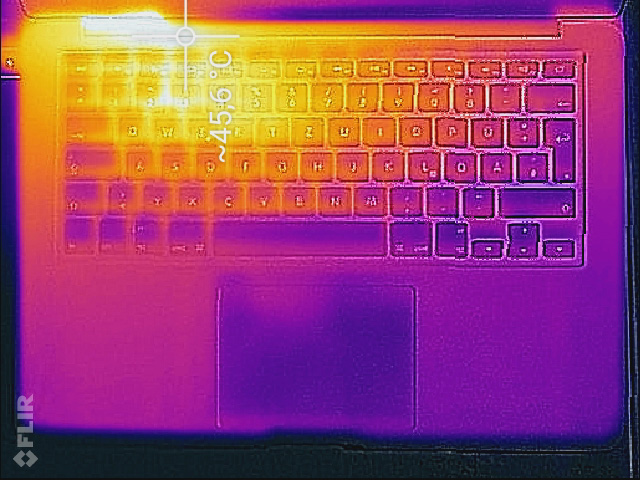
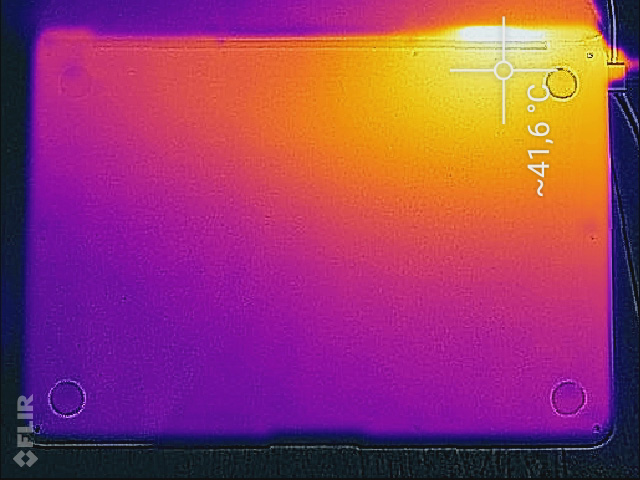
The same was true for temperatures. We did not expect the newer model to behave any differently from the older one, and we were right. Under medium load, the case remained comfortably cool. Only after a prolonged period of high load did it warm up significantly around the rear parts of the keyboard close to the hinges.
(±) The maximum temperature on the upper side is 42.8 °C / 109 F, compared to the average of 35.9 °C / 97 F, ranging from 21.4 to 59 °C for the class Subnotebook.
(±) The bottom heats up to a maximum of 41.5 °C / 107 F, compared to the average of 39.2 °C / 103 F
(+) In idle usage, the average temperature for the upper side is 26.3 °C / 79 F, compared to the device average of 30.8 °C / 87 F.
(+) The palmrests and touchpad are cooler than skin temperature with a maximum of 31.2 °C / 88.2 F and are therefore cool to the touch.
(-) The average temperature of the palmrest area of similar devices was 28.2 °C / 82.8 F (-3 °C / -5.4 F).
Speakers
Back in 2015, we were not testing a notebook’s speakers as thoroughly as we do today, and we can now finally make up for that. Unfortunately, when compared to the smaller MacBook 12, the Air did not perform very well. Mids and highs are much more pronounced on the MacBook 12, and so are lows (bass) to a lesser degree. Nevertheless, the speakers were not half bad and are okay for listening to music in mostly quiet environments. Its maximum noise level of 78 dB(A) places it mid-field among its competitors.
Apple MacBook Air 13.3" 1.8 GHz (2017) audio analysis
(±) | speaker loudness is average but good (77.7 dB)
Bass 100 - 315 Hz
(±) | reduced bass - on average 9.2% lower than median
(±) | linearity of bass is average (11% delta to prev. frequency)
Mids 400 - 2000 Hz
(+) | balanced mids - only 3.6% away from median
(±) | linearity of mids is average (9.7% delta to prev. frequency)
Highs 2 - 16 kHz
(±) | higher highs - on average 5.2% higher than median
(±) | linearity of highs is average (8.4% delta to prev. frequency)
Overall 100 - 16.000 Hz
(±) | linearity of overall sound is average (15.1% difference to median)
Compared to same class
» 33% of all tested devices in this class were better, 5% similar, 62% worse
» The best had a delta of 5%, average was 18%, worst was 53%
Compared to all devices tested
» 21% of all tested devices were better, 4% similar, 75% worse
» The best had a delta of 4%, average was 24%, worst was 134%
Apple MacBook 12 (Early 2016) 1.1 GHz audio analysis
(+) | speakers can play relatively loud (83.6 dB)
Bass 100 - 315 Hz
(±) | reduced bass - on average 11.3% lower than median
(±) | linearity of bass is average (14.2% delta to prev. frequency)
Mids 400 - 2000 Hz
(+) | balanced mids - only 2.4% away from median
(+) | mids are linear (5.5% delta to prev. frequency)
Highs 2 - 16 kHz
(+) | balanced highs - only 2% away from median
(+) | highs are linear (4.5% delta to prev. frequency)
Overall 100 - 16.000 Hz
(+) | overall sound is linear (10.2% difference to median)
Compared to same class
» 7% of all tested devices in this class were better, 2% similar, 91% worse
» The best had a delta of 5%, average was 18%, worst was 53%
Compared to all devices tested
» 5% of all tested devices were better, 1% similar, 94% worse
» The best had a delta of 4%, average was 24%, worst was 134%
Frequency Diagram (checkboxes selectable/deselectable!)
Energy Management - Big Battery, Low Consumption
Power Consumption
Once again, the 2017 i5-model performed very similar to the previously tested 2015 i7-model. Not only has its extra 200 MHz bumped the performance, but also increased power consumption, which has made it ever so slightly less power efficient than the previous i7-model. It is feasible, however, that a more draconic selection process on Intel’s part is at least partly responsible for the i7’s slightly higher energy efficiency.
| Off / Standby | |
| Idle | |
| Load |
|
Key:
min: | |
| Apple MacBook Air 13.3" 1.8 GHz (2017) 5350U, HD Graphics 6000, Apple SSD SM0128G, TN LED, 1440x900, 13.3" | Apple MacBook Pro 15 2017 (2.8 GHz, 555) i7-7700HQ, Radeon Pro 555, Apple SSD SM0256L, IPS, 2880x1800, 15.4" | Apple MacBook 12 (Early 2016) 1.1 GHz 6Y30, HD Graphics 515, Apple SSD AP0256, IPS, 2304x1440, 12" | Apple MacBook Air 13 inch 2015-03 5650U, HD Graphics 6000, Apple SSD SD0256F, TN LED, 1440x900, 13.3" | Apple MacBook 12 2017 m3-7Y32, HD Graphics 615, Apple SSD AP0256, LED IPS, 2304x1440, 12" | Apple MacBook 12 (Early 2016) 1.3 GHz 6Y75, HD Graphics 515, Apple SSD AP0256, IPS, 2304x1440, 12" | Apple MacBook Pro 13 2017 Touchbar i5 i5-7267U, Iris Plus Graphics 650, Apple SSD AP0256, IPS, 2560x1600, 13.3" | |
|---|---|---|---|---|---|---|---|
| Power Consumption | -100% | 32% | 12% | 29% | 36% | -45% | |
| Idle Minimum * (Watt) | 3.4 | 3.4 -0% | 2.7 21% | 2.7 21% | 2 41% | 2 41% | 2.8 18% |
| Idle Average * (Watt) | 6.3 | 13.9 -121% | 2.7 57% | 5.7 10% | 5.4 14% | 2.06 67% | 10.9 -73% |
| Idle Maximum * (Watt) | 7 | 17.6 -151% | 7.2 -3% | 6 14% | 6.6 6% | 6.94 1% | 11.4 -63% |
| Load Average * (Watt) | 34.5 | 71.1 -106% | 22 36% | 32.1 7% | 22 36% | 22.52 35% | 55.4 -61% |
| Load Maximum * (Watt) | 40 | 88.5 -121% | 20.5 49% | 36.2 9% | 20 50% | 24.87 38% | 57.5 -44% |
| Witcher 3 ultra * (Watt) | 57.9 |
* ... smaller is better
Battery Life
We ran our real-world Wi-Fi test of at 150 nits display brightness with the 2017 model, and it lasted almost 20 minutes longer than its 2015 predecessor. Thus, you can expect to be able to browse the web for more than 10 consecutive hours, something the MacBook Pro 13 fails at, and even the MacBook 12 ran out of juice almost 100 minutes before the new MacBook Air.
| Apple MacBook Air 13.3" 1.8 GHz (2017) 5350U, HD Graphics 6000, 54 Wh | Apple MacBook Pro 13 2017 Touchbar i5 i5-7267U, Iris Plus Graphics 650, 49.2 Wh | Apple MacBook 12 (Early 2016) 1.3 GHz 6Y75, HD Graphics 515, 41.4 Wh | Apple MacBook 12 2017 m3-7Y32, HD Graphics 615, 41.4 Wh | Apple MacBook Pro 13 2016 (2.9 GHz) 6267U, Iris Graphics 550, 49.2 Wh | Apple MacBook Air 13 inch 2015-03 5650U, HD Graphics 6000, 54 Wh | Apple MacBook Pro 15 2017 (2.8 GHz, 555) i7-7700HQ, Radeon Pro 555, 76 Wh | |
|---|---|---|---|---|---|---|---|
| Battery runtime | -18% | -13% | -15% | -11% | -3% | 1% | |
| WiFi v1.3 (h) | 10.6 | 8.7 -18% | 9.2 -13% | 9 -15% | 9.4 -11% | 10.3 -3% | 10.7 1% |
| H.264 (h) | 6.9 | 10.3 | 8.1 | 8.5 | |||
| Load (h) | 1.2 | 3.5 | 1.1 | 1.6 | 1 | ||
| Reader / Idle (h) | 26.2 | ||||||
| Witcher 3 ultra (h) | 1.5 |
Verdict - Olden but Golden.
Pros
Cons
Years go by, yet the MacBook Air remains unchanged year after year after year. The most significant changes in notebook design of the last few years, such as higher display resolutions, thinner bezels, and larger displays in similarly sized cases, have all gone unnoticed by the Air. Accordingly, it did not surprise us that unlike the MacBook 12’s updates, Apple has decided to perform the Air’s updates on the quiet. Apparently, the MacBook Air is not deemed “presentable” anymore, and somehow it does not really fit into Apple’s current portfolio.
The biggest issue we have with the new MacBook Air 13 is its display. With its low-resolution TN panel, it certainly feels very outdated overall. In 2017, our expectations of a $1000 notebook include an IPS panel with at least FHD resolution. Its price tag of $999 for the 128 GB base model is quite hefty, and the extra $200 that Apple charges for a 256 GB SSD instead is, quite frankly, daylight robbery.
Nevertheless, even after all these years the Air’s basic concept still shines through all this gloom and dust. A very well-built and high-quality aluminum case combined with decent input devices; more than decent Wi-Fi performance; overall very good system performance that is well suited for its intended use scenarios; more than 10 hours of battery life; and last but not least a dead silent user experience. Even in 2017, all these aspects are worthy of praise.
With each year passing by, the Air’s high price is getting harder and harder to justify. Still, all things considered the MacBook Air 13 2017 is still a very decent notebook. Mind you, it is the entry-level model for entering the Apple universe, and therefore the cheapest alternative if you prefer MacOS to Windows. And while it is highly unlikely that the MacBook Air is going to get yet another update in 2018, Apple has managed to surprise us quite often already …
Apple MacBook Air 13.3" 1.8 GHz (2017)
- 06/20/2017 v6 (old)
J. Simon Leitner
Price comparison

