Apple MacBook Pro 15 2017 (2.8 GHz, 555) Laptop Review
For the original German review, see here.
Apple announced an update for the MacBook Pro 15 at this year's WWDC in June. The Skylake processors were still up to date when the previous model launched last autumn, but the competition started shipping models with new and faster Kaby Lake chips soon after that. Apple now reacts with an unusually early update after just 8 months – we originally expected an update this autumn.
Besides the new processors, Apple now also ships slightly more powerful GPUs by default. The entry-level spec is equipped with the AMD Radeon Pro 555, which is the direct (and basically similarly powerful) successor to the old Radeon Pro 455. There is no successor to the Radeon Pro 450, but there is an option for the more powerful Radeon Pro 560. Apple once again uses up to 16 GB of LPDDR3-RAM (2133 MHz), but the maximum SSD storage has been doubled to 2 TB.
The following table shows Apple's current line-up for the 15-inch MacBook Pro. Unlike the smaller 13-inch system, the manufacturer still sells the old MacBook Pro Retina 15 with the 2015 design.
| MacBook Pro 15 Mid 2017 | MacBook Pro 15 Mid 2017 | MacBook Pro 15 (old model) | |
| Processor | Core i7 2.8 GHz (Kaby Lake, 45 W) Core i7 3.1 GHz (Kaby Lake, 45 W) |
Core i7 2.9 GHz (Kaby Lake, 45 W) Core i7 3.1 GHz (Kaby Lake, 45 W) |
Core i7 2.2 GHz (Haswell, 45 W) Core i7 2.5 GHz (Haswell, 45 W) Core i7 2.8 GHz (Haswell, 45 W) |
| GPU | AMD Radeon Pro 555 AMD Radeon Pro 560 |
AMD Radeon Pro 560 | Intel Iris Pro Graphics |
| RAM | 16 GB LPDDR3-2133 | 16 GB LPDDR3-2133 | 16 GB DDR3L-1600 |
| SSD | 256 GB / 512 GB / 1 TB / 2 TB | 512 GB / 1 TB / 2 TB | 256 GB / 512 GB / 1 TB |
| Display | 15.4 inch IPS 2880x1800 pixels | 15.4 inch IPS 2880x1800 pixels | 15.4 inch IPS 2880x1800 pixels |
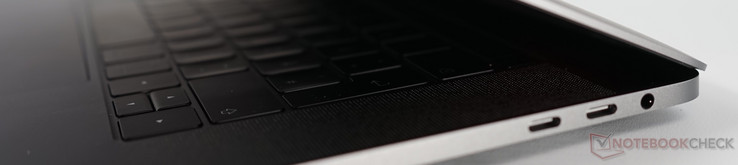
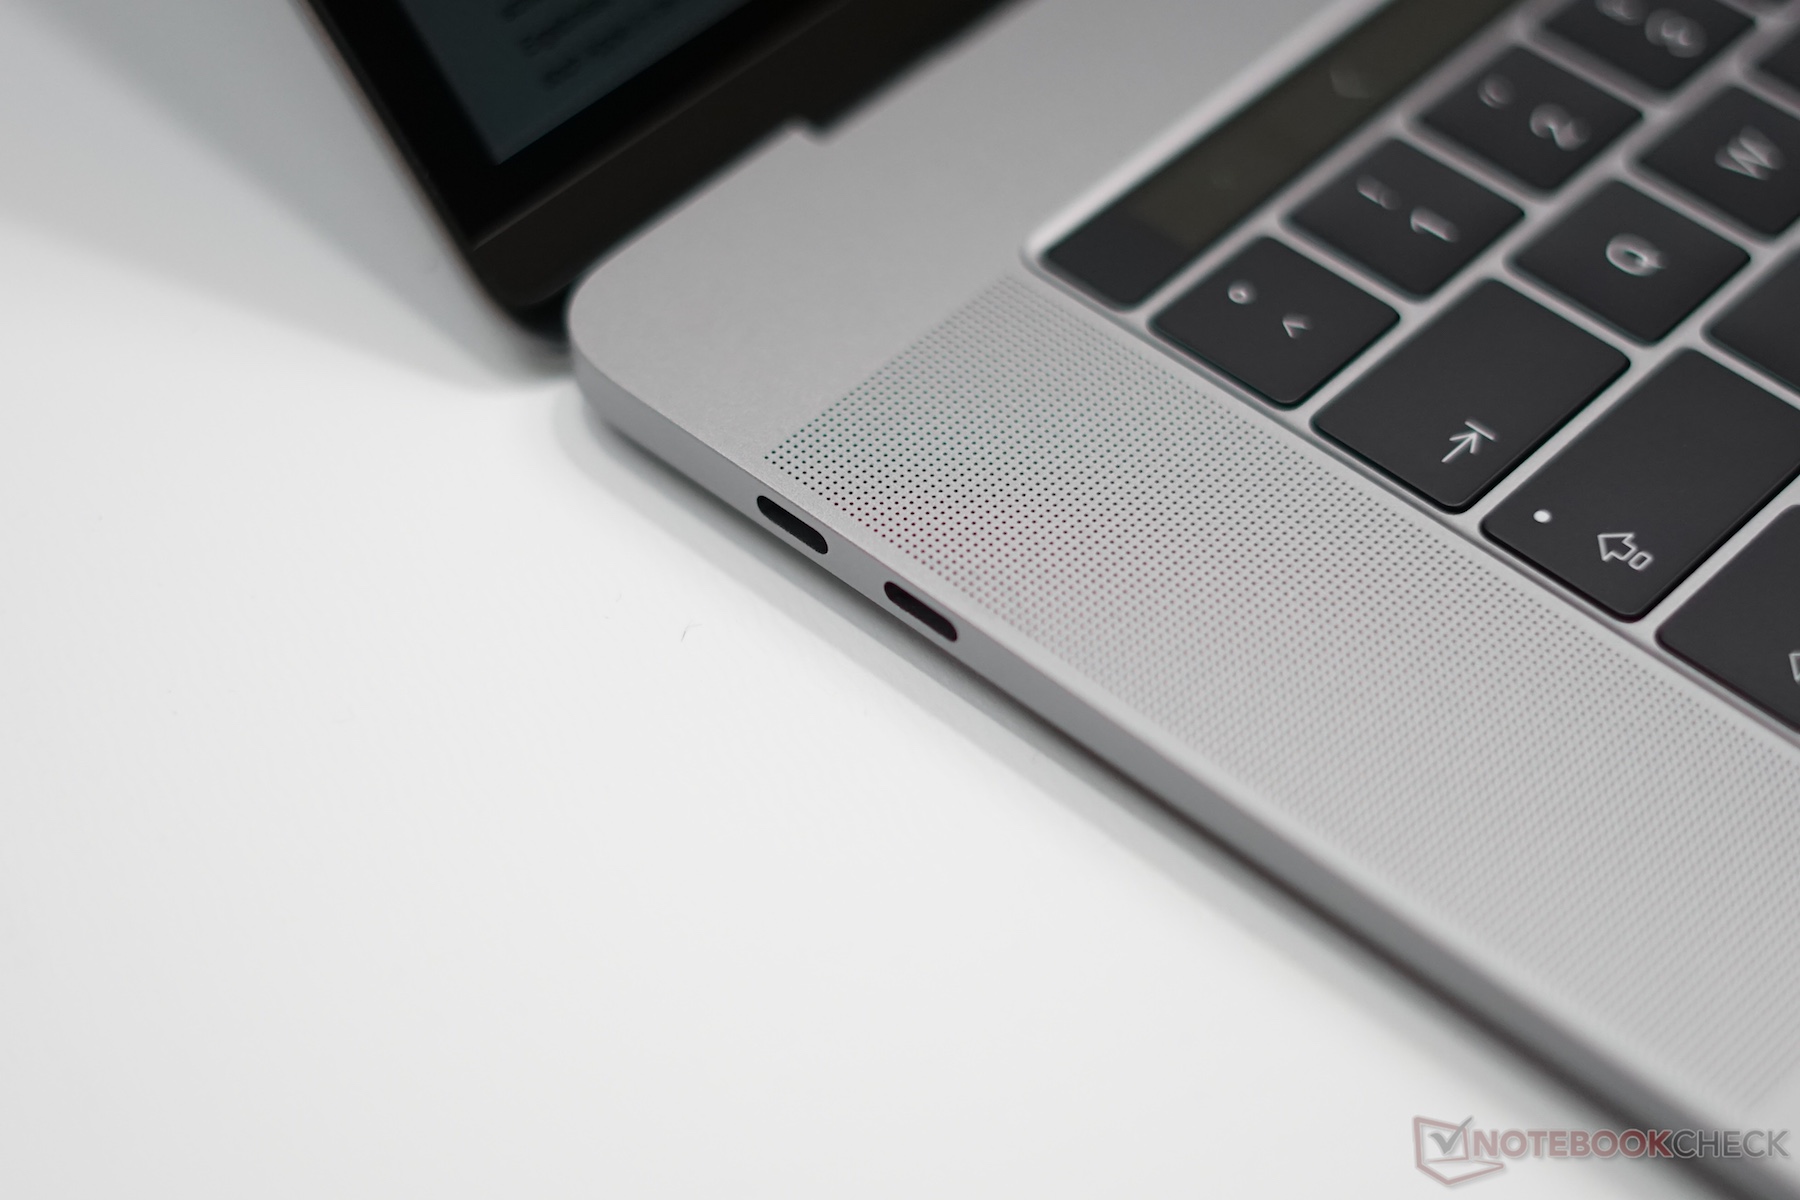
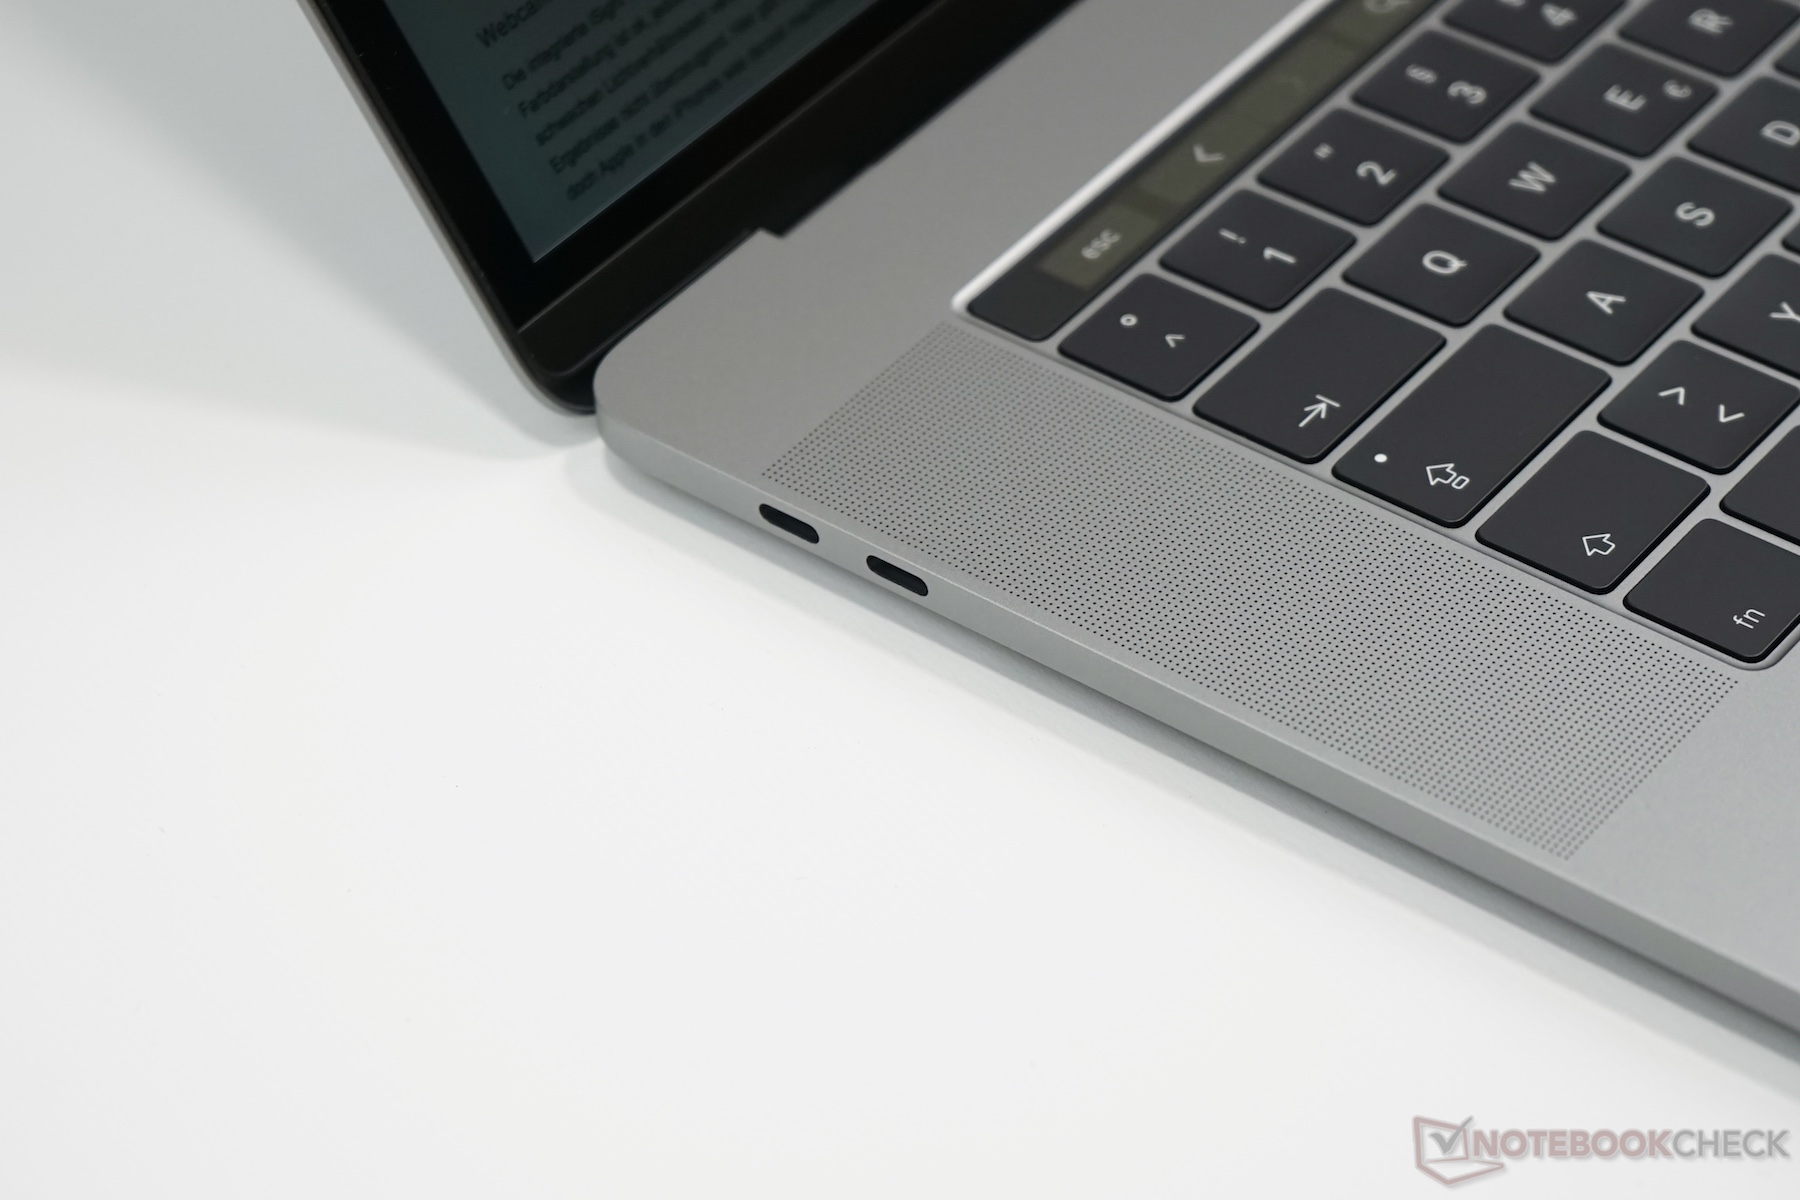
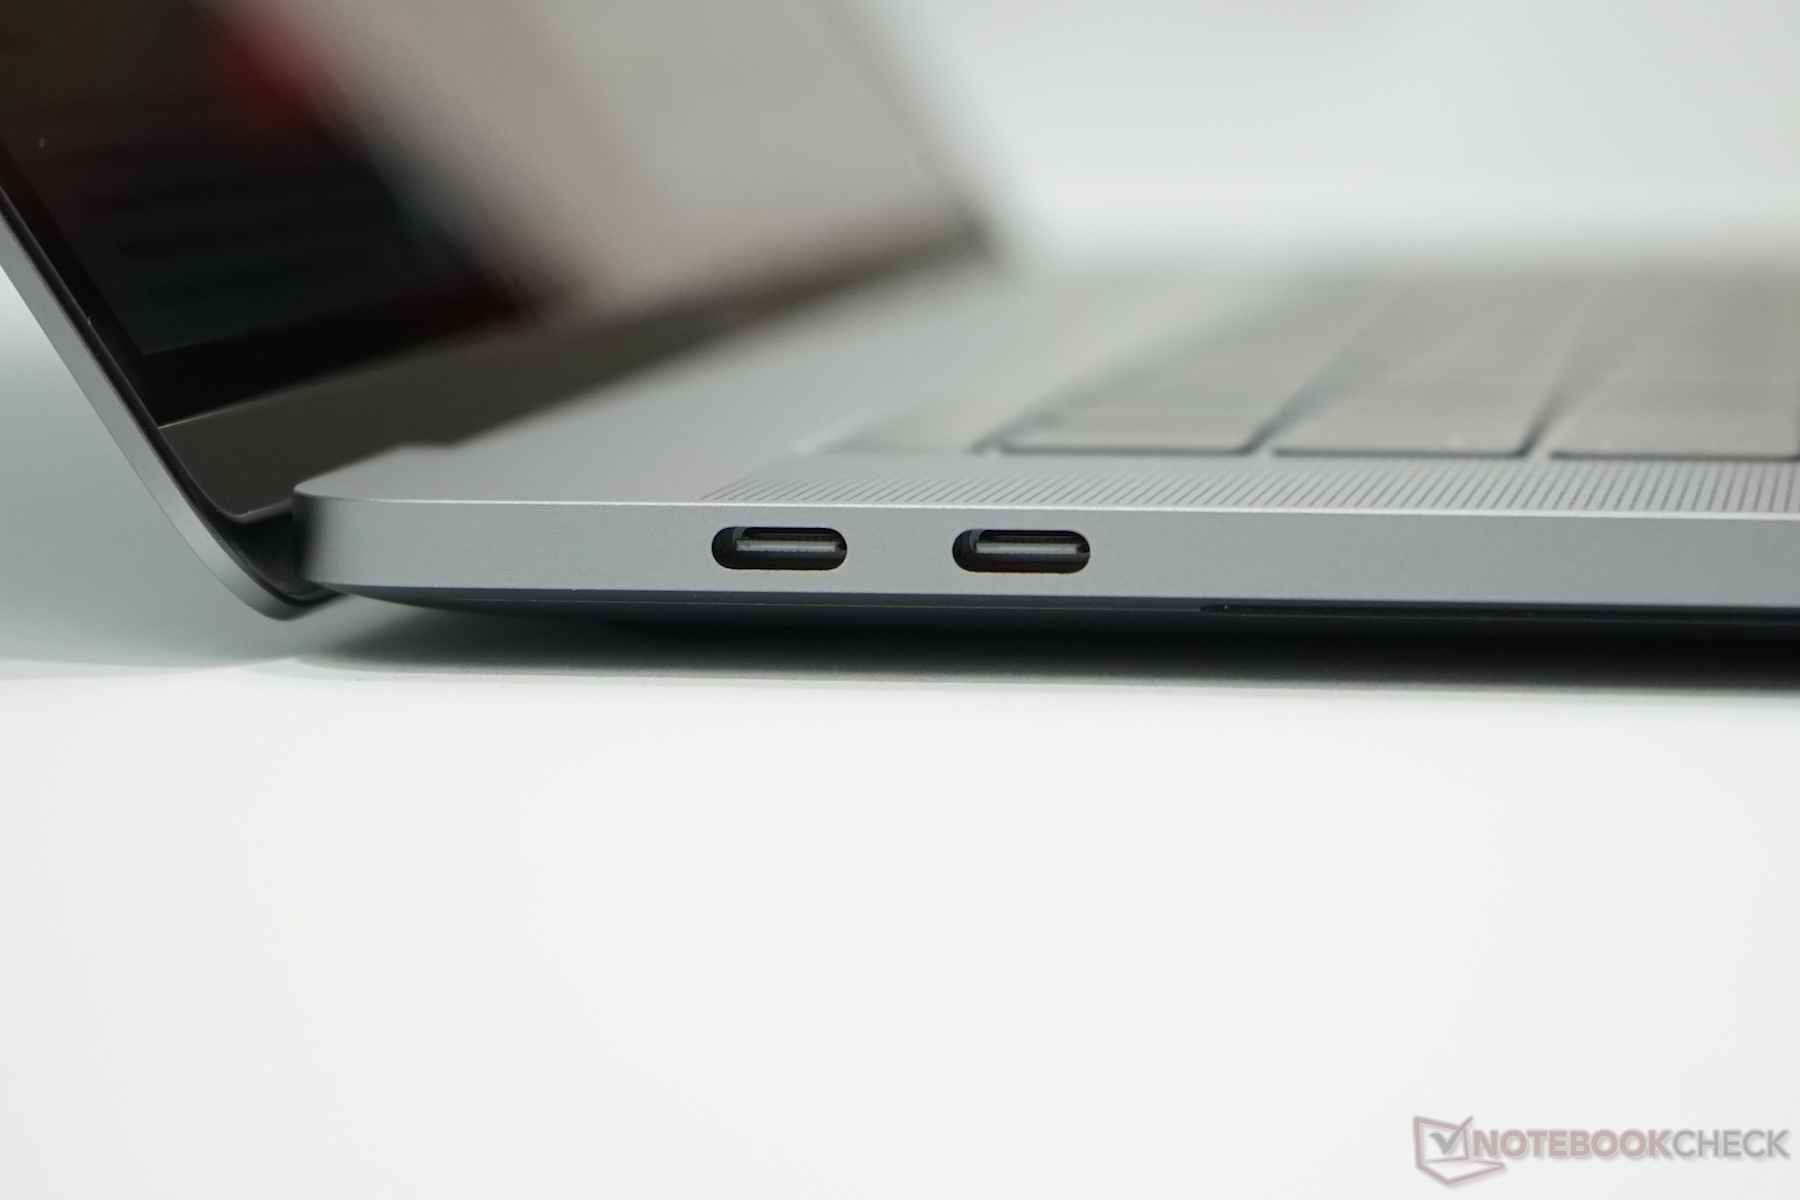
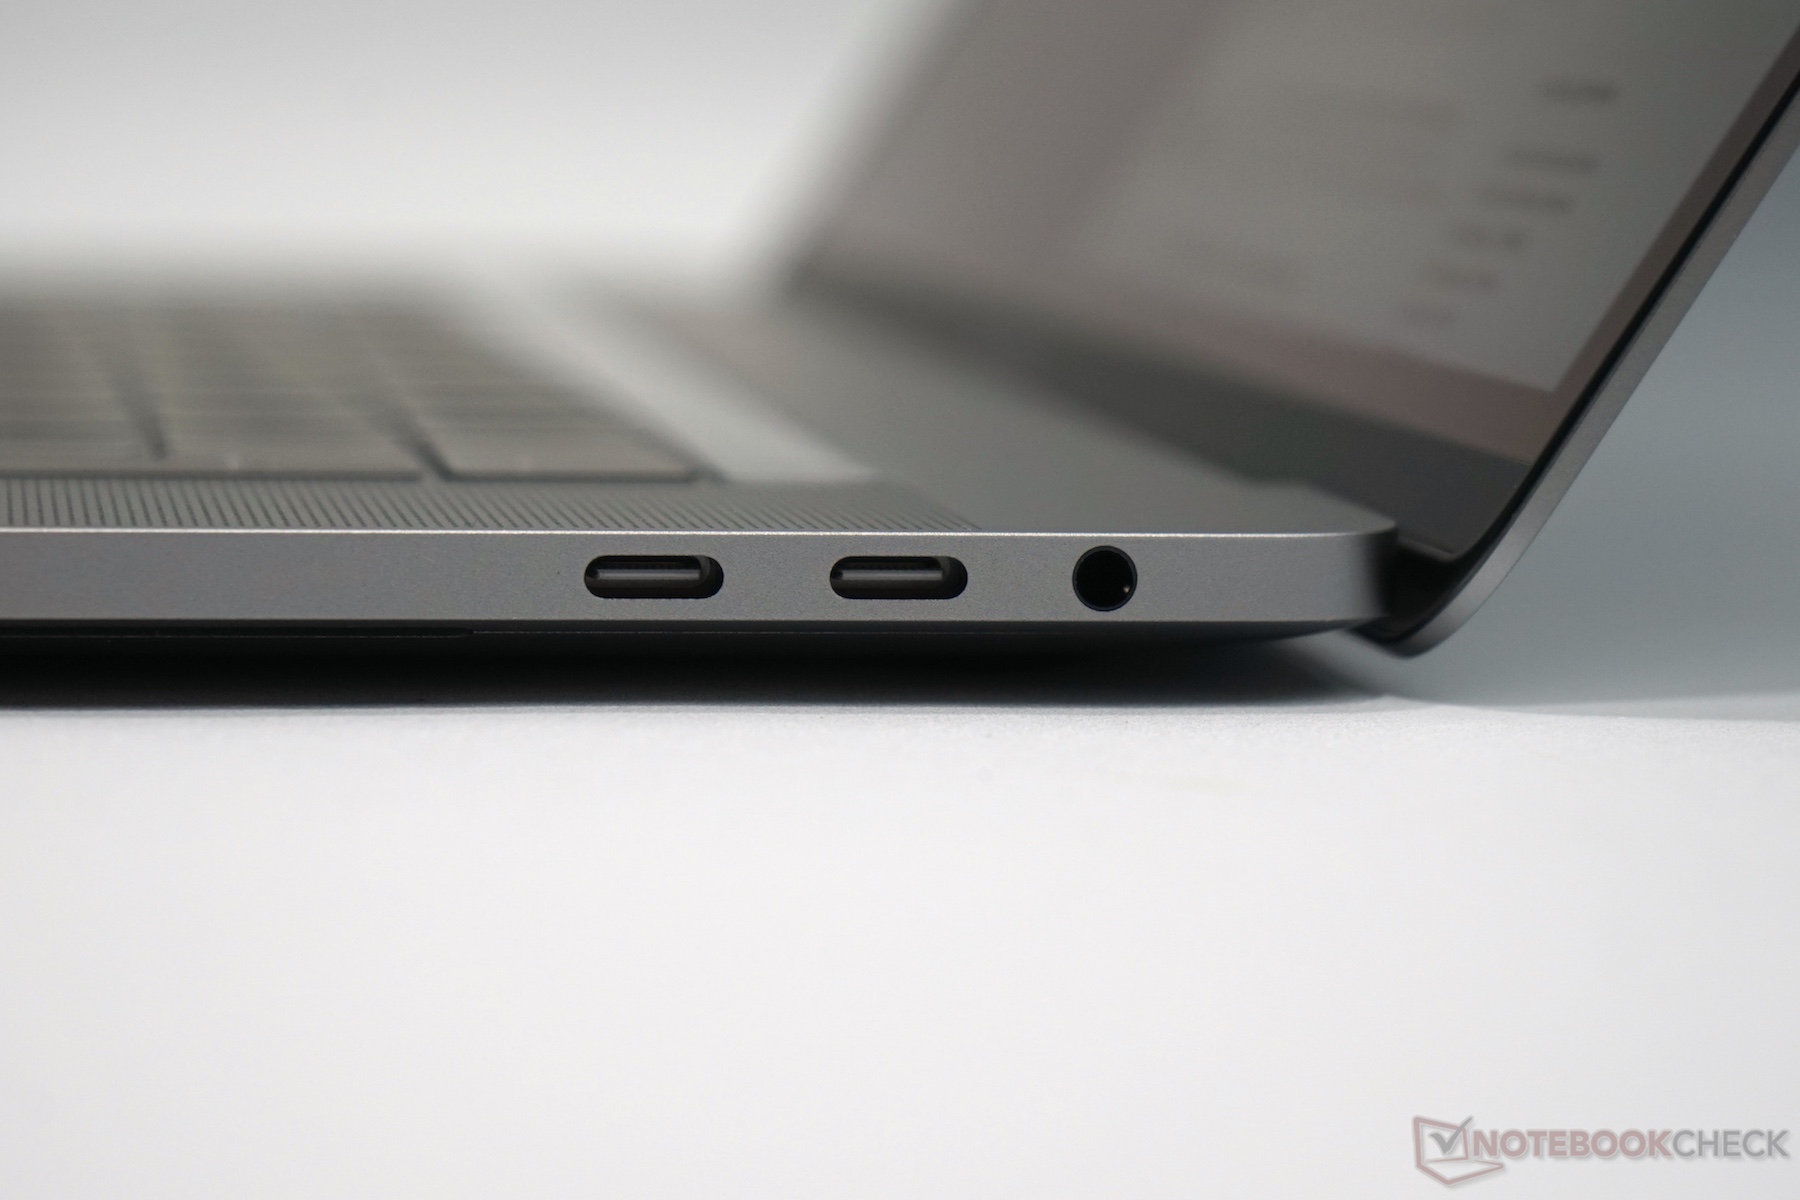
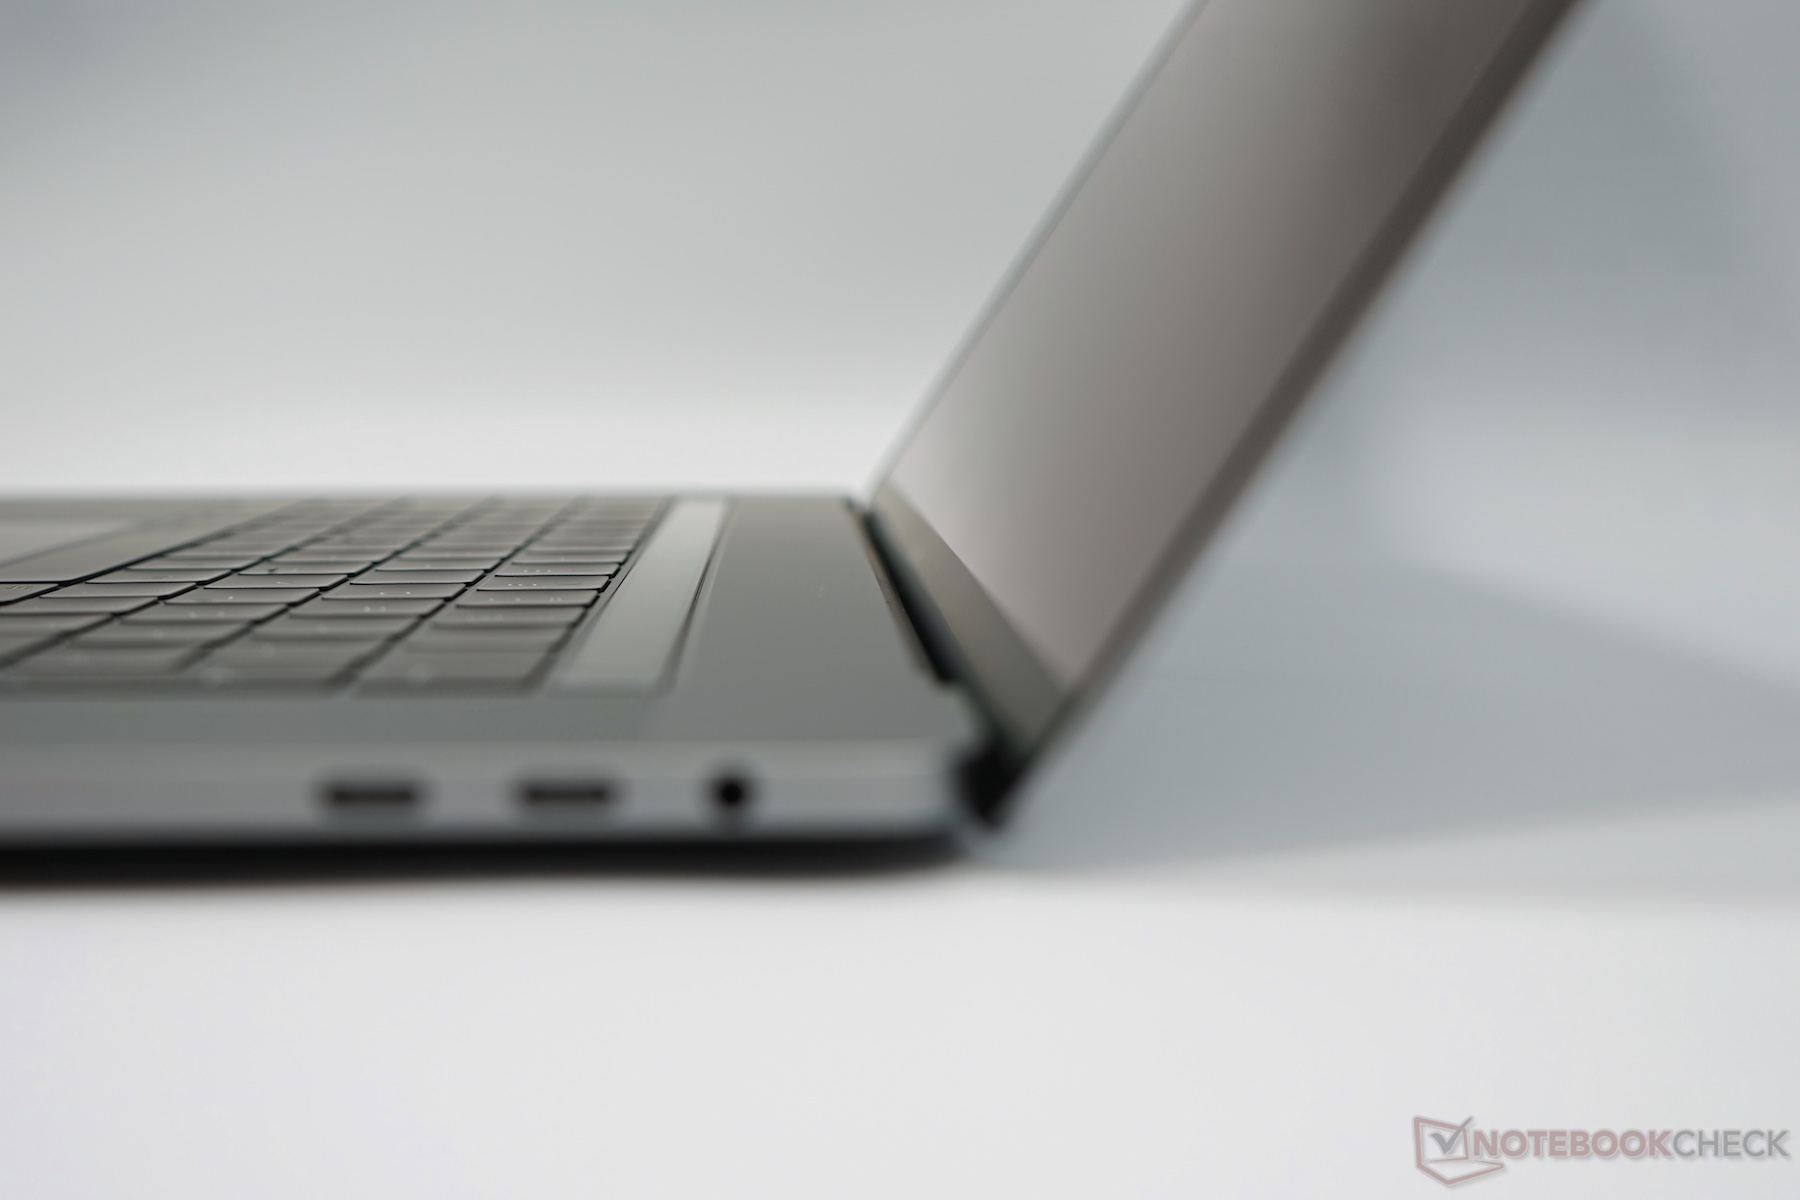
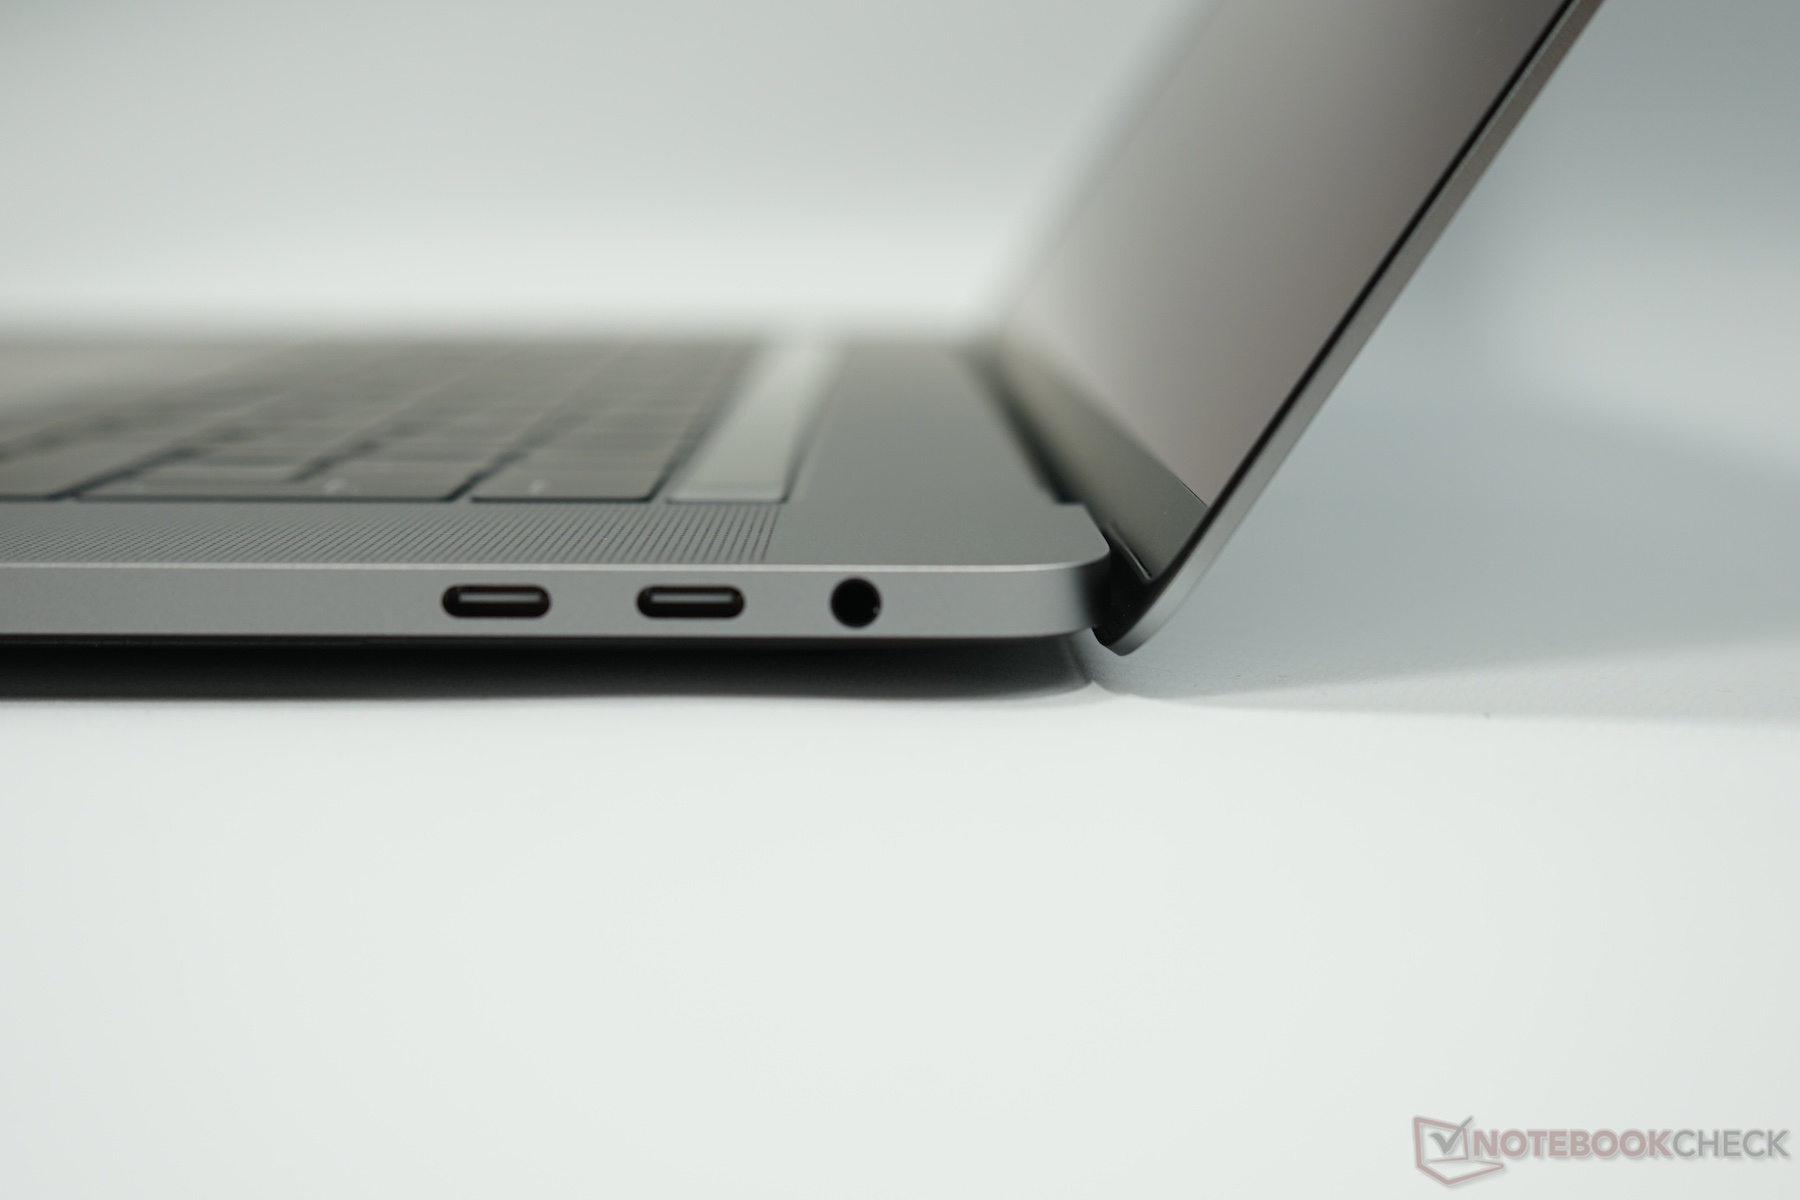
| Ports | 4x Thunderbolt 3 with USB-C 3.5 mm Headset |
4x Thunderbolt 3 with USB-C 3.5 mm Headset |
2x Thunderbolt 2 2x USB 3.0 MagSafe HDMI SD-card reader 3.5 mm Headset |
| Price | starting at $2399 | starting at $2799 | starting at $1999 |
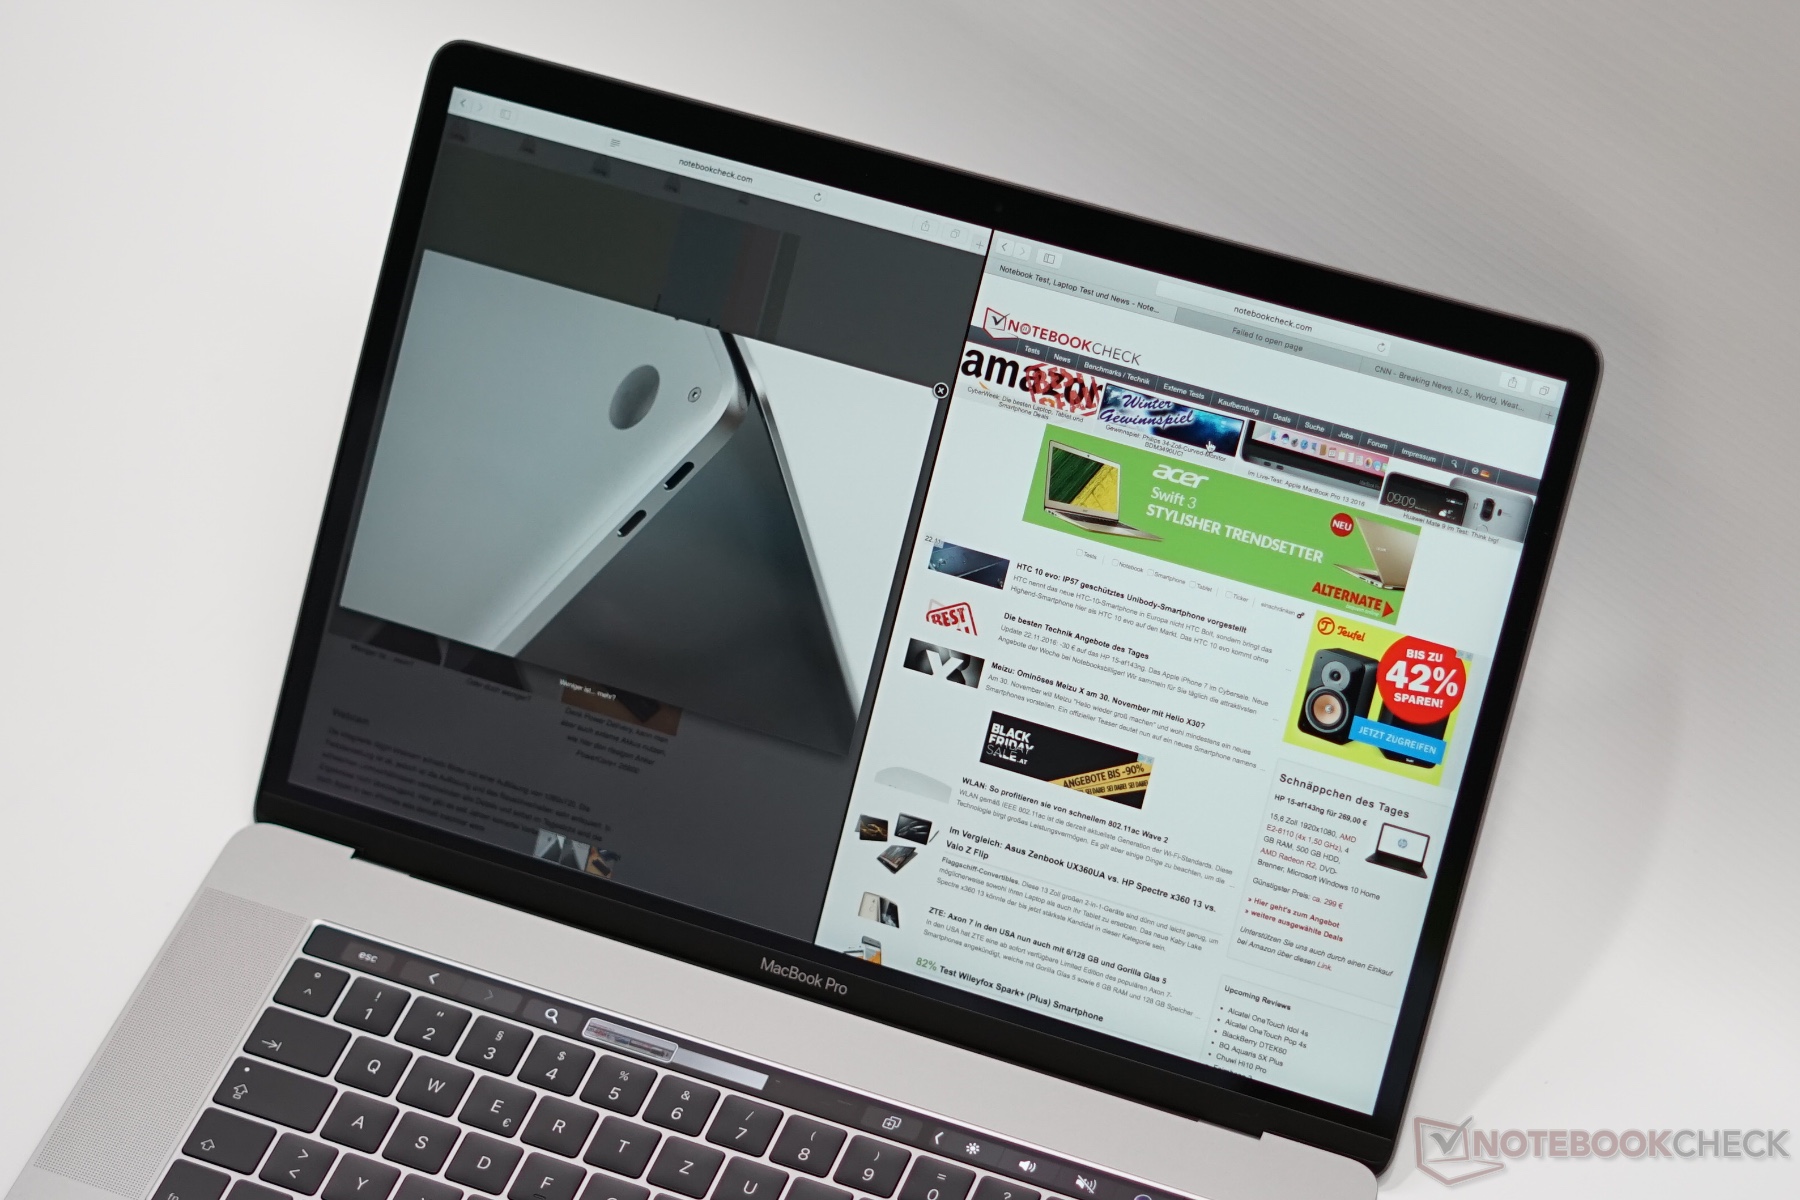
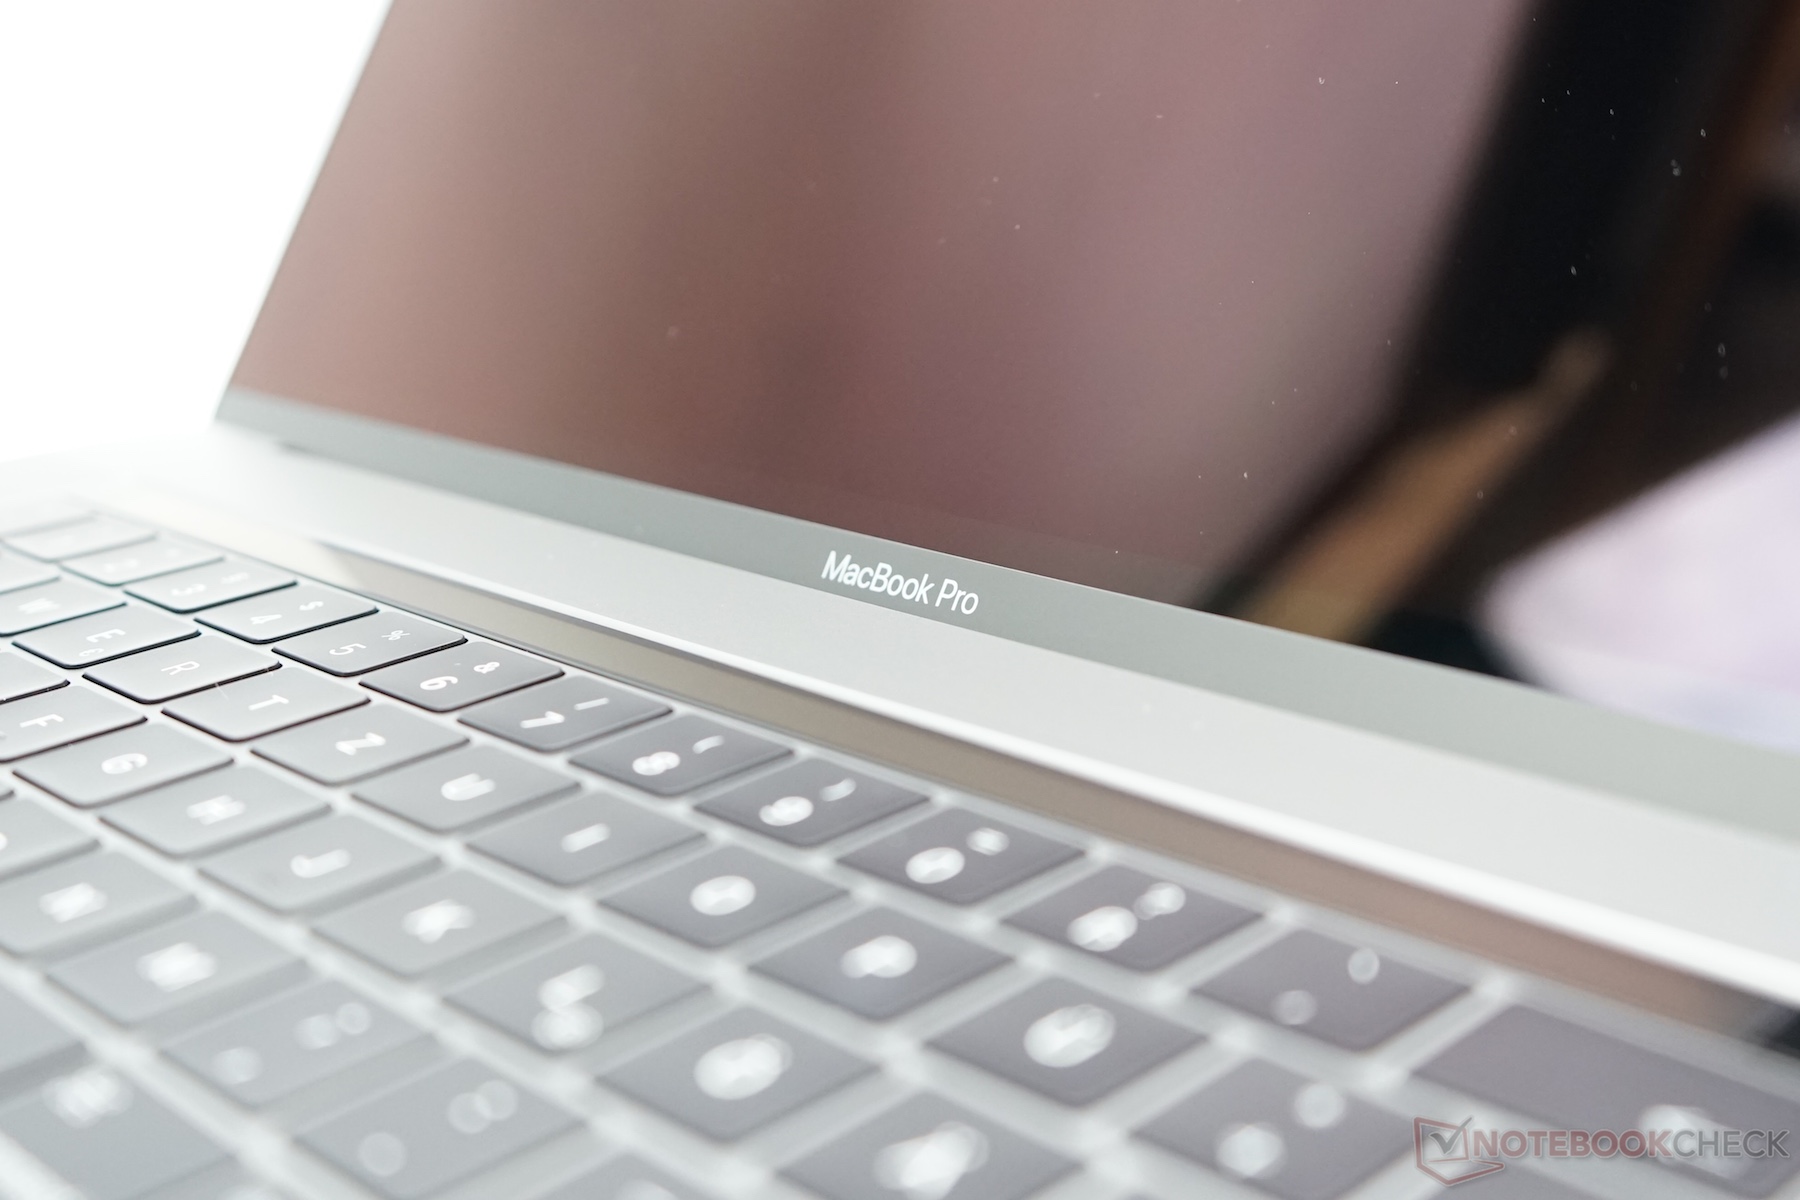
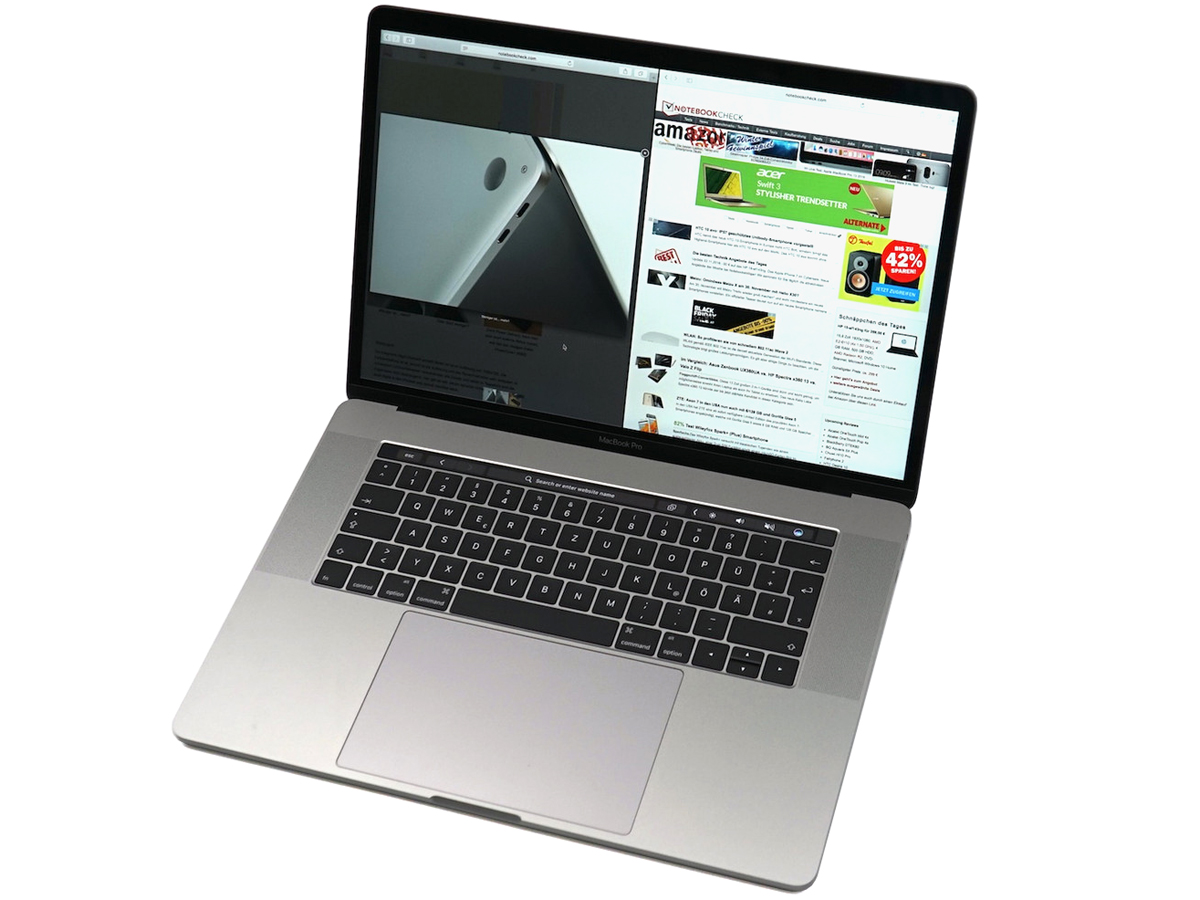
We purchased the test model from Apple's online store. It is the entry-level model with the Intel Core i7-7700HQ, 16 GB of RAM, 256 GB SSD storage as well as the AMD Radeon Pro 555 for $2399. Not a lot has changed except for the small performance bump, so we will not cover all the test sections once again. The corresponding information is available in our reviews of the 2016 models. The following pictures were also taken from the 2016 MacBook Pro 15 review.


Communication
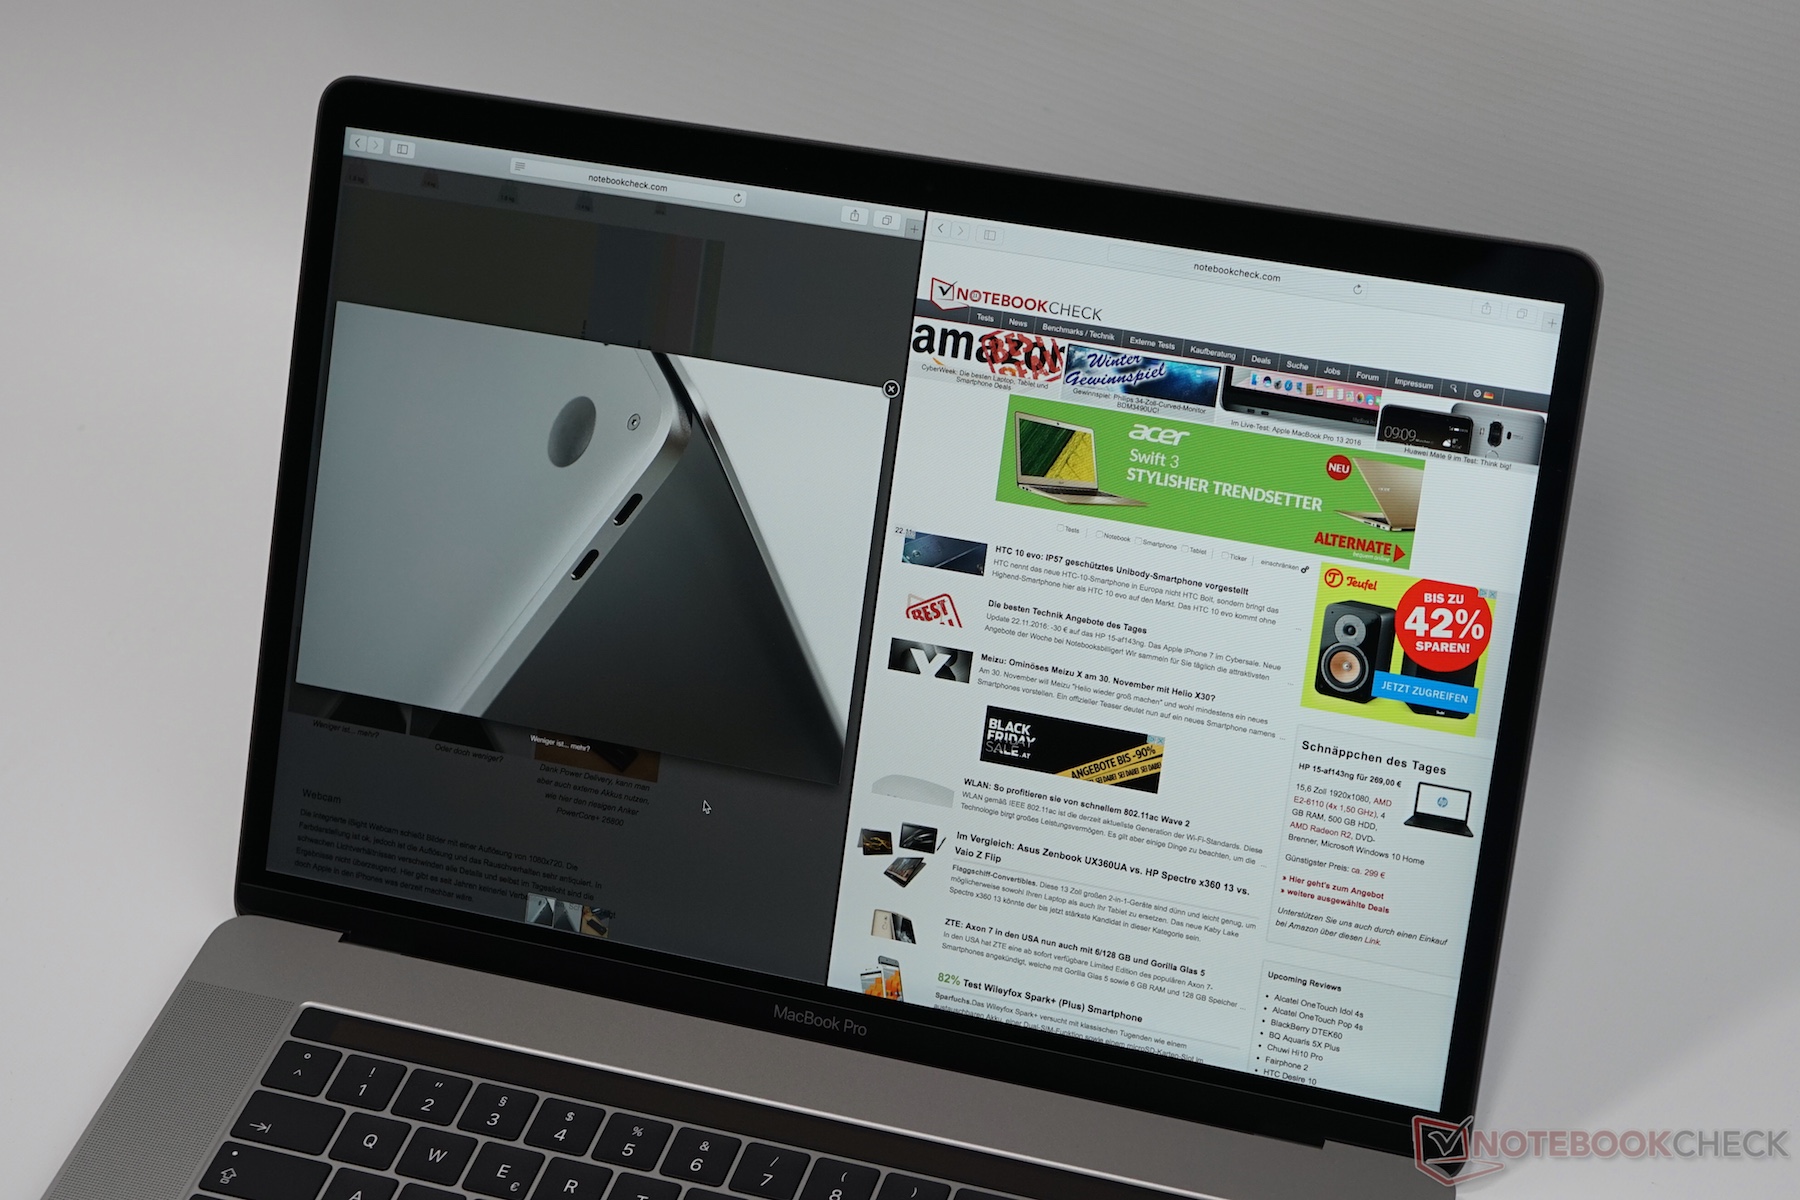
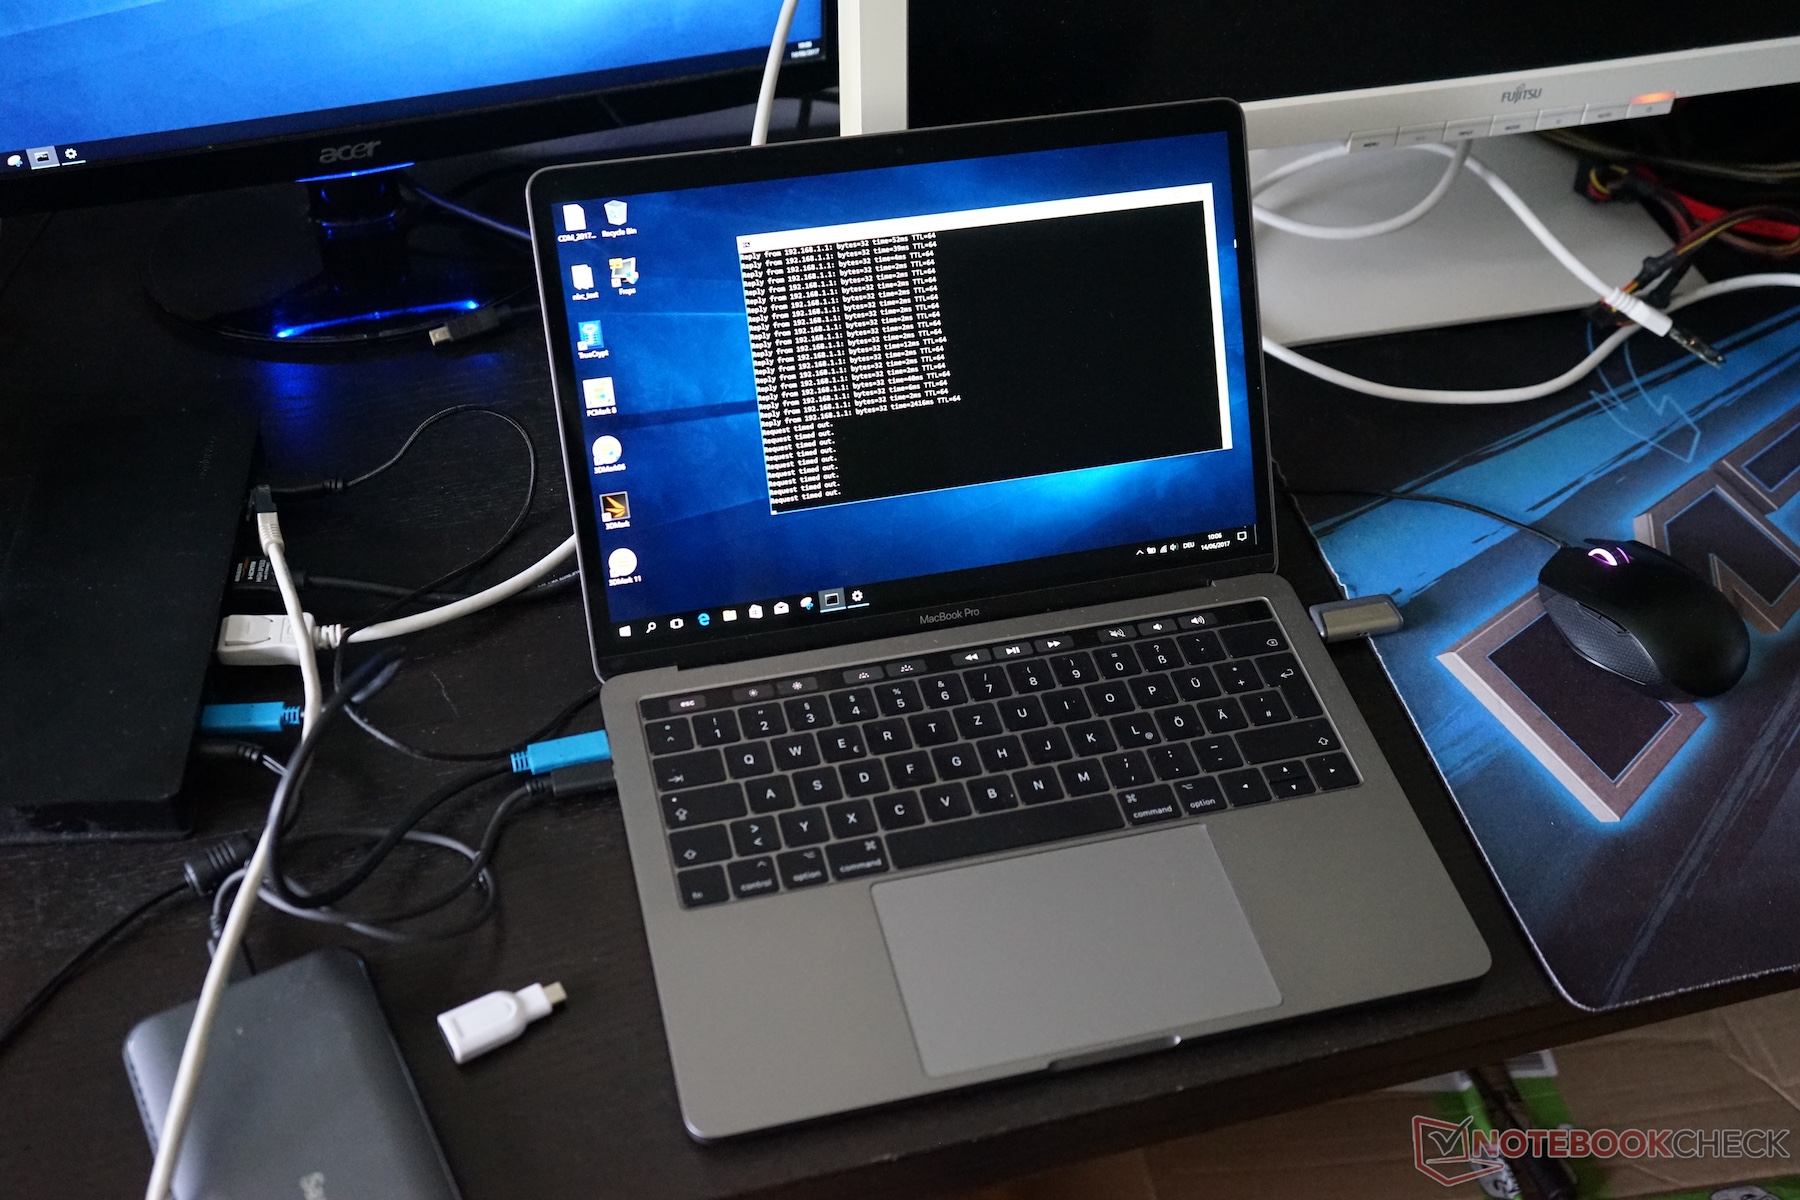
The transfer rates of the MacBook Pro 15 Bar are once again excellent. However, we can still notice the Wi-Fi problem with 2.4 GHz networks when USB-C devices are attached – similar to the smaller 13-inch model. However, the issue was limited to certain constellations. We noticed connection problems with the Anker Premium USB-C Hub, for example, as well as a maximum configuration with Kensington USB-C Hub, SanDisk 900 USB-C SSD, DisplayPort monitor, USB thumb drive, and other peripherals running Windows (Bootcamp). However, we could not always reproduce the problem, and both the Kensington hub as well as the USB-C SSD worked without problems. The Razer Stealth (Kaby Lake) is not affected. The latter does not support Power Delivery via USB-C though, so this might be the issue.
| Networking | |
| iperf3 transmit AX12 | |
| Apple MacBook Pro 13 2016 (2.9 GHz) | |
| Apple MacBook Pro 15 2017 (2.8 GHz, 555) | |
| Dell XPS 13 9360 QHD+ i5 | |
| Apple MacBook Pro 13 2016 (Klaus I211) | |
| Dell XPS 13 9360 FHD i7 Iris | |
| iperf3 receive AX12 | |
| Apple MacBook Pro 13 2016 (2.9 GHz) | |
| Apple MacBook Pro 15 2017 (2.8 GHz, 555) | |
| Apple MacBook Pro 13 2016 (Klaus I211) | |
| Dell XPS 13 9360 QHD+ i5 | |
| Dell XPS 13 9360 FHD i7 Iris | |
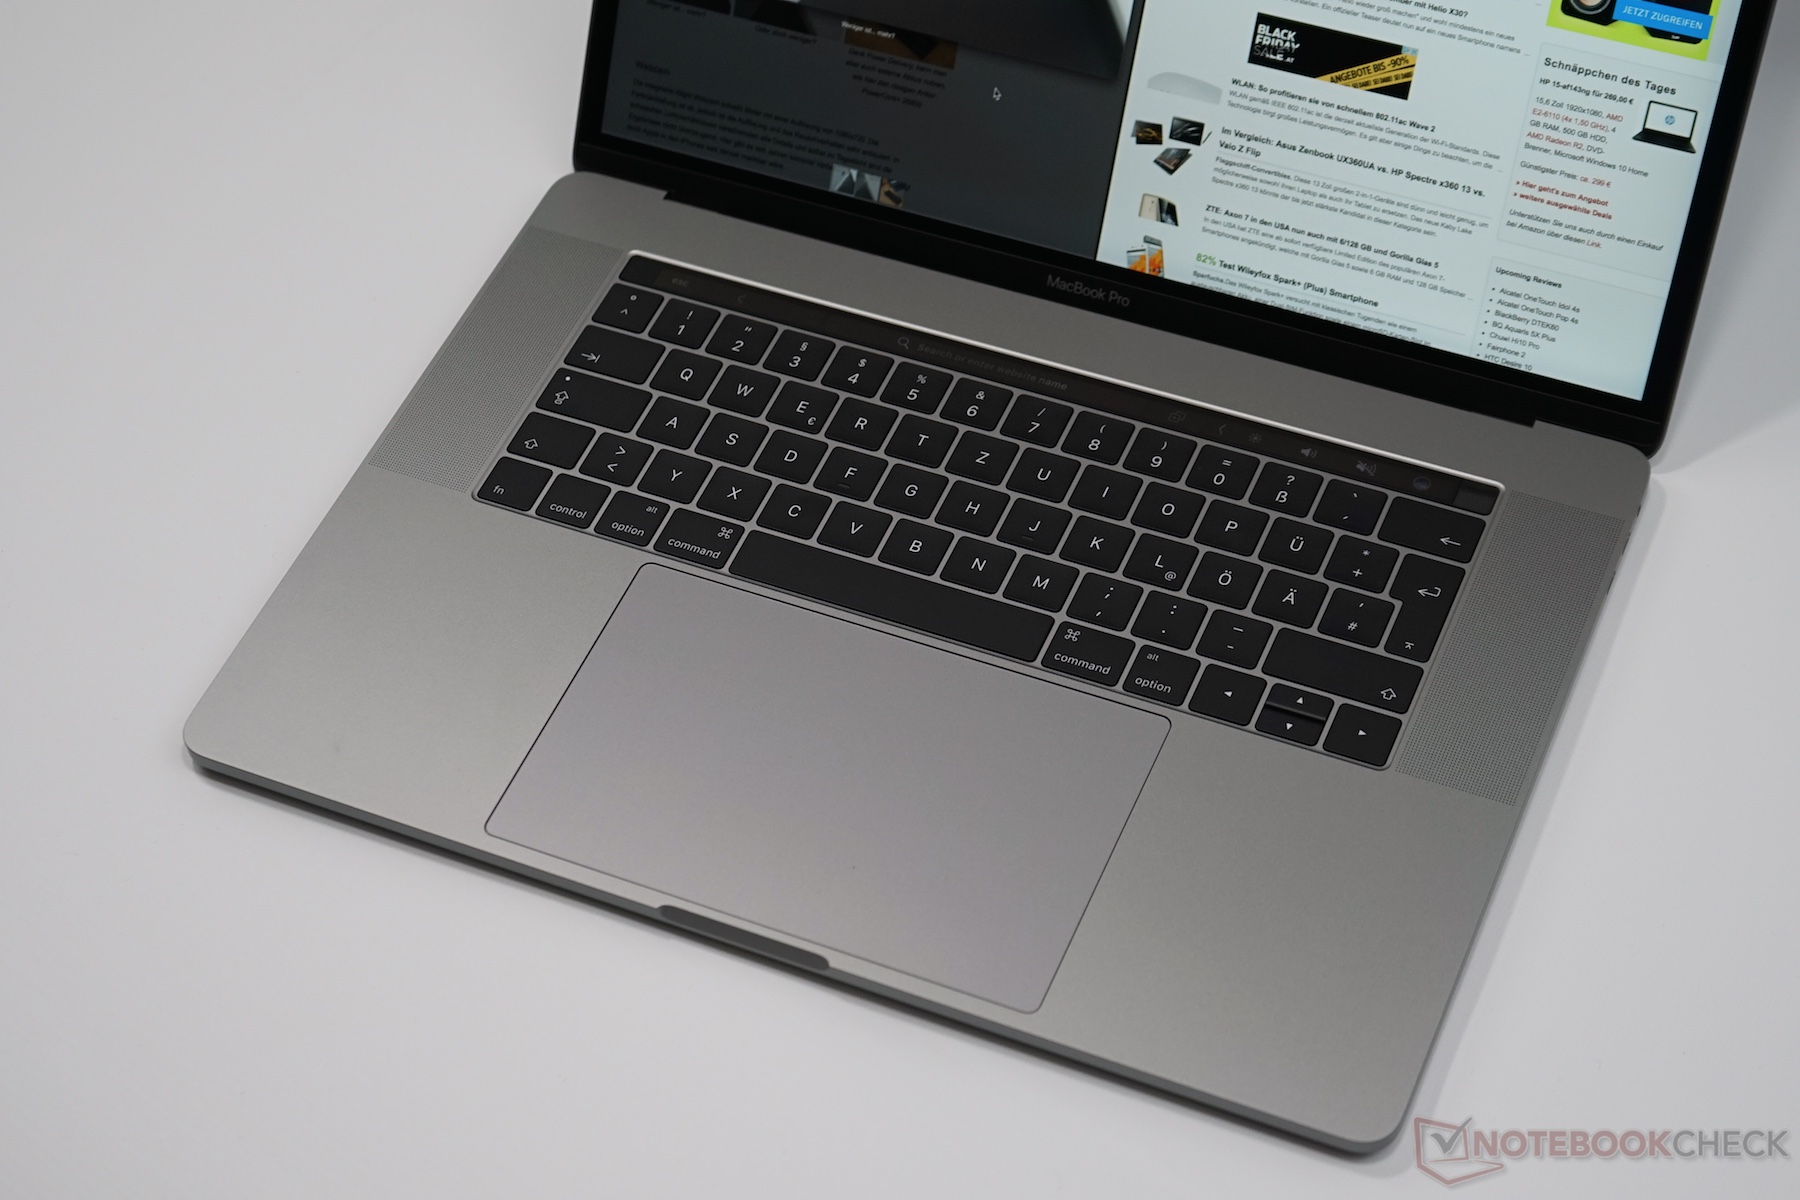
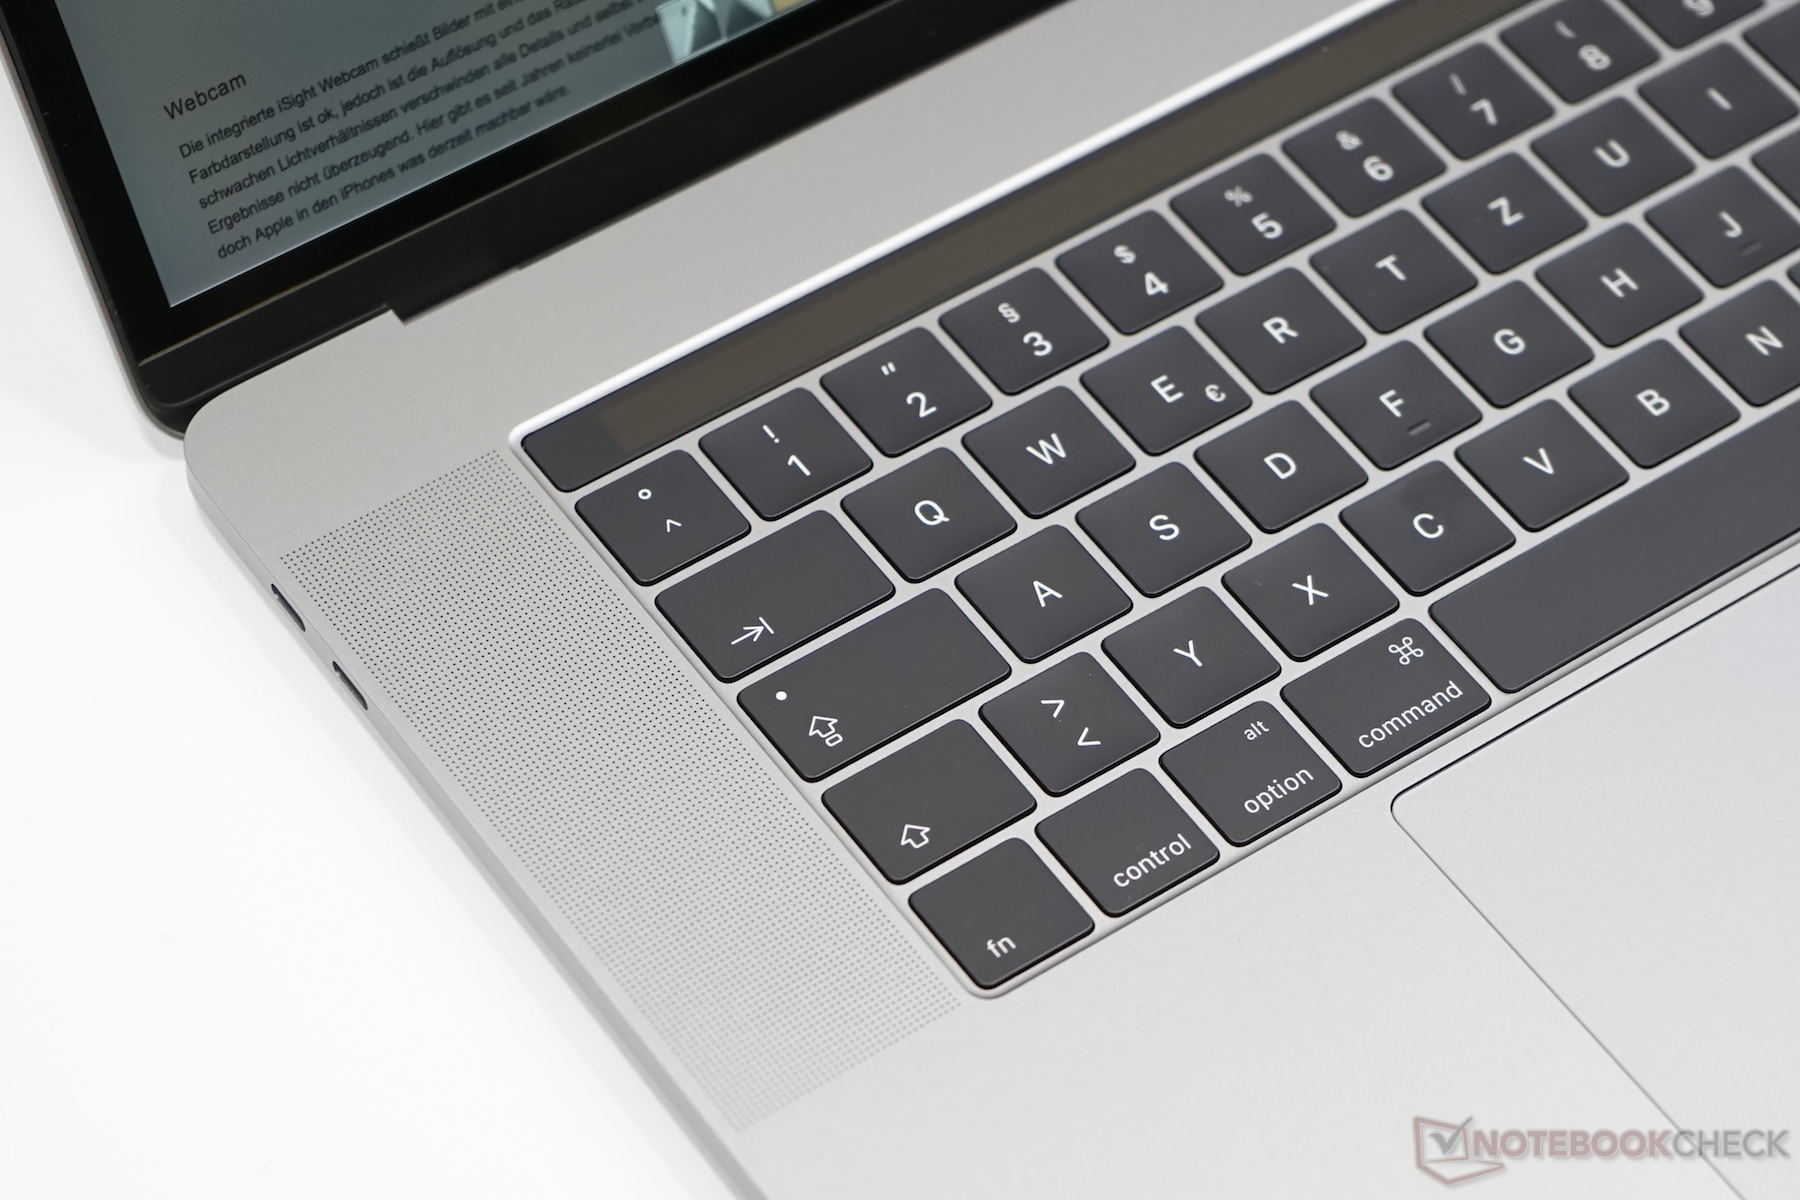
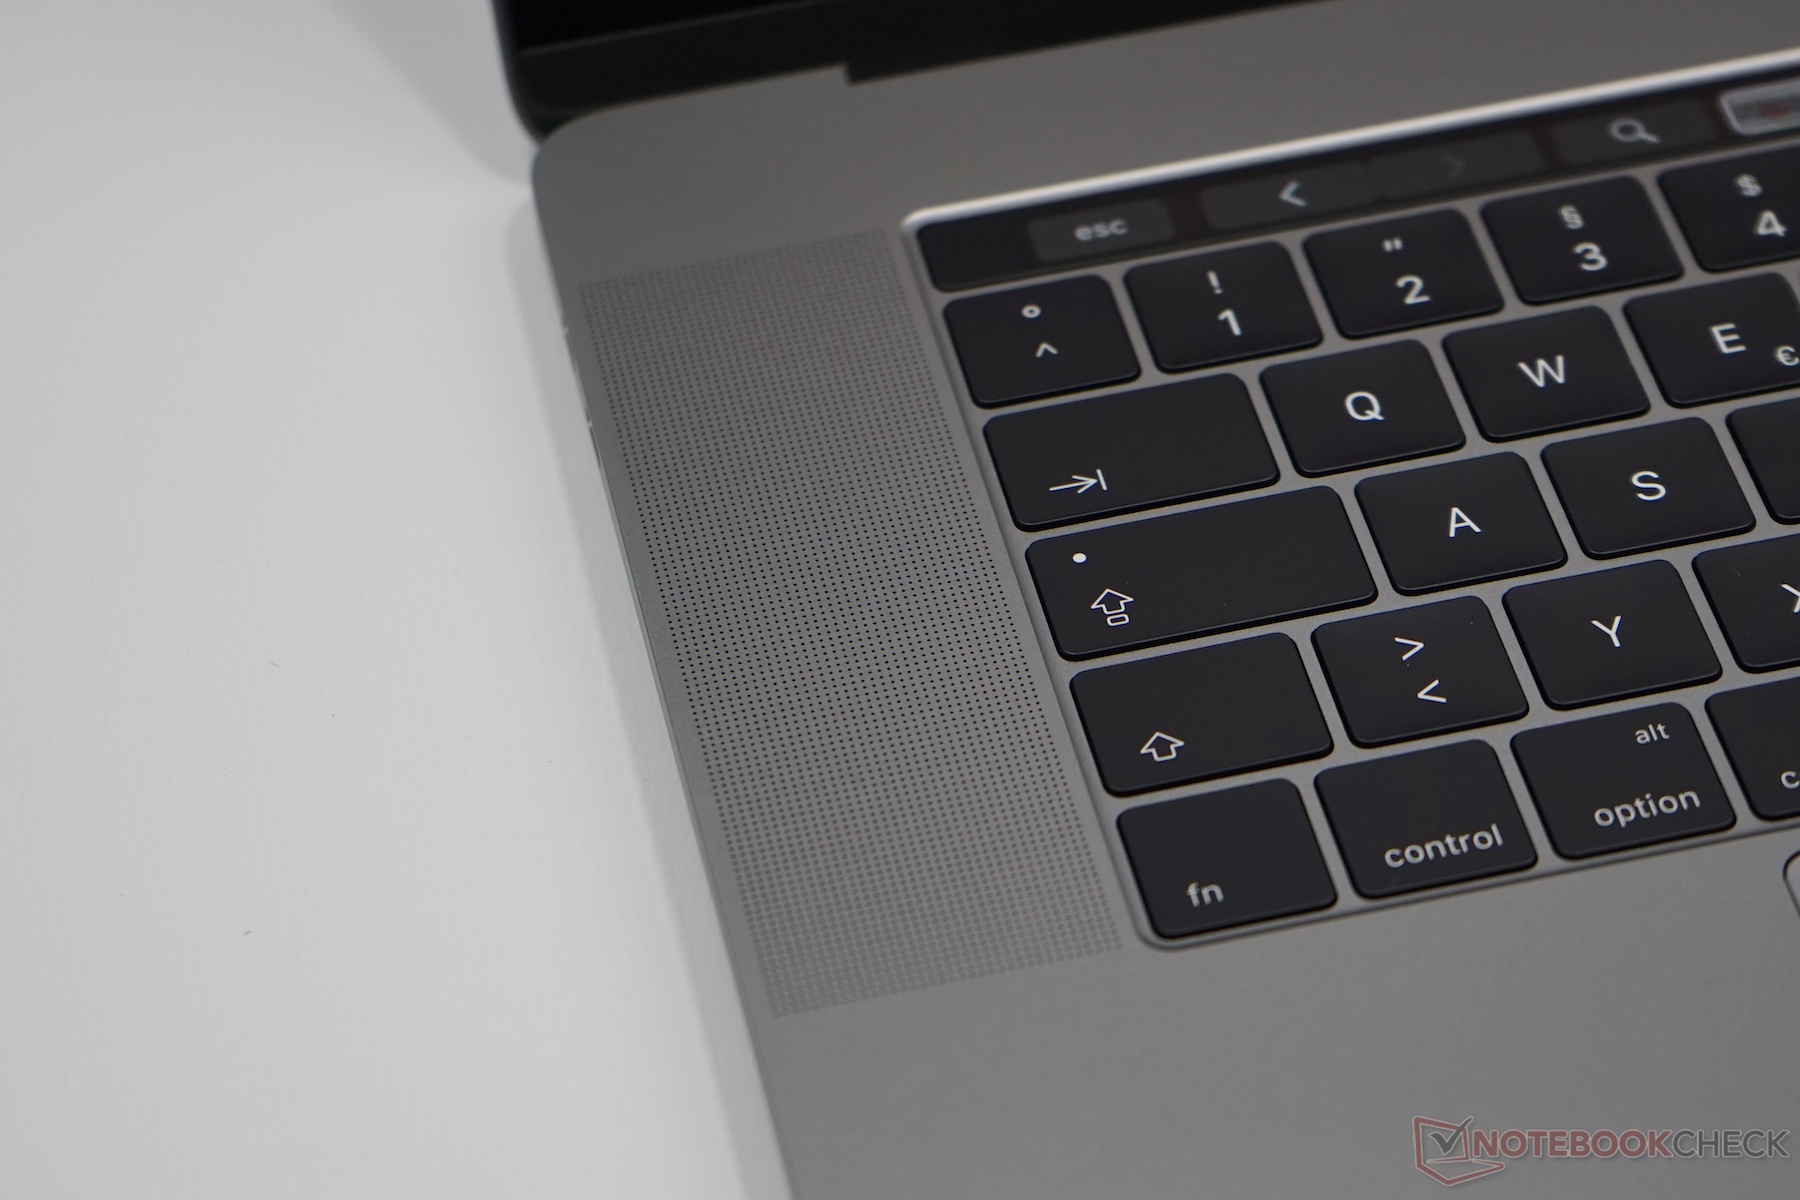
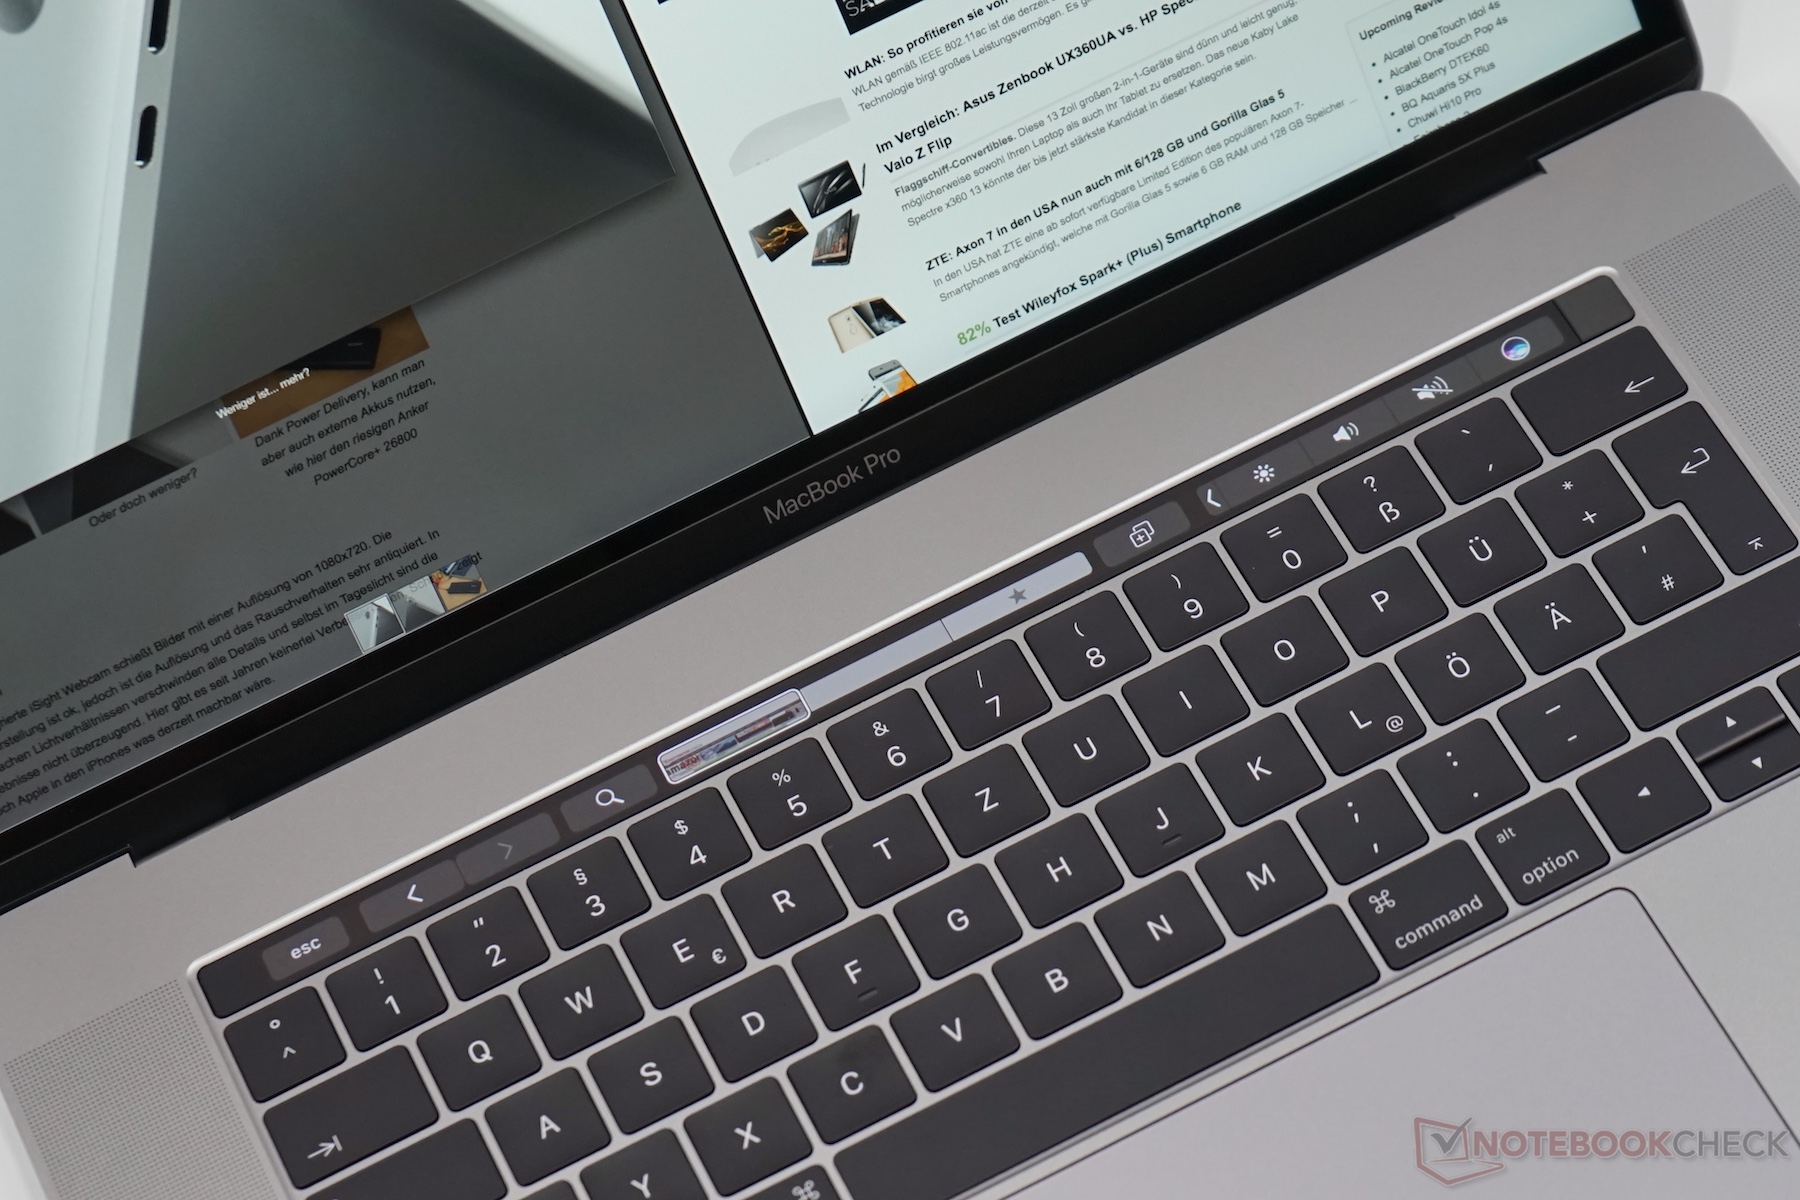
Input Devices
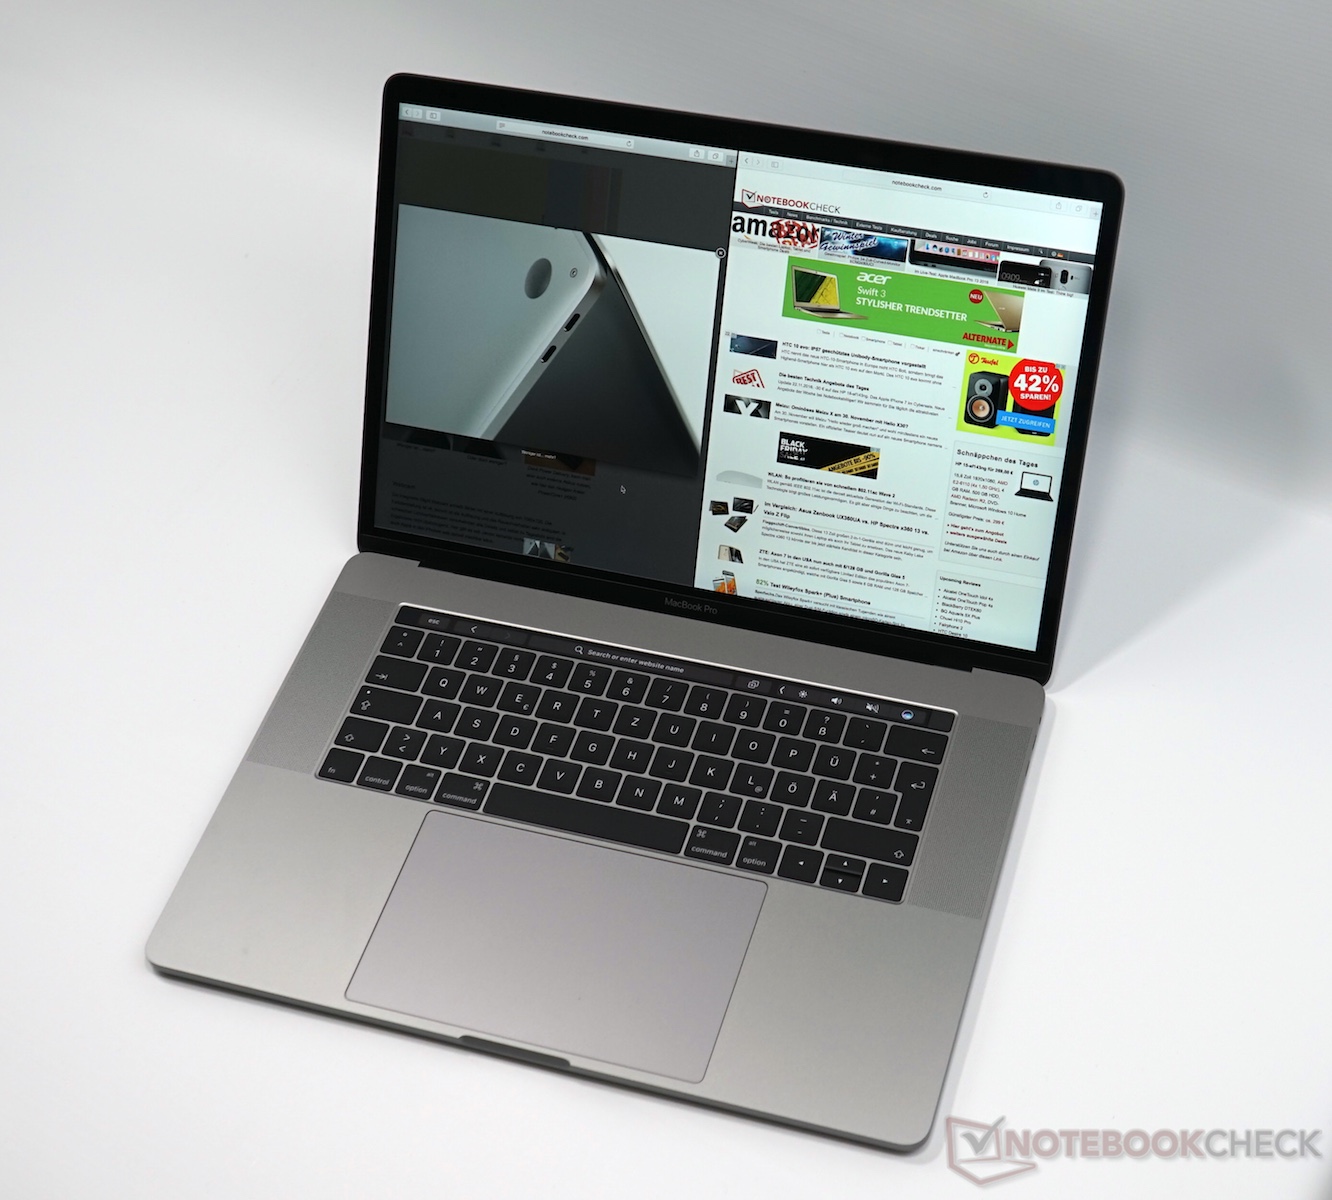
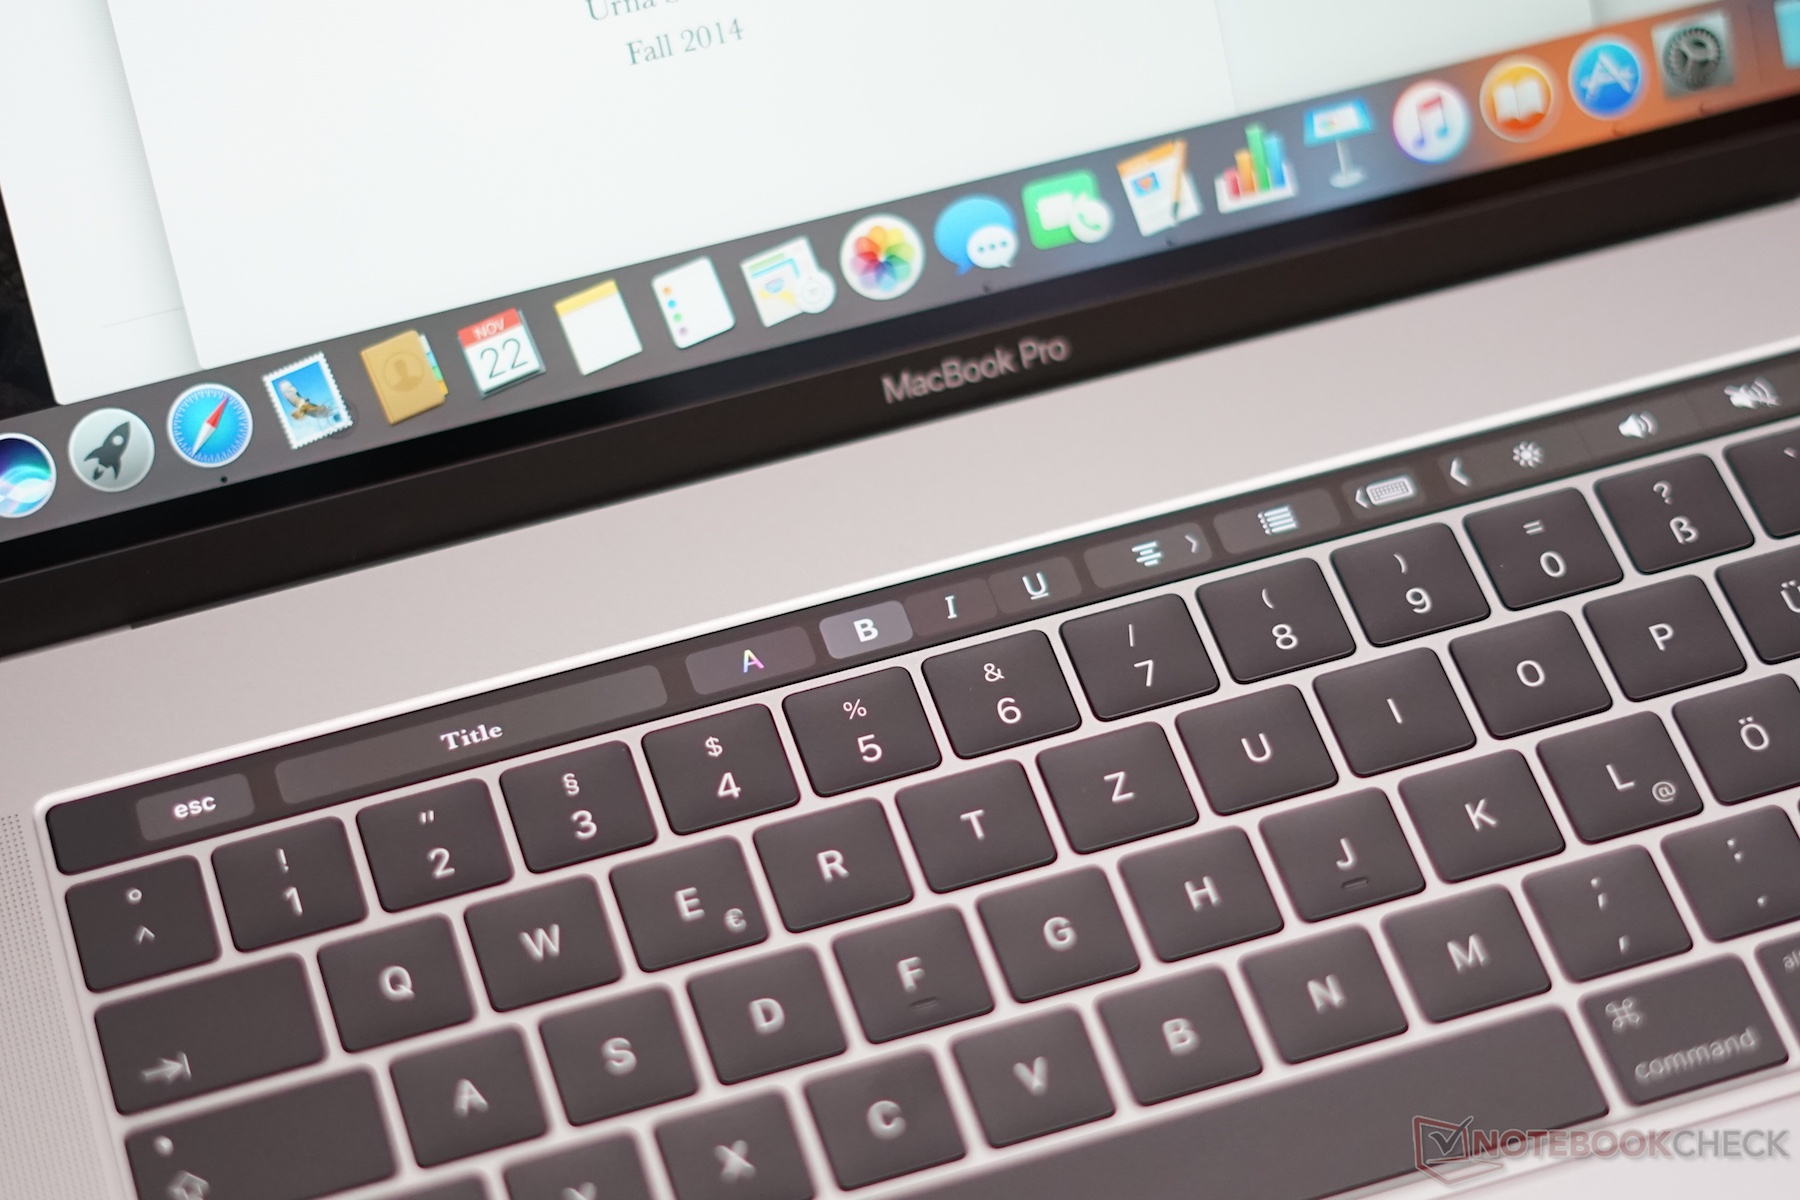
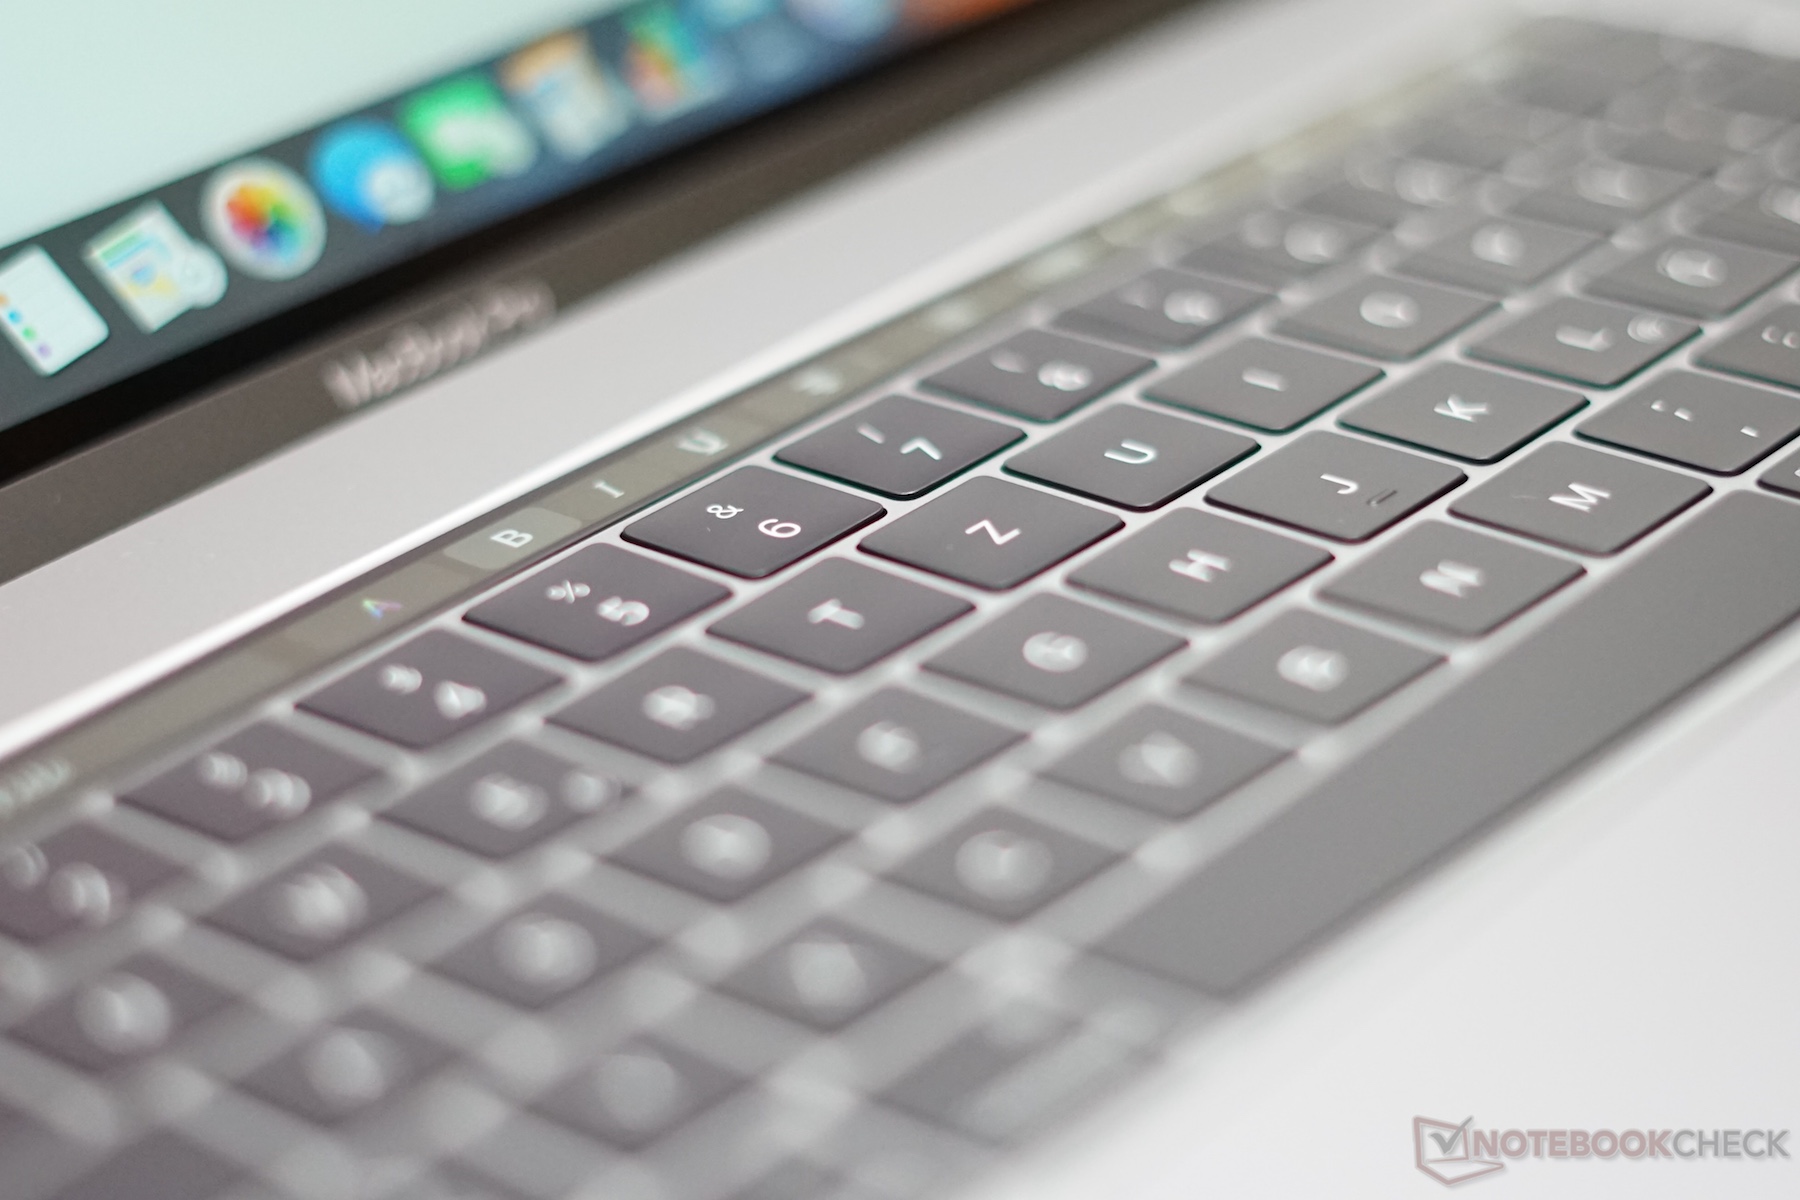
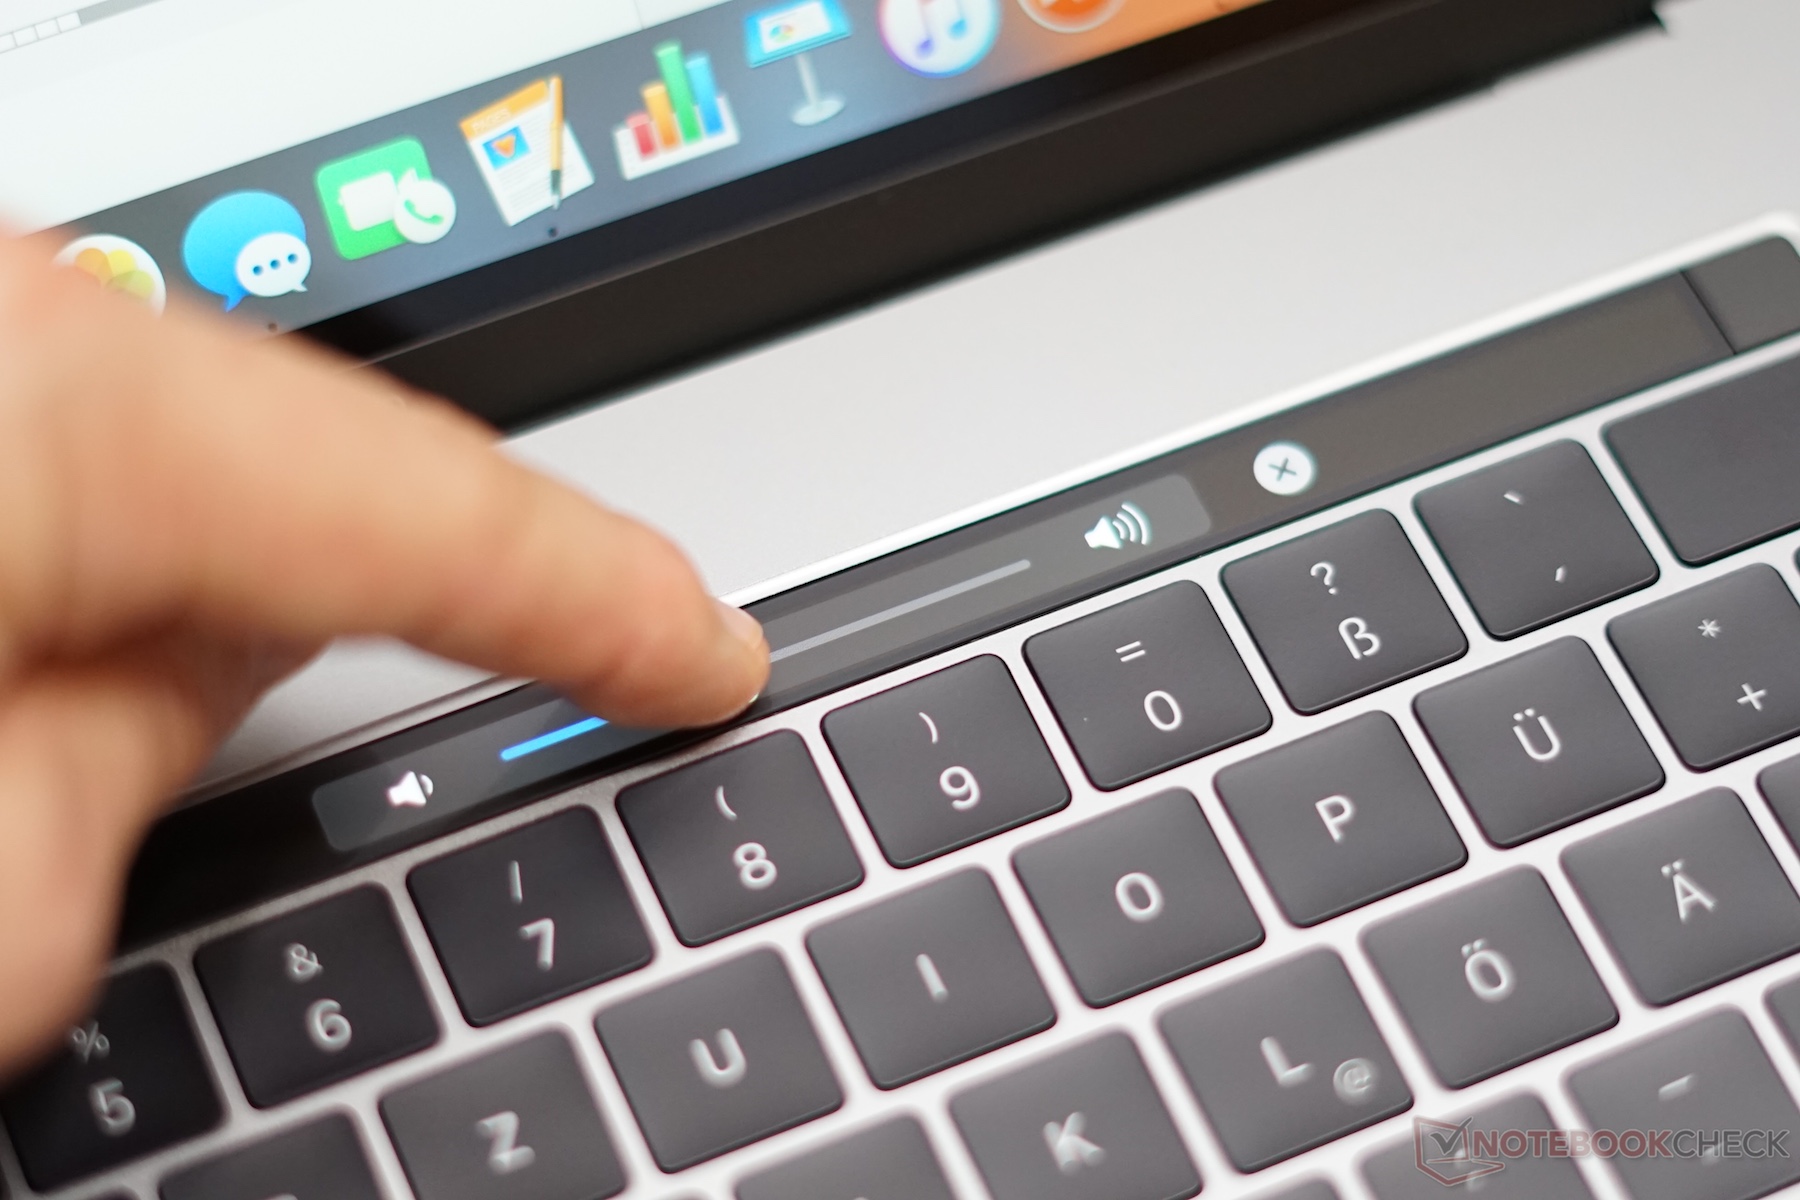
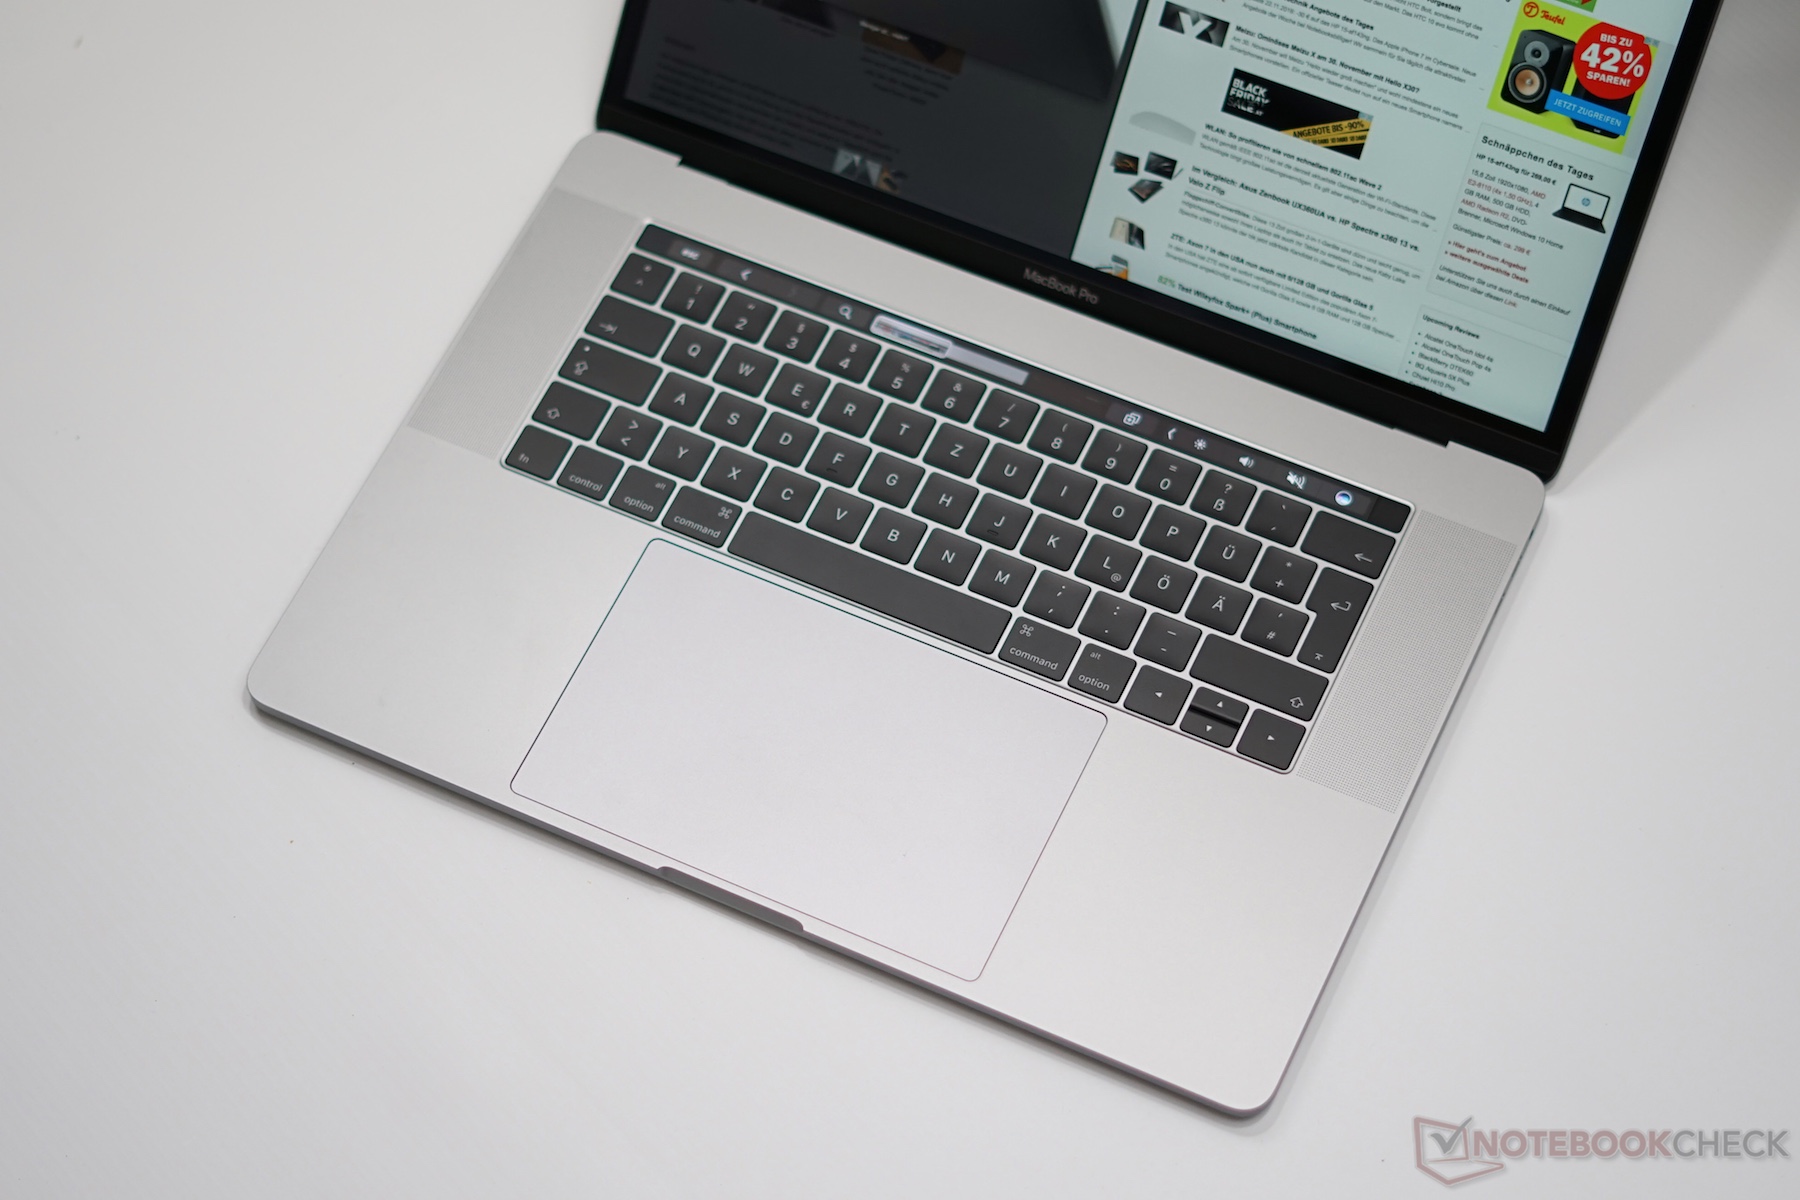
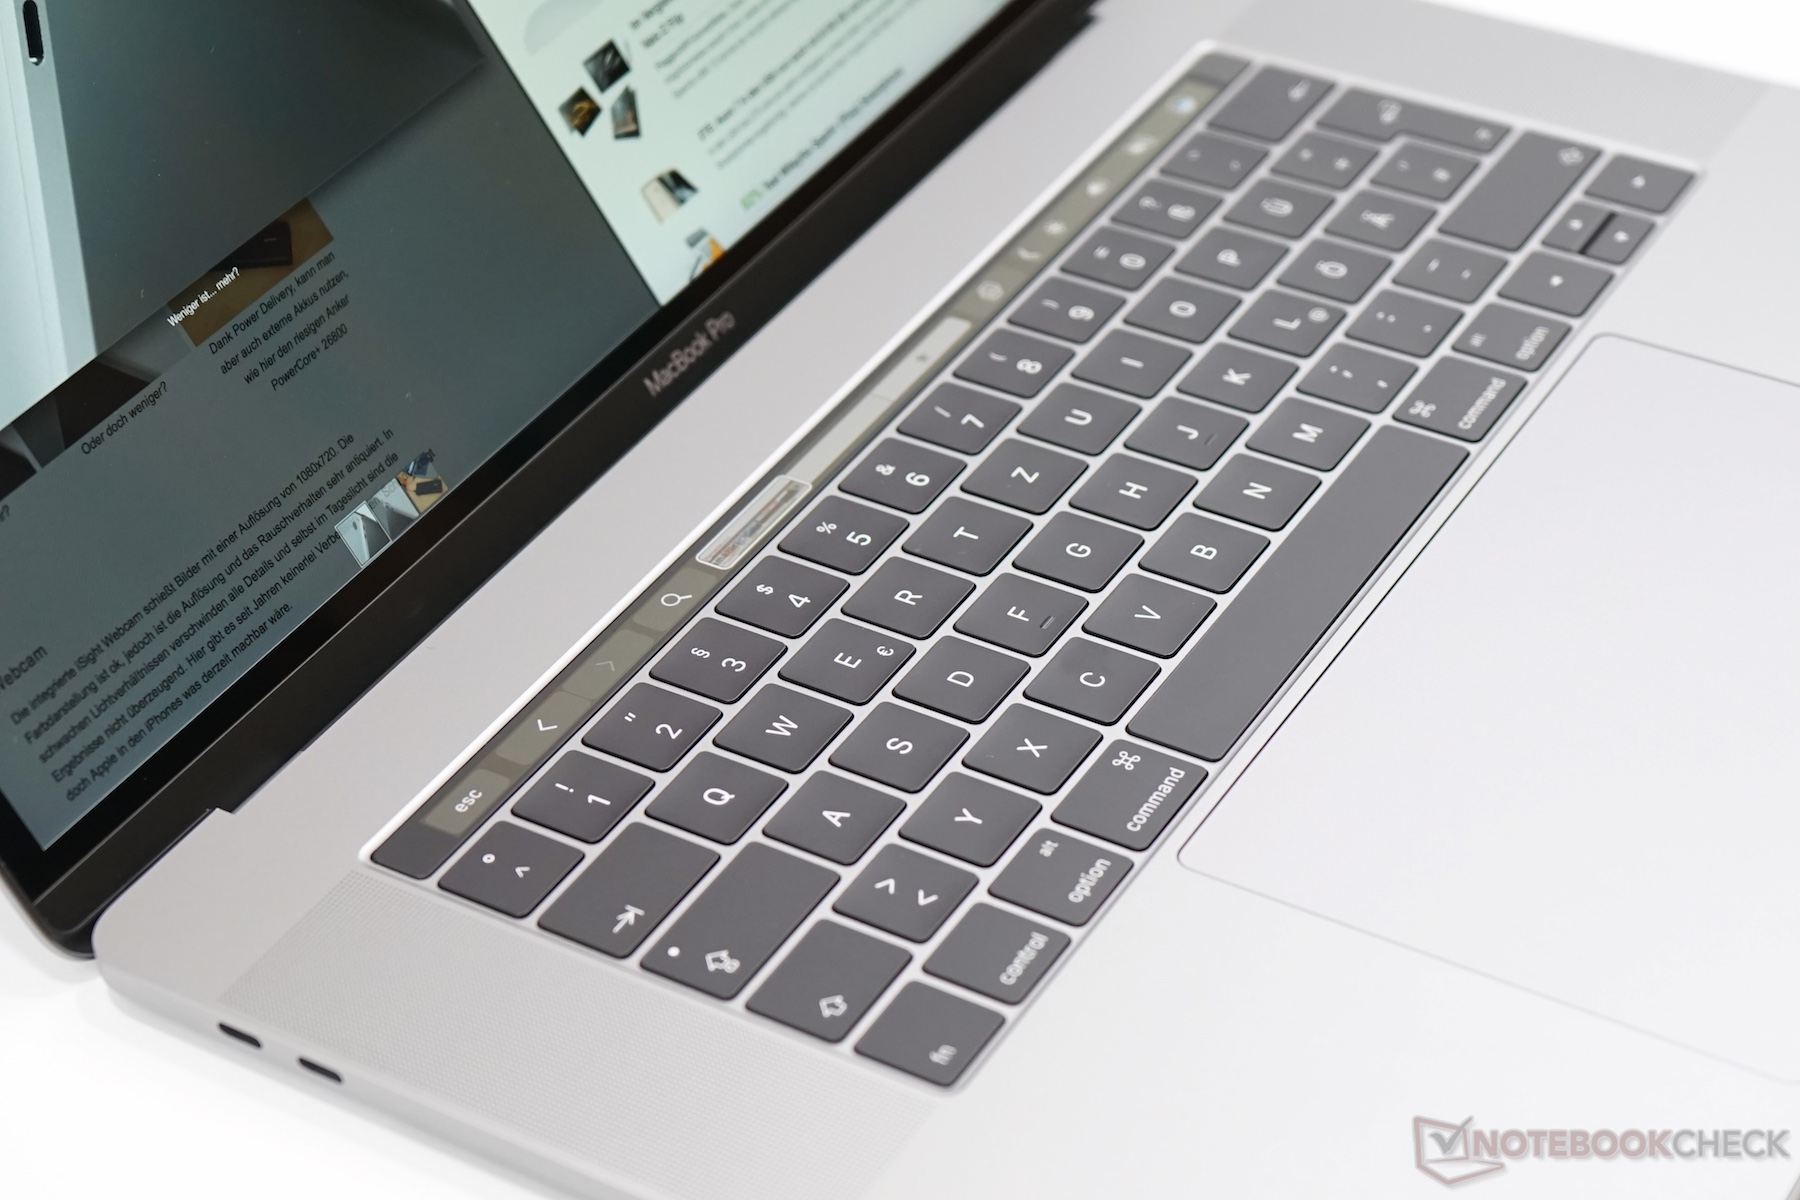
Apple is using second generation Butterfly keys for the MacBook Pro 15 similar to the smaller 13-inch system. However, the teardown from iFixit shows a slightly adjusted underlying construction. There have been reports about problems with keystrokes and our 2016 model in the editorial office also had some problem with the "S" key for a short while where strokes were not registered at all or they were registered twice. Subjectively, we cannot notice a difference between the two keyboards in a direct comparison. You still have to get used to the limited travel of the individual buttons, but the advantage is the even and precise pressure point.
Display
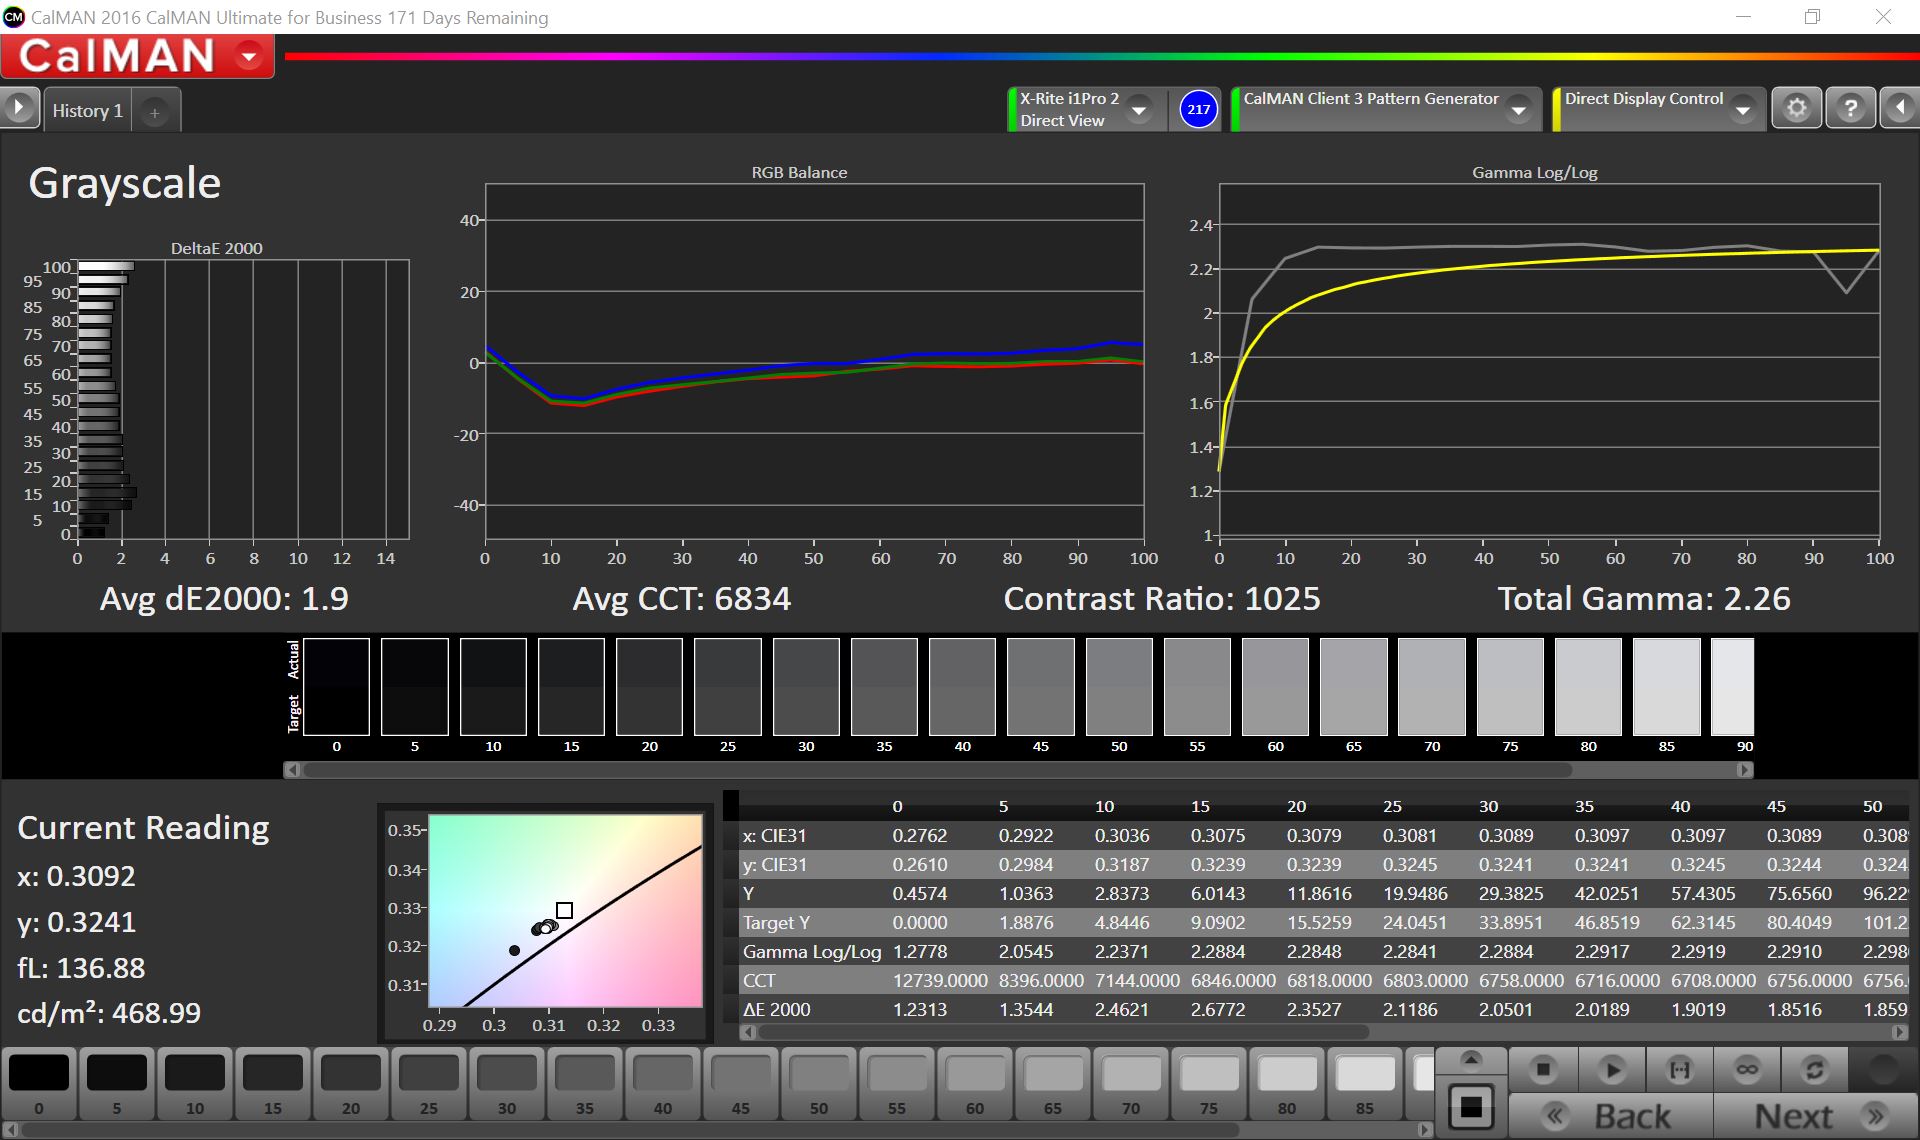
Last year we saw different panels in the 2016 Apple MacBook Pro 15 test models, so the measurement results can differ between two otherwise identical systems. The basic features obviously have not changed (2880x1800 pixels, IPS). Our test model of the 2017 version manages a very good average luminance of 523 nits, but the black value (0.44) is comparatively high this time. This means that the contrast ratio is lower, but more than 1200:1 is still a very good result.
| |||||||||||||||||||||||||
Brightness Distribution: 86 %
Center on Battery: 545 cd/m²
Contrast: 1239:1 (Black: 0.44 cd/m²)
ΔE ColorChecker Calman: 1.6 | ∀{0.5-29.43 Ø4.71}
ΔE Greyscale Calman: 1.9 | ∀{0.09-98 Ø4.96}
85.9% AdobeRGB 1998 (Argyll 3D)
99.9% sRGB (Argyll 3D)
97.9% Display P3 (Argyll 3D)
Gamma: 2.26
CCT: 6834 K
| Apple MacBook Pro 15 2017 (2.8 GHz, 555) APPA031, , 2880x1800, 15.4" | Apple MacBook Pro 15 2016 (2.6 GHz, 450) 2880x1800, 15.4" | Apple MacBook Pro 15 2016 (2.7 GHz, 455) APPA031, , 2880x1800, 15.4" | Apple MacBook Pro 15 2016 (2.9 GHz, 460) Apple APPA030, , 2880x1800, 15.4" | Dell XPS 15 9560 (i7-7700HQ, UHD) 3840x2160, 15.6" | Lenovo ThinkPad P51s 20HB000SGE BOE NV156QUM-N44, , 3840x2160, 15.6" | |
|---|---|---|---|---|---|---|
| Display | 1% | 1% | 3% | -20% | ||
| Display P3 Coverage (%) | 97.9 | 98.5 1% | 99 1% | 89.7 -8% | 69.7 -29% | |
| sRGB Coverage (%) | 99.9 | 99.9 0% | 100 0% | 100 0% | 91.2 -9% | |
| AdobeRGB 1998 Coverage (%) | 85.9 | 86.4 1% | 87.3 2% | 100 16% | 66.8 -22% | |
| Response Times | 5% | -7% | -31% | -18% | 24% | |
| Response Time Grey 50% / Grey 80% * (ms) | 48 ? | 47.3 ? 1% | 46.4 ? 3% | 46 ? 4% | 57.2 ? -19% | 38.4 ? 20% |
| Response Time Black / White * (ms) | 33.8 ? | 31.2 ? 8% | 39.2 ? -16% | 56 ? -66% | 39.2 ? -16% | 24.8 ? 27% |
| PWM Frequency (Hz) | 119000 ? | 117000 ? | 119000 ? | 962 | 980 ? | |
| Screen | 10% | 14% | -23% | -75% | -50% | |
| Brightness middle (cd/m²) | 545 | 483 -11% | 568 4% | 420 -23% | 370.1 -32% | 317 -42% |
| Brightness (cd/m²) | 523 | 465 -11% | 532 2% | 401 -23% | 356 -32% | 290 -45% |
| Brightness Distribution (%) | 86 | 92 7% | 83 -3% | 90 5% | 87 1% | 85 -1% |
| Black Level * (cd/m²) | 0.44 | 0.33 25% | 0.297 32% | 0.3 32% | 0.37 16% | 0.32 27% |
| Contrast (:1) | 1239 | 1464 18% | 1912 54% | 1400 13% | 1000 -19% | 991 -20% |
| Colorchecker dE 2000 * | 1.6 | 1.4 13% | 1.4 13% | 3.33 -108% | 5.3 -231% | 3.6 -125% |
| Colorchecker dE 2000 max. * | 3.8 | 3 21% | 2.7 29% | 5.11 -34% | 9.9 -161% | 6.6 -74% |
| Greyscale dE 2000 * | 1.9 | 1.5 21% | 2.3 -21% | 2.73 -44% | 4.6 -142% | 4.2 -121% |
| Gamma | 2.26 97% | 2.34 94% | 2.29 96% | 2.48 89% | 2.31 95% | 2.24 98% |
| CCT | 6834 95% | 6650 98% | 7165 91% | 6457 101% | 6284 103% | 6740 96% |
| Color Space (Percent of AdobeRGB 1998) (%) | 77.4 | 78.09 | 88.3 | 59.5 | ||
| Color Space (Percent of sRGB) (%) | 99.9 | 99.97 | 100 | 91.1 | ||
| Total Average (Program / Settings) | 8% /
9% | 3% /
8% | -18% /
-19% | -30% /
-48% | -15% /
-32% |
* ... smaller is better
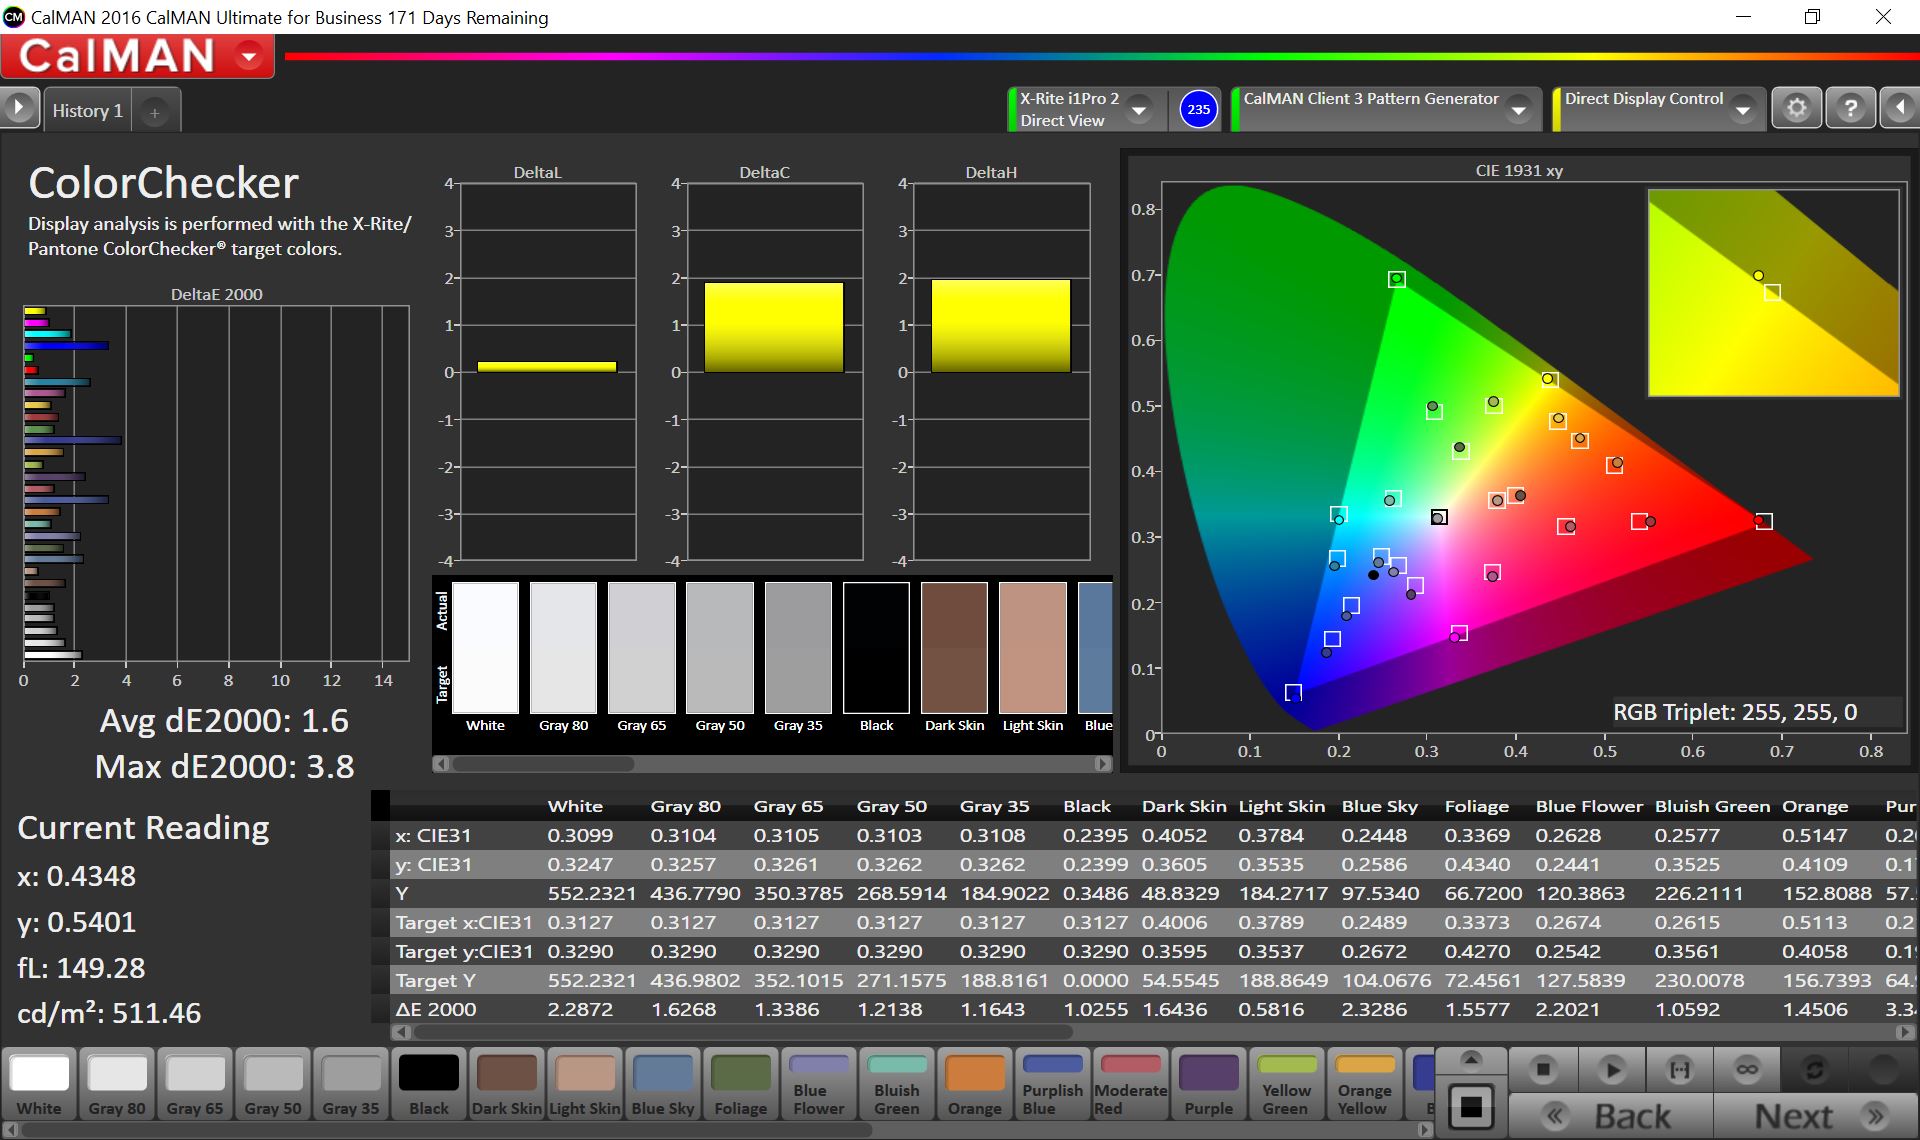
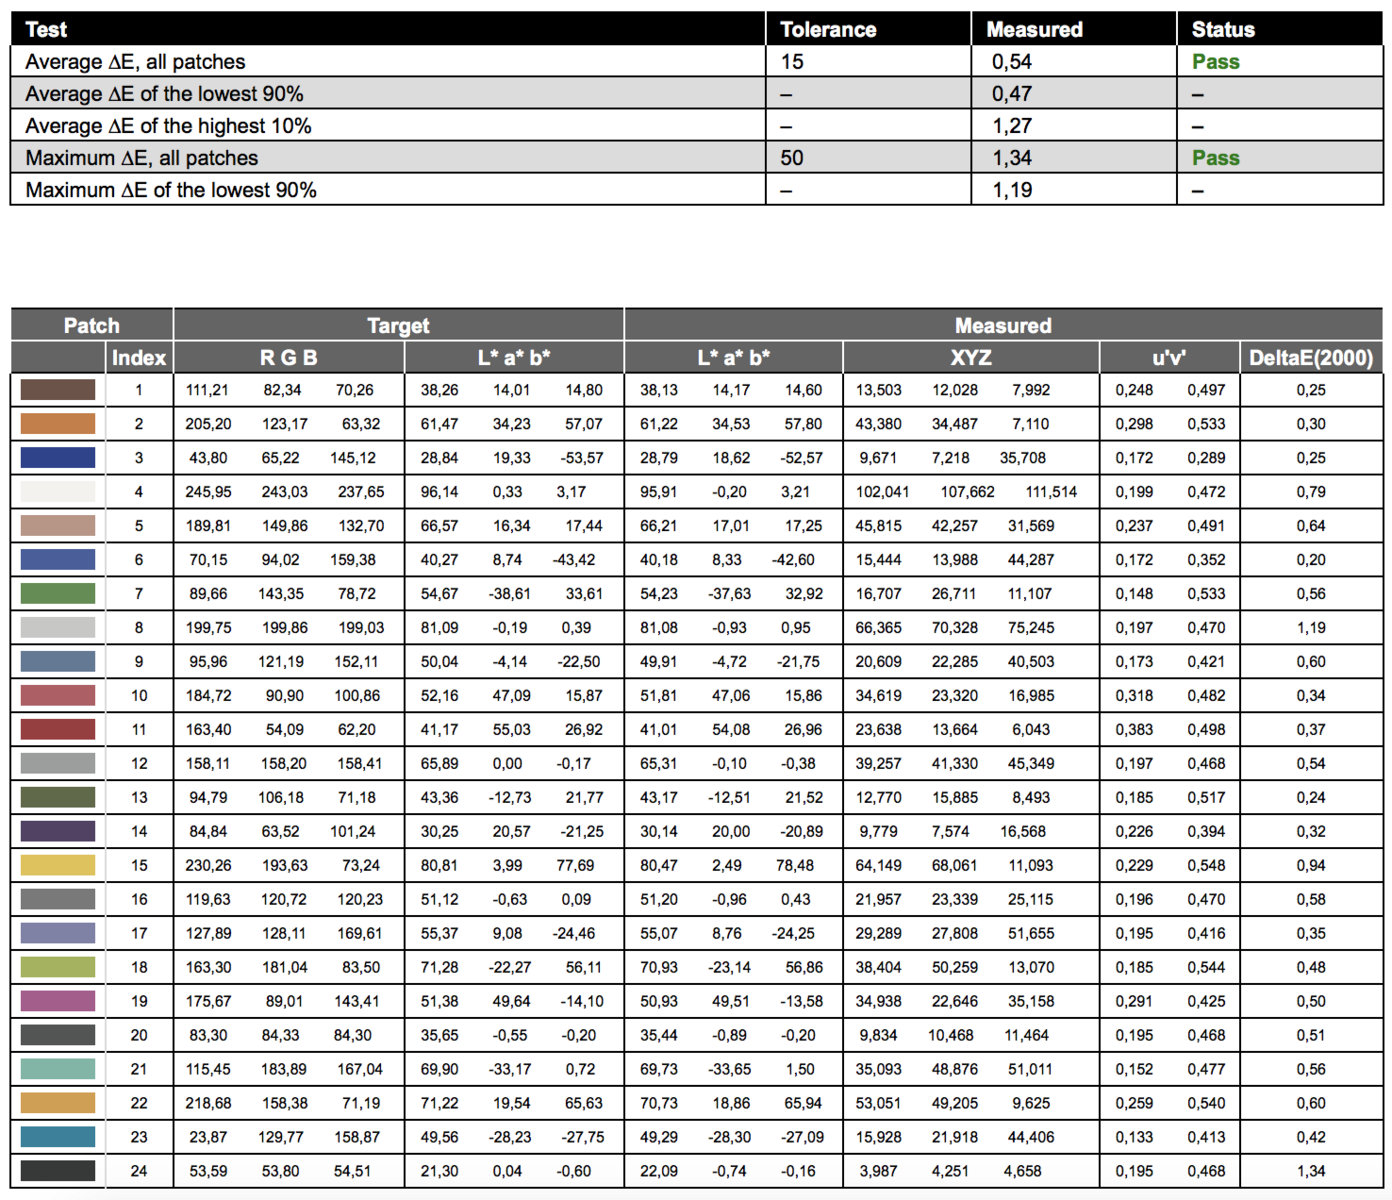
This is also the case for the average DeltaE-2000 deviations that we determined with the X-Rite i1Pro2 spectrophotometer and the professional CalMAN software. The results for the grayscale (1.6) and the colors (1.9) compared to the P3 reference color space are already within the target range before calibration. Only the color temperature is a little bit on the cool side at 6834 K. The calibration (via i1Profiler) reduces the ColorChecker value to 0.5 on average and up to 1.34 (DeltaE 2000). Both results are excellent.
Display Response Times
| ↔ Response Time Black to White | ||
|---|---|---|
| 33.8 ms ... rise ↗ and fall ↘ combined | ↗ 19.6 ms rise | 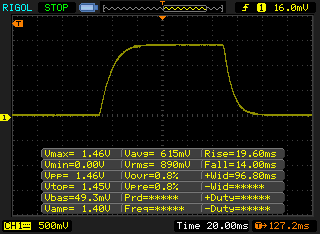 |
| ↘ 14.2 ms fall | ||
| The screen shows slow response rates in our tests and will be unsatisfactory for gamers. In comparison, all tested devices range from 0.1 (minimum) to 240 (maximum) ms. » 91 % of all devices are better. This means that the measured response time is worse than the average of all tested devices (19.8 ms). | ||
| ↔ Response Time 50% Grey to 80% Grey | ||
| 48 ms ... rise ↗ and fall ↘ combined | ↗ 23.6 ms rise | 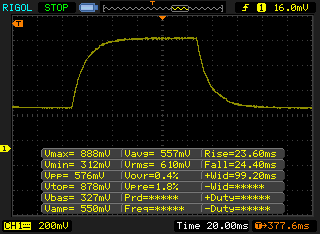 |
| ↘ 24.4 ms fall | ||
| The screen shows slow response rates in our tests and will be unsatisfactory for gamers. In comparison, all tested devices range from 0.165 (minimum) to 636 (maximum) ms. » 82 % of all devices are better. This means that the measured response time is worse than the average of all tested devices (31 ms). | ||
We have been using a more sensitive measuring device since the beginning of this year, which can detect higher frequencies. There are brightness fluctuations at 119 kHz when the brightness drops to 80% and lower. We also repeated the measurement for the 2016 model and got similar results. However, the frequency is very high, so even sensitive users should not have problems.
Screen Flickering / PWM (Pulse-Width Modulation)
| Screen flickering / PWM detected | 119000 Hz | ≤ 80 % brightness setting | 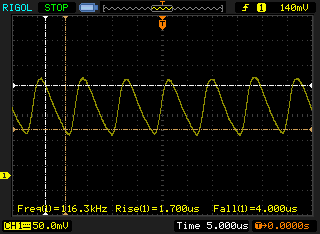 |
| ≤ 210 cd/m² brightness | |||
The display backlight flickers at 119000 Hz (worst case, e.g., utilizing PWM) Flickering detected at a brightness setting of 80 % (210 cd/m²) and below. There should be no flickering or PWM above this brightness setting. The frequency of 119000 Hz is quite high, so most users sensitive to PWM should not notice any flickering. Flickering occurs even at high brightness setting and may have an effect on the user during everyday use. In comparison: 52 % of all tested devices do not use PWM to dim the display. If PWM was detected, an average of 7757 (minimum: 5 - maximum: 343500) Hz was measured. | |||
Performance
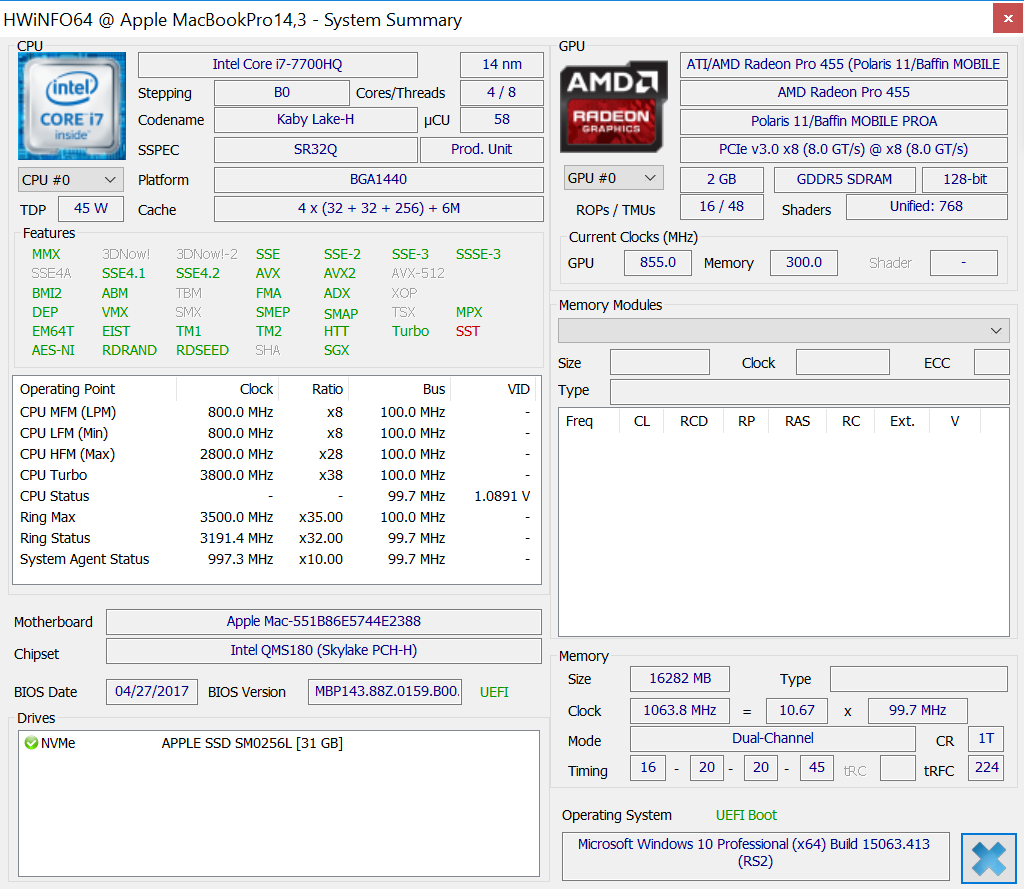
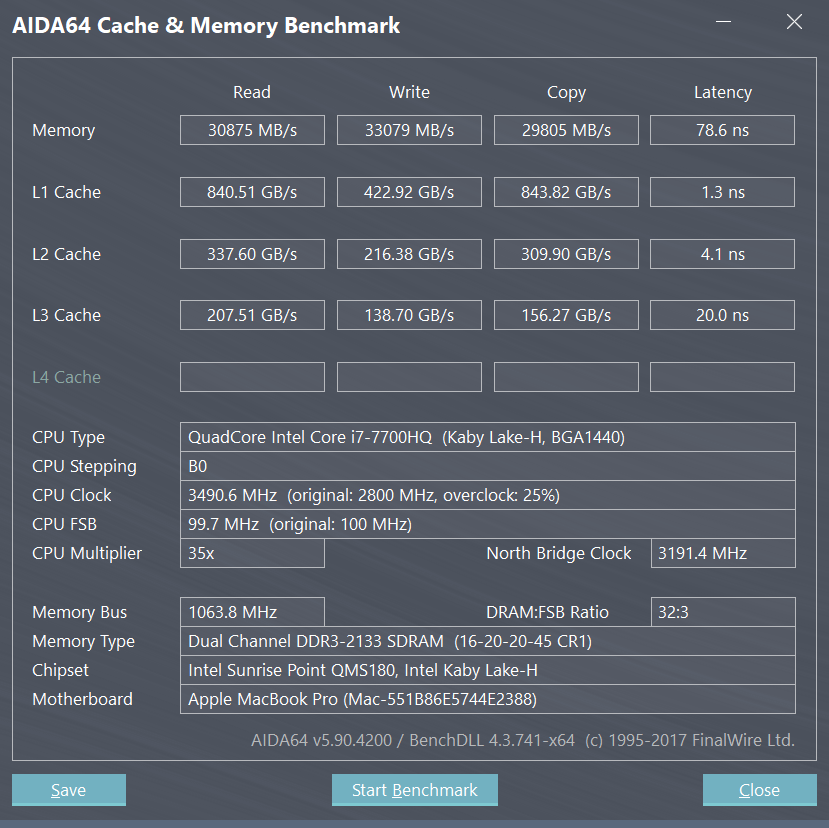
The Apple MacBook Pro 15 is a very powerful multimedia notebook thanks to the mobile quad-core processors and discrete graphics cards from AMD. Apple offers three different CPU and two GPU options. All SKUs feature 16 GB of RAM (LPDDR3-2133), which cannot be upgraded. The maximum storage size has been doubled to 2 TB.
Processor
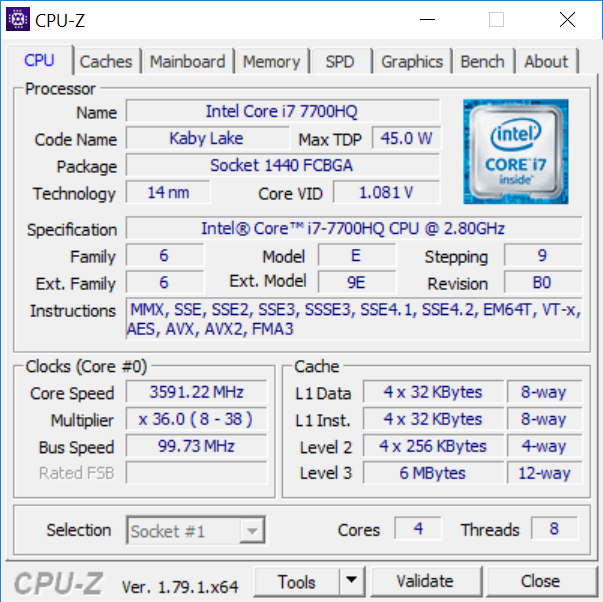
The entry-level processor of the new Apple MacBook Pro 15 has the designation Intel Core i7-7700HQ. The quad-core is currently a very popular choice for virtually every powerful multimedia and gaming laptop. The four cores have a base frequency of 2.8 GHz with a maximum Turbo Boost of 3.8 GHz. The architecture has not changed compared to the old Skylake chips, so the additional performance is a result of higher clocks.
The entry-level i7 performs as expected and is almost on par with the i7-6920HQ, which was still an expensive upgrade on the MBP 15 just a few weeks ago. The performance is also very steady in macOS, which is supported by our Cinebench R15 Multi loop, while we can see bigger fluctuations running on Windows. The CPU performance is not reduced on battery power.
System Performance
We performed the synthetic PCMarks while running on Windows (Boot Camp). You should note that Apple's drivers can always influence the performance. The new MacBook Pro 15 performs really well though, and the Dell XPS 15 is beaten in both tests (Home, Work). Subjectively, there are no problems whatsoever; the handling is very responsive and applications are launched quite quickly.
| PCMark 8 Home Score Accelerated v2 | 4054 points | |
| PCMark 8 Creative Score Accelerated v2 | 4914 points | |
| PCMark 8 Work Score Accelerated v2 | 4648 points | |
| PCMark 10 Score | 4122 points | |
Help | ||
Storage Devices

The 2017 entry-level model of the MacBook Pro 15 is – despite the high price – once again equipped with only a 256 GB PCIe SSD. Apple still charges hefty premiums for bigger drives. The upgrade to 512 GB costs $200, 1 TB $600, and the 2 TB drive is an additional $1400. For comparison: The Samsung SSD 960 Pro with 2 TB (M.2) is available for ~$1200 in online shops.
The benchmarks put the drive with the designation AP0256 on par with the predecessor as well as the smaller MacBook Pro 13. More benchmarks and comparisons are available in our SSD/HDD list.

GPU Performance
The graphics card of the current MacBook Pro carries the designation AMD Radeon Pro 555 and is the direct successor to the old Radeon Pro 455. This means that the entry-level SKU has had a speed bump since there is no successor to the slower Radeon Pro 450. The Radeon Pro 555 uses the smaller Polaris 21 chip, which is manufactured in an improved process (14 nm FinFET LPP). However, the technical specifications have not changed: 768 shaders clocked at up to 855 MHz, supported by 2 GB of GDDR5-VRAM. More information about the Radeon Pro 555 is available in our Tech section; more information about the Polaris architecture is available in our dedicated article.
It is not surprising that the Radeon Pro 555 is on par with the old Radeon Pro 455 as well as the old Nvidia GeForce GTX 950M in the synthetic benchmarks. The current GeForce GTX 1050 on the other hand, is much faster. The suitable rival based on the Pascal architecture is the brand-new GeForce MX150 (laptop version of the GT 1030). You can also utilize the full GPU performance on battery power. We did not notice any throttling in “The Witcher 3” (Bootcamp) or the Unigine Valley benchmark (macOS). The frame rates were steady, even after prolong periods.
| 3DMark 06 Standard Score | 26389 points | |
| 3DMark 11 Performance | 5566 points | |
| 3DMark Cloud Gate Standard Score | 15337 points | |
| 3DMark Fire Strike Score | 3430 points | |
| 3DMark Time Spy Score | 1207 points | |
Help | ||
Besides the pure performance, the efficiency is another important aspect, especially for slim devices. We check it with the game “The Witcher 3” (ultra) running on an external monitor to eliminate the integrated panel as a consumer. The results are very interesting. Our first comparison device is the smaller MacBook Pro 13 Touch Bar. Its integrated graphics card is – for an iGPU – very powerful, but it is not particularly efficient in this performance range. The performance is much lower compared to the Radeon Pro 555, but both systems basically consume the same amount of power.
This is also the case for the new GeForce MX150 in the MSI PL62 (also i7-7700HQ), where both the performance and the power consumption are on par. On the other hand, the Asus FX553 (i7-7700HQ) with the more powerful GeForce GTX 1050 consumes almost twice as much power and obviously creates more heat as well.
| Power Consumption - 1920x1080 The Witcher 3 ultra (external Monitor) | |
| Acer Aspire VX5-591G-D0DD (25 fps, Idle: 11.2 W) | |
| Asus FX553VD-DM249T | |
| MSI PL62 MX150 7700HQ (12 fps, Idle: 10.8 W) | |
| Apple MacBook Pro 15 2017 (2.8 GHz, 555) (13 fps, Idle: 13.2 W) | |
| Apple MacBook Pro 13 2017 Touchbar i5 (4.8 fps, Idle: 7.5 W) | |
| Apple MacBook Pro 15 2016 (2.7 GHz, 455) (13.3 fps, Idle: 16.6 W) | |
| Apple MacBook Pro 15 2016 (2.6 GHz, 450) (11 fps, Idle: 16.2 W) | |
| Lenovo ThinkPad P51s 20HB000SGE (7.6 fps) | |
* ... smaller is better
Gaming Performance
The gaming performance is roughly on par with the old Radeon Pro 455 in the 2016 MacBook Pro 15. Similar to the synthetic tests, the direct rival from Nvidia is the new GeForce MX150 (Pascal). This means that you can play some games with the MBP 15, but you are limited to low/medium details in demanding titles. However, some modern games like “Prey” or “Dirt 4” also run smoothly at high settings. We recommend our gaming list for more benchmarks. As well as the results for the new Radeon Pro 555, you can also check the frame rates for the previous Radeon Pro 455.
| The Witcher 3 - 1920x1080 Ultra Graphics & Postprocessing (HBAO+) | |
| Lenovo ThinkPad P51 20HH0016GE | |
| Dell XPS 15 9560 (i7-7700HQ, UHD) | |
| Apple MacBook Pro 15 2016 (2.9 GHz, 460) | |
| Apple MacBook Pro 15 2016 (2.7 GHz, 455) | |
| Apple MacBook Pro 15 2017 (2.8 GHz, 555) | |
| MSI PL62 MX150 7700HQ | |
| Dell Precision 3520 | |
| Apple MacBook Pro Retina 15 inch 2015-05 | |
| Farming Simulator 17 - 1920x1080 Very High Preset AA:4xMS AF:4x | |
| MSI PL62 MX150 7700HQ | |
| Apple MacBook Pro 15 2016 (2.9 GHz, 460) | |
| Lenovo ThinkPad P51s 20HB000SGE | |
| Apple MacBook Pro 15 2017 (2.8 GHz, 555) | |
| Apple MacBook Pro 15 2016 (2.7 GHz, 455) | |
| Apple MacBook Pro 15 2016 (2.6 GHz, 450) | |
| Apple MacBook Pro 13 2017 Touchbar i5 | |
| Rainbow Six Siege - 1920x1080 Ultra Preset AA:T AF:16x | |
| Apple MacBook Pro 15 2016 (2.9 GHz, 460) | |
| Apple MacBook Pro 15 2017 (2.8 GHz, 555) | |
| Apple MacBook Pro 15 2016 (2.6 GHz, 450) | |
| Apple MacBook Pro 15 2016 (2.7 GHz, 455) | |
| MSI PL62 MX150 7700HQ | |
| Lenovo ThinkPad P51s 20HB000SGE | |
| Ghost Recon Wildlands - 1280x720 Low Preset | |
| MSI PL62 MX150 7700HQ | |
| Apple MacBook Pro 15 2017 (2.8 GHz, 555) | |
| Apple MacBook Pro 15 2016 (2.6 GHz, 450) | |
| Lenovo ThinkPad P51s 20HB000SGE | |
| Apple MacBook Pro 13 2017 Touchbar i5 | |
| For Honor - 1920x1080 High Preset AA:T AF:8x | |
| Lenovo ThinkPad P51 20HH0016GE | |
| Apple MacBook Pro 15 2017 (2.8 GHz, 555) | |
| MSI PL62 MX150 7700HQ | |
| Apple MacBook Pro 15 2016 (2.6 GHz, 450) | |
| Lenovo ThinkPad P51s 20HB000SGE | |
| low | med. | high | ultra | 4K | |
|---|---|---|---|---|---|
| Crysis 3 (2013) | 17.9 | ||||
| BioShock Infinite (2013) | 37.6 | ||||
| Sims 4 (2014) | 53.9 | ||||
| GTA V (2015) | 80 | 38.5 | 19.2 | ||
| The Witcher 3 (2015) | 66.7 | 23.2 | 13.9 | ||
| Dota 2 Reborn (2015) | 56.5 | ||||
| Rainbow Six Siege (2015) | 48.5 | 36.2 | |||
| Rise of the Tomb Raider (2016) | 73.6 | 23.5 | |||
| Far Cry Primal (2016) | 76 | 31 | 28 | ||
| The Division (2016) | 88 | 24.8 | |||
| Ashes of the Singularity (2016) | 38.1 | 22.8 | |||
| Doom (2016) | 63.5 | 19.5 | |||
| Overwatch (2016) | 63.6 | 30.5 | |||
| Deus Ex Mankind Divided (2016) | 59.7 | 21.3 | 8.7 | ||
| FIFA 17 (2016) | 99 | ||||
| Battlefield 1 (2016) | 113 | 30.2 | 25.9 | ||
| Civilization 6 (2016) | 30.2 | 23.3 | |||
| Farming Simulator 17 (2016) | 70.2 | 26 | 22.6 | ||
| Titanfall 2 (2016) | 59.2 | 43 | |||
| Call of Duty Infinite Warfare (2016) | 40.6 | ||||
| Dishonored 2 (2016) | 46.5 | 19.4 | 18.3 | ||
| Watch Dogs 2 (2016) | 53.9 | 19.8 | |||
| Resident Evil 7 (2017) | 142 | 56.8 | |||
| For Honor (2017) | 96.8 | 34.1 | 32.6 | 22.8 | |
| Ghost Recon Wildlands (2017) | 49.2 | 25.5 | |||
| Mass Effect Andromeda (2017) | 75 | 31.5 | 18.4 | ||
| Warhammer 40.000: Dawn of War III (2017) | 31.2 | ||||
| Prey (2017) | 42.3 | 34.5 | 29.8 | ||
| Rocket League (2017) | 65.6 | ||||
| Dirt 4 (2017) | 61.4 | 33.8 | 16.8 | 8.3 | |
| Team Fortress 2 (2017) | 110 | 58 | 75 () | ||
| Playerunknown's Battlegrounds (PUBG) (2017) | 74 | 24.3 | 21.2 | 13.4 | |
| F1 2017 (2017) | 110 | 47 | 38 | ||
| Ark Survival Evolved (2017) | 47.1 | 14 | |||
| Middle-earth: Shadow of War (2017) | 74 | 29 | 20 | 9 | |
| Assassin´s Creed Origins (2017) | 45 | 24 | 20 | ||
| Call of Duty WWII (2017) | 24.4 | ||||
| Fortnite (2018) | 82 | 28.8 | 22.9 | ||
| Final Fantasy XV Benchmark (2018) | 35.5 | 16.7 | 3.7 | ||
| Kingdom Come: Deliverance (2018) | 63 | 25.7 | 20.5 | 14.7 | |
| X-Plane 11.11 (2018) | 47 | 33.9 | 30 | 14.1 | |
| Far Cry 5 (2018) | 57 | 26 | 24 | 22 | |
| The Crew 2 (2018) | 60 | 31.5 | 28.3 | 26 | 6.7 |
| F1 2018 (2018) | 80 | 41.9 | 32 | 19.9 | 12 |
| Shadow of the Tomb Raider (2018) | 60 | 21 | |||
| Forza Horizon 4 (2018) | 58 | 31 | 26 | 18 | |
| Assassin´s Creed Odyssey (2018) | 37 | 20 | 16 | ||
| Call of Duty Black Ops 4 (2018) | 81 | 32.1 | 28.2 | 24.6 |
Emissions
System Noise
As per usual for Apple, the new 15-inch MacBook Pro with Kaby Lake is conveniently quiet. Subjectively, the fan behavior does not differ from the old model. Both fans are still running continuously, but you can only hear them a few centimeters from the device in very quiet environments. The MacBook stays quiet for a long time under load – especially under macOS. Apple prefers CPU temperatures above 90 °C (~194 °F) in favor of loud fans. We can only assume the long-term effects, but you benefit from quiet fans and you can usually not hear them in practice. When you hear the fans, the noise is quite pleasant and there are no annoying frequencies.
Apple has also improved the fan control for Windows over time. While the system noise running Windows (Bootcamp) was often noticeably higher, the current MacBook Pro 15 is conveniently quiet during normal workloads and there is no difference between the two operating systems.
Noise level
| Idle |
| 31.3 / 31.3 / 31.7 dB(A) |
| Load |
| 39.7 / 48.6 dB(A) |
 | ||
30 dB silent 40 dB(A) audible 50 dB(A) loud |
||
min: | ||
| Apple MacBook Pro 15 2017 (2.8 GHz, 555) Radeon Pro 555, i7-7700HQ, Apple SSD SM0256L | Apple MacBook Pro 15 2016 (2.6 GHz, 450) Radeon Pro 450, 6700HQ, Apple SSD SM0256L | Apple MacBook Pro 15 2016 (2.7 GHz, 455) Radeon Pro 455, 6820HQ, Apple SSD SM0512L | Apple MacBook Pro 15 2016 (2.9 GHz, 460) Radeon Pro 460, 6920HQ, Apple SSD SM1024L | Dell XPS 15 9560 (i7-7700HQ, UHD) GeForce GTX 1050 Mobile, i7-7700HQ, Lite-On CX2-8B512-Q11 | Lenovo ThinkPad P51s 20HB000SGE Quadro M520, i7-7600U, Samsung SSD PM961 1TB M.2 PCIe 3.0 x4 NVMe (MZVLW1T0) | |
|---|---|---|---|---|---|---|
| Noise | 5% | 2% | 6% | -6% | 8% | |
| off / environment * (dB) | 30.9 | 30.4 2% | 30.4 2% | 29 6% | 28.4 8% | 29.2 6% |
| Idle Minimum * (dB) | 31.3 | 30.6 2% | 30.8 2% | 30.3 3% | 29 7% | 29.2 7% |
| Idle Average * (dB) | 31.3 | 30.6 2% | 30.8 2% | 30.3 3% | 29 7% | 29.2 7% |
| Idle Maximum * (dB) | 31.7 | 30.6 3% | 30.8 3% | 30.3 4% | 32.2 -2% | 31.1 2% |
| Load Average * (dB) | 39.7 | 34.7 13% | 38.7 3% | 35.1 12% | 47.1 -19% | 36.7 8% |
| Witcher 3 ultra * (dB) | 35.5 | 52 -46% | ||||
| Load Maximum * (dB) | 48.6 | 46.3 5% | 48.8 -0% | 46 5% | 47.1 3% | 39.4 19% |
* ... smaller is better
Temperature
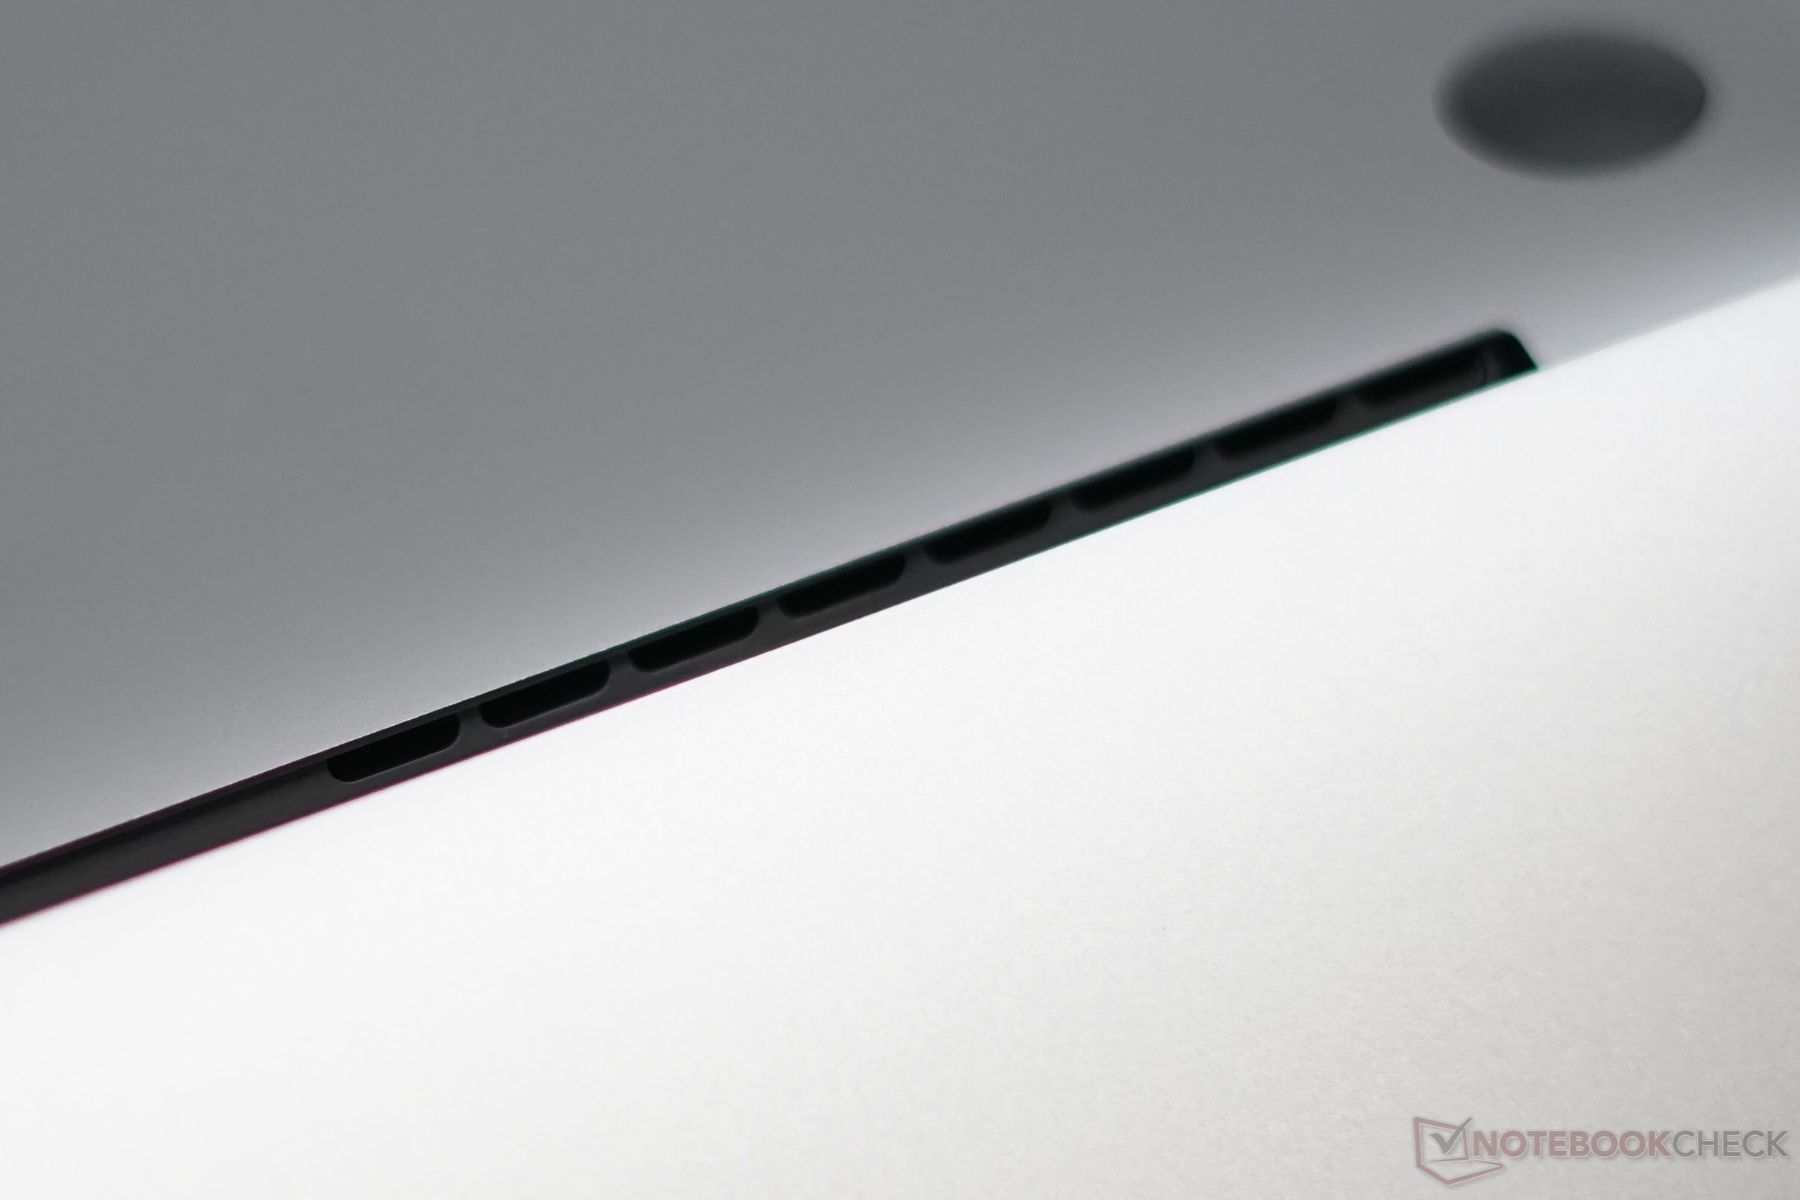
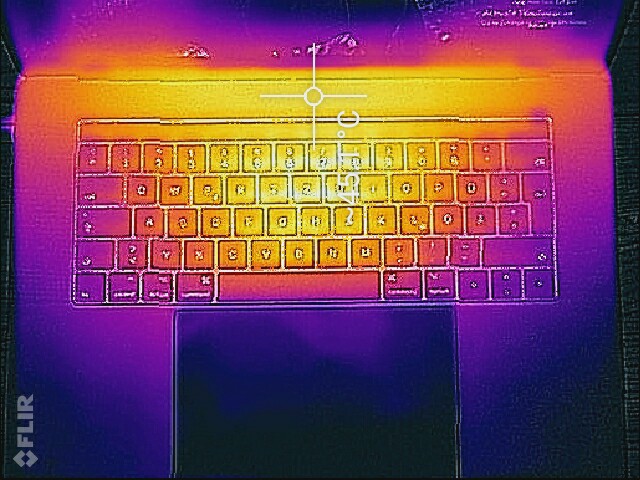
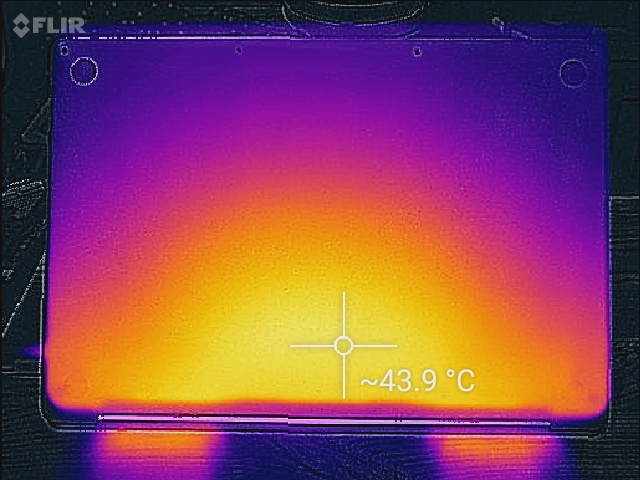
The MacBook Pro hardly warms up while idling, despite the quiet fans. Apple uses the aluminum chassis to dissipate the heat under load. We can measure up to 44 °C (~111 °F) above the keyboard, but this is a spot you rarely touch. The palm rests and the individual keys stay conveniently cool.
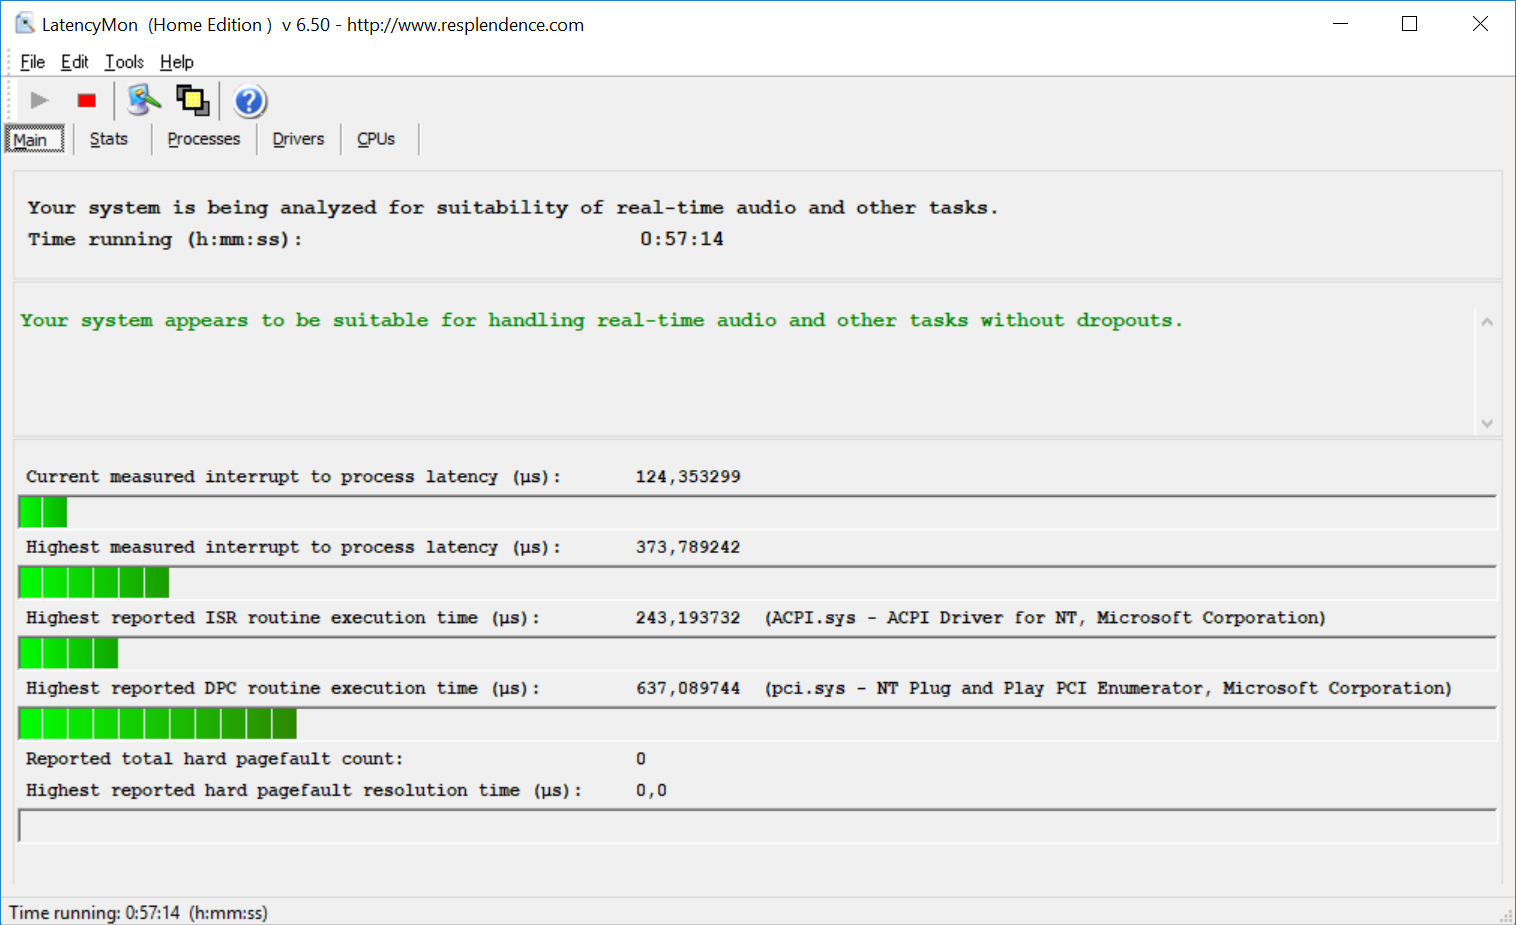
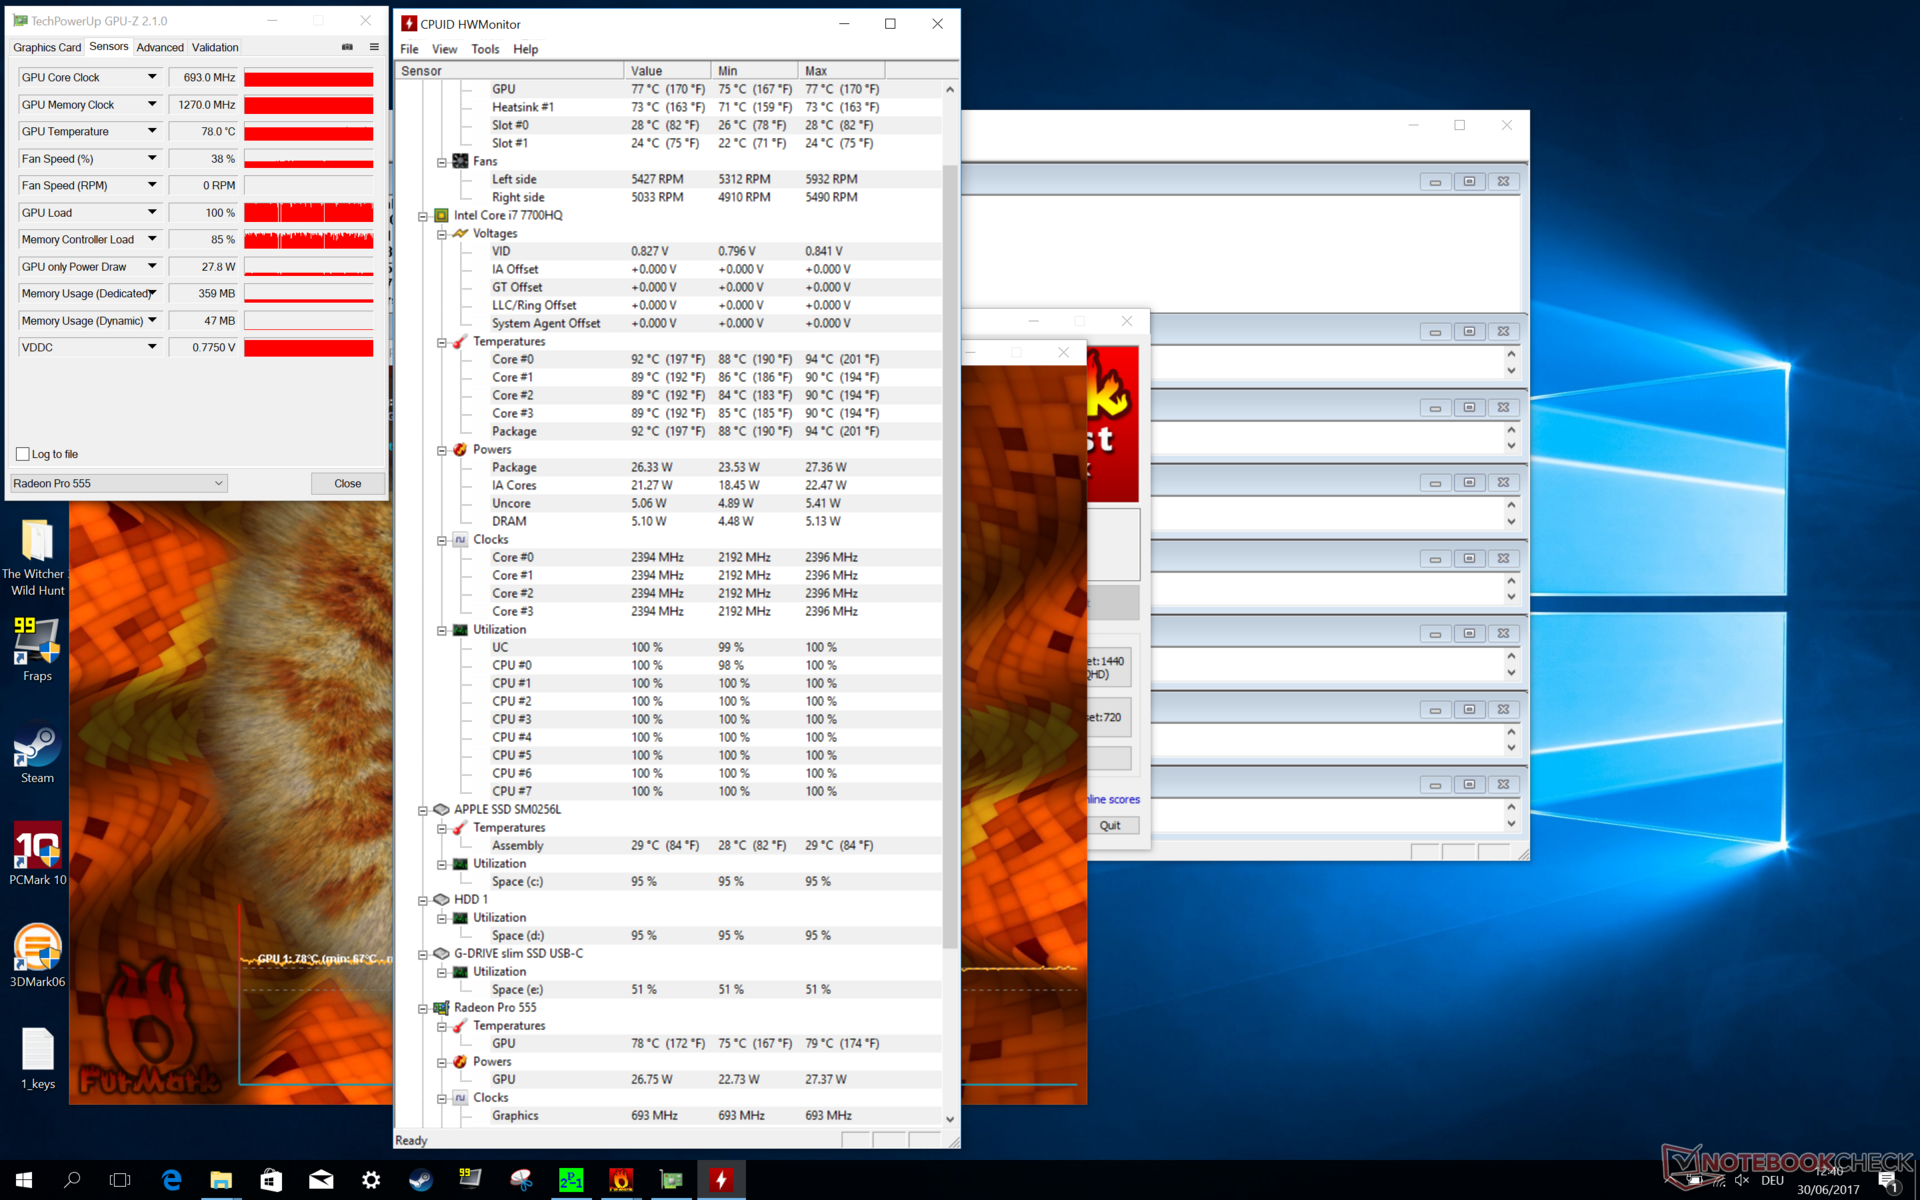
We stress the two components with the tools Prime95 and FurMark (Windows Bootcamp). The processor quickly reaches temperatures of above 90 °C (~194 °F) and reduces its clock. We can see fluctuations between 2.2 and 2.4 GHz over the course of the test. The graphics card also runs at a slightly lower clock (693 MHz), but the GPU is cooler at 78 °C (~172 °F). The very demanding 3DMark Time Spy stress test was passed, so there should not be any limitations in practice, even when you are running Windows.
(±) The maximum temperature on the upper side is 44 °C / 111 F, compared to the average of 36.8 °C / 98 F, ranging from 21 to 71 °C for the class Multimedia.
(±) The bottom heats up to a maximum of 41 °C / 106 F, compared to the average of 39.1 °C / 102 F
(+) In idle usage, the average temperature for the upper side is 22.8 °C / 73 F, compared to the device average of 31.3 °C / 88 F.
(±) Playing The Witcher 3, the average temperature for the upper side is 36.6 °C / 98 F, compared to the device average of 31.3 °C / 88 F.
(+) The palmrests and touchpad are cooler than skin temperature with a maximum of 30 °C / 86 F and are therefore cool to the touch.
(±) The average temperature of the palmrest area of similar devices was 28.7 °C / 83.7 F (-1.3 °C / -2.3 F).
Speakers
The two stereo speakers are convincing, despite the slim construction of the MBP 15. The 2016 model shows a very similar result with slightly weaker high tones. It is hard to say whether this is a result of driver improvements, hardware, or normal variation. Compared to the smaller MacBook 12 and MacBook Pro 13, we can even see better results for the high and low tones in the frequency diagram. The direct competitor Dell XPS 15 9560 is beaten in all measured factors.
Apple MacBook Pro 15 2017 (2.8 GHz, 555) audio analysis
(+) | speakers can play relatively loud (87 dB)
Bass 100 - 315 Hz
(±) | reduced bass - on average 8.7% lower than median
(±) | linearity of bass is average (11.1% delta to prev. frequency)
Mids 400 - 2000 Hz
(+) | balanced mids - only 2.5% away from median
(±) | linearity of mids is average (7.5% delta to prev. frequency)
Highs 2 - 16 kHz
(+) | balanced highs - only 1.7% away from median
(+) | highs are linear (5% delta to prev. frequency)
Overall 100 - 16.000 Hz
(+) | overall sound is linear (7.9% difference to median)
Compared to same class
» 7% of all tested devices in this class were better, 2% similar, 91% worse
» The best had a delta of 5%, average was 17%, worst was 45%
Compared to all devices tested
» 2% of all tested devices were better, 1% similar, 98% worse
» The best had a delta of 4%, average was 23%, worst was 134%
Apple MacBook Pro 13 2017 Touchbar i5 audio analysis
(+) | speakers can play relatively loud (86.2 dB)
Bass 100 - 315 Hz
(±) | reduced bass - on average 11.5% lower than median
(±) | linearity of bass is average (10.8% delta to prev. frequency)
Mids 400 - 2000 Hz
(±) | higher mids - on average 5.2% higher than median
(+) | mids are linear (6.4% delta to prev. frequency)
Highs 2 - 16 kHz
(+) | balanced highs - only 2.2% away from median
(+) | highs are linear (5.7% delta to prev. frequency)
Overall 100 - 16.000 Hz
(+) | overall sound is linear (11.9% difference to median)
Compared to same class
» 13% of all tested devices in this class were better, 5% similar, 82% worse
» The best had a delta of 5%, average was 18%, worst was 53%
Compared to all devices tested
» 9% of all tested devices were better, 2% similar, 89% worse
» The best had a delta of 4%, average was 23%, worst was 134%
Dell XPS 15 9560 (i7-7700HQ, UHD) audio analysis
(-) | not very loud speakers (70.9 dB)
Bass 100 - 315 Hz
(±) | reduced bass - on average 12.9% lower than median
(±) | linearity of bass is average (14.3% delta to prev. frequency)
Mids 400 - 2000 Hz
(+) | balanced mids - only 3.5% away from median
(±) | linearity of mids is average (8.9% delta to prev. frequency)
Highs 2 - 16 kHz
(+) | balanced highs - only 2.3% away from median
(±) | linearity of highs is average (7.3% delta to prev. frequency)
Overall 100 - 16.000 Hz
(±) | linearity of overall sound is average (16.2% difference to median)
Compared to same class
» 41% of all tested devices in this class were better, 7% similar, 51% worse
» The best had a delta of 5%, average was 17%, worst was 45%
Compared to all devices tested
» 26% of all tested devices were better, 6% similar, 68% worse
» The best had a delta of 4%, average was 23%, worst was 134%
Frequency Comparison (Checkboxes select/deselectable!)
Energy Management
Power Consumption
The power consumption of our test model is higher than that of the 2016 models in some scenarios, which is interesting. We measure 3.4 watts at the lowest luminance, while the 2016 models consume between 2.9 and 4 watts – so the 2017 model is average. However, the new 2017 MacBook consumes 3 watts more on average while idling compared to the 2016 systems. One aspect is the increased maximum luminance of the display, so the additional consumption is justified. We cannot see a big difference under load though. The 3DMark 06 value is on par with the old high-end model, but this is once again a result of the bright display. All tested models are similar under maximum load at 88 to 91 watts.
| Off / Standby | |
| Idle | |
| Load |
|
Key:
min: | |
Battery Runtime
The battery capacity of 76 Wh has not changed. Unlike the smaller MacBook Pro 13 however, we can determine slightly longer battery runtimes compared to the previous models. The battery lasts for one hour under load, but the realistic Wi-Fi test (luminance ~150 nits) runs for almost 11 hours, so the advertised runtime from Apple (10 hours) is slightly exceeded. A 1080p video loop (H.264, no Wi-Fi, 150 nits) stopped at around 8:30 hours – once again comparable to the 2016 model with the Radeon Pro 455.
Our new game test “The Witcher 3” (Bootcamp) revealed a slightly longer runtime of almost 1:30 hours. You can utilize the full performance, so the short runtime is no surprise. We once again check the Wi-Fi runtime in combination with Windows, where the Radeon Pro 555 is always running. The battery dropped to 5% after 5:20 hours and Windows 10 shut down (default setting, the battery capacity drops further on macOS). This is a significant difference to macOS.
| Apple MacBook Pro 15 2017 (2.8 GHz, 555) i7-7700HQ, Radeon Pro 555, 76 Wh | Apple MacBook Pro 15 2016 (2.6 GHz, 450) 6700HQ, Radeon Pro 450, 76 Wh | Apple MacBook Pro 15 2016 (2.7 GHz, 455) 6820HQ, Radeon Pro 455, 76 Wh | Apple MacBook Pro 15 2016 (2.9 GHz, 460) 6920HQ, Radeon Pro 460, 76 Wh | Dell Precision 3520 i7-7820HQ, Quadro M620, 68 Wh | Dell XPS 15 9560 (i7-7700HQ, UHD) i7-7700HQ, GeForce GTX 1050 Mobile, 97 Wh | Lenovo ThinkPad P51s 20HB000SGE i7-7600U, Quadro M520, 104 Wh | |
|---|---|---|---|---|---|---|---|
| Battery runtime | -5% | -6% | -2% | -1% | 19% | 163% | |
| H.264 (h) | 8.5 | 8.6 1% | 9.1 7% | 8.1 -5% | 11.7 38% | ||
| WiFi v1.3 (h) | 10.7 | 10 -7% | 10.6 -1% | 10.3 -4% | 7.6 -29% | 7.2 -33% | 11.9 11% |
| Witcher 3 ultra (h) | 1.5 | ||||||
| Load (h) | 1 | 0.9 -10% | 0.9 -10% | 0.9 -10% | 1.3 30% | 1.7 70% | 5.4 440% |
| Reader / Idle (h) | 16.6 | 13.9 | 26.4 |
Verdict
Pros
Cons
Apple's multimedia notebook MacBook Pro 15 is back on par with the rivals in terms of processor performance thanks to the Kaby Lake update. The new models are therefore more attractive, especially for power users in need of as much CPU performance as possible. Apple also ships the new entry-level model with a slightly more powerful GPU. Its strength is definitely the efficiency and the low heat development.
However, it is hard to find any other reasons that would justify an upgrade. The construction of the keyboard has been slightly reworked, but we cannot evaluate the long-term effects at this point. The screen is still excellent, just like the case and the emissions. The two biggest issues are once again the port selection as well as the price and the hefty premiums for hardware options. Four Thunderbolt 3 ports usually require adapters or hubs, but there can still be issues with 2.4 GHz Wi-Fi networks. As with the previous model, we deduct two percent from the final rating. The entry-level price tag is still high, but the SSD upgrades extremely expensive. However, this does not change the fact that the Apple MacBook Pro 15 is still one of the best multimedia laptops.
Apple MacBook Pro 15 2017 (2.8 GHz, 555)
- 07/07/2017 v6 (old)
Klaus Hinum, Andreas Osthoff
Price comparison
