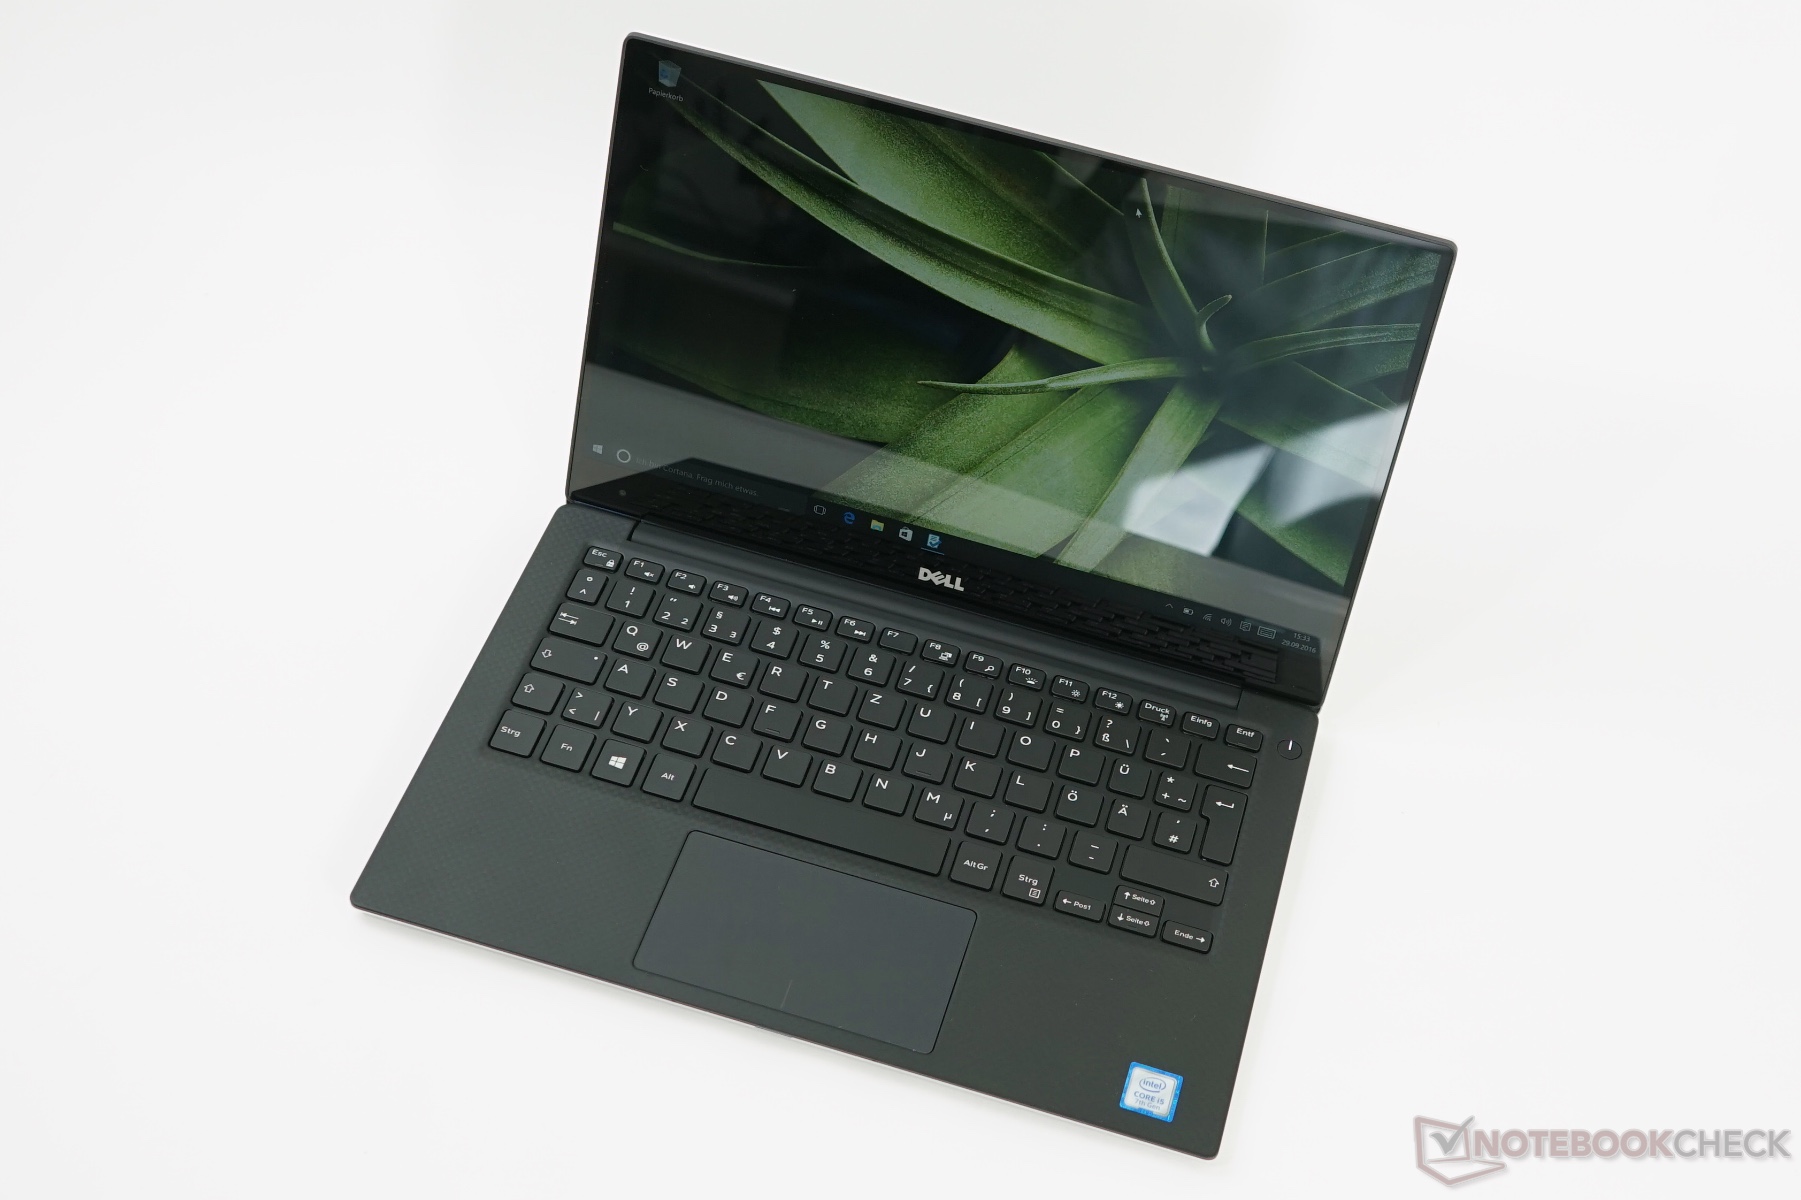
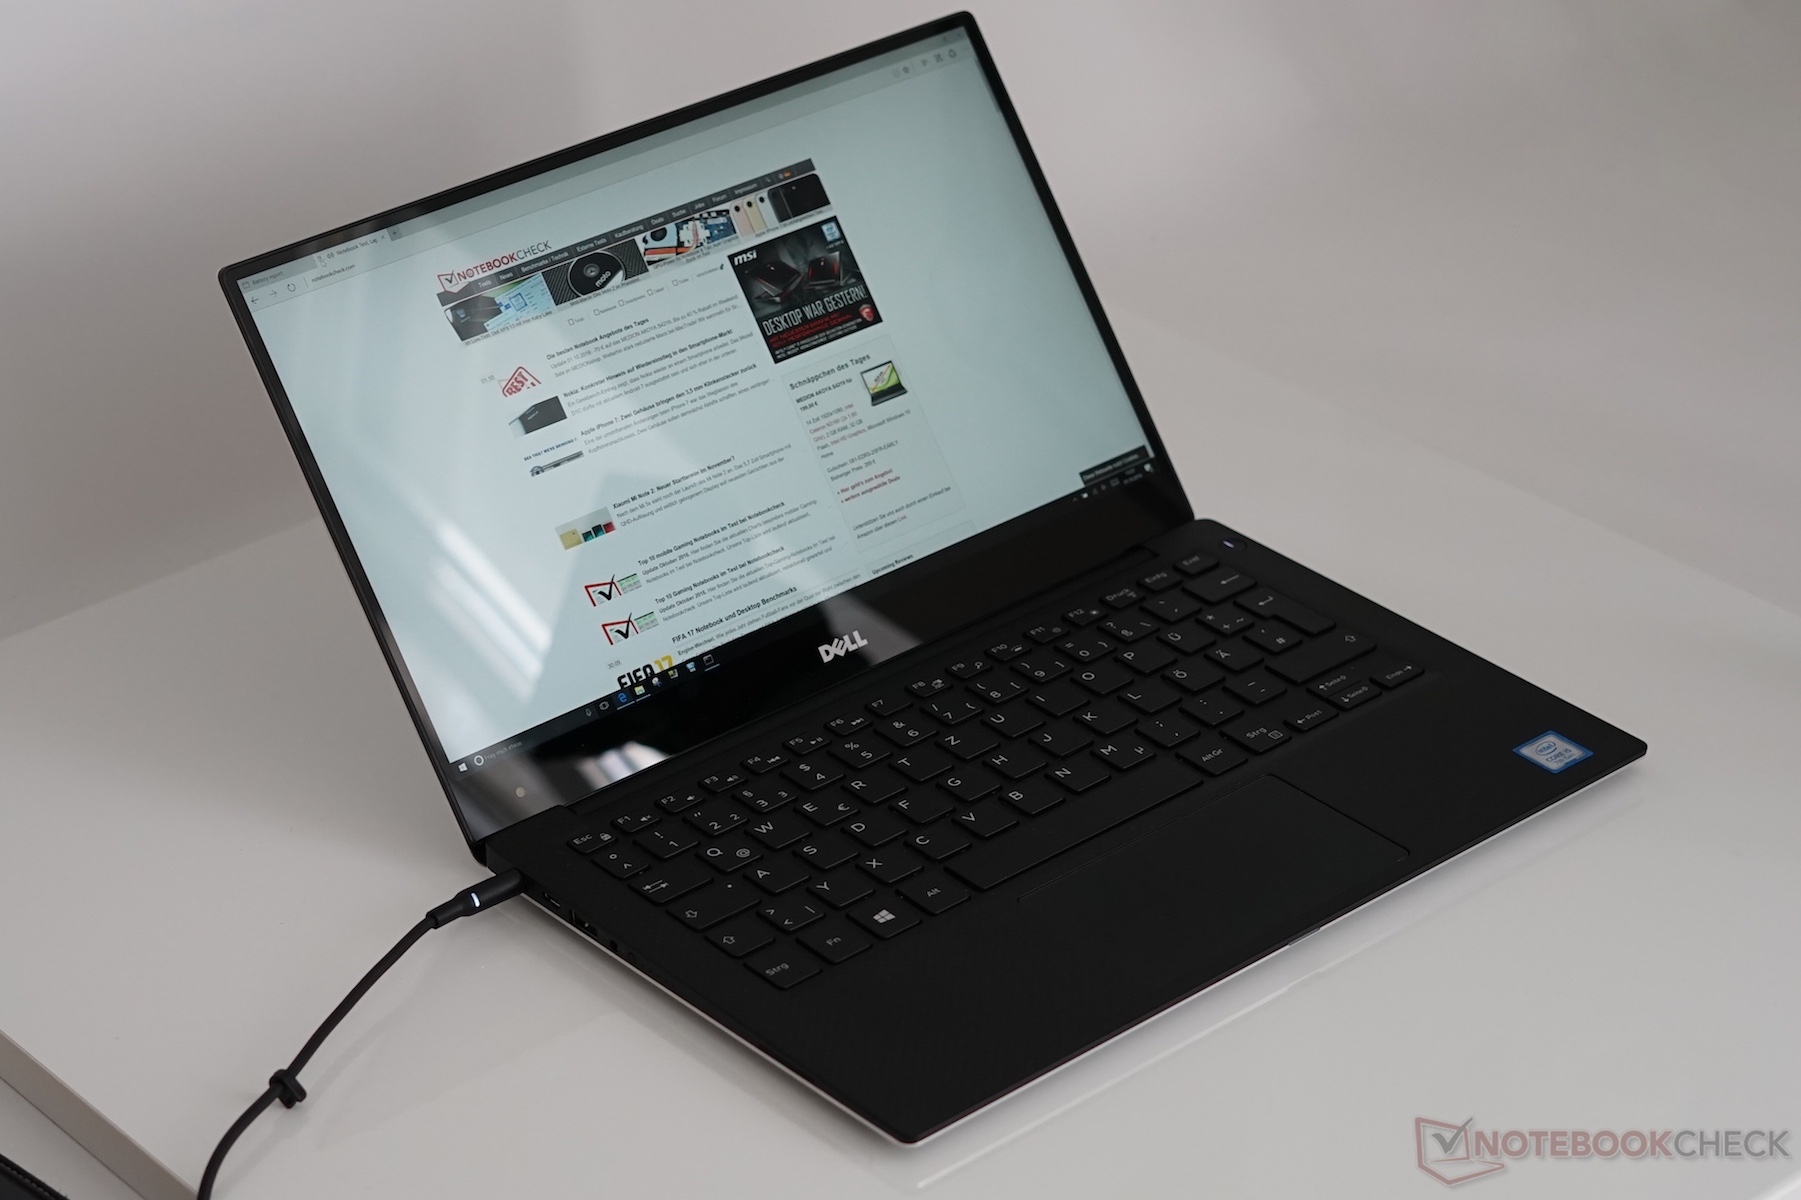
Dell XPS 13 9360 QHD+ i5-7200U Notebook Review

We were already able to get a picture of the performance increase during our review of the Intel's new Kaby Lake processor generation. The CPU should be between 10-15 % faster, while the new integrated graphics adapter Intel HD Graphics 620 was up to 30 % faster depending on the test. This means the GPU gets closer to the Intel Iris Graphics 540, which is handling the graphics output in the XPS 13 configurations with the i7-6560U CPU, but it is still 20 % slower. The new i5-7200U entry-level CPU is at least on par with the previous i7-6560U top configuration in terms of processing performance.
Over the course of the following article, we will have a closer look at numerous benchmarks, check how well the XPS 13 can utilize its alleged performance upgrade and also measure the emissions including temperature and system noise. The review will be updated and completed over the next couple of days.
Changelog
- 09/29/2016 19:02 – PCMark 8 added and analyzed
- 09/29/2016 20:55 – 3DMark Stress Test added – XPS 13 just fails
- 09/29/2016 22:35 – Killer WiFi card shows good performance
- 09/29/2016 23:25 – Initial display measurements
- 09/30/2016 15:09 – Temperature and thermal images
- 09/30/2016 15:43 – Pink Noise and audio analysis added
- 09/30/2016 16:07 – System noise added
- 10/04/2016 10:09 – Added Wifi battery test, PWM and response time tests, countless benchmarks
- 10/04/2016 12:30 – Maintenance added, Wifi battery runtime added and analyzed
- 10/04/2016 23:30 – Gaming benchmarks analyzed, Fifa 17 added
- 10/05/2016 09:39 – Added The Witcher 3 battery runtime of 2.5 h
- 10/05/2016 15:45 – Performance: Dell has test protocols that might indicate a defect on our test model and the full performance cannot be utilized. We are working on a quick clarification.
- 10/06/2016 17:42 – Added color space size
- 10/09/2016 22:22 – Redone Color space measurements, looks like CABC skewed the remotely done measurements. Directly at the device the measurements are similar to the old QHD+ model.
- 10/13/2016 19:10 – Added power consumption analysis and PSU efficiency. Tested card reader
- 10/14/2016 18:18 – Added thermal paste picture and changed the paste for performance tests
- 10/16/2016 22:18 – Benchmarked League of Legends (LoL)
- 10/17/2016 11:20 – Fan characteristics described after the replacement of the thermal paste
- 10/17/2016 16:00 – Linux compatibility tested


Webcam
The included webcam is still positioned below the screen which leads to an awkward perspective. Furthermore, the quality of the camera is not very good (especially in low light).
SD Card Reader
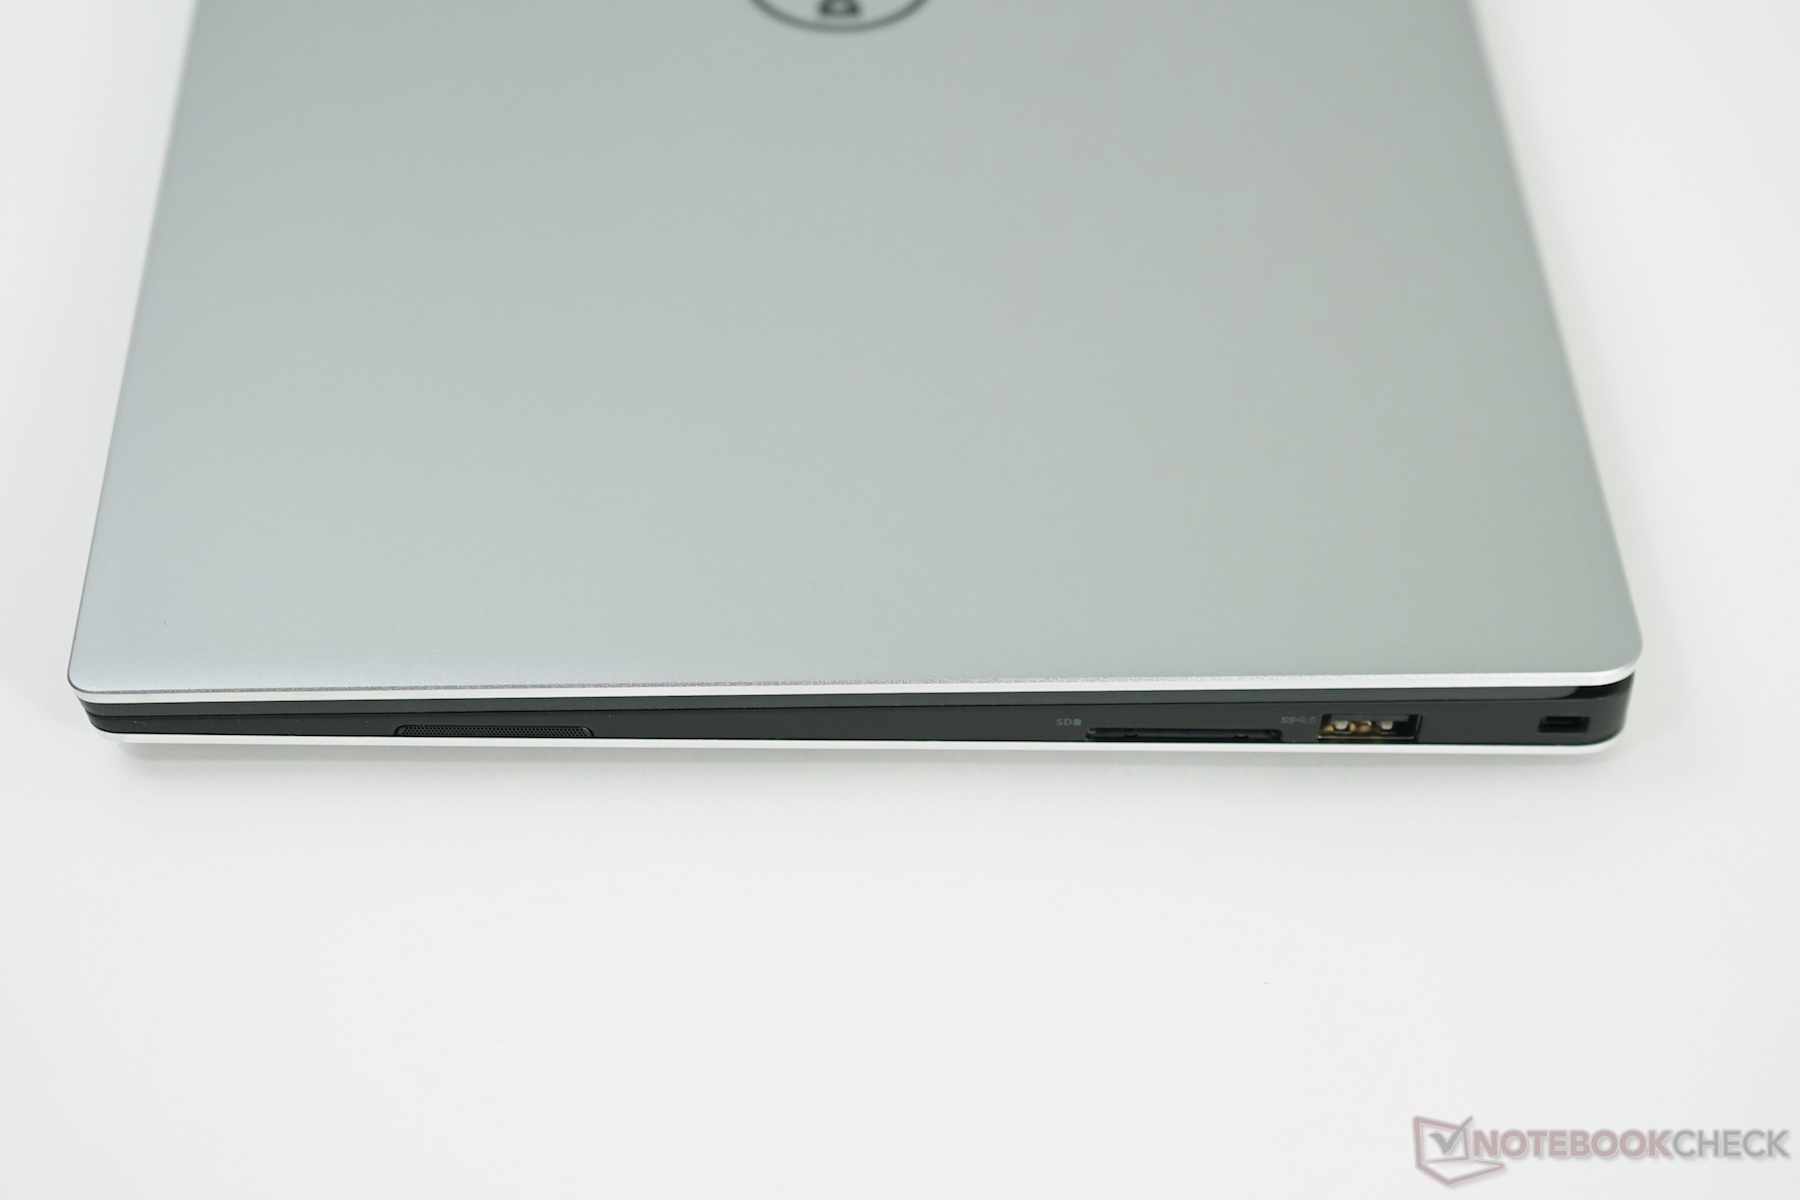
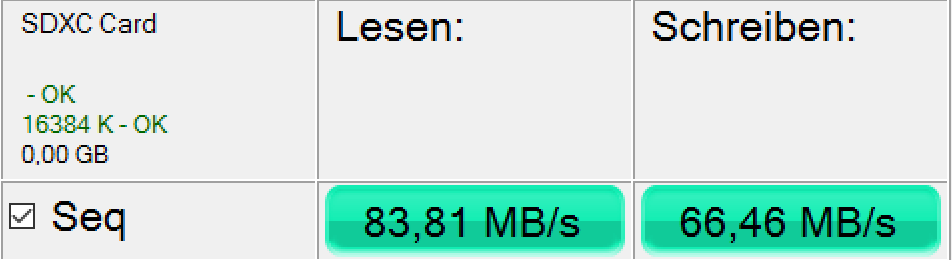
We did not notice any problems when we tested the card reader in combination with a Toshiba microSDXC UHS-I card with 64 GB (up to 95 MB/s read and 80 MB/s write according to the manufacturer) and determined 84 MB/s read and 67 MB/s write in the AS SSD benchmark.
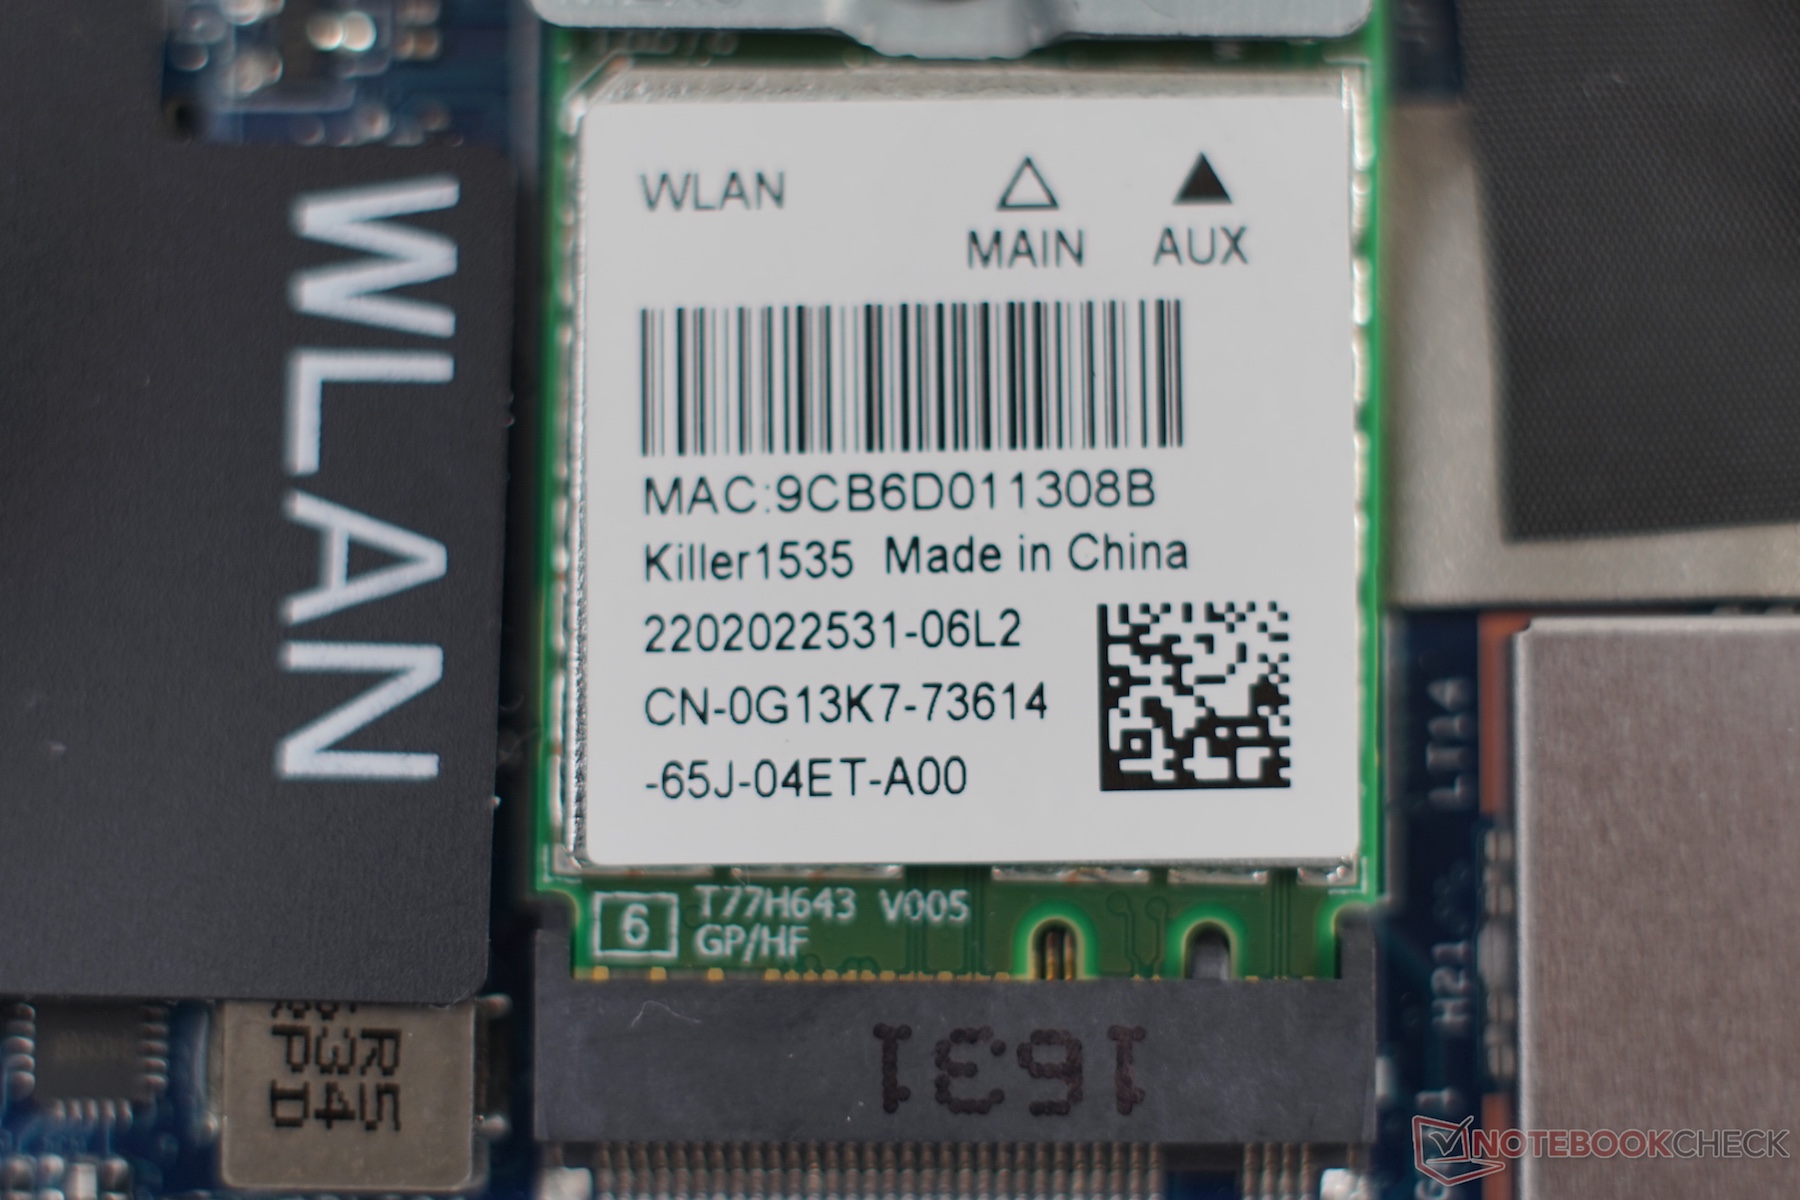
Communication
One new component is the WLAN module from Rivet Networks. Dell decided to implements the Killer 1535 we just recently reviewed. It scores with numerous features and good performance. It even manages a slightly better performance in this case compared to the MSI GT72 and is only beaten by the 3x3 card in the current MacBook Pro Retina notebooks.
| Networking | |
| iperf3 receive AX12 | |
| Apple MacBook Pro Retina 13 inch 2013-10 (Klaus I211) | |
| Dell XPS 13 9360 QHD+ i5 | |
| MSI GT72S-6QEG16SR421BW (Klaus I211) | |
| Lenovo ThinkPad T460s-20FA003GGE | |
| Microsoft Surface Pro 4, Core i5, 128GB (Klaus I211) | |
| Intel NUC5i5RYH (Klaus I211) | |
| MSI PE60 2QD | |
| iperf3 transmit AX12 | |
| Apple MacBook Pro Retina 13 inch 2013-10 (Klaus I211) | |
| Dell XPS 13 9360 QHD+ i5 | |
| MSI GT72S-6QEG16SR421BW (Klaus I211) | |
| Microsoft Surface Pro 4, Core i5, 128GB (Klaus I211) | |
| Intel NUC5i5RYH (Klaus I211) | |
| Lenovo ThinkPad T460s-20FA003GGE | |
| MSI PE60 2QD | |
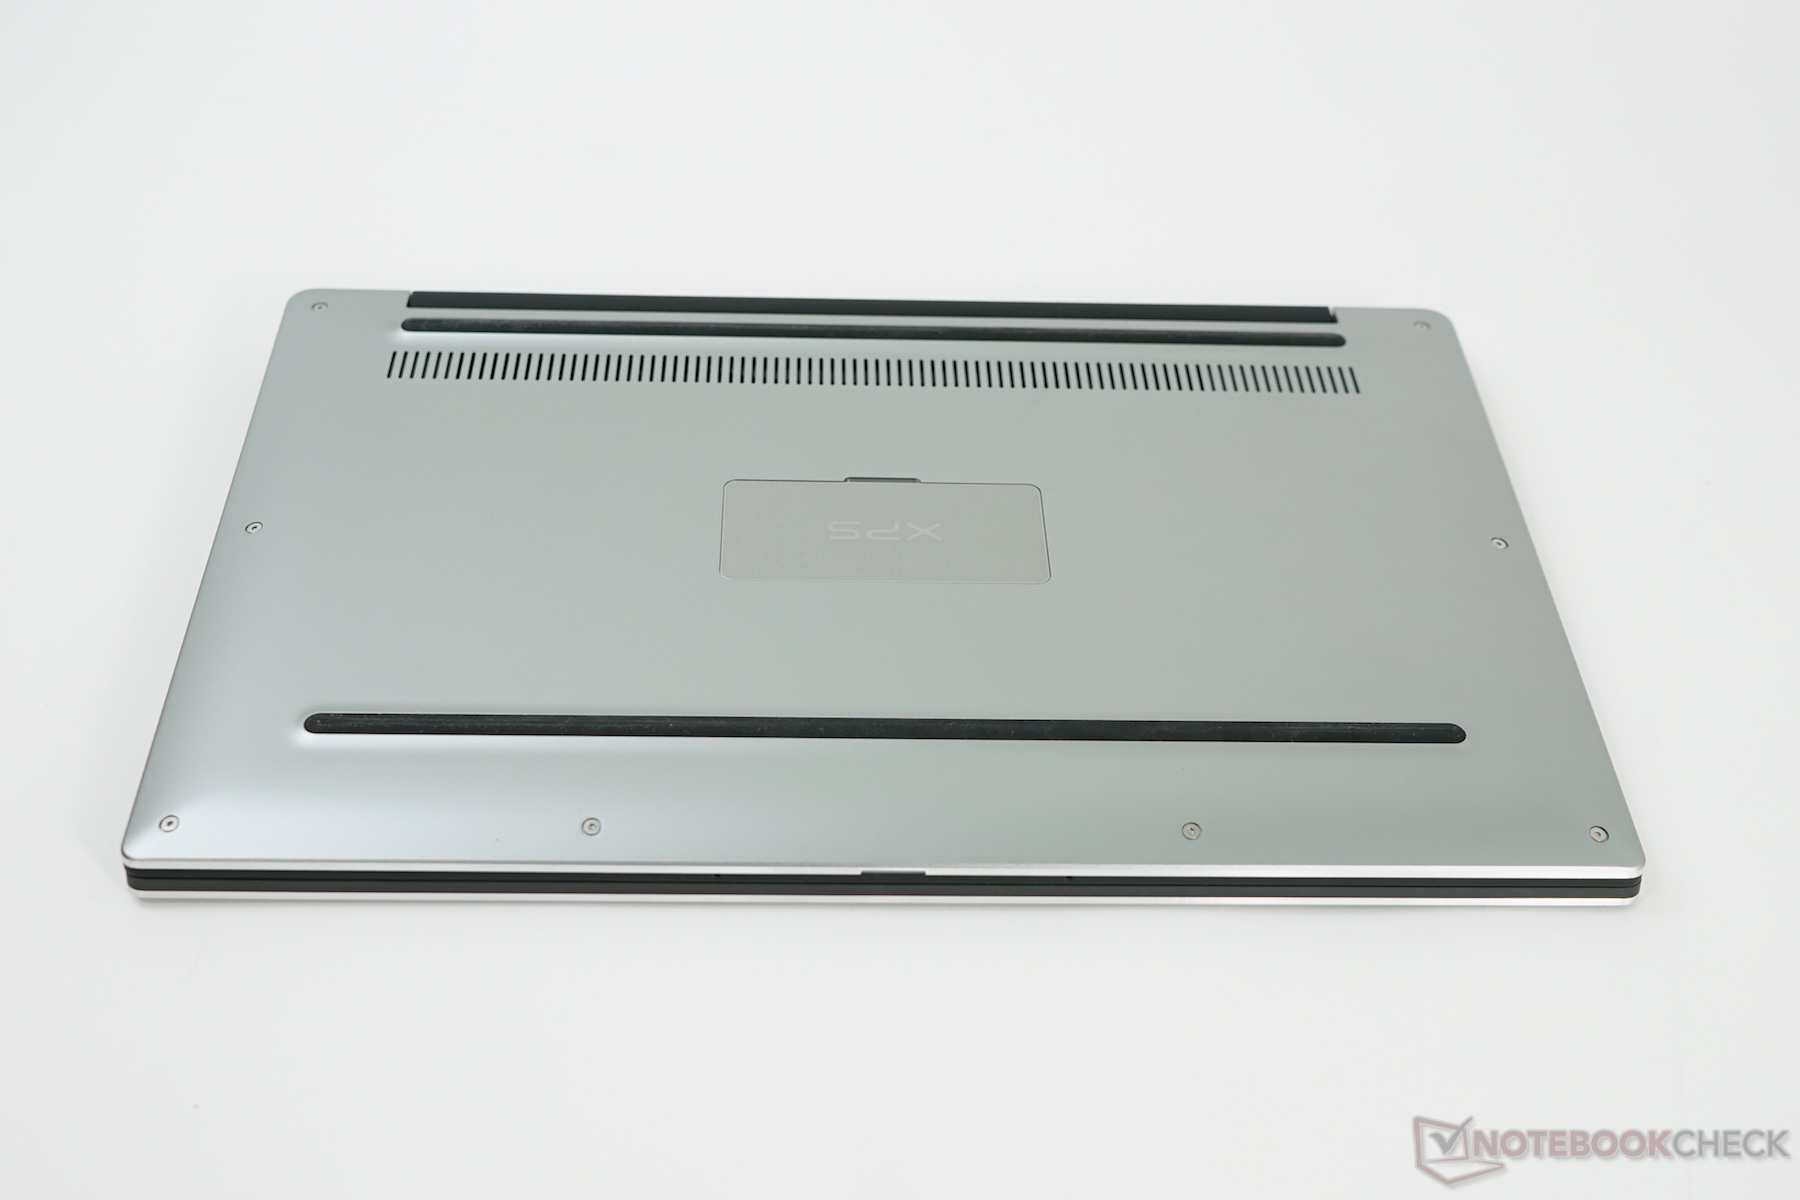
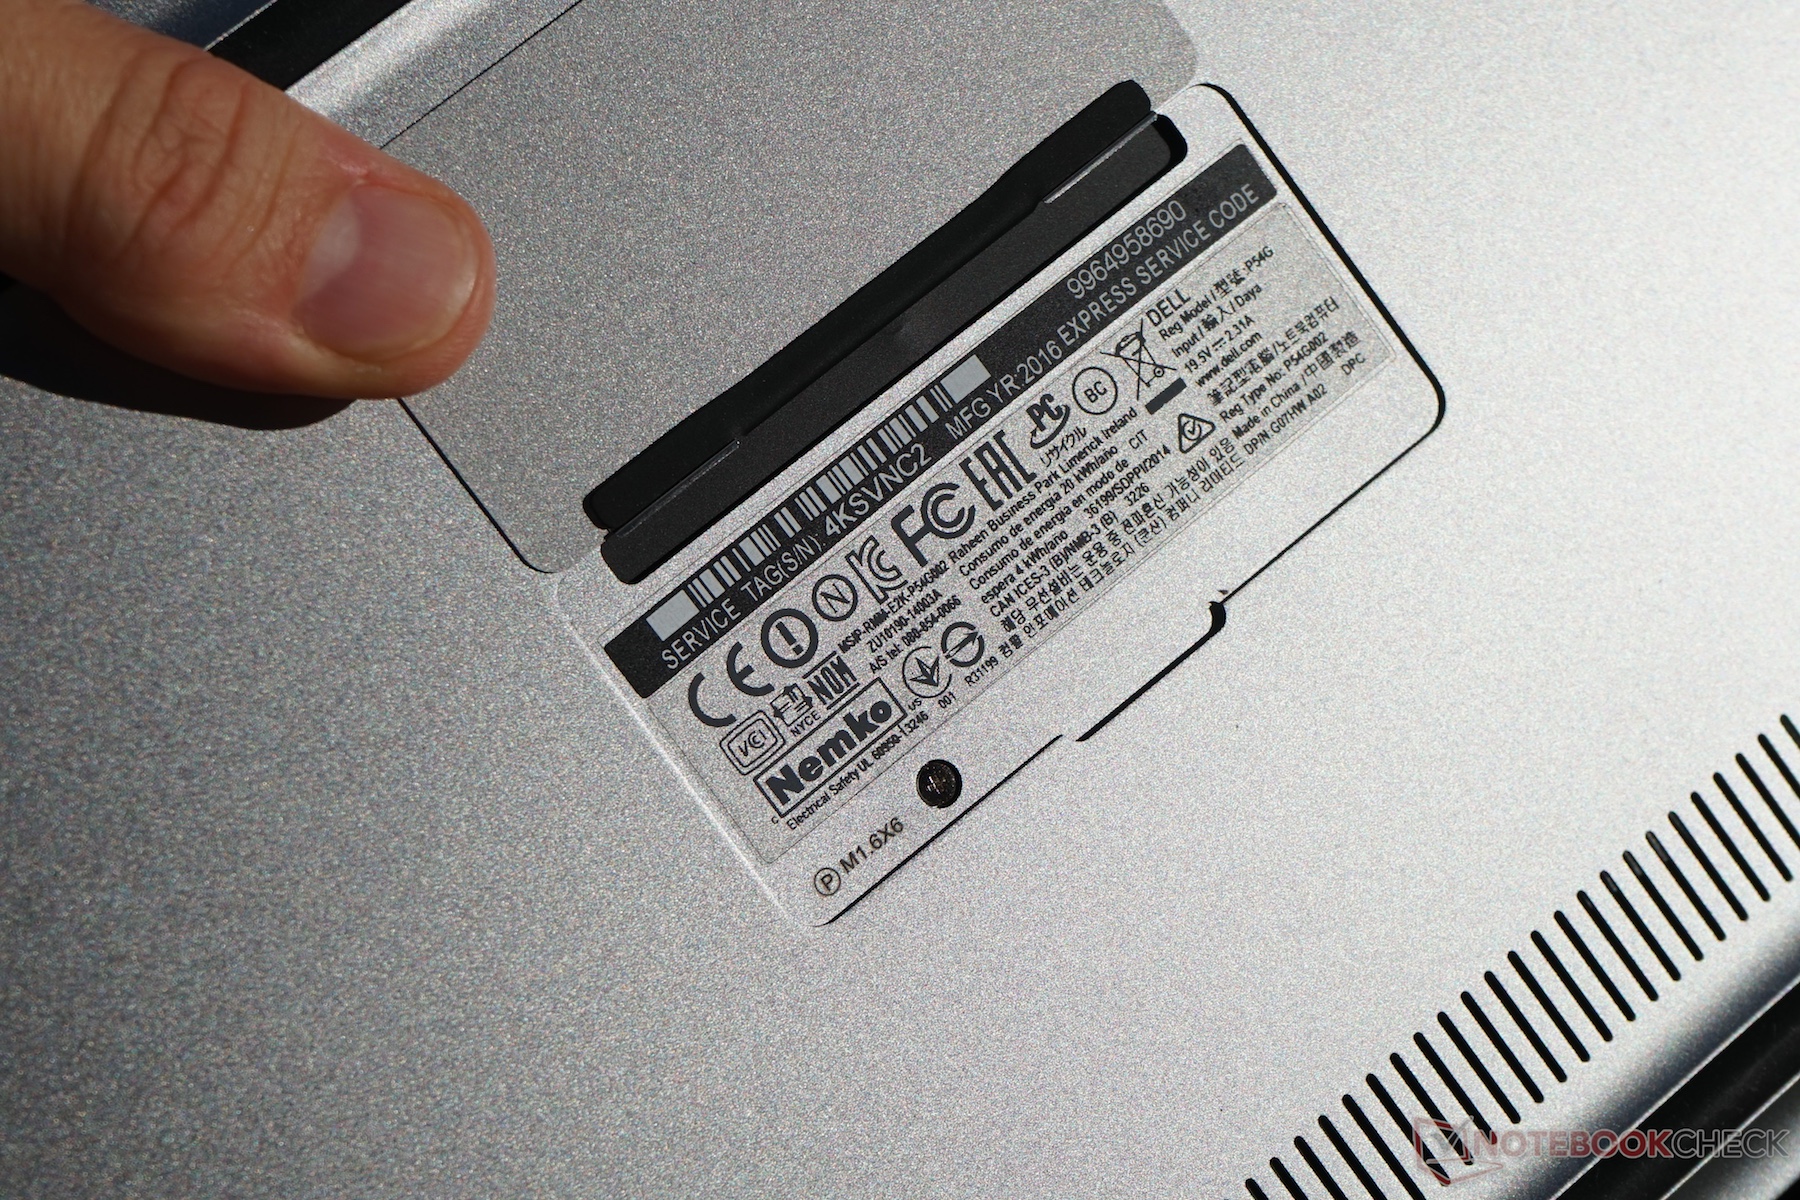
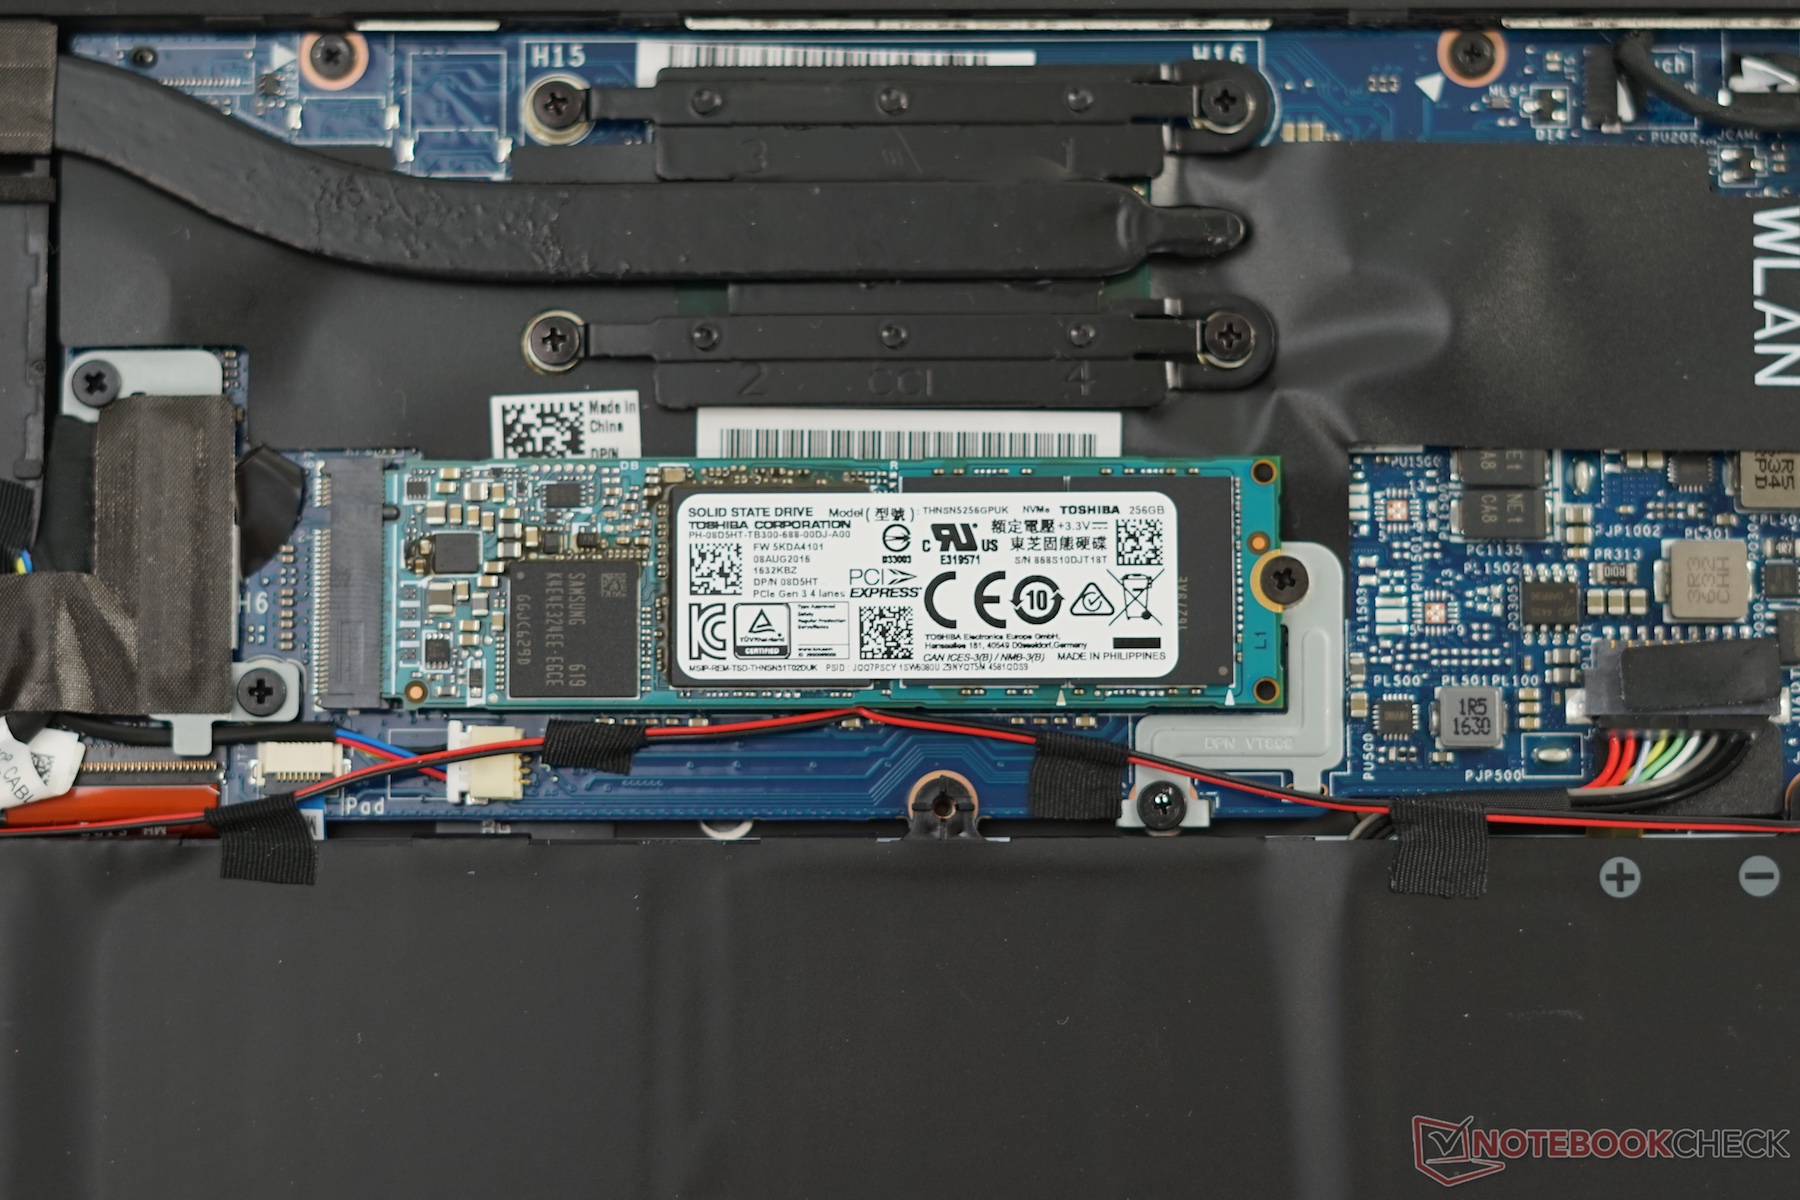
Maintenance
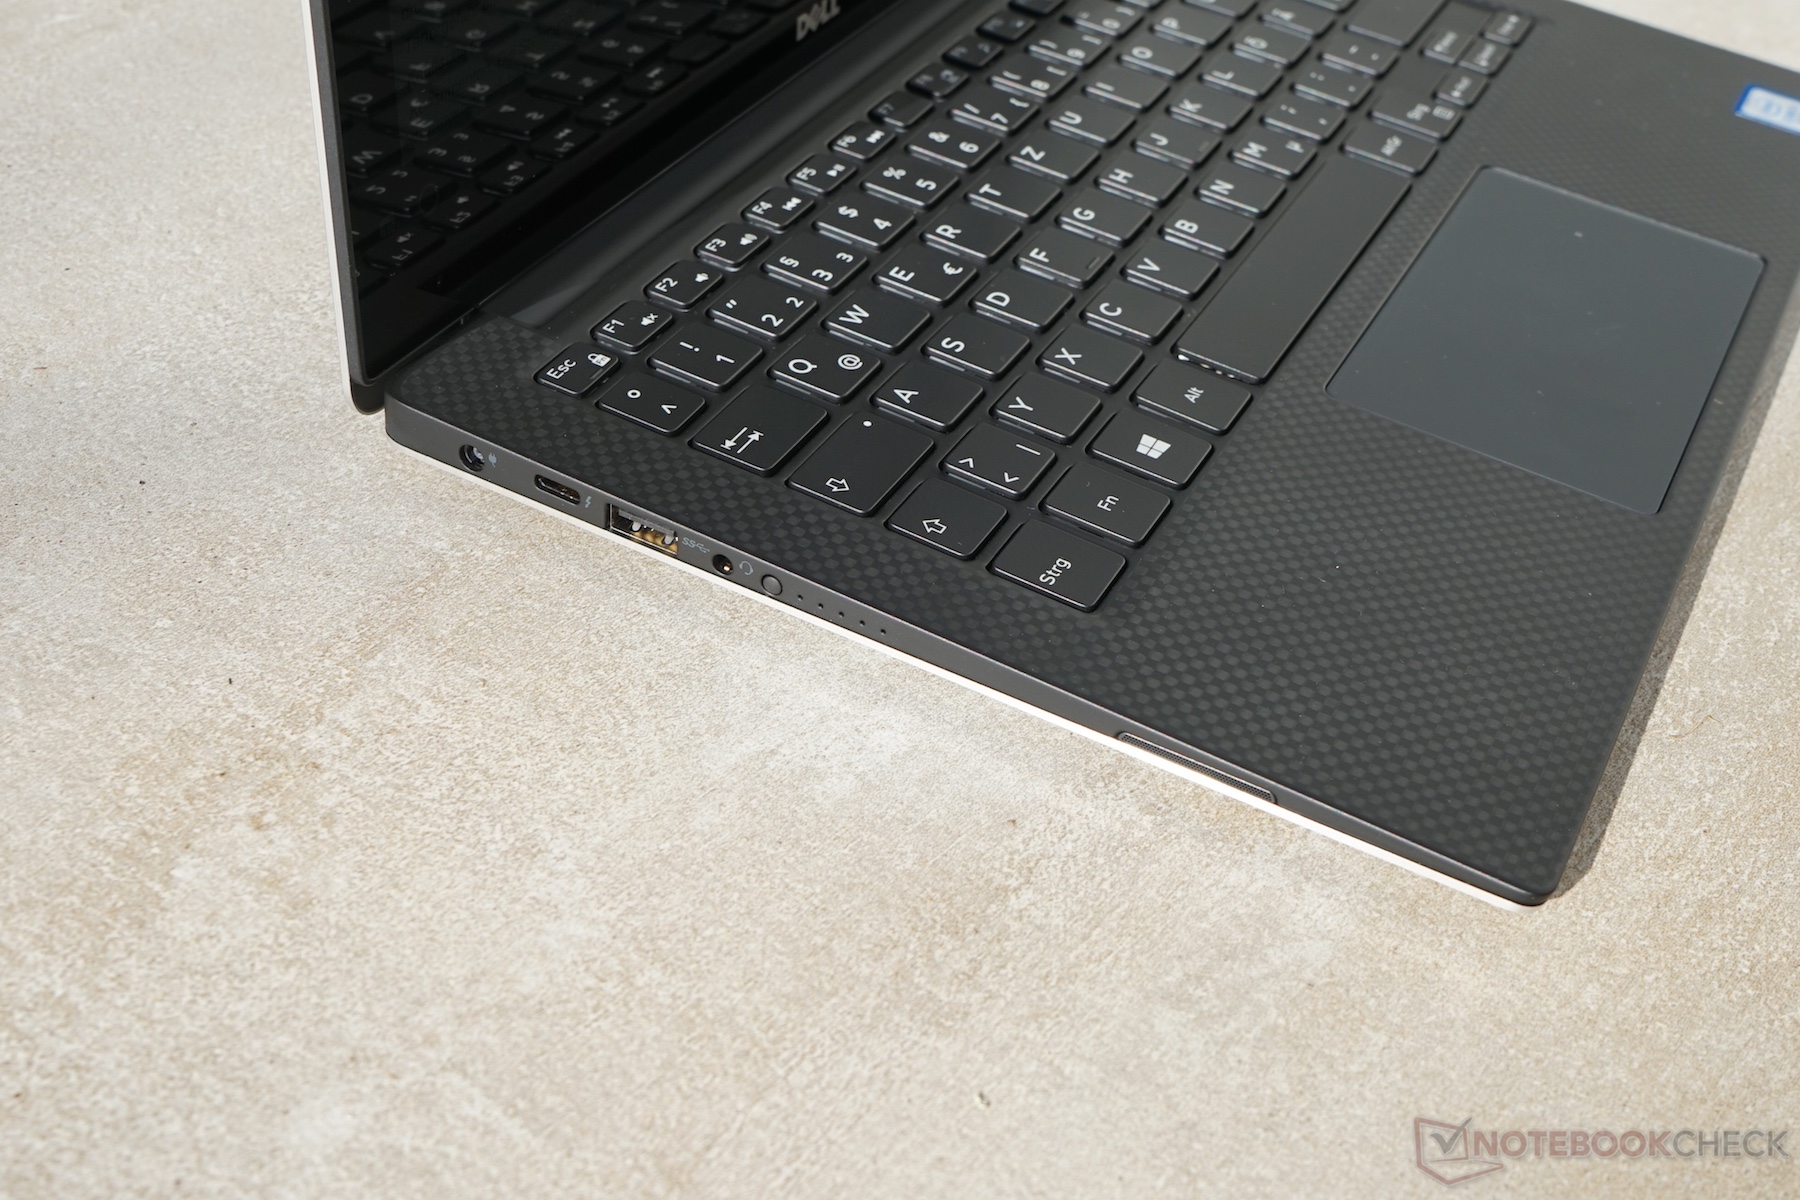
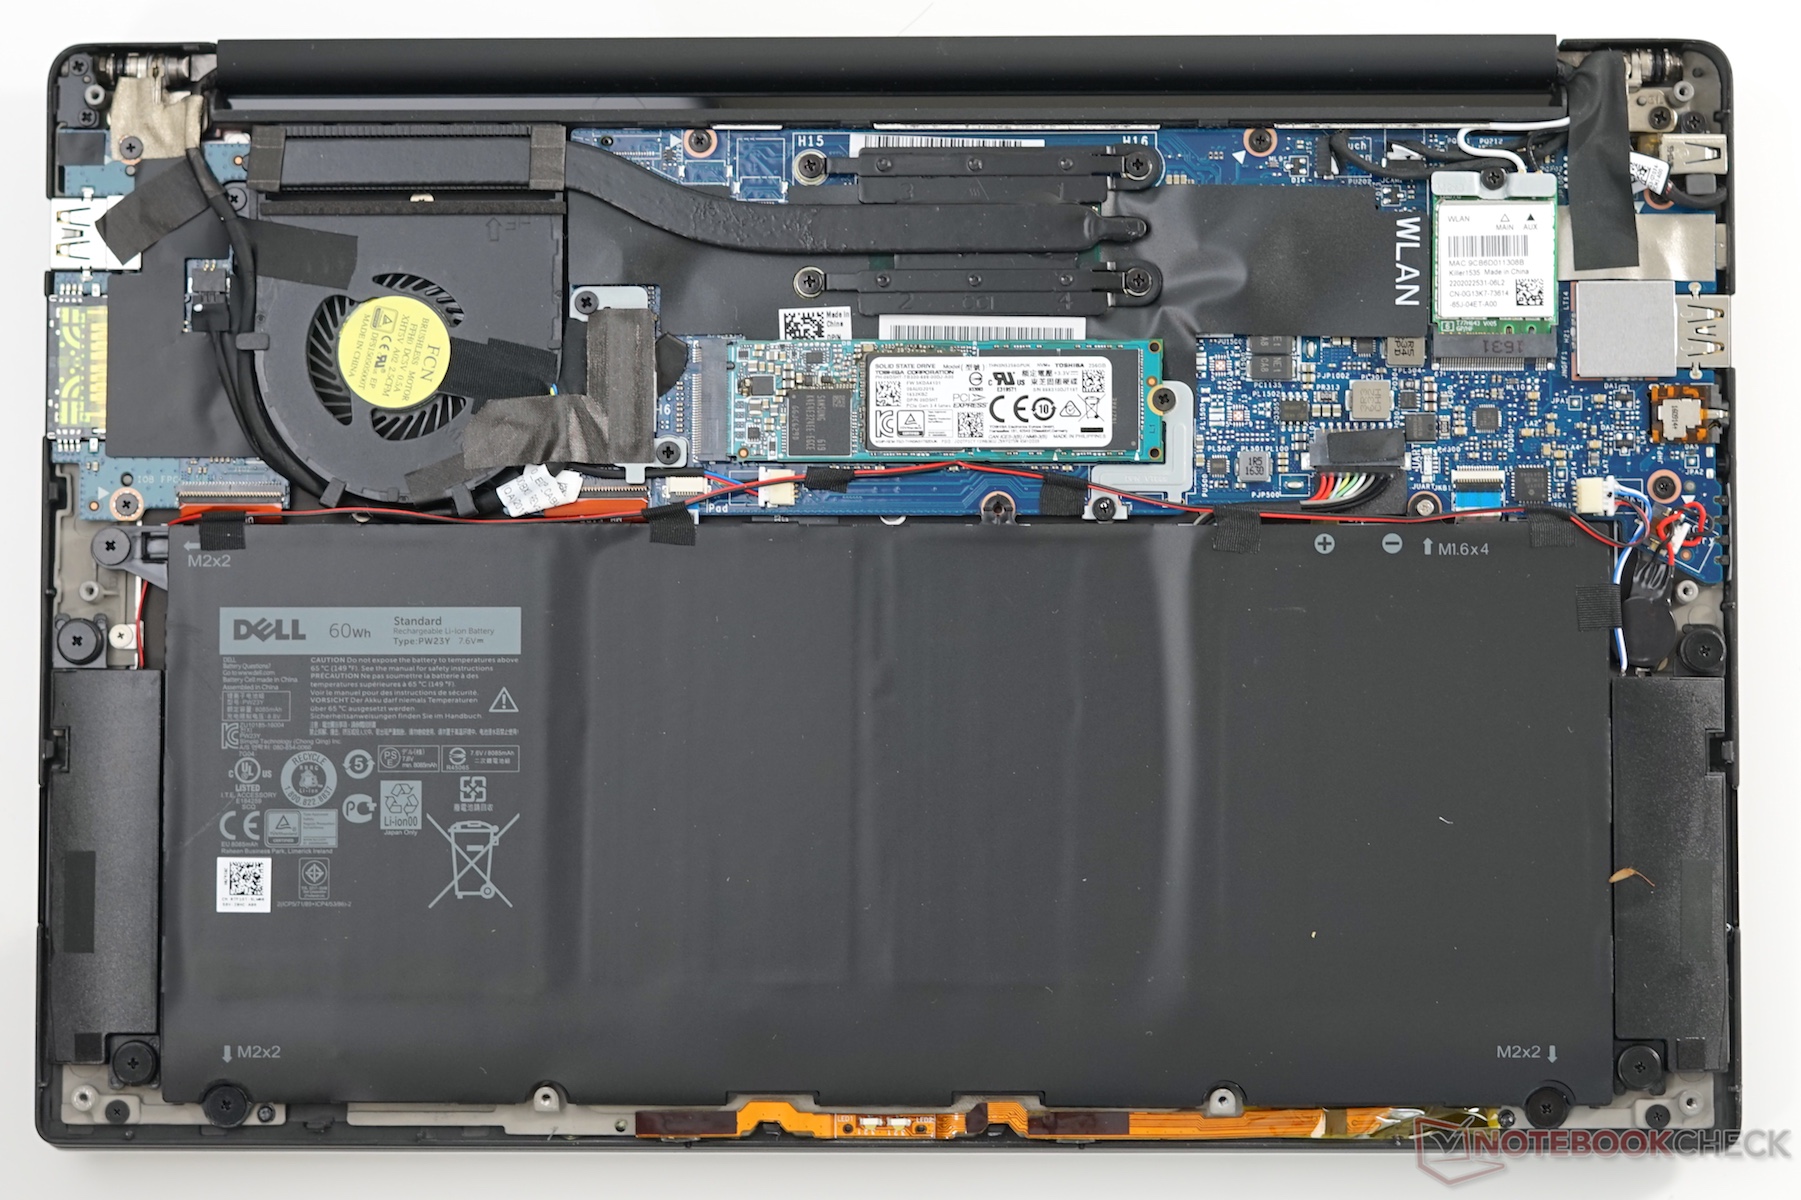
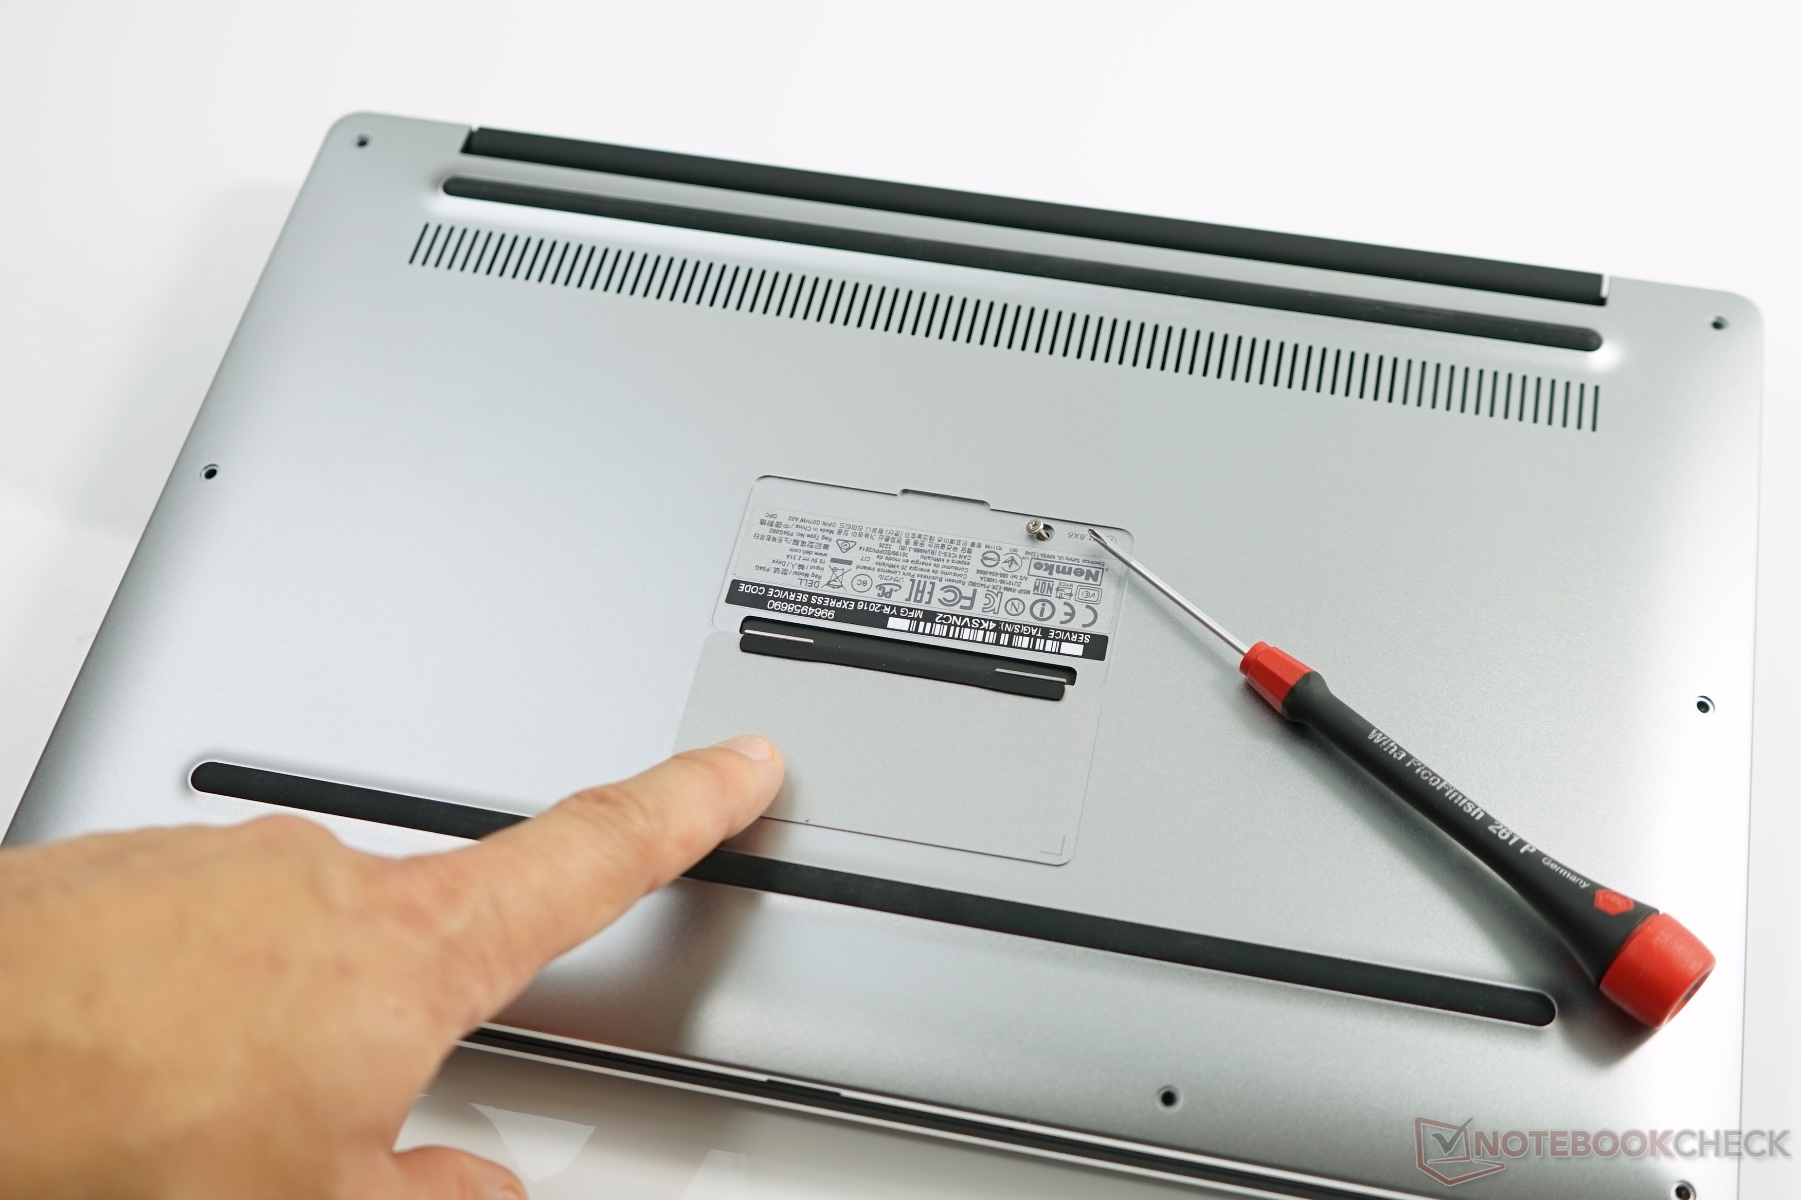
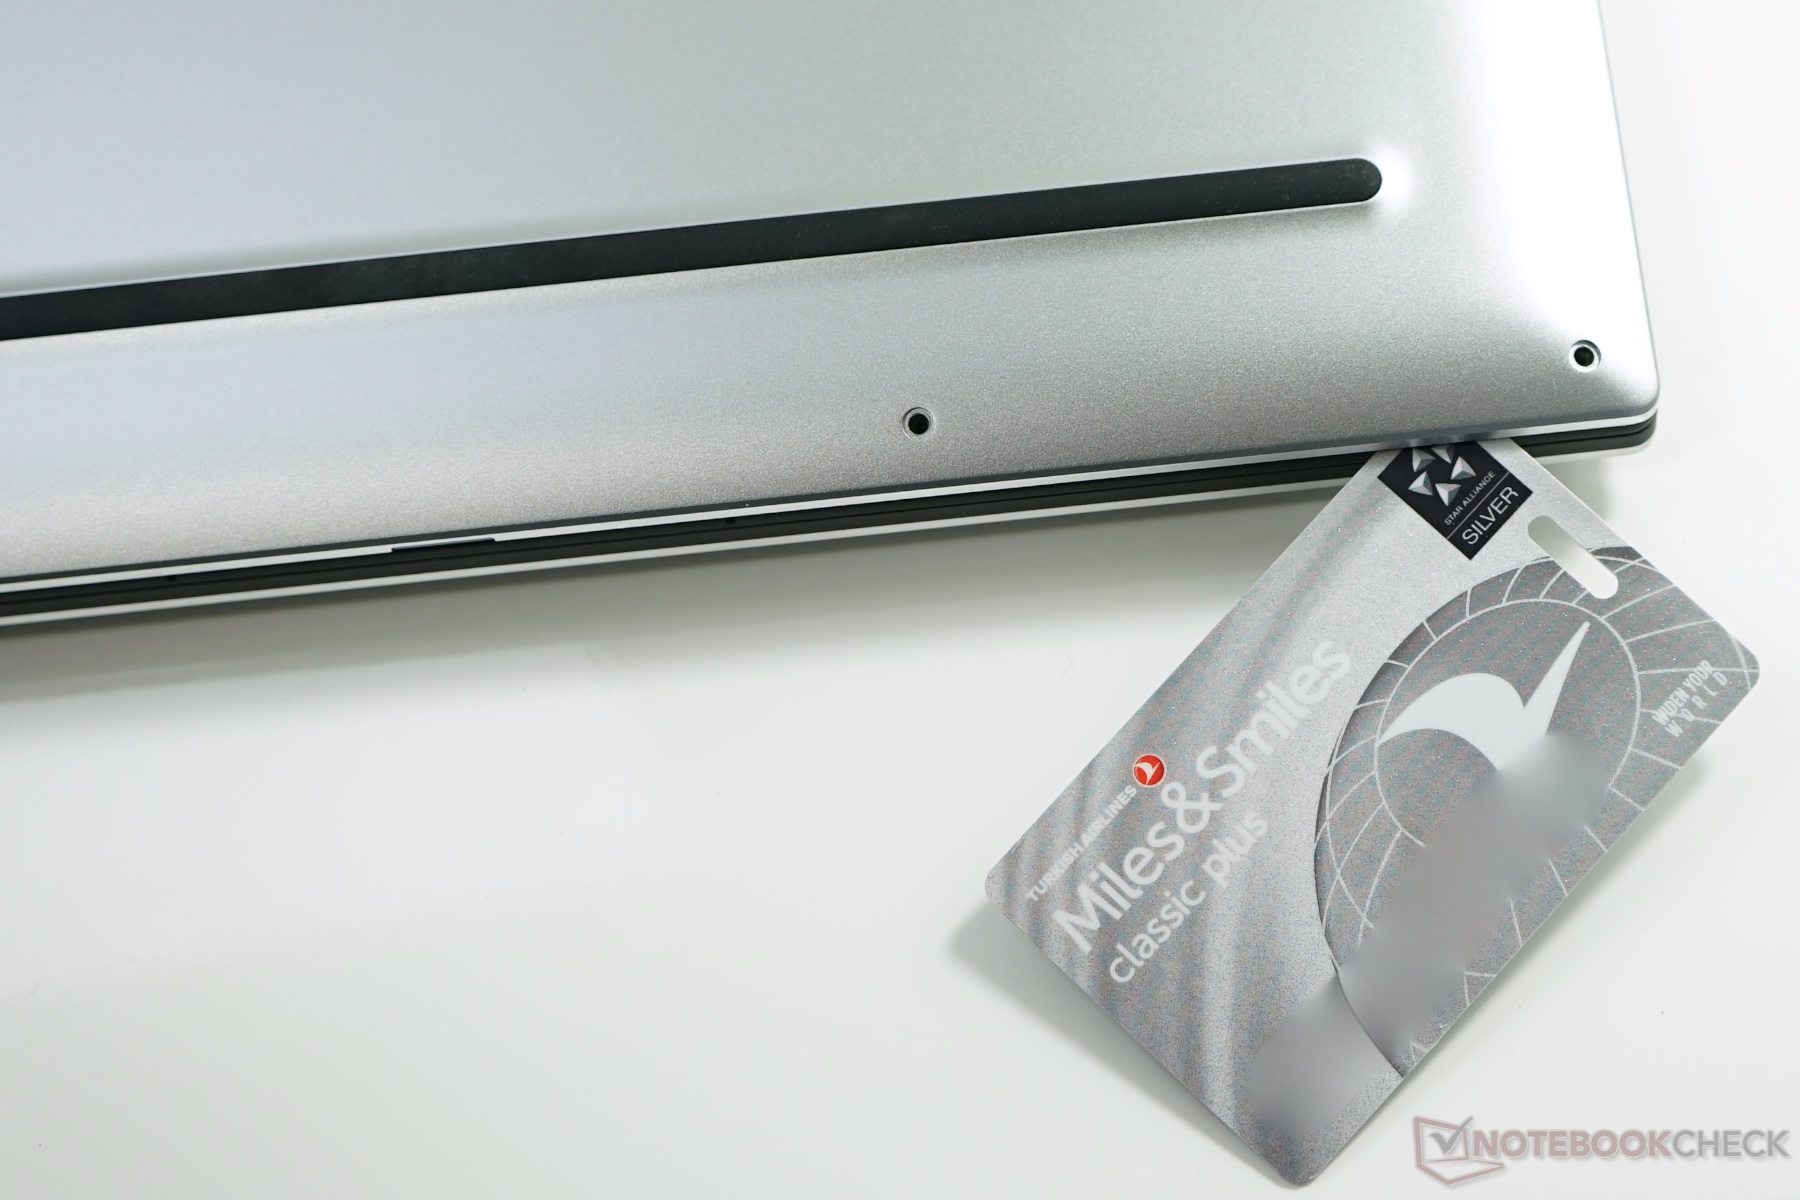
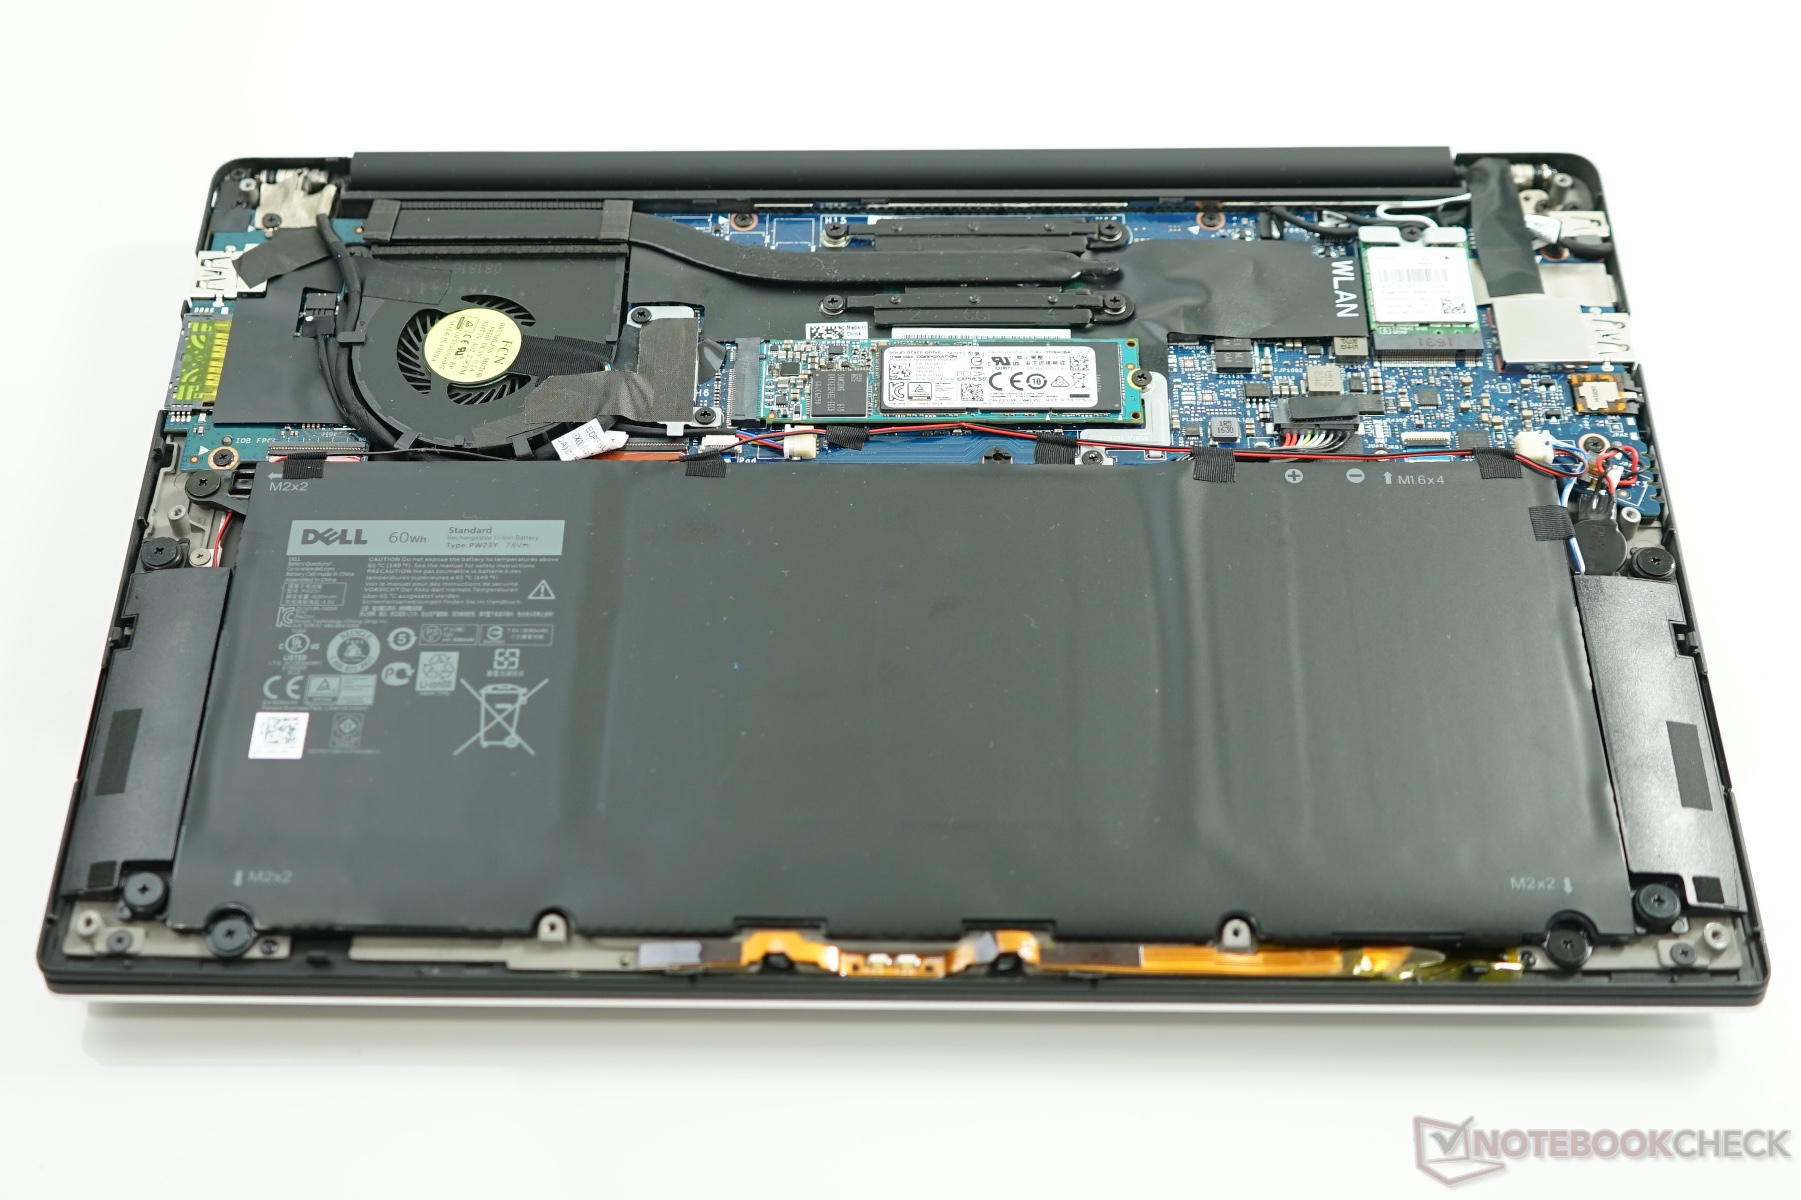
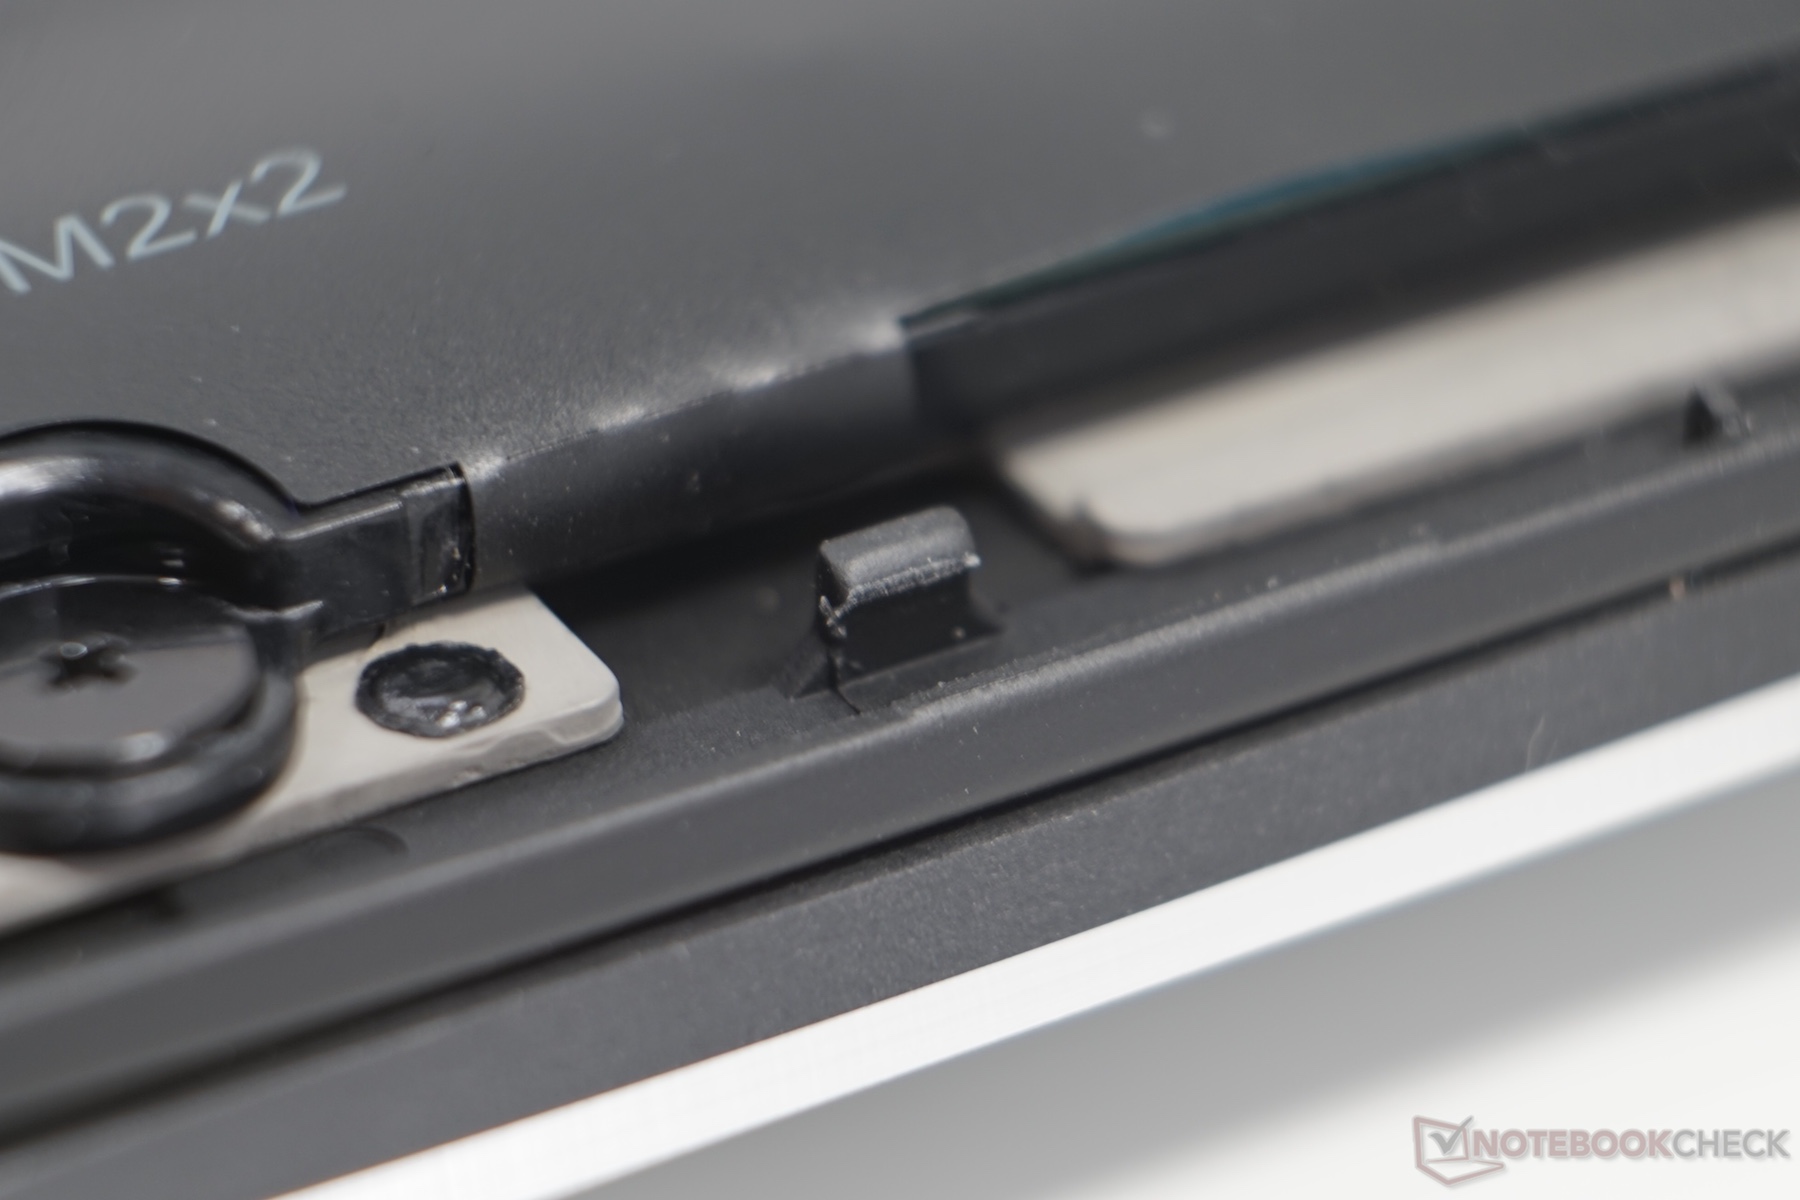
Similar to the previous XPS 13 models, you can access the internal components by removing the bottom panel. The latter is secured by 8 Torx T4 screws, a Philips screw (underneath the magnetic center hatch) as well as plastic clips. The first step is to remove the 9 screws and then you can lift the panel with a sharp object to make room for a credit card. Then you can use it to go around the case to remove the panel. After this you can access the WLAN card, M.2 SSD, battery and the fan. It is no problem to replace the WLAN module and the SSD, and it is also no problem to clean the fan as well as the heat sink.

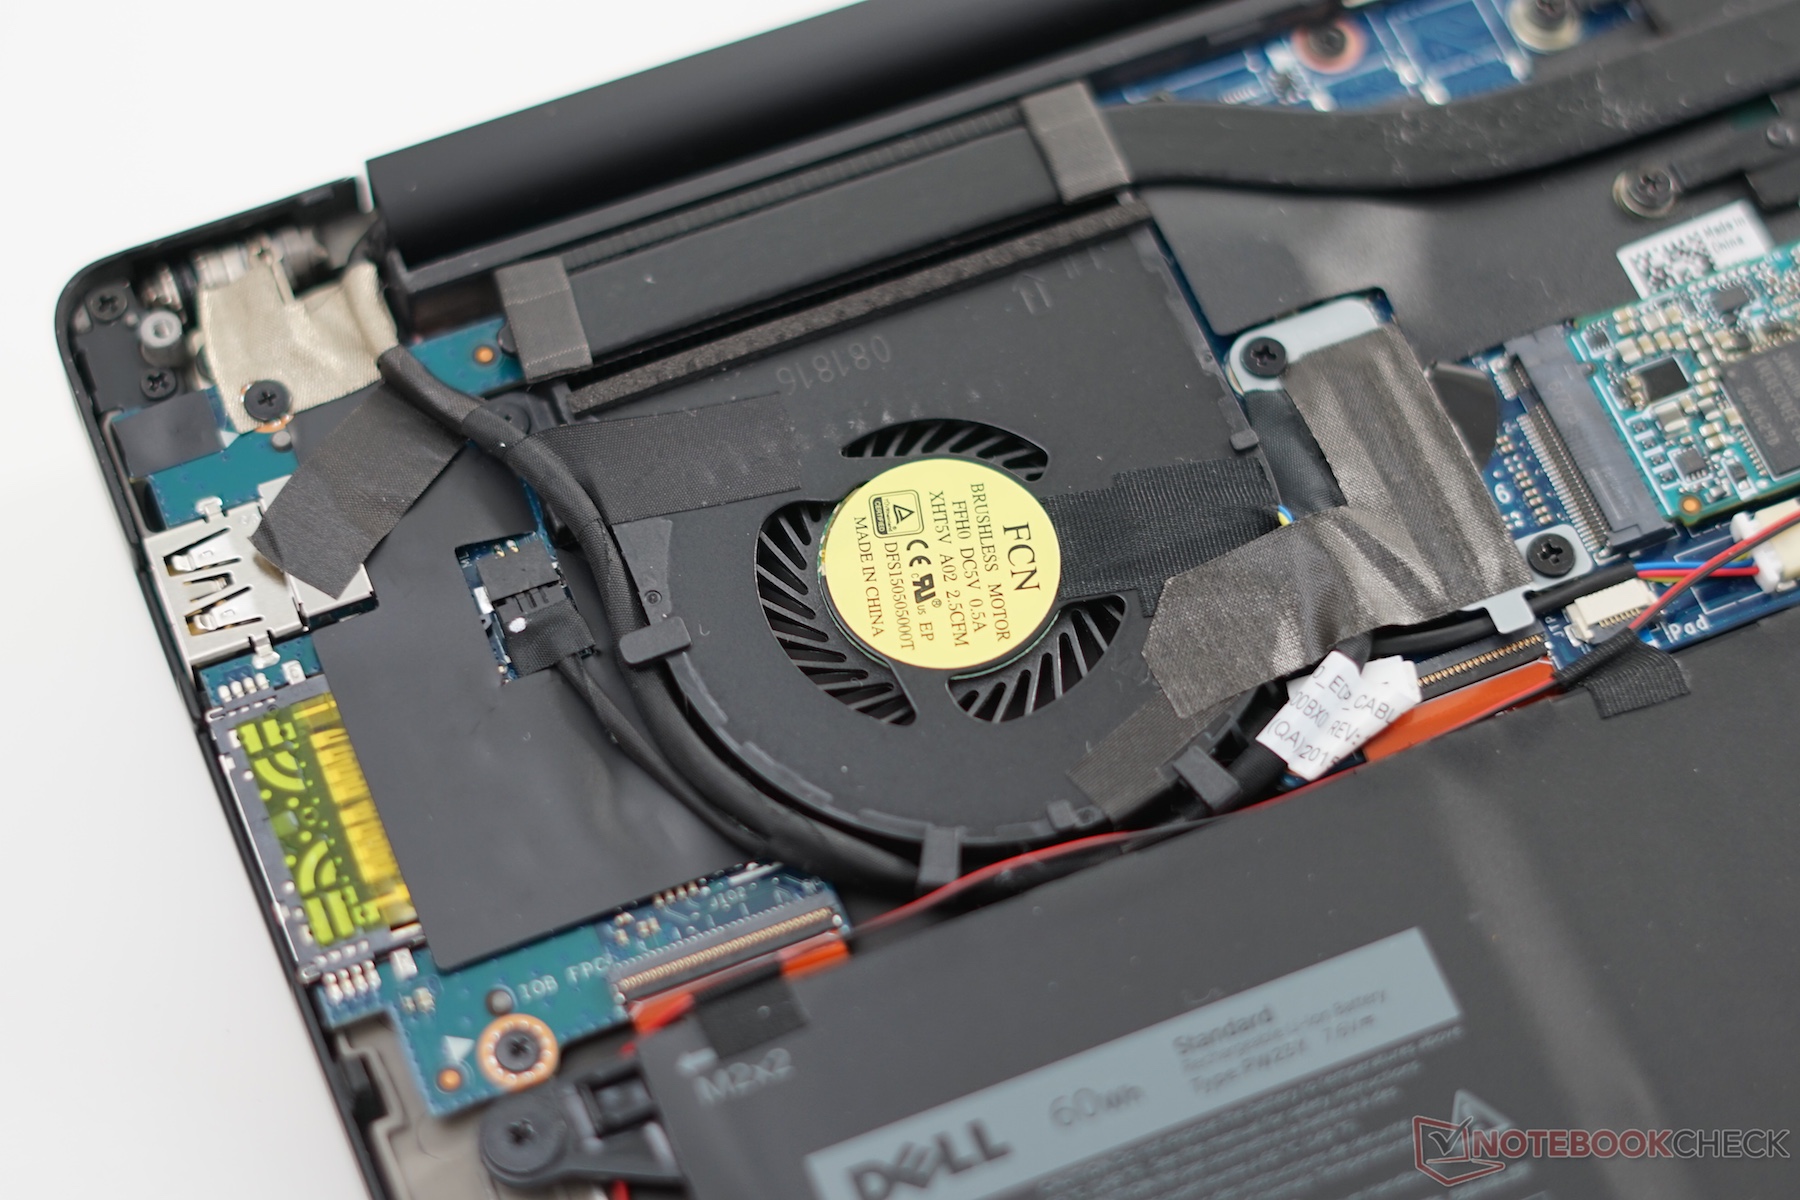
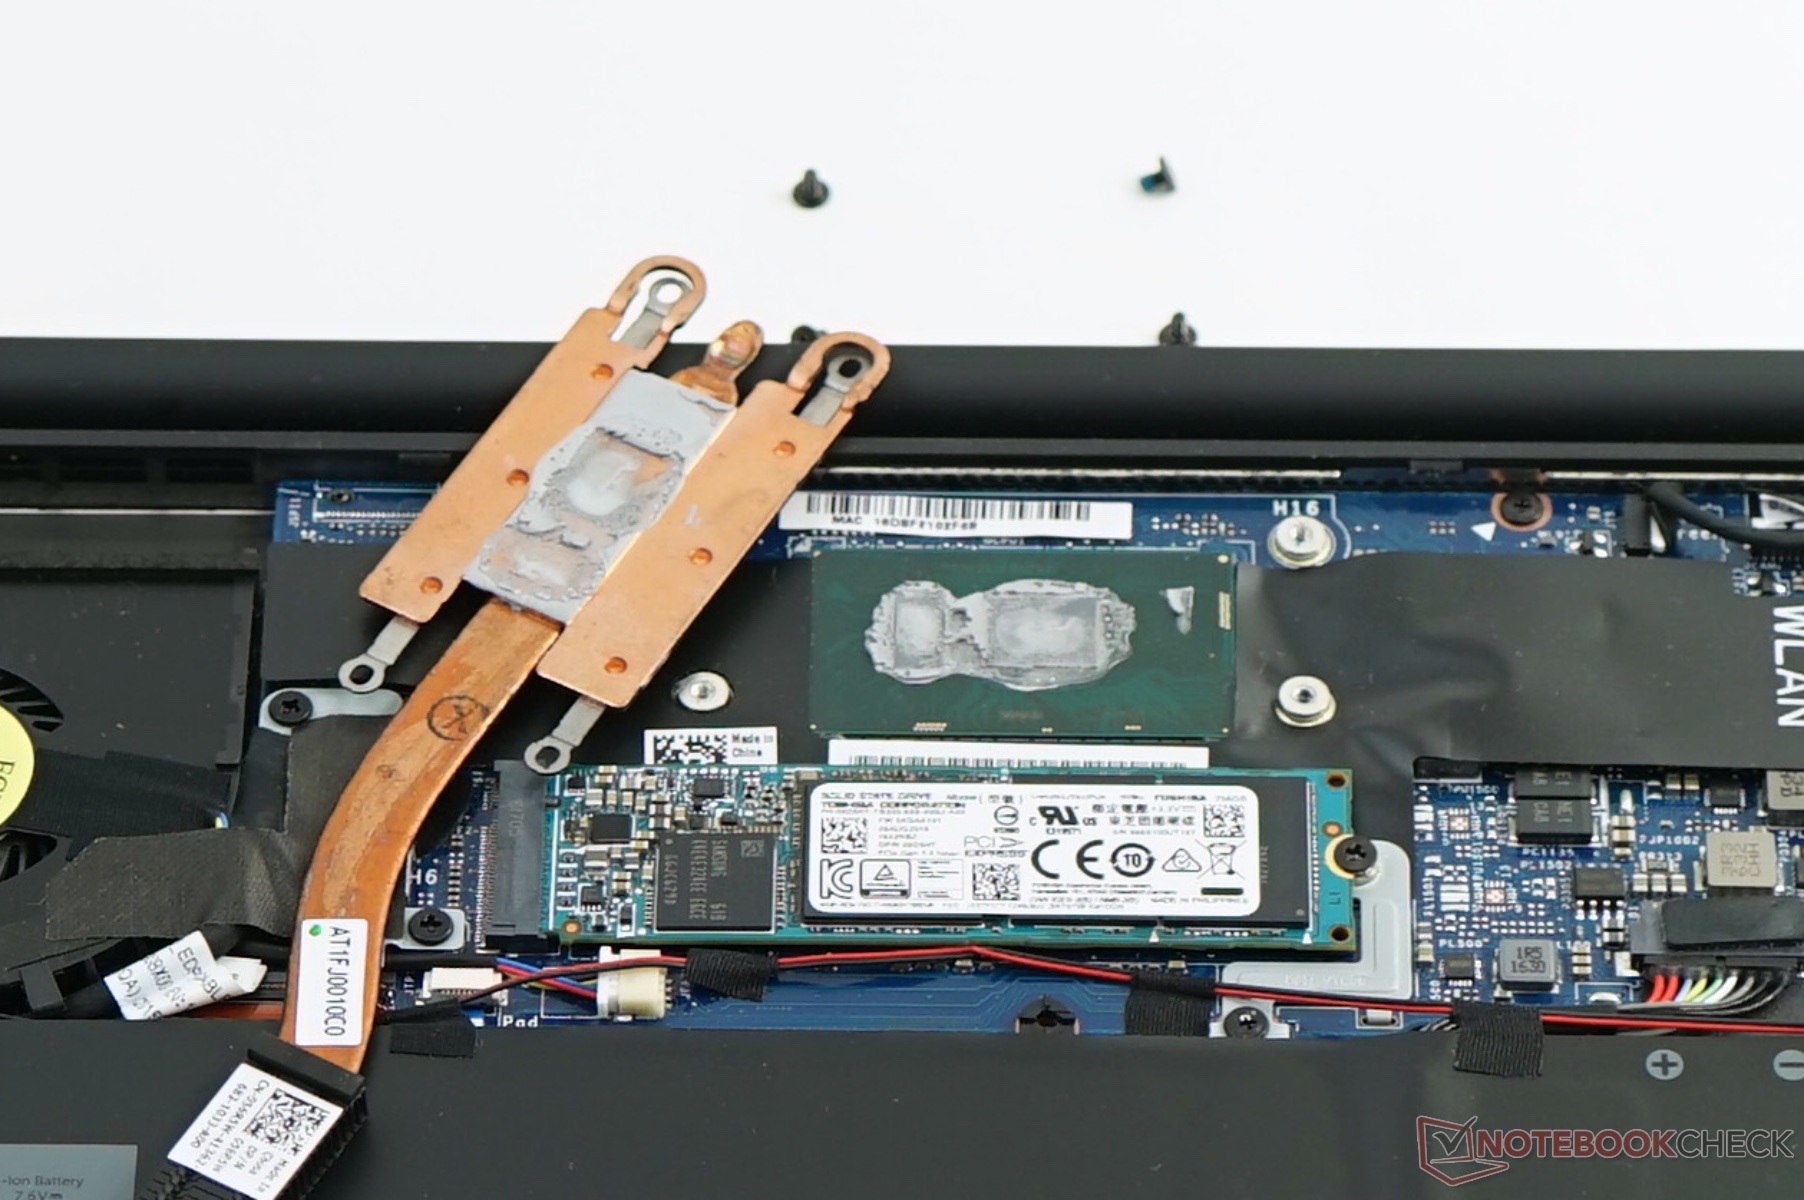
Too much Thermal Paste
We unfortunately found vast amounts of thermal paste underneath the small cooling unit of our review model, and it was already pretty dried up as well. This is certainly one reason for the weak thermal performance of the cooling solution – but more on that later.
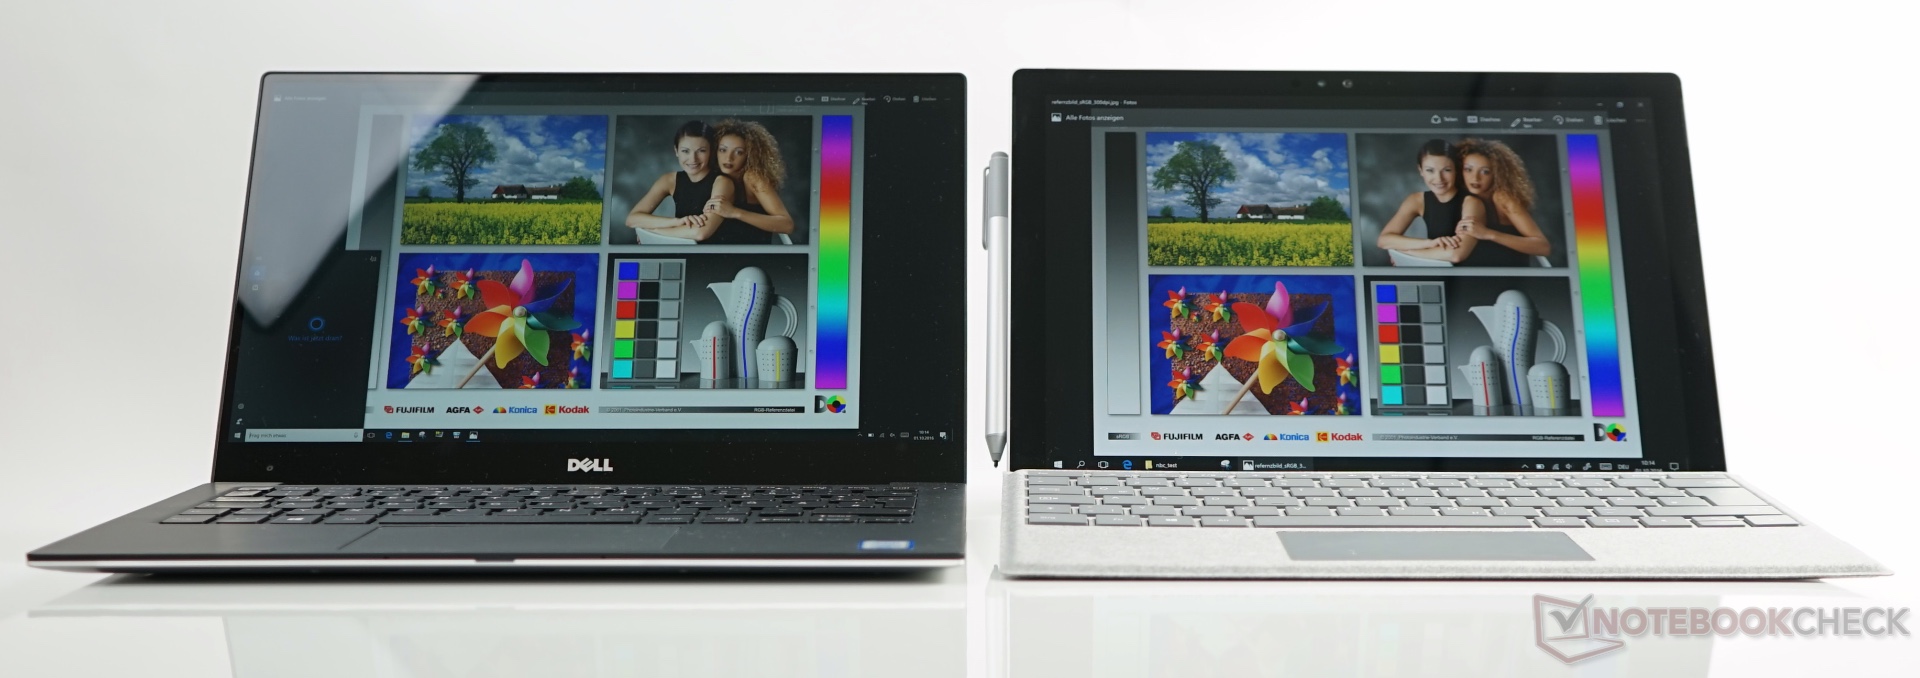
Display
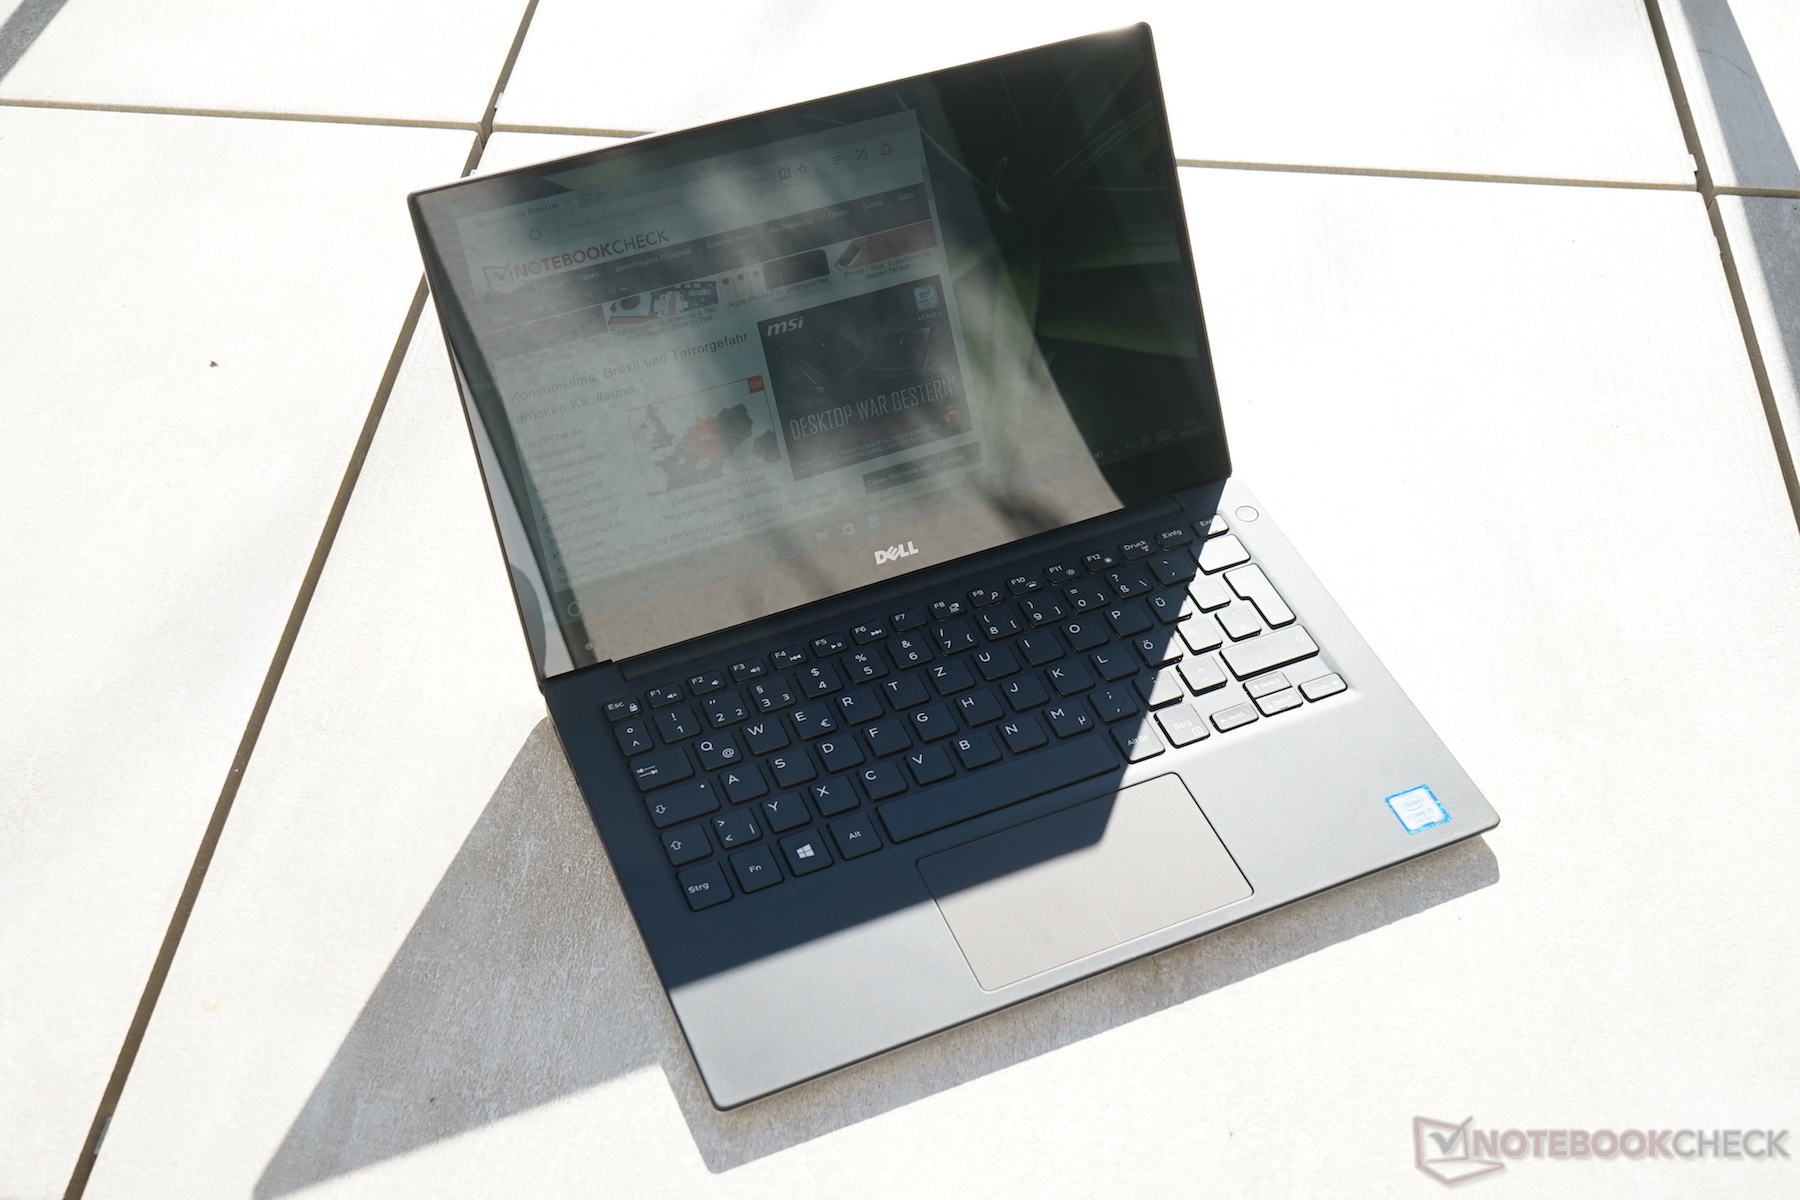
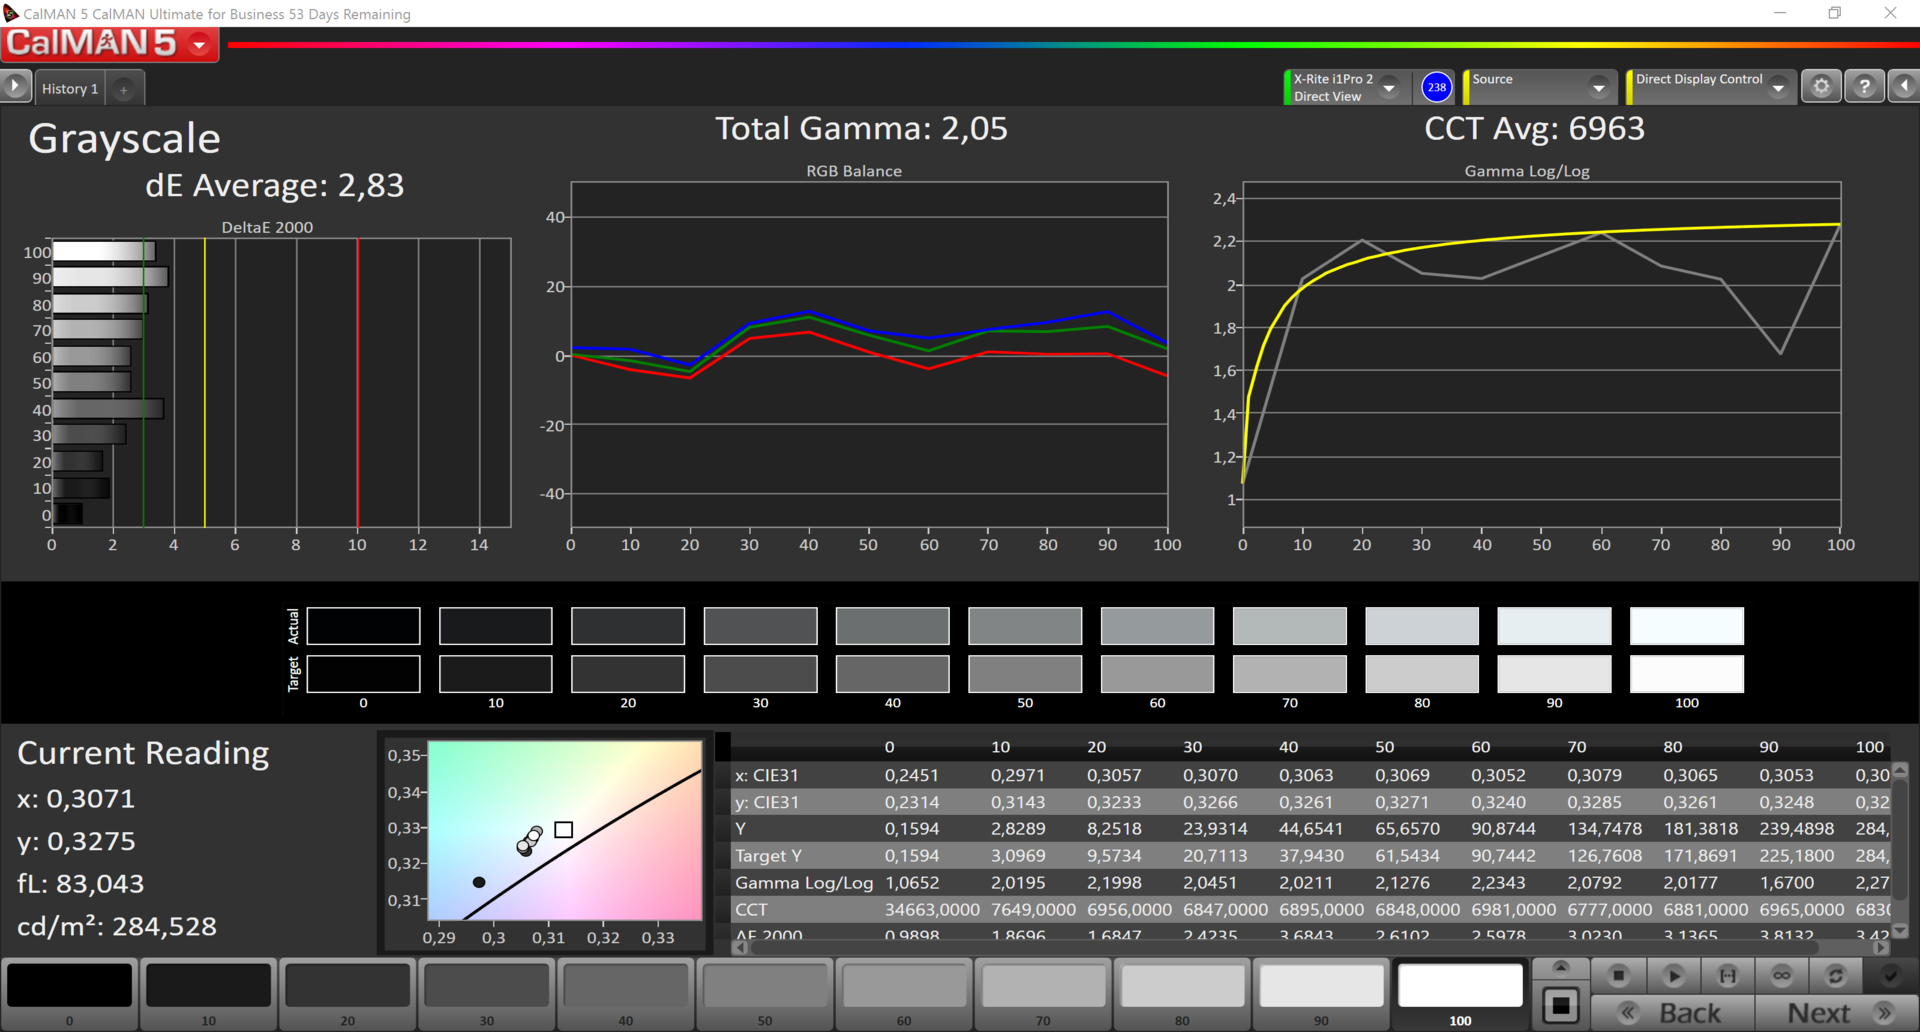
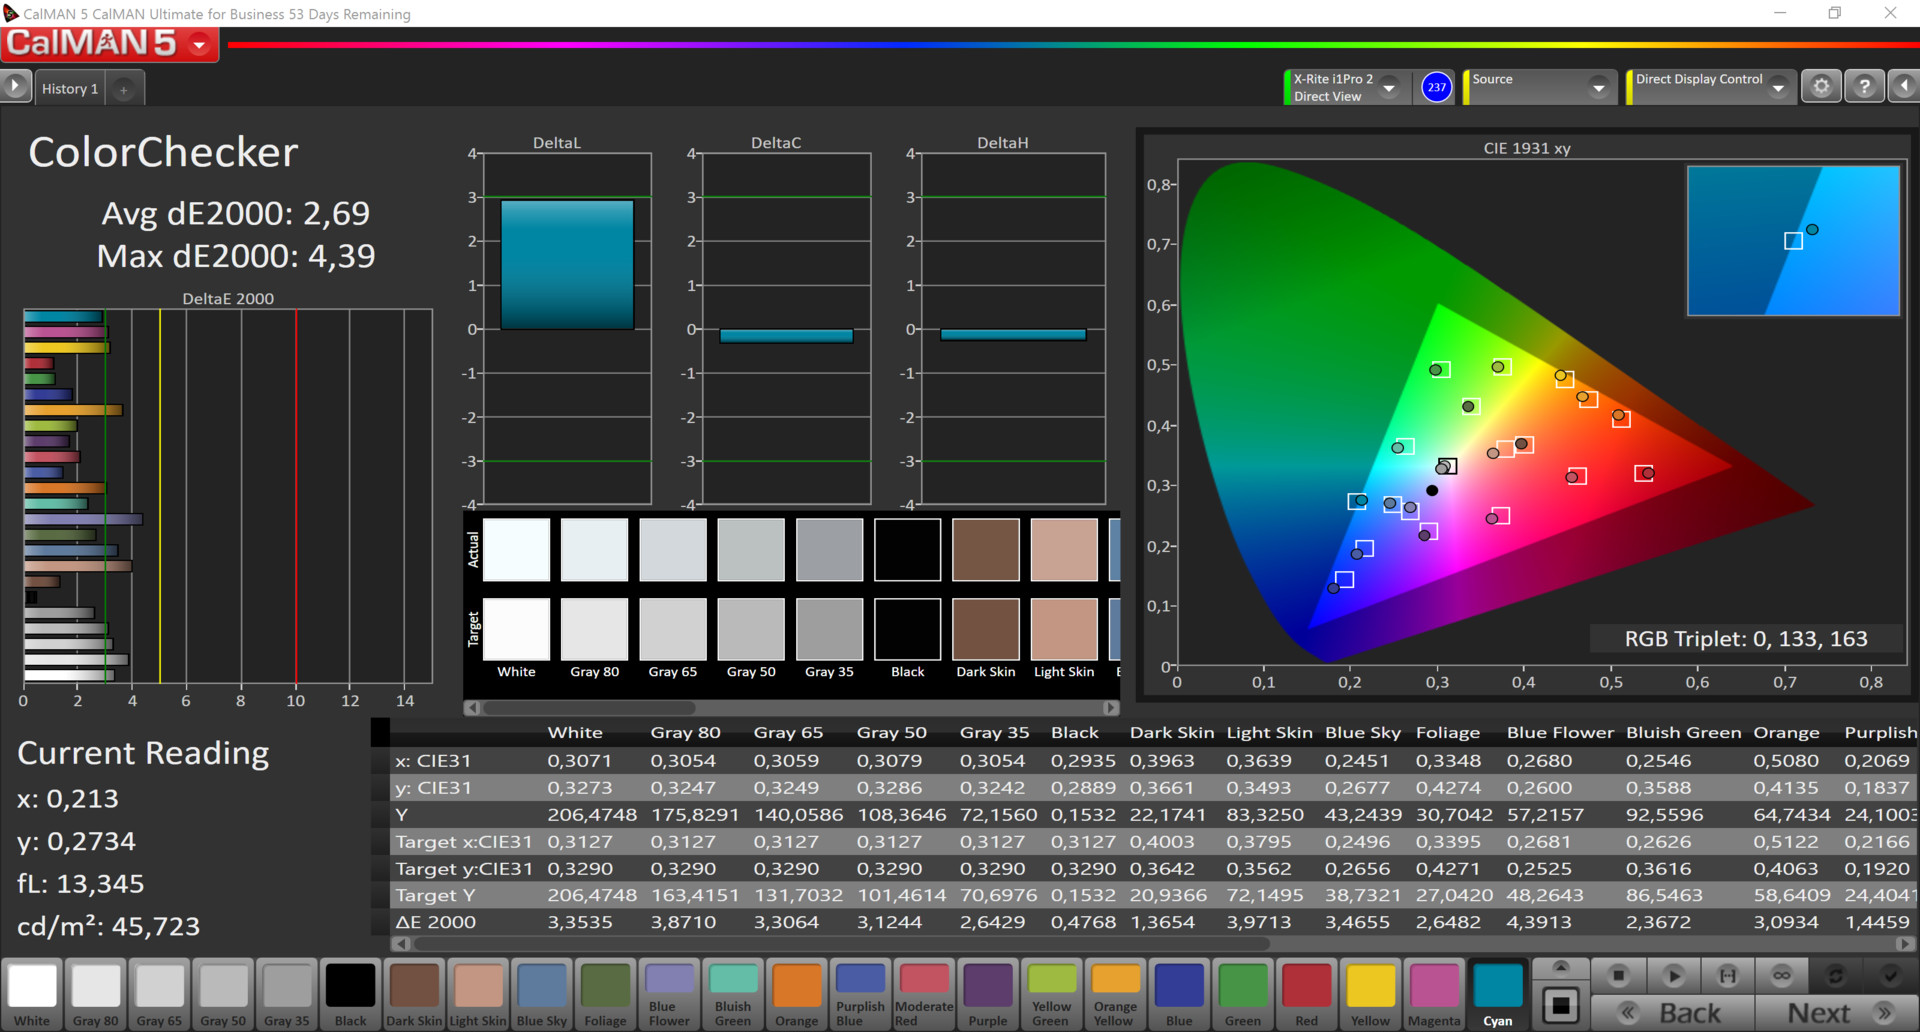
Our test model is equipped with the QHD+ touchscreen (also wrongly called 4K) and it manages an impressive maximum luminance of 444 nits in the center. The minimum brightness (0%) is 18 nits, but other devices manage even lower values. It should still not be too bright at night. The contrast ratio is also good, but CABC fooled us a bit at initially. We can only see the maximum luminance after the white picture is displayed for a couple of seconds. A fast change of colors like in CalMAN, the display only reaches 337 nits, for example, and only 285 nits in the APL50 mode (only a small measuring window). The full luminance is at least maintained on battery power.
The brightness distribution on the other hand is not very good, and the brightness drops in the corners.
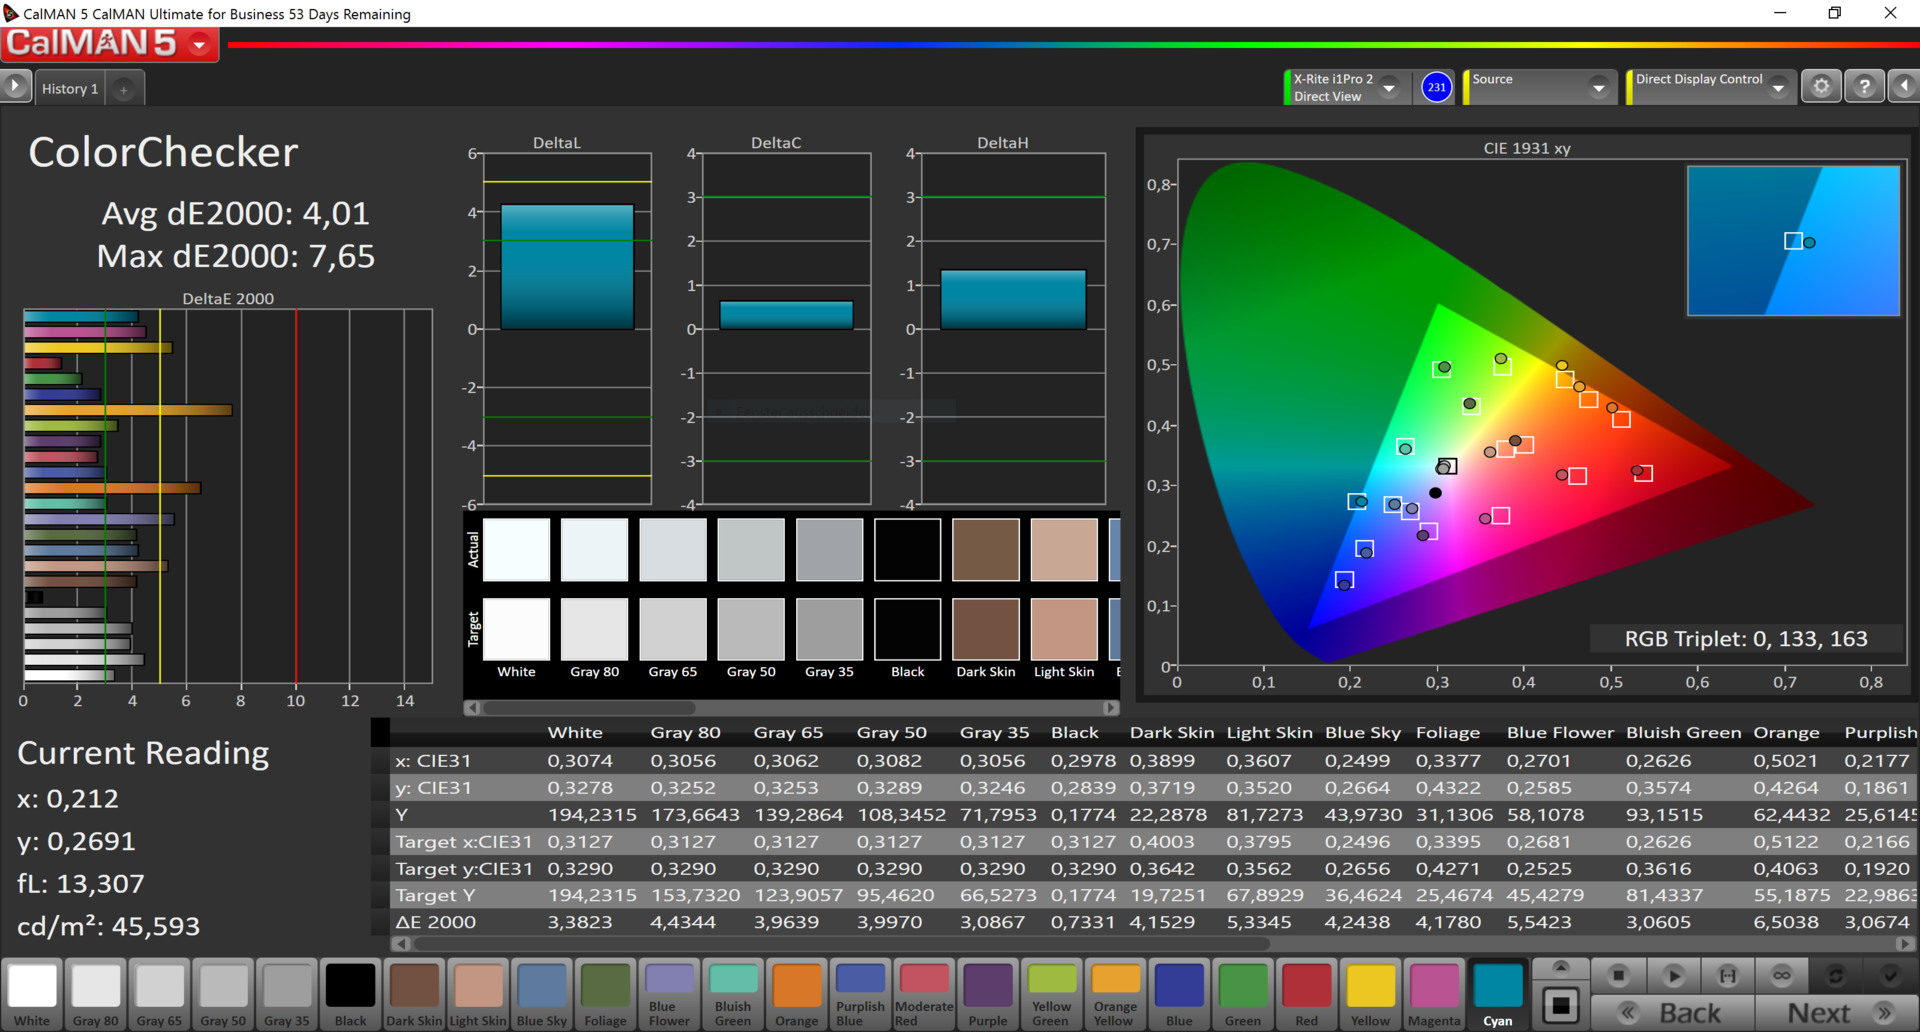
We are not really impressed by the measured DeltaE deviations for our review sample. It is therefore not suited for demanding photographers without a calibration.

| |||||||||||||||||||||||||
Brightness Distribution: 82 %
Center on Battery: 444 cd/m²
Contrast: 1345:1 (Black: 0.33 cd/m²)
ΔE ColorChecker Calman: 4 | ∀{0.5-29.43 Ø4.71}
ΔE Greyscale Calman: 2.83 | ∀{0.09-98 Ø4.96}
91.4% sRGB (Argyll 1.6.3 3D)
59.3% AdobeRGB 1998 (Argyll 1.6.3 3D)
66.5% AdobeRGB 1998 (Argyll 3D)
91.6% sRGB (Argyll 3D)
64.6% Display P3 (Argyll 3D)
Gamma: 2.05
CCT: 6963 K
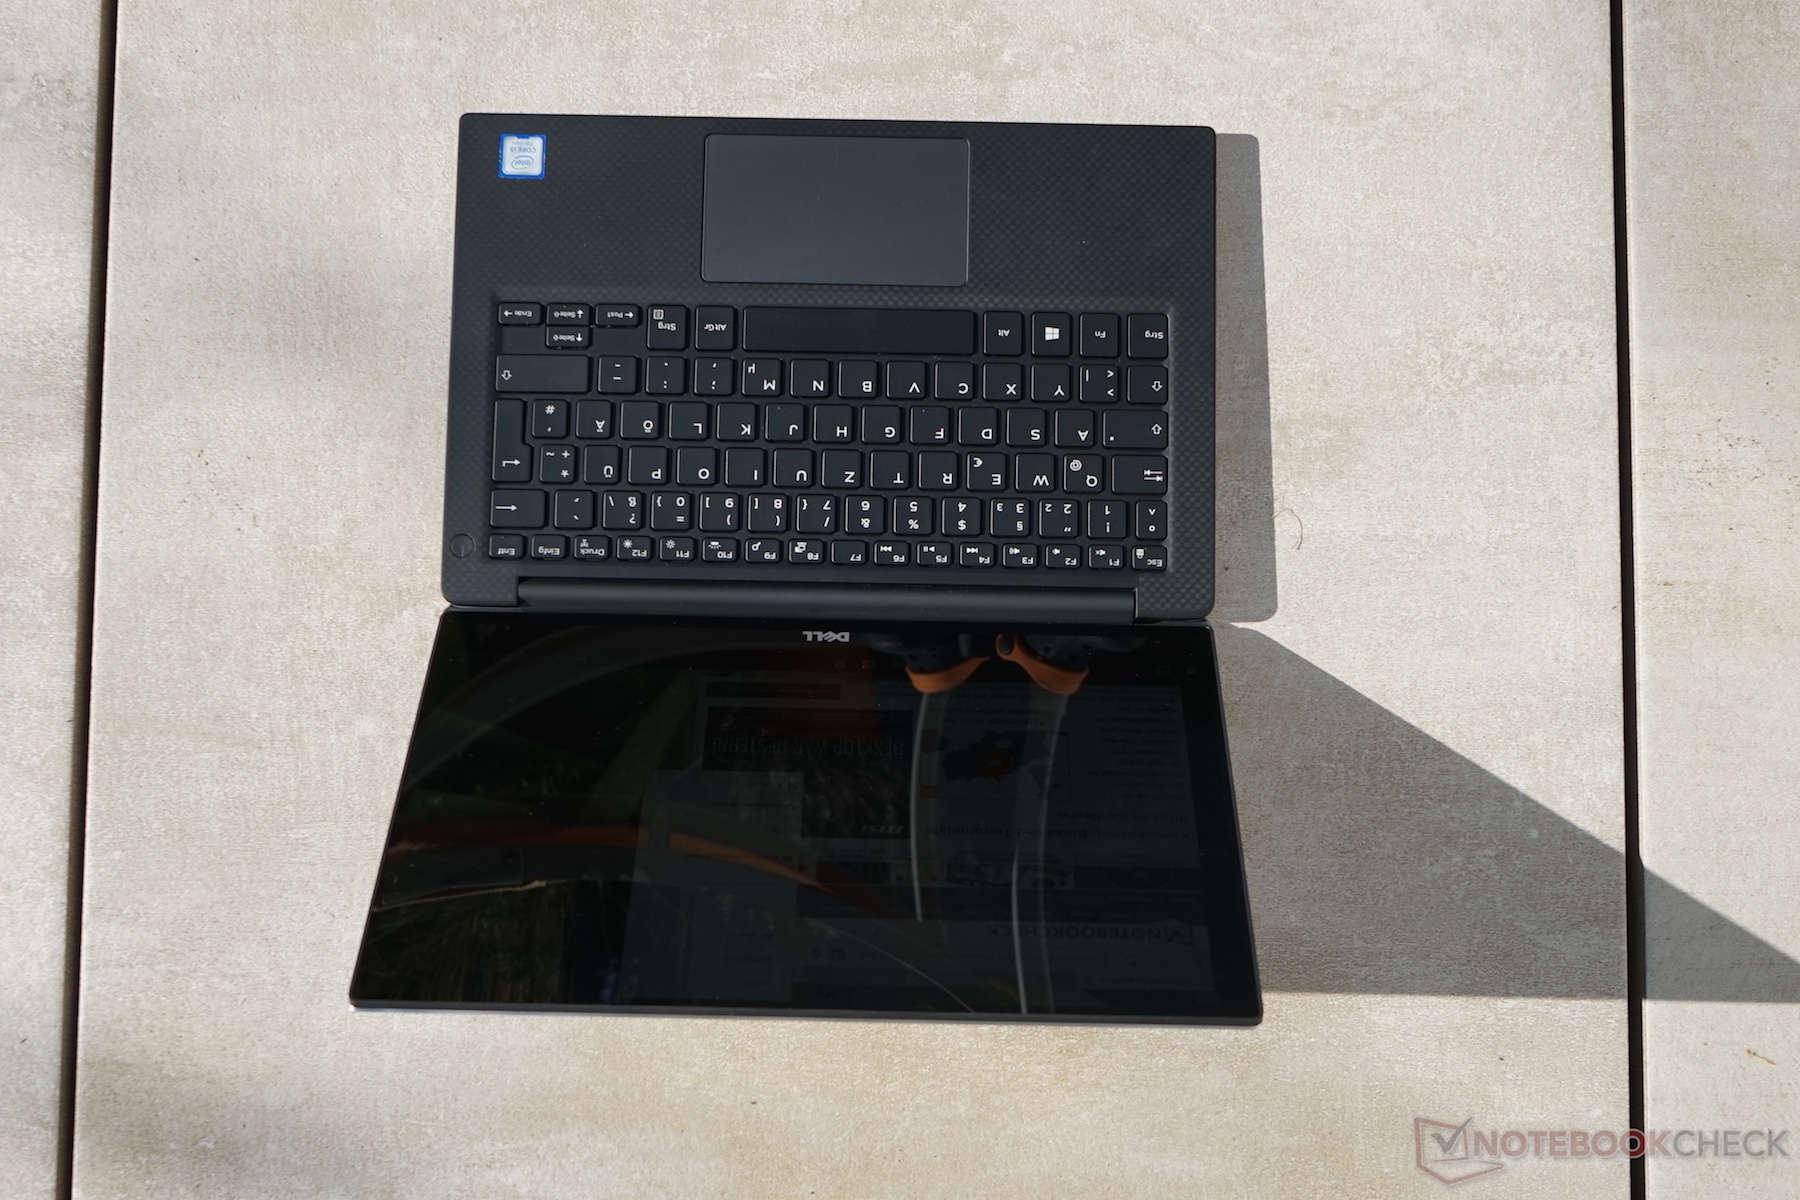
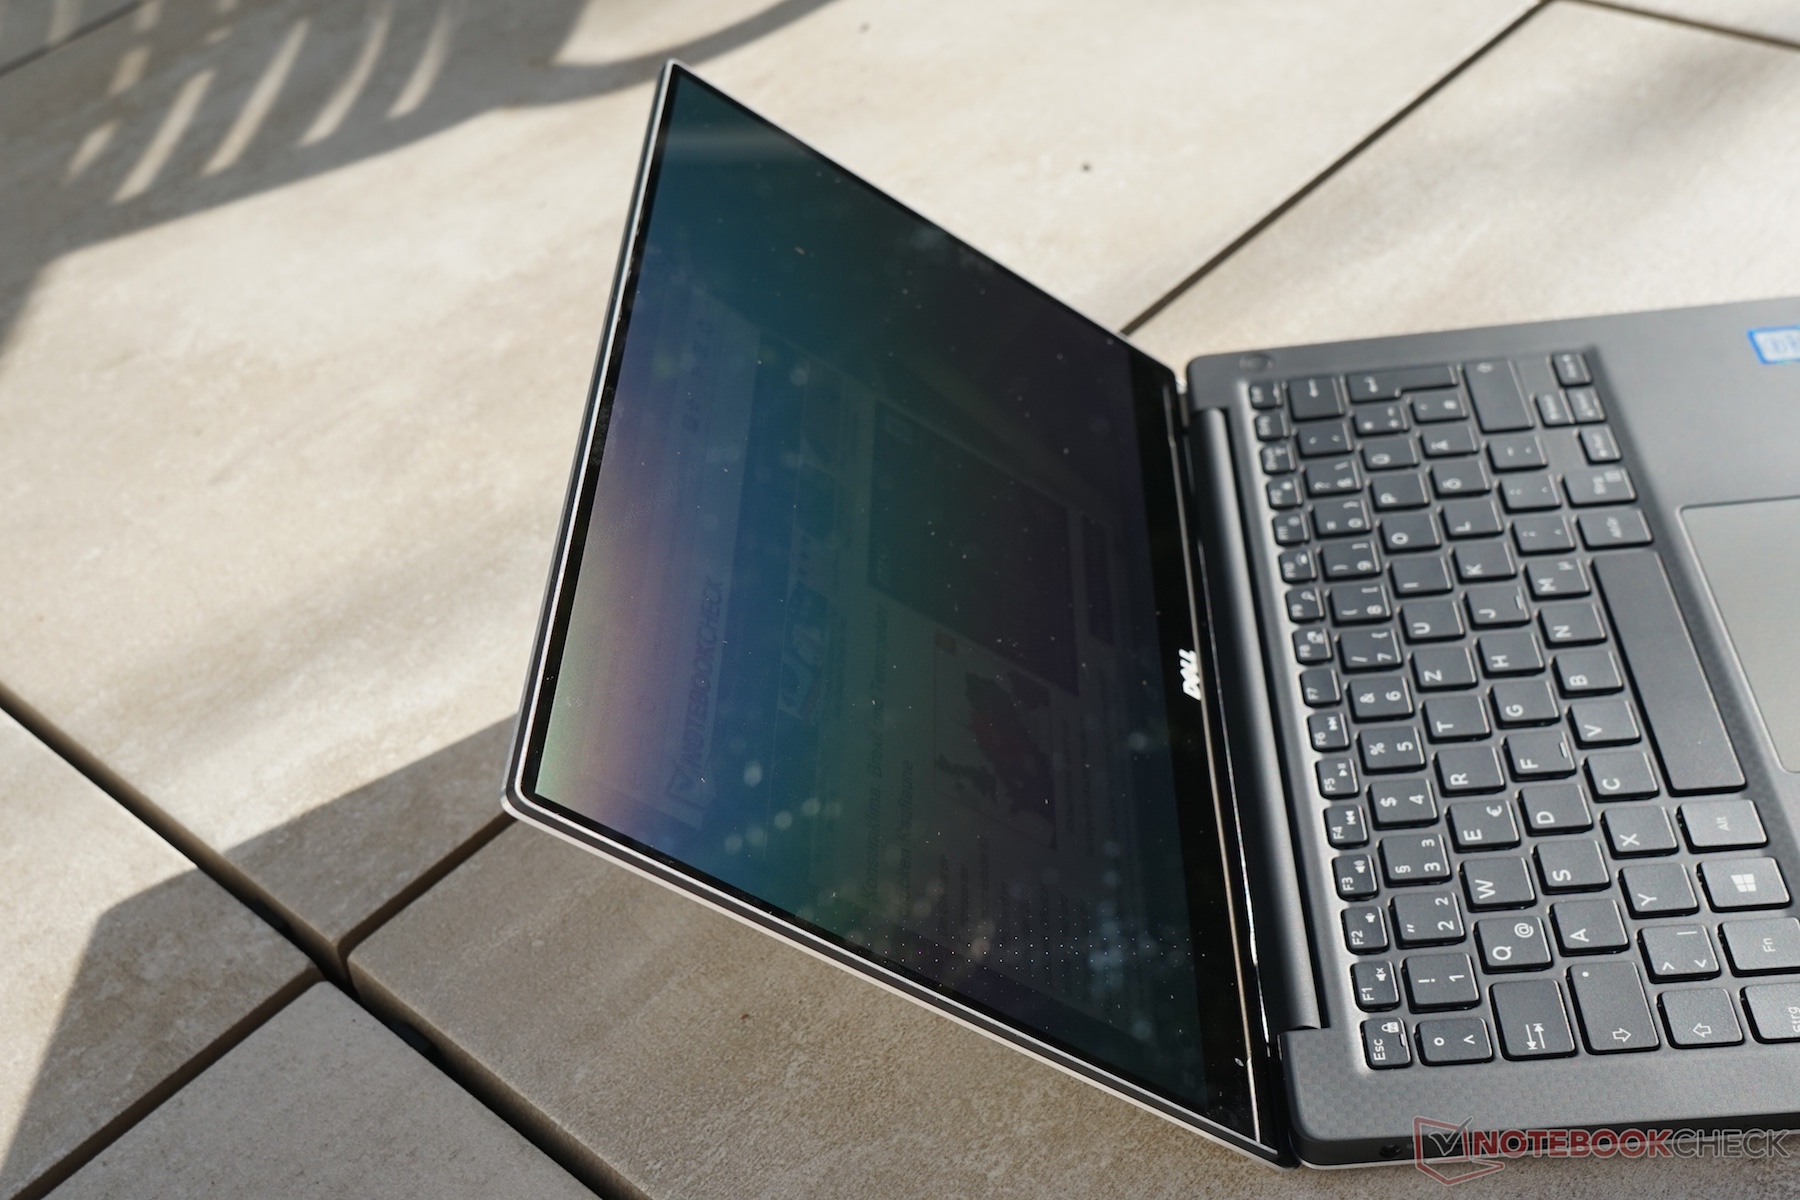
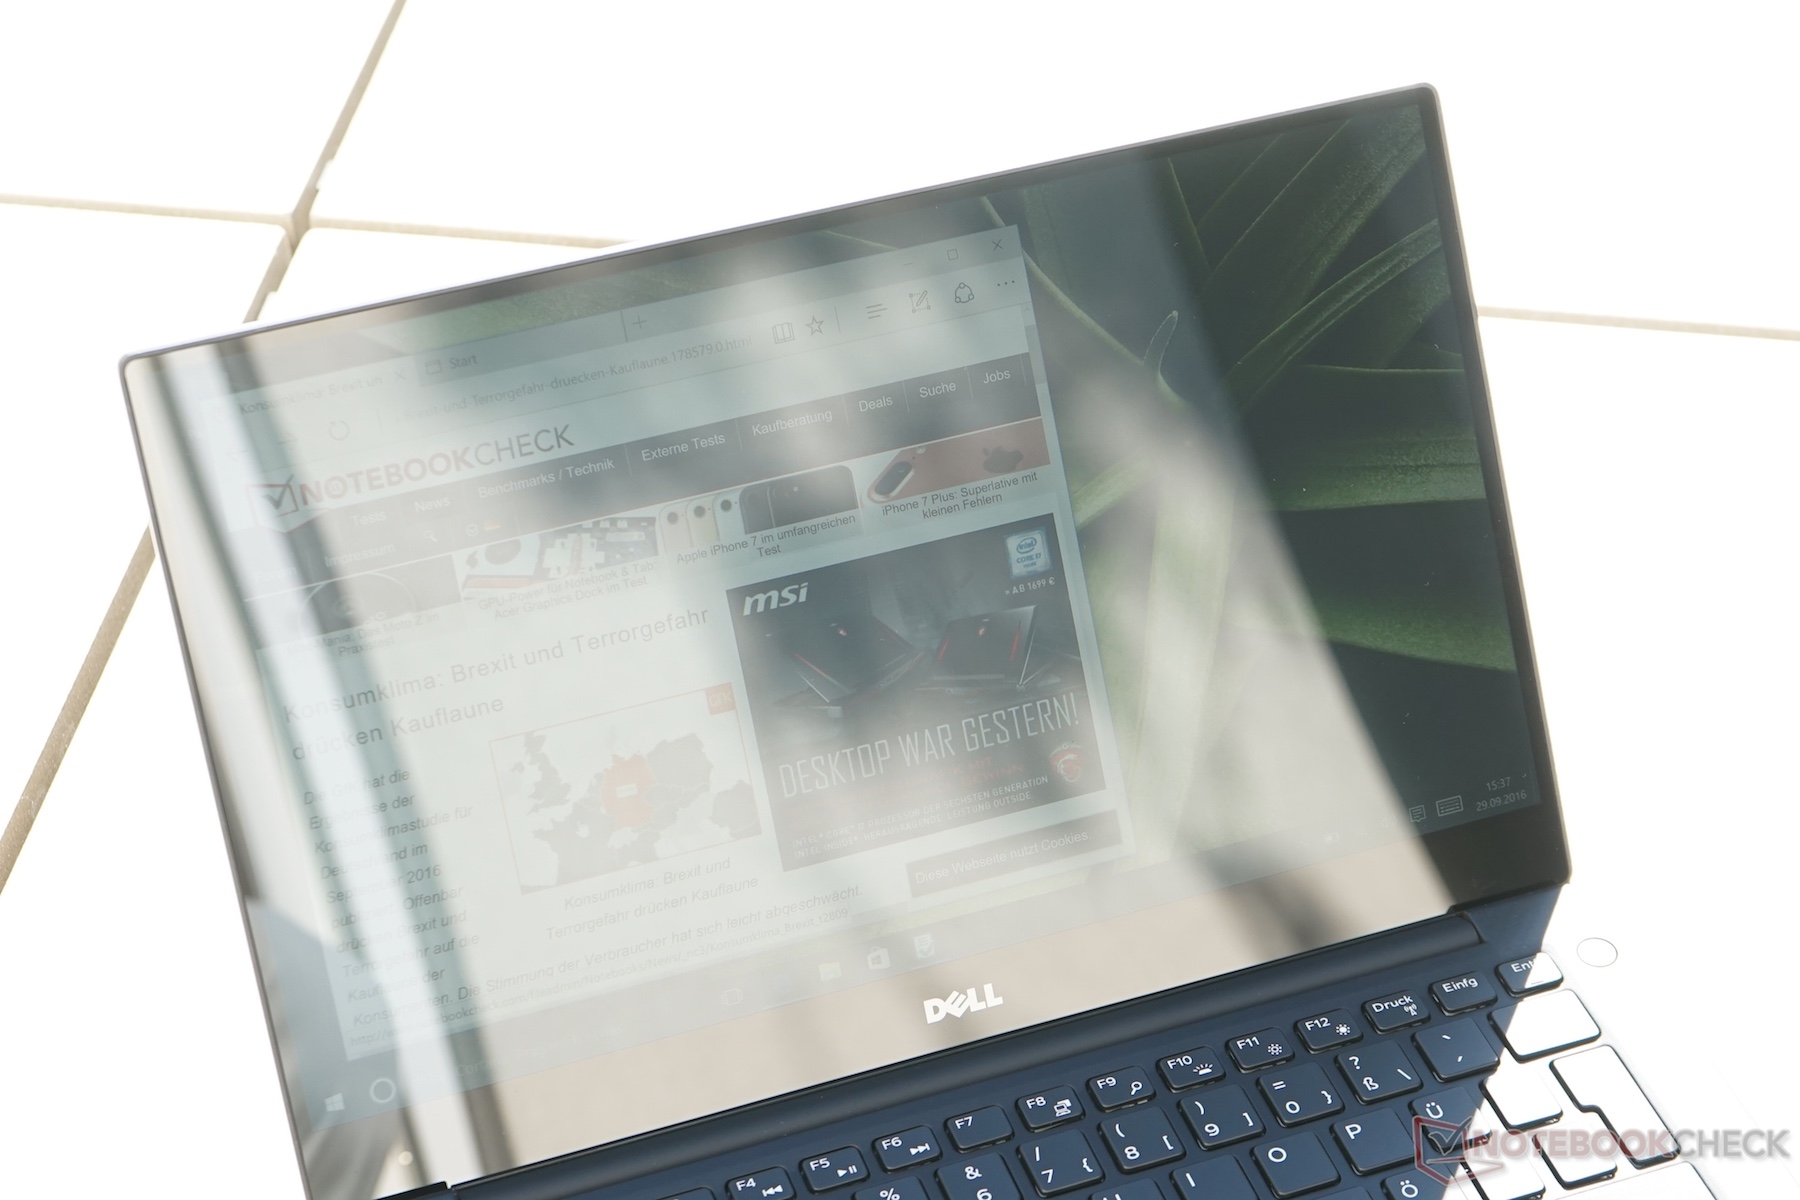
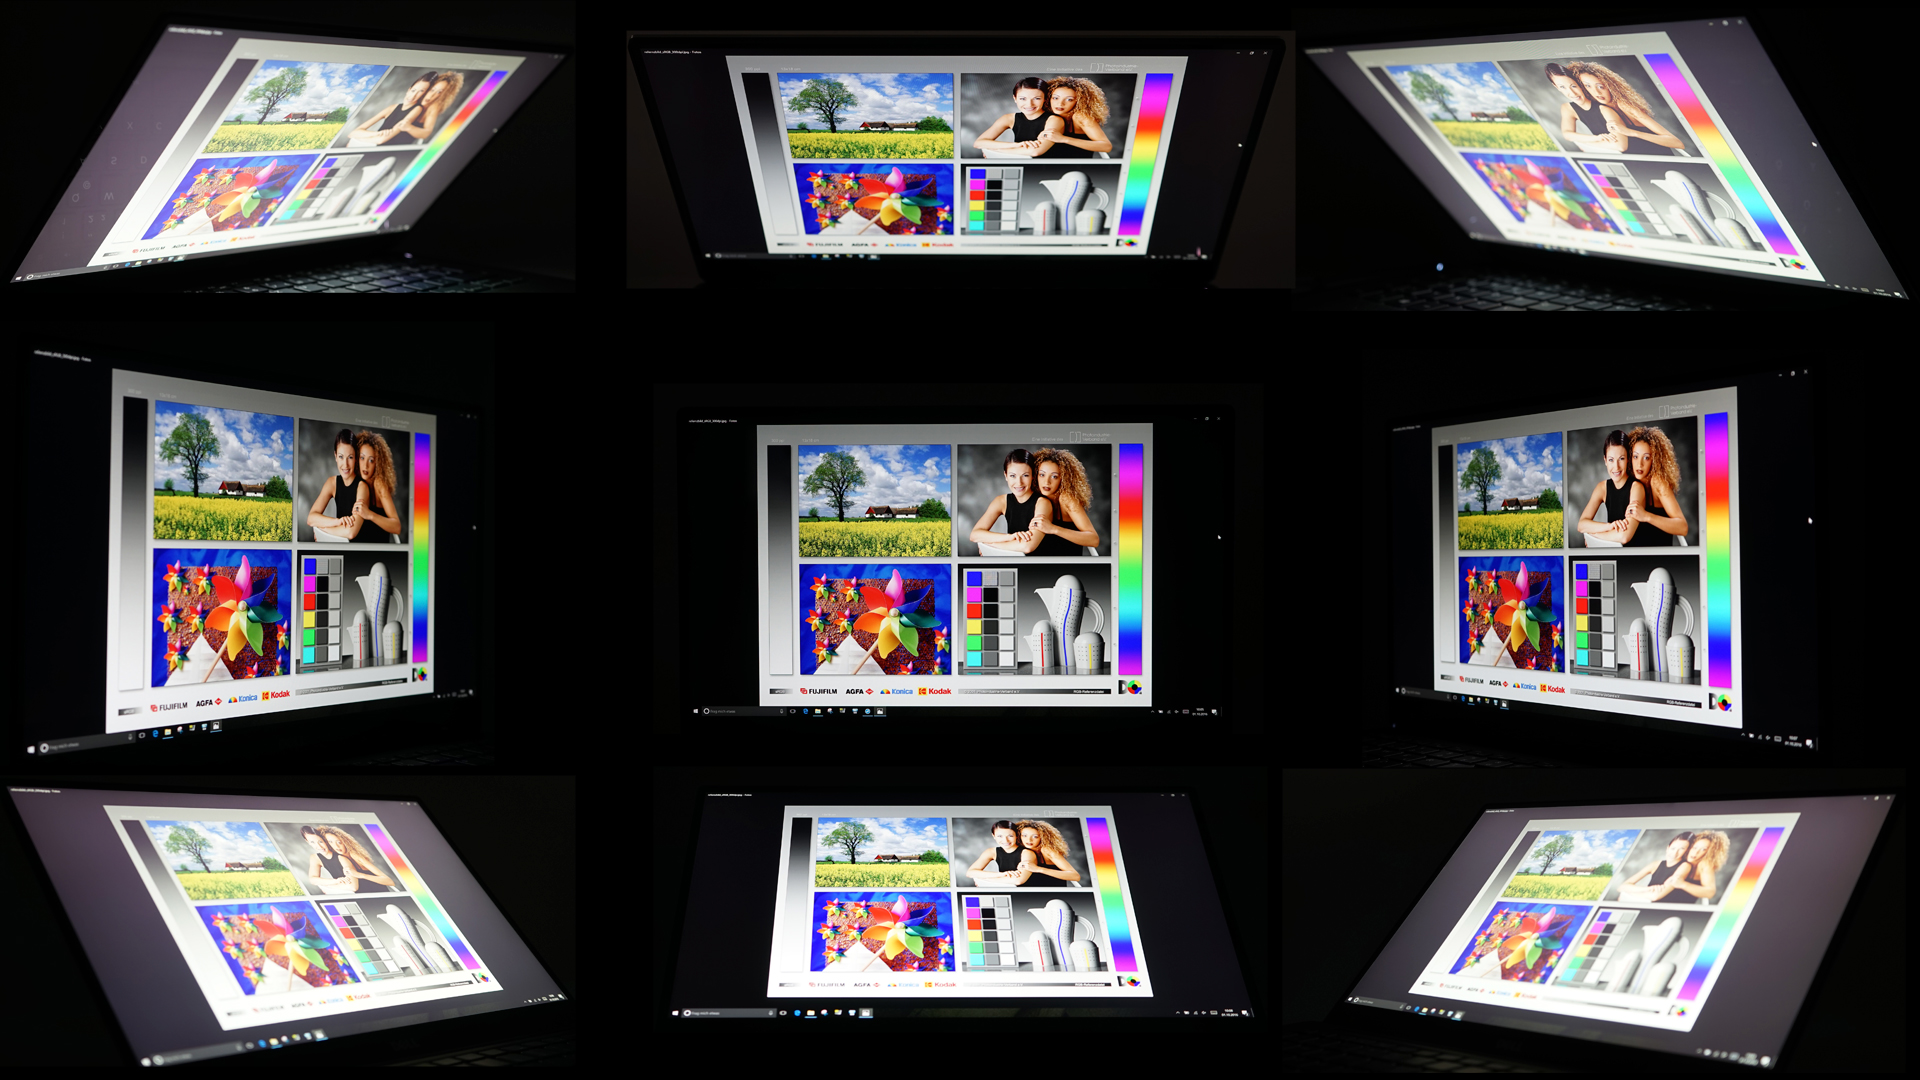
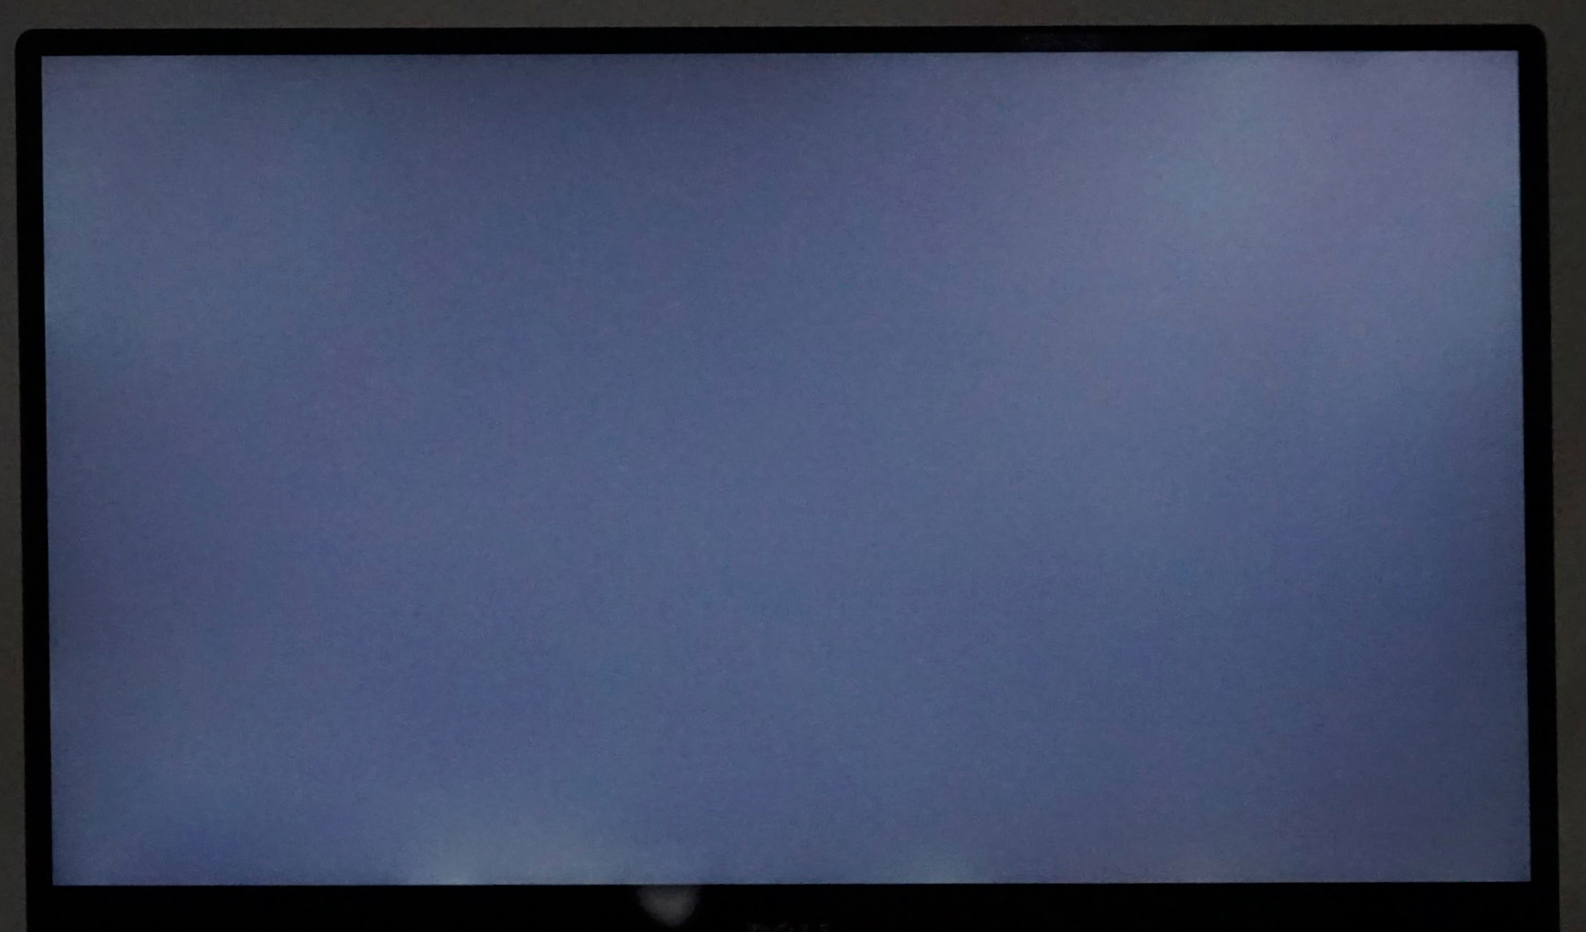
The strong reflections of the touchscreen are annoying outdoors. The viewing angle stability is very good thanks to the IPS technology. Backlight bleeding is no problem for our sample, and the picture is still pretty even with longer exposure (see picture).
Display Response Times
| ↔ Response Time Black to White | ||
|---|---|---|
| 31.2 ms ... rise ↗ and fall ↘ combined | ↗ 10.8 ms rise | 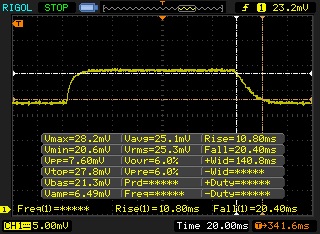 |
| ↘ 20.4 ms fall | ||
| The screen shows slow response rates in our tests and will be unsatisfactory for gamers. In comparison, all tested devices range from 0.1 (minimum) to 240 (maximum) ms. » 84 % of all devices are better. This means that the measured response time is worse than the average of all tested devices (19.8 ms). | ||
| ↔ Response Time 50% Grey to 80% Grey | ||
| 31 ms ... rise ↗ and fall ↘ combined | ↗ 13 ms rise | 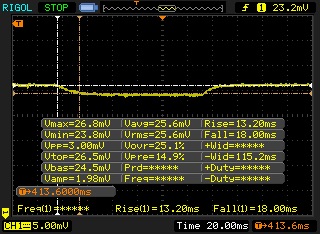 |
| ↘ 18 ms fall | ||
| The screen shows slow response rates in our tests and will be unsatisfactory for gamers. In comparison, all tested devices range from 0.165 (minimum) to 636 (maximum) ms. » 42 % of all devices are better. This means that the measured response time is similar to the average of all tested devices (31 ms). | ||
Screen Flickering / PWM (Pulse-Width Modulation)
| Screen flickering / PWM not detected |  | ||
In comparison: 52 % of all tested devices do not use PWM to dim the display. If PWM was detected, an average of 7754 (minimum: 5 - maximum: 343500) Hz was measured. | |||
Performance
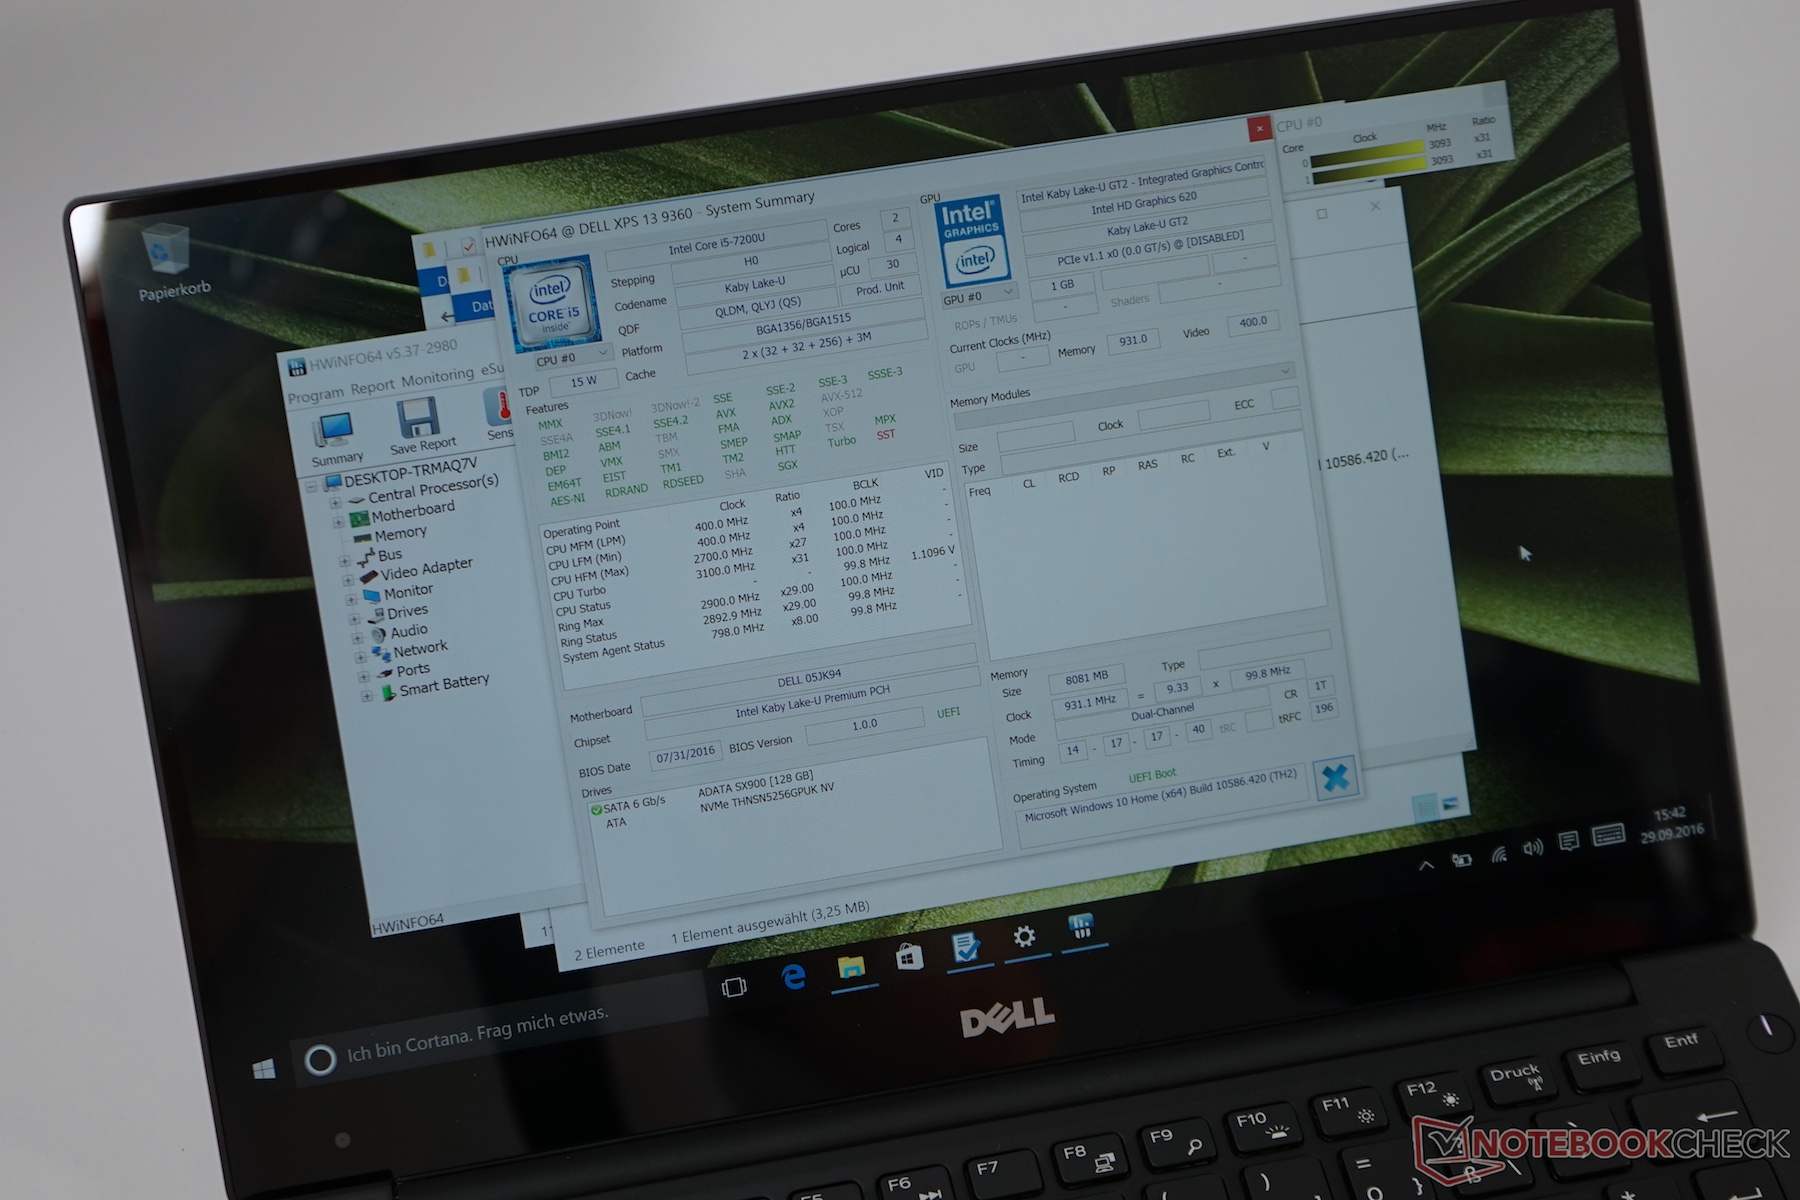
Processor
Based on our initial CPU benchmarks, the Dell XPS 13 with the i5-7200U falls short of expectations. The Acer Aspire E5-575G, for example, which is equipped with the same CPU, is 10 % faster in the Single-Core test and still 5 % ahead of the Dell XPS 13 in the Cinebench R15 Multi test. If you compare our results with the i5-6200U in the XPS 13 9350, the advantage is almost negligible. In other words: Our test model of the XPS 13 cannot benefit from the new Kaby Lake processor generation in respect to the CPU performance.
We will perform more tests to support the disappointing initial results.
Interesting detail: The XPS 13 is only shipped with two power plans: Dell and Balanced. We can see a difference between them in the wPrime 32m benchmark with 15.7 s (Balanced) vs. 16.1 s (Dell). There are, however, no differences in the longer wPrime 1024m and Cinebench Multi.
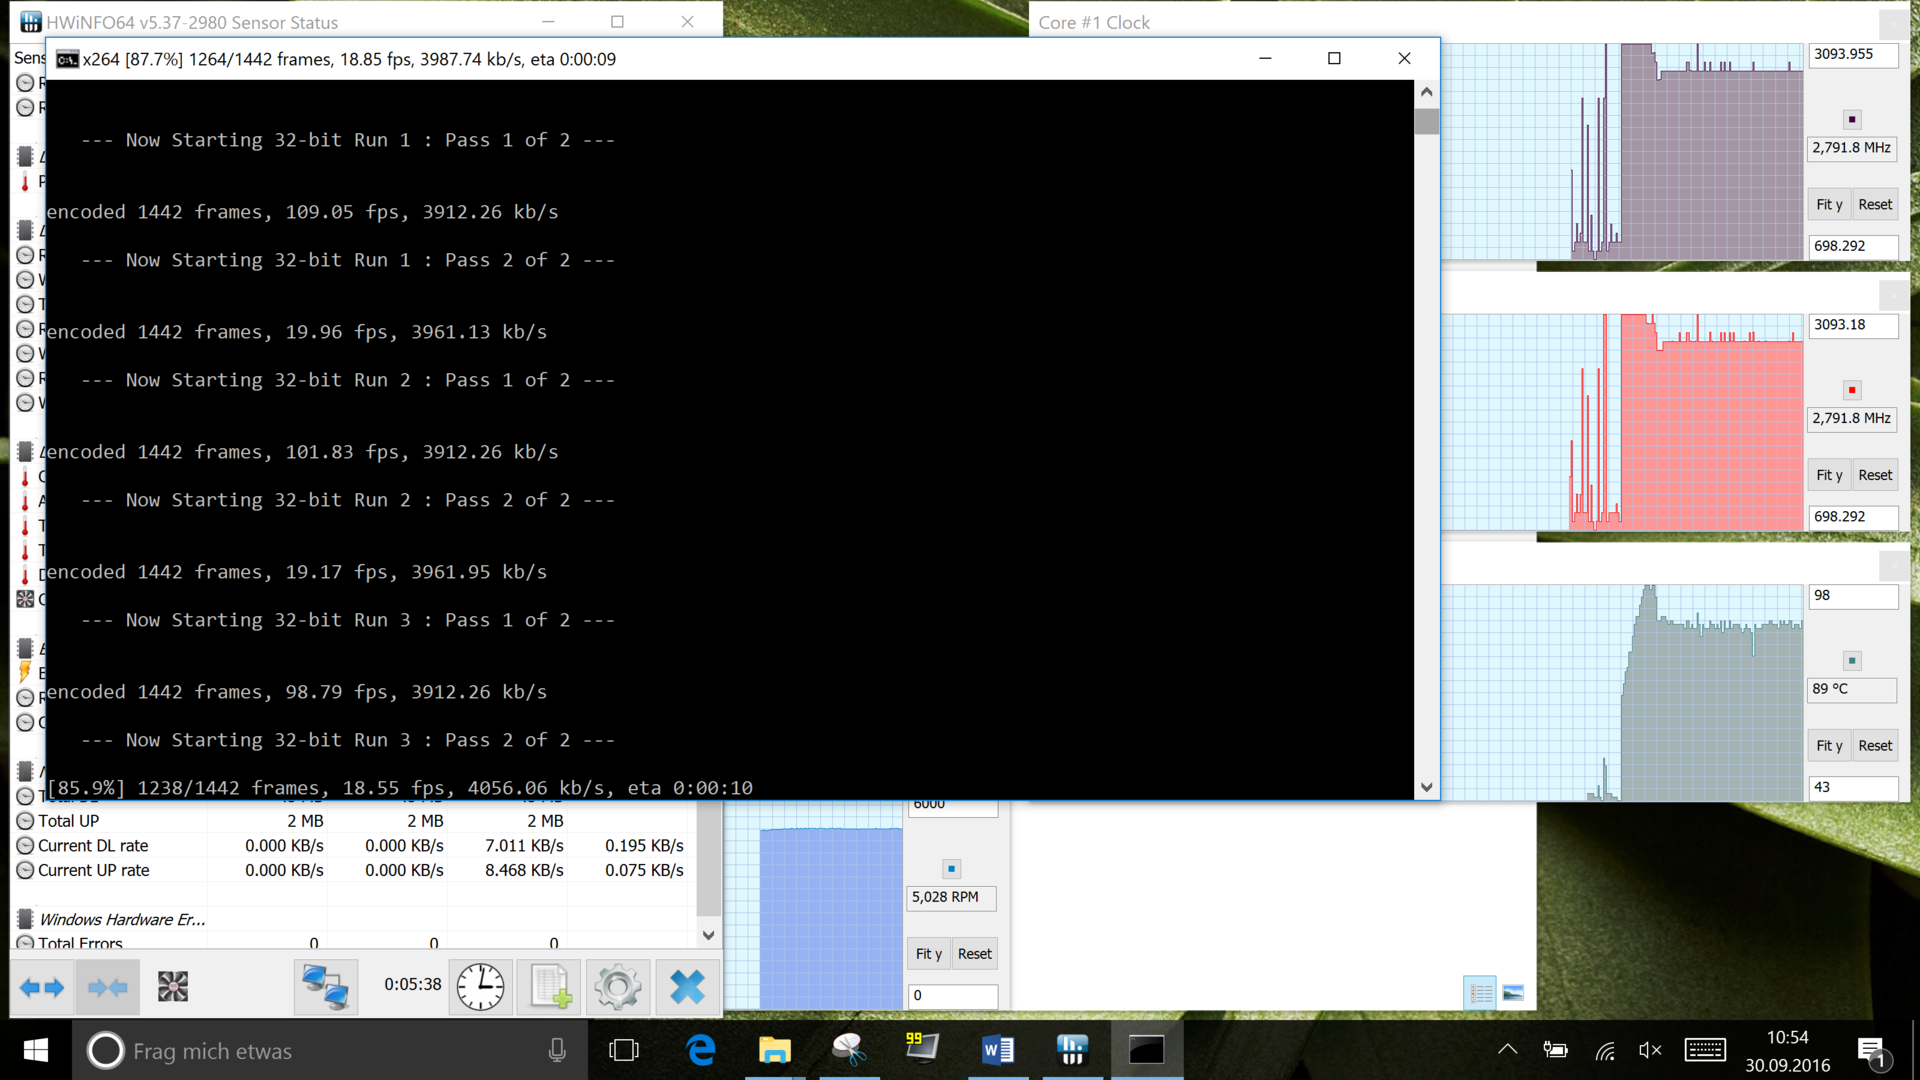
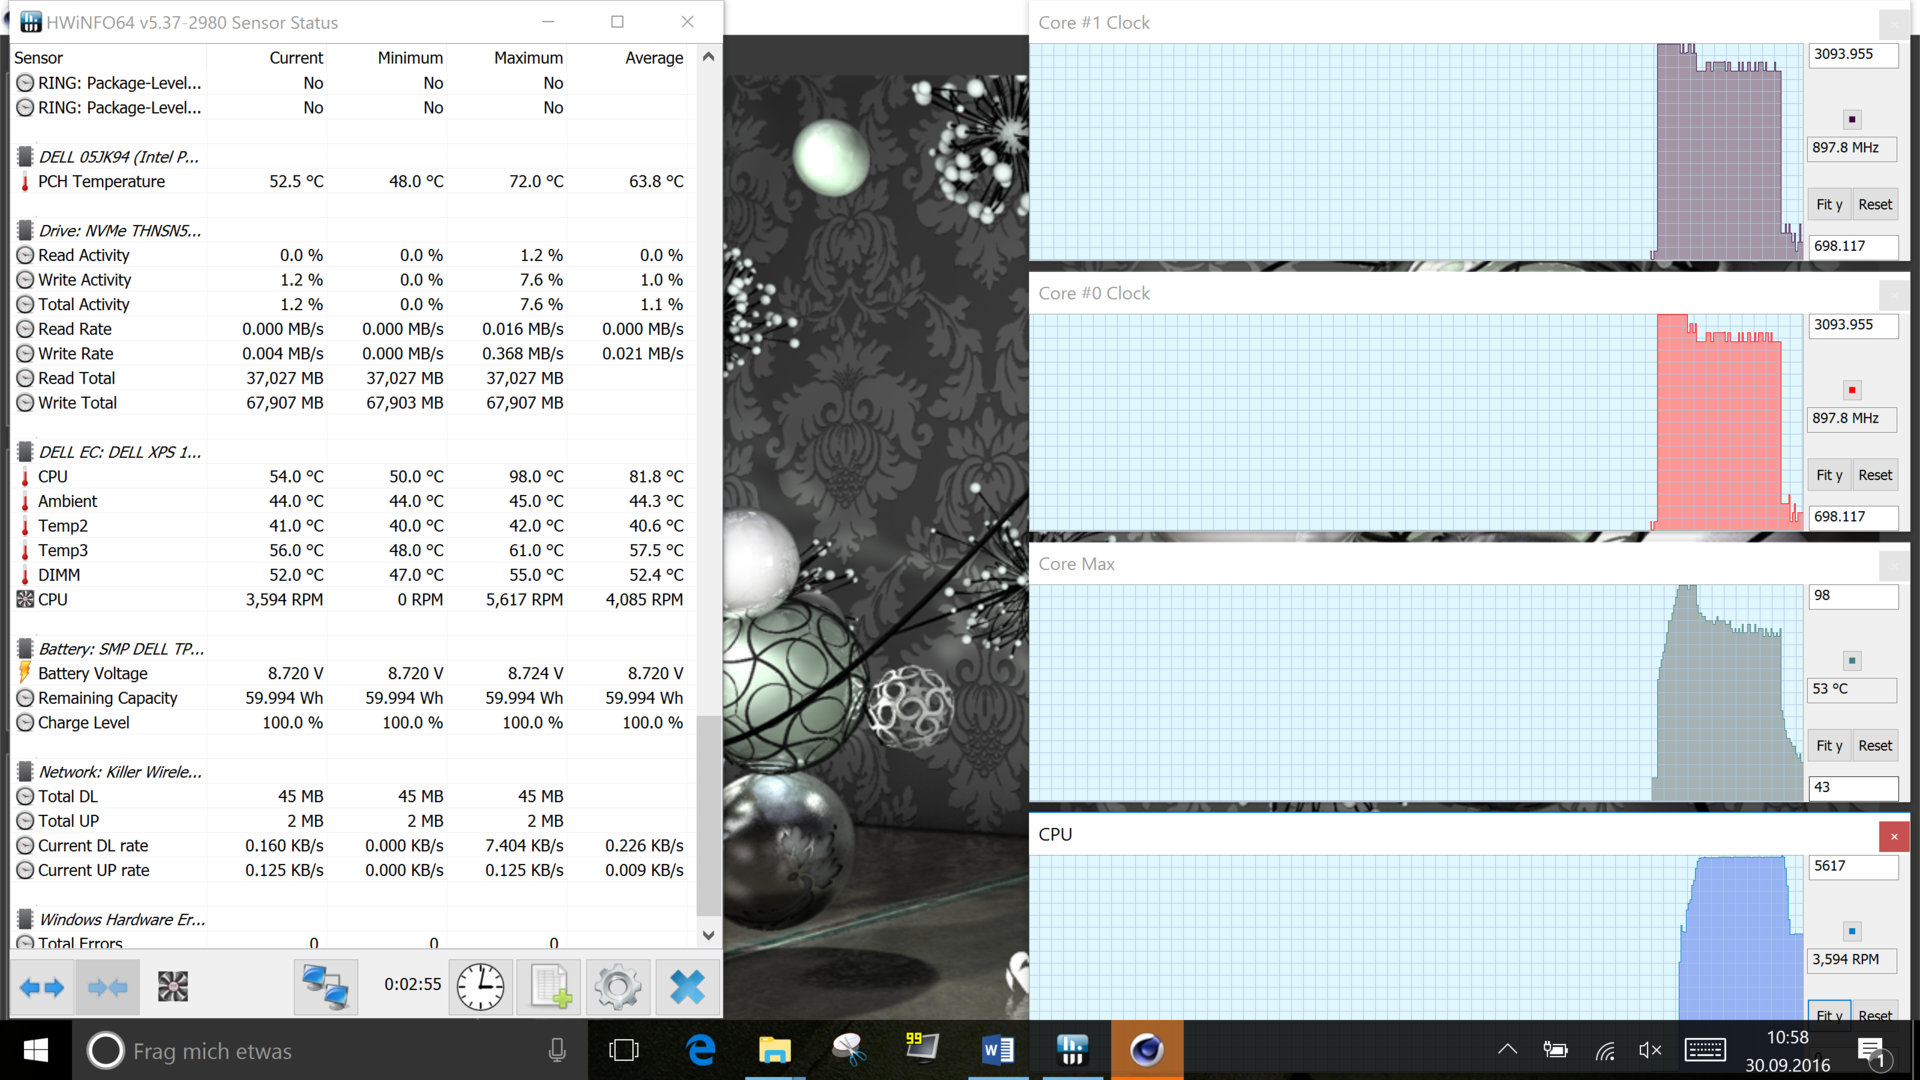
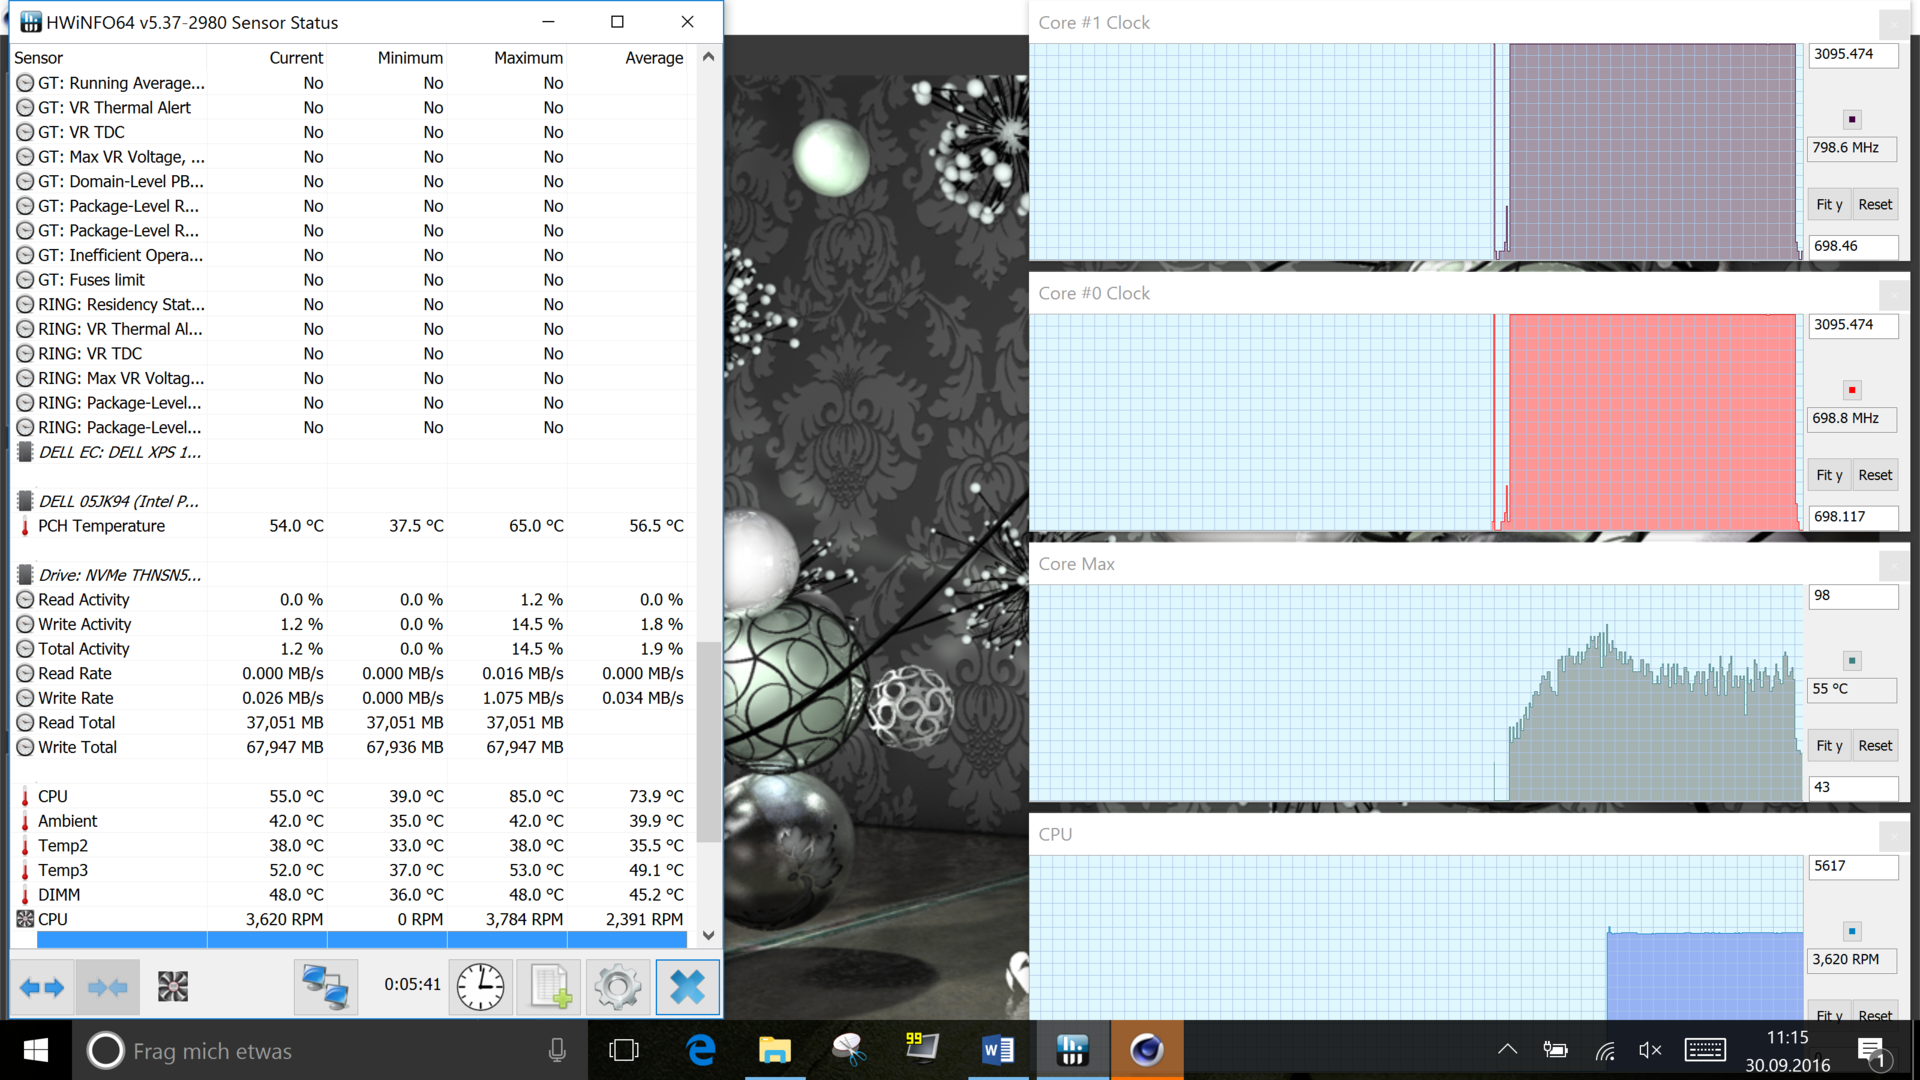
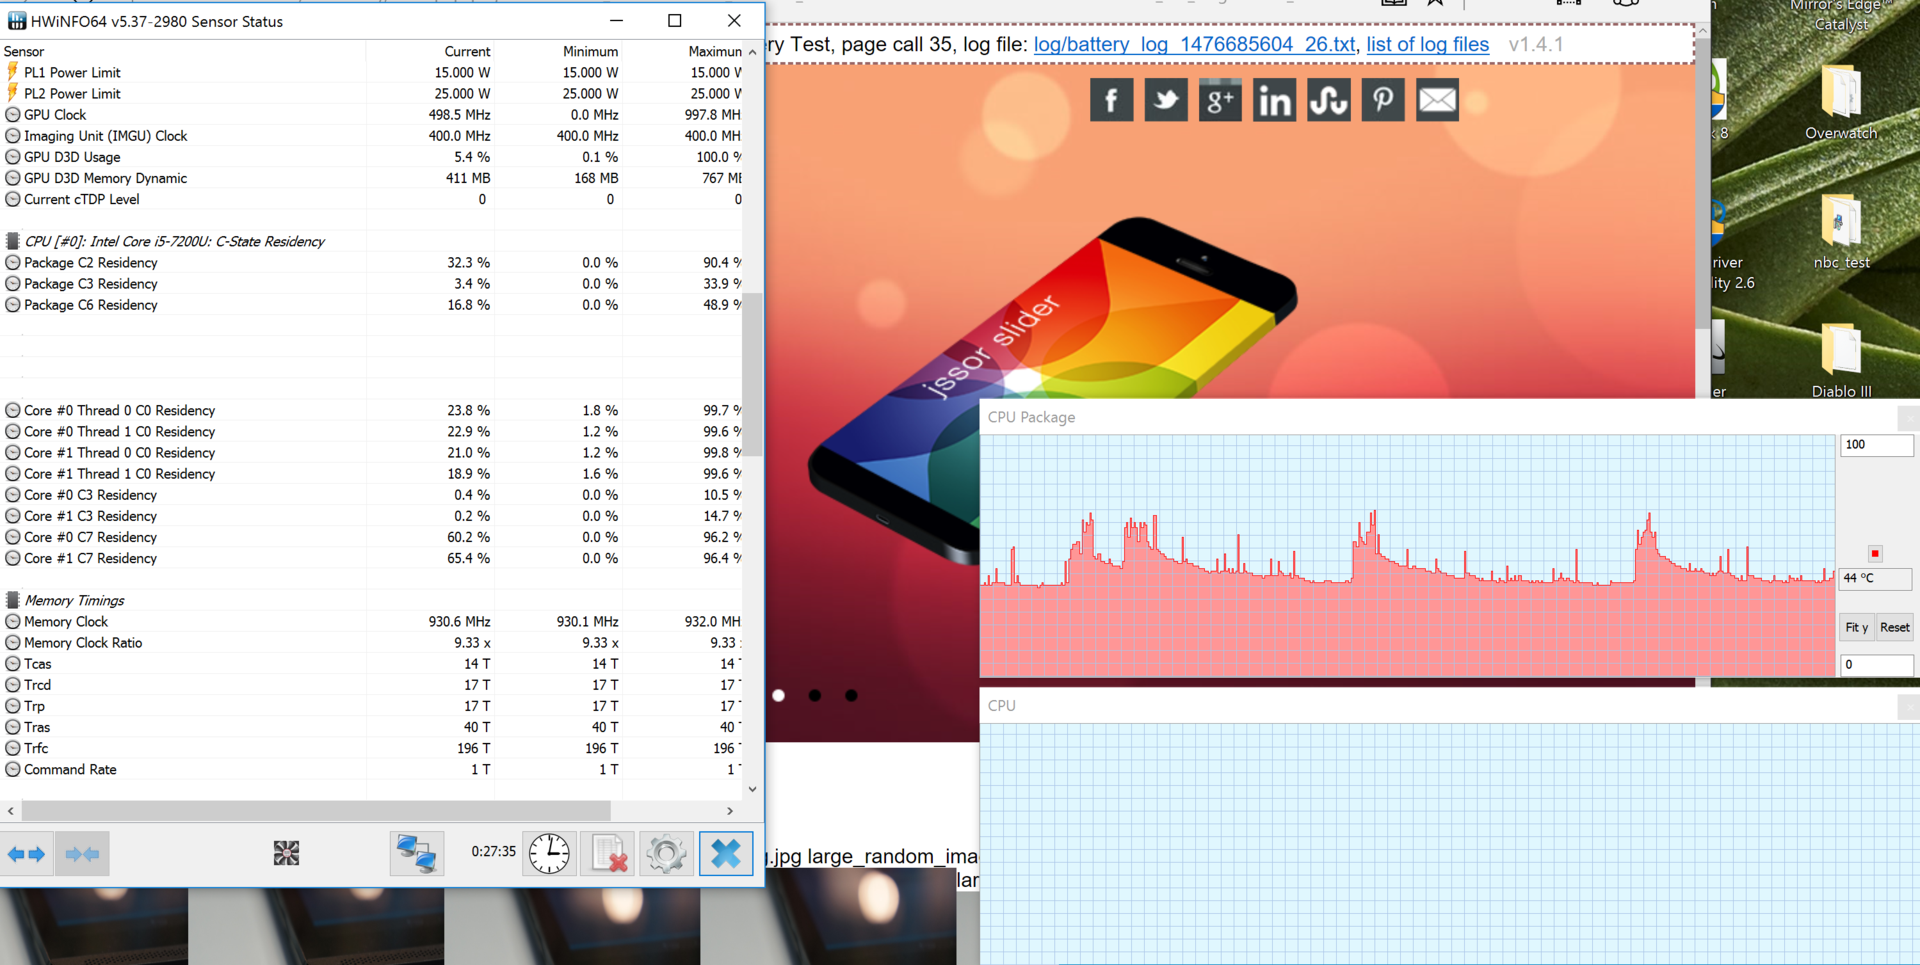
The CPU Turbo only stays at 3.1 GHz for a short while when you stress both cores, which is clearly shown by Cinebench R15 Multi and the X.264 benchmark. Dell currently leaves the fan disabled up to a CPU temperature of around 90 °C. The processor will then quickly reach the limit of 98 °C and reduces the clock to 2.8 GHz. The fan runs at 5600 rpm and keeps the CPU cores at around 88 °C at this kind of load, but the clock does not go higher than 2.8 GHz after that. The first X.264 benchmark run is therefore around 10 % faster (110 fps) compared to the second one (around 100 fps). The cooling performance is sufficient to enable steady 3.1 GHz in the Cinebench R15 Single-Core test. The CPU will reach up to 88 °C and then levels off at around 77 °C (at 3600 rpm for the fan).
After changing the heat paste (see above for a picture of the original mess), the temperature during the Cinebench R15 tests were definately better, but still the performance of the Core i5 only increases slightly to 306 points (as the CPU falls to 2.8 GHz only a few seconds later and still stays there). Another hint that more than our model may be affected, ist the report in the comments on the Core i7 performance that is not much higher and also lower than Dell sees in their labs (325 points).
Note: We are currently in close contact with Dell about the conspicuous performance behavior of our test model. It is possible that our unit has a defect with limited cooling capabilities. Dell showed us test protocols of the XPS 13 9360 where the CPU performance in Cinebench is on the expected level for the i5-7200U and the CPU executes both tests (Single and Multi-CPU) with almost the maximum clock. We try to clarify this as quickly as possible and will try to repeat our tests with another test model if possible.
System Performance
We check the system performance with the PCMark 8 Home benchmark. The score of 2761 points is rather disappointing and the Kaby Lake model is actually ranked just behind the Skylake predecessor. The results is, however, affected by the QHD+ screen and probably the low write performance of the SSD.
| PCMark 8 Home Score Accelerated v2 | 2761 points | |
Help | ||
Storage Devices
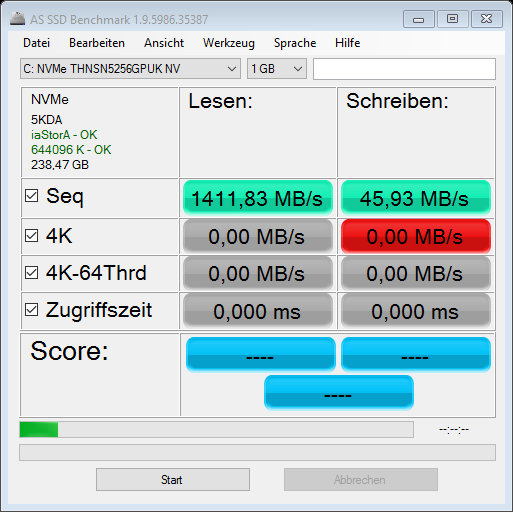
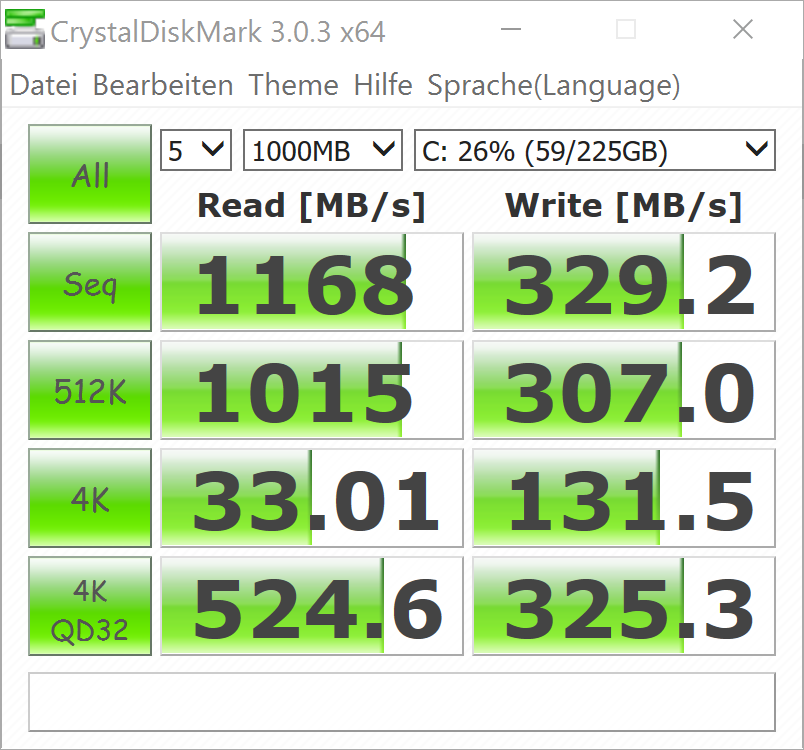
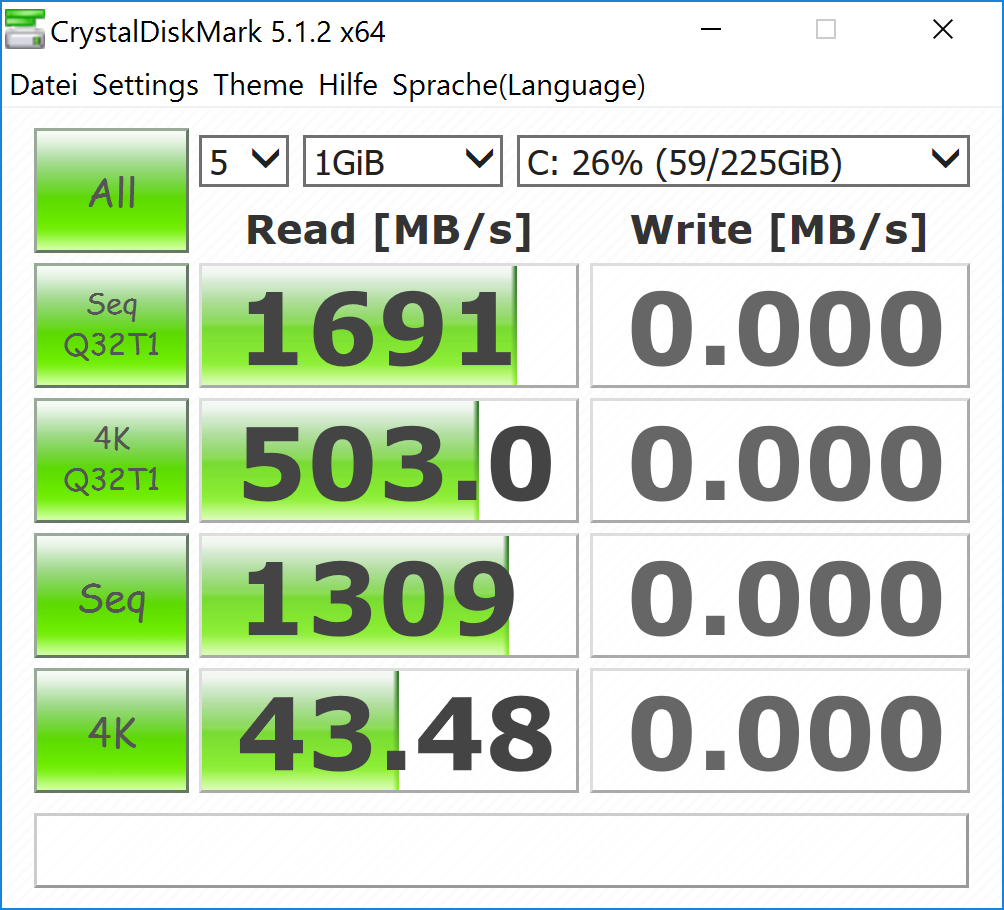
Contrary to the 128 GB model, Dell does not use a SATA-III M.2-SSD for the 256 GB SKU, but an NVMe-SSD. Our test model was equipped with a THNSN5256GPUK from Toshiba, but the drive did have some issues in AS SSD and CrystalDiskMark 5. CrystalDiskMark 3 shows rather low write speeds and a good read performance, similar to the old Skylake model.

GPU Performance
Not only the CPU performance of our test model is not perfect, the graphics performance cannot utilize the full potential from the Kaby Lake update, either. The initial 3DMark test score of the XPS 13 is 8 % behind a comparison device with the same CPU, and Intel's Iris Pro 540 is even 26 % faster. Systems with the Intel HD Graphics 520 are beaten by up to 10 %.
| 3DMark 11 - 1280x720 Performance GPU | |
| Dell XPS 13 2016 9350 (FHD, i7-6560U) | |
| MSI CX72-7QL | |
| Dell XPS 13 9360 QHD+ i5 | |
| HP Spectre 13 | |
| Acer Aspire S 13 S5-371-71QZ | |
| Dell XPS 13-9350 | |
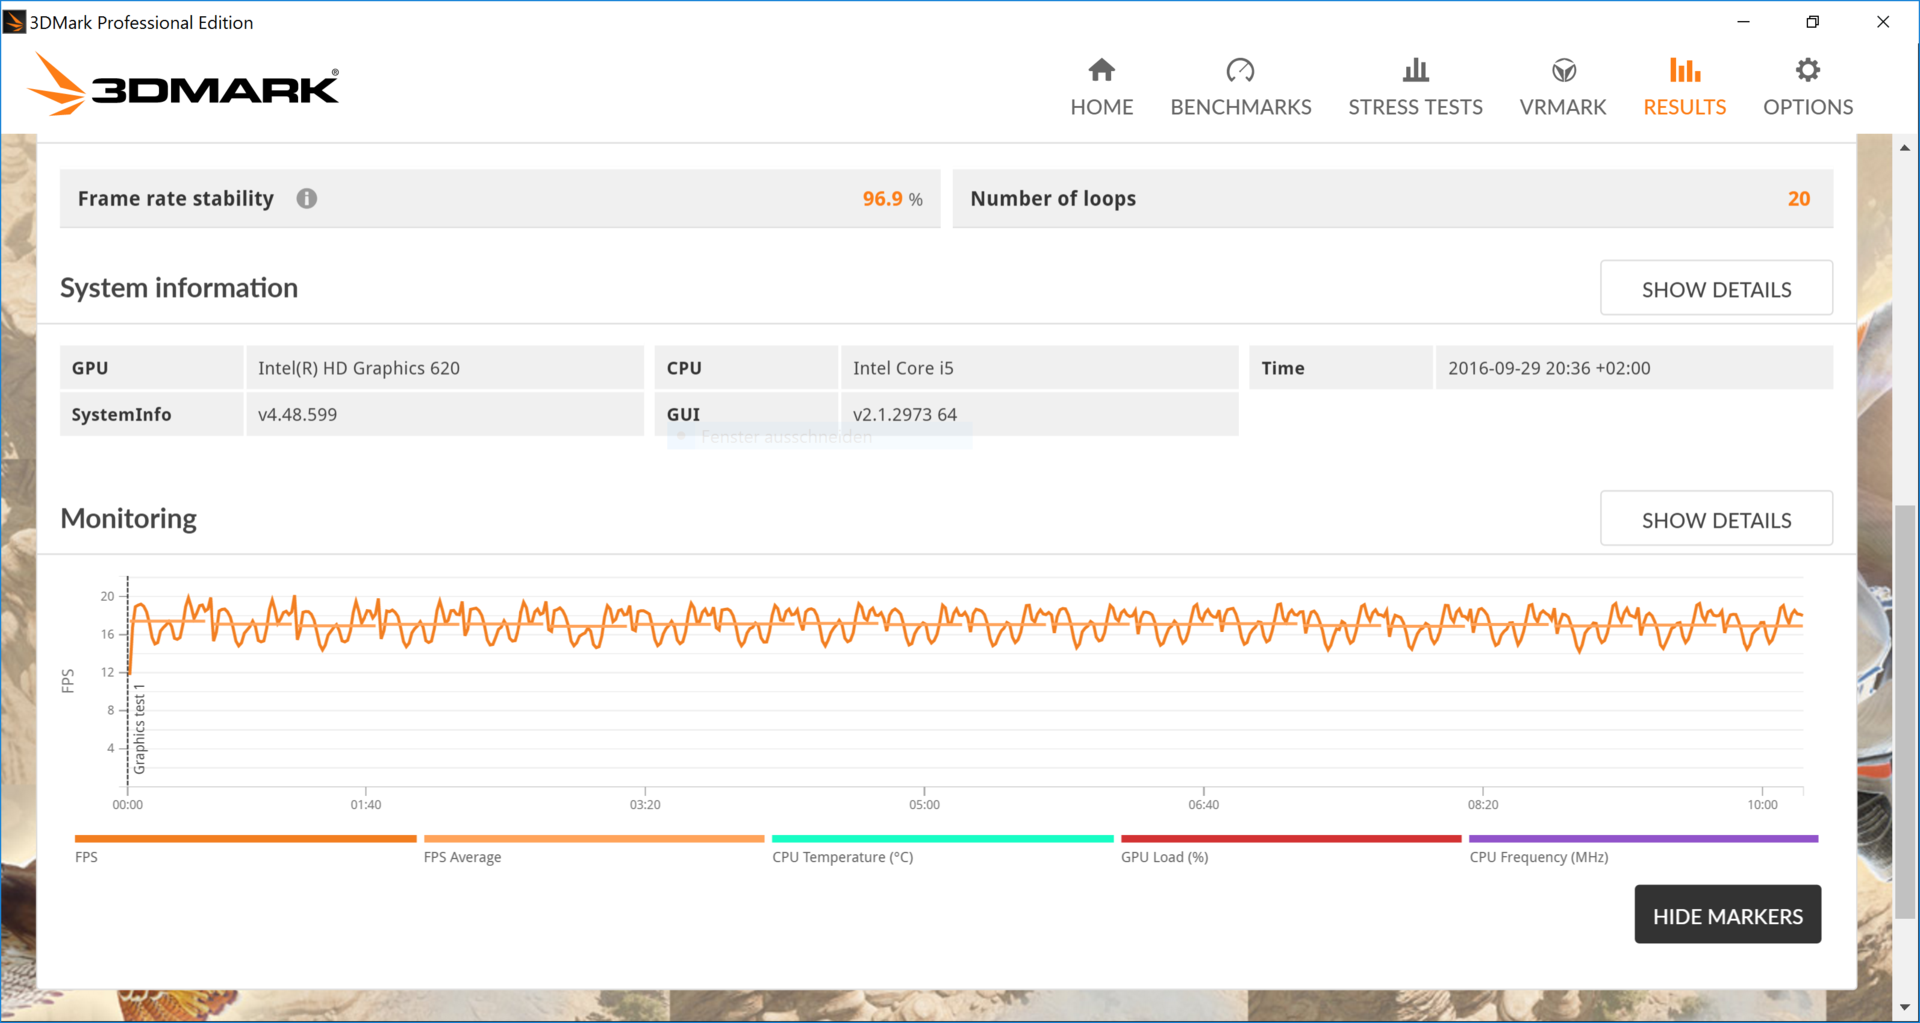
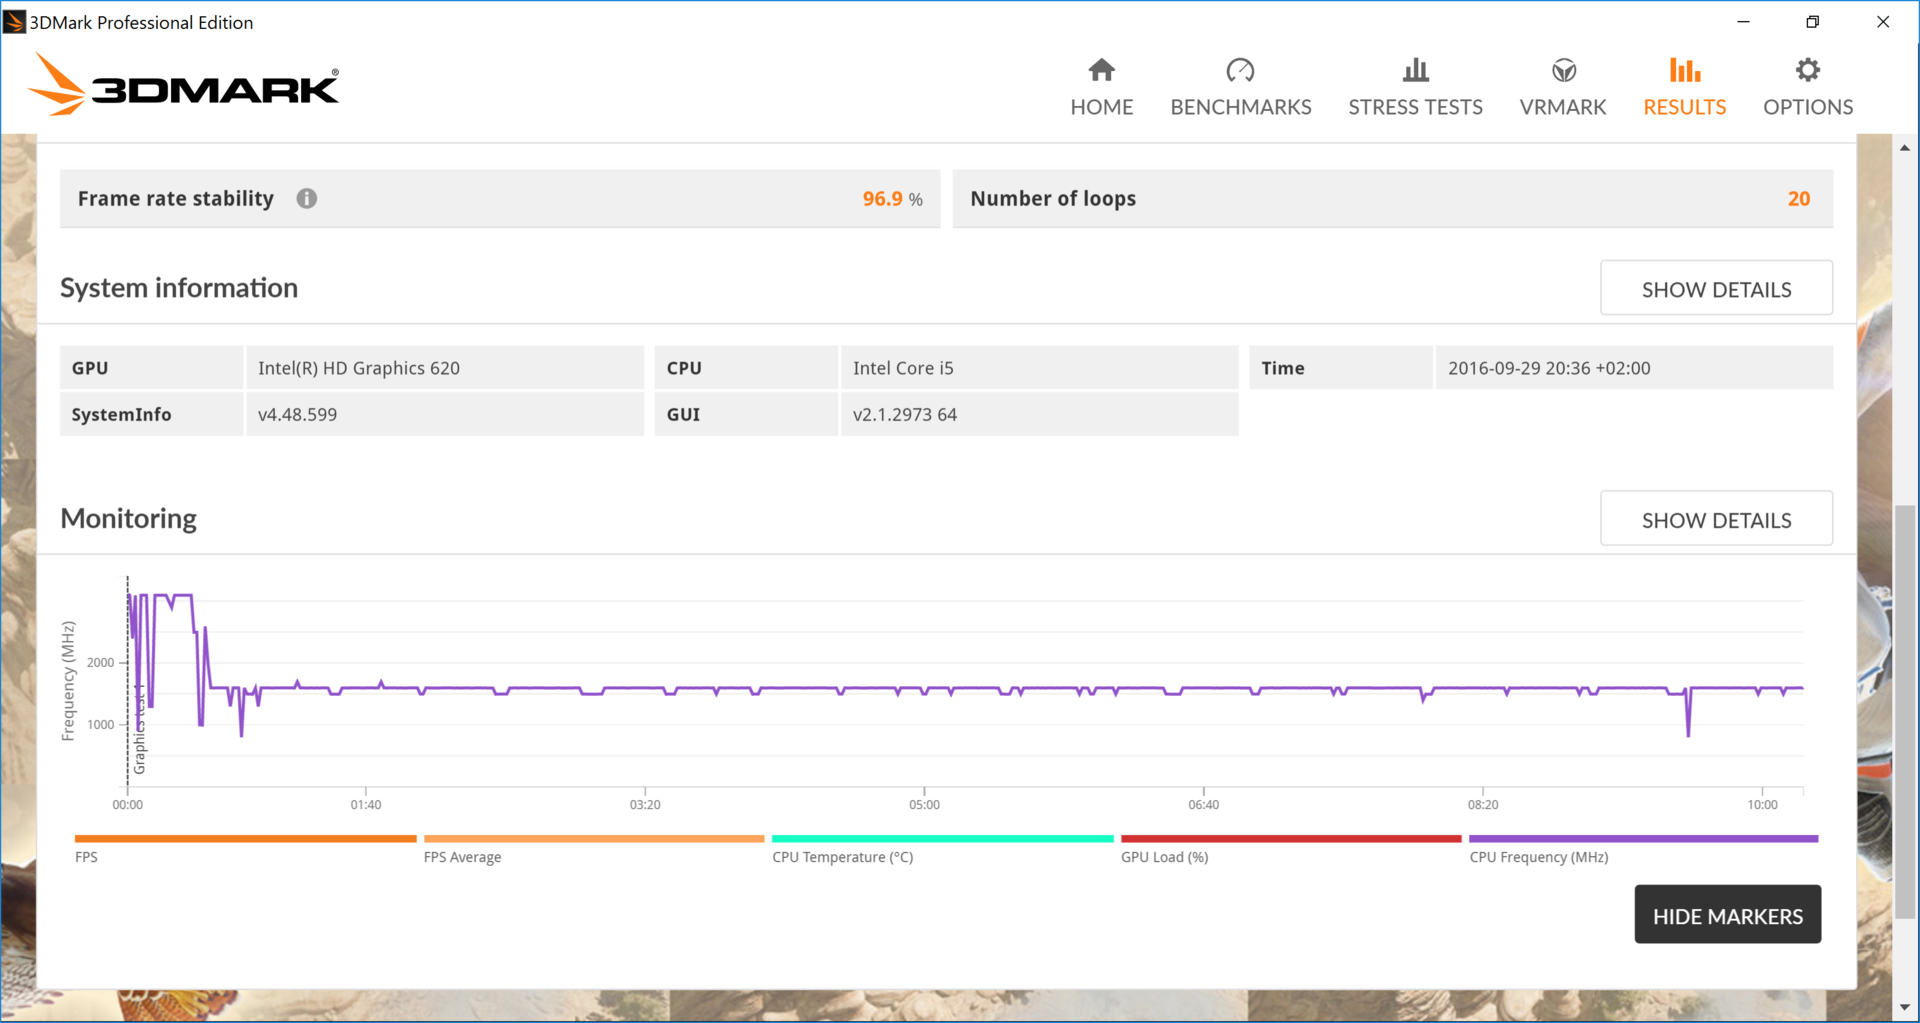
3DMark Stress Test
At 96.9 %, the Stress Test is not passed according to Futuremark (the limit is 97 %). The frame rate in the diagram is pretty steady, but the CPU cannot maintain its Turbo clocks and probably results in the lower scores of the benchmark runs 2-20.
| 3DMark 2001SE Standard | 67477 points | |
| 3DMark 11 Performance | 1683 points | |
| 3DMark Cloud Gate Standard Score | 5778 points | |
| 3DMark Fire Strike Score | 848 points | |
Help | ||
Gaming Performance
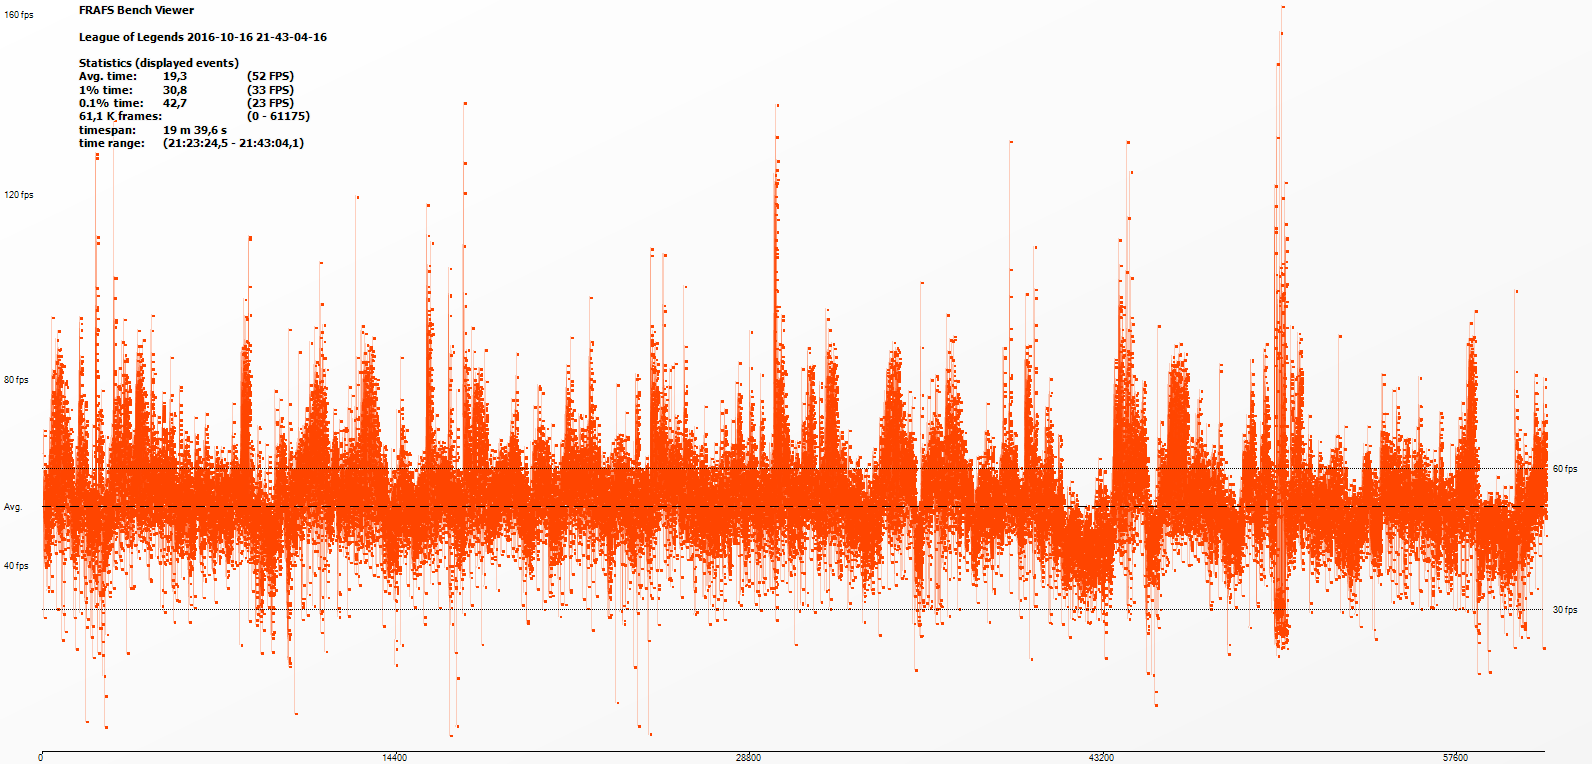
The XPS is unfortunately not a good gaming system. First of all, the Kaby Lake drivers currently still have some issues. Diablo 3 can only be played with active VSync (despite different settings) and there are big graphics errors in the menu and cutscenes in Fifa 17. Fifa 17 is also hardly playable despite 55 fps since the speed is way too slow. It seems that Fifa does not really like the dual-core processor. Older titles like Warcraft and Bioshock Infinite, but also less demanding games like World of Warships or Overwatch on the other hand can be played smoothly at the lowest settings. The very popular League of Legends poses no problem for the XPS 13 either. An online 5-vs-5 match ran smoothly at an average of 50 fps. Similar to Diablo 3, 60 fps was again the Maximum although the frame rate was not limited in the settings and VSync was not activate.
| low | med. | high | ultra | |
|---|---|---|---|---|
| World of Warcraft (2005) | 48 | 10.1 | ||
| Diablo III (2012) | 30 | 28.6 | ||
| BioShock Infinite (2013) | 50.5 | 30.3 | 25.5 | 8.2 |
| The Witcher 3 (2015) | 12.7 | |||
| World of Warships (2015) | 58 | 39.7 | 20.5 | |
| Rainbow Six Siege (2015) | 35.6 | 22.4 | 12.1 | |
| Rise of the Tomb Raider (2016) | 17.4 | |||
| Far Cry Primal (2016) | 16 | 8 | ||
| Overwatch (2016) | 40.1 | 30 | 13.9 |
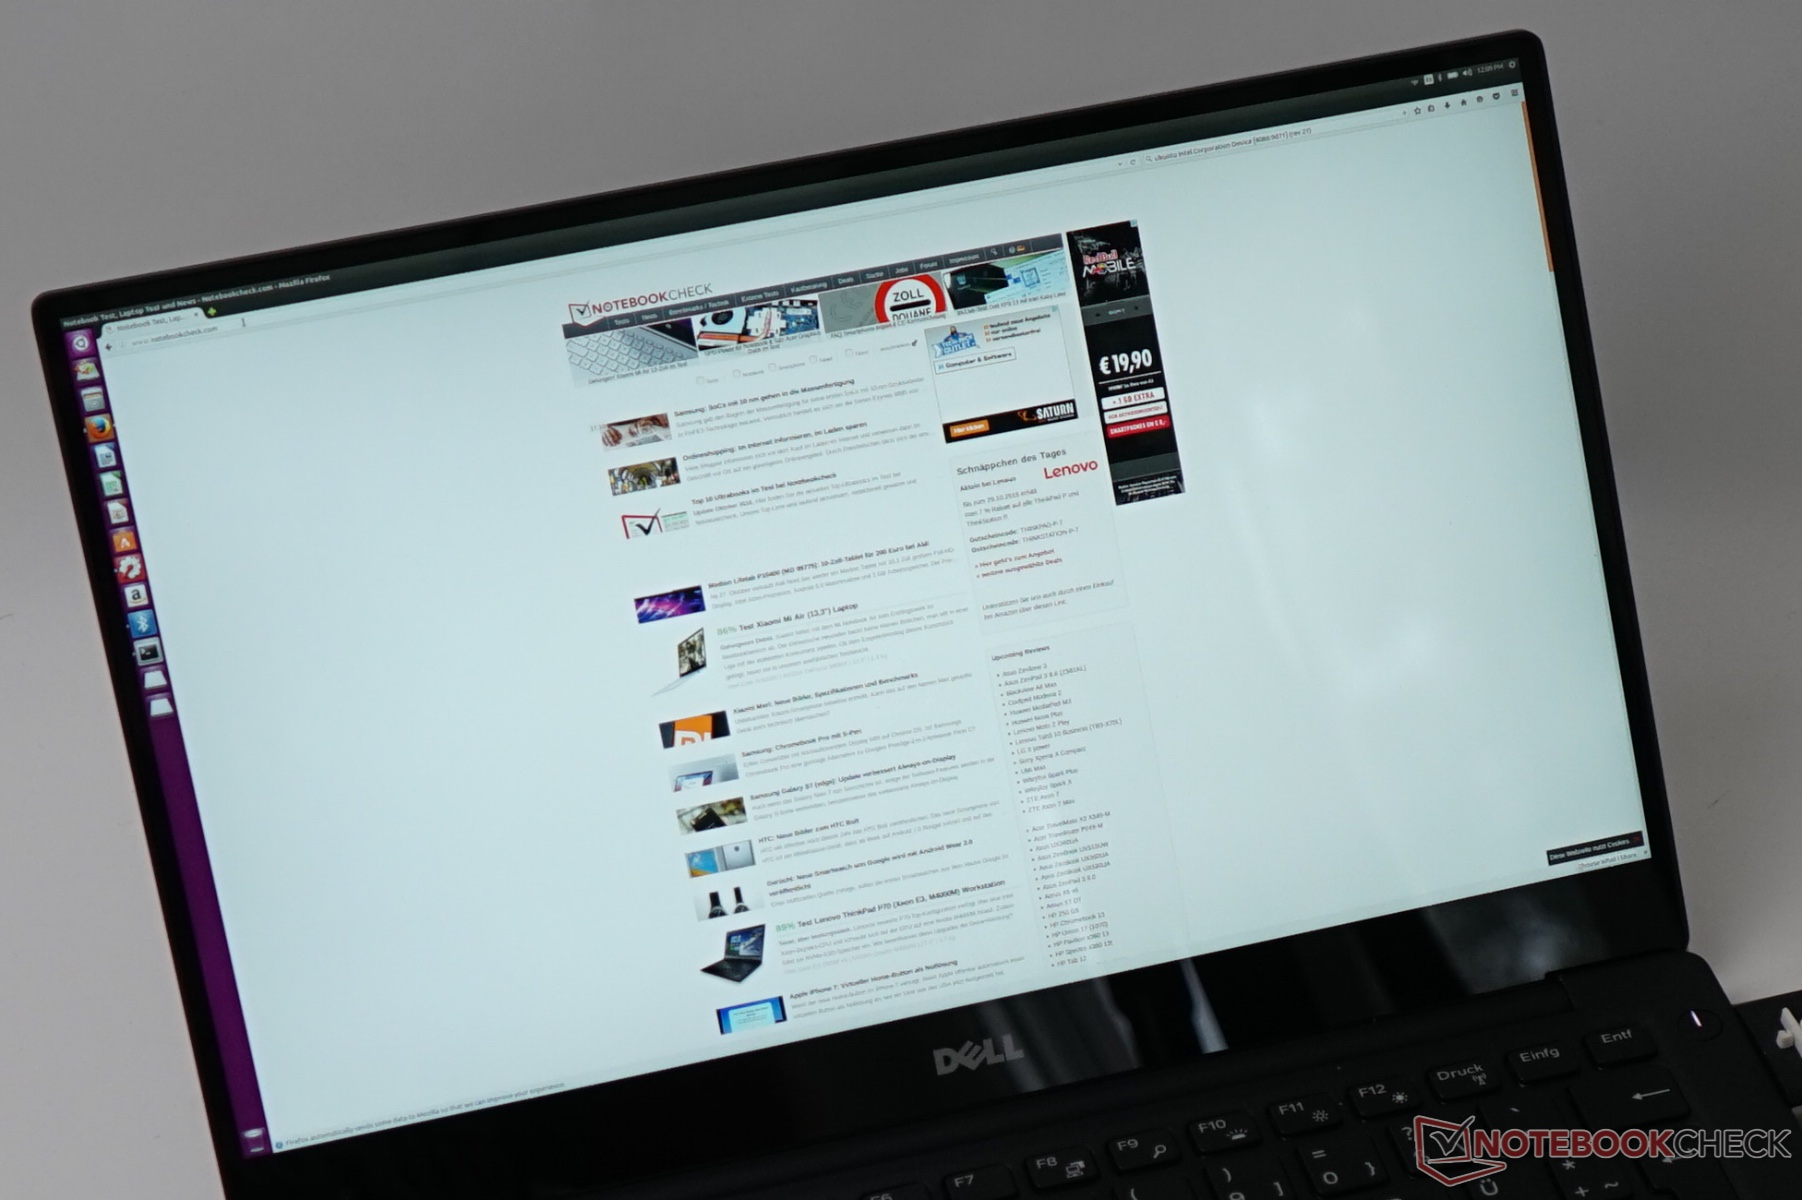
Ubuntu 16.10 on the XPS 13
A new hardware platform is always interesting when it comes to Linux compatibility. We therefore tested the Kaby Lake XPS 13 with the current Ubuntu version 16.04.1 and 16.10. Everything worked "out of the box" with 16.10 (booted from USB drive). Touchscreen, Wi-Fi, Bluetooth (no further tests, but devices were found), special keys (volume, brightness), touchpad, audio, webcam and WebGL (Unity Benchmark in Firefox 67557 points) were functional. The presentation on the 3200 x 1800 screen was pretty small though. The Full-HD screen might be the better choice here. Most things also worked on Ubuntu 16.04 without a configuration, only the sound card from Intel was not found. We recommend using 16.10.
Emissions
System Noise
We already noticed a quiet coil whining from our test model during the initial tests and benchmarks. This problem was also reported from many users of the previous generation and was one of the biggest disadvantages of the XPS 13.
The fan of our test model leaves mixed impressions as well. It is often active and clearly audible even without dedicated CPU load, but the device is still silent most of the time with office workloads. The recorded noise characteristics is similar to the previous Skylake model. The frequencies around 2500 Hz in particular are increasing when the fan spins faster. The most common fan speed is 3600 rpm, which results in a system noise of 32.2 dB(A). Subjectively, this can be described as audible but low-frequency murmur. The fan will hit ist maximum speed at 5000 rpm under sustained load, which are very audible at 38.5 in the lower highs.
After the replacement of the thermal paste, we also had another look at the fan characteristics with light workloads. The fan is always deactivated in the modes Idle, WLAN browsing and YouTube (up to 5K) at an ambient temperature of 20 °C. The CPU reaches up to 75 °C and therefore doe not trigger the fan. Before we changed the thermal paste, we could often notice the fan during the installation of updates in the background, but the small copper cooler could not handle as much heat in this case. The basic cooling design can therefore manage a quiet operation. The deactivated fan does enable a completely silent cooling, but there is no headroom for short CPU load periods. Apple can compensate such periods much better, where the CPU fan runs constantly – but it is basically not audible.
Noise level
| Idle |
| 30.6 / 30.6 / 32.2 dB(A) |
| Load |
| 32.2 / 38.5 dB(A) |
 | ||
30 dB silent 40 dB(A) audible 50 dB(A) loud |
||
min: | ||
Temperature
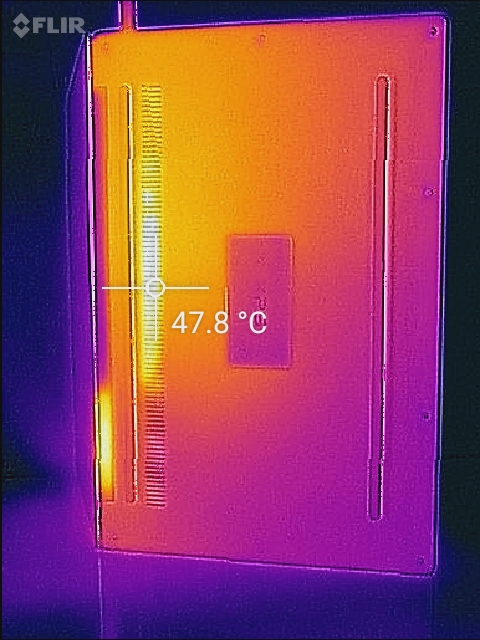
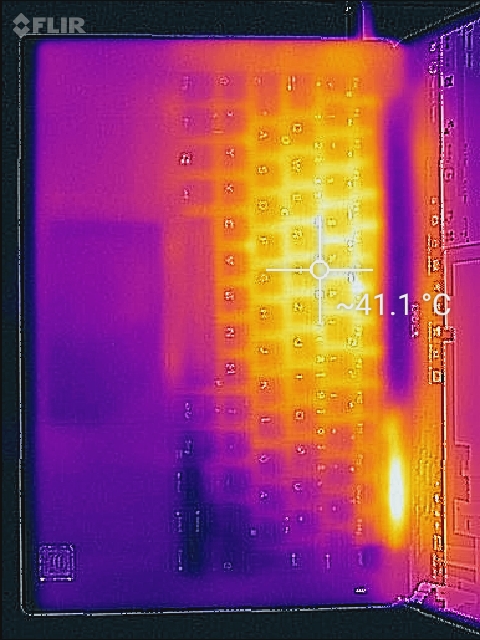
While our test model of the Dell XPS 13 is very inconspicuous with surface temperatures of less than 30 °C under light workloads, we can see two hot spots under load at the rear area of the top and the bottom, respectively. At up to 40 °C at the top and 42 °C at the bottom, the values are still in the acceptable range. It is interesting to compare our measurements with our i5-6200U XPS 13 model, which is the predecessor CPU of the i5-7200U. The surface temperatures of the old model were a bit higher (bottom: up to 45 vs. 40 °C, top: up to 45 vs. 42 °C).
(±) The maximum temperature on the upper side is 40 °C / 104 F, compared to the average of 35.9 °C / 97 F, ranging from 21.4 to 59 °C for the class Subnotebook.
(±) The bottom heats up to a maximum of 42 °C / 108 F, compared to the average of 39.2 °C / 103 F
(+) In idle usage, the average temperature for the upper side is 26.2 °C / 79 F, compared to the device average of 30.8 °C / 87 F.
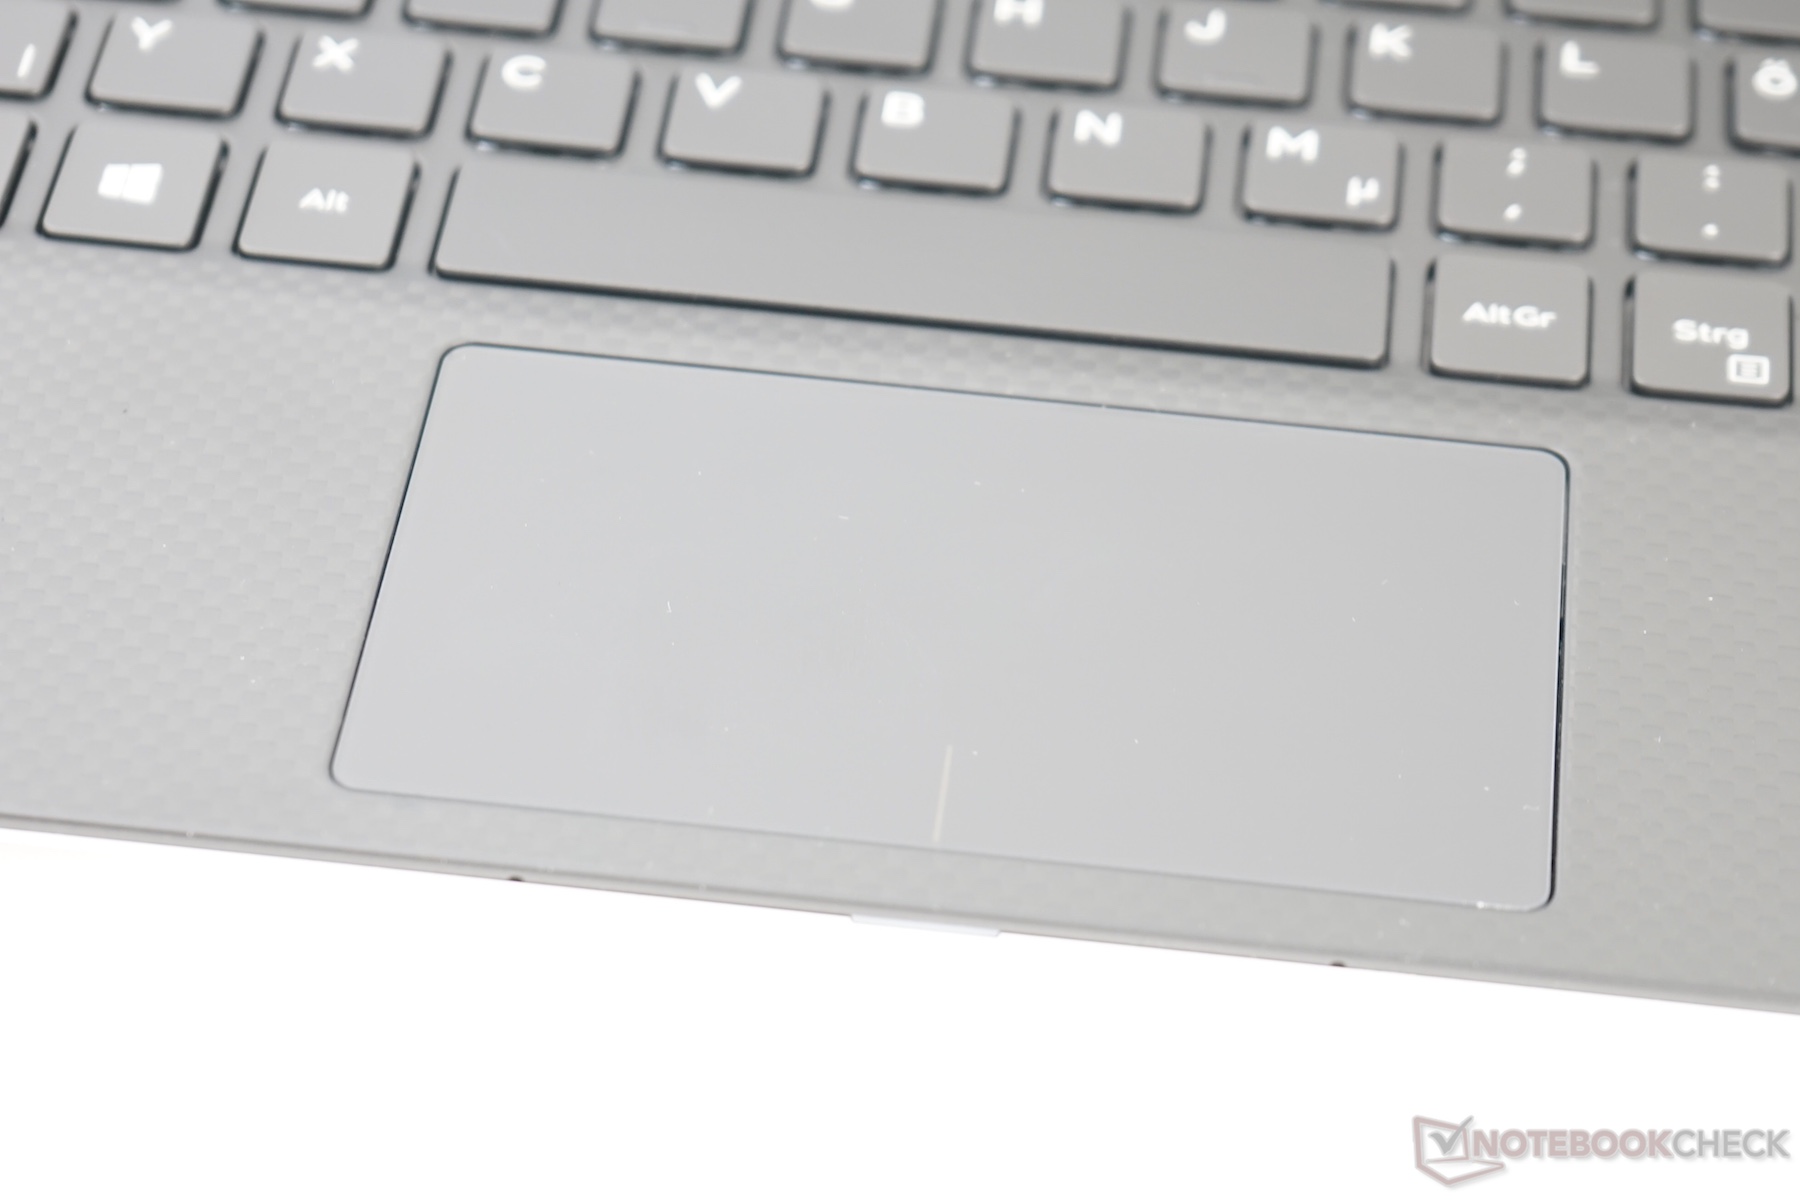
(+) The palmrests and touchpad are cooler than skin temperature with a maximum of 30 °C / 86 F and are therefore cool to the touch.
(±) The average temperature of the palmrest area of similar devices was 28.2 °C / 82.8 F (-1.8 °C / -3.2 F).
| Dell XPS 13 9360 (7200U) | Dell XPS 13 9350 (6200U) | Dell XPS 13 9350 (6560U) | Acer Aspire S 13 S5-371-71QZ | Lenovo IdeaPad 710S-13ISK | |
|---|---|---|---|---|---|
| Heat | -8% | -16% | 1% | -7% | |
| Maximum Upper Side * (°C) | 40 | 45.2 -13% | 45 -13% | 38.5 4% | 42 -5% |
| Maximum Bottom * (°C) | 42 | 45.2 -8% | 50 -19% | 47.7 -14% | 37.5 11% |
| Idle Upper Side * (°C) | 28 | 30.4 -9% | 27.2 3% | 34.8 -24% | |
| Idle Bottom * (°C) | 31 | 31.2 -1% | 27.4 12% | 33.4 -8% |
* ... smaller is better
Compared to the XPS 13 9350 with Intel i7-6560U processor, the temperature distribution is very similar, but are between 5-8 degrees cooler compared to the highest values of the Skylake i7. The XPS 13 stays comfortable in practice without long load periods. If you stress the device, when you render a video, for example, it could be a bit uncomfortable when you use the system on your lap.
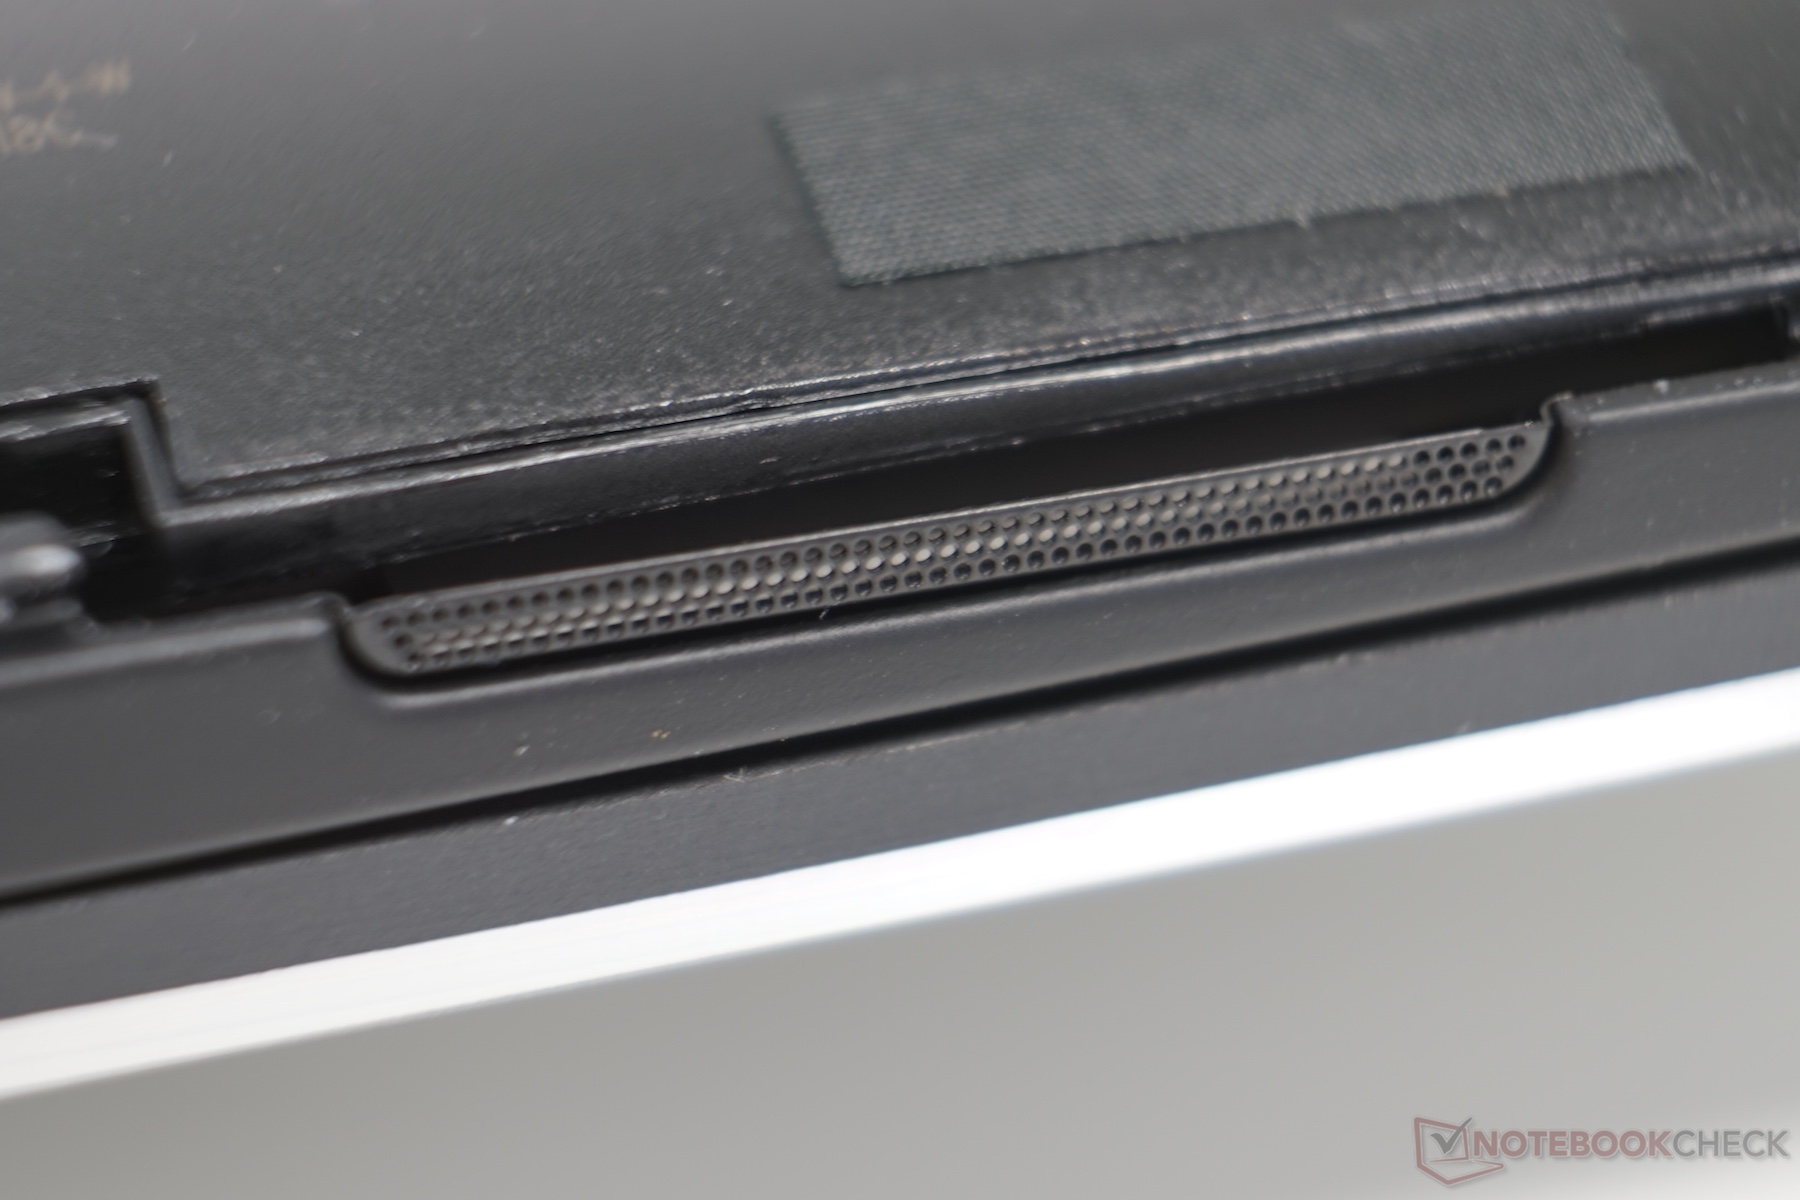
Speakers
All in all, the sound quality from the speakers is convenient. This is primarily a result of the covered low-frequency range, but the XPS still falls behind the Apple MacBook 12 in this respect. The latter also performs better in the high-tone range. We can see similar characteristics compared to the XPS 13 9350, but our test model of the 9350 was a tad louder than the 9360.
Dell XPS 13 9360 QHD+ i5 audio analysis
(±) | speaker loudness is average but good (79.4 dB)
Bass 100 - 315 Hz
(±) | reduced bass - on average 9.5% lower than median
(±) | linearity of bass is average (14% delta to prev. frequency)
Mids 400 - 2000 Hz
(+) | balanced mids - only 4.5% away from median
(+) | mids are linear (5% delta to prev. frequency)
Highs 2 - 16 kHz
(+) | balanced highs - only 2.9% away from median
(±) | linearity of highs is average (11% delta to prev. frequency)
Overall 100 - 16.000 Hz
(±) | linearity of overall sound is average (15.1% difference to median)
Compared to same class
» 33% of all tested devices in this class were better, 5% similar, 62% worse
» The best had a delta of 5%, average was 18%, worst was 53%
Compared to all devices tested
» 21% of all tested devices were better, 4% similar, 75% worse
» The best had a delta of 4%, average was 23%, worst was 134%
Apple MacBook 12 (Early 2016) 1.1 GHz audio analysis
(+) | speakers can play relatively loud (83.6 dB)
Bass 100 - 315 Hz
(±) | reduced bass - on average 11.3% lower than median
(±) | linearity of bass is average (14.2% delta to prev. frequency)
Mids 400 - 2000 Hz
(+) | balanced mids - only 2.4% away from median
(+) | mids are linear (5.5% delta to prev. frequency)
Highs 2 - 16 kHz
(+) | balanced highs - only 2% away from median
(+) | highs are linear (4.5% delta to prev. frequency)
Overall 100 - 16.000 Hz
(+) | overall sound is linear (10.2% difference to median)
Compared to same class
» 7% of all tested devices in this class were better, 2% similar, 90% worse
» The best had a delta of 5%, average was 18%, worst was 53%
Compared to all devices tested
» 5% of all tested devices were better, 1% similar, 94% worse
» The best had a delta of 4%, average was 23%, worst was 134%
Dell XPS 13 2016 9350 (FHD, i7-6560U) audio analysis
(+) | speakers can play relatively loud (83.8 dB)
Bass 100 - 315 Hz
(-) | nearly no bass - on average 19.4% lower than median
(-) | bass is not linear (15.4% delta to prev. frequency)
Mids 400 - 2000 Hz
(+) | balanced mids - only 4.7% away from median
(±) | linearity of mids is average (9.1% delta to prev. frequency)
Highs 2 - 16 kHz
(+) | balanced highs - only 3.5% away from median
(±) | linearity of highs is average (7.6% delta to prev. frequency)
Overall 100 - 16.000 Hz
(±) | linearity of overall sound is average (18.8% difference to median)
Compared to same class
» 56% of all tested devices in this class were better, 7% similar, 37% worse
» The best had a delta of 5%, average was 18%, worst was 53%
Compared to all devices tested
» 43% of all tested devices were better, 8% similar, 49% worse
» The best had a delta of 4%, average was 23%, worst was 134%
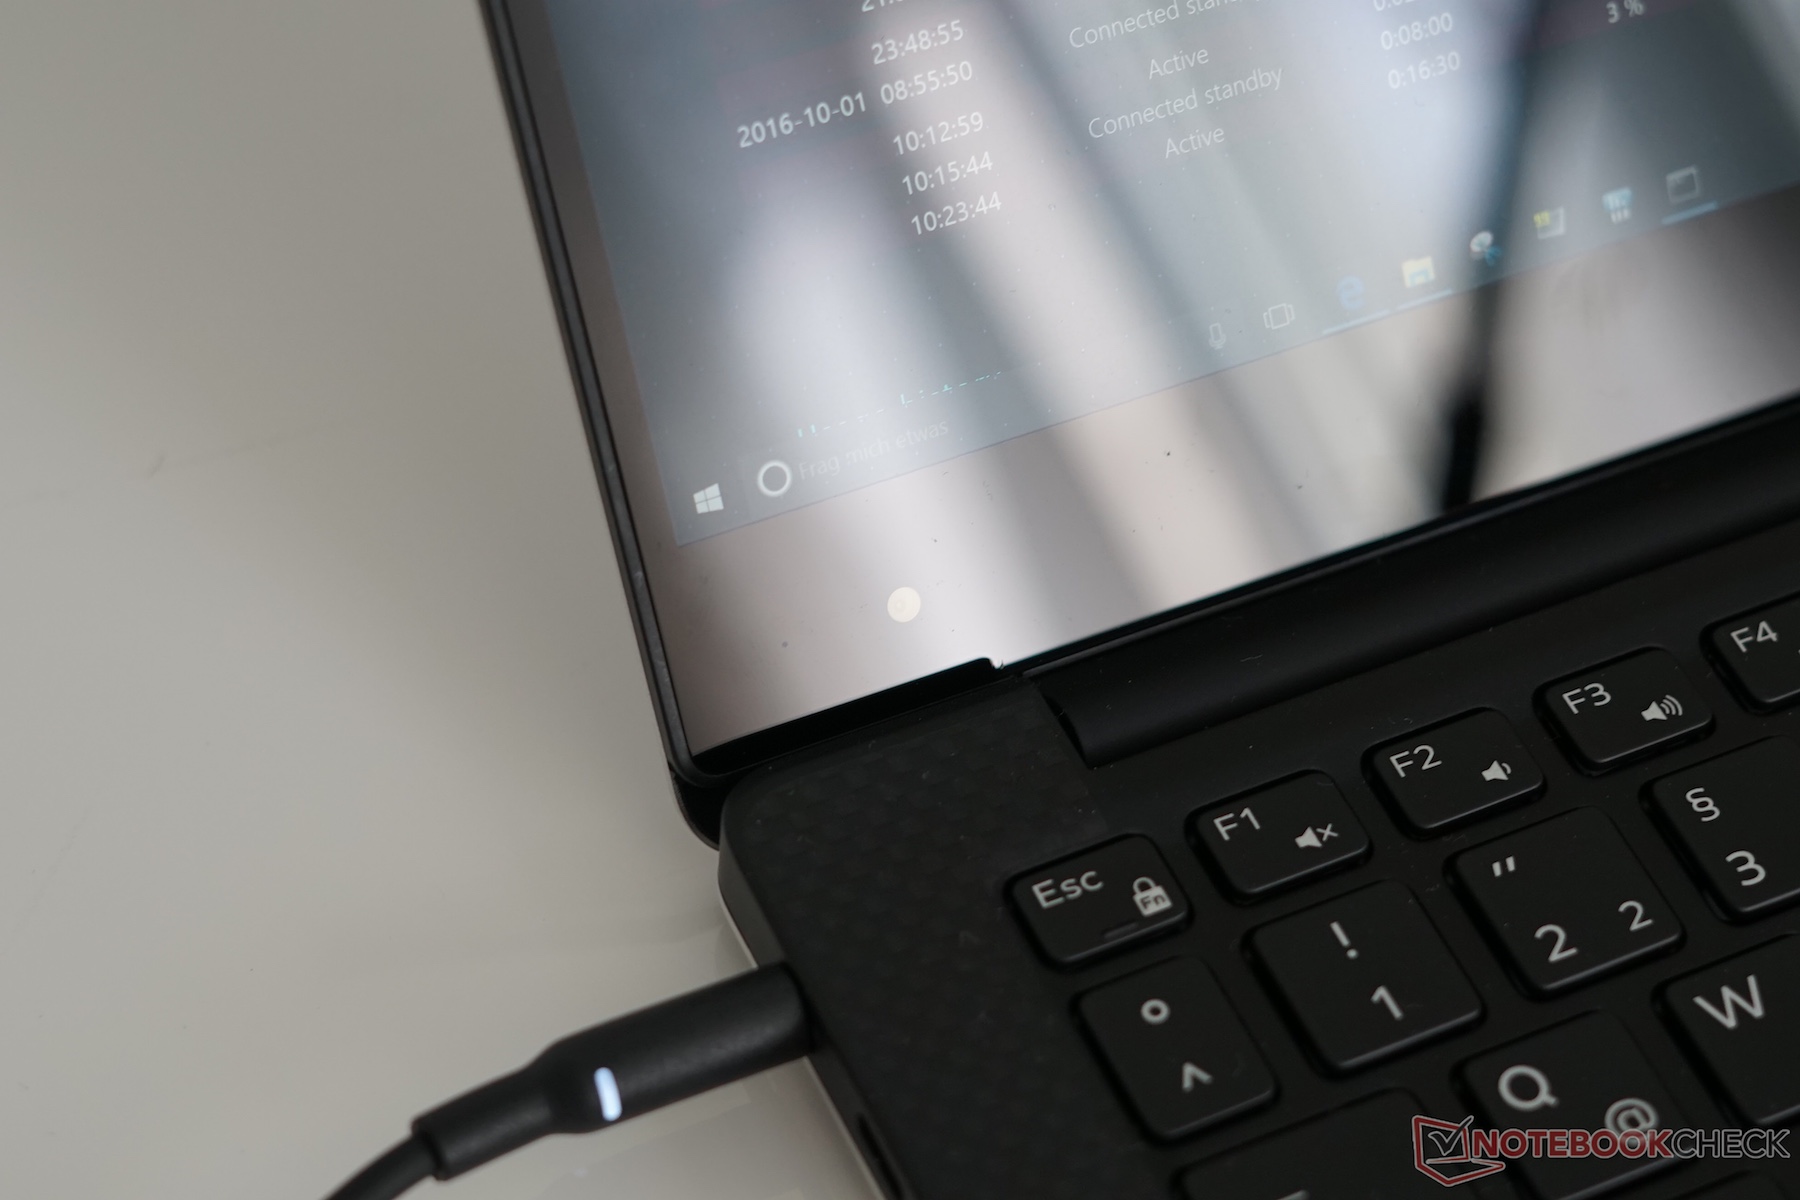
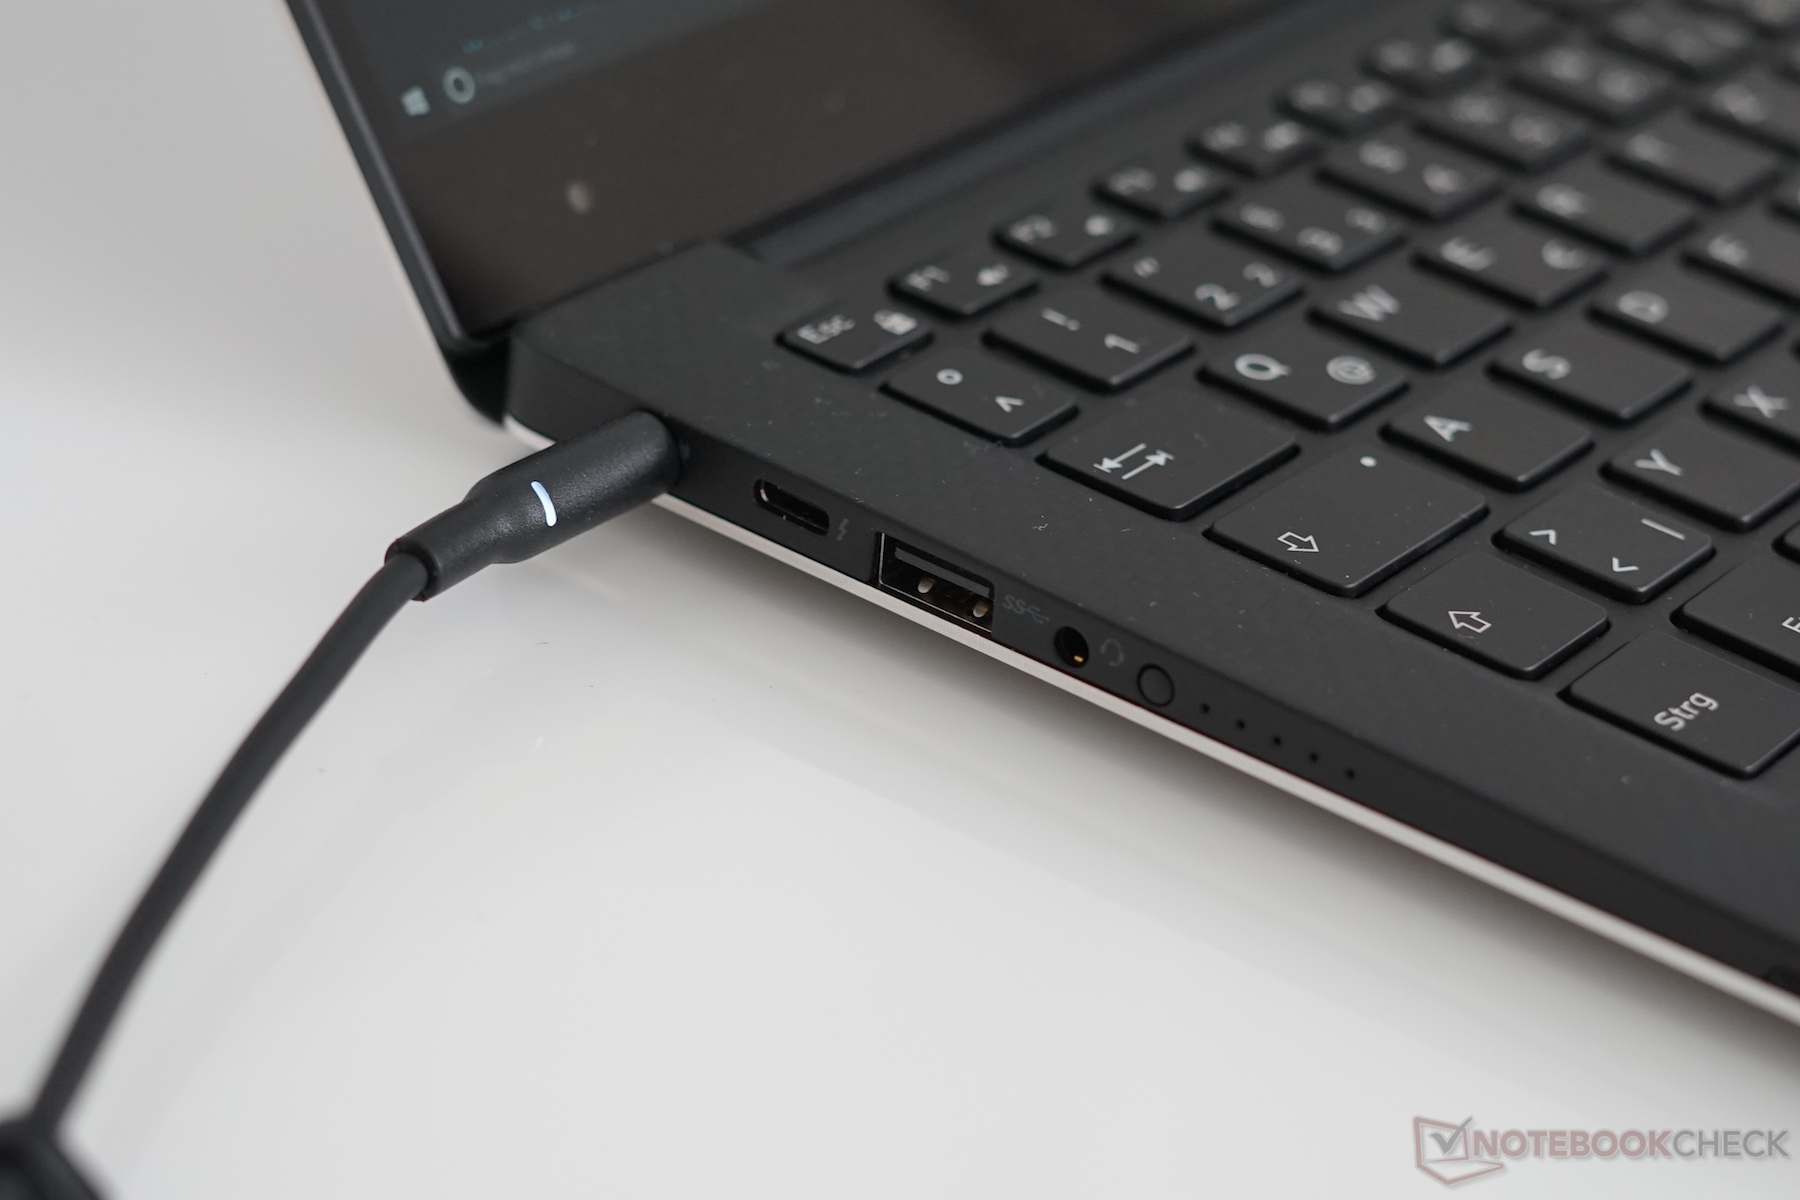
Power Consumption
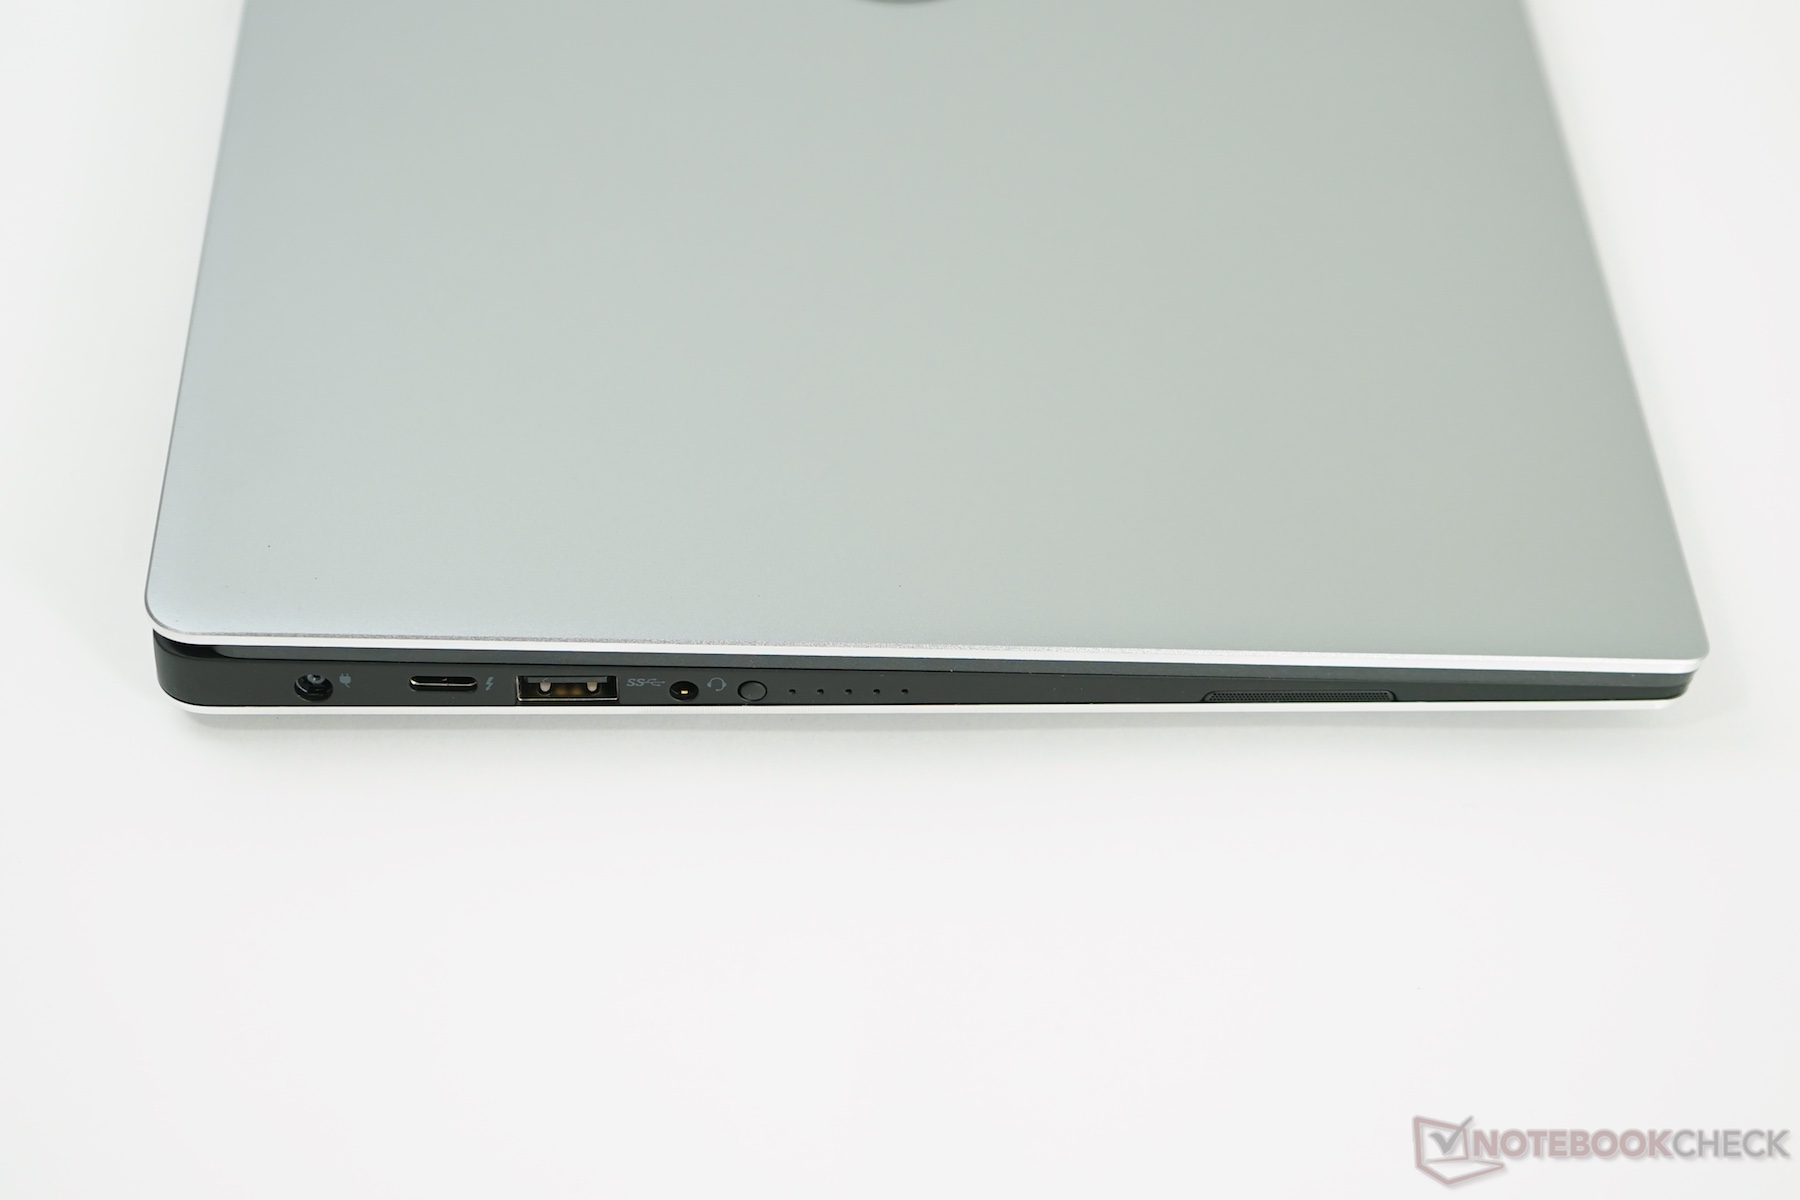
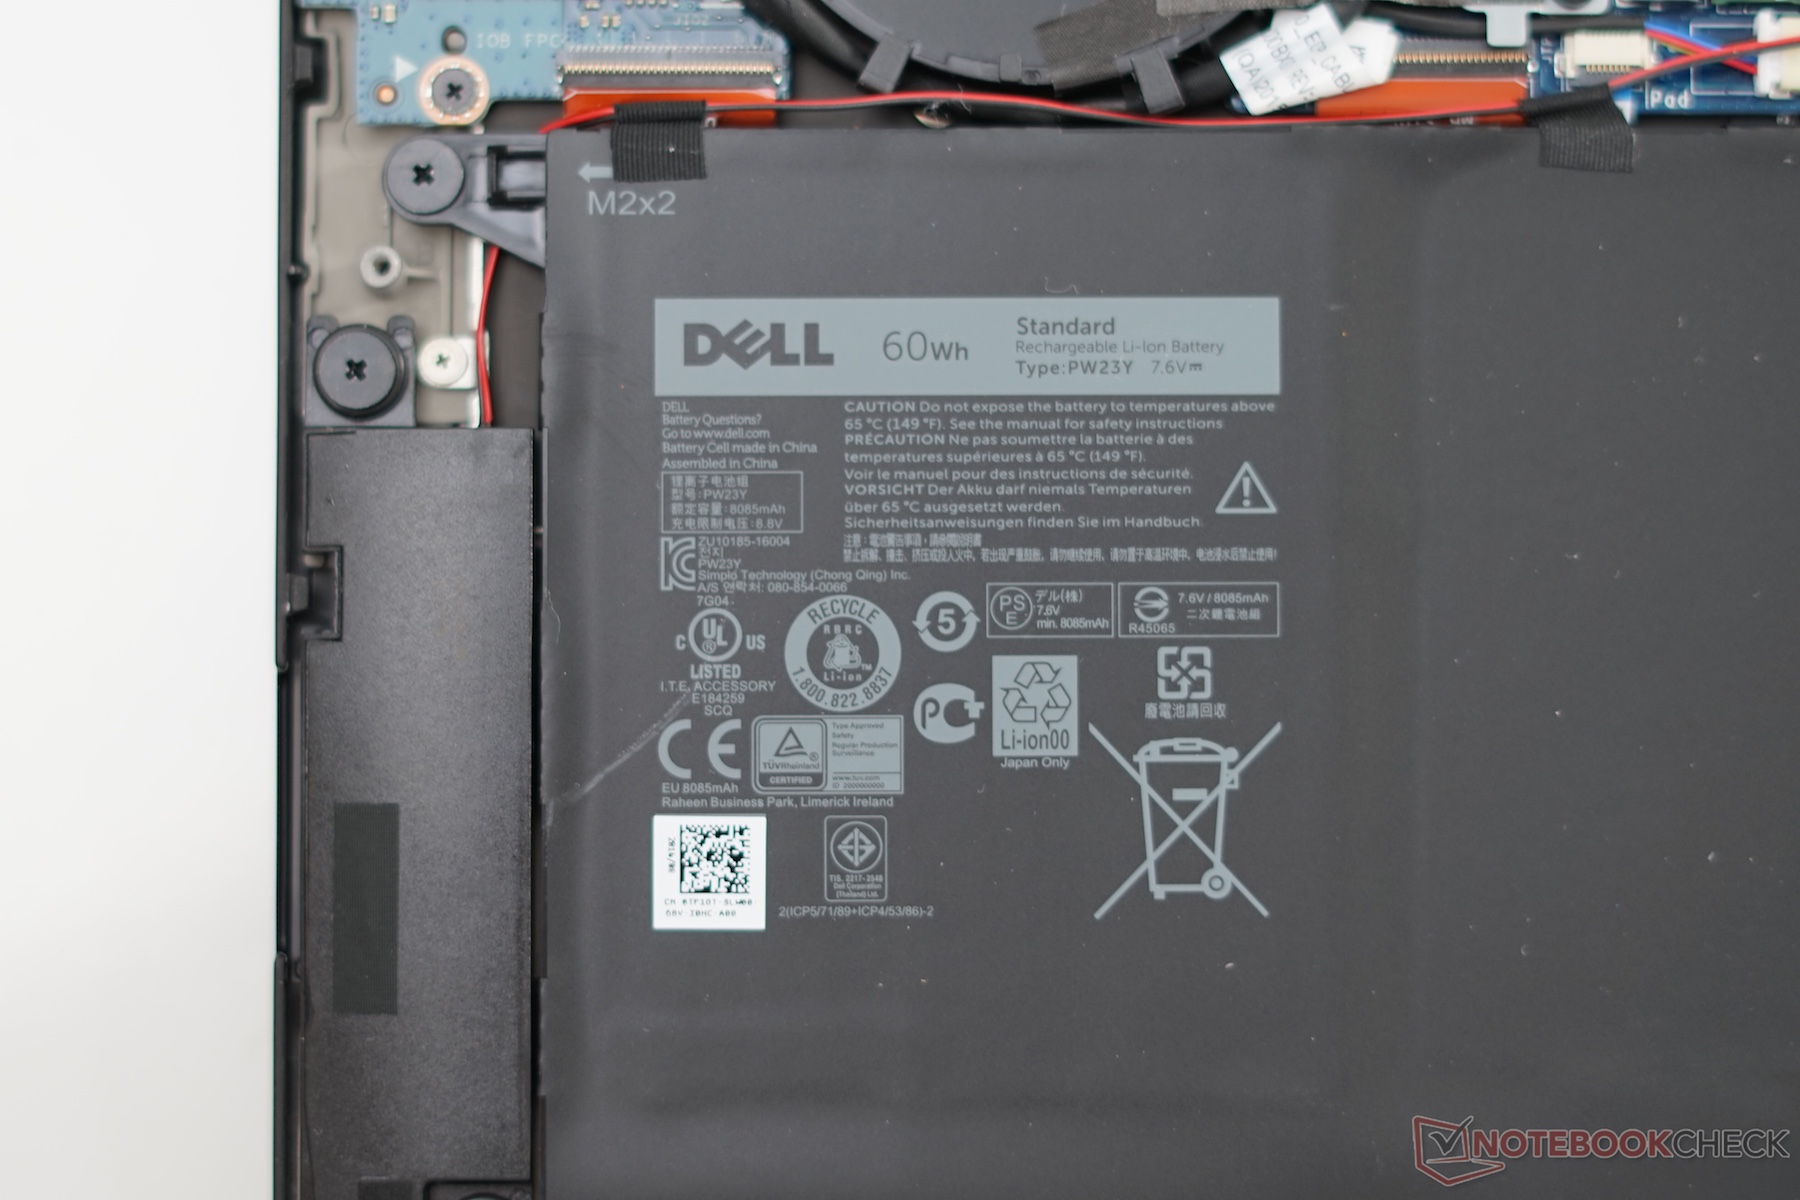
The shipped 45-Watt power adapter does a good job and is sufficient for the system. The measured 0.26 Watts when the device is turned off are okay, but the high standby consumption was conspicuous. We check the efficiency of the power adapter in our WLAN test with a display luminance of 150 nits as well as bei The Witcher 3. The power adapter drew 8.8 Watts from the socket on average. This would require a 77-Wh battery to reach the determined runtime. The XPS 13 is only equipped with a 60-Wh battery, so the efficiency of the power adapter is 78 %. The performance was better at an efficiency of 86 % in the load scenario with The Witcher 3 and again 150 nits.
If we compare the measurements with the predecessor, which was equipped with QHD+ and 6500U, we can see that the standby consumption was much lower at 0.4 Watts. The new Late 2016 is a bit more frugal under load (6.1 vs. 9-10 Watts for the previous generations), but the consumption is basically identical under load.
| Off / Standby | |
| Idle | |
| Load |
|
Key:
min: | |
Battery Runtime
A battery runtime of 8 hours and 46 minutes for the Kaby Lake laptop with its 60 Wh battery is a great result – when you consider the 3K display with the higher power consumption. This means it is even more enduring than the previous Full-HD model, but still behind the i5-5200U FHD model from 2015 (+14%). The average result for the segment of subnotebooks is currently 7 hours, and the top spot is occupied by the Satellite Z30-B-100 with an impressive runtime of 12 hours in our test.
When we changed the brightness of the display to 100%, the power consumption (at the power outlet) increased from 8.8 to 11.6 Watt leading to approximately 6.6 hours of runtime in the WiFi test (calculated).
A runtime of little more than 9 hours in the video test with Big Buck Bunny and a brightness of 150 nits (34 % of the maximum luminance in the case of our test model) is also convincing. The XPS 13 therefore manages a runtime on par with the 1.1 GHz MacBook 12 (2016) test model (the faster models lasted 2 hours longer) or the 2015 MacBook Pro Retina 13. The model with the longest stamina is once again the Z30 at 11 hours. Dell advertises 13 hours (Netflix streaming) for the Full-HD model.
Processor and graphics card performance did not suffer in battery mode in our tests (Cinebench R15 Multi and The Witcher 3). The Witcher 3 ran on battery exactly for 2.5 hours with again 150 nits brightness, the last 30 minutes however the fps rate went a bit down from 15 to 12 fps.
| Dell XPS 13 9360 QHD+ i5 i5-7200U, 3200x1800, 60 Wh | Dell XPS 13 2016 9350 (FHD, i7-6560U) 6560U, 1920x1080, 56 Wh | Asus Zenbook UX302LA-C4003H 4200U, 1920x1080, 50 Wh | Acer Aspire S 13 S5-371-71QZ 6500U, 1920x1080, 45 Wh | HP Spectre 13 6500U, 1920x1080, 38 Wh | Microsoft Surface Pro 4, Core i5, 128GB 6300U, 2736x1824, 38 Wh | Apple MacBook Pro Retina 13 inch 2015-03 5257U, 2560x1600, 75 Wh | |
|---|---|---|---|---|---|---|---|
| Battery runtime | -7% | -26% | -18% | -40% | -18% | -7% | |
| H.264 (h) | 9.1 | 9.7 7% | |||||
| WiFi v1.3 (h) | 8.8 | 7.3 -17% | 7.9 -10% | 5.6 -36% | 7.1 -19% | 9 2% | |
| Load (h) | 2.3 | 2.4 4% | 1.7 -26% | 1.7 -26% | 1.3 -43% | 1.9 -17% | 1.6 -30% |
| Reader / Idle (h) | 15.7 | 11.8 | 17.1 | 11.9 | 15 | 28.2 | |
| WiFi (h) | 5.6 |
Verdict
The Dell XPS 13 with Kaby Lake is an update of the existing Skylake version. The new WLAN module from Killer in particular can convince during our review with useful features and excellent performance figures. The Kaby Lake SoC inside our test model only manages a slightly higher performance compared for the previous Skylake model and falls behind the i5-7200U in the Acer notebook we reviewed. The GPU does not perform very well, either. Dell says their test models manage higher performance scores and wants to send us a replacement device. Replacing the vast amounts of thermal paste on our test model also resulted in a significant improvement of the temperatures, but the performance is still behind expectations for the i5-7200U. We will have to wait and see whether the small cooler can handle the full performance of the CPU in the replacement device.
Another big point of criticism for the XPS 13 series is the almost notorious coil whining. We can also hear it from our test model, but only in quiet environments. It sounds a bit like a mechanical hard drive. The emissions are otherwise actually pretty good when you consider the small chassis.
It is hard to get proper measurements and analyze the 3K touchscreen because of the CABC (dynamic brightness control). Subjectively, we like it a lot except for the heavy reflections, which can be particularly annoying in bright environments (also indoors). According to our measurements of the previous model, there should not be big changes in this section.
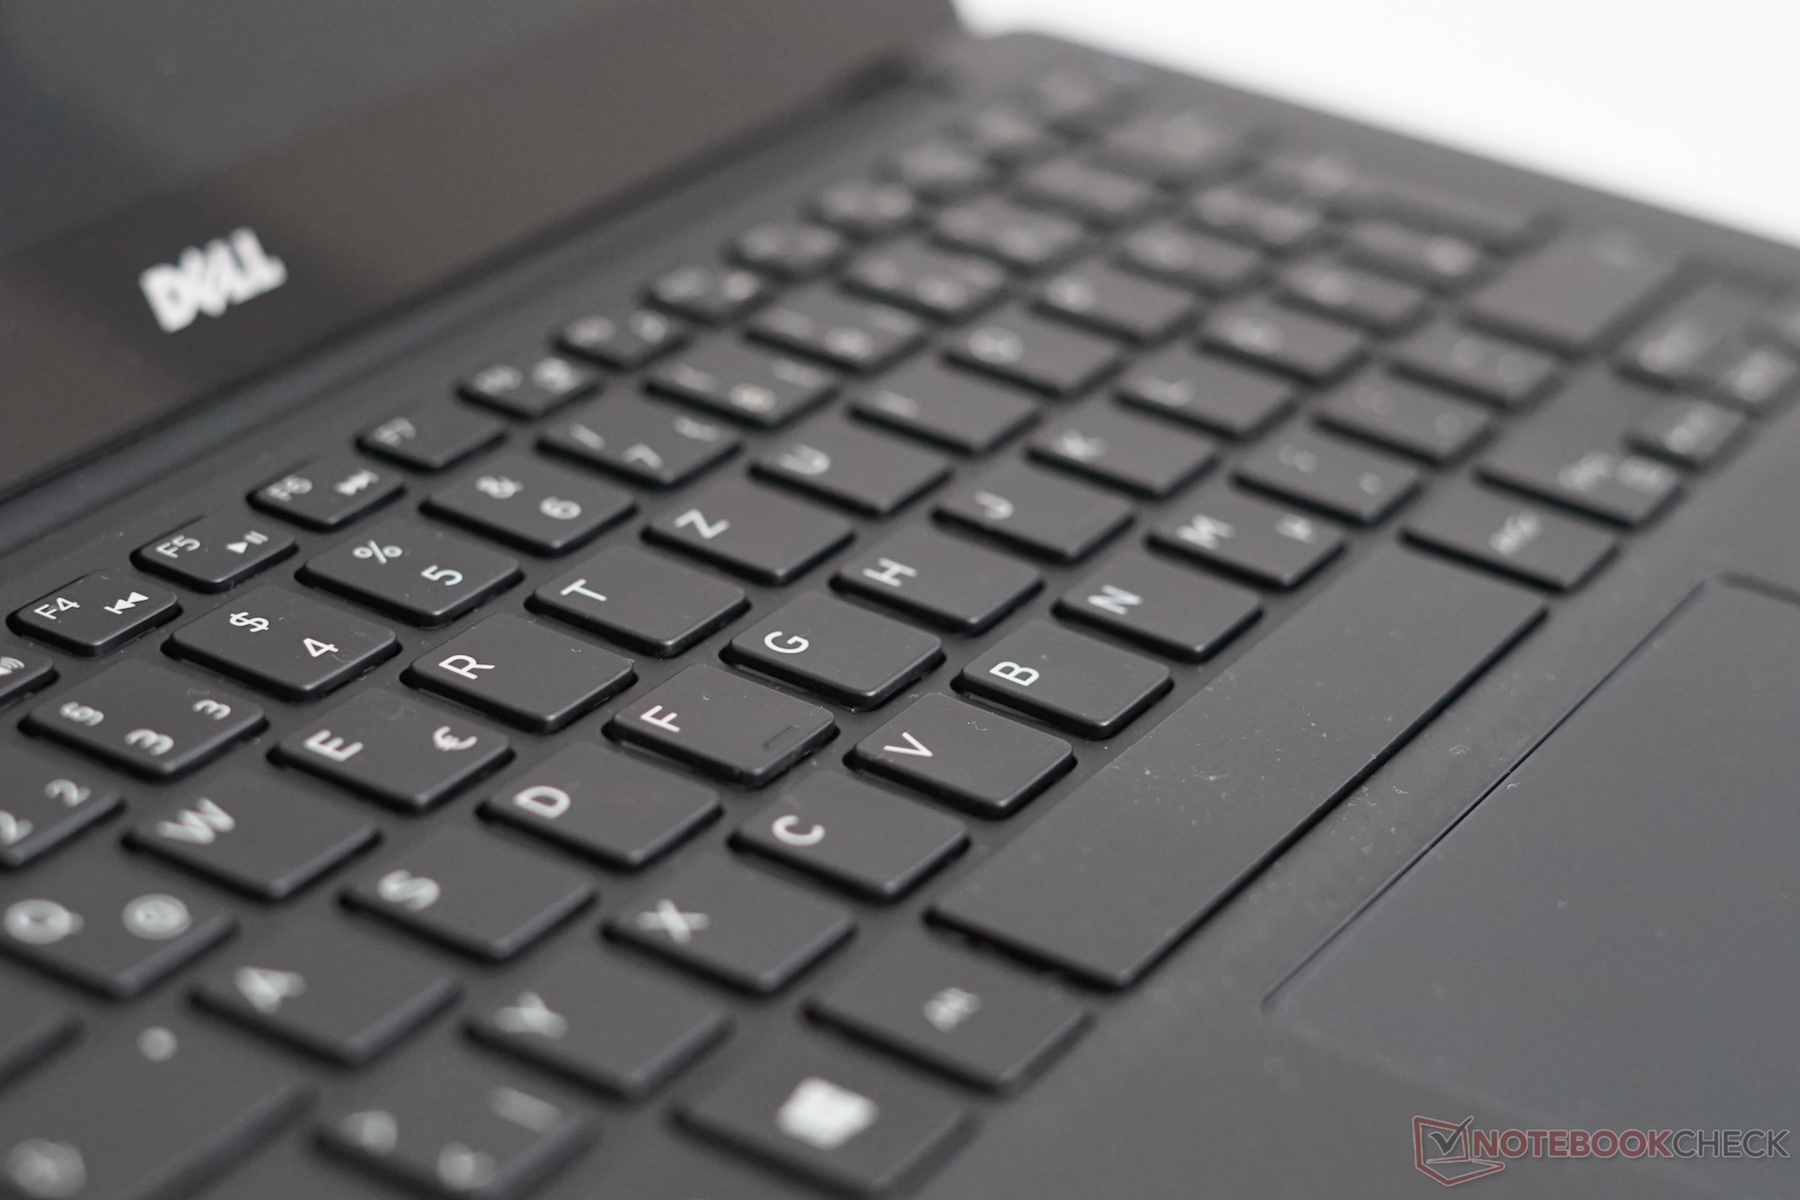
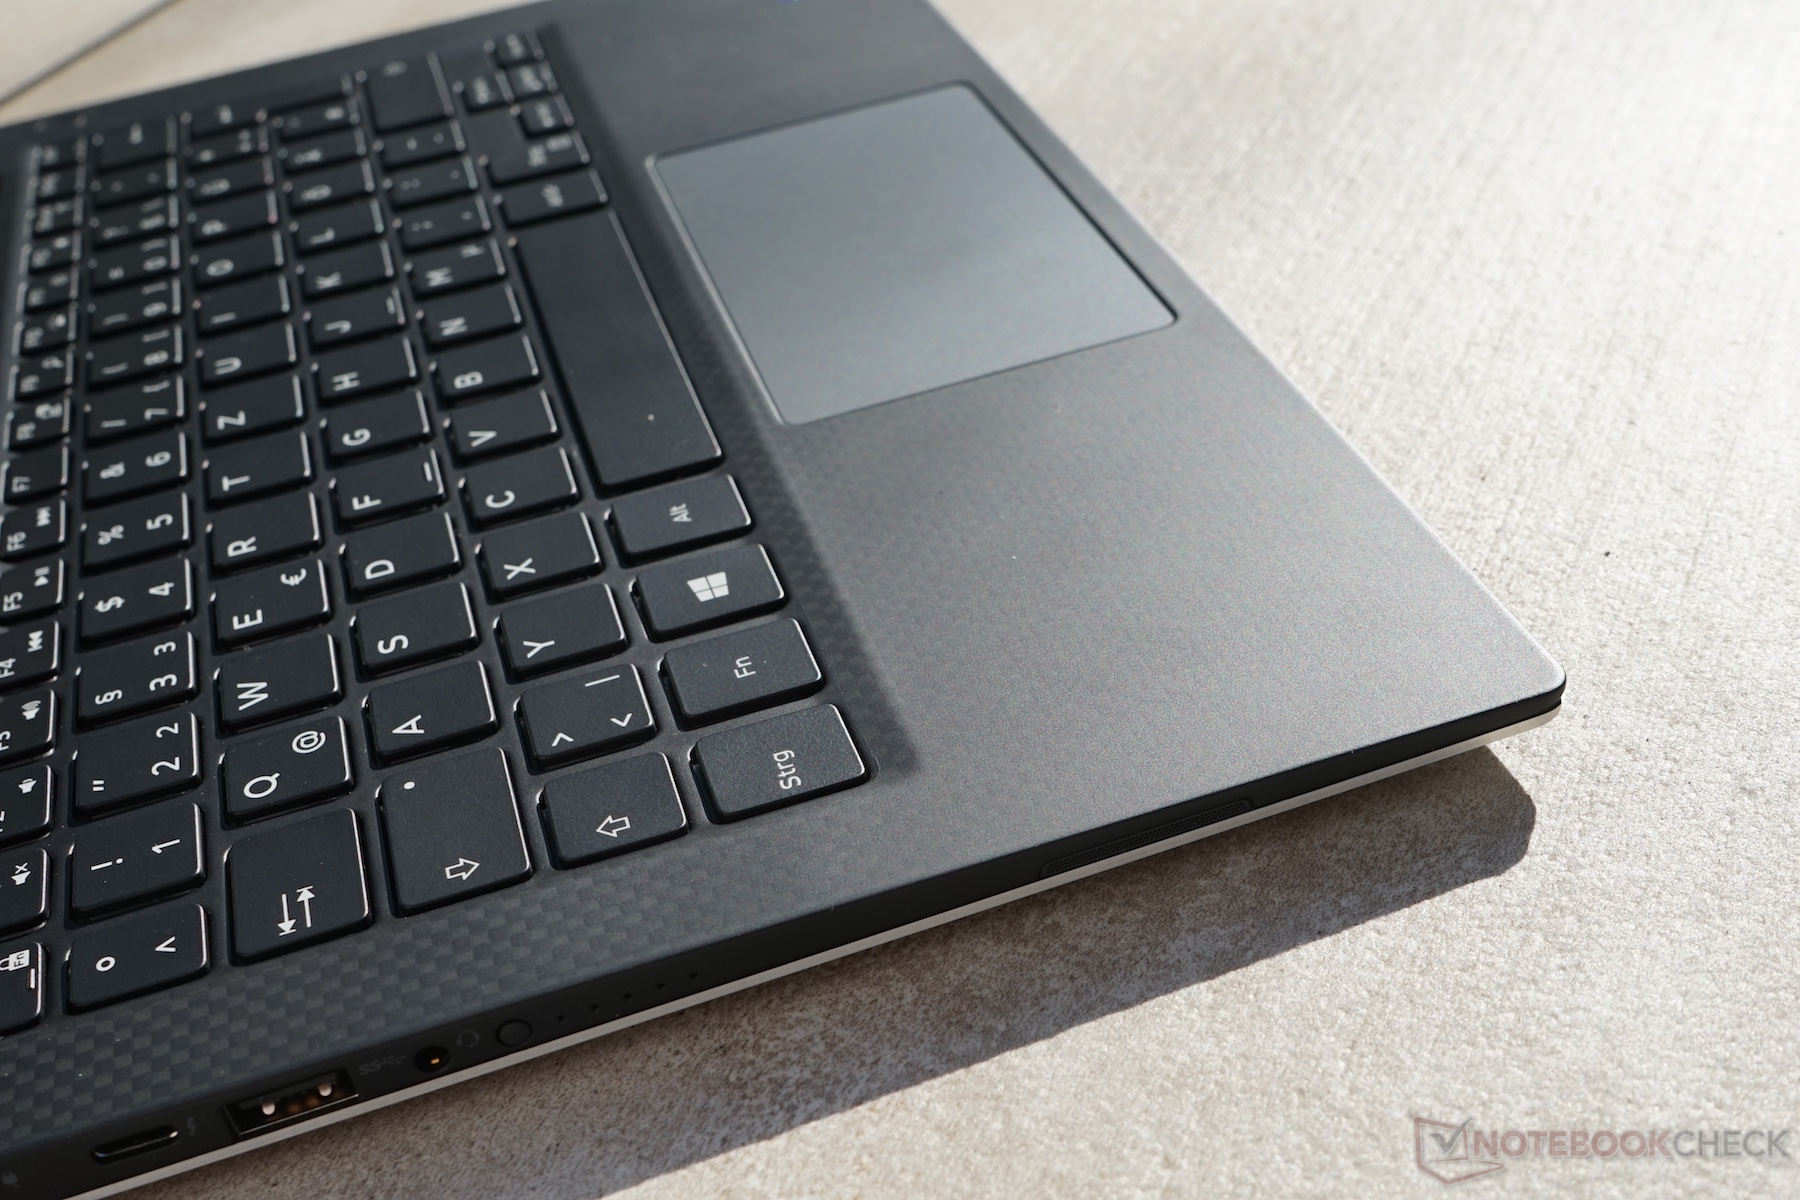
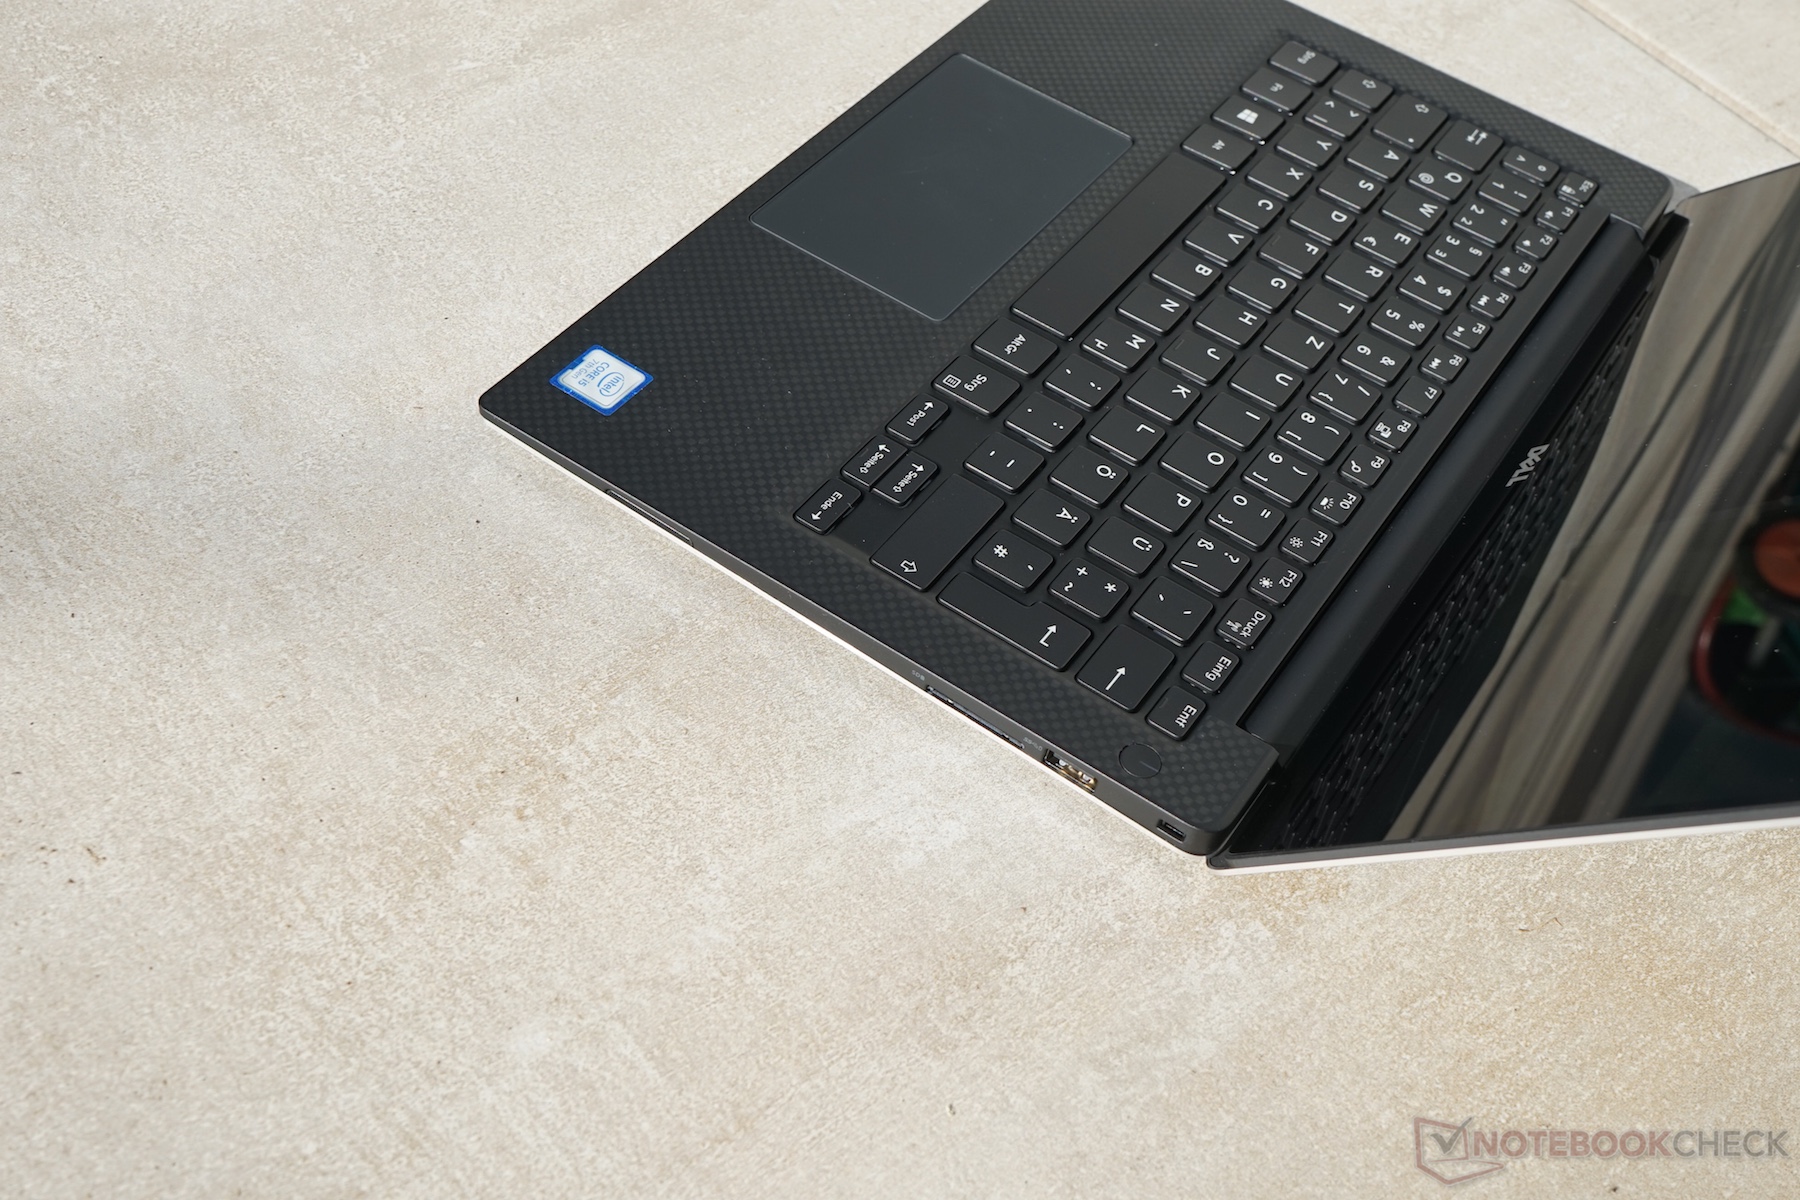
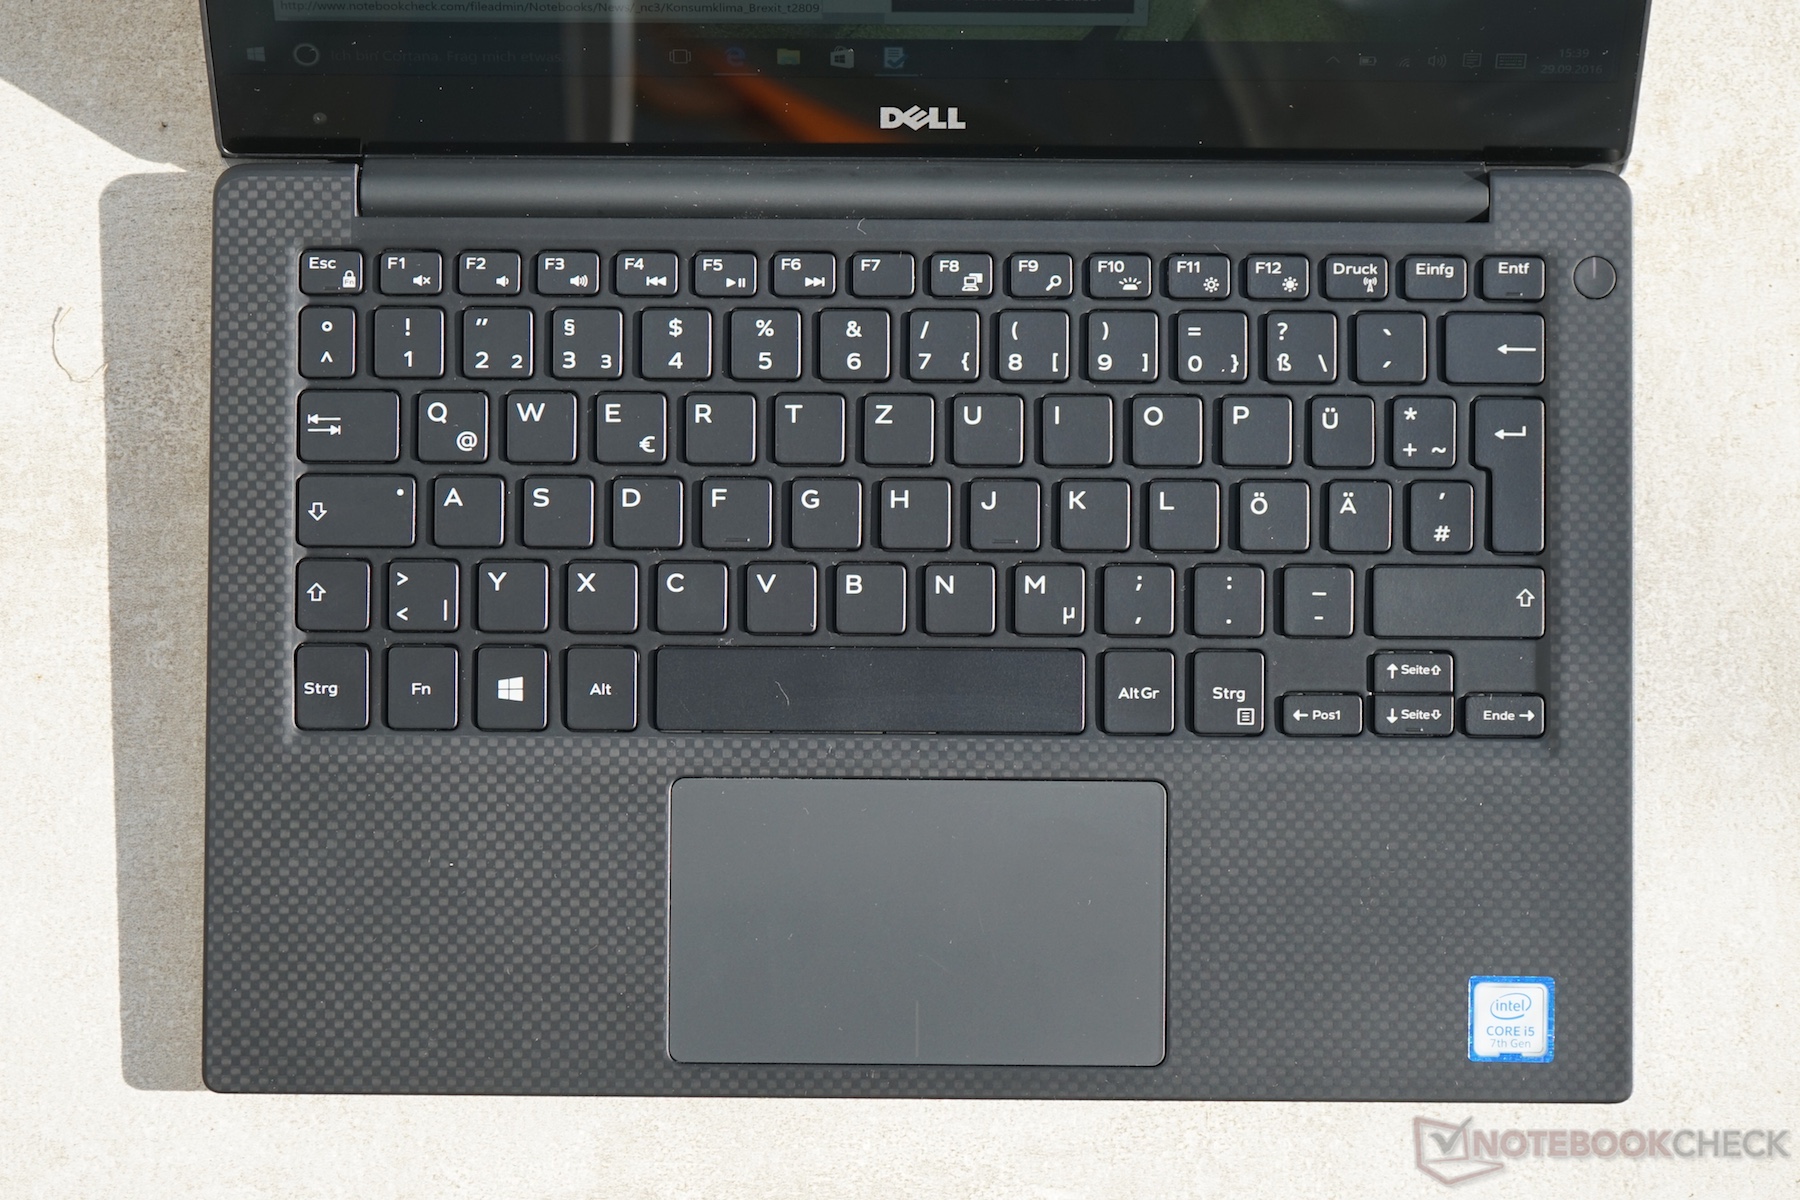
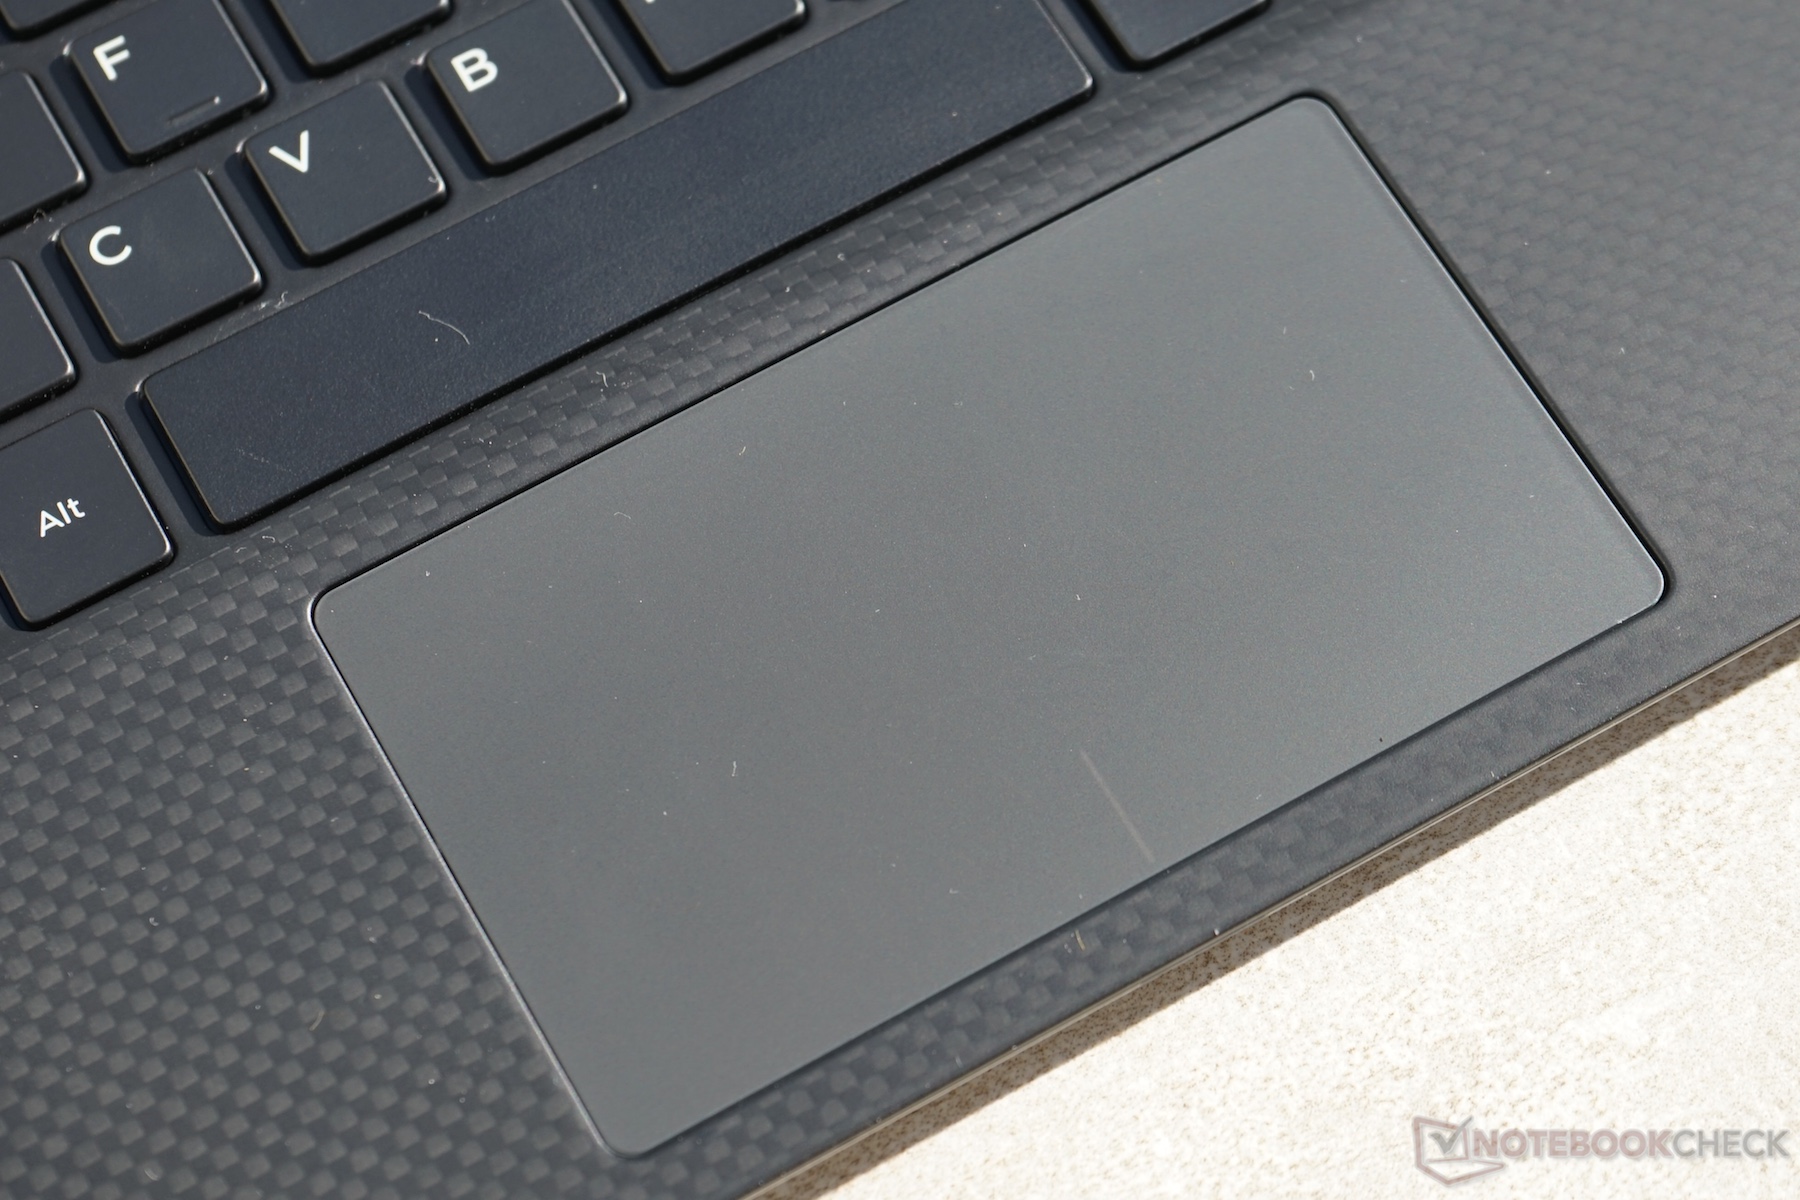
Keyboard and touchpad are among the better models in the Windows world and in combination with the very good battery runtimes, the XPS 13 is still a very interesting business notebook.
(December 2016 update: Our replacement Core i5-7200U FHD SKU is 6 percent ahead of our i5-7200U QHD SKU in both single- and multi-threaded CineBench R15 tests. Core temperature on our replacement model is slightly cooler under Prime95 load at 85 C and at a constant 3.0 GHz compared to 2.8 GHz on our i5-7200U QHD SKU.)
Price comparison
