Kaby Lake (Core i7-7500U) Review: Skylake on Steroids
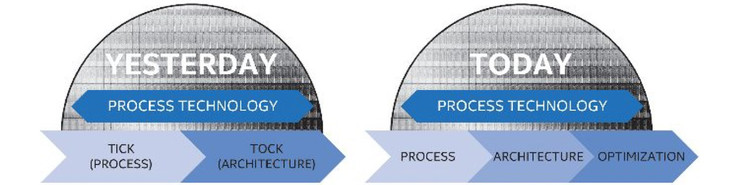
Intel's CPU development follows the so called Tick-Tock model since the last P4 generation. Every year, we would see either a smaller manufacturing process (Tick) or a new micro architecture (Tock). This concept worked very well for many years – the CPU giant was able to increase the gap to the rivals with often small, but steady performance and efficiency increases.
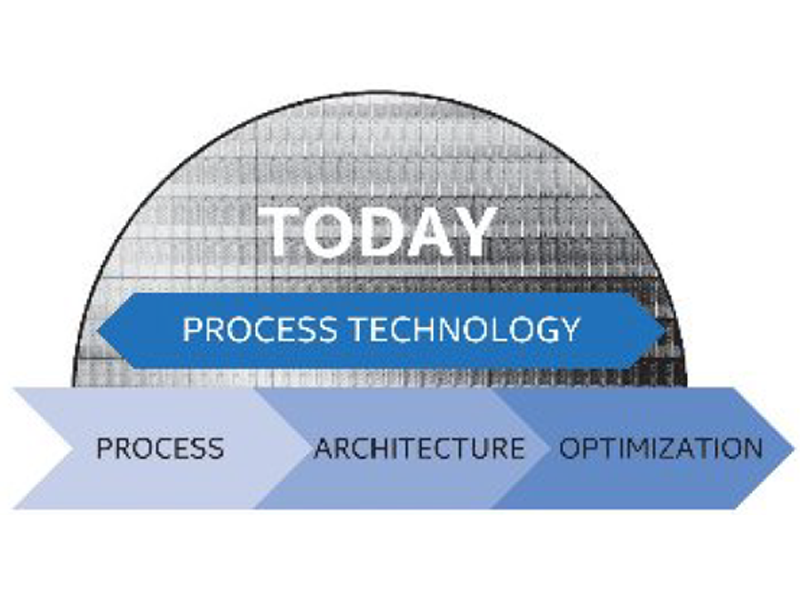
Due to the increasing complexity and costs of a new manufacturing process, Intel now has to change the plan: Instead of two, there will be three CPU designs with the same process from now on – Tick-Tock becomes "Process -> Architecture -> Optimization". Looking at the current 14 nm generation, Broadwell and Skylake represent the first two steps, while the new Kaby Lake platform is the culmination of the series.
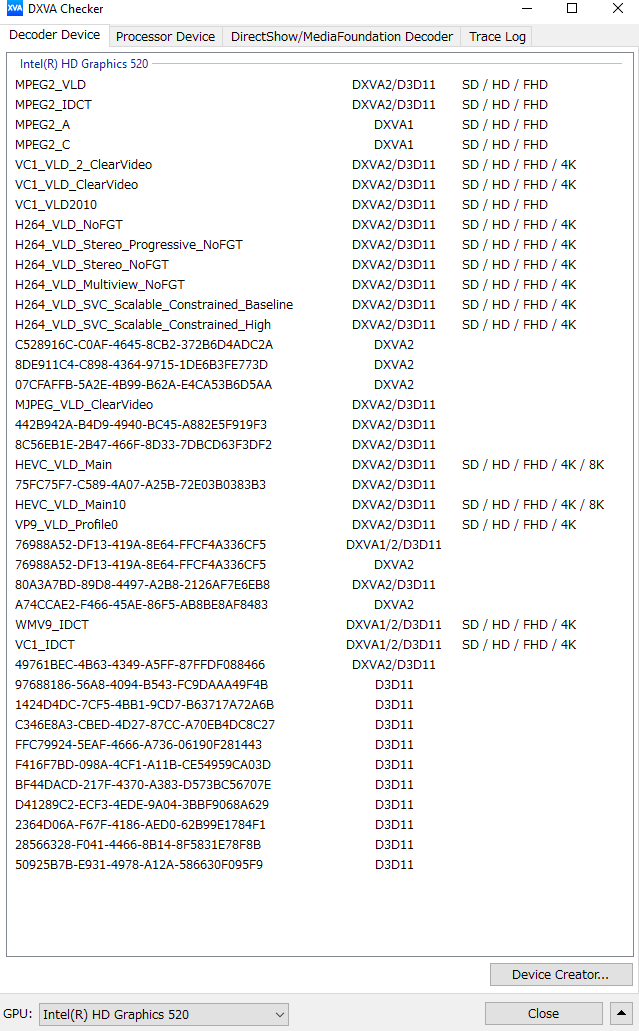
But what can Kaby Lake offer compared to the predecessors? For quite a while, it is the first time that both the CPU and GPU design are basically unchanged, so we do not expect increased per-MHz performance. The manufacturer still promises noticeably more performance as a result of higher clocks or better Turbo Boost utilization at the same consumption, respectively. Only the video unit was redesigned, and it now supports the codecs VP9 as well as HEVC-Main10 with a 10-bit color depth and it is also supposed to be even more efficient. We also get HDMI 2.0 with HDCP 2.2 support for the first time, but these features will be reserved for the new chip revision we will see at the end of the year. The first batches are still limited to HDCP 1.4 and can therefore not output Netflix in 4K, for example.
SKUs
Even though there are already some unofficial details about the upcoming quad-cores, Intel only announced 6 ULV models from the U- (15 Watts) and Y-series (4.5 Watts) today. New: Only the Core m3-7Y30 is officially called Core "m", while the two faster models 7Y54 and 7Y75 are now listed as i5 and i7 chips, respectively – not really a customer-friendly decision since the TDP rating is important for the performance of the processor. This means a Core i3 with a 15-Watt TDP can actually be faster than a Core i7 rated at 4.5 Watts.
| SKU | Cores/Threads | Base clock | Turbo 1C/2C | GPU | TDP |
|---|---|---|---|---|---|
| Kaby Lake | |||||
| i7-7500U | 2/4 | 2.7 GHz | 3.5/3.5 GHz | HD Graphics 620 (300 - 1050 MHz) | 15 Watts |
| i5-7200U | 2/4 | 2.5 GHz | 3.1/3.1(?) GHz | HD Graphics 620 (300 - 1000 MHz) | 15 Watts |
| i3-7100U | 2/4 | 2.4 GHz | – | HD Graphics 620 (300 - 1000 MHz) | 15 Watts |
| i7-7Y75 | 2/4 | 1.3 GHz | 3.6/? GHz | HD Graphics 615 (300 - 1050 MHz) | 4.5 Watts |
| i5-7Y54 | 2/4 | 1.2 GHz | 3.2/? GHz | HD Graphics 615 (300 - 950 MHz) | 4.5 Watts |
| m3-7Y30 | 2/4 | 1.0 GHz | 2.6/? GHz | HD Graphics 615 (300 - 900 MHz) | 4.5 Watts |
| Skylake | |||||
| i7-6500U | 2/4 | 2.5 GHz | 3.1/3.0 GHz | HD Graphics 520 (300 - 1050 MHz) | 15 Watts |
| i5-6200U | 2/4 | 2.3 GHz | 2.8/2.7 GHz | HD Graphics 520 (300 - 1000 MHz) | 15 Watts |
| i3-6100U | 2/4 | 2.3 GHz | – | HD Graphics 520 (300 - 1000 MHz) | 15 Watts |
| m7-6Y75 | 2/4 | 1.2 GHz | 3.1/2.9 GHz | HD Graphics 515 (300 - 1000 MHz) | 4.5 Watts |
| m5-6Y54 | 2/4 | 1.1 GHz | 2.7/2.4 GHz | HD Graphics 515 (300 - 900 MHz) | 4.5 Watts |
| m3-6Y30 | 2/4 | 0.9 GHz | 2.2/2.0 GHz | HD Graphics 515 (300 - 850 MHz) | 4.5 Watts |
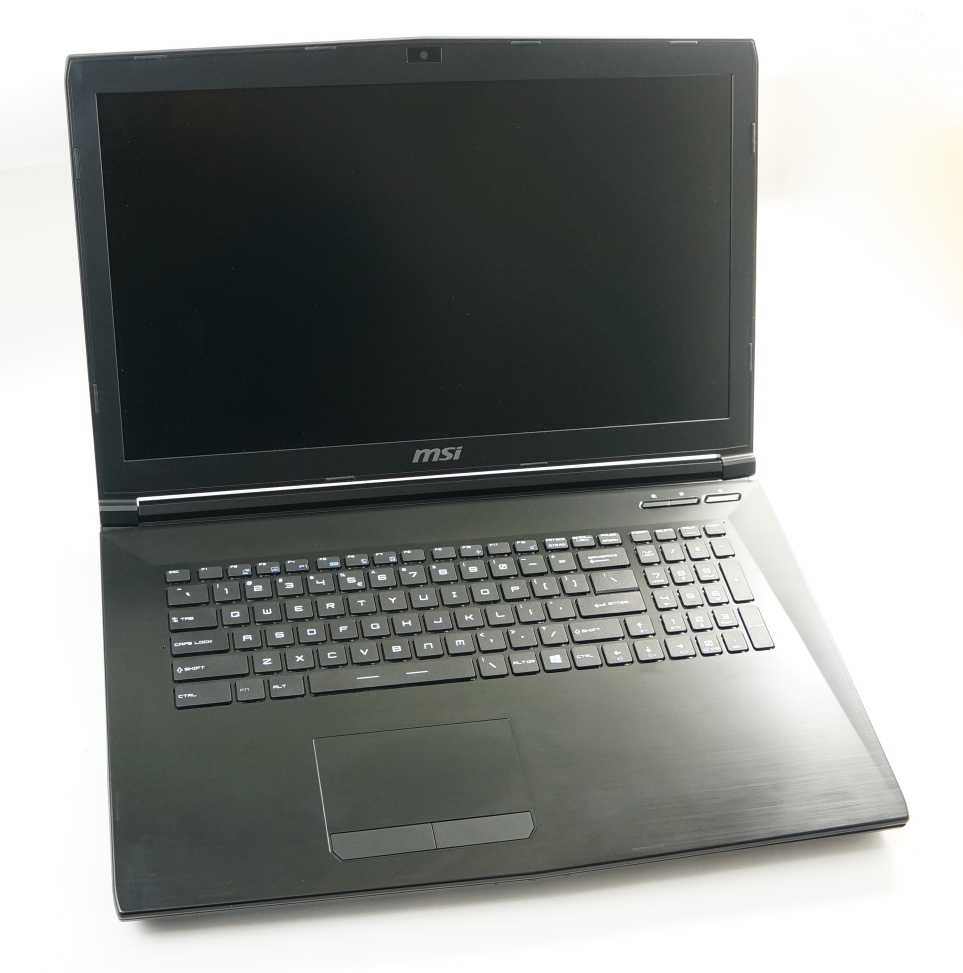
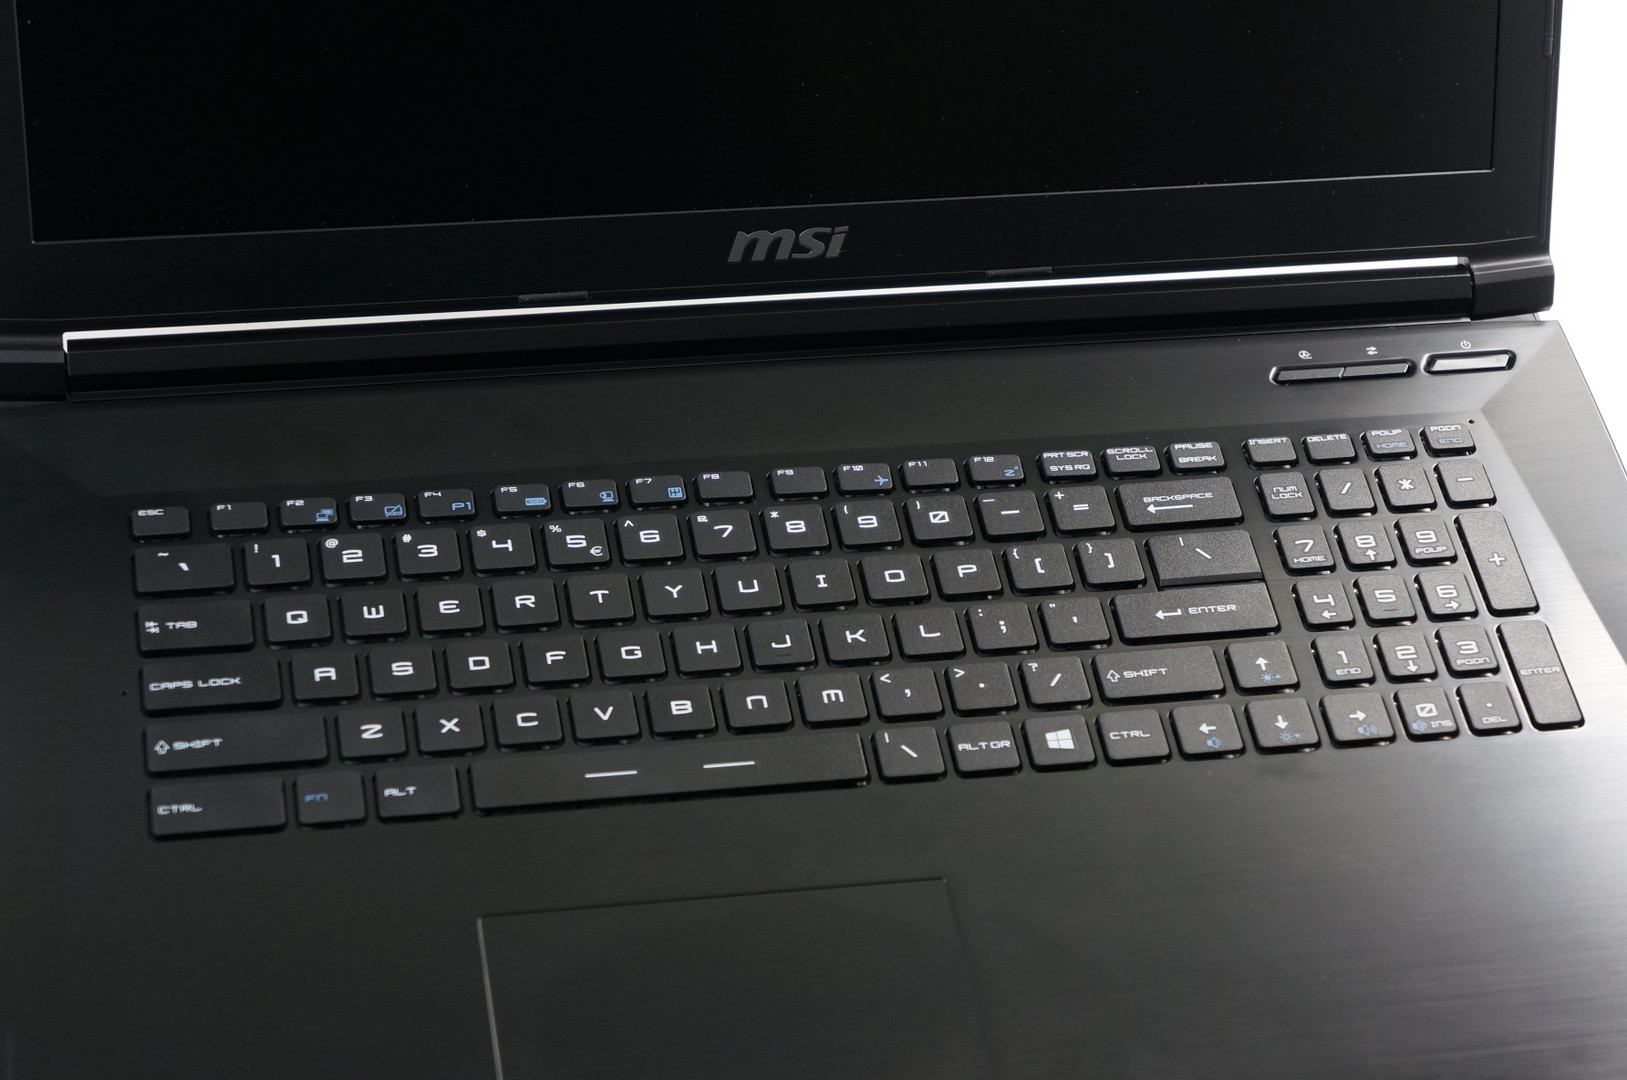
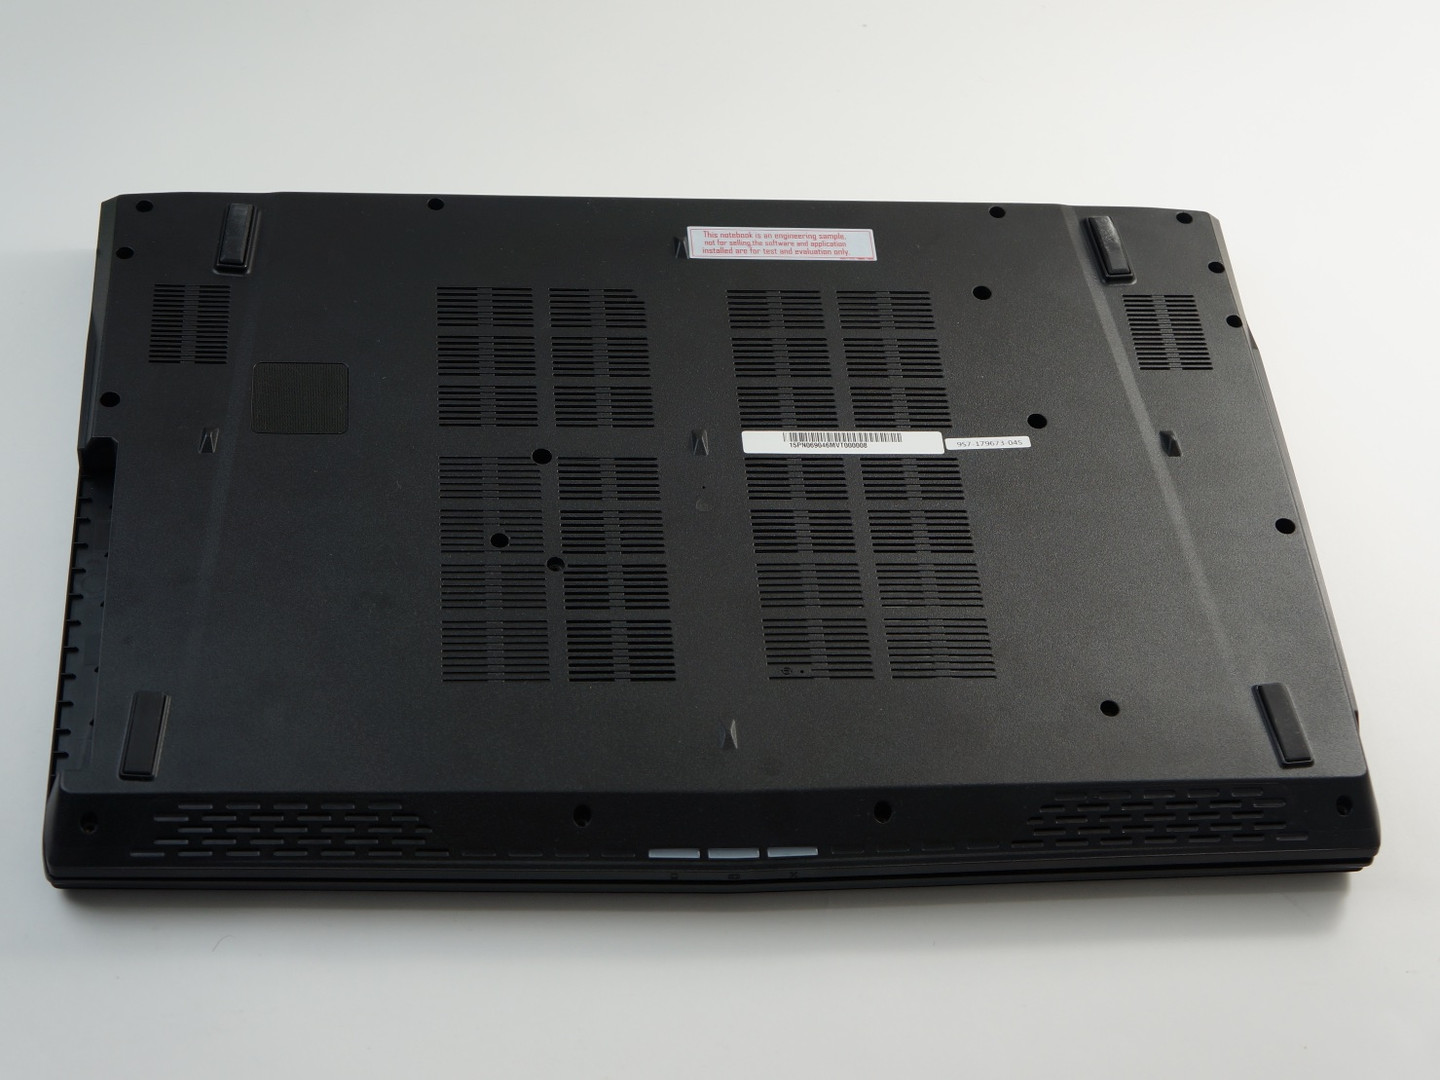
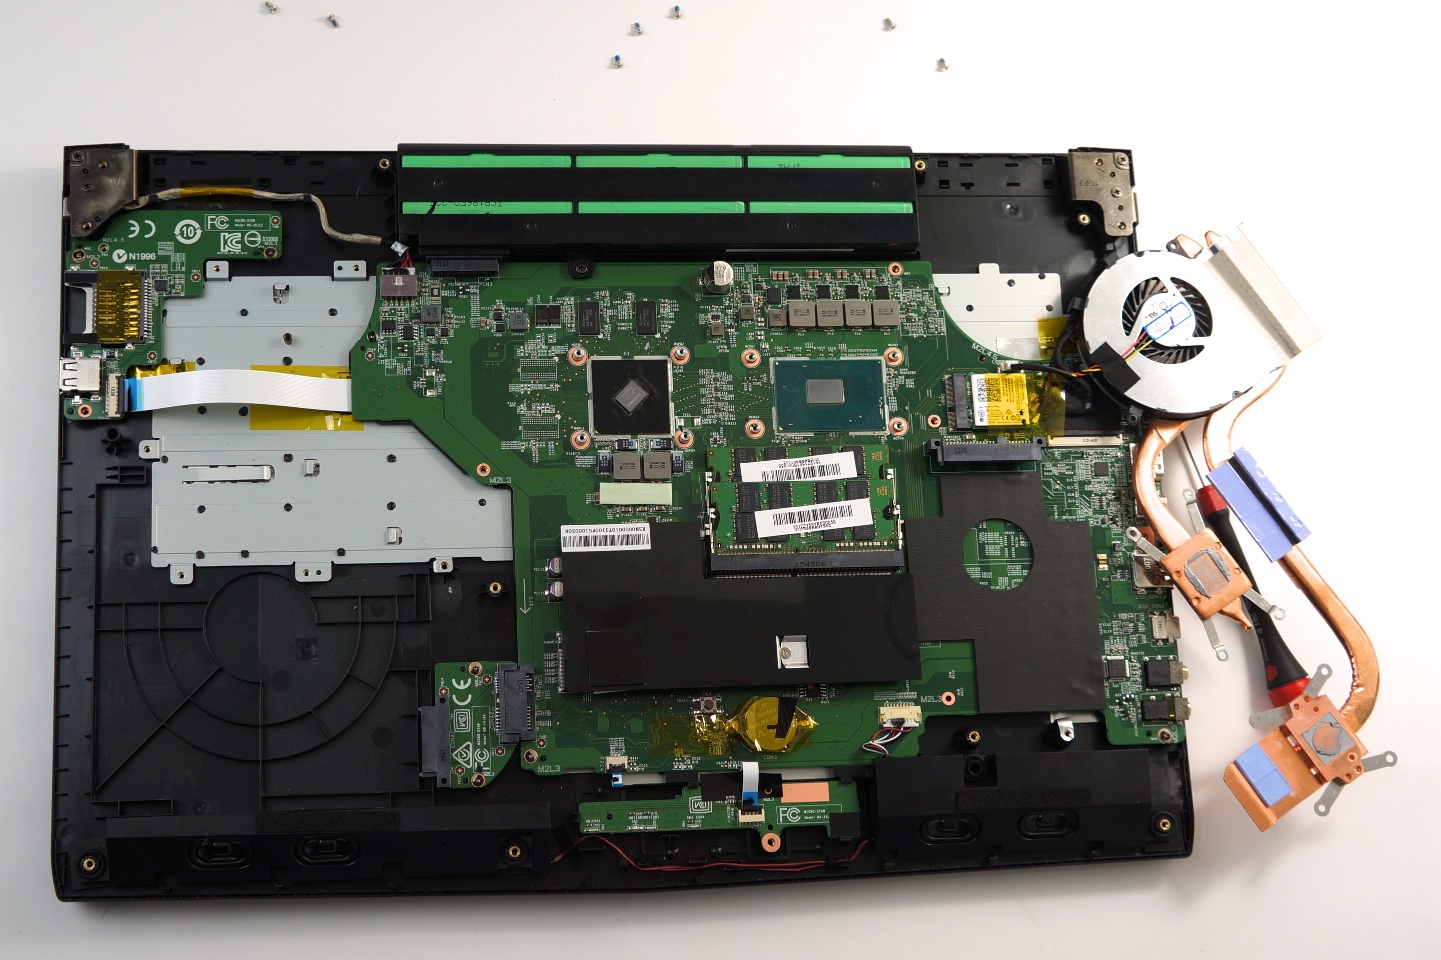
The Test Model
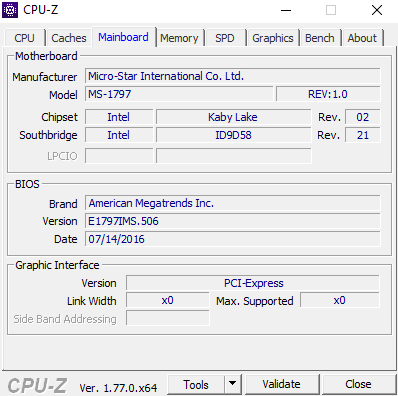
We want to thank MSI for the supply of the test model, the new CX72-7QL. The bulky 17-inch system is a slightly slimmed-down version of the GE72 and we already know it from the review of the Nvidia GeForce 940MX. The following chassis pictures were taken from this article. The notebook is equipped with the following components:
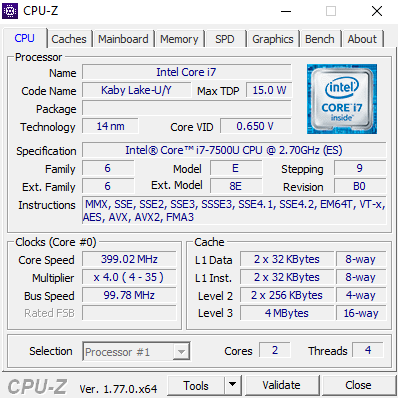
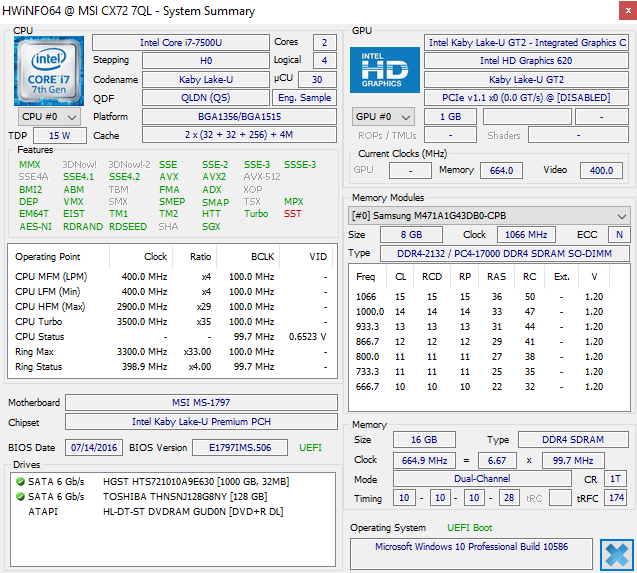
- Intel Core i7-7500U (Kaby Lake)
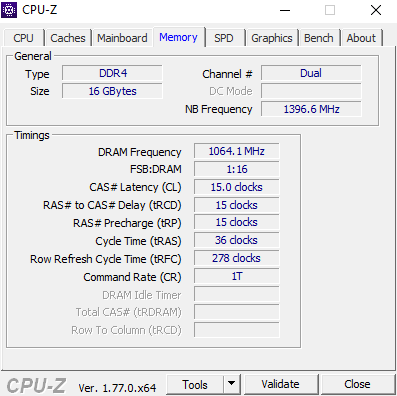
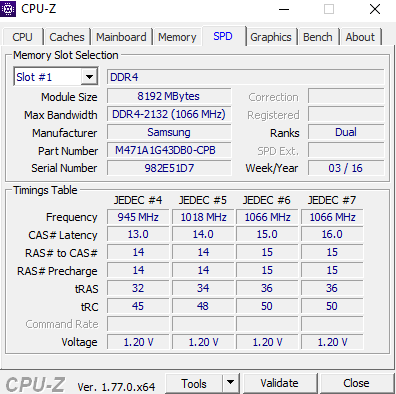
- 2x 8 GB DDR4-2133
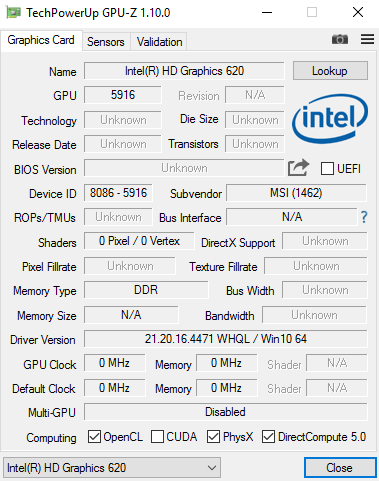
- HD Graphics 620 + GeForce 940MX (deactivated), driver 21.20.1.4471
- 128 GB SSD (Toshiba HG6z M.2) + 1 TB HDD (HGST Travelstar 7K1000)
- 17.3-inch Full-HD Display (1920 x 1080 pixels), TN panel, matte
- Windows 10 Pro 64-bit
Benchmarks
CPU Performance
Compared to the direct predecessor Core i7-6500U (2.5 GHz base, 3.1 GHz for one core, 3.0 GHz for two cores), the clocks of the Core i7-7500U (2.7 GHz base, 3.5 GHz for one core, 3.5 GHz for two cores) were increased by around 10-15 percent and therefore even surpass the Skylake top model Core i7-6600U (2.6 GHz base, 3.4 GHz for one core, 3.2 GHz for two cores).
As always, the maximum clocks are just one aspect – the processor can only maintain the specified maximum values if it does not surpass the TDP. Looking at the Core i7-7500U, this is only the case for single-threading applications, where we can see the maximum 3.5 GHz all the time. The clocks will drop from initial 3.5 GHz to 3.2-3.3 GHz after 30 seconds in multi-core scenarios. All in all, we get a respectable 15 percent advantage over a Core i7-6500U in both scenarios. Even a Core i7-6600U with an increased TDP limit of 25 Watts (ThinkPad T460s) cannot keep up with the new CPU.
Update 09/12/2016: The less powerful Core i5-7200U (2.5 GHz base clock, 3.1 GHz Turbo for one and two cores) also leaves a great impression in our benchmarks. The performance is just above the previous high-end model Core i7-6500U and only a bit slower than the i7-6600U. The maximum Turbo Boost is maintained in all single and multi-core benchmarks.
Our test sample of the i5-7200U seems to be a pretty bad example, because the chip already consumed around 16 Watts at 3.1 GHz in Cinebench R15 Multi. In theory, the CPU should have to throttle its clock by around 100 MHz, but this does not happen since Acer increased the TDP limit to 25 Watts for the test model E15 E5-575G-549D (review will follow soon). Without this, the performance would probably be 2-3 % lower.
| WinRAR - Result | |
| Intel Core i7-6700HQ | |
| Intel Core i7-7500U | |
| Intel Core i5-6300HQ | |
| Intel Core i7-6600U | |
| Intel Core i5-7200U | |
| Intel Core i7-6500U | |
| Intel Core i5-6200U | |
| Super Pi Mod 1.5 XS 32M - 32M | |
| Intel Core i5-6300U | |
| Intel Core i7-6500U | |
| Intel Core i5-7200U | |
| Intel Core i5-6300HQ | |
| Intel Core i7-6700HQ | |
| Intel Core i7-6600U | |
| Intel Core i7-7500U | |
| 3DMark 06 - CPU - CPU Score | |
| Intel Core i7-6700HQ | |
| Intel Core i5-6300HQ | |
| Intel Core i7-7500U | |
| Intel Core i7-6600U | |
| Intel Core i7-6500U | |
| Intel Core i5-7200U | |
| Intel Core i5-6300U | |
| Intel Core i5-6200U | |
| Geekbench 3 | |
| 32 Bit Single-Core Score | |
| Intel Core i7-7500U | |
| Intel Core i7-6600U | |
| Intel Core i5-6300HQ | |
| Intel Core i7-6700HQ | |
| Intel Core i5-7200U | |
| Intel Core i7-6500U | |
| 32 Bit Multi-Core Score | |
| Intel Core i7-6700HQ | |
| Intel Core i5-6300HQ | |
| Intel Core i7-7500U | |
| Intel Core i7-6600U | |
| Intel Core i5-7200U | |
| Intel Core i7-6500U | |
| Mozilla Kraken 1.1 - Total | |
| Intel Core i5-6200U | |
| Intel Core i5-7200U | |
| Intel Core i5-6300HQ | |
| Intel Core i7-6500U | |
| Intel Core i7-6600U | |
| Intel Core i7-6700HQ | |
| Intel Core i7-7500U | |
| Octane V2 - Total Score | |
| Intel Core i7-6700HQ | |
| Intel Core i7-7500U | |
| Intel Core i7-6600U | |
| Intel Core i5-7200U | |
| Intel Core i5-6300HQ | |
| Intel Core i7-6500U | |
| Intel Core i5-6200U | |
* ... smaller is better
Performance consistency under sustained CPU load
We want to have a closer look at the Turbo Boost behavior as well as the according power consumption compared to the Skylake generation. Even though the single-thread performance is about 3 percent higher compared to the Core i7-6600U, the Kaby Lake chip is almost 20 % more frugal (CPU Package Power).
Cinebench R15 shows similar efficiency improvements between 15-25 percent in the multi-thread benchmark. As mentioned above, the Core i7-7500U cannot maintain its maximum clock with a TDP limit of 15 Watts, but 3.3-3.2 GHz are still much higher than a comparable Skylake model, which would hit the 15-Watt limit at 2.8 GHz. The listed Core i7-6600U inside the ThinkPad T460s can only maintain 3.2 GHz thanks to an increased TDP limit, but also consumes much more power.
| Start | after 30 seconds | after 5 minutes | |
|---|---|---|---|
Core i7-7500U |
|||
Cinebench R15 (Single) |
3.5 GHz (9.5 Watts) | 3.5 GHz (9.5 Watts) | 3.5 GHz (9.5 Watts) |
Cinebench R15 (Multi) |
3.5 GHz (18.2 Watts) | 3.2 - 3.3 GHz (14.9 Watts) | 3.2 - 3.3 GHz (14.9 Watts) |
Prime95 |
3.5 GHz (20.6 Watts) | 3.0 - 3.1 GHz (14.9 Watts) | 3.0 - 3.1 GHz (14.9 Watts) |
Core i7-6600U (25 Watts) |
|||
Cinebench R15 (Single) |
3.4 GHz (11.8 Watts) | 3.4 GHz (11.8 Watts) | 3.4 GHz (11.8 Watts) |
Cinebench R15 (Multi) |
3.2 GHz (19.3 Watts) | 3.2 GHz (19.3 Watts) | 3.2 GHz (19.3 Watts) |
Prime95 |
3.2 GHz (21.7 Watts) | 3.2 GHz (21.7 Watts) | 3.2 GHz (21.7 Watts) |
GPU Performance
The MSI CX72-7QL is equipped with 16 GB of the fast DDR4-2133 memory in a dual-channel configuration, which is a great way to utilize the maximum performance of the HD Graphics 620. Even though the HD Graphics 520 successor is still equipped with just 24 Execution units (EUs) and the clocks did not change, either (i7-6500U/i7-7500U: up to 1050 MHz), Intel was able to improve the performance considerably: The gaming performance is 20-30 percent higher on average, so the performance gains are even higher than the synthetic benchmarks indicated. One reason for the comparatively good results is once again the excellent Turbo Boost utilization: Depending on the game, the GPU runs at core clocks between 1000-1050 MHz.
All in all, the HD Graphics 620 is roughly on par with a dedicated Nvidia GeForce 920M or AMD Radeon R7 M440. Upcoming Kaby Lake chips with the more powerful Iris Graphics GPU (GT3e, 48 EUs, eDRAM) should even beat the GeForce 940M(X).
| Sims 4 | |
| 1024x768 Low Preset | |
| HD Graphics 620 (i7-7500U; Dual-Channel) | |
| HD Graphics 520 (i7-6600U; Dual-Channel) | |
| HD Graphics 520 (i5-6200U; Dual-Channel) | |
| HD Graphics 520 (i5-6200U; Single-Channel) | |
| 1366x768 Medium Preset | |
| HD Graphics 620 (i7-7500U; Dual-Channel) | |
| HD Graphics 520 (i5-6200U; Dual-Channel) | |
| HD Graphics 520 (i7-6600U; Dual-Channel) | |
| HD Graphics 520 (i5-6200U; Single-Channel) | |
| 1920x1080 High Preset | |
| HD Graphics 620 (i7-7500U; Dual-Channel) | |
| HD Graphics 520 (i5-6200U; Dual-Channel) | |
| HD Graphics 520 (i7-6600U; Dual-Channel) | |
| HD Graphics 520 (i5-6200U; Single-Channel) | |
| Diablo III | |
| 1024x768 Low / off | |
| HD Graphics 620 (i7-7500U; Dual-Channel) | |
| HD Graphics 520 (i5-6200U; Dual-Channel) | |
| HD Graphics 520 (i5-6200U; Single-Channel) | |
| 1366x768 Medium / low | |
| HD Graphics 620 (i7-7500U; Dual-Channel) | |
| HD Graphics 520 (i5-6200U; Dual-Channel) | |
| HD Graphics 520 (i5-6200U; Single-Channel) | |
| 1366x768 High AA:on | |
| HD Graphics 620 (i7-7500U; Dual-Channel) | |
| HD Graphics 520 (i5-6200U; Dual-Channel) | |
| HD Graphics 520 (i5-6200U; Single-Channel) | |
| Dirt Rally | |
| 1024x768 Ultra Low Preset | |
| Iris Graphics 540 (i5-6260U; Dual-Channel) | |
| HD Graphics 620 (i7-7500U; Dual-Channel) | |
| Iris Graphics 540 (i7-6560U; Dual-Channel) | |
| HD Graphics 520 (i5-6200U; Dual-Channel) | |
| HD Graphics 520 (i5-6200U; Single-Channel) | |
| 1366x768 Medium Preset | |
| Iris Graphics 540 (i5-6260U; Dual-Channel) | |
| HD Graphics 620 (i7-7500U; Dual-Channel) | |
| Iris Graphics 540 (i7-6560U; Dual-Channel) | |
| HD Graphics 520 (i5-6200U; Dual-Channel) | |
| HD Graphics 520 (i5-6200U; Single-Channel) | |
| 1920x1080 High Preset | |
| Iris Graphics 540 (i5-6260U; Dual-Channel) | |
| HD Graphics 620 (i7-7500U; Dual-Channel) | |
| Iris Graphics 540 (i7-6560U; Dual-Channel) | |
| HD Graphics 520 (i5-6200U; Single-Channel) | |
| HD Graphics 520 (i5-6200U; Dual-Channel) | |
| The Witcher 3 | |
| 1024x768 Low Graphics & Postprocessing | |
| Iris Graphics 540 (i5-6260U; Dual-Channel) | |
| Iris Graphics 540 (i7-6560U; Dual-Channel) | |
| HD Graphics 620 (i7-7500U; Dual-Channel) | |
| HD Graphics 520 (i5-6200U; Dual-Channel) | |
| 1366x768 Medium Graphics & Postprocessing | |
| Iris Graphics 540 (i5-6260U; Dual-Channel) | |
| Iris Graphics 540 (i7-6560U; Dual-Channel) | |
| HD Graphics 620 (i7-7500U; Dual-Channel) | |
| HD Graphics 520 (i5-6200U; Dual-Channel) | |
| 1920x1080 High Graphics & Postprocessing (Nvidia HairWorks Off) | |
| Iris Graphics 540 (i7-6560U; Dual-Channel) | |
| World of Warships | |
| 1366x768 Low Preset AF:Trilinear | |
| Iris Graphics 540 (i5-6260U; Dual-Channel) | |
| HD Graphics 620 (i7-7500U; Dual-Channel) | |
| HD Graphics 520 (i5-6200U; Dual-Channel) | |
| HD Graphics 520 (i5-6200U; Single-Channel) | |
| 1366x768 Medium Preset AF:Trilinear | |
| Iris Graphics 540 (i5-6260U; Dual-Channel) | |
| HD Graphics 620 (i7-7500U; Dual-Channel) | |
| HD Graphics 520 (i5-6200U; Dual-Channel) | |
| HD Graphics 520 (i5-6200U; Single-Channel) | |
| 1920x1080 High Preset AF:8x | |
| Iris Graphics 540 (i5-6260U; Dual-Channel) | |
| HD Graphics 620 (i7-7500U; Dual-Channel) | |
| HD Graphics 520 (i5-6200U; Dual-Channel) | |
| HD Graphics 520 (i5-6200U; Single-Channel) | |
| Star Wars Battlefront | |
| 1024x768 Low Preset | |
| HD Graphics 620 (i7-7500U; Dual-Channel) | |
| Iris Graphics 540 (i7-6560U; Dual-Channel) | |
| HD Graphics 520 (i7-6600U; Single-Channel) | |
| 1366x768 Medium Preset AA:FX | |
| Iris Graphics 540 (i7-6560U; Dual-Channel) | |
| HD Graphics 620 (i7-7500U; Dual-Channel) | |
| HD Graphics 520 (i7-6600U; Single-Channel) | |
| 1920x1080 High Preset AA:FX | |
| HD Graphics 620 (i7-7500U; Dual-Channel) | |
| Iris Graphics 540 (i7-6560U; Dual-Channel) | |
| Just Cause 3 | |
| 1024x768 Low / Off AF:2x | |
| Iris Graphics 540 (i5-6260U; Dual-Channel) | |
| HD Graphics 620 (i7-7500U; Dual-Channel) | |
| HD Graphics 520 (i7-6500U; Dual-Channel) | |
| 1366x768 Medium / Off AF:4x | |
| Iris Graphics 540 (i5-6260U; Dual-Channel) | |
| HD Graphics 620 (i7-7500U; Dual-Channel) | |
| HD Graphics 520 (i7-6500U; Dual-Channel) | |
| 1920x1080 High / On AA:FX AF:8x | |
| Iris Graphics 540 (i5-6260U; Dual-Channel) | |
| HD Graphics 620 (i7-7500U; Dual-Channel) | |
| HD Graphics 520 (i7-6500U; Dual-Channel) | |
| low | med. | high | ultra | |
|---|---|---|---|---|
| Diablo III (2012) | 105.9 | 72.2 | 64.1 | 37.8 |
| Counter-Strike: GO (2012) | 166.3 | 112.8 | 70.5 | 42.7 |
| Crysis 3 (2013) | 38.2 | 23.1 | 14.7 | 5.4 |
| BioShock Infinite (2013) | 67.8 | 36.6 | 30.9 | 9.5 |
| Metro: Last Light (2013) | 35.2 | 28.6 | 17.5 | 8.2 |
| Battlefield 4 (2013) | 53.3 | 36.1 | 24.3 | 7.9 |
| Sims 4 (2014) | 186.8 | 63 | 29.5 | 21.8 |
| Dirt Rally (2015) | 139.9 | 35.5 | 15.5 | 12.5 |
| The Witcher 3 (2015) | 15.8 | 10.5 | ||
| World of Warships (2015) | 81.3 | 54.6 | 26 | 19.1 |
| FIFA 16 (2015) | 78.4 | 50.9 | 29.3 | |
| Star Wars Battlefront (2015) | 40.3 | 22.7 | 10.2 | |
| Assassin's Creed Syndicate (2015) | 5.4 | |||
| Rainbow Six Siege (2015) | 41.9 | 25.8 | 14.3 | 11.5 |
| Just Cause 3 (2015) | 29 | 22.2 | 10.8 | |
| Rise of the Tomb Raider (2016) | 18.9 | 12.1 | 6.6 | |
| XCOM 2 (2016) | 19.8 | 7.6 | 5.2 | |
| Far Cry Primal (2016) | 20 | 10 | 8 | |
| Hitman 2016 (2016) | 14.5 | 19.7 | 11.7 | |
| Overwatch (2016) | 55.9 | 40.2 | 17.8 | |
| Mirror's Edge Catalyst (2016) | 28.8 | 17 | 7.1 |
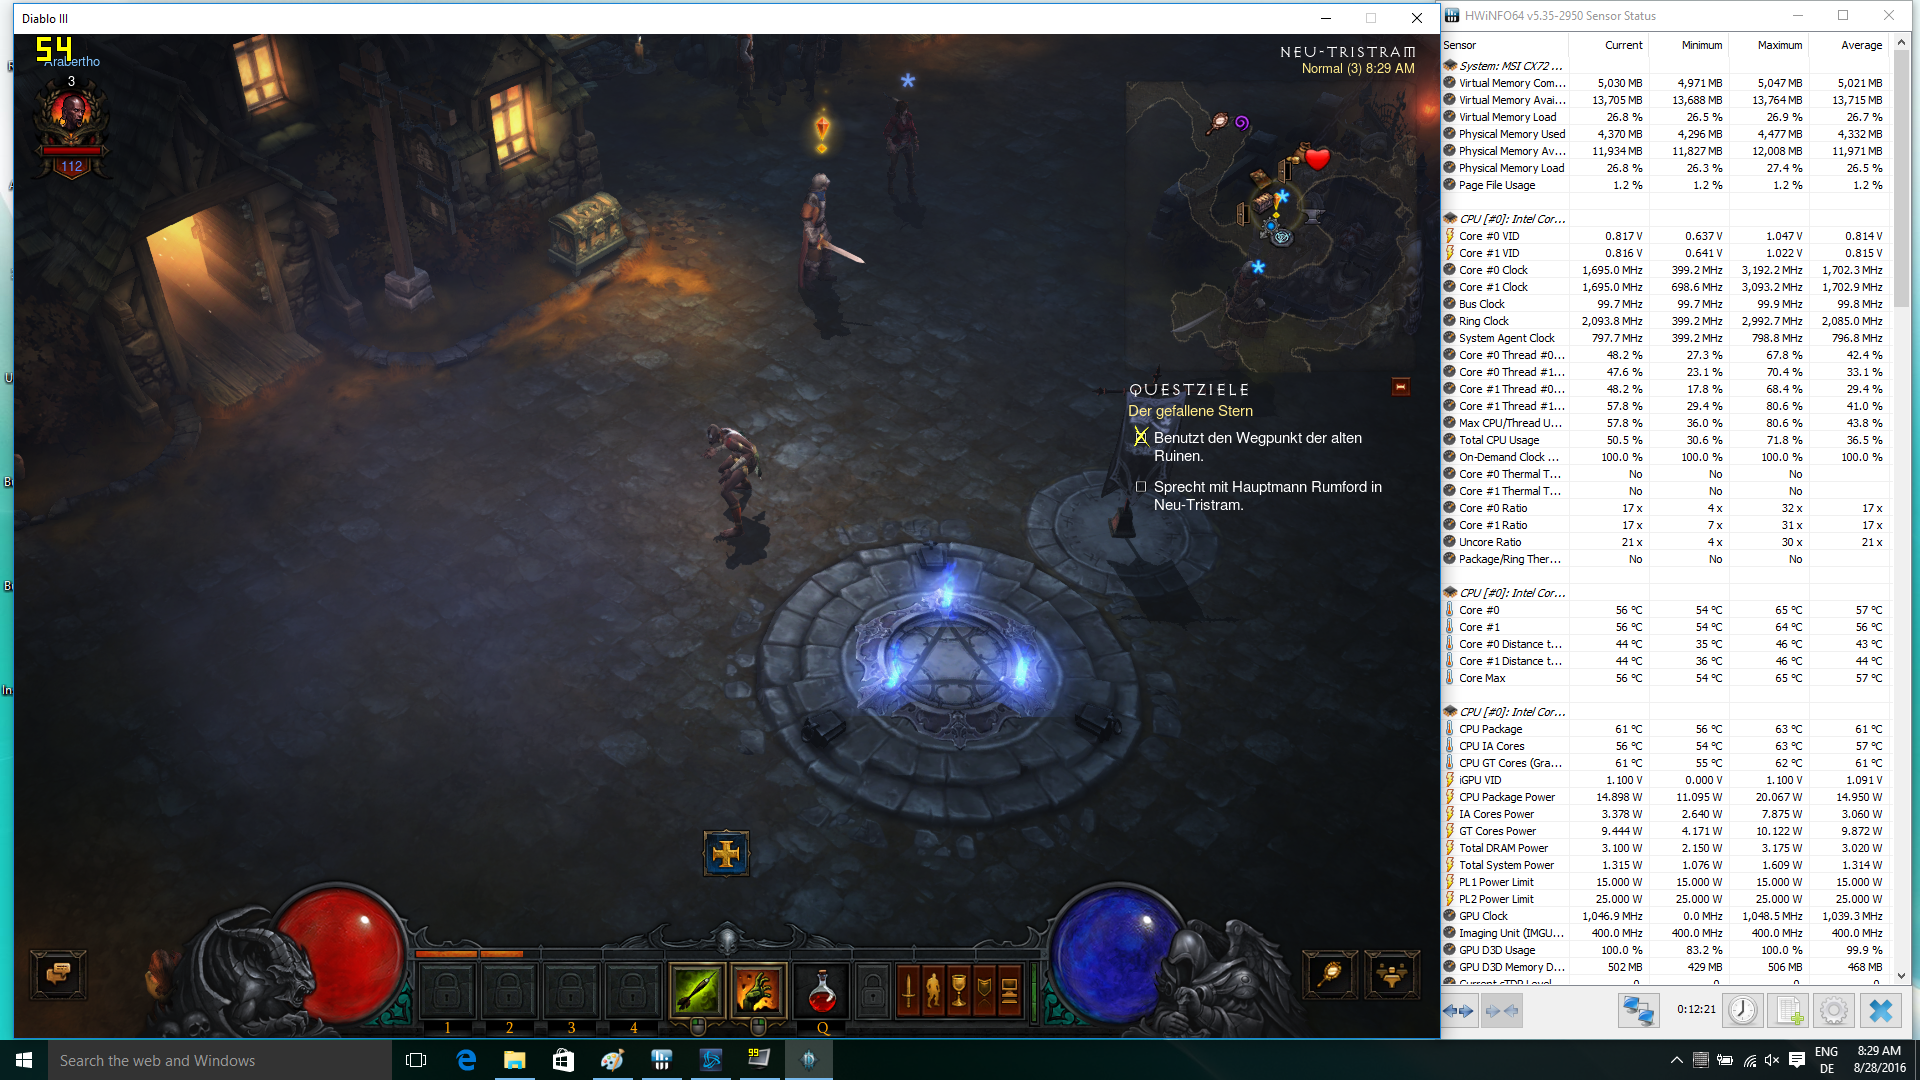
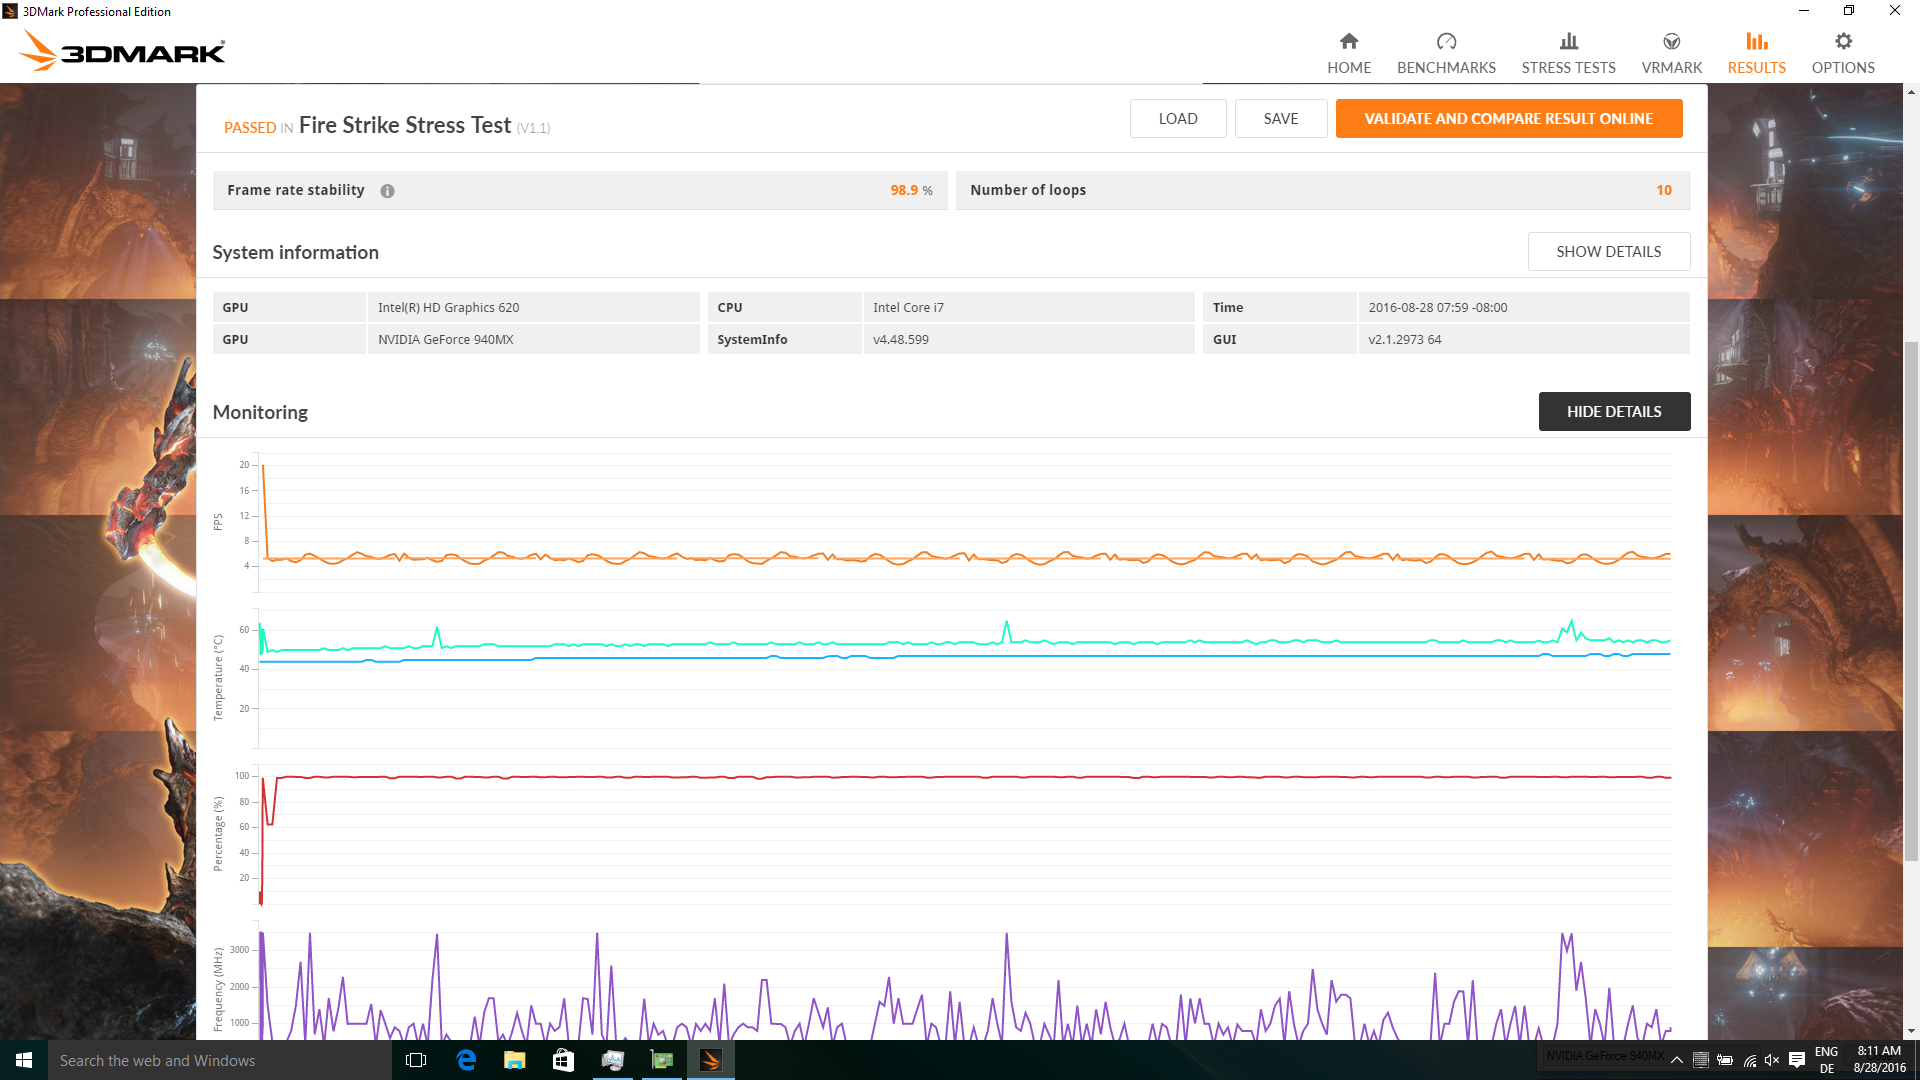
Performance consistency under sustained CPU/GPU load
ULV processors can usually exceed their TDP limit for a short time, in the case of modern Intel chips usually for about 30 seconds. The Core i7-7500U makes use of that as well and can consume more than 20 Watts for a short while during gaming. This "Overboost" period is often finished after a couple of clicks in the menu and the loading time, so the frame rate will not drop further during longer gaming sessions. The 3DMark Fire Strike Test also confirms an almost perfect Frame Rate Stability of 98.9 percent for our test model.
HEVC and VP9 Playback
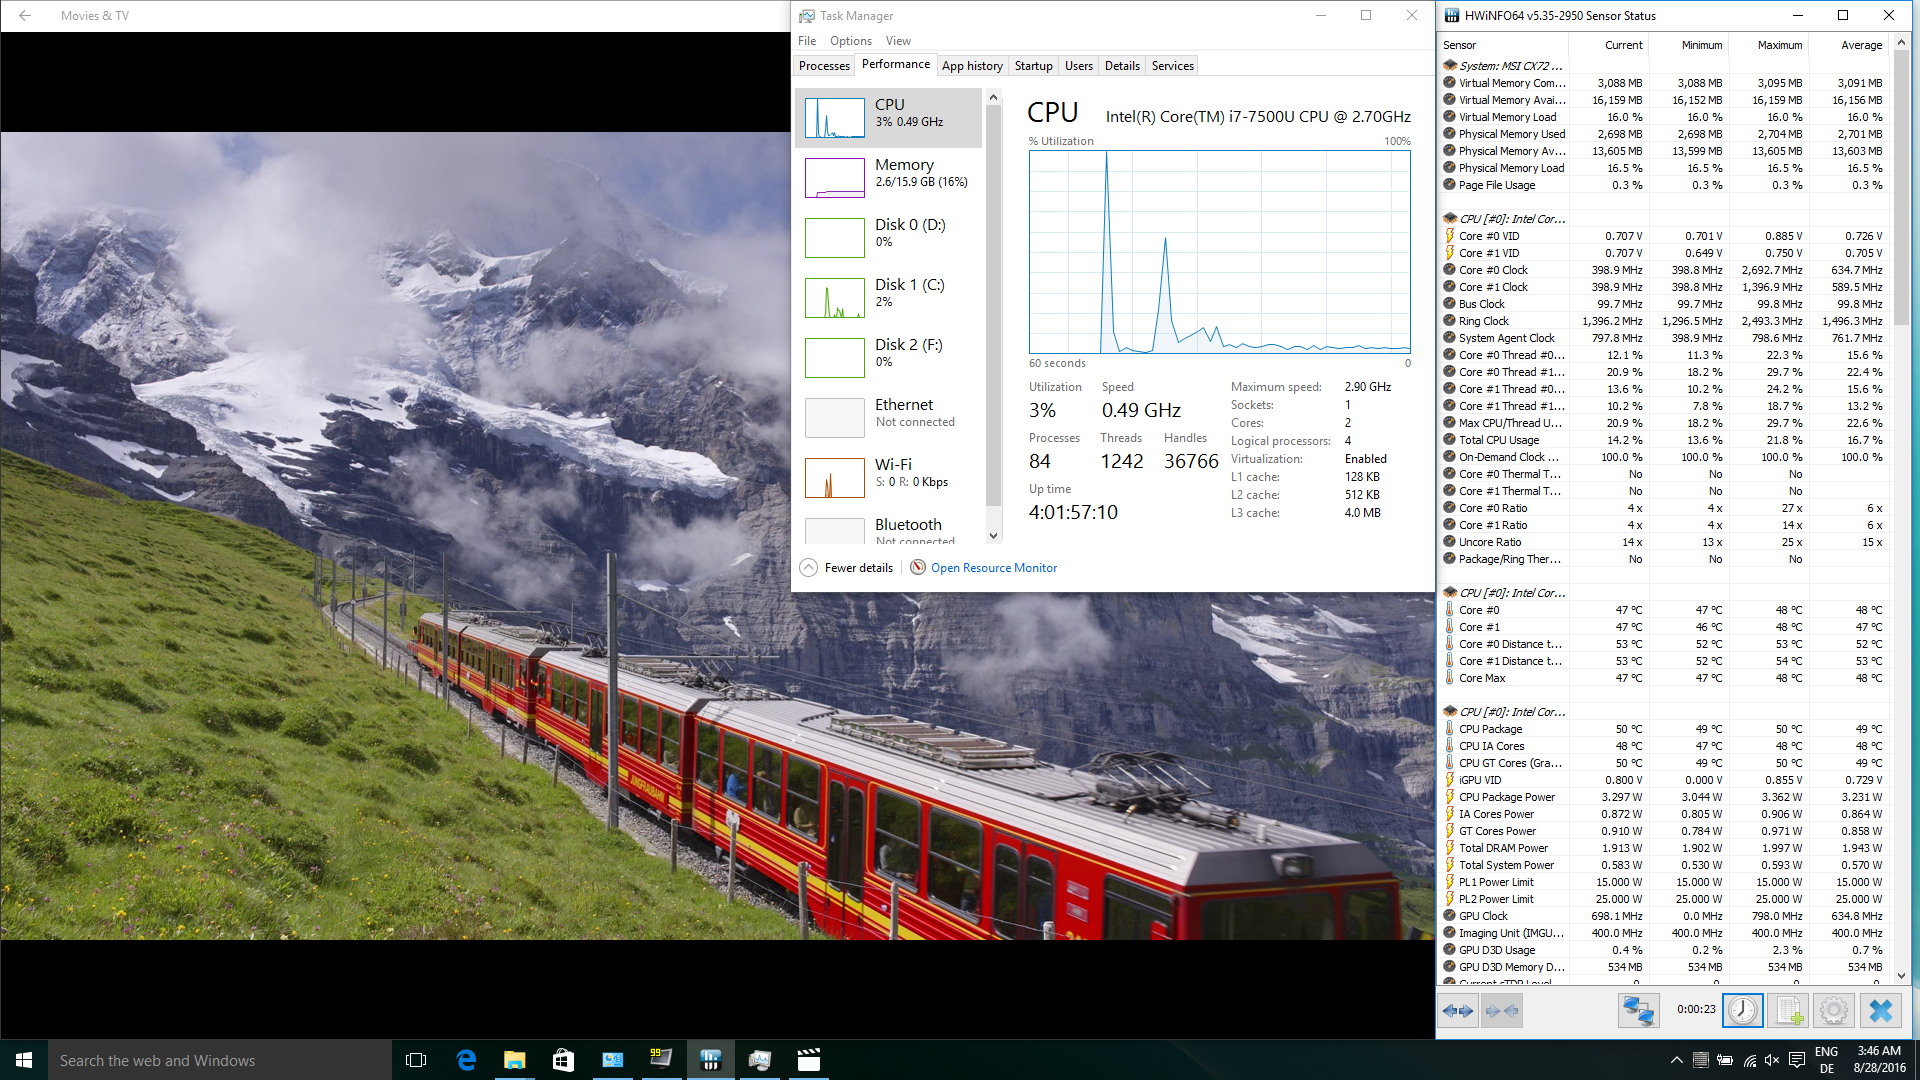
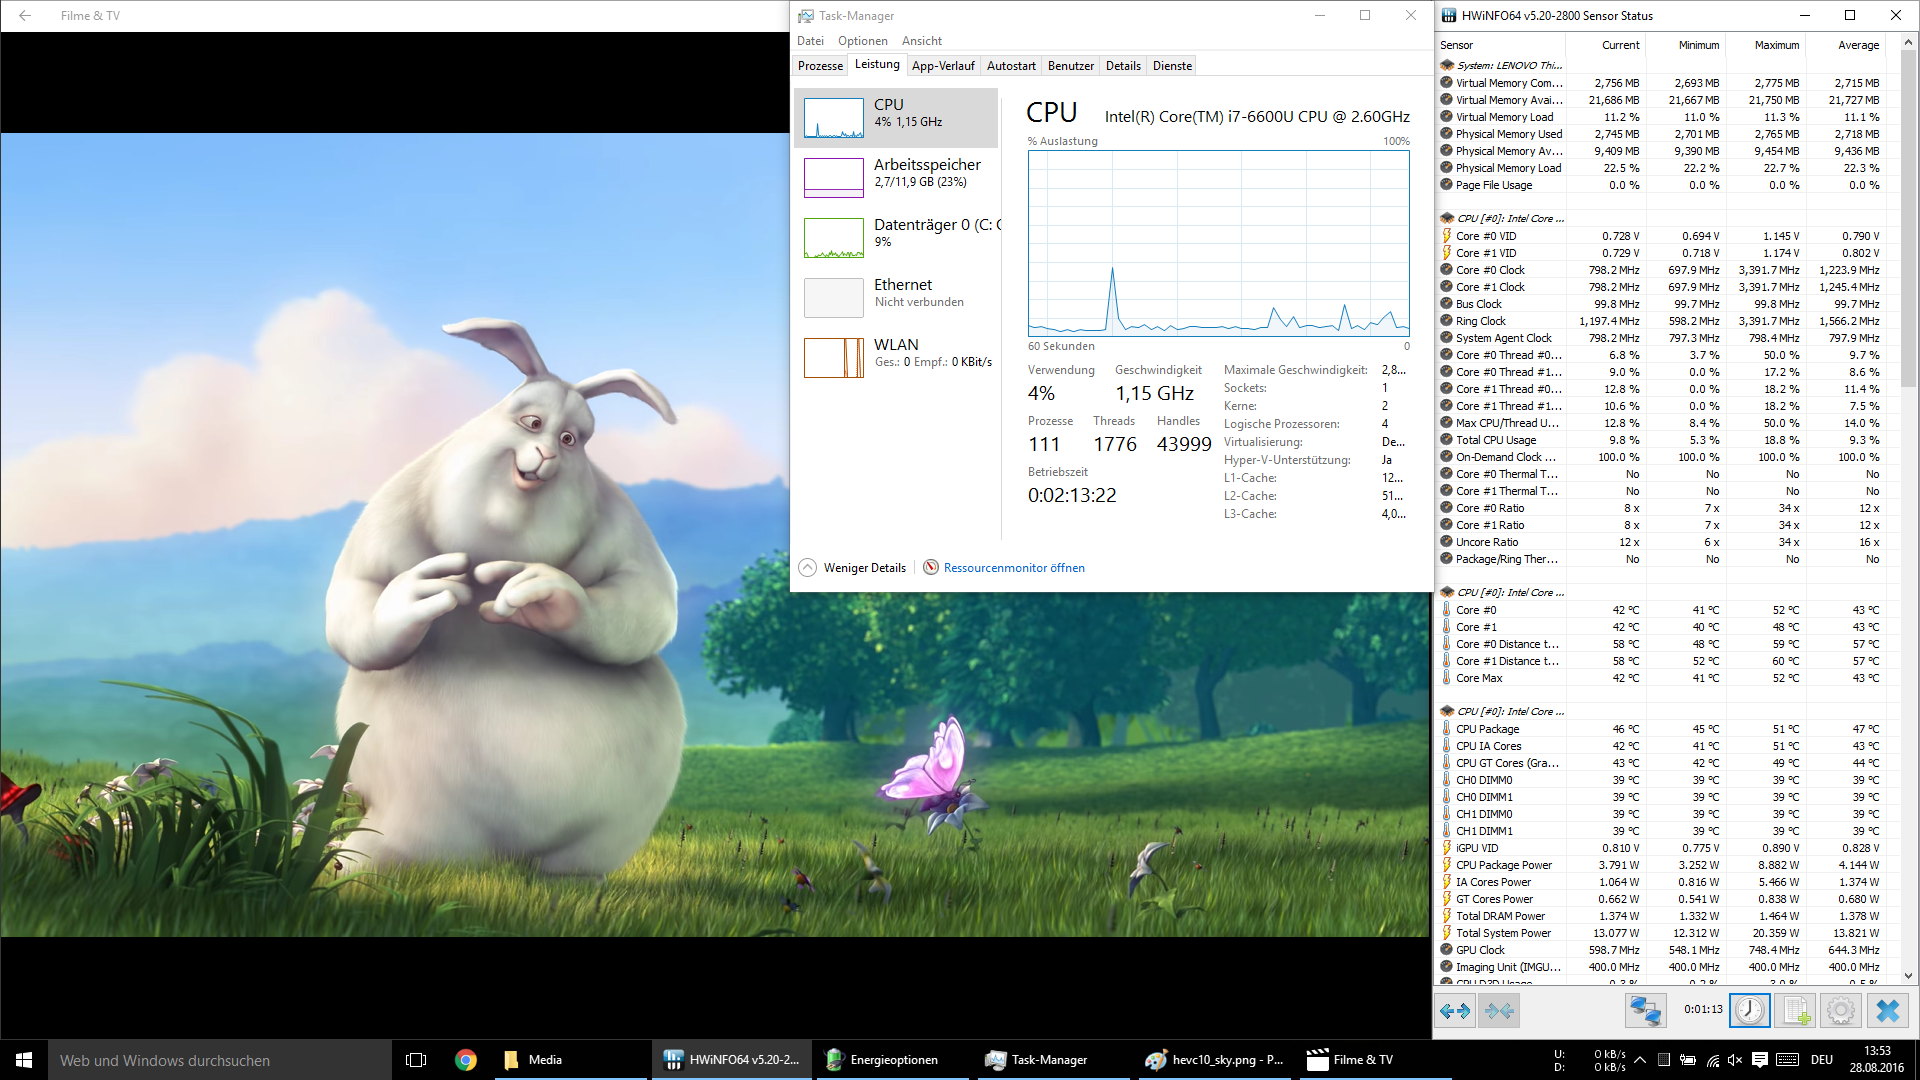
The Skylake hardware was already able to decode H-265/HEVC videos at a low power consumption, but it did not support the Main10 standard for contents with a 10-bit color depth. Kaby Lake changes that: Our demanding 4K trailer (HEVC Main10, 50 Mbps, 60 fps) is handled smoothly by the i7-7500U at an average power consumption of just 3.2 Watts (CPU Package Power), while the video stuttered noticeably on the i7-6600U despite a consumption of 16.5 Watts.
Neither of the two chips has problems with a simpler 8-bit 4K video (HEVC, 6 Mbps, 60 fps), but Kaby Lake (3.4 Watts) is still more frugal than its predecessor (4.1 Watts).
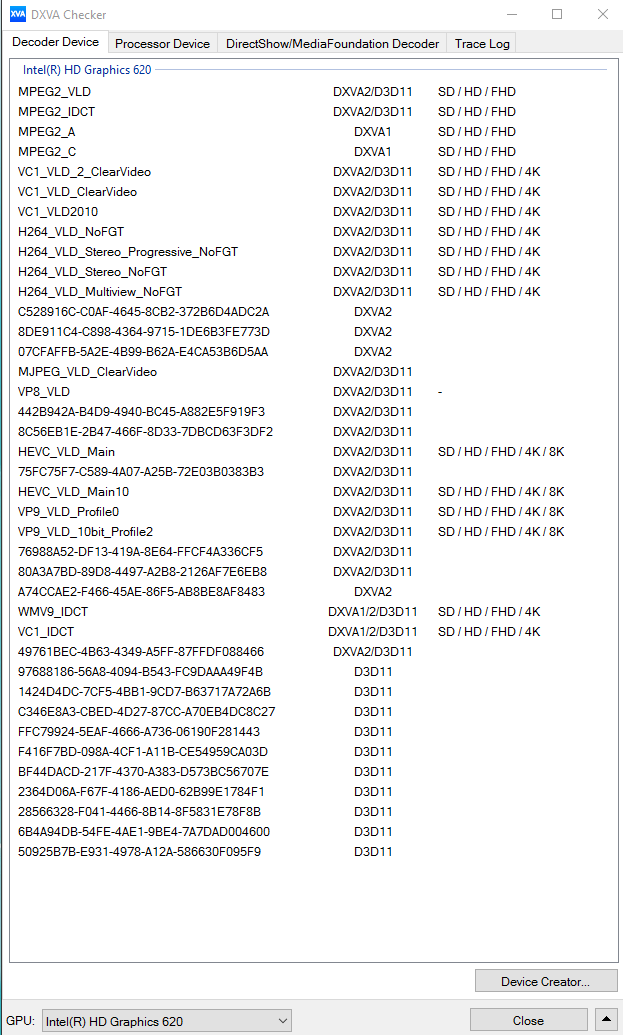
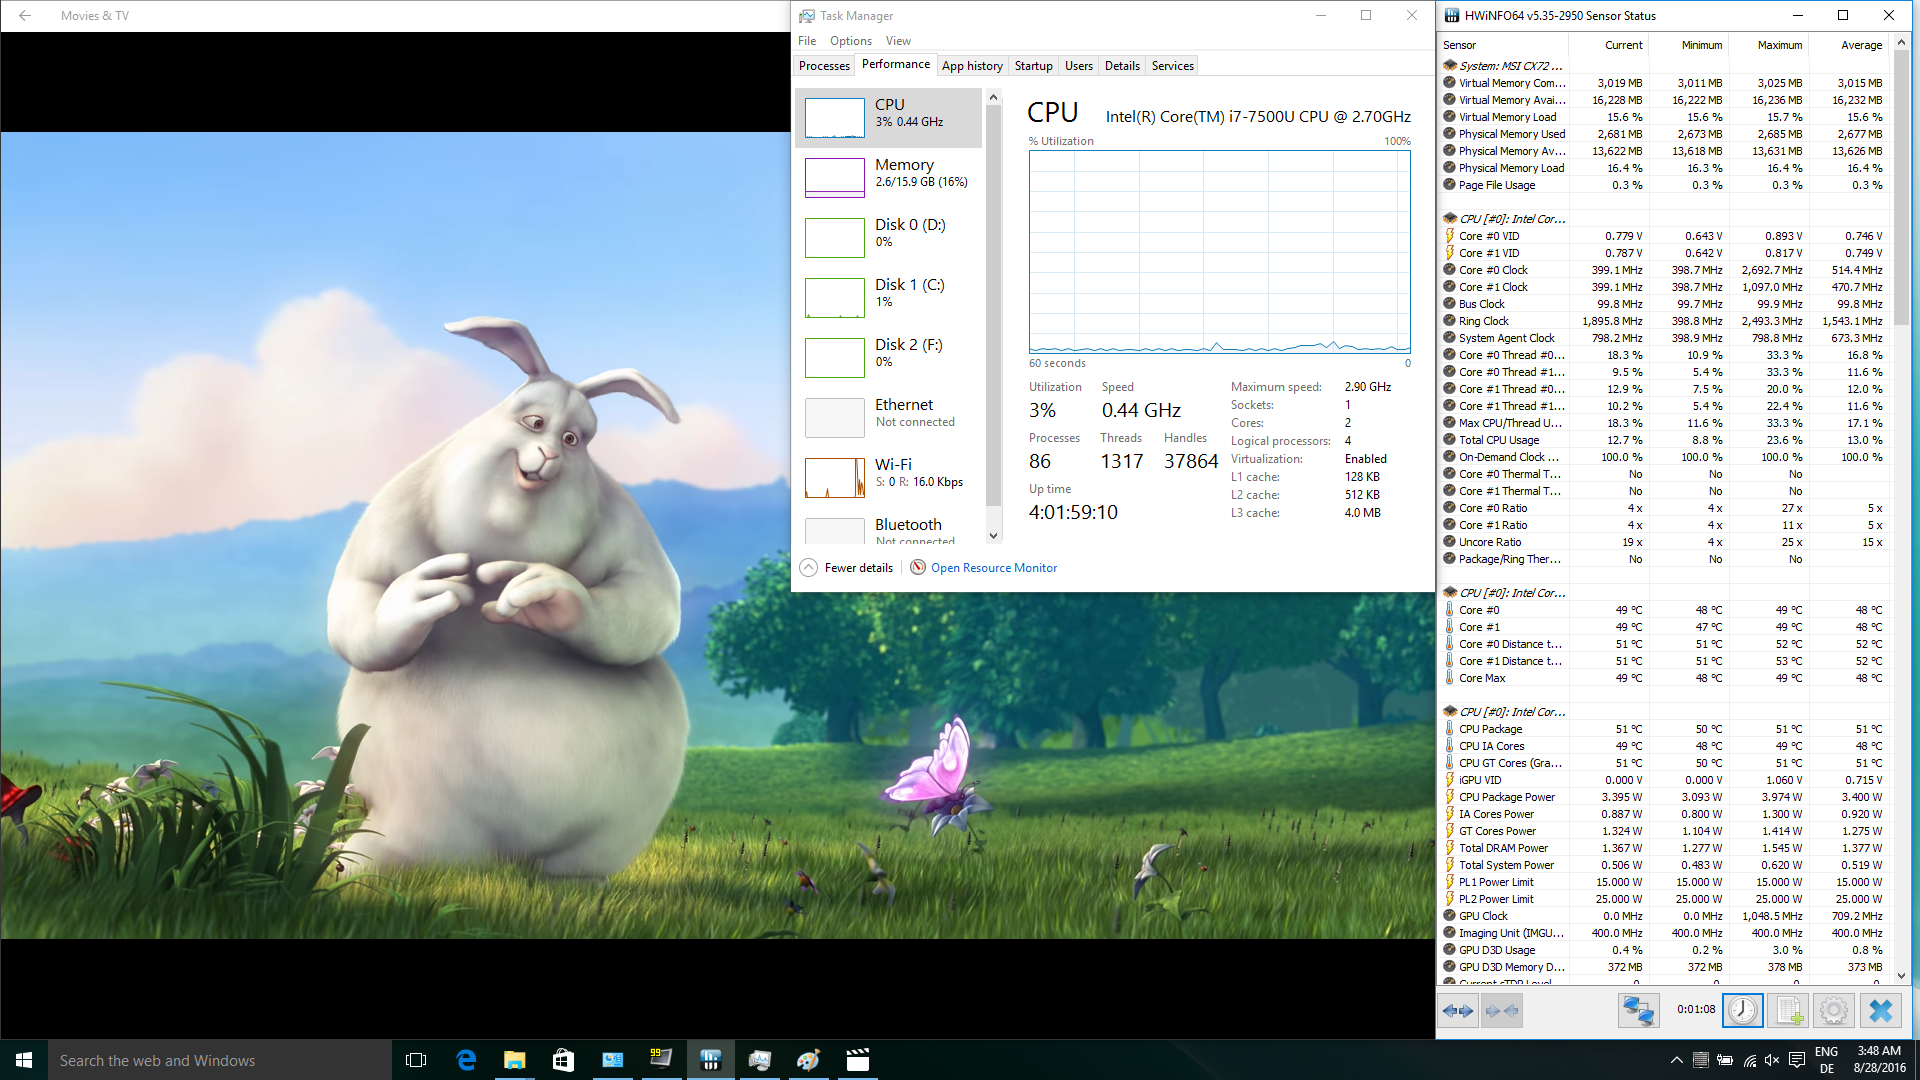
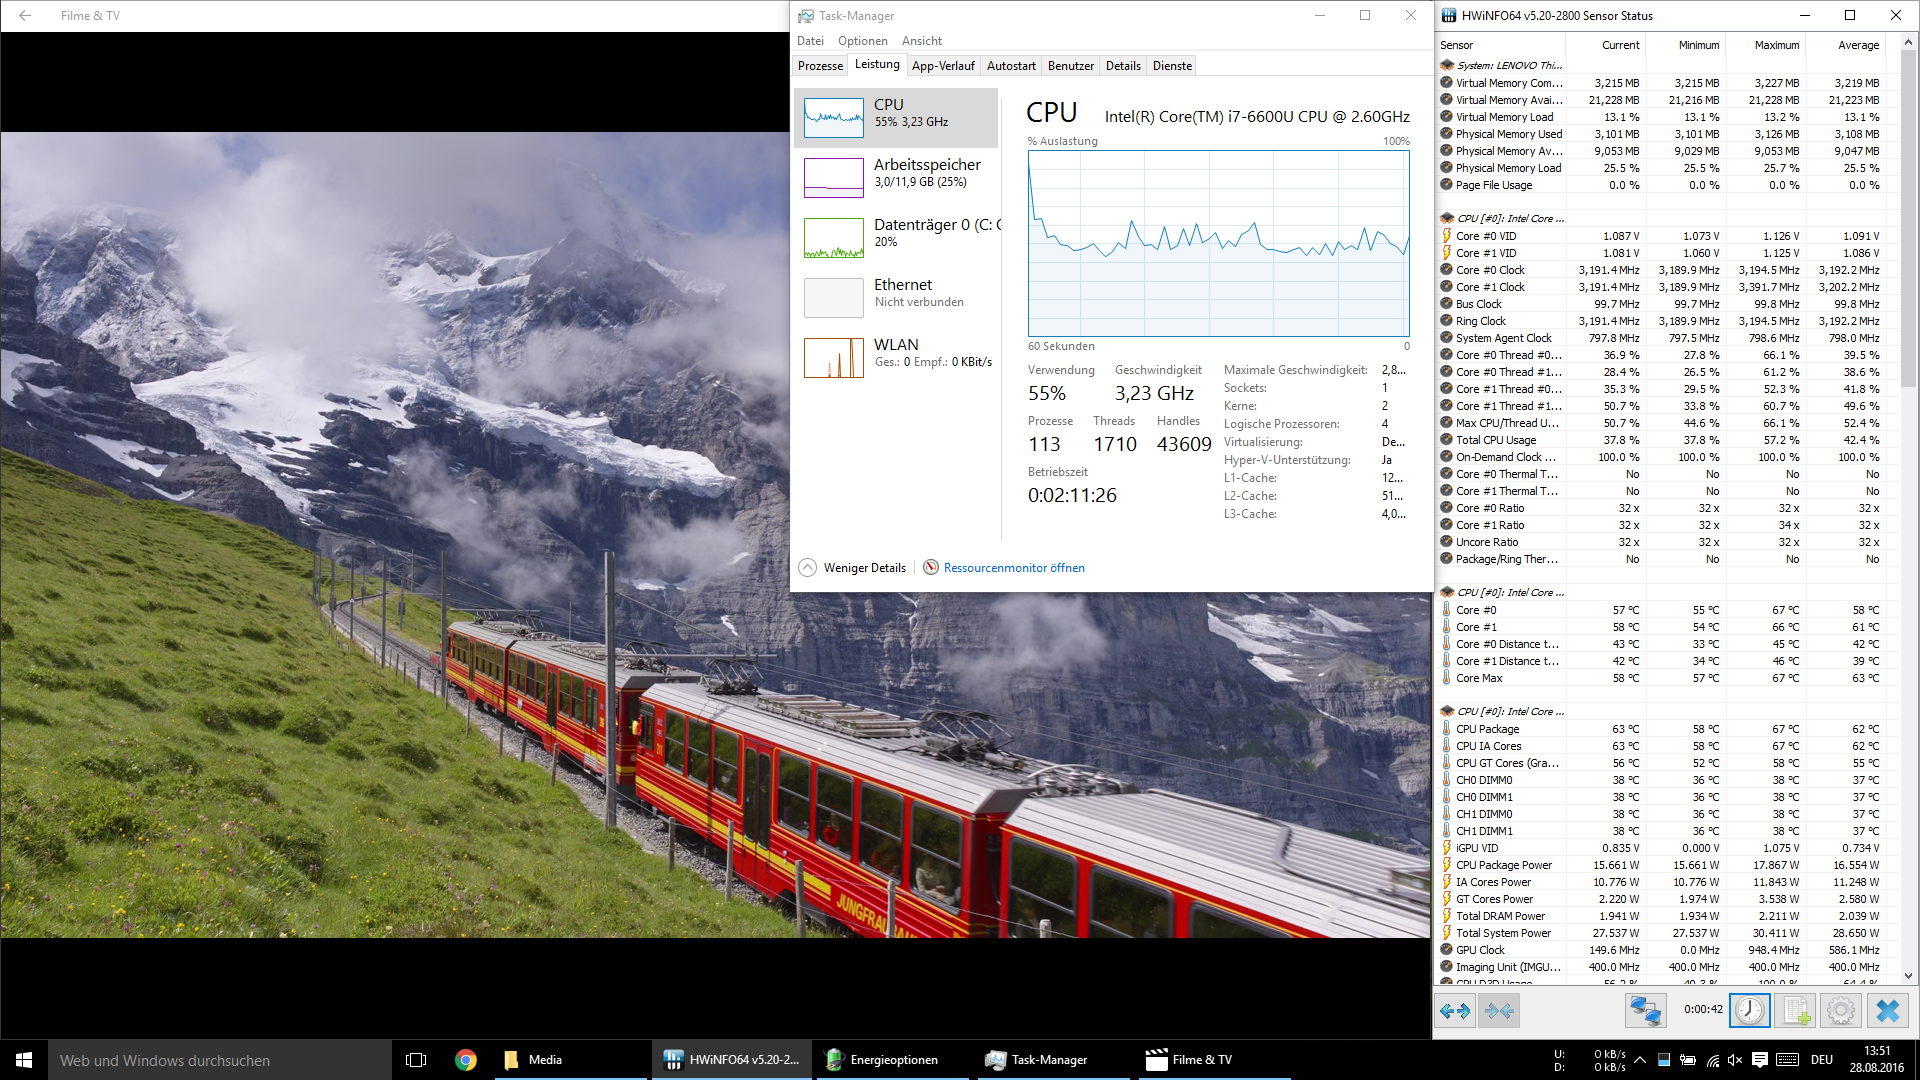
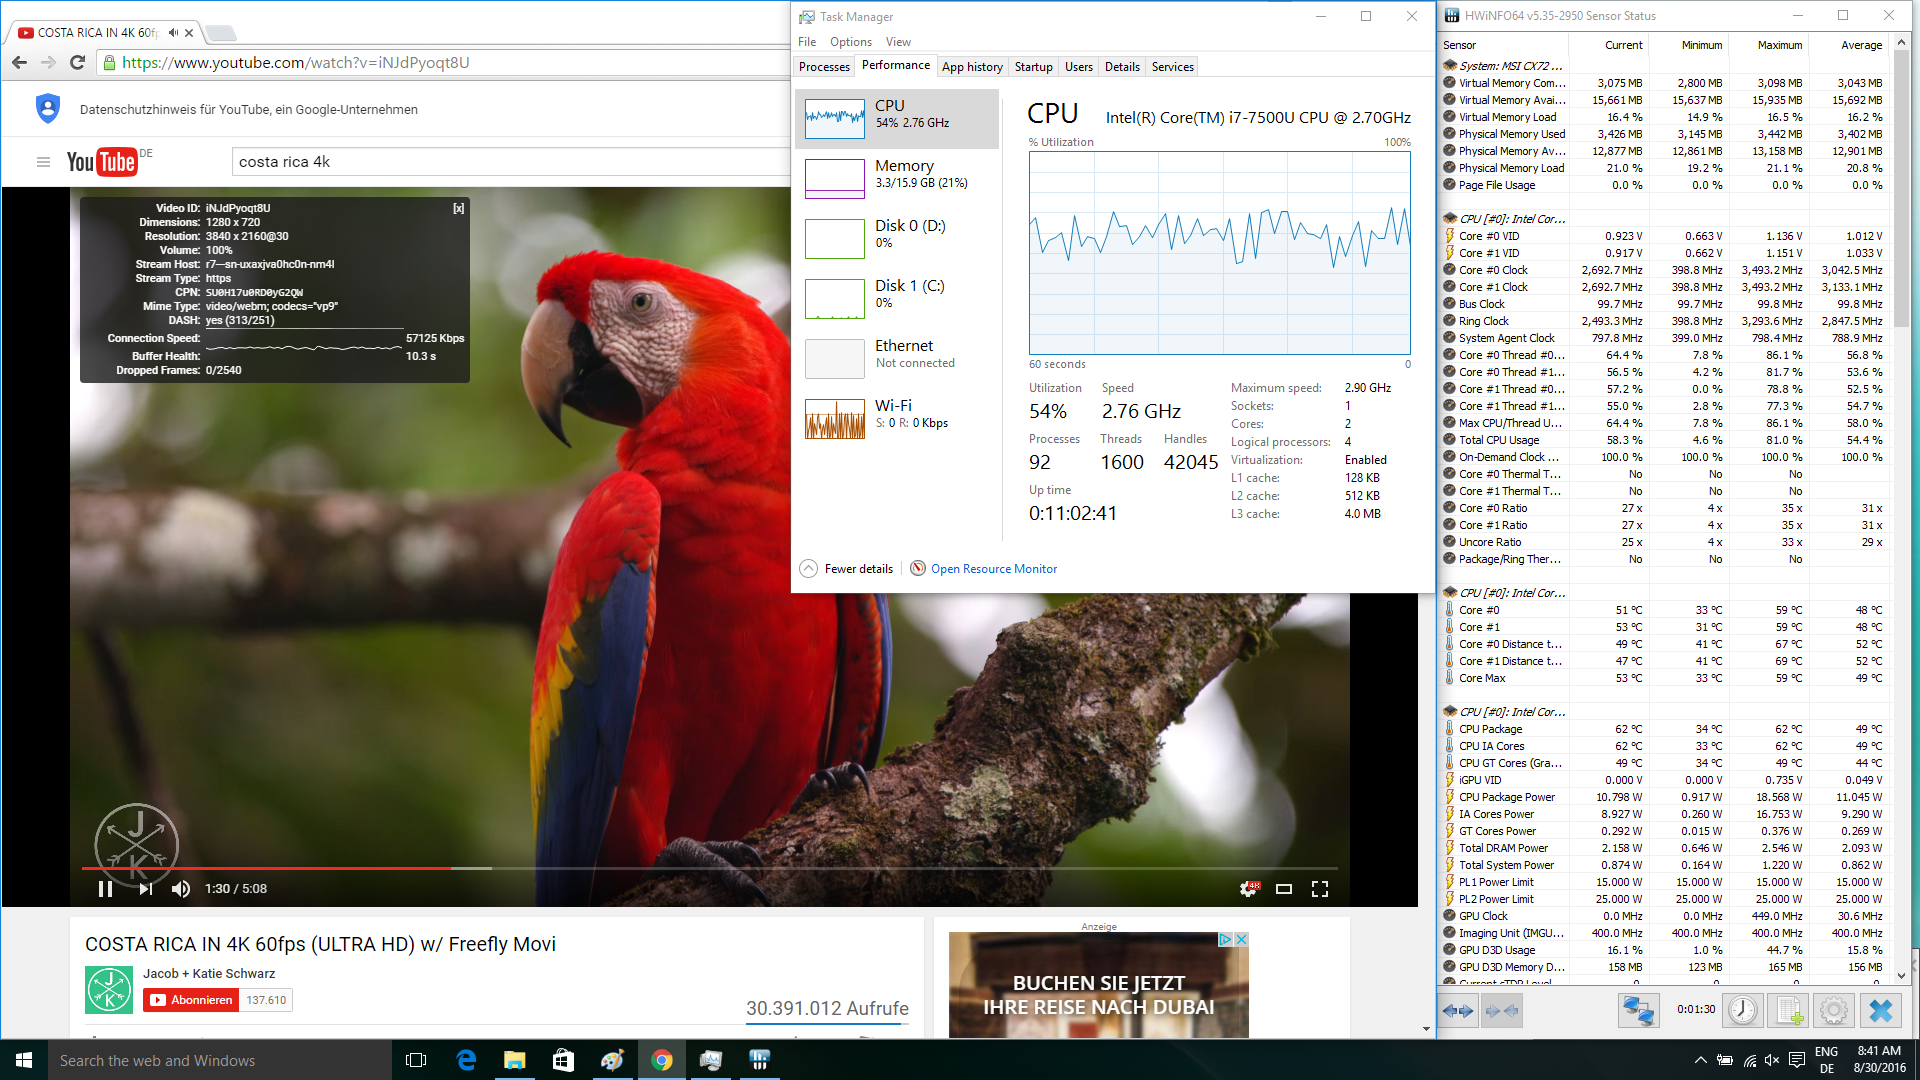
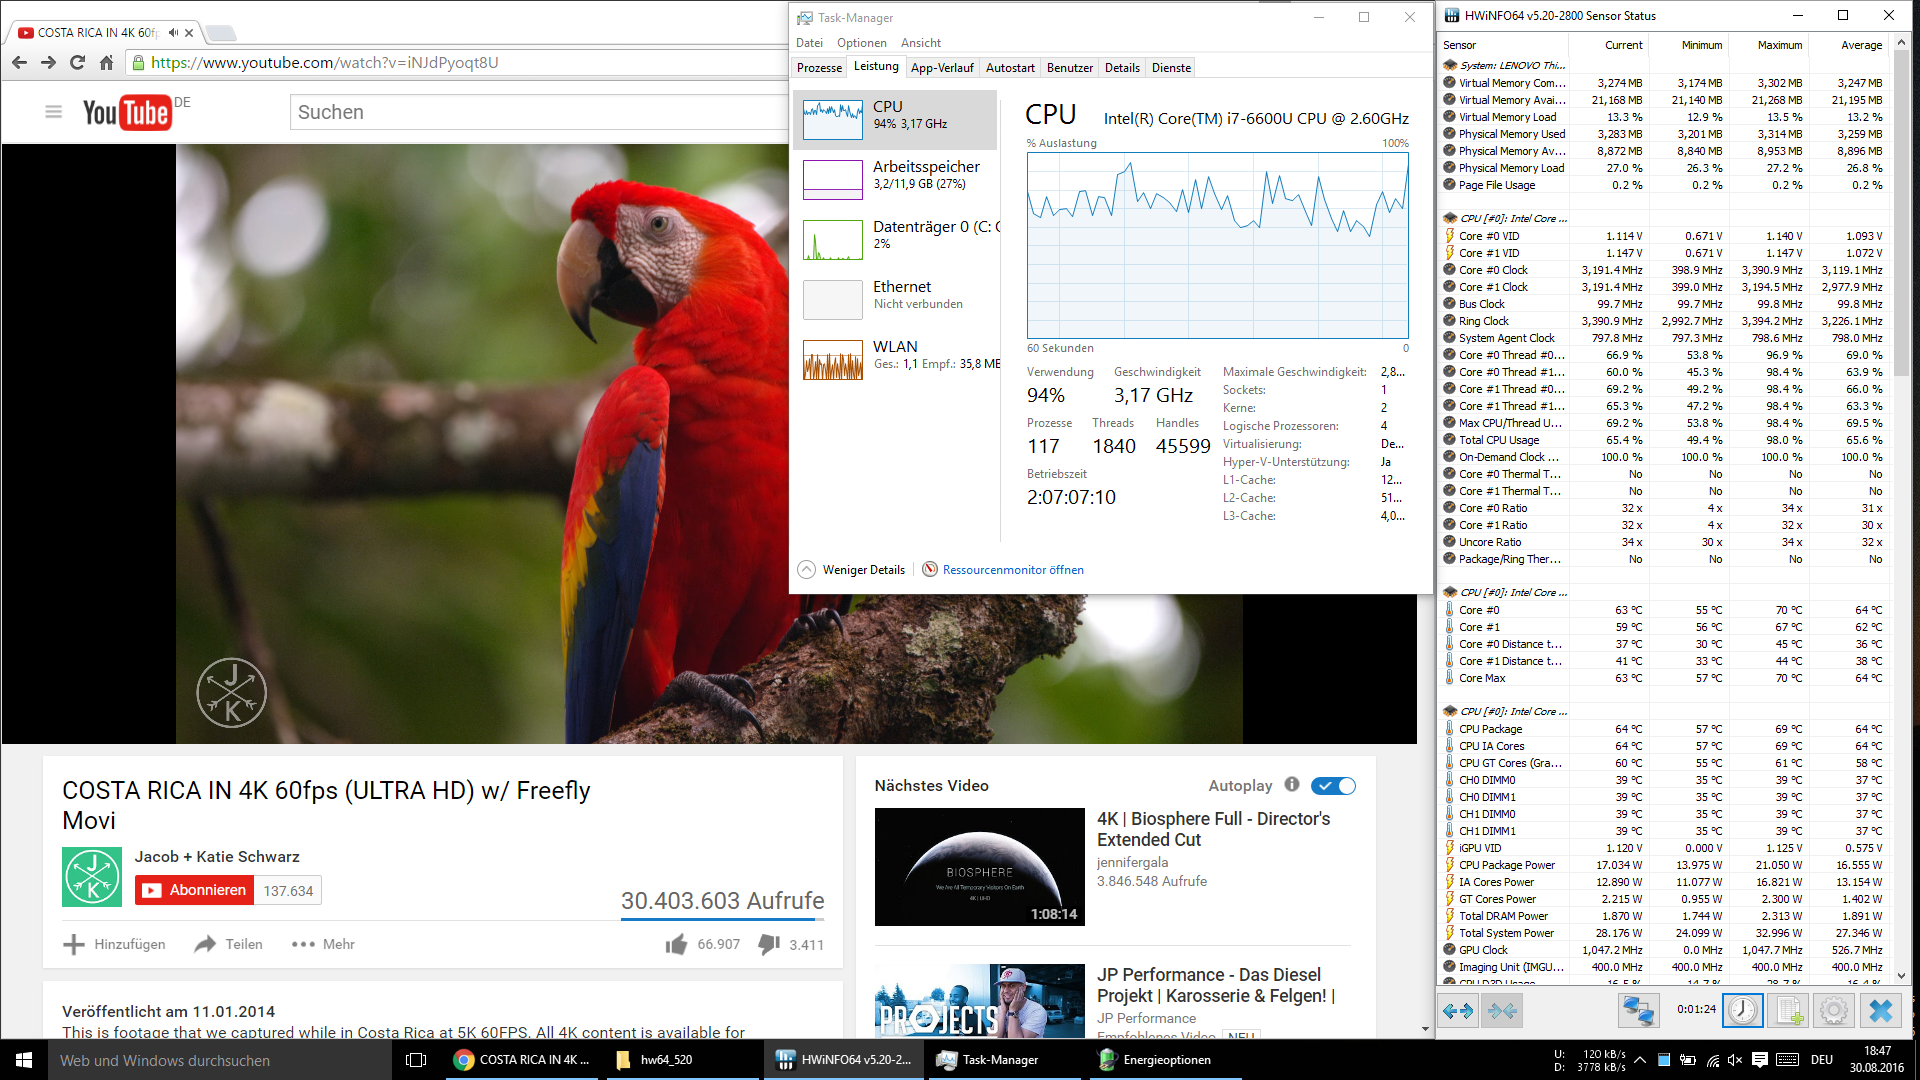
The added VP9 support is particularly interesting for 4K videos on YouTube, because the videos use this codec by default in Google's Chrome browser. It unfortunately looks like the hardware acceleration does not really work yet: The average CPU load slightly drops from 66 (i7-6600U) to 54 percent (i7-7500U) and therefore also the power consumption (11.0 instead of 16.6 Watts), but it is still not very efficient. We probably need a driver or browser update to activate full hardware support.
Verdict
Intel's Kaby Lake generation admittedly looks pretty boring at first. There is no new manufacturing process, no new microarchitecture – all this reminds us a bit of the Haswell refresh back in 2014, which did not really introduce any noteworthy advantages.
Kaby Lake on the other hand is more than just a simple rebranding of the Skylake chips. Even though the 14-nm process was basically not changed, the manufacturer was able to optimize it considerably. The results are surprisingly high clocks or a much lower consumption at the same clocks, respectively. Depending on the frequency range, we can see efficiency improvements somewhere between 15 and 25 percent; it remains to be seen whether the lower clocked Core-m/Y-series might be even better. We are also eager to see the quad-core ULV models. They are planned for 2017 and should introduce the biggest performance gains in the 15-Watt segment we have seen for years.
And last but not least, we also want to praise the reworked video decoder, which does not only support new codecs like HEVC Main10, but is also much more efficient than before. In combination with other efficiency improvements, Kaby Lake notebooks should manage even longer battery runtimes compared to their Skylake predecessors.

