Reviews for the Intel Core i7-6600U processor
Fujitsu LifeBook E756 (i7-6600U, HD520) Laptop Review
Plenty of ports. The LifeBook E756 is a notebook for business users. In our review, the 15-inch notebook shines with its great maintenance features; however, in other places it has some minor difficulties. What kind of overall impression the device has left on us and how it performs when compared to the competition, you can find out in our review.
Intel Core i7-6600U, HD Graphics 520, 15.6", 1.9 kgSurface Book with Performance Base Review – 1 TB SSD Update
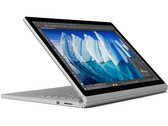
Top model. We review the high-end SKU of Microsoft's luxury 2-in-1 with a fast 1 TB NVMe-SSD and 16 GB DDR4 of RAM. We check the differences to the entry-level version from 2017 that we have already reviewed.
Intel Core i7-6600U, NVIDIA GeForce GTX 965M, 13.5", 1.7 kgFujitsu Lifebook S936 (6600U, 512 GB) PalmSecure Laptop Review
Master of Mobility. With its new flagship, Fujitsu turns towards the traveling business user for whom a mobile all-around worry-free package is worth a lot of money. It does not change anything about its core competencies that the manufacturer messes up in some details and will not keep the target audience from buying this laptop.
Intel Core i7-6600U, HD Graphics 520, 13.3", 1.4 kgMicrosoft Surface Book with Performance Base (GTX 965M) Convertible Review
Pumped up. Is premium getting even better? Nvidia’s current Pascal GPU didn’t make it into the new Surface Book but Microsoft managed to fit a Maxwell chip under the hood that should offer plenty of performance. Or does it?
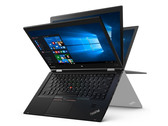
Intel Core i7-6600U, NVIDIA GeForce GTX 965M, 13.5", 1.7 kgLenovo ThinkPad X1 Yoga (OLED) Convertible Review
A class of its own. Lenovo goes all-in with the ThinkPad X1 Yoga 20FRS1VS00. The icing on the cake is the OLED screen. Our review update will find out how the flagship convertible from Lenovo performs.
Intel Core i7-6600U, HD Graphics 520, 14", 1.3 kgLenovo ThinkPad P40 Yoga 20GQ-000EUS: NVIDIA Quadro M500M, 14.10", 1.8 kg
Review » Lenovo ThinkPad P40 Yoga 20GQ-000EUS Workstation Review
Lenovo ThinkPad T560-20FH002RGE: NVIDIA GeForce 940MX, 15.60", 2.3 kg
Review » Lenovo ThinkPad T560 (Core i7, 940MX, 3K) Notebook Review
Dell Latitude 14 7000 Series E7470: Intel HD Graphics 520, 14.00", 1.7 kg
Review » Dell Latitude 14 E7470 Ultrabook Review
Lenovo ThinkPad T460s-20FA003GGE: Intel HD Graphics 520, 14.00", 1.3 kg
Review » Lenovo ThinkPad T460s (Core i7, WQHD) Ultrabook Review
HP ZBook 15u G3: AMD FirePro W4190M, 15.60", 2.2 kg
Review » HP ZBook 15u G3 Workstation Review
Microsoft Surface Book Core i7: NVIDIA Maxwell GPU Surface Book, 13.50", 1.5 kg
Review » Microsoft Surface Book (Core i7, 940M) Convertible Review
Lenovo ThinkPad T560-20FH002RGE: NVIDIA GeForce 940MX, 15.60", 2.3 kg
External Review » Lenovo ThinkPad T560-20FH002RGE
Microsoft Surface Book with Performance Base: NVIDIA GeForce GTX 965M, 13.50", 1.7 kg
External Review » Microsoft Surface Book with Performance Base
Dell Latitude 15 E5570-X2DCY: AMD Radeon R7 M360, 15.60", 2.1 kg
External Review » Dell Latitude 15 E5570-X2DCY
HP ProBook 650 G2-Y3B47ES: Intel HD Graphics 520, 15.60", 2.3 kg
External Review » HP ProBook 650 G2-Y3B47ES
HP ProBook 640 G2-Y3B44ES: Intel HD Graphics 520, 14.10", 2 kg
External Review » HP ProBook 640 G2-Y3B44ES
Dell Latitude 12 Rugged Extreme-7214: Intel HD Graphics 520, 11.60", 2.7 kg
External Review » Dell Latitude 12 Rugged Extreme-7214
Microsoft Surface Book 2016, Core i7: NVIDIA GeForce GTX 965M, 13.50", 1.7 kg
External Review » Microsoft Surface Book 2016, Core i7
Lenovo Thinkpad X1 Yoga 20FX-0045GE: Intel HD Graphics 520, 14.00", 1.4 kg
External Review » Lenovo Thinkpad X1 Yoga 20FX-0045GE
Lenovo ThinkPad T460s-20F90058GE: Intel HD Graphics 520, 14.00", 1.4 kg
External Review » Lenovo ThinkPad T460s-20F90058GE
Lenovo ThinkPad X1 Yoga 20FQ005TMS: Intel HD Graphics 520, 14.00", 1.4 kg
External Review » Lenovo ThinkPad X1 Yoga 20FQ005TMS
HP EliteBook 1040 G3-V1B13EA: Intel HD Graphics 520, 14.00", 1.4 kg
External Review » HP EliteBook 1040 G3-V1B13EA
Fujitsu Lifebook T936: Intel HD Graphics 520, 13.30", 1.6 kg
External Review » Fujitsu Lifebook T936
Toshiba Tecra Z40-C-103: NVIDIA GeForce 930M, 14.00", 1.5 kg
External Review » Toshiba Tecra Z40-C-103
Lenovo ThinkPad X260-20F5003JGE: Intel HD Graphics 520, 12.50", 1.5 kg
External Review » Lenovo ThinkPad X260-20F5003JGE
HP Spectre Pro x360 G2-V1B04EA: Intel HD Graphics 520, 13.30", 1.5 kg
External Review » HP Spectre Pro x360 G2-V1B04EA
HP ProBook 650 G2-X9V26UT: Intel HD Graphics 520, 15.60", 2.3 kg
External Review » HP ProBook 650 G2-X9V26UT
Lenovo ThinkPad P40 Yoga 20GQ-000EUS: NVIDIA Quadro M500M, 14.10", 1.8 kg
External Review » Lenovo ThinkPad P40 Yoga 20GQ-000EUS
Fujitsu Stylistic R726-0M871PDE: Intel HD Graphics 520, 12.50", 1.2 kg
External Review » Fujitsu Stylistic R726-0M871PDE
Lenovo ThinkPad X1 Yoga 20FQ0044GE: Intel HD Graphics 520, 14.00", 1.4 kg
External Review » Lenovo ThinkPad X1 Yoga 20FQ0044GE
Fujitsu LifeBook E736-0M87BPDE: Intel HD Graphics 520, 13.30", 1.6 kg
External Review » Fujitsu LifeBook E736-0M87BPDE
Toshiba Portege Z30-C1320: Intel HD Graphics 520, 13.30", 1.2 kg
External Review » Toshiba Portege Z30-C1320
HP ZBook 15u G3: AMD FirePro W4190M, 15.60", 2.2 kg
External Review » HP ZBook 15u G3
Toshiba Tecra Z50-C1550: NVIDIA GeForce 930M, 15.60", 2.2 kg
External Review » Toshiba Tecra Z50-C1550
Toshiba Tecra Z40-C1420: Intel HD Graphics 520, 14.00", 1.5 kg
External Review » Toshiba Tecra Z40-C1420
Asus N552VW-FI043T: NVIDIA GeForce GTX 960M, 15.60", 2.5 kg
External Review » Asus N552VW-FI043T
Dell Latitude 14 7000 Series E7470: Intel HD Graphics 520, 14.00", 1.7 kg
External Review » Dell Latitude 14 7000 Series E7470
Microsoft Surface Book Core i7: NVIDIA Maxwell GPU Surface Book, 13.50", 1.5 kg
External Review » Microsoft Surface Book, Core i7
Lenovo ThinkPad X1 Yoga-20FRS1VS00: Intel HD Graphics 520, 14.00", 1.3 kg
Article » Display Comparison: OLED vs. IPS on Notebooks
Lenovo ThinkPad T460s-20FAS2G900: Intel HD Graphics 520, 14.00", 1.4 kg
Article » Lenovo ThinkPad T460s Long-Term Review: Part 2 - Wireless Docks and Terabyte SSDs
Lenovo ThinkPad T460s-20FA003GGE: Intel HD Graphics 520, 14.00", 1.3 kg
Article » Lenovo ThinkPad T460s Long-Term Review: Part 1