Notebook reviews with NVIDIA GeForce 820M graphics card
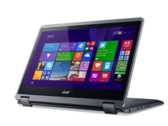
Acer Aspire R14 Convertible Review
Small and simple. Acer presents a 14-inch convertible dubbed Aspire R14 R3-471TG-552E that is to convince us with its elegant design, a 360-degree display, and decent system performance. Unfortunately, the screen does not quite meet our expectations.
Intel Core i5-4210U, NVIDIA GeForce 820M, 14", 2 kgAsus X555LD-XX283H Notebook Review
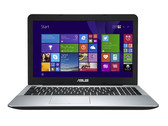
Inexpensive all-rounder. A Core i3 processor and GeForce 820M graphics core make the Asus laptop a versatile all-rounder that offers enough power for everyday use and playing the odd game. Could buying a device for around 450 Euros (~$505) be a mistake?
Intel Core i3-4010U, NVIDIA GeForce 820M, 15.6", 2.3 kgAsus F555LD-XX243H Notebook Review Update
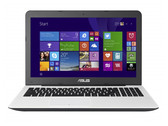
Well-equipped. Pony up 500 Euros (~$613) for this 15.6-inch device and you'll get an all-rounder capable of running some current video games. Thanks to its 1 TB hard drive, the storage space won't run out anytime soon.
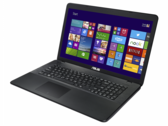
Intel Core i3-4010U, NVIDIA GeForce 820M, 15.6", 2.3 kgAsus F751LDV-TY178H Notebook Review
Made to serve? Asus' F751LDV-TY178H wants to be an all-rounder and satisfy all natures to an equal extent. Will the 650-Euro (~$814) laptop accomplish this feat?
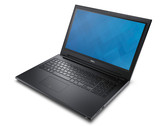
Intel Core i5-4210U, NVIDIA GeForce 820M, 17.3", 2.6 kgDell Inspiron 15 3542-2293 Notebook Review
Decent all around. The Inspiron 15 3542 is an inexpensive allrounder-notebook. Thanks to a powerful Core i5 processor and dedicated GeForce graphics card, even gaming is not out of the question. The battery life is very decent as well.
Intel Core i5-4210U, NVIDIA GeForce 820M, 15.6", 2.3 kgAsus Transformer Book Flip TP300LD-C4031H: Intel Core i7-4510U, 13.30", 1.8 kg
Review » Asus Transformer Book Flip TP300LD-C4031H Convertible Review
Lenovo IdeaPad Z40-59422614: Intel Core i5-4200U, 14.00", 2.1 kg
Review » Lenovo Z40-59422614 Notebook Review
HP Compaq 15-a024sg: Intel Core i3-3110M, 15.60", 2.5 kg
Review » Review HP Compaq 15-a024sg Notebook
Acer Aspire E1-772G 54208G1TMnsk: Intel Core i5-4200M, 17.30", 3.2 kg
Review » Review Acer Aspire E1-772G 54208G1TMnsk Notebook
Asus ASUSPRO P550LDV-XO1303G: Intel Core i3-4030U, 15.60", 2.3 kg
External Review » Asus ASUSPRO P550LDV-XO1303G
HP 15-L0Z35EA: Intel Core i5-5200U, 15.60", 2.2 kg
External Review » HP 15-L0Z35EA
Asus Transformer Book Flip TP300LD-C4031H: Intel Core i7-4510U, 13.30", 1.8 kg
External Review » Asus Transformer Book Flip TP300LD-C4031H
Acer Aspire R14 R3-471TG-552E: Intel Core i5-4210U, 14.00", 2 kg
External Review » Acer Aspire R14 R3-471TG-552E
Asus X751MD: Intel Pentium N3530, 17.30", 2.8 kg
External Review » Asus X751MD
Asus Transformer Book Flip TP300LD-C4030H: Intel Core i5-4210U, 13.30", 1.7 kg
External Review » Asus Transformer Book Flip TP300LD-C4030H
MSI CX61-2PC385W7W: Intel Core i3-4100M, 15.60", 2.4 kg
External Review » MSI CX61-2PC385W7W
Asus Transformer Book Flip TP550LA-BH71T-CB: Intel Core i7-4500U, 15.60", 2.6 kg
External Review » Asus Transformer Book Flip TP550LA-BH71T-CB
Dell Inspiron 15 3542-2293: Intel Core i5-4210U, 15.60", 2.3 kg
External Review » Dell Inspiron 15-3542
Asus X555LD: Intel Core i3-4030U, 15.60", 2.3 kg
External Review » Asus X555LD
Acer Extensa 2510G: Intel Core i3-4030U, 15.60", 2.5 kg
External Review » Acer Extensa 2510G
Acer Aspire E5-471G-53XG: Intel Core i5-4210U, 14.00", 2.1 kg
External Review » Acer Aspire E5-471G-53XG
Asus X550LDV-XO552H: Intel Core i7-4510U, 15.60", 2.3 kg
External Review » Asus X550LDV-XO552H
Lenovo G710: Intel Pentium 3550M, 17.30", 2.9 kg
External Review » Lenovo G710
Lenovo IdeaPad Z40-59422614: Intel Core i5-4200U, 14.00", 2.1 kg
External Review » Lenovo IdeaPad Z40-59422614
Asus R752LD-TY057: Intel Core i3-4010U, 17.30", 2.7 kg
External Review » Asus R752LD-TY057
Acer Aspire E5-471G-527B: Intel Core i5-4210U, 14.00", 2.1 kg
External Review » Acer Aspire E5-471G-527B
Lenovo Ideapad Flex 2 14-59420166: Intel Core i5-4210U, 14.00", 1.9 kg
External Review » Lenovo Ideapad Flex 2 14-59420166
Asus X550LDV-XO610H: Intel Core i5-4210U, 15.60", 2.3 kg
External Review » Asus X550LDV-XO610H
Dell Inspiron 3542: Intel Core i5-4210U, 15.60", 2.3 kg
External Review » Dell Inspiron 3542
Acer Aspire E1-472G-6844: Intel Core i5-4200U, 14.00", 2.1 kg
External Review » Acer Aspire E1-472G-6844