Notebook reviews with AMD Radeon RX Vega 3 graphics card
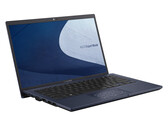
Asus ExpertBook L1 L1401CDA in review: Quiet office notebook for a small budget
The ExpertBook has a Ryzen 3 APU on board, usually operates quietly, offers a backlit keyboard and scores with many connectivity options (including VGA). Windows 10 Pro serves as the operating system (an upgrade to Windows 11 is possible). The purchase price is around 330 Euros (~$350).
AMD Ryzen 3 3250U, Vega 3, 14", 1.5 kgAsus Chromebook Flip CM1 in review: Silent 2-in-1 laptop
The 2-in-1 laptop offers an IPS touchscreen display, a silent operation, good battery life, and USB-C with Power Delivery. The overall package won't put too big a dent in your wallet.
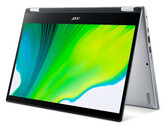
AMD 3015Ce, Vega 3, 14", 1.7 kgAcer Spin 3 SP314-21N review: A quiet 2-in-1 laptop with pen input
Acer's 2-in-1 laptop is equipped for office and Internet operation with a Ryzen 3 APU, 8 GB of working memory in dual-channel mode, and an NVMe SSD. The touchscreen can not only be operated with the fingers but also with an active input pen.
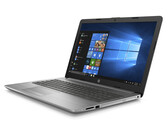
AMD Ryzen 3 3250U, Vega 3, 14", 1.5 kgHP 255 G7 in review: Multiple weaknesses, no strengths
The HP 255 G7 offers a Ryzen 3 APU, 8 GB of RAM, a DVD drive, and a 512 GB NVMe SSD. Windows 10 Pro serves as the operating system. Moreover, the built-in display disappoints in every respect.
AMD Ryzen 3 3200U, Vega 3, 15.6", 1.8 kgLenovo IdeaPad 1 11ADA05 in the review: Hand-held
Lenovo's 11.6-incher does not have a convincing hardware configuration on board. However, the device offers silent operation, a one-year MS Office 365 Personal license and a low price level (279 Euros/~$337). Windows 10 Home in S mode serves as the operating system.
AMD Athlon Silver 3050e, Vega 3, 11.6", 1.2 kgLenovo V15-ADA 82C7009SGE: AMD Athlon Gold 3150U, 15.60", 1.9 kg
Review » Lenovo V15-ADA Laptop Review: Not with this display
DFI GHF51-BN-43R15: AMD Ryzen Embedded R1505G, 0.3 kg
Review » DFI GHF51 Single-Board Computer Hands-On
Asus Vivobook 15 F512DA-SH31: AMD Ryzen 3 3200U, 15.60", 1.8 kg
Review » Asus Vivobook 15 F512DA Laptop Review: AMD Ryzen 3 for $400
Asus M509DA-EJ153T: AMD Ryzen 3 3200U, 15.60", 1.8 kg
Review » Asus M509DA Review: Slow Speed WiFi in Ryzen 3 Notebook
Lenovo Ideapad S145-15API 81UT002XGE: AMD Athlon 300U, 15.60", 1.9 kg
Review » Lenovo IdeaPad S145-15API Laptop Review: An affordable office laptop with an AMD Athlon APU
Lenovo IdeaPad 330-15ARR-81D2005JGE: AMD Ryzen 3 2200U, 15.60", 2.2 kg
Review » Lenovo IdeaPad 330-15ARR (Ryzen 3 2200U, Vega 3) Laptop Review
Dell Inspiron 15 5575-98MH4: AMD Ryzen 3 2200U, 15.60", 2.1 kg
Review » Dell Inspiron 15 5575 (Ryzen 3 2200U, Vega 3) Laptop Review
Acer Aspire 3 A315-41-R7BM: AMD Ryzen 3 2200U, 15.60", 2.4 kg
Review » Acer Aspire 3 A315-41 (Ryzen 3 2200U, Vega 3, SSD, FHD) Laptop Review
HP Chromebook 14b-nb0004ns: AMD Ryzen 3 3250U, 14.00", 1.5 kg
External Review » HP Chromebook 14b-nb0004ns
HP 15s-eq1040ns: AMD 3020e, 15.60", 1.7 kg
External Review » HP 15s-eq1040ns
Lenovo IdeaPad 1 14ADA7, AMD 3020e: AMD 3020e, 14.00", 1.4 kg
External Review » Lenovo IdeaPad 1 14ADA7, AMD 3020e
HP 255 G8, AMD 3020e: AMD 3020e, 15.60", 1.7 kg
External Review » HP 255 G8, AMD 3020e
Lenovo IdeaPad 1 15ADA7, AMD 3020e: AMD 3020e, 15.60", 1.6 kg
External Review » Lenovo IdeaPad 1 15ADA7, AMD 3020e
Asus ExpertBook L1 L1401CDA-EK0457R: AMD Ryzen 3 3250U, 14.00", 1.5 kg
External Review » Asus ExpertBook L1 L1401CDA-EK0457R
Acer Chromebook Spin 514 CP514-1H-R0KA: AMD Ryzen 3 3250U, 14.00", 1.7 kg
External Review » Acer Chromebook Spin 514 CP514-1H-R0KA
HP 14s-fq0009ns: AMD 3020e, 14.00", 1.5 kg
External Review » HP 14s-fq0009ns
Acer Chromebook Spin 514 CP514-1H-R7EY: unknown, 14.00", 1.7 kg
External Review » Acer Chromebook Spin 514 CP514-1H-R7EY
Acer Chromebook Spin 514 CP514-3H-R2D2: AMD Ryzen 3 5125C, 14.00", 1.5 kg
External Review » Acer Chromebook Spin 514 CP514-3H-R2D2
HP 15s-eq1154ns: AMD 3020e, 15.60", 1.7 kg
External Review » HP 15s-eq1154ns
HP 15s-eq1156ur: AMD Athlon Gold 3150U, 15.60", 1.7 kg
External Review » HP 15s-eq1156ur
Asus Chromebook Flip CM1400FXA-EC0021: AMD 3015Ce, 14.00", 1.7 kg
External Review » Asus Chromebook Flip CM1400FXA-EC0021
HP Chromebook 14b-na0004ns: unknown, 14.00", 1.5 kg
External Review » HP Chromebook 14b-na0004ns
Acer Aspire 3 A314-22-R9MH: AMD Ryzen 3 3250U, 14.00", 1.9 kg
External Review » Acer Aspire 3 A314-22-R9MH
HP 15s-eq1035ns: AMD 3020e, 15.60", 1.7 kg
External Review » HP 15s-eq1035ns
Lenovo IdeaPad 1 14ADA05-82GW003JGE: AMD Athlon Silver 3050e, 14.00", 1.4 kg
External Review » Lenovo IdeaPad 1 14ADA05-82GW003JGE
Acer Chromebook Spin 514 CP514-1H-R22Q: unknown, 14.00", 1.7 kg
External Review » Acer Chromebook Spin 514 CP514-1H-R22Q
Asus VivoBook 17 M712-WH34: AMD Ryzen 3 3250U, 17.30", 2.3 kg
External Review » Asus VivoBook 17 M712-WH34
Asus D515DA-BR638: AMD Ryzen 3 3250U, 15.60", 1.8 kg
External Review » Asus D515DA-BR638
Lenovo IdeaPad 3 15ADA05-81W10094US: AMD Ryzen 3 3250U, 15.60", 1.9 kg
External Review » Lenovo IdeaPad 3 15ADA05-81W10094US
Lenovo V14 ADA-82C6009GSP: AMD 3020e, 14.00", 1.6 kg
External Review » Lenovo V14 ADA-82C6009GSP
HP 14s-fq0007ns: AMD 3020e, 14.00", 1.5 kg
External Review » HP 14s-fq0007ns
HP Stream 14s-fq0005ns: AMD 3020e, 14.00", 1.5 kg
External Review » HP Stream 14s-fq0005ns
Lenovo IdeaPad 3 15ADA05-CWSP: AMD 3020e, 15.60", 1.9 kg
External Review » Lenovo IdeaPad 3 15ADA05-CWSP
Lenovo IdeaPad 3 14ADA05-81W000CLMH: AMD 3020e, 14.00", 1.6 kg
External Review » Lenovo IdeaPad 3 14ADA05-81W000CLMH
HP 14s-fq0002ns: AMD 3020e, 14.00", 1.5 kg
External Review » HP 14s-fq0002ns
Dell Inspiron 15 3505-C1DY0: AMD Ryzen 3 3250U, 15.60", 2 kg
External Review » Dell Inspiron 15 3505-C1DY0
Lenovo V15-ADA-82C7007SGE: AMD 3020e, 15.60", 1.9 kg
External Review » Lenovo V15-ADA-82C7007SGE
Asus Vivobook 15 F512DA-SH31: AMD Ryzen 3 3200U, 15.60", 1.8 kg
External Review » Asus Vivobook 15 F512DA-SH31
Lenovo IdeaPad 3 15ADA05-81W100DHGE: AMD 3020e, 15.60", 1.9 kg
External Review » Lenovo IdeaPad 3 15ADA05-81W100DHGE
Lenovo IdeaPad 3 15ADA05-81W100KHSP: AMD 3020e, 15.60", 1.9 kg
External Review » Lenovo IdeaPad 3 15ADA05-81W100KHSP
HP 15s-eq1026ns: AMD Ryzen 3 3250U, 15.60", 1.7 kg
External Review » HP 15s-eq1026ns
Lenovo IdeaPad 3 14ADA05: AMD 3020e, 14.00", 1.6 kg
External Review » Lenovo IdeaPad 3 14ADA05
HP 15s-eq1014ns: AMD Ryzen 3 3250U, 15.60", 1.7 kg
External Review » HP 15s-eq1014ns
HP 14s-dk1003au: AMD Athlon Gold 3150U, 14.00", 1.5 kg
External Review » HP 14s-dk1003au
HP 15s-eq0803ng: AMD Ryzen 3 3200U, 15.60", 1.7 kg
External Review » HP 15s-eq0803ng
Asus M509DA-BR241: AMD Ryzen 3 3200U, 15.60", 1.9 kg
External Review » Asus M509DA-BR241
Lenovo Ideapad S145-14API-81UV0000UK: AMD Athlon 300U, 14.00", 1.6 kg
External Review » Lenovo Ideapad S145-14API-81UV0000UK
Lenovo Ideapad S340-14API-81NB00D4SP: AMD Ryzen 3 3200U, 14.00", 1.6 kg
External Review » Lenovo Ideapad S340-14API-81NB00D4SP
Asus VivoBook 15 S512DA-BR658T: AMD Ryzen 3 3200U, 15.60"
External Review » Asus VivoBook 15 S512DA-BR658T
Lenovo Ideapad C340-14API 81N600A8GE: AMD Ryzen 3 3200U, 14.00", 1.7 kg
External Review » Lenovo Ideapad C340-14API 81N600A8GE
Lenovo V155-15API 81V5000YGE: AMD Athlon 300U, 15.60", 2.2 kg
External Review » Lenovo V155-15API 81V5000YGE
Lenovo V155-15API-81V50004SP: AMD Ryzen 3 3200U, 15.60", 2.2 kg
External Review » Lenovo V155-15API-81V50004SP
Asus VivoBook D509DA-EJ102T: AMD Ryzen 3 3200U, 15.60", 1.8 kg
External Review » Asus VivoBook D509DA-EJ102T
Lenovo Ideapad S340-15API-81NC007QSP: AMD Ryzen 3 3200U, 15.60", 1.8 kg
External Review » Lenovo Ideapad S340-15API-81NC007QSP
Lenovo Ideapad S145-15API-81UT00DYMB: AMD Ryzen 3 3200U, 15.60", 1.9 kg
External Review » Lenovo Ideapad S145-15API-81UT00DYMB
HP 15-db1000ng: AMD Ryzen 3 3200U, 15.60", 1.9 kg
External Review » HP 15-db1000ng
Asus M509DA-BR151: AMD Ryzen 3 3200U, 15.60", 1.9 kg
External Review » Asus M509DA-BR151
HP 15s-eq0012ns: unknown, 15.60", 1.8 kg
External Review » HP 15s-eq0012ns
Asus VivoBook 14 D409DA, Ryzen 3-3200U: AMD Ryzen 3 3200U, 14.00", 1.5 kg
External Review » Asus VivoBook 14 D409DA, Ryzen 3-3200U
Acer Aspire 3 A315-42-R1BU: AMD Ryzen 3 3200U, 15.60", 1.9 kg
External Review » Acer Aspire 3 A315-42-R1BU
Asus D509DA-BR128: AMD Ryzen 3 3200U, 15.60", 1.9 kg
External Review » Asus D509DA-BR128
HP 15-db1002ns: AMD Ryzen 3 3200U, 15.60", 1.8 kg
External Review » HP 15-db1002ns
Lenovo Ideapad S340-14API-81NB0045GE: AMD Ryzen 3 3200U, 14.00", 1.7 kg
External Review » Lenovo Ideapad S340-14API-81NB0045GE
HP 14-dk0014ns: AMD Ryzen 3 3200U, 14.00", 1.5 kg
External Review » HP 14-dk0014ns
Asus VivoBook S512DA-BR608: AMD Ryzen 3 3200U, 15.60", 1.6 kg
External Review » Asus VivoBook S512DA-BR608
Acer Swift 3 SF314-41-R4J1: AMD Ryzen 3 3200U, 14.00", 1.5 kg
External Review » Acer Swift 3 SF314-41-R4J1
Acer Aspire 5 A515-43-R19L: AMD Ryzen 3 3200U, 15.60", 1.8 kg
External Review » Acer Aspire 5 A515-43-R19L
HP 14s-dk0001ax: AMD Ryzen 3 3200U, 14.00", 1.5 kg
External Review » HP 14s-dk0001ax
Lenovo Yoga 530-14ARR-81H9005SMX: AMD Ryzen 3 2200U, 14.00", 1.6 kg
External Review » Lenovo Yoga 530-14ARR-81H9005SMX
Acer Swift 3 SF314-41-R80D: AMD Athlon 300U, 14.00", 1.5 kg
External Review » Acer Swift 3 SF314-41-R80D
HP 15-db1013ns: AMD Ryzen 3 3200U, 15.60", 1.8 kg
External Review » HP 15-db1013ns
HP 15-db1002ng: AMD Ryzen 3 3200U, 15.60", 1.8 kg
External Review » HP 15-db1002ng
HP 15-db0145ur: AMD Ryzen 3 2200U, 15.60", 2.1 kg
External Review » HP 15-db0145ur
HP 14-dk0001ns: AMD Ryzen 3 3200U, 14.00", 1.5 kg
External Review » HP 14-dk0001ns
Acer Aspire 3 A315-41-R84K: AMD Ryzen 3 2200U, 15.60", 2.3 kg
External Review » Acer Aspire 3 A315-41-R84K
HP 15-db0025ns: AMD Ryzen 3 2200U, 15.60", 1.8 kg
External Review » HP 15-db0025ns
Lenovo IdeaPad 330-15ARR-81D2005JGE: AMD Ryzen 3 2200U, 15.60", 2.2 kg
External Review » Lenovo IdeaPad 330-15ARR-81D2005JGE
Lenovo Yoga 530-14ARR-81H90019SP: AMD Ryzen 3 2200U, 14.00", 1.7 kg
External Review » Lenovo Yoga 530-14ARR-81H90019SP
Lenovo Ideapad 530S-14ARR-81H1001RGE: AMD Ryzen 3 2200U, 14.00", 1.5 kg
External Review » Lenovo Ideapad 530S-14ARR-81H1001RGE
Lenovo Ideapad 330-15ARR-81D2007MSP: AMD Ryzen 3 2200U, 15.60", 2.2 kg
External Review » Lenovo Ideapad 330-15ARR-81D2007MSP
Lenovo Yoga 530-14ARR-81H90025PB: AMD Ryzen 3 2200U, 14.00", 1.7 kg
External Review » Lenovo Yoga 530-14ARR-81H90025PB
HP 15-db0027NS: AMD Ryzen 3 2200U, 15.60", 2.1 kg
External Review » HP 15-DB0027NS
Asus VivoBook 15 X505ZA: AMD Ryzen 3 2200U, 15.60", 1.7 kg
External Review » Asus VivoBook 15 X505ZA
HP 15-db0401ng: AMD Ryzen 3 2200U, 15.60", 2 kg
External Review » HP 15-db0401ng
Lenovo Ideapad 330S-15ARR-81FB005KSP: AMD Ryzen 3 2200U, 15.60", 1.9 kg
External Review » Lenovo Ideapad 330S-15ARR-81FB005KSP
HP 17-ca0200ng: AMD Ryzen 3 2200U, 17.30", 2.5 kg
External Review » HP 17-ca0200ng
Acer Aspire 3 A315-41-R3AZ: AMD Ryzen 3 2200U, 15.60", 2.1 kg
External Review » Acer Aspire 3 A315-41-R3AZ
HP 17-ca0012ng: AMD Ryzen 3 2200U, 17.30", 2.5 kg
External Review » HP 17-ca0012ng
HP 15-db0034ns: AMD Ryzen 3 2200U, 15.60", 1.8 kg
External Review » HP 15-db0034ns
Dell Inspiron 15 5575-98MH4: AMD Ryzen 3 2200U, 15.60", 2.1 kg
External Review » Dell Inspiron 15 5575-98MH4
Asus Chromebook Flip CM1: AMD 3015Ce, 14.00", 1.7 kg
» Asus Chromebook Flip CM1: A 2-in-1 laptop for the small budget
Lenovo V15-ADA 82C7009SGE: AMD Athlon Gold 3150U, 15.60", 1.9 kg
» Lenovo V15 Gen 2 AMD test: Speed boost on an antique display
Acer Spin 3 SP314-21N-R4GU: AMD Ryzen 3 3250U, 14.00", 1.5 kg
» Acer Spin 3 SP314-21N: No active stylus with the 2-in-1 laptop
HP 255 G7 159P1EA: AMD Ryzen 3 3200U, 15.60", 1.8 kg
» HP 255 G7: Office laptop with poor display quality
Lenovo V15-ADA 82C7009SGE: AMD Athlon Gold 3150U, 15.60", 1.9 kg
» Lenovo V15-ADA: The Athlon Gold CPU makes it usable, but the cheap TN panel renders it unusable
Asus Vivobook 15 F512DA-SH31: AMD Ryzen 3 3200U, 15.60", 1.8 kg
» The Ryzen 3 3200U performs so closely to the Core i3-8145U that any differences are essentially negligible to the target budget user