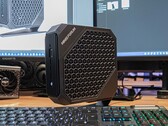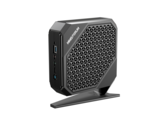


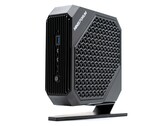
Minisforum Neptune Series HX77G review: The mini gaming PC with an AMD Ryzen 7 7735HS, AMD Radeon RX 6600M and 2x USB4
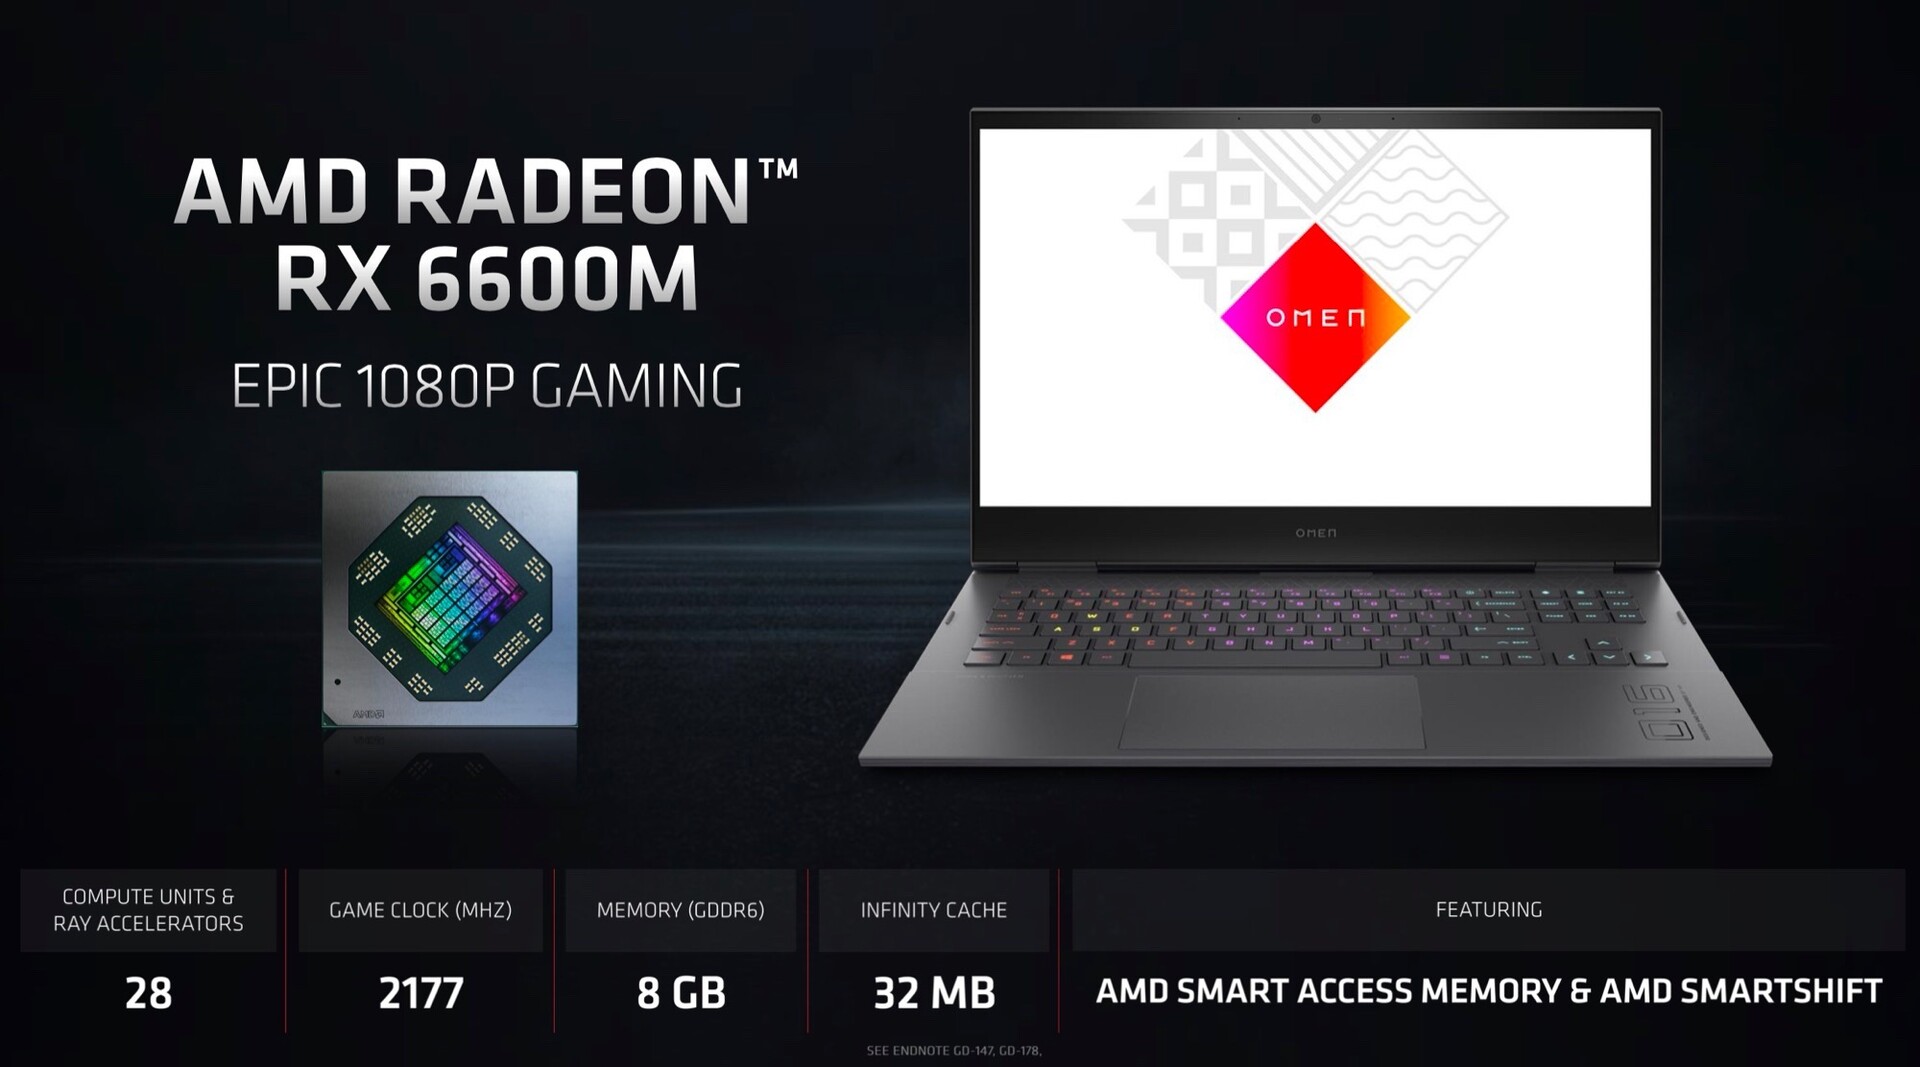
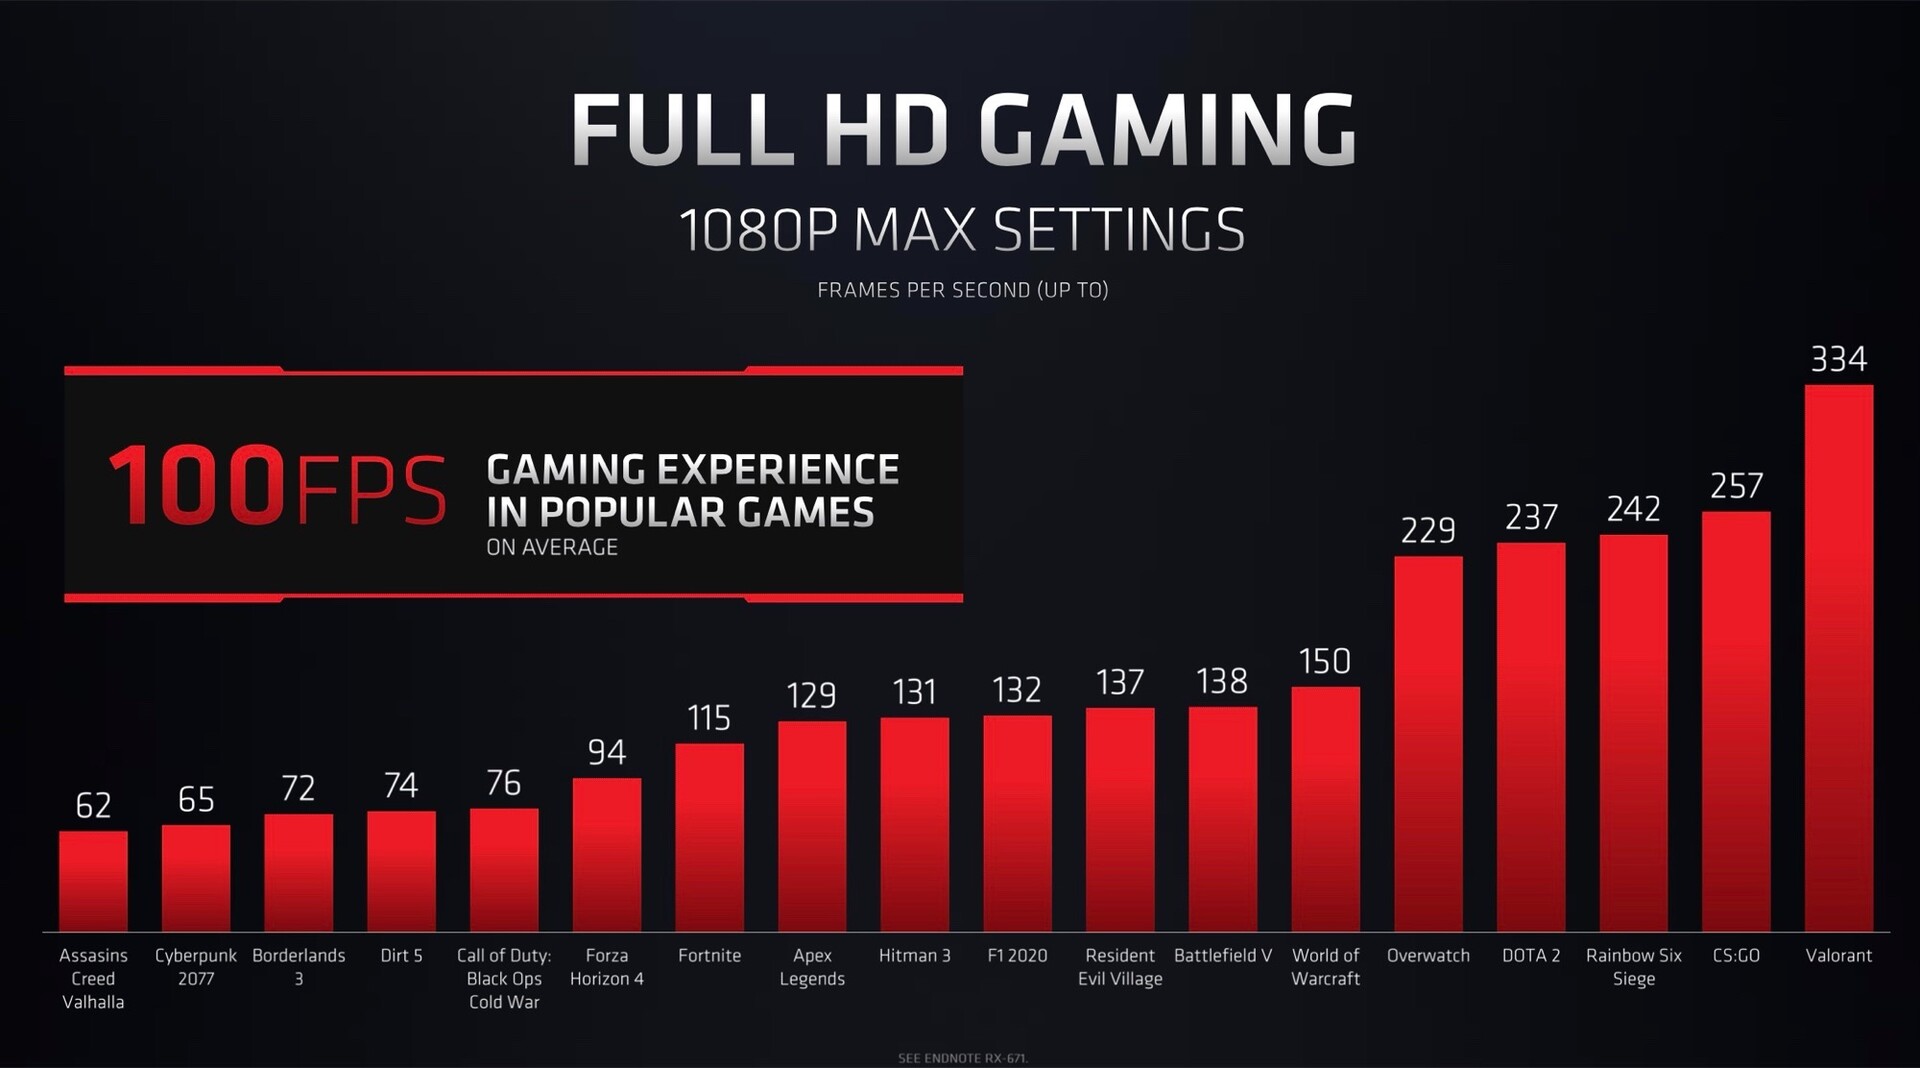
Compact mini PCs with dedicated graphics cards aren't all too widespread at the moment. Nevertheless, Minisforum's Neptune Series HX77G is a compact mini PC with an AMD Ryzen 7 7735HS and an AMD Radeon RX 6600M. We have taken a closer look at this device and have analyzed its performance with the help of a variety of benchmarks and current games.
AMD Ryzen 7 7735HS, Radeon RX 6600M, 1.6 kg