Notebookcheck Logo

Sons of the Forest review: Laptop and desktop benchmarks

An unforgettable experience. Nearly five years after the debut of their surprise hit The Forest, the developers at Canadian studio Endnight Games have released the sequel to the title. Sons of the Forest once again offers an interesting game design that combines open-world exploration and survival horror. Read our benchmark check to find out whether its hardware requirements are just as terrifying.
Sons of the Forest

Technical aspects

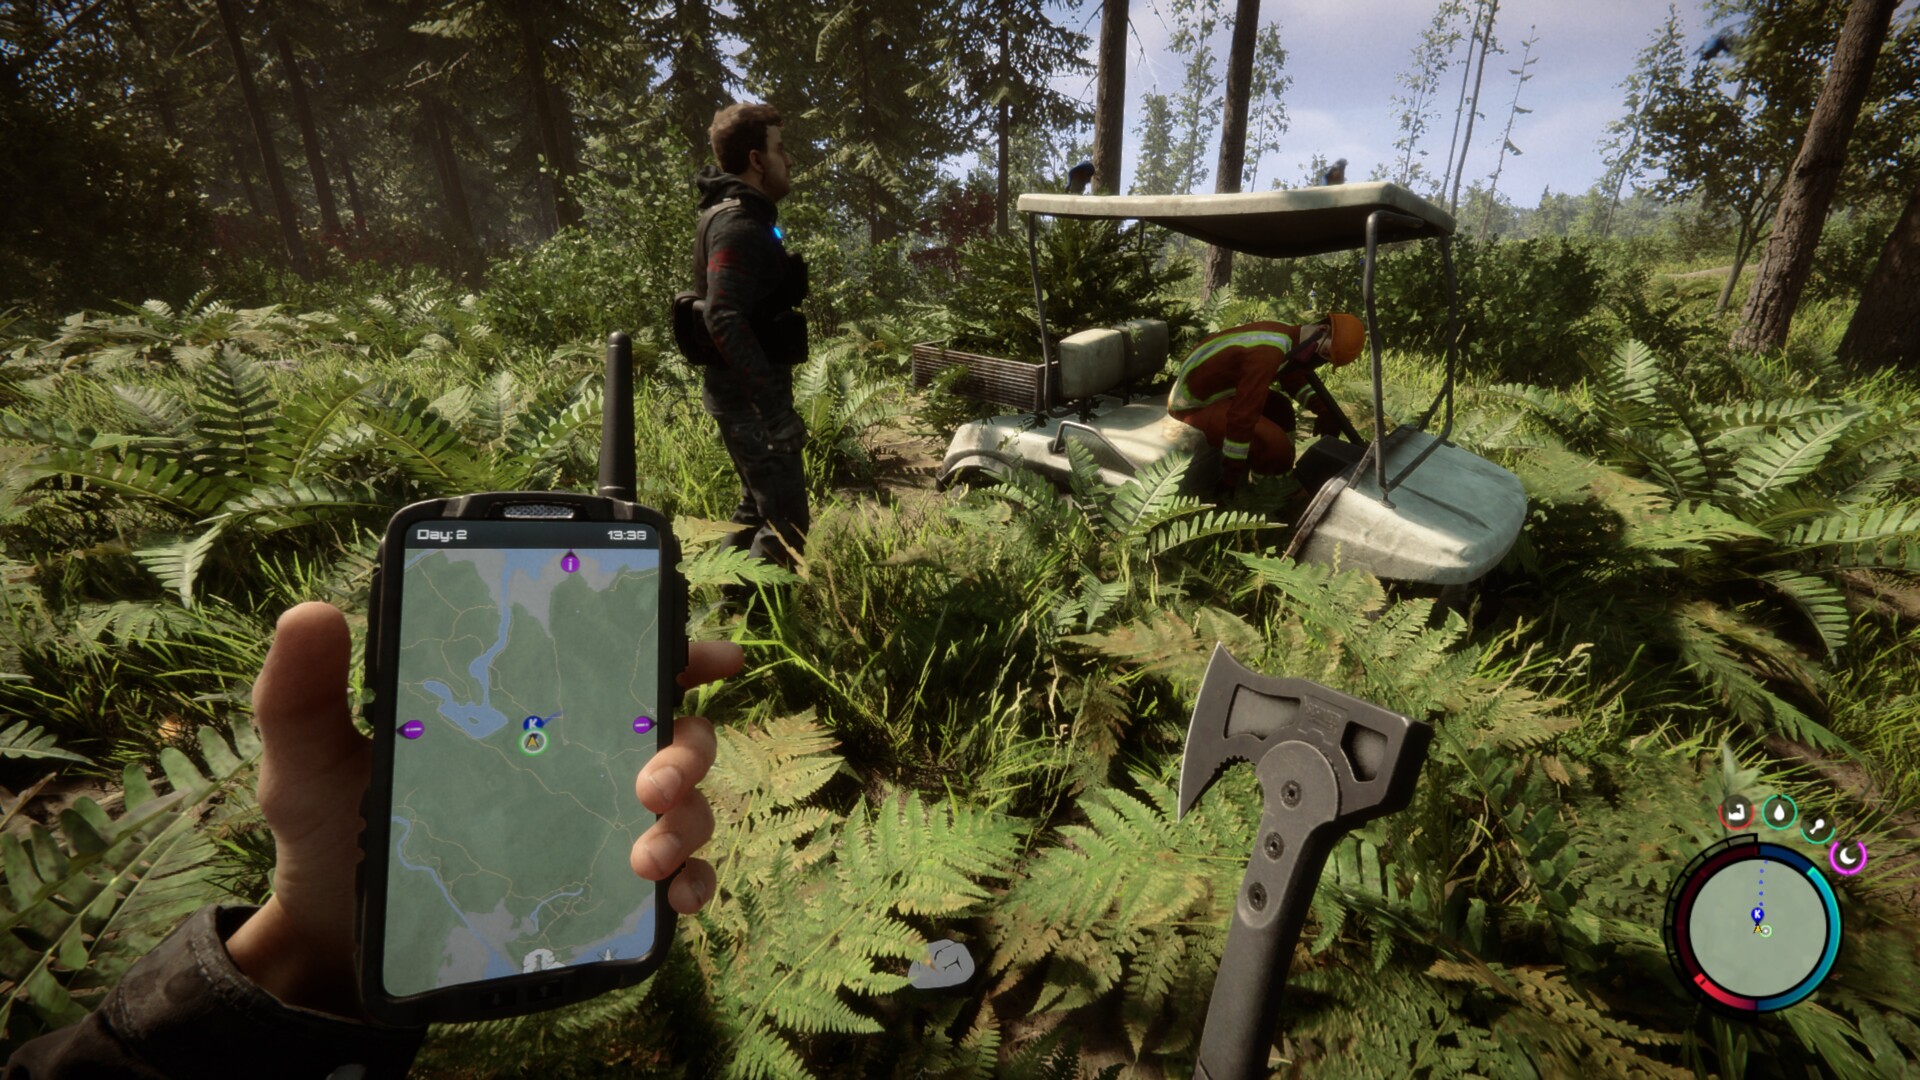
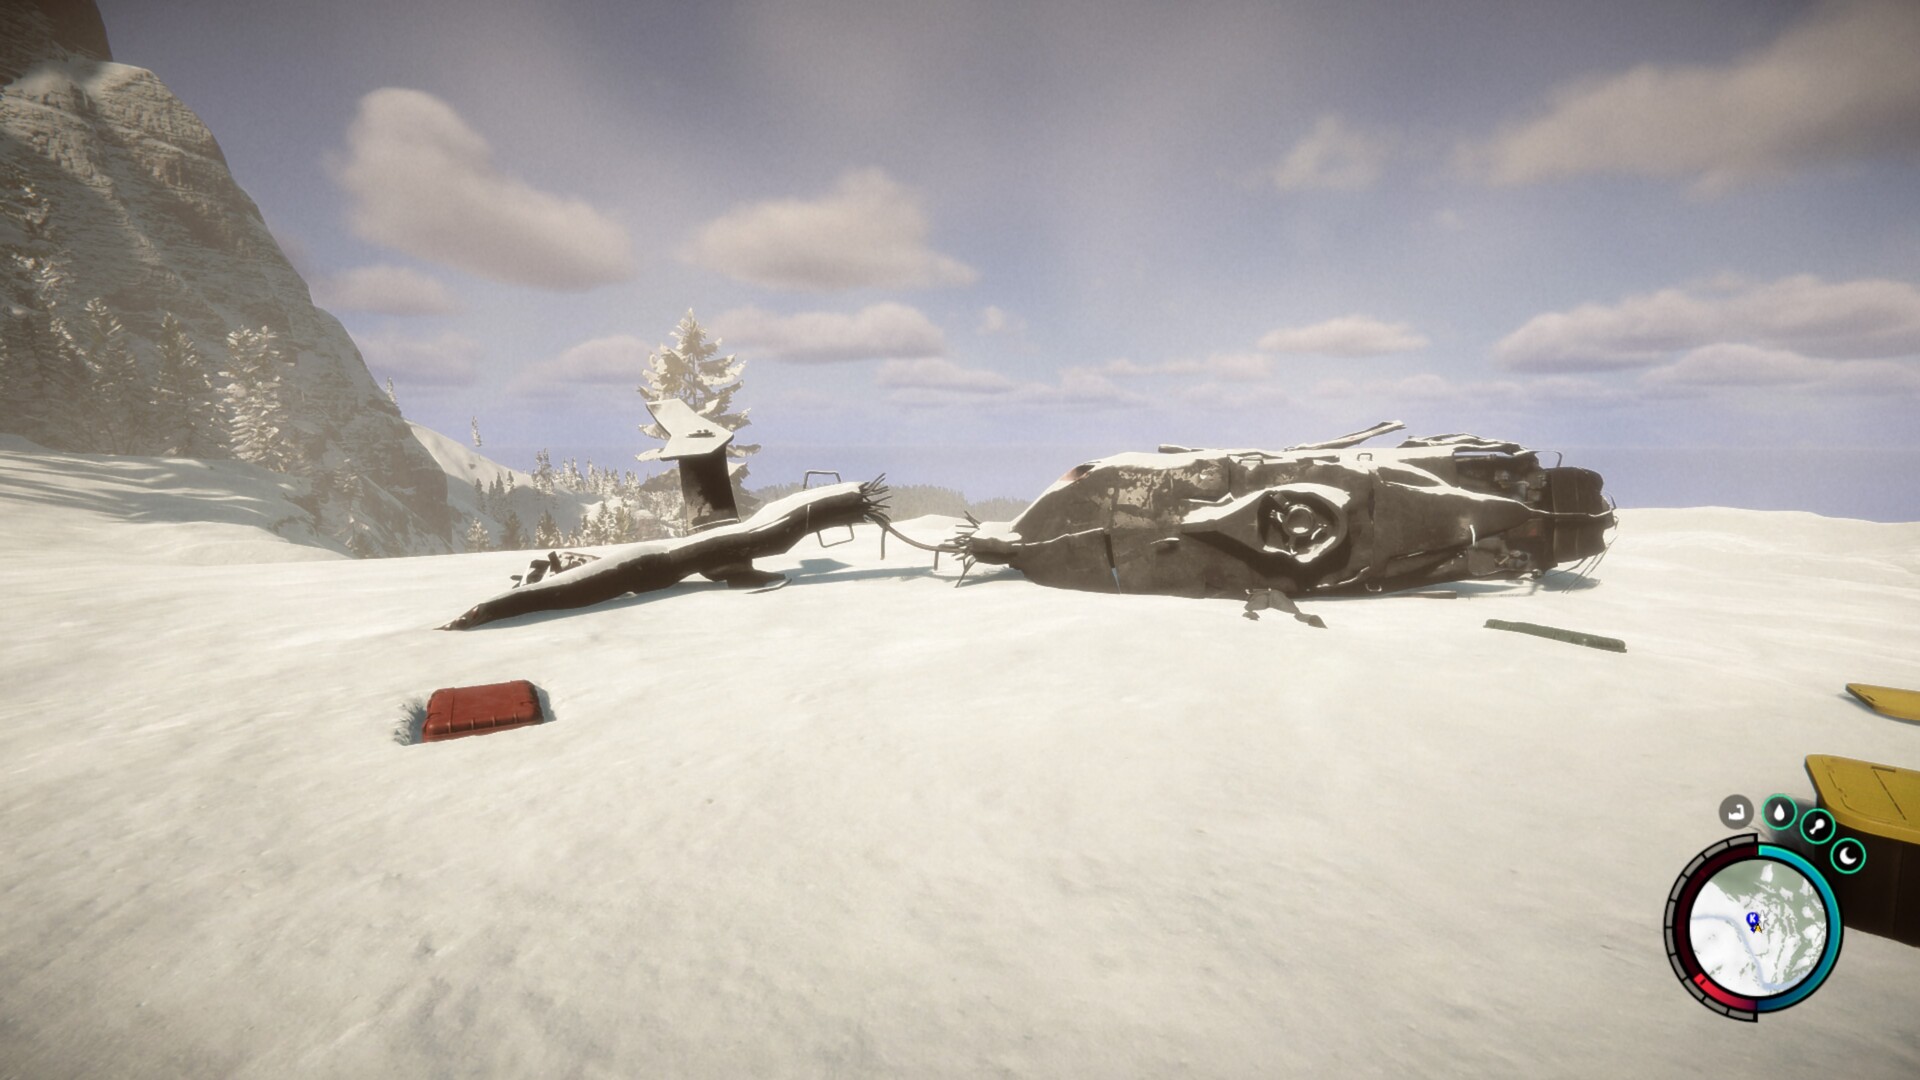
Despite still being in Early Access, Sons of the Forest is already very popular. This is obvious when you look at the countless good reviews it has received on Steam as well as the great success it enjoys amongst the YouTube and Twitch community. We can definitely understand this positive reception. Like many Early Access titles, Sons of the Forest still struggles with various minor hiccups such as stuttering (regardless of how powerful your hardware is), clipping issues and other graphical glitches (e.g. flickering and objects popping in). Nonetheless, the game's graphics is mostly quite impressive.

Sons of the Forest
Sons of the Forest
Sons of the Forest
Sons of the Forest
Sons of the Forest
Sons of the Forest

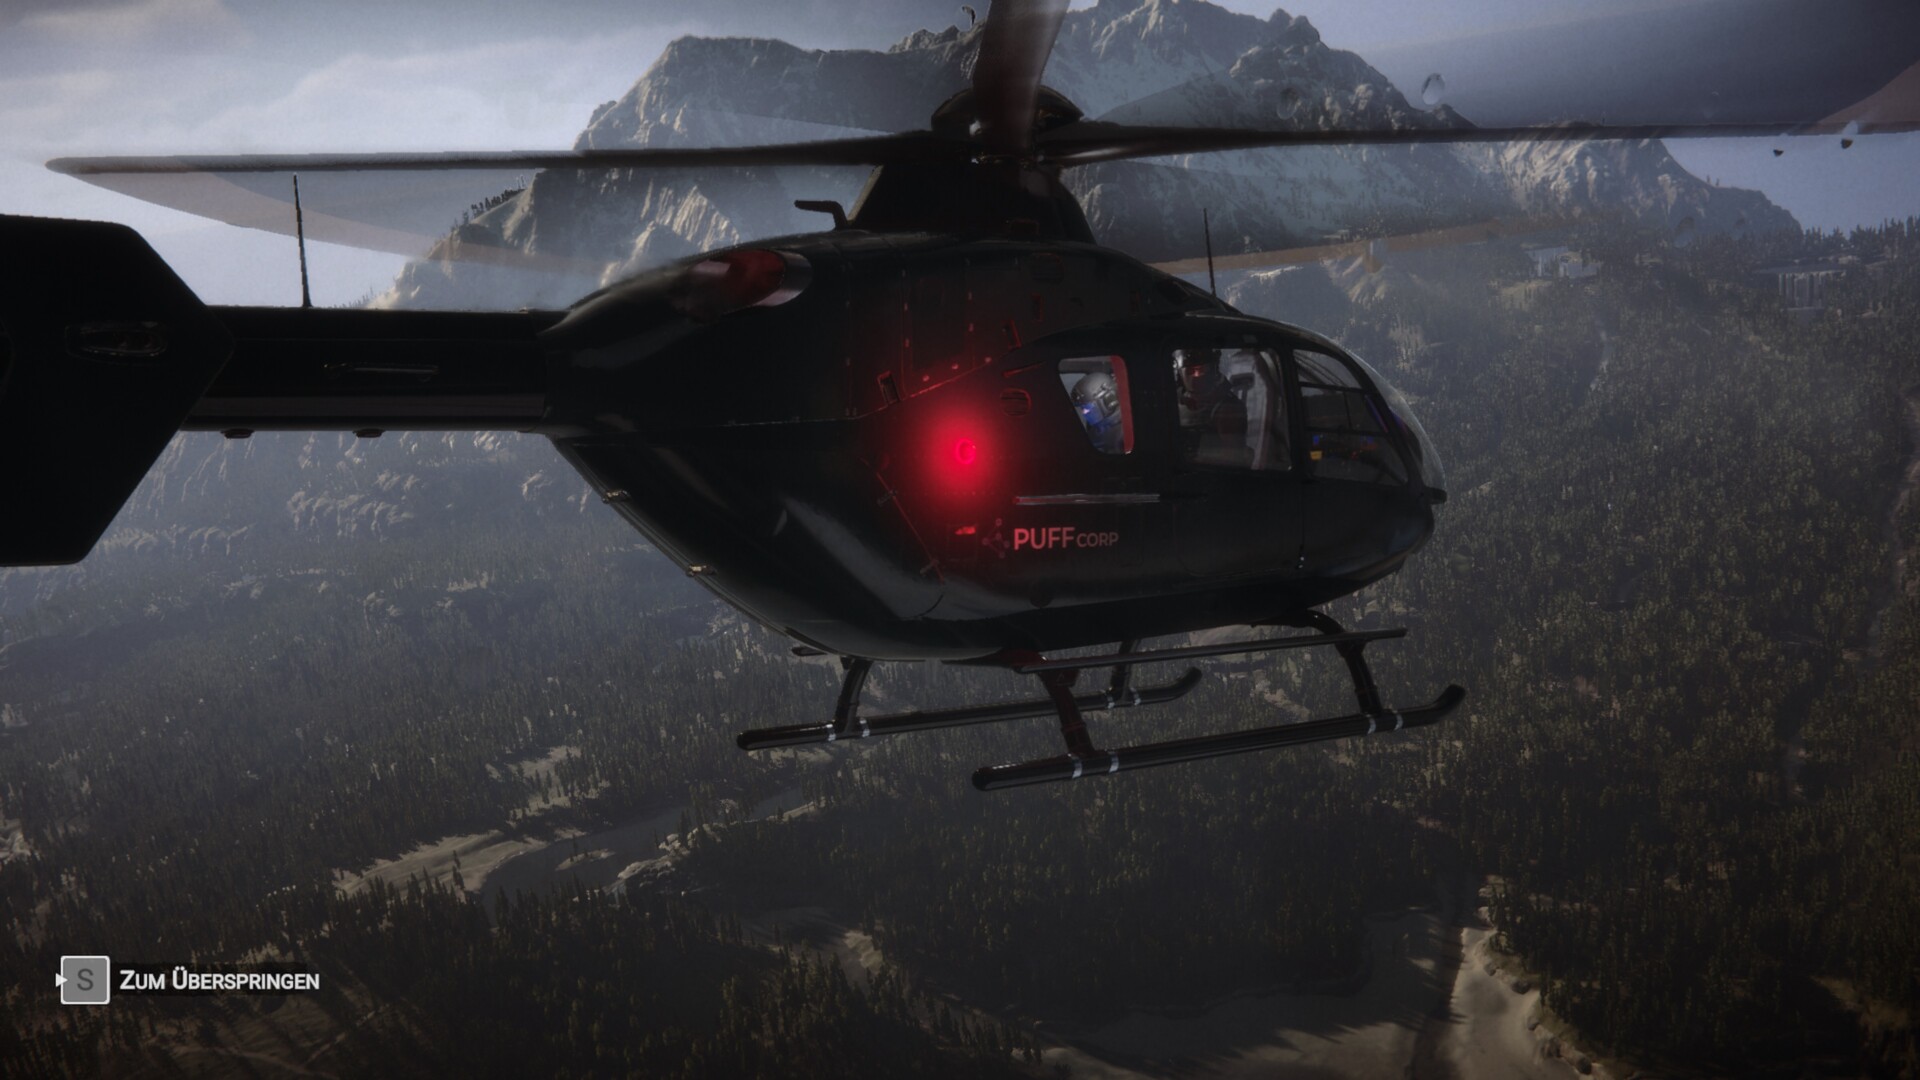
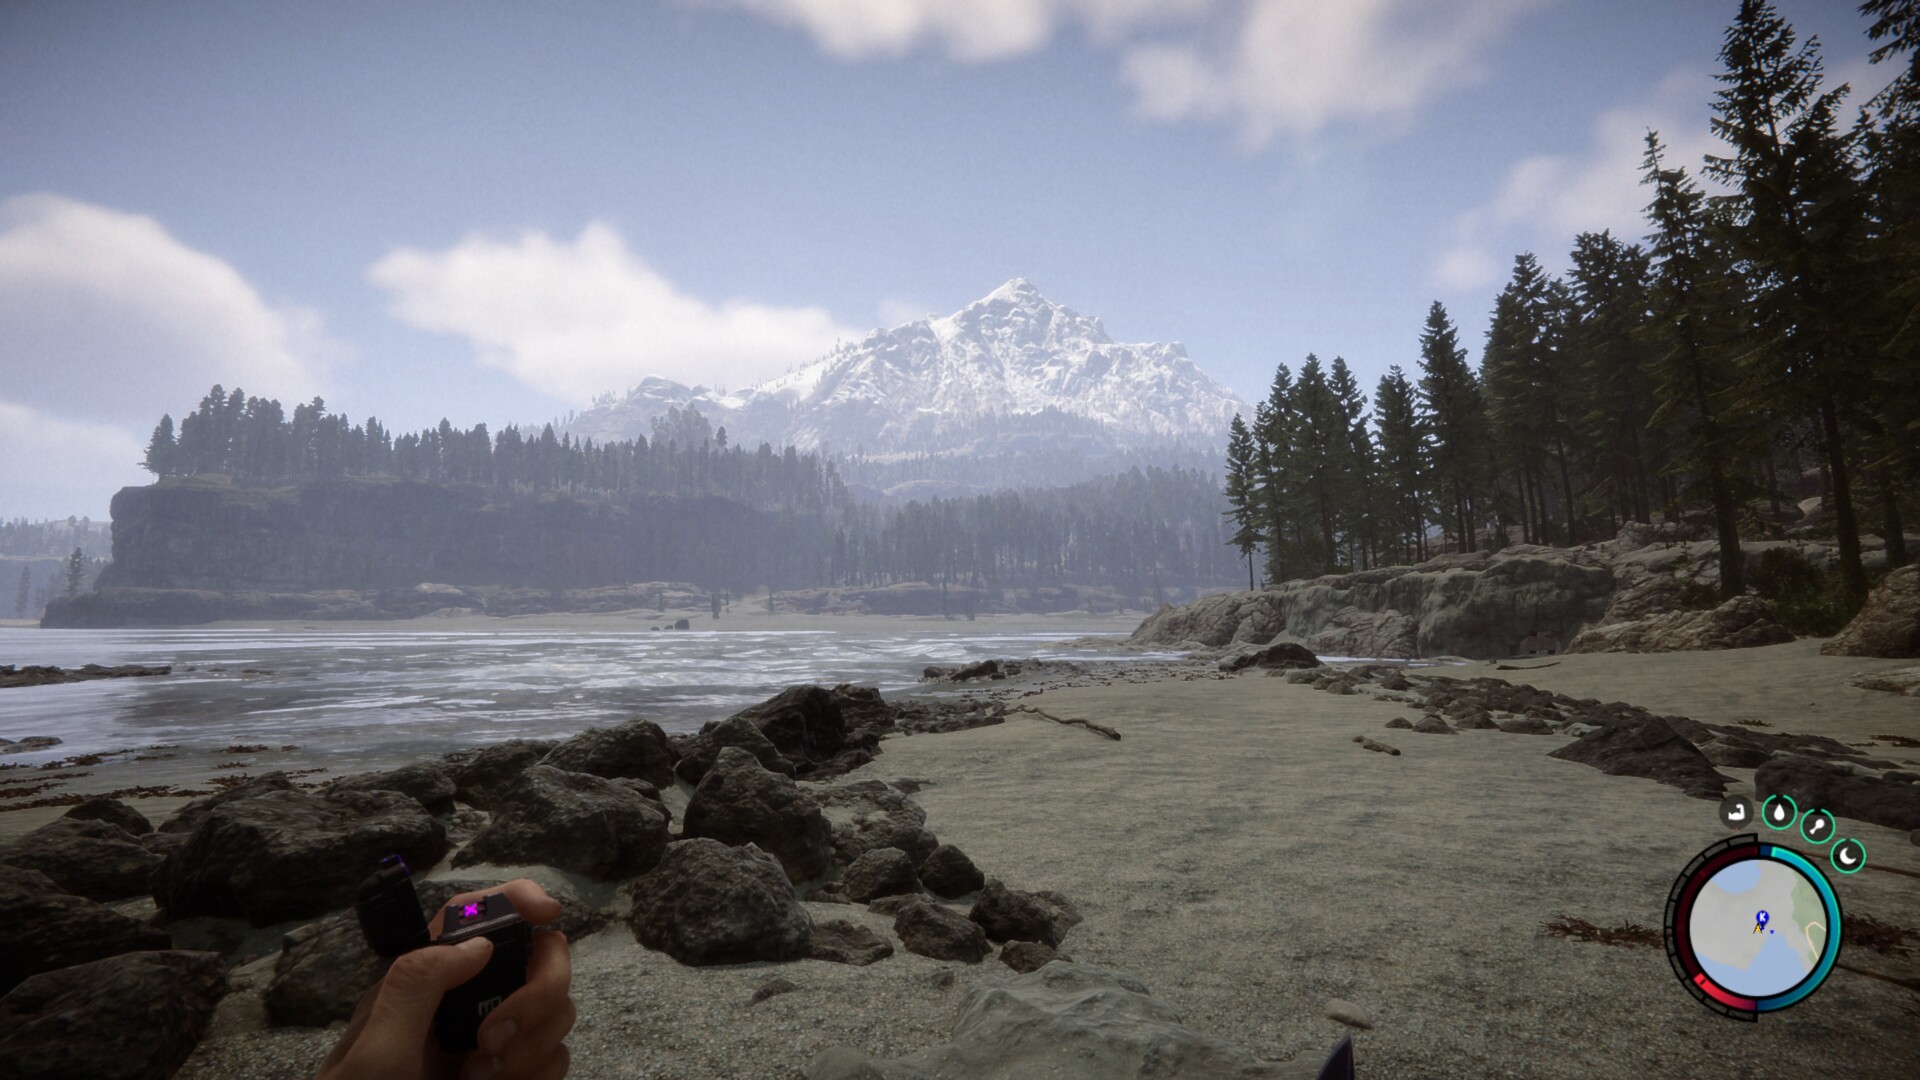
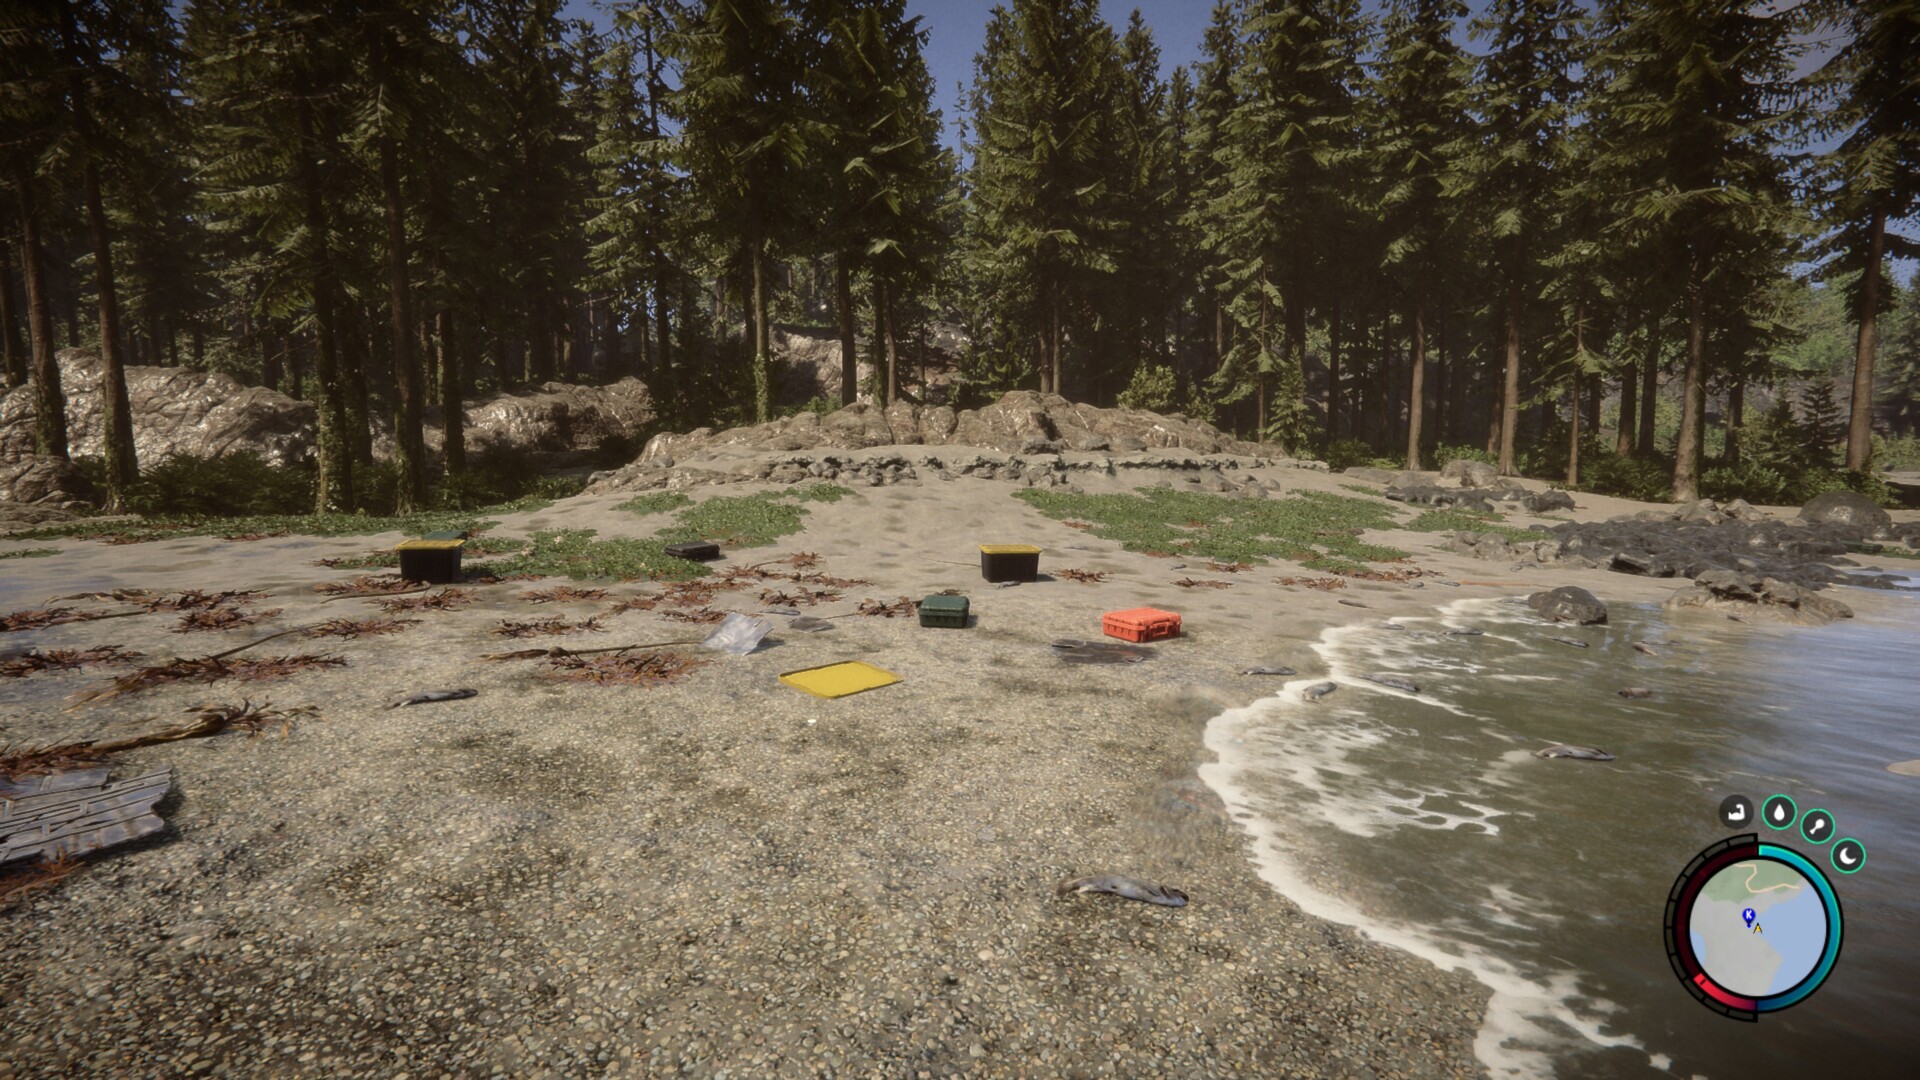
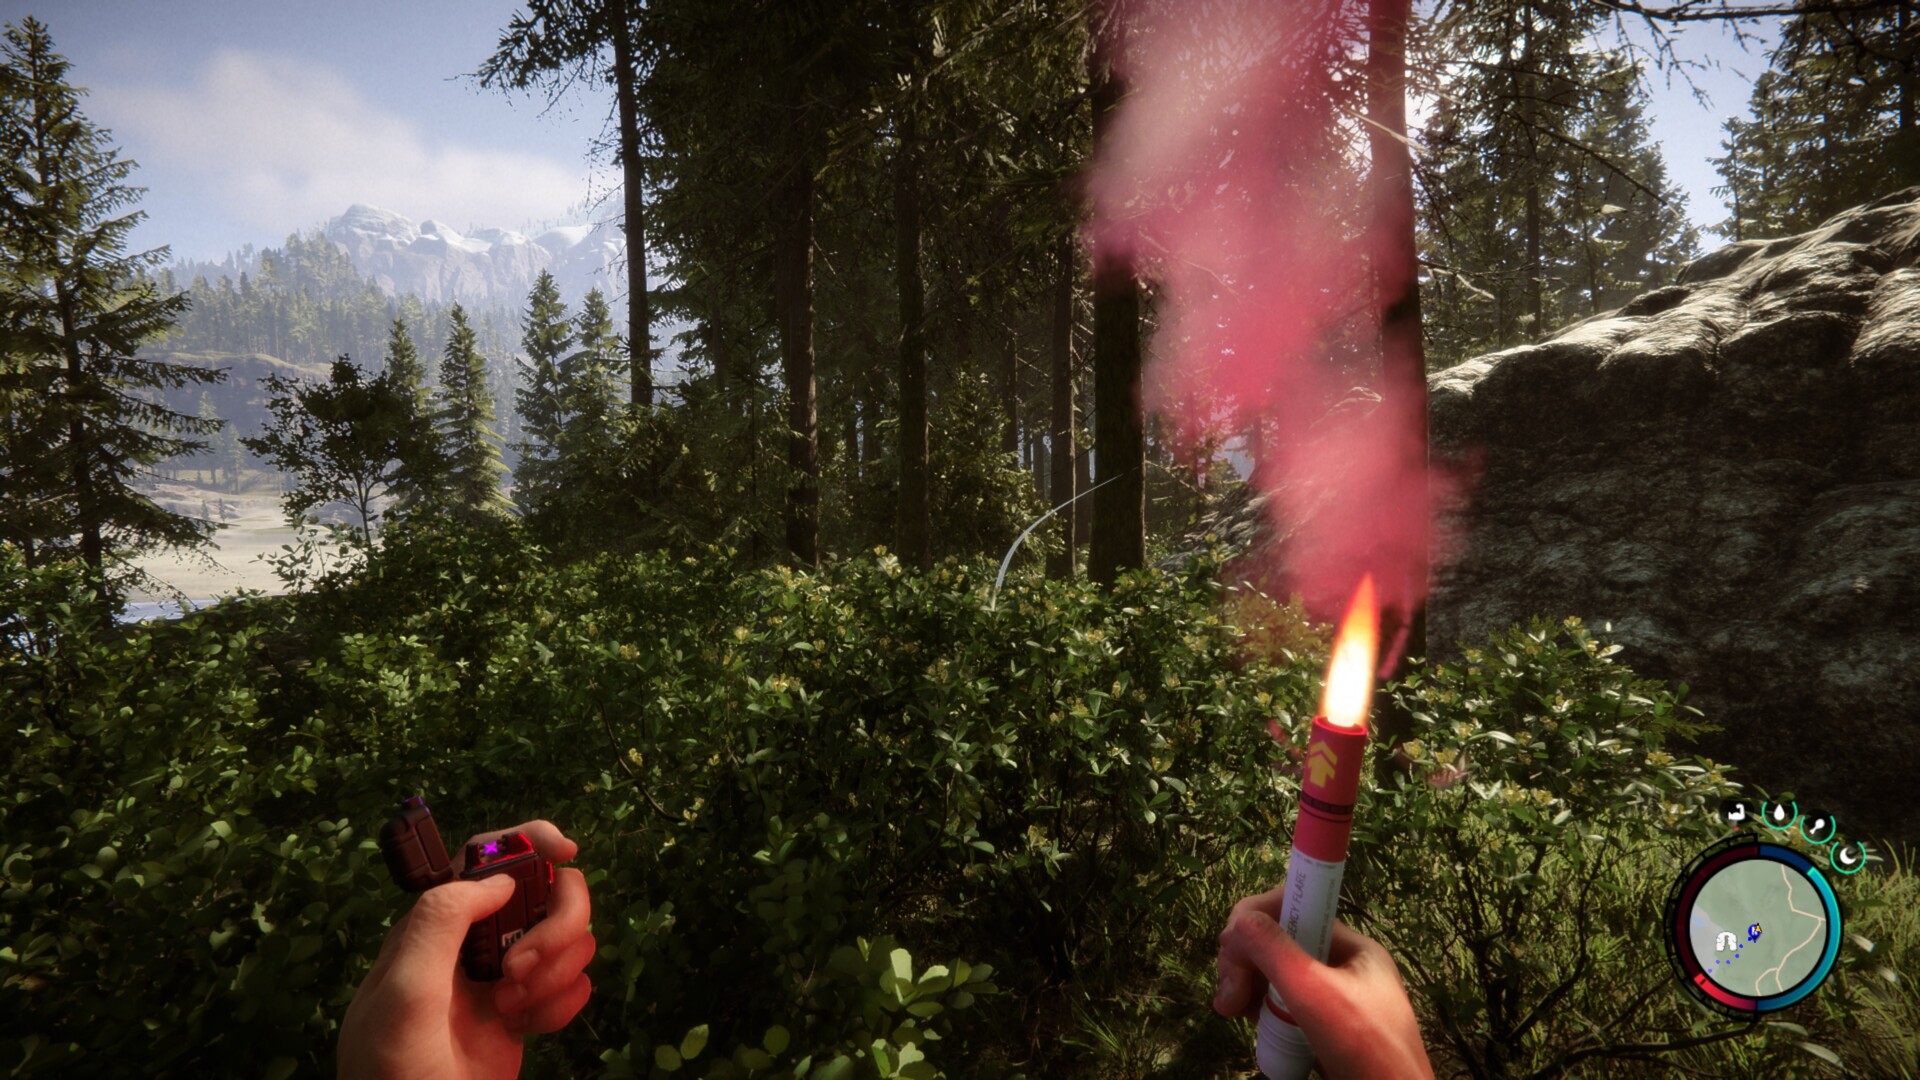
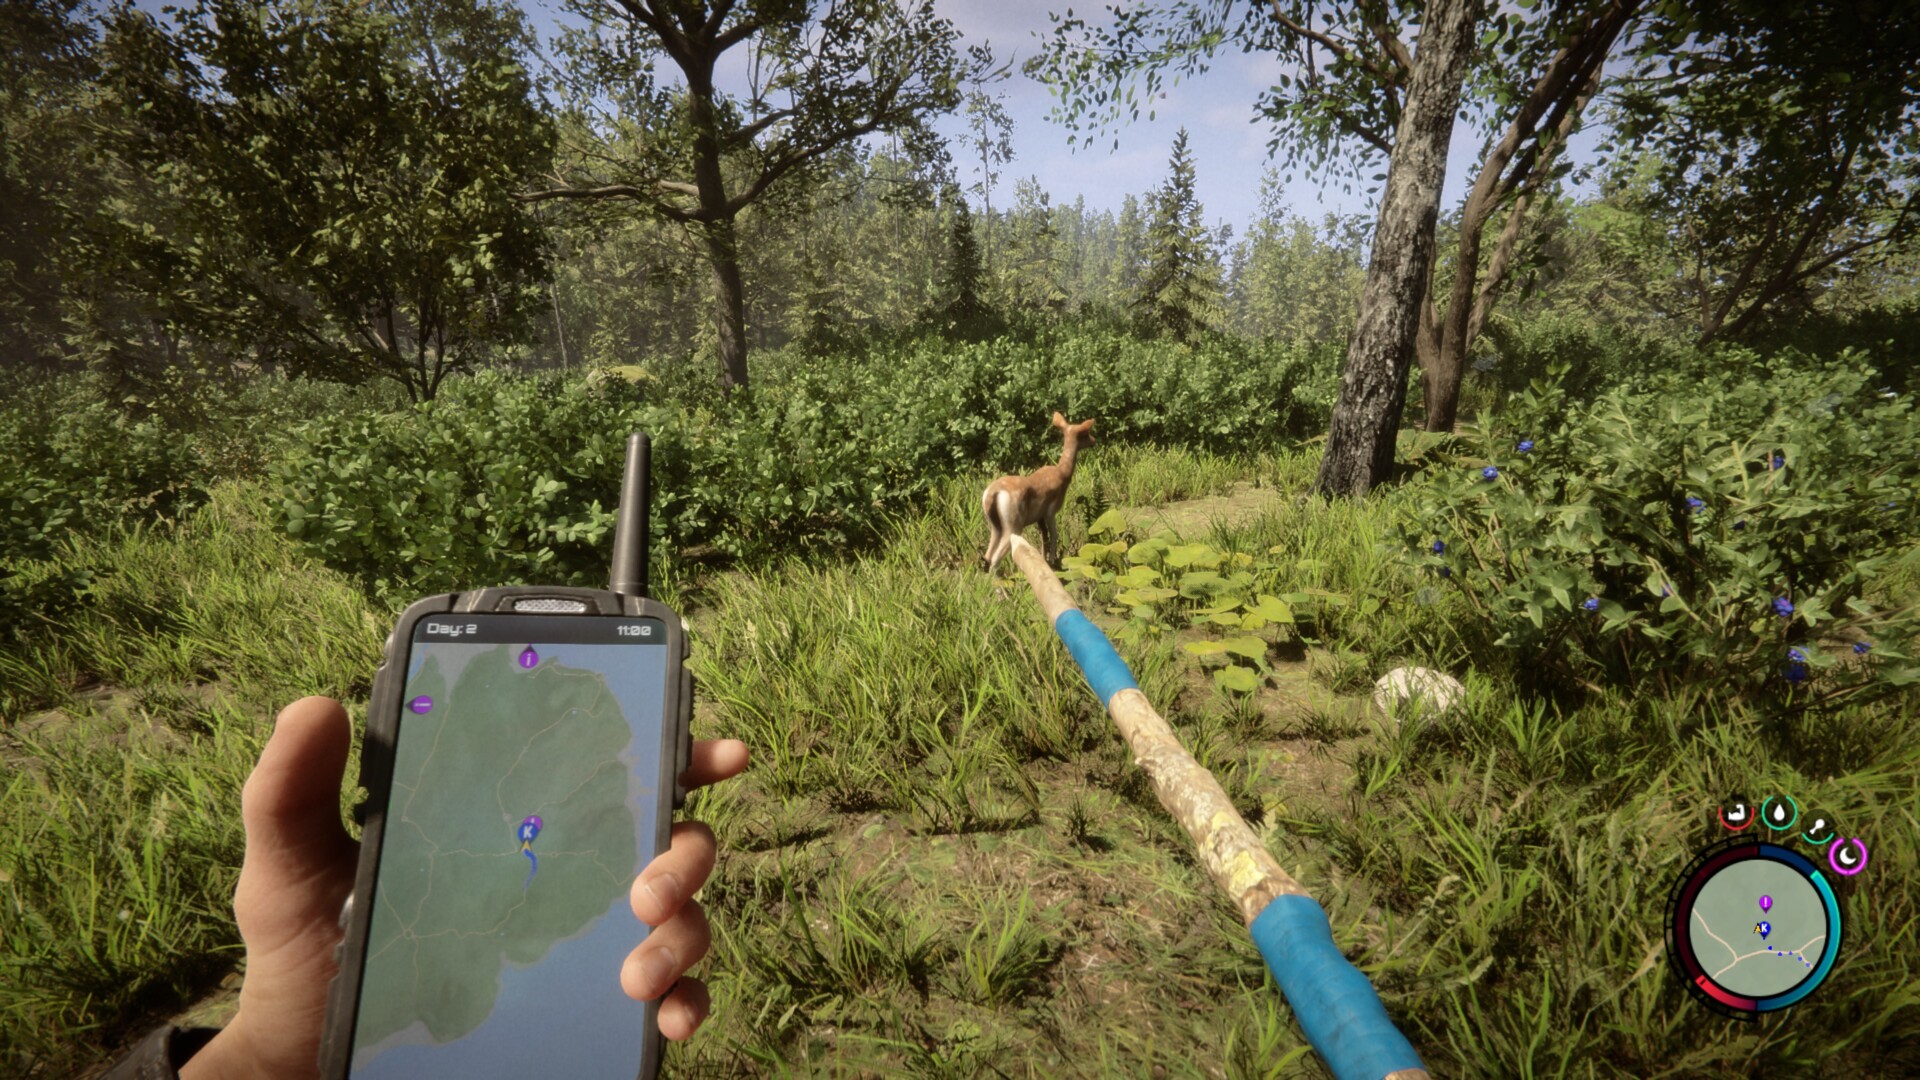
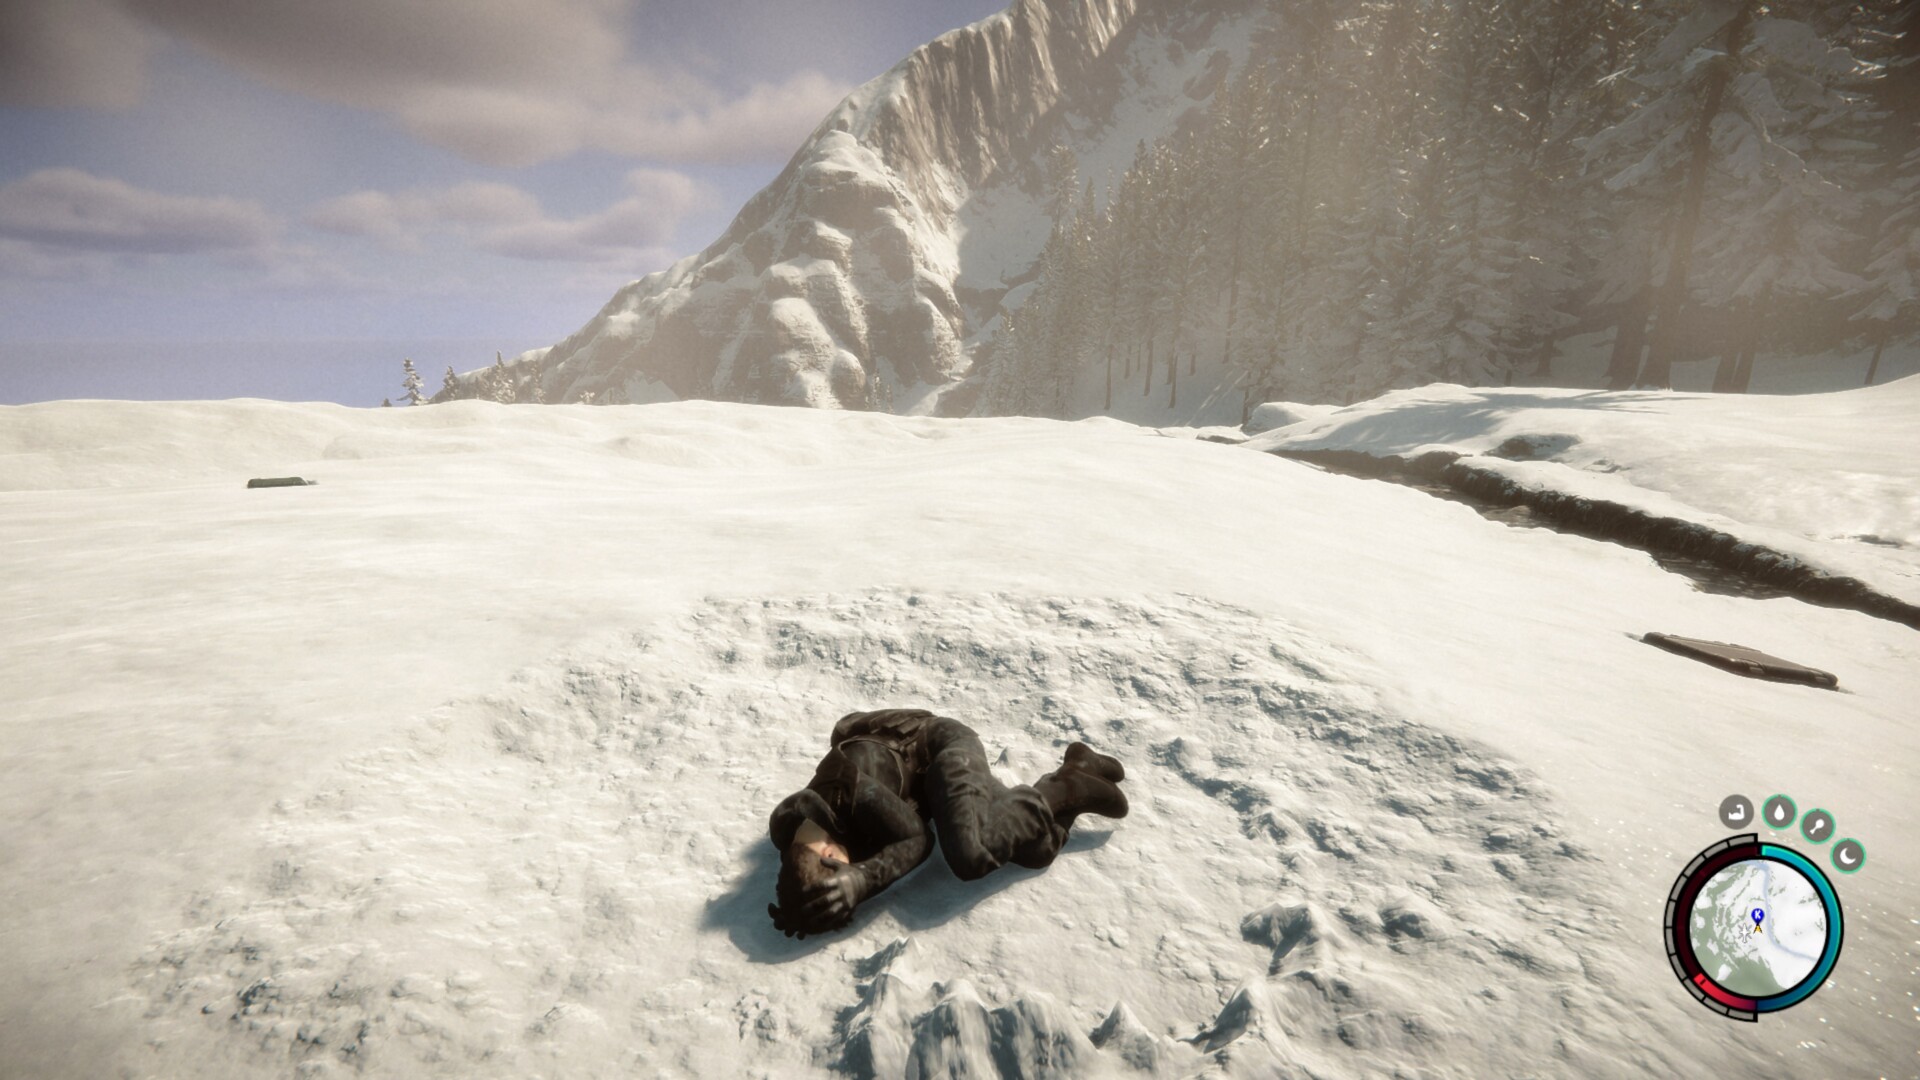
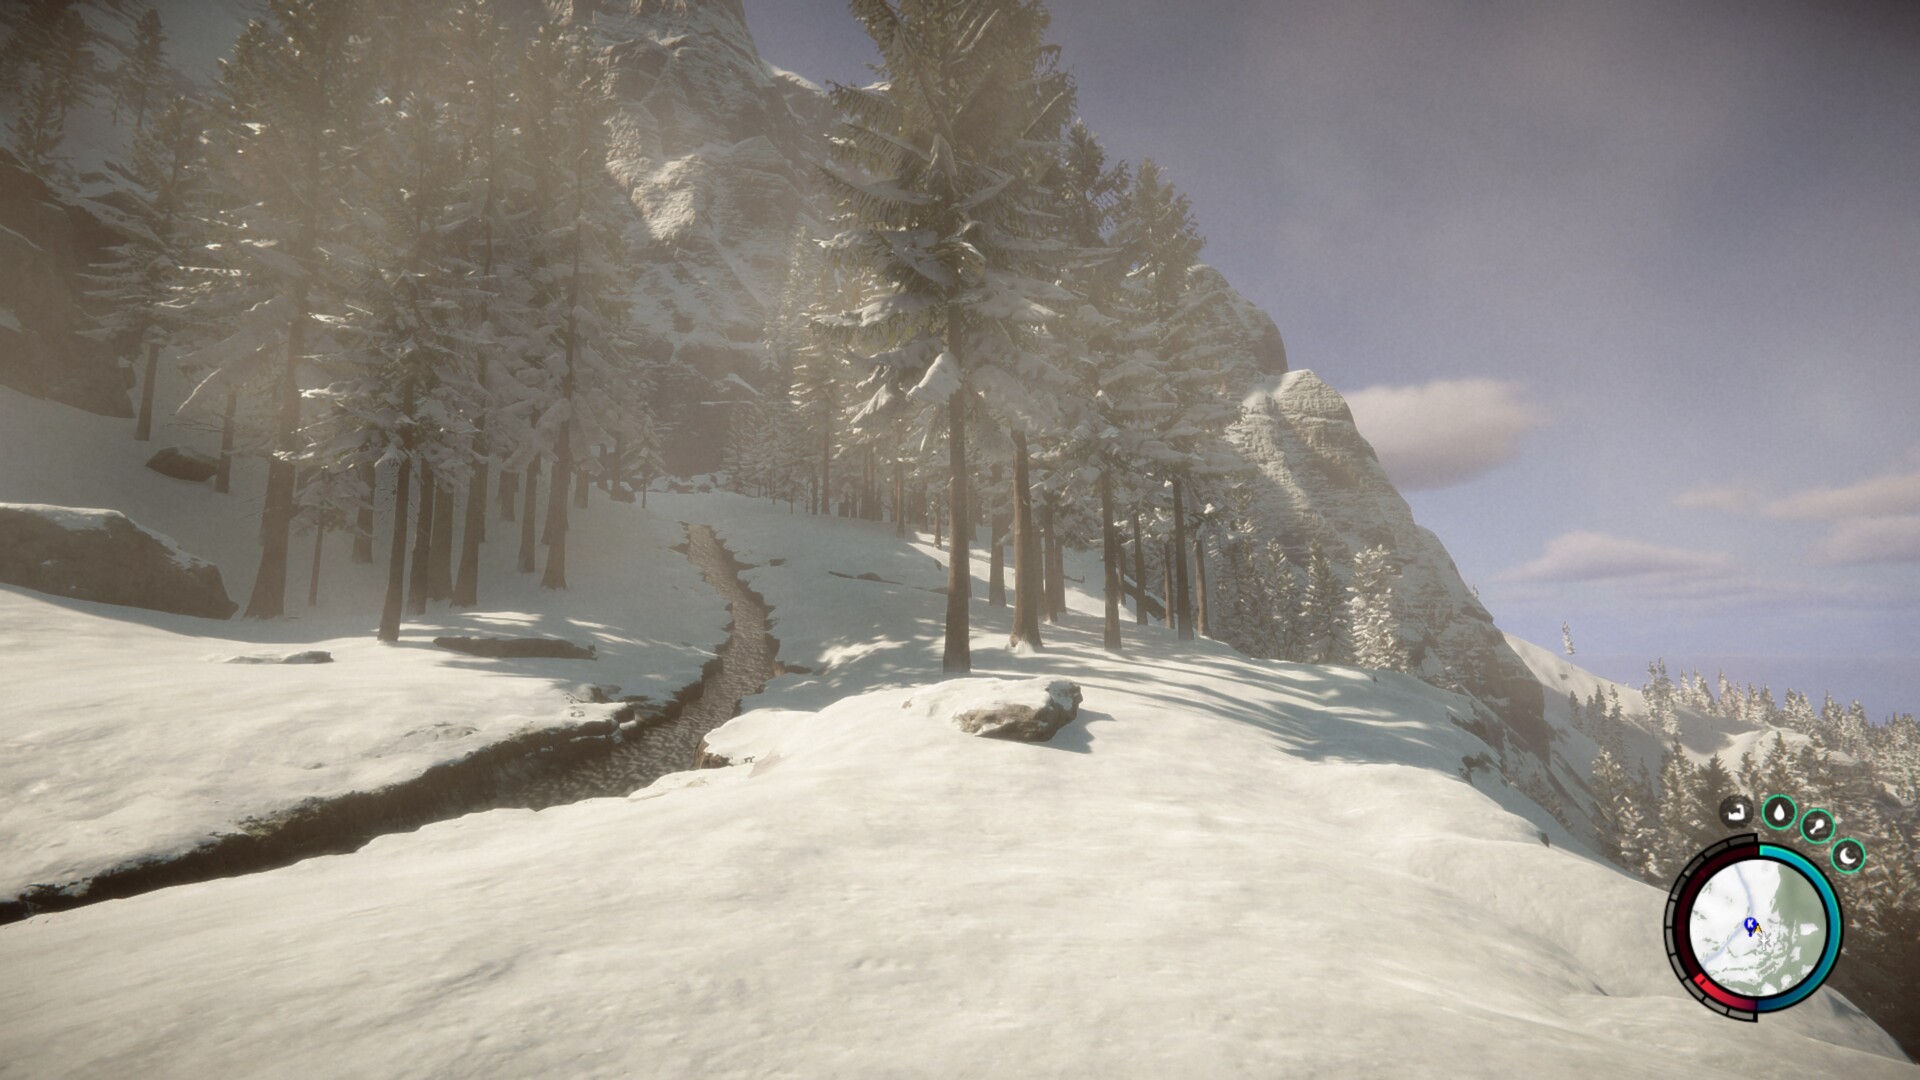
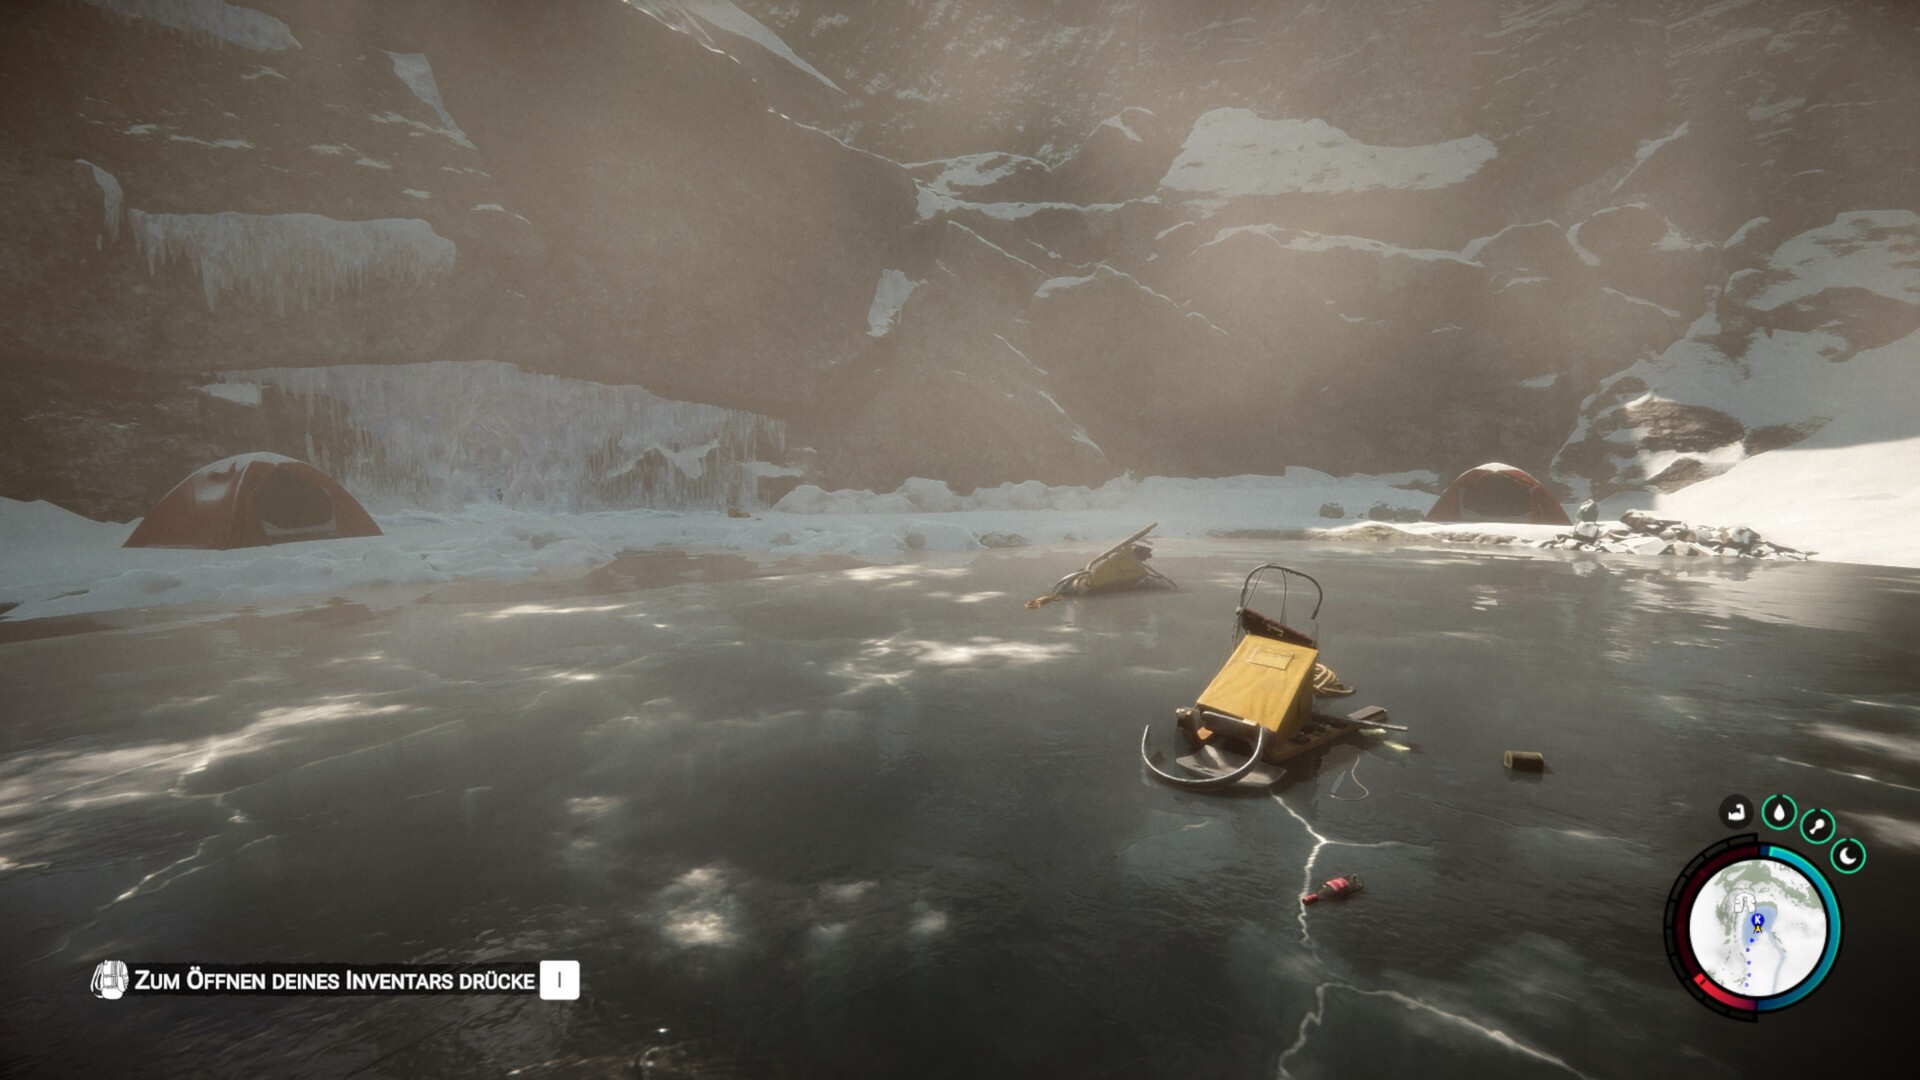
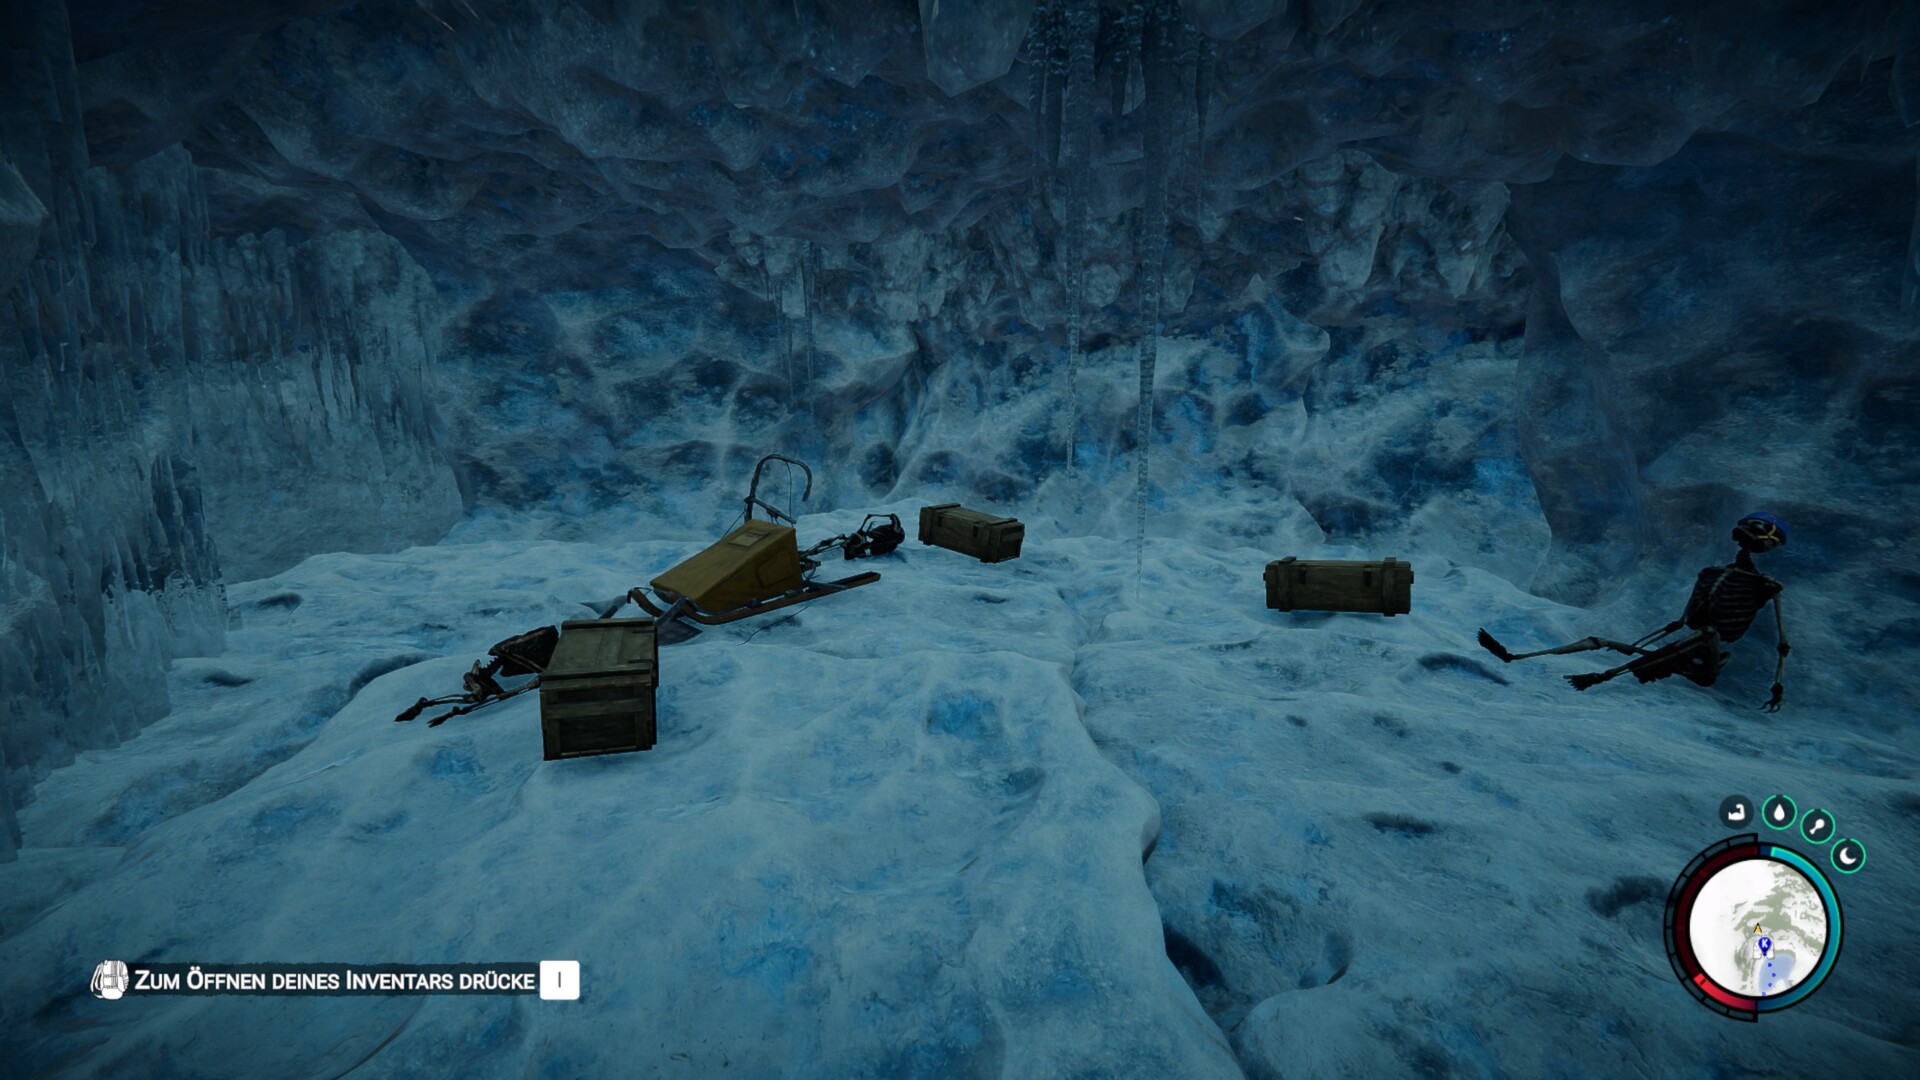
If you ignore the somewhat blurry clouds, Sons of the Forest features crisp textures, luscious vegetation, high draw distance and stylish effects (e.g. lighting) for the most part. In conjunction with various climate zones (green forests, snowy mountains, etc.), the day and night cycle and regular change in weather also lend the game a fantastic and rather unique atmosphere. Another highlight is the beautiful trails that the player character leaves in snow or wet beach. Overall, the developers have managed to get a lot out of the Unity Engine and don't have to be daunted by typical triple-A games from large studios.

Sons of the Forest
Sons of the Forest
Sons of the Forest
Sons of the Forest
Sons of the Forest
Sons of the Forest

From a technical standpoint, the game is already relatively polished and runs quite well in its current state (provided you have at least a mid-range GPU). We'll discuss this later in the benchmark section. Load times are likewise acceptable. Whilst the game launches very quickly, the initial loading process takes a while to complete. That said, other load times are fairly reasonable. One more thing to mention is the small install size: Sons of the Forest is a 9 GB download and occupies 13 GB of storage – astonishingly little for a game in 2023.

Sons of the Forest
Sons of the Forest
Sons of the Forest
Sons of the Forest
Sons of the Forest
Sons of the Forest

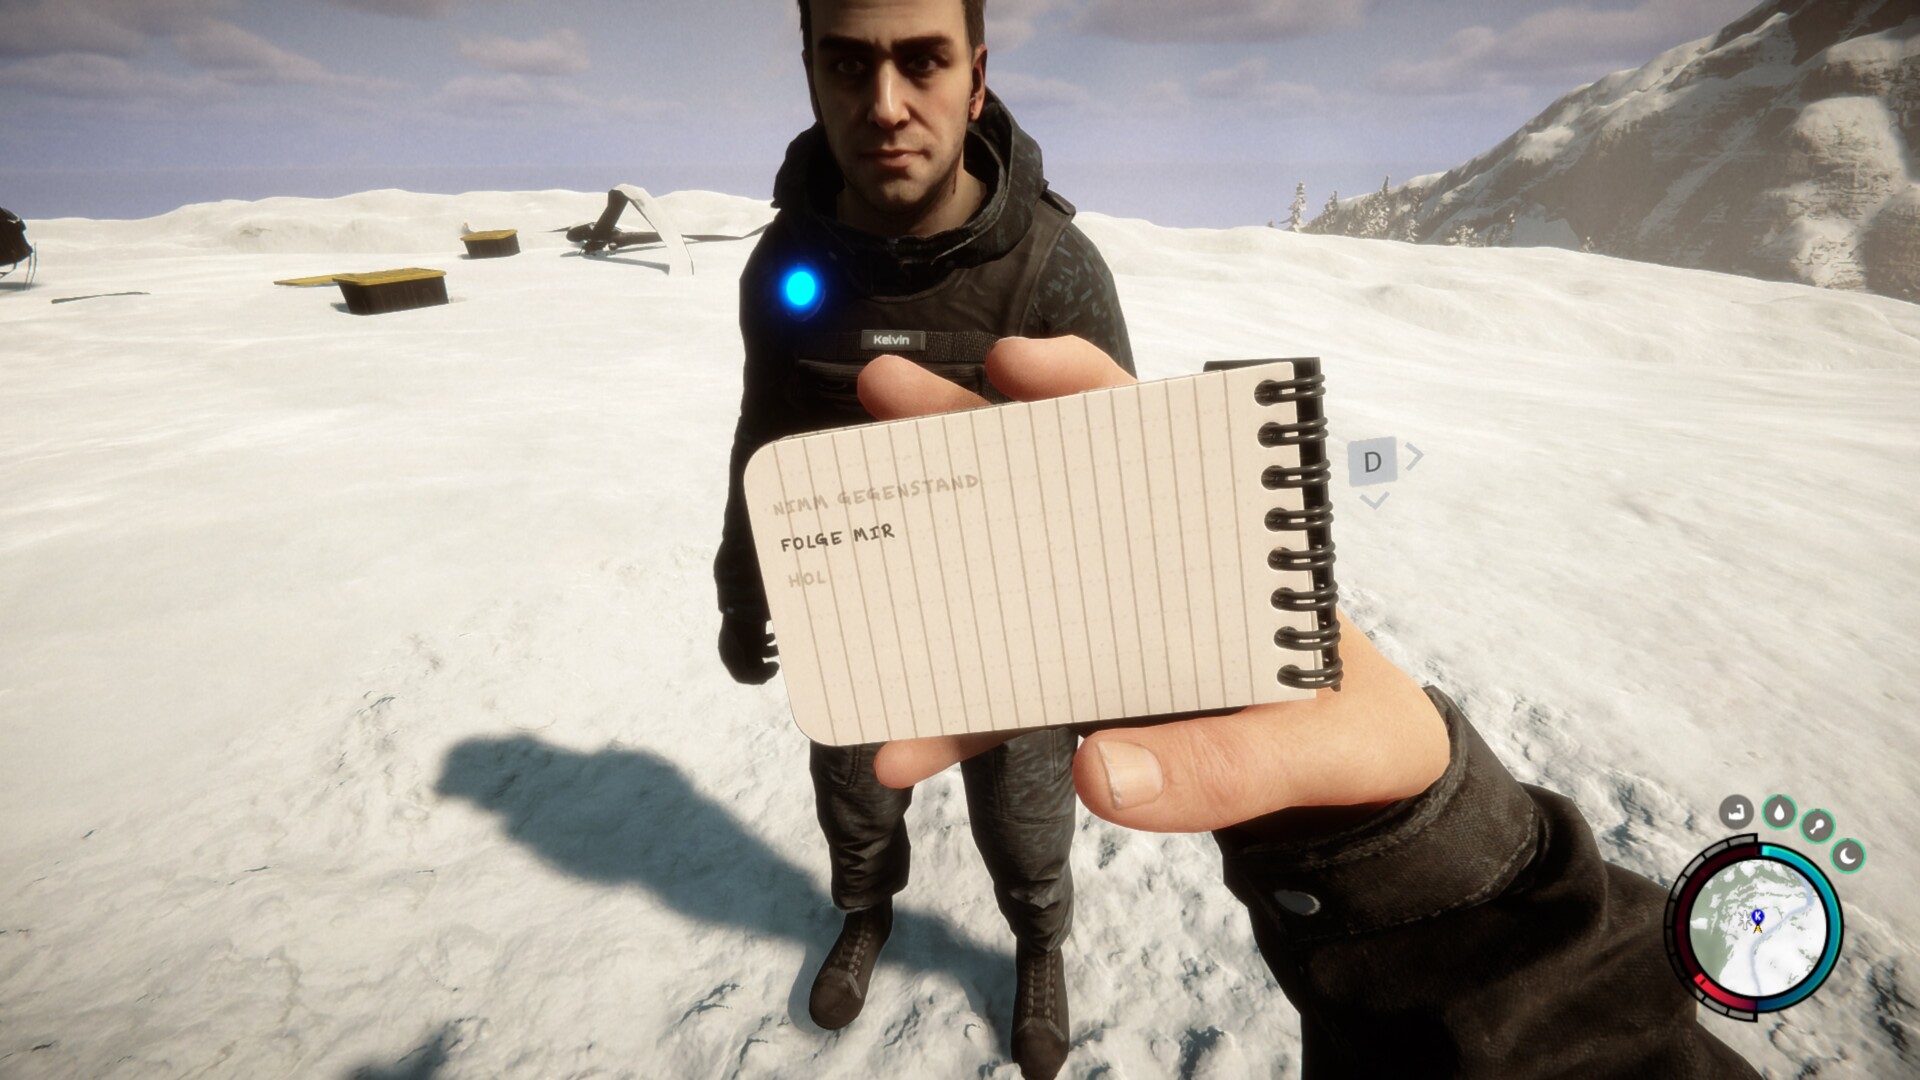
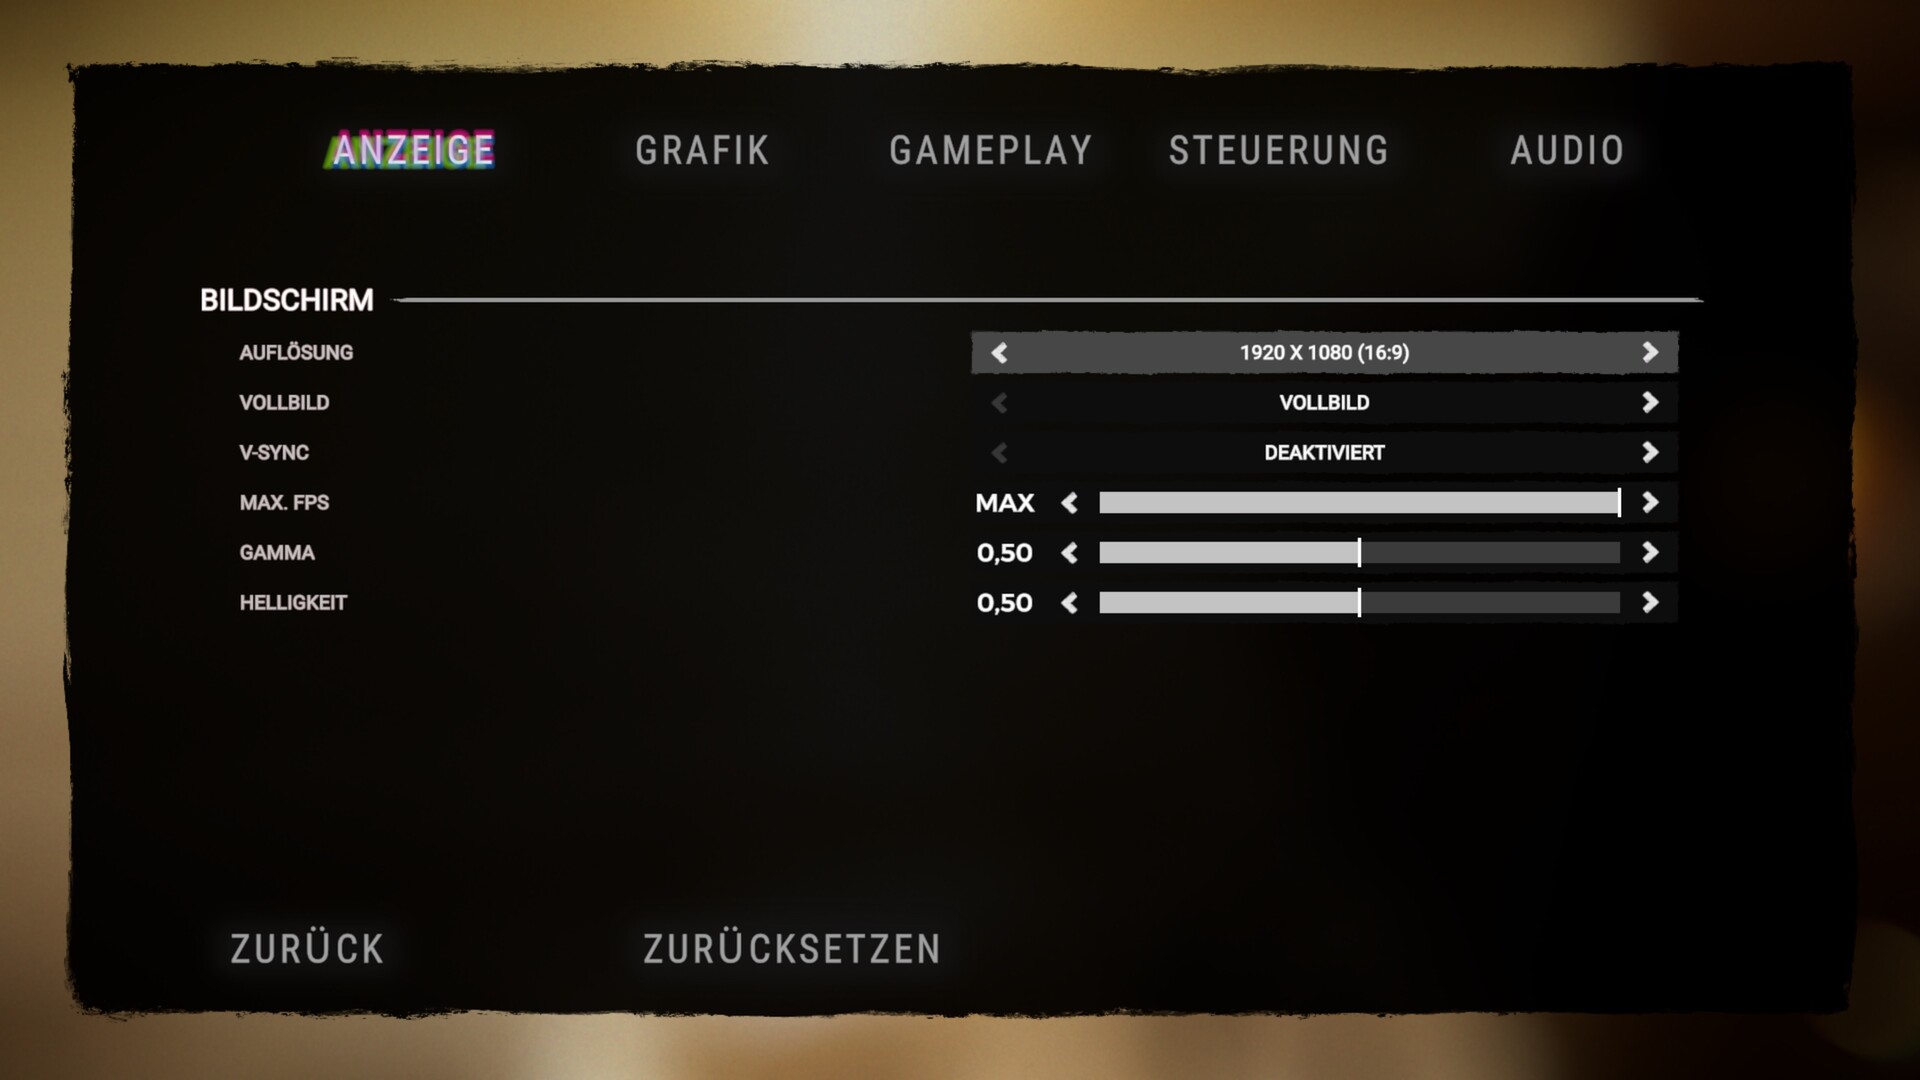
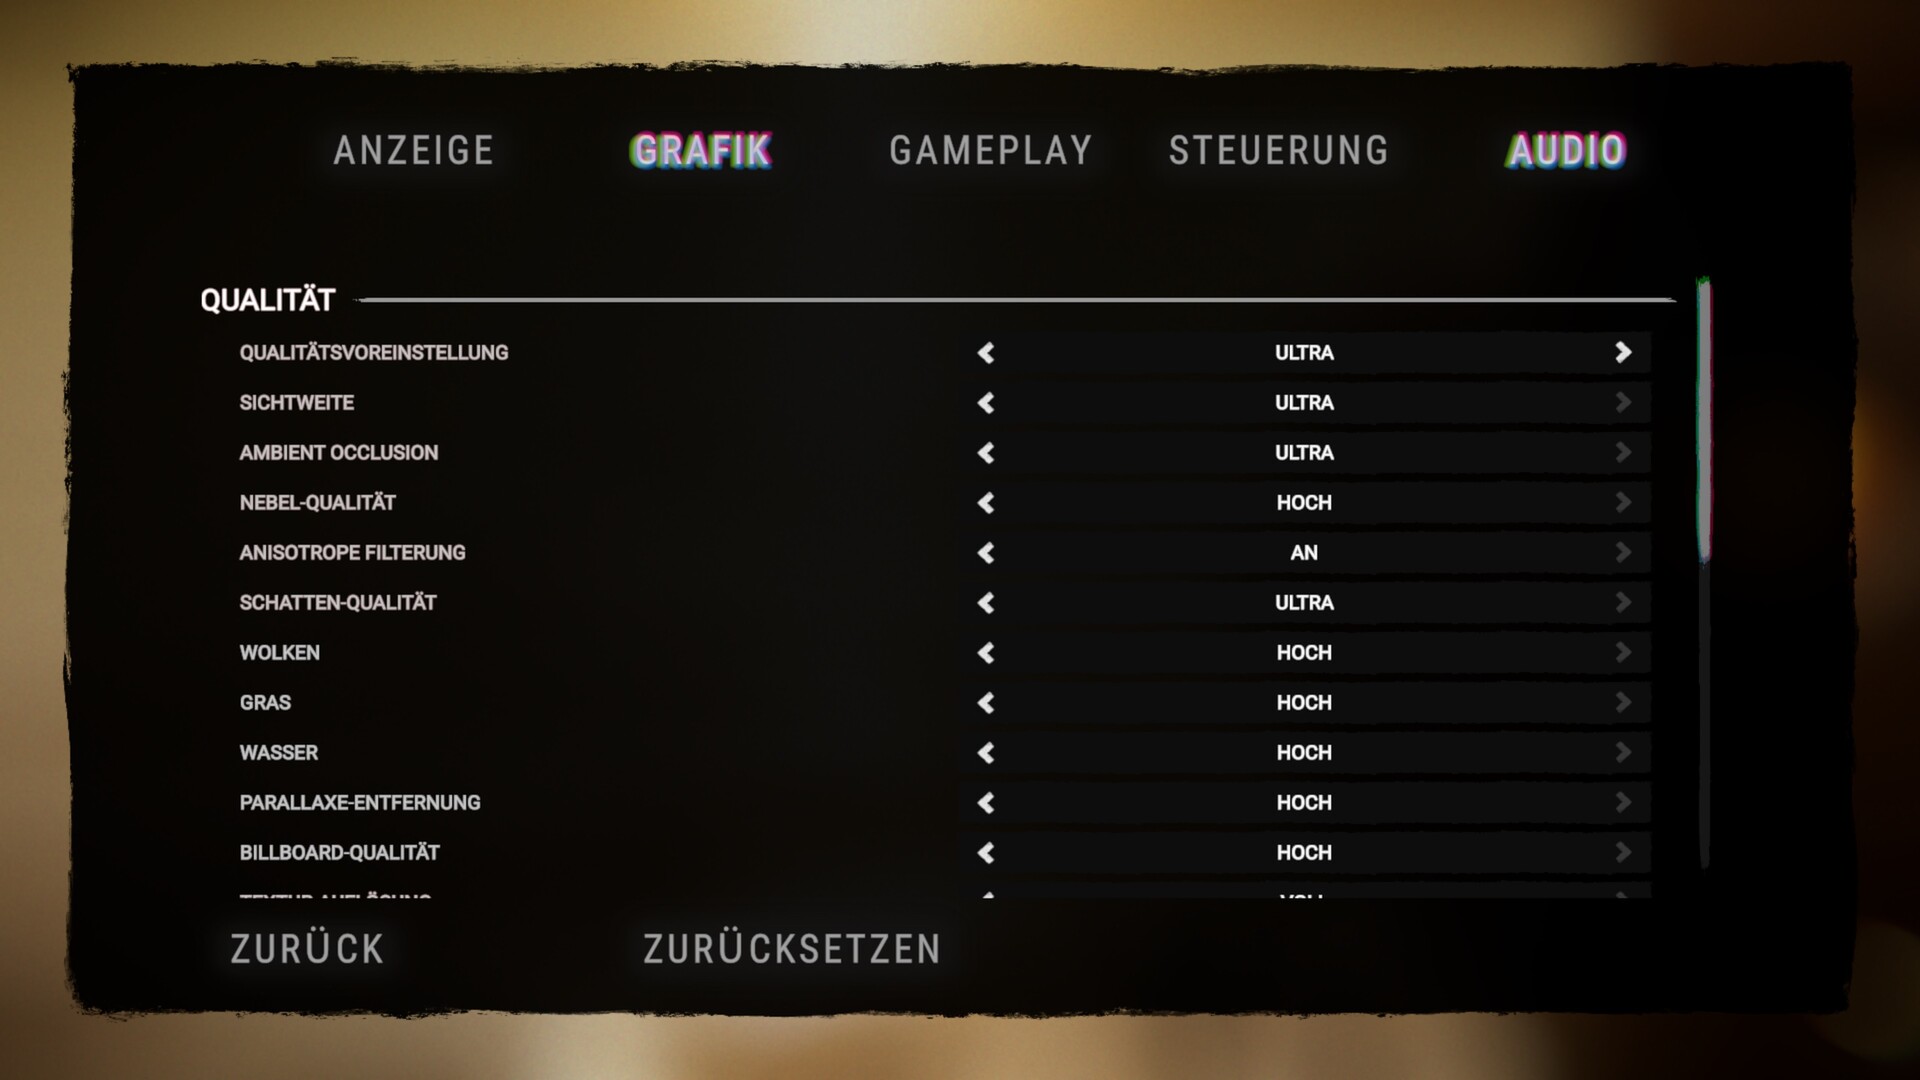
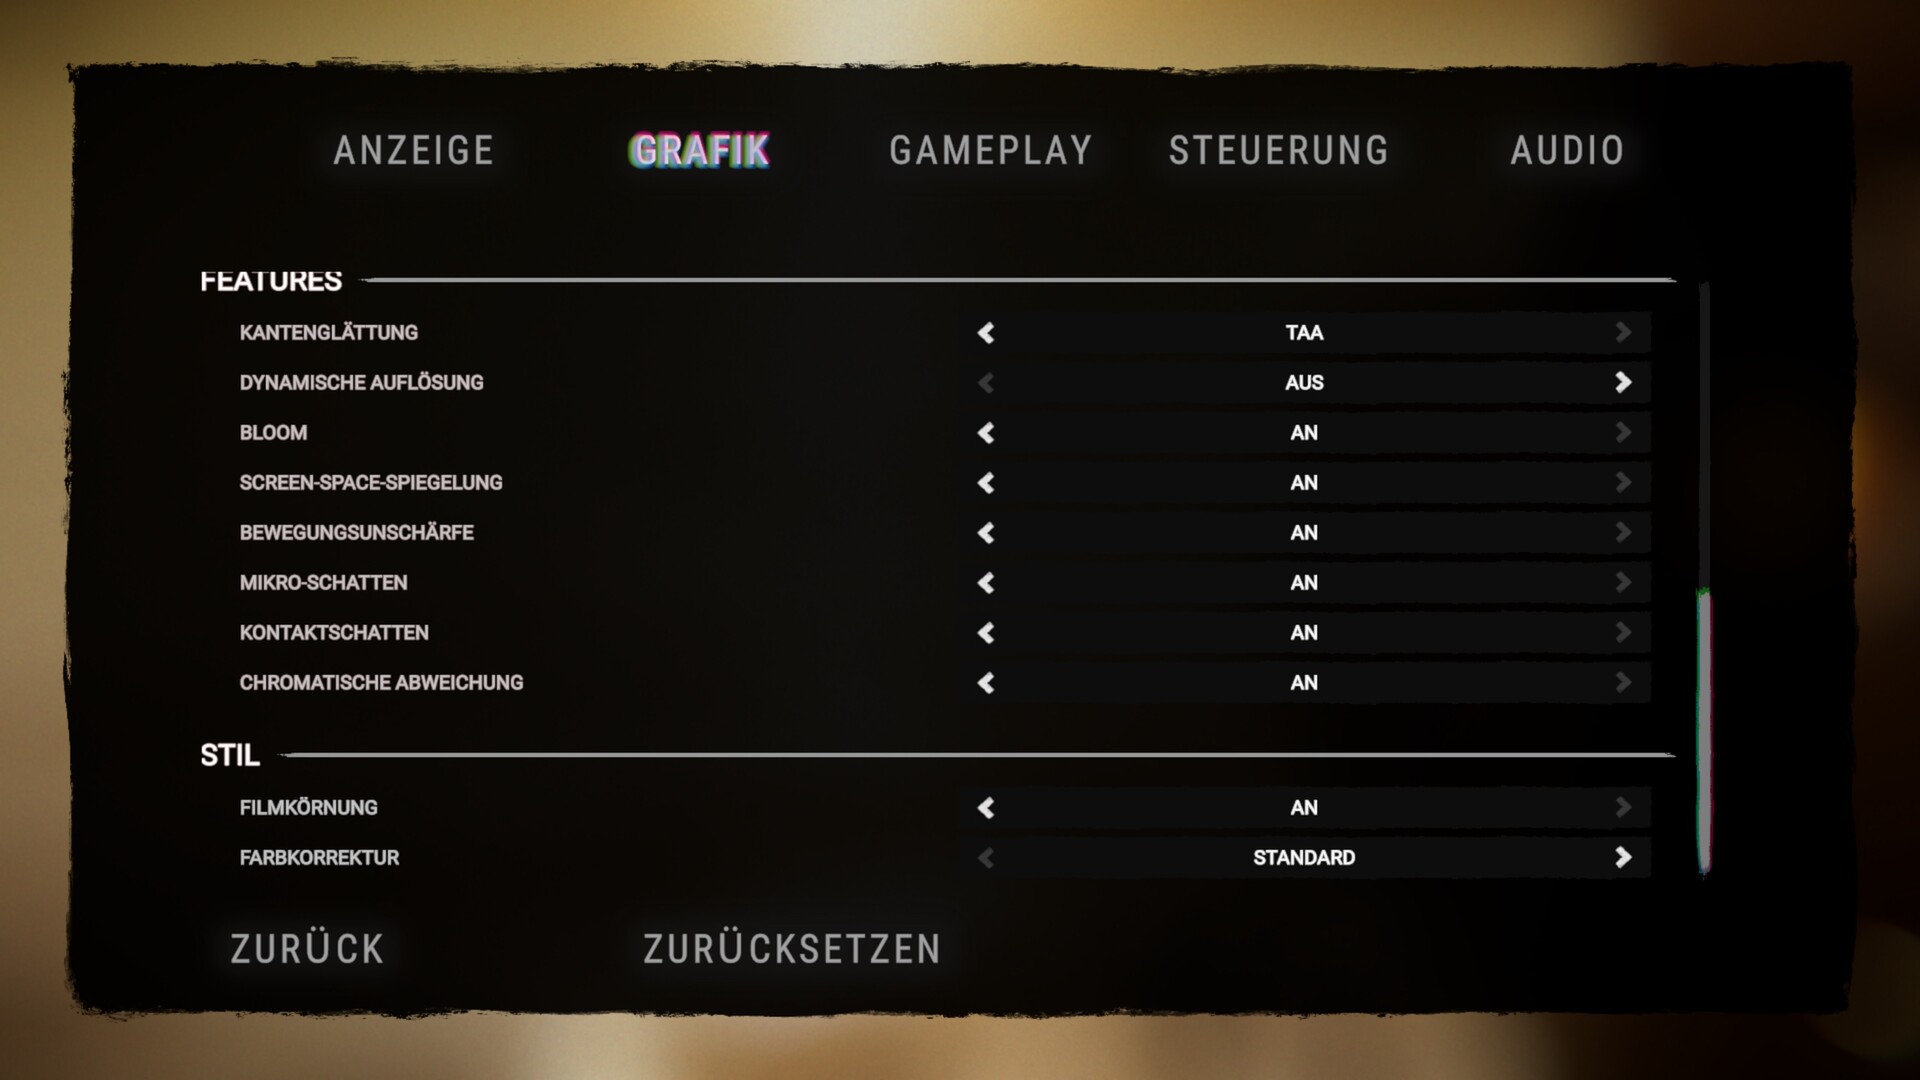
The options menu is likewise not too shabby. The graphics tab contains more than 20 options, which can be adjusted collectively by selecting one of the quality presets. One nice thing is that all the settings can be changed without restarting the game. Similar to many other current games, Sons of the Forest supports dynamic upscaling methods such as FSR and DLSS (which we disabled for our testing). The display tab doesn't have much to offer by comparison. Besides resolution, it only lets you adjust the display mode, VSync, gamma, brightness and frame rate limit (20 to 240 or unlocked).

Sons of the Forest
Sons of the Forest
Sons of the Forest

Benchmark

Because Sons of the Forest doesn't have a built-in benchmark, we used a standardised in-game sequence to help us measure frame rates. As shown in the video below, we made the player character walk up and down a predefined path on the beach (one of the spawn points at the start of the game) for roughly 40 seconds. Frame rates were captured using CapFrameX.

Results

FHD (1,920 x 1,080)

Whilst iGPUs such as the Radeon 680M and Iris Xe Graphics G7 already struggle to handle the game at Full HD and Low preset (<40 fps), mid-tier GPUs mostly have enough power to spare for high to max settings. However, as you can see in the table for FHD, the processor quickly ends up being a limiting factor when paired with a mid-range GPU or better. For example, at Ultra preset, our desktop RTX 3070 is hardly any slower than the otherwise much faster desktop RX 7900 XTX. Even more remarkable: our RX 6600M laptop managed to outperform the RX 6800M laptop thanks to better CPU utilisation.

Sons of the Forest
    1920x1080 Low Preset     1920x1080 Medium Preset AA:T     1920x1080 High Preset AA:T     1920x1080 Ultra Preset AA:T
AMD Radeon RX 7900 XTX, i9-12900K
Desktop-PC
122.7 (55.5min, 94.4P0.1, 99.7P1) fps ∼50%
119.3 (50min, 88.5P0.1, 95.9P1) fps ∼48%
113.6 (57.5min, 79.6P0.1, 92.6P1) fps ∼47%
113.4 (53.3min, 84.3P0.1, 93.9P1) fps ∼48%
NVIDIA GeForce RTX 3080, i9-12900K
Desktop-PC
120.9 (79.2min, 89.9P0.1, 98.1P1) fps ∼49%
116.5 (83.7min, 87.3P0.1, 95P1) fps ∼47%
114 (70.5min, 84.7P0.1, 90.8P1) fps ∼48%
112.4 (41.3min, 73.5P0.1, 86.8P1) fps ∼48%
AMD Radeon RX 7900 XT, i9-12900K
Desktop-PC
122.1 (39.8min, 52.2P0.1, 97.2P1) fps ∼49%
116.8 (56.6min, 91.6P0.1, 97.8P1) fps ∼47%
113.3 (44.8min, 87.4P0.1, 93.3P1) fps ∼47%
111.6 (40.5min, 83P0.1, 92.3P1) fps ∼48%
NVIDIA GeForce RTX 3070, i9-12900K
Desktop-PC
114.7 (47min, 57.8P0.1, 85.7P1) fps ∼46%
104.4 (51.6min, 63.1P0.1, 75.9P1) fps ∼42%
103.3 (47min, 69.7P0.1, 76.1P1) fps ∼43%
102 (37.4min, 57.8P0.1, 70.5P1) fps ∼44%
NVIDIA GeForce RTX 3080 Ti Laptop GPU, i9-12900HX
MSI Titan GT77 12UHS
91.7 (58.7min, 69.4P0.1, 74.9P1) fps ∼37%
87.8 (58.9min, 63.5P0.1, 71.4P1) fps ∼36%
85.7 (53.5min, 64.8P0.1, 69.4P1) fps ∼36%
84.6 (33.6min, 63.5P0.1, 68.9P1) fps ∼36%
NVIDIA GeForce RTX 3060 Laptop GPU, i7-12700H
Lenovo Legion 5 Pro
83.8 (46.1min, 53.8P0.1, 65.9P1) fps ∼34%
70.5 (39.8min, 43.6P0.1, 48.9P1) fps ∼29%
65.9 (30.7min, 36.9P0.1, 46.8P1) fps ∼27%
65.4 (36.4min, 40.1P0.1, 46.7P1) fps ∼28%
AMD Radeon RX 6600M, R7 5800H
Lenovo Legion 5
71.6 (49.3min, 57.4P0.1, 60.1P1) fps ∼29%
68.4 (51.2min, 53.5P0.1, 57.1P1) fps ∼28%
65.6 (36.4min, 48.4P0.1, 54.4P1) fps ∼27%
64.7 (26.4min, 43.3P0.1, 50.3P1) fps ∼28%
AMD Radeon RX 6800M, R9 5900HX
Asus ROG Strix G15
59.2 (40.9min, 47.8P0.1, 49.8P1) fps ∼24%
56.5 (43.9min, 46P0.1, 48.2P1) fps ∼23%
54.6 (43.9min, 44.5P0.1, 46P1) fps ∼23%
53.1 (33.3min, 35.2P0.1, 39P1) fps ∼23%
AMD Radeon 680M, R9 6900HS
Asus ROG Zephyrus G14
33.7 (19.4min, 19.8P0.1, 22.2P1) fps ∼14%
24.9 (12.6min, 15P0.1, 16.8P1) fps ∼10%
23.6 (12.9min, 13.5P0.1, 15.5P1) fps ∼10%
23.3 (11.2min, 13.6P0.1, 15.8P1) fps ∼10%
Intel Iris Xe Graphics G7 96EUs, i7-1165G7
Zotac ZBOX CI665 Nano
9.53 (2.15min, 2.15P0.1, 2.6P1) fps ∼4%
7.73 (2.32min, 2.38P0.1, 2.58P1) fps ∼3%
7.35 (2.42min, 2.43P0.1, 2.61P1) fps ∼3%
7.24 (2.22min, 2.22P0.1, 2.34P1) fps ∼3%

QHD (2,560 x 1,440)

You should use an upper mid-range to high-end graphics card if you want to play the game on a QHD display. Based on our testing, a GeForce RTX 3060 or higher is required to achieve an average of more than 50 fps at 2,560 x 1,440 and Ultra preset.

Sons of the Forest
    2560x1440 Ultra Preset AA:T
AMD Radeon RX 7900 XTX, i9-12900K
Desktop-PC
108.5 (5.81min, 44P0.1, 88.2P1) fps ∼49%
AMD Radeon RX 7900 XT, i9-12900K
Desktop-PC
108.3 (72.3min, 86P0.1, 91.1P1) fps ∼49%
NVIDIA GeForce RTX 3080, i9-12900K
Desktop-PC
98.5 (52.2min, 55.7P0.1, 62.4P1) fps ∼44%
NVIDIA GeForce RTX 3070, i9-12900K
Desktop-PC
82.3 (45.7min, 54.5P0.1, 61.1P1) fps ∼37%
NVIDIA GeForce RTX 3080 Ti Laptop GPU, i9-12900HX
MSI Titan GT77 12UHS
74 (27.1min, 27.4P0.1, 35.4P1) fps ∼33%
NVIDIA GeForce RTX 3060 Laptop GPU, i7-12700H
Lenovo Legion 5 Pro
51.1 (24.8min, 28.6P0.1, 37.5P1) fps ∼23%
AMD Radeon RX 6800M, R9 5900HX
Asus ROG Strix G15
49.9 (30.8min, 32.4P0.1, 34.6P1) fps ∼22%
AMD Radeon RX 6600M, R7 5800H
Lenovo Legion 5
47.5 (33.7min, 36.1P0.1, 39.2P1) fps ∼21%

UHD (3,840 x 2,160)

In general, there's no getting around using an absolute top-end graphics card if you wish to play the game at 4K (3,840 x 2,160) and Ultra preset. For a portable system, only a GeForce RTX 3080 Ti or better can break the 50 fps mark.

Sons of the Forest
    3840x2160 Ultra Preset AA:T
AMD Radeon RX 7900 XTX, i9-12900K
Desktop-PC
98.4 (34.2min, 40.3P0.1, 71.7P1) fps ∼41%
AMD Radeon RX 7900 XT, i9-12900K
Desktop-PC
86 (48.2min, 62.8P0.1, 66.8P1) fps ∼36%
NVIDIA GeForce RTX 3080, i9-12900K
Desktop-PC
69.5 (40.2min, 48P0.1, 51.4P1) fps ∼29%
NVIDIA GeForce RTX 3080 Ti Laptop GPU, i9-12900HX
MSI Titan GT77 12UHS
53.8 (6.45min, 30.1P0.1, 41.2P1) fps ∼23%
NVIDIA GeForce RTX 3070, i9-12900K
Desktop-PC
50.5 (33.1min, 35.4P0.1, 40.7P1) fps ∼21%
AMD Radeon RX 6800M, R9 5900HX
Asus ROG Strix G15
39.9 (19.7min, 24.1P0.1, 30.4P1) fps ∼17%
NVIDIA GeForce RTX 3060 Laptop GPU, i7-12700H
Lenovo Legion 5 Pro
31.9 (11.9min, 15.3P0.1, 22.9P1) fps ∼13%
AMD Radeon RX 6600M, R7 5800H
Lenovo Legion 5
27.7 (21.4min, 21.5P0.1, 22.3P1) fps ∼12%

Note

Because gaming tests are very time-consuming and are often constrained by installation or activation limits, we are only able to provide you with part of the benchmark results at the time of publishing this article. We will be adding more graphics cards over the coming days and weeks.

Overview

Show Restrictions
PosModel< PrevNext >Sons of the Forest
 Sons of the Forest (2023)
low
1920x1080
Low Preset
med.
1920x1080
Medium Preset
TAA
high
1920x1080
High Preset
TAA
ultra
1920x1080
Ultra Preset
TAA
QHD
2560x1440
Ultra Preset
TAA
4K
3840x2160
Ultra Preset
TAA
NVIDIA GeForce RTX 4090
154.85n4
149.65n4
144.3n4
145.3n3
139.05n4
131.5n5
AMD Radeon RX 7900 XTX
132.65n2
129.1n2
123.6n2
123n2
118.35n2
102.9n2
NVIDIA GeForce RTX 4080 Super
144.95n2
141.25n2
137n2
134.9n2
132.35n2
103.05n2
NVIDIA GeForce RTX 4080
118.1
111.5
108.5
103
92.3
AMD Radeon RX 7900 XT
122.1
116.8
113.3
111.6
108.3
86
NVIDIA GeForce RTX 4070 Ti
119.3
116.8
113.4
112.7
109.8
82.7
AMD Radeon RX 7900 GRE
117.05n2
112.5n2
110.1n2
107.9n2
106.35n2
76.6n2
AMD Radeon RX 6950 XT
128.5
123.5
119.8
117.6
116
77.6
NVIDIA GeForce RTX 4090 Laptop GPU
99.65n2
93.75n2
90.9n2
89.8n2
87.4n2
72.5
NVIDIA GeForce RTX 3090
132.4
127.8
123.4
120.3
109.4
72.8
AMD Radeon RX 7800 XT
120.2
115
112.7
109.7
107
69.4
NVIDIA GeForce RTX 4080 Laptop GPU
78.1
75
74.6
69.7
66.8
NVIDIA GeForce RTX 3080 12 GB
142.4
136.5
130.2
104.1
68.6
NVIDIA GeForce RTX 3080
120.9
116.5
114
112.4
98.5
69.5
NVIDIA GeForce RTX 4070
133
126.3
122.5
120.1
99.9
59.7
AMD Radeon RX 6800
124.2
120.2
115.8
113.9
92.8
54.6
AMD Radeon RX 7700 XT
118.7
115.6
112.4
112.2
99.1
59
NVIDIA Titan RTX
130.8
118.4
113
112.2
87.4
55.7
NVIDIA GeForce RTX 4060 Ti 16G
122.3
111.8
109.5
108
84
51.7
PosModel< PrevNext >Sons of the Forest
low med. high ultra QHD 4K
NVIDIA GeForce RTX 4060 Ti 8G
120.4n3
109.9n3
105.6n3
103.1n3
81.9n3
49.6n3
NVIDIA GeForce RTX 3080 Ti Laptop GPU
91.7
87.8
85.7
84.6
74
53.8
NVIDIA GeForce RTX 4070 Laptop GPU
98.3
87.45n4
84.55n4
83.85n4
65.25n2
NVIDIA GeForce RTX 3070
114.7
104.4
103.3
102
82.3
50.5
AMD Radeon RX 6750 XT
119.5
113
108.8
105.7
79.3
45.5
AMD Radeon RX 6700 XT
122.7
110.5
105.9
104.1
74.3
42.5
NVIDIA GeForce RTX 3080 Laptop GPU
81.9
80.5
76.7
72.45n2
63.25n2
44.85n2
NVIDIA GeForce RTX 3060 Ti
123.7
101.5
95.1
94.1
73.7
45.1
Intel Arc A770
70.3
54.5
54.2
54
39.5
23
NVIDIA GeForce RTX 4060
107.1
92.3
88.4
86.8
65.5
38.2
AMD Radeon RX 7600
125.4
112
105.2
104.8
71.6
41.2
NVIDIA GeForce RTX 3070 Ti Laptop GPU
85
82.8
81.7
65.5
44.2
NVIDIA GeForce RTX 4060 Laptop GPU
80.1n2
79.1n3
73.3n3
71.8n3
64.2
AMD Radeon RX 6800M
59.2
56.5
54.6
53.1
49.9
39.9
AMD Radeon RX 6650 XT
126.5
97.7
92.5
90.4
64.4
35.4
NVIDIA GeForce RTX 3070 Laptop GPU
80.4
75.8
72.8
67.15n2
53.8n2
34.8n2
AMD Radeon RX 7600M XT
111.6
101.1
93.1
92.1
64.7
35.3
Intel Arc A750
65.5
51
50.5
49.7
36.7
21.7
NVIDIA Titan X Pascal
97.7
79.4
76.1
75.5
56
33.1
NVIDIA GeForce RTX 2070 Super (Desktop)
112.7
89.7
85.5
83.4
64.5
38.4
PosModel< PrevNext >Sons of the Forest
low med. high ultra QHD 4K
AMD Radeon RX 5700 XT (Desktop)
112.4
86.9
82.3
80
58.6
32.3
NVIDIA GeForce RTX 3060 Laptop GPU
83.8
70.5
65.9
65.4
51.1
31.9
AMD Radeon RX 7600S
93.2
81.4
78
76.7
Intel Arc A580
78.3
61.5
58
56.9
43.3
24.3
NVIDIA GeForce RTX 2060 Super (Desktop)
94.5
78.4
74.9
72.7
54.5
32.3
AMD Radeon RX 6600
105.4
82.9
78.9
76.8
53.8
29.3
AMD Radeon RX 5700 (Desktop)
100.4
73.3
71.2
69.3
50.6
28.8
AMD Radeon RX 6600M
78.2n3
74.2n3
70.1n3
69.7n3
50.3n3
27.7n3
NVIDIA GeForce RTX 3050
60.2
56.2
65.25n2
39.8
23.7
AMD Radeon RX 5600 XT (Desktop)
89.5
68.8
66.6
64.7
49.1
25.7
NVIDIA GeForce GTX 1660 Super (Desktop)
71.6
55
52.9
51.4
37.2
20.4
AMD Radeon RX 6500 XT
40.4
29.4
26.7
24.5
18.1
10.5
AMD Radeon RX 5500 XT (Desktop)
59.7
44.9
47.7
44.7
32
17.9
NVIDIA GeForce RTX 4050 Laptop GPU
73.85n2
74.75n4
71.5n4
49.2n2
24.5
Intel Arc A730M
53.8n2
37.25n2
35.35n2
32.65n2
15.4
NVIDIA GeForce GTX 1660 Ti Mobile
72.9
55.8
55
54
NVIDIA GeForce RTX 3050 Ti Laptop GPU
54.9
38.8
35.4
33.3
25.6
NVIDIA GeForce GTX 1660 (Desktop)
67.2
51.2
47.6
47.1
33.2
18.1
NVIDIA GeForce GTX 1650 Super (Desktop)
57.8
41.7
39.3
39
26.7
14.5
NVIDIA GeForce RTX 3050 4GB Laptop GPU
50.1
31.5
30.8
28.9
PosModel< PrevNext >Sons of the Forest
low med. high ultra QHD 4K
NVIDIA GeForce GTX 1060 Mobile
48.2
35
34.5
33.9
NVIDIA GeForce GTX 1650 Ti Mobile
58.3
38.3
35.9
34.1
Intel Arc A370M
27.6
17.4
11.5
11.4
AMD Radeon RX 5500M
44.4
35.9
35.4
34.5
NVIDIA GeForce RTX 2050 Mobile
35.9
34.1
33
NVIDIA GeForce GTX 1650 Mobile
53
32.3
31.5
30.1
Intel Arc A380
35.9
26.9
25.4
25.1
Intel Arc A310
29.9
18.9
17.4
17.1
Intel Arc 8-Cores iGPU
29.8
21
19.4
18.7
Intel Arc 7-Cores iGPU
24.9
17.3
15.5
15.2
AMD Radeon 780M
32.8
21.1
19.8
19.4
AMD Radeon 680M
33.7
24.9
23.6
23.3
NVIDIA GeForce GTX 1050 Mobile
35.8
22.2
20.8
AMD Radeon 760M
32
19.6
19
AMD Radeon 660M
24.7
16.7
15.3
14.8
AMD Radeon RX 560X (Laptop)
34.7
21.5
20.3
20.2
Intel Iris Xe Graphics G7 96EUs
9.53
8.29n2
7.91n2
7.66n2
NVIDIA GeForce MX350
26.2
13.8
12.8
AMD Radeon RX 550 (Laptop)
12.1
8.73
NVIDIA GeForce MX250
20
10.7
PosModel< PrevNext >Sons of the Forest
low med. high ultra QHD 4K
Intel Iris Xe Graphics G7 80EUs
10.2
7.74
AMD Radeon 540X
12.5
Intel UHD Graphics 64EUs (Alder Lake 12th Gen)
12.4
Intel Iris Plus Graphics G7 (Ice Lake 64 EU)
8.54
AMD Radeon RX Vega 10
16
10.5
Intel UHD Graphics Xe 32EUs (Tiger Lake-H)
9.56
Intel UHD Graphics 770
9.64
AMD Radeon RX Vega 8 (Ryzen 4000/5000)
18.7
11.7
NVIDIA GeForce MX130
7.88
AMD Radeon RX Vega 8 (Ryzen 2000/3000)
12.3
Intel Iris Graphics 550
5.37
AMD Radeon RX Vega 6 (Ryzen 4000/5000)
16.1
9.3
AMD Radeon RX Vega 6 (Ryzen 2000/3000)
8.35
AMD Radeon RX Vega 5
12.1
7.57
Intel UHD Graphics G1 (Ice Lake 32 EU)
4.7
Intel UHD Graphics 620
4.44
AMD Radeon R5 M255
7.37
AMD Radeon RX Vega 3
8.66
(-) * Smaller values are better. / n123 Number of benchmarks for this median value / * Approximate position


Legend
5Stutters – This game is very likely to stutter and have poor frame rates. Based on all known benchmarks using the specified graphical settings, average frame rates are expected to fall below 25fps
May Stutter – This graphics card has not been explicitly tested on this game. Based on interpolated information from surrounding graphics cards of similar performance levels, stutters and poor frame rates are expected.
30Fluent – Based on all known benchmarks using the specified graphical settings, this game should run at or above 25fps
40Fluent – Based on all known benchmarks using the specified graphical settings, this game should run at or above 35fps
60Fluent – Based on all known benchmarks using the specified graphical settings, this game should run at or above 58fps
May Run Fluently – This graphics card has not been explicitly tested on this game. Based on interpolated information from surrounding graphics cards of similar performance levels, fluent frame rates are expected.
?Uncertain – This graphics card experienced unexpected performance issues during testing for this game. A slower card may be able to achieve better and more consistent frame rates than this particular GPU running the same benchmark scene.
Uncertain – This graphics card has not been explicitly tested on this game and no reliable interpolation can be made based on the performances of surrounding cards of the same class or family.
The value in the fields displays the average frame rate of all values in the database. Move your cursor over the value to see individual results.

Test systems

Device Graphics card Processor RAM Operating system
Notebooks
MSI Titan GT77 12UHS Nvidia GeForce RTX 3080 Ti @175 W TGP (16 GB GDDR6) Intel Core i9-12900 2 x 16 GB DDR5 Windows 11
Lenovo Legion 5 Pro Nvidia GeForce RTX 3060 @140 W TGP (6 GB GDDR6) Intel Core i7-12700H 2 x 8 GB DDR5 Windows 11
Asus ROG Strix G15 AMD Radeon RX 6800M (12 GB GDDR6) AMD Ryzen 9 5900HX 2 x 8 GB DDR4 Windows 11
Lenovo Legion 5 AMD Radeon RX 6600M (8 GB GDDR6) AMD Ryzen 7 5800H 2 x 8 GB DDR4 Windows 11
Asus ROG Zephyrus G14 AMD Radeon 680M AMD Ryzen 9 6900HS 2 x 16 GB DDR5 Windows 11
Tower PCs
Custom I AMD Radeon RX 7900 XTX (24 GB GDDR6)
AMD Radeon RX 7900 XT (20 GB GDDR6)
MSI GeForce RTX 3080 (10 GB GDDR6X)
MSI GeForce RTX 3070 (8 GB GDDR6)
Intel Core i9-12900K 2 x 16 GB DDR4 Windows 11
Custom II Palit GeForce RTX 4090 GameRock OC (24 GB GDDR6X)
Nvidia GeForce RTX 3090 FE (24 GB GDDR6X)
Nvidia GeForce RTX 3060 Ti (8 GB GDDR6X)
Nvidia Titan RTX (24 GB GDDR6)
Nvidia GeForce RTX 2070 Super (8 GB GDDR6)
Nvidia GeForce RTX 2060 Super (8 GB GDDR6)
KFA2 GeForce GTX 1660 Super (6 GB GDDR6)
PNY GeForce GTX 1660 (6 GB GDDR5)
KFA2 GeForce GTX 1650 Super (4 GB GDDR6)
AMD Radeon RX 6950 XT (16 GB DDR6)
AMD Radeon RX 6800 (16 GB DDR6)
AMD Radeon RX 6700 XT (12 GB DDR6)
AMD Radeon RX 6650 XT (8 GB GDDR6)
AMD Radeon RX 6600 (8 GB GDDR6)
AMD Radeon RX 5700 XT (8 GB GDDR6)
AMD Radeon RX 5700 (8 GB GDDR6)
AMD Radeon RX 5600 XT (6 GB GDDR6)
AMD Radeon RX 5500 XT (8 GB GDDR6)
AMD Ryzen 9 7950X 2 x 16 GB DDR5 Windows 11
Custom III Nvidia GeForce RTX 2080 Super FE Intel Core i9-11900K 2 x 8 GB DDR4 Windows 11
Mini-PCs
Zotac ZBOX CI665 Nano Intel Iris Xe Graphics G7 (96 CUs) Intel Core i7-1165G7 2 x 8 GB DDR4 Windows 11
Morefine S500+ AMD Radeon RX Vega 8 AMD Ryzen 9 5900HX 2 x 16 GB DDR4 Windows 11
Minisforum NUCXi7 Nvidia GeForce RTX 3070 @125 W TGP (8 GB GDDR6) Intel Core i7-11800H 2 x 8 GB DDR4 Windows 11
Minisforum HX99G AMD Radeon RX 6600M @100 W TGP (8 GB GDDR6) AMD Ryzen 9 6900HX 2 x 16 GB DDR5 Windows 11
4K monitors Nvidia driver AMD driver
Philips Brilliance 329P9H, Gigabyte M32U ForceWare 528.49 Adrenalin 23.2.2
static version load dynamic
Loading Comments
Comment on this article
Please share our article, every link counts!
> Expert Reviews and News on Laptops, Smartphones and Tech Innovations > Reviews > Sons of the Forest review: Laptop and desktop benchmarks
Florian Glaser, 2023-03-15 (Update: 2023-03-15)