Notebook reviews with AMD Radeon 660M graphics card
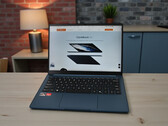
Looking for an affordable office notebook? Chuwi CoreBook Air review with AMD Ryzen power
The Chuwi CoreBook Air with AMD Ryzen 5 6600H offers a balanced mix of mobility, everyday performance, and a matte IPS display that is well suited for longer work sessions. In combination with 16 GB of RAM and an NVMe SSD, the result is a compact overall package that is primarily aimed at budget-oriented users who are looking for a lightweight notebook for office, web, and multimedia.
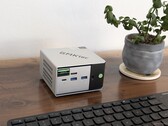
AMD Ryzen 5 6600H, Radeon 660M, 14", 1 kgGMK NucBox M8 mini PC review: Small, professional, and affordable
The NucBox M8 isn't trying to be the fastest mini PC out there, but its balanced approach to performance and price makes it much easier to recommend for most general applications.
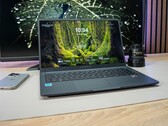
AMD Ryzen 5 PRO 6650H, Radeon 660M, 494 gLightweight and affordable notebook for pupils, students & office with great 2K display - Ninkear S14 review
The Ninkear S14 combines low weight, solid performance and a high-quality IPS display to create an attractive overall package. With the AMD Ryzen 5 7535HS, 16 GB RAM and 1 TB SSD, the notebook is ideal for pupils, students and mobile office users.
AMD Ryzen 5 7535HS, Radeon 660M, 14", 1.1 kgAsus ExpertBook B1 review – The business laptop with Win 11 Pro and a 3-year warranty for $750
The new Asus ExpertBook B1 is an affordable 15-inch office laptop aimed at price-conscious users. Equipped with an AMD Ryzen 7 processor, upgradeable RAM, a Windows 11 Pro license and a multi-year warranty, it offers a solid basis for everyday work.
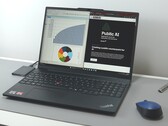
AMD Ryzen 5 7535U, Radeon 660M, 15.6", 1.7 kgLenovo ThinkPad E16 Gen 2 AMD laptop review: Cuts corners (mostly) in the right places
The second edition of the no-frills ThinkPad E16 now offers decent graphics performance. Apart from that, everything looks like a ThinkPad from the premium and, as you would expect, more expensive series - with a few crucial cuts.
AMD Ryzen 5 7535HS, Radeon 660M, 16", 1.9 kgLenovo ThinkPad L14 G5 21L50014GE: AMD Ryzen 5 7535U, 14.00", 1.6 kg
Review » Lenovo ThinkPad L14 G5 laptop review: Affordable AMD ThinkPad now much more modern
GMK NucBox M6: AMD Ryzen 5 6600H, 0.5 kg
Review » GMK NucBox M6 review: A balanced mini PC for under $300
Lenovo ThinkPad X13 G3 21CM002UGE: AMD Ryzen 5 PRO 6650U, 13.30", 1.3 kg
Review » Lenovo ThinkPad X13 G3 AMD Laptop Review: Already very good ThinkPad even better with Ryzen 6000
Morefine M600, 6600U: AMD Ryzen 5 6600U, 0.8 kg
Review » Morefine M600 6600U desktop PC review: The affordable mini PC with an AMD Ryzen 5 6600U with 32 GB RAM and USB4
Lenovo ThinkPad T16 G1 21CH004MGE: AMD Ryzen 5 PRO 6650U, 16.00", 1.8 kg
Review » Lenovo ThinkPad T16 G1 AMD laptop review: Efficient and faster than Intel
HP EliteBook 845 G9 6F6H9EA: AMD Ryzen 5 PRO 6650U, 14.00", 1.4 kg
Review » HP EliteBook 845 G9 laptop review: Also convincing with Ryzen 5 PRO 6650U
Lenovo IdeaPad 5 Pro 16ARH7: AMD Ryzen 5 6600HS, 16.00", 1.9 kg
Review » Lenovo IdeaPad 5 Pro 16ARH7 laptop review: Ryzen 5 6600HS meets good 16:10 display
Lenovo ThinkPad Z13 21D2CTO1WW: AMD Ryzen 5 PRO 6650U, 13.30", 1.2 kg
Review » Lenovo ThinkPad Z13 laptop review: AMD's premium ThinkPad with long battery life
Lenovo Ideapad Slim 3 16ARP10: AMD Ryzen 5 7535HS, 15.30", 1.6 kg
External Review » Lenovo Ideapad Slim 3 16ARP10 - Reviews and Specs
Lenovo IdeaPad Slim 3 15ARP10: AMD Ryzen 5 150, 15.30", 1.6 kg
External Review » Lenovo IdeaPad Slim 3 15ARP10
Chuwi Corebook Air Plus: AMD Ryzen 5 6600H, 16.00", 1.4 kg
External Review » Chuwi Corebook Air Plus
Chuwi CoreBook Air: AMD Ryzen 5 6600H, 14.00", 1 kg
External Review » Chuwi CoreBook Air
Lenovo ThinkBook 16 G7 ARP: AMD Ryzen 5 7535HS, 16.00"
External Review » Lenovo ThinkBook 16 G7 ARP
Asus ExpertBook PM1503: AMD Ryzen 5 7535HS, 15.60", 1.8 kg
External Review » Asus ExpertBook PM1503
Asus Vivobook S 16 OLED M5606NA: AMD Ryzen 5 7535HS, 15.60", 1.7 kg
External Review » Asus Vivobook S 16 OLED M5606NA
Lenovo ThinkBook 14 G7 ARP: AMD Ryzen 5 7535HS, 14.00", 1.4 kg
External Review » Lenovo ThinkBook 14 G7 ARP
Lenovo ThinkPad E16 Gen 2 21M5002VGE: AMD Ryzen 5 7535HS, 16.00", 1.9 kg
External Review » Lenovo ThinkPad E16 Gen 2 21M5002VGE
HP EliteBook 645 G11: AMD Ryzen 5 7535U, 14.00", 1.4 kg
External Review » HP EliteBook 645 G11
Asus Vivobook S 15 OLED M5506NA: AMD Ryzen 5 7535HS, 15.60", 1.5 kg
External Review » Asus Vivobook S 15 OLED M5506NA
HP Pavilion Aero 13-be2000: AMD Ryzen 5 7535U, 13.30", 1 kg
External Review » HP Pavilion Aero 13-be2000
Lenovo Yoga Slim 7 Pro 14ARH7, R5 6600HS: AMD Ryzen 5 6600HS, 14.00", 1.3 kg
External Review » Lenovo Yoga Slim 7 Pro 14ARH7, R5 6600HS
Acer Swift Edge SFA16-41, Ryzen 5 6600U: AMD Ryzen 5 6600U, 16.00", 1.2 kg
External Review » Acer Swift Edge SFA16-41, Ryzen 5 6600U
Lenovo ThinkBook 13s G4 ARB, Ryzen 5 6600U: AMD Ryzen 5 6600U, 13.30", 1.2 kg
External Review » Lenovo ThinkBook 13s G4 ARB, Ryzen 5 6600U
Lenovo ThinkBook 13s G4 ARB-21AS0006GE: AMD Ryzen 5 6600U, 13.30", 1.2 kg
External Review » Lenovo ThinkBook 13s G4 ARB-21AS0006GE
Lenovo IdeaPad 5 Pro 16ARH7: AMD Ryzen 5 6600HS, 16.00", 1.9 kg
External Review » Lenovo IdeaPad 5 Pro 16ARH7
Lenovo ThinkPad Z13 21D2CTO1WW: AMD Ryzen 5 PRO 6650U, 13.30", 1.2 kg
External Review » Lenovo ThinkPad Z13 21D2CTO1WW
Asus ZenBook S 13 UM5302TA: AMD Ryzen 5 6600U, 13.30", 1.1 kg
External Review » Asus ZenBook S 13 UM5302TA
Chuwi CoreBook Air: AMD Ryzen 5 6600H, 14.00", 1 kg
» 14-inch notebook at a low price: Chuwi CoreBook Air with AMD Ryzen reviewed
GMK NucBox M8: AMD Ryzen 5 PRO 6650H, 0.5 kg
» GMKtec NucBox M8 is a newer mini PC with an older AMD Zen 3+ processor
Ninkear S14, 16+1TB: AMD Ryzen 5 7535HS, 14.00", 1.1 kg
» Compact and lightweight everyday notebook with 2K display for pupils and students - Ninkear S14 review
» Compact and lightweight everyday notebook with 2K display for pupils and students - Ninkear S14 review
Lenovo ThinkPad L14 G5 21L50014GE: AMD Ryzen 5 7535U, 14.00", 1.6 kg
» Lenovo ThinkPad L14 Gen 5: The only modern 14-inch ThinkPad with three USB-A ports
Lenovo ThinkPad X13 G3 21CM002UGE: AMD Ryzen 5 PRO 6650U, 13.30", 1.3 kg
» Lenovo ThinkPad X13 Gen 3 with AMD Ryzen 7 Pro 6850U discounted by $323 in limited-time sale
» Lenovo ThinkPad X13 G3 AMD: A good choice even in 2023
» Lenovo ThinkPad X13 Gen 3 with AMD Ryzen 7 Pro 6850U, 16GB RAM and 1TB SSD discounted by 66%
Lenovo ThinkPad Z13 21D2CTO1WW: AMD Ryzen 5 PRO 6650U, 13.30", 1.2 kg
» New Lenovo ThinkPad Z series feature haptic Sensel trackpad for the first time
Lenovo ThinkPad T16 G1 21CH004MGE: AMD Ryzen 5 PRO 6650U, 16.00", 1.8 kg
» Lenovo ThinkPad T16 G1 AMD tested: Significantly faster and more efficient than Intel version
Lenovo ThinkPad Z13 21D2CTO1WW: AMD Ryzen 5 PRO 6650U, 13.30", 1.2 kg
» Lenovo ThinkPad Z13: The integrated TrackPoint buttons might succeed this time around