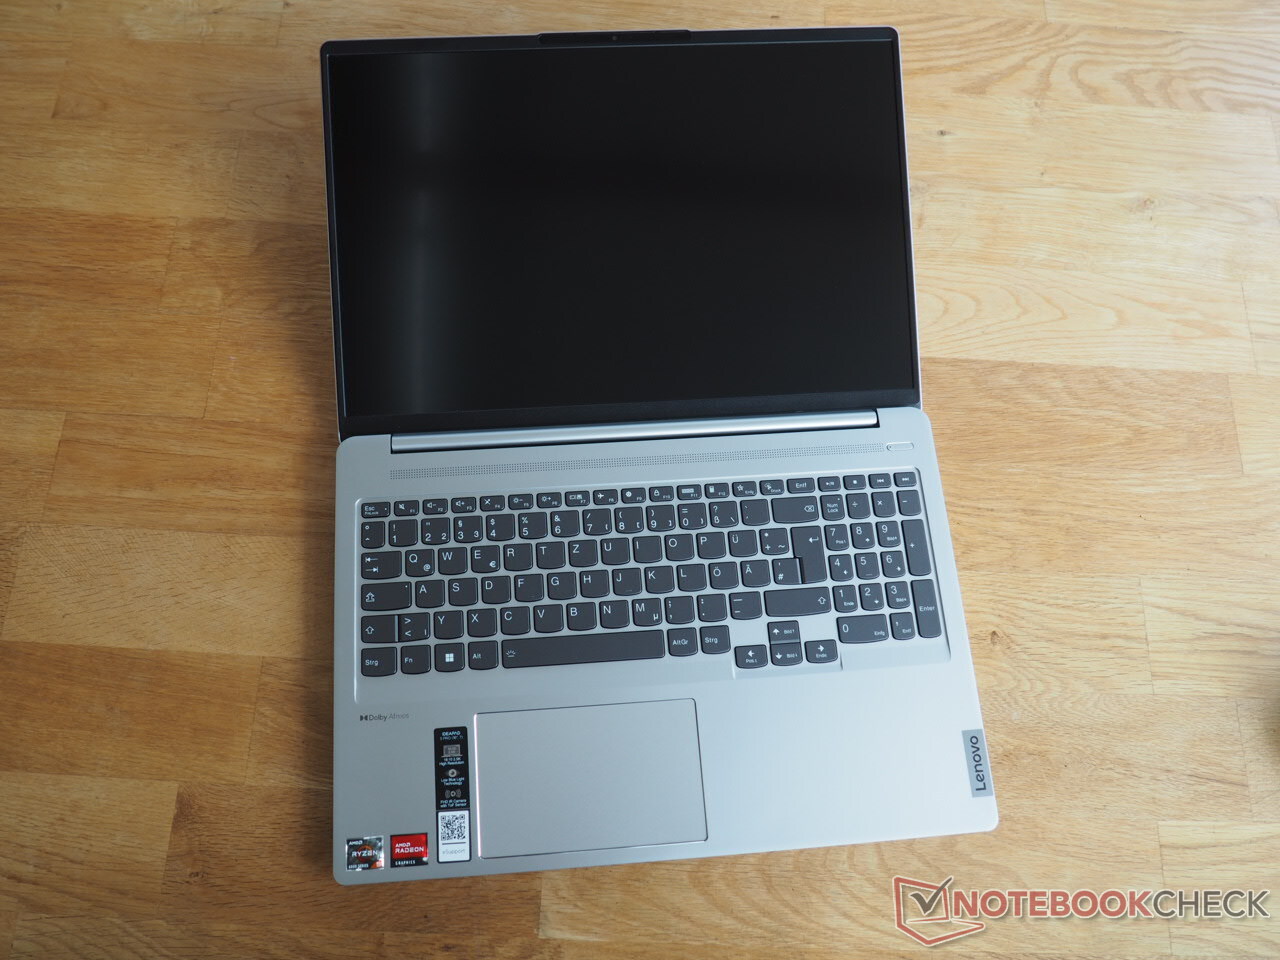
Lenovo IdeaPad 5 Pro 16ARH7 laptop review: Ryzen 5 6600HS meets good 16:10 display

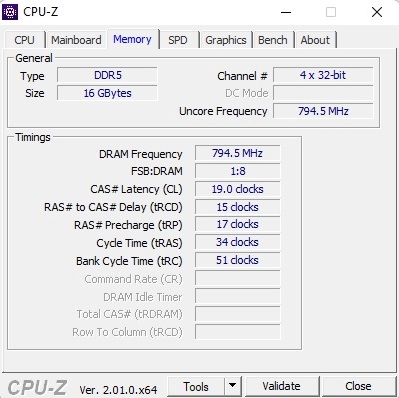
The tested 16ARH7 model isn't very affordable for the offered performance, considering its price of almost 1,000 Euros (~$998). On the other hand, the 16-inch laptop scores with a high quality and first-rate display. According to the manufacturer, the IPS screen used here offers 350 cd/m², 120 Hz, and 100% sRGB. The resolution of 2,560 x 1,600 pixels is also nothing to scoff at. As the storage solution, a 512-GB NVMe SSD is used, and the DDR5 working memory, which is unfortunately soldered and cannot be expanded, offers 16 GB. As already mentioned, for the processor, Lenovo has decided for the rather rare Ryzen 5 6600HS that uses a Radeon 660M.
The competitors of the IdeaPad 5 Pro include other 16-inch laptops such as the Huawei MateBook D16, the Acer Swift 3 SF316-51, the LG Gram 16, and the Lenovo Yoga 7 16IAP7, which all use different CPUs, but their graphics accelerator is the comparably fast Iris Xe G7 with 96 EUs.
Possible Competitors in Comparison
Rating | Date | Model | Weight | Height | Size | Resolution | Price |
|---|---|---|---|---|---|---|---|
| 85.7 % v7 (old) | 09 / 2022 | Lenovo IdeaPad 5 Pro 16ARH7 R5 6600HS, Radeon 660M | 1.9 kg | 18.4 mm | 16.00" | 2560x1600 | |
| 83.6 % v7 (old) | 07 / 2022 | Huawei MateBook D 16 2022 i7-12700H, Iris Xe G7 96EUs | 1.7 kg | 18.4 mm | 16.00" | 1920x1200 | |
| 86.4 % v7 (old) | 10 / 2021 | Acer Swift 3 SF316-51 i7-11370H, Iris Xe G7 96EUs | 1.7 kg | 15.9 mm | 16.10" | 1920x1080 | |
| 86.3 % v7 (old) | 06 / 2021 | LG Gram 16 (2021) i7-1165G7, Iris Xe G7 96EUs | 1.2 kg | 16.8 mm | 16.00" | 2560x1600 | |
| 88.7 % v7 (old) | 08 / 2022 | Lenovo Yoga 7 16IAP7 i7-1260P, Iris Xe G7 96EUs | 2 kg | 19.2 mm | 16.00" | 2560x1600 |
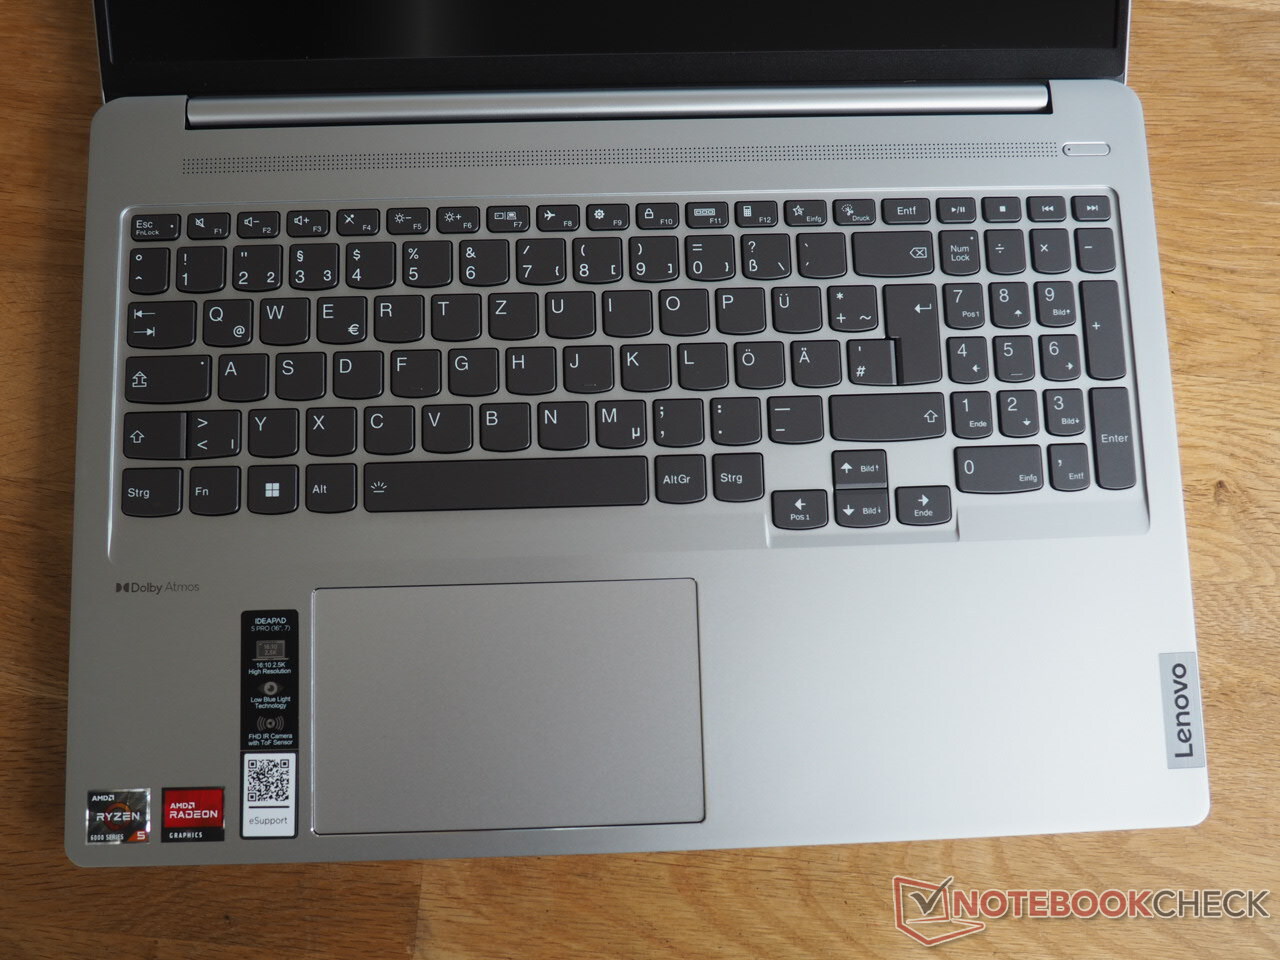
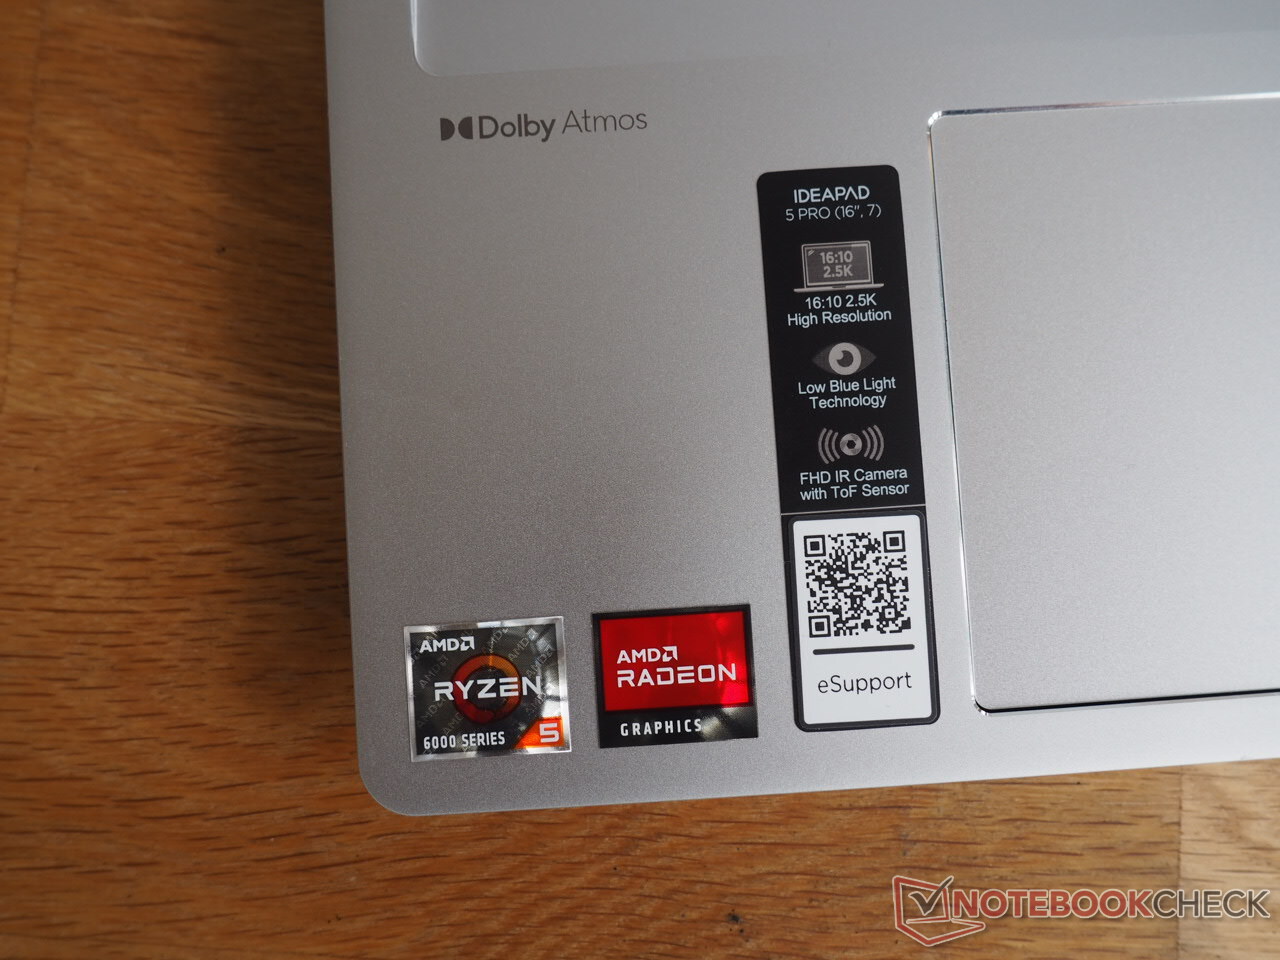
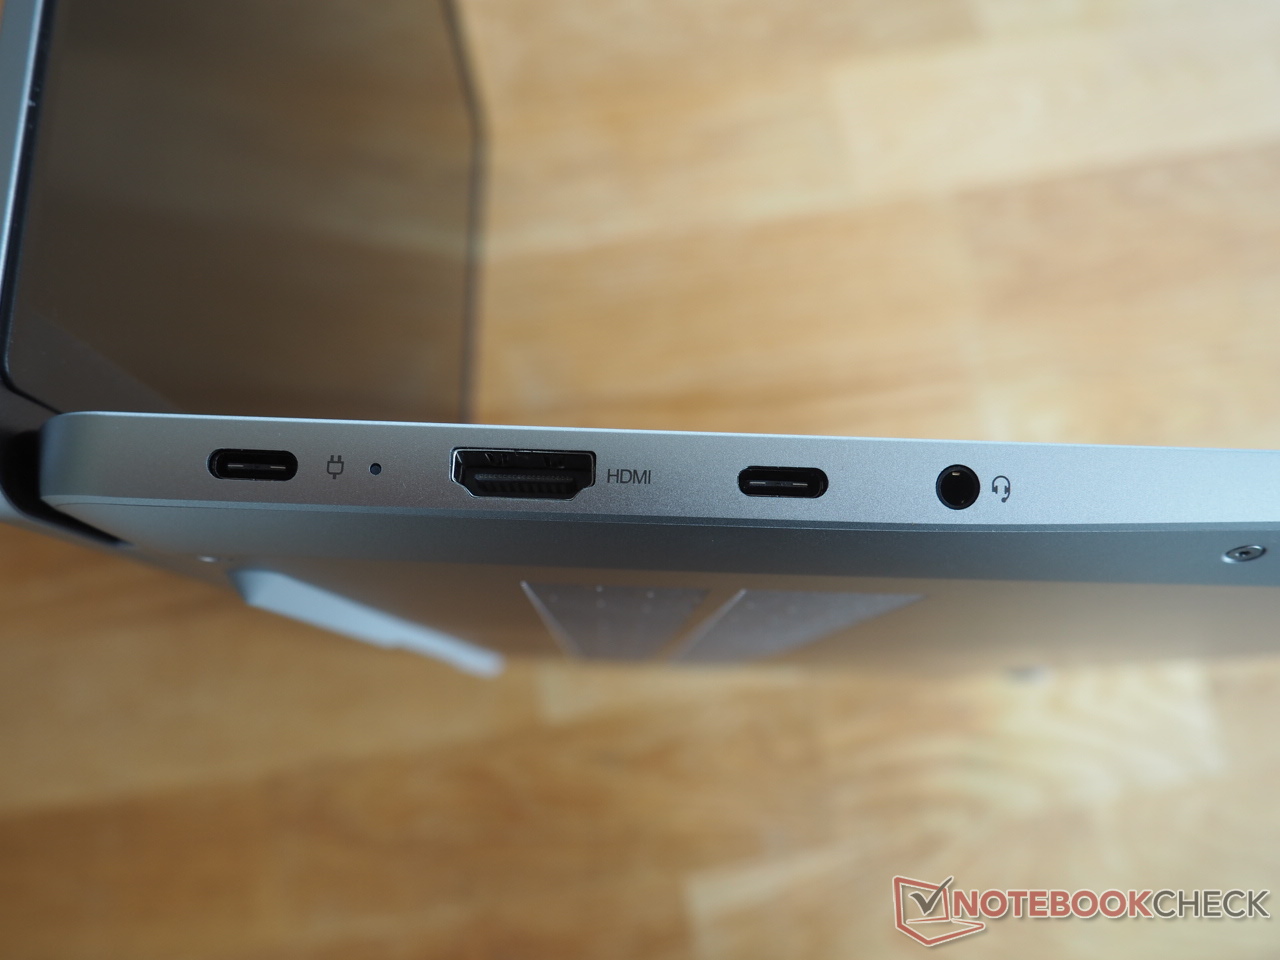
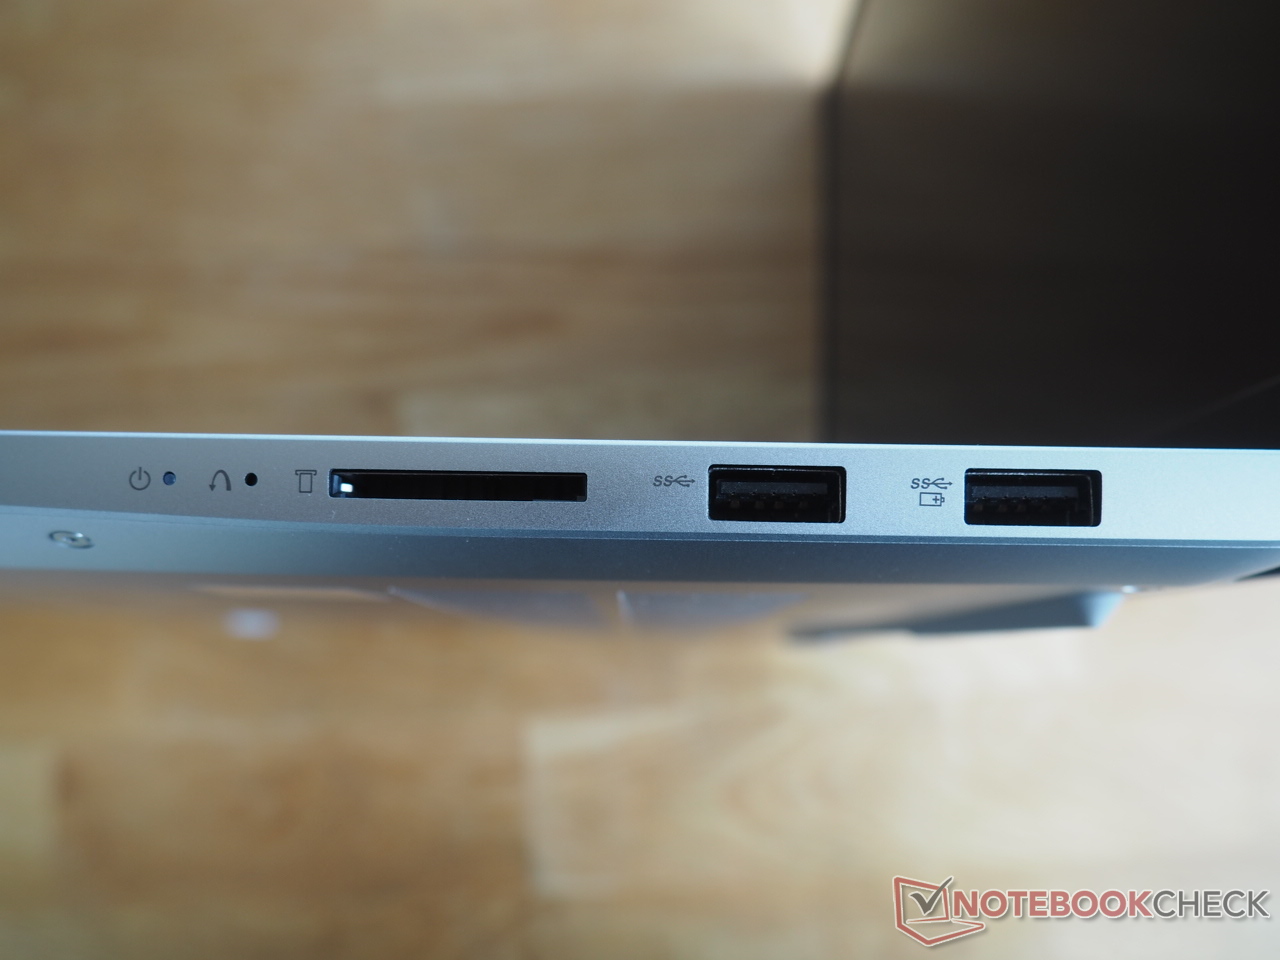
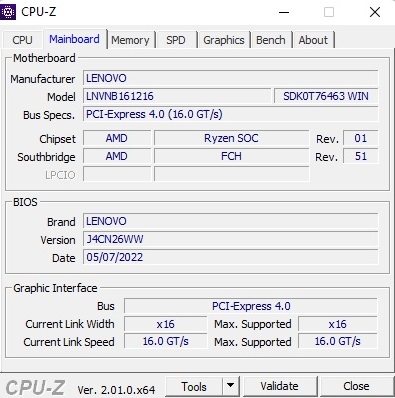
Since the case is to a large extent identical to the already tested 5 Pro 16IHU6 with Core i5-11300H and GeForce MX450, and the connections are also similar except for a single detail (the USB-C 3.2 Gen2 port has to make do without Thunderbolt support), we won't discuss the case, connection equipment, and input devices again here. You can find the corresponding information in this review of the sibling model.
SD Card Reader
| SD Card Reader - average JPG Copy Test (av. of 3 runs) | |
| Average of class Multimedia (23 - 531, n=43, last 2 years) | |
| Lenovo Yoga 7 16IAP7 (Toshiba Exceria Pro SDXC 64 GB UHS-II) | |
| Lenovo IdeaPad 5 Pro 16ARH7 (AV PRO microSD 128 GB V60) | |
| LG Gram 16 (2021) (Toshiba Exceria Pro M501 microSDXC 64GB) | |
Communication
Webcam


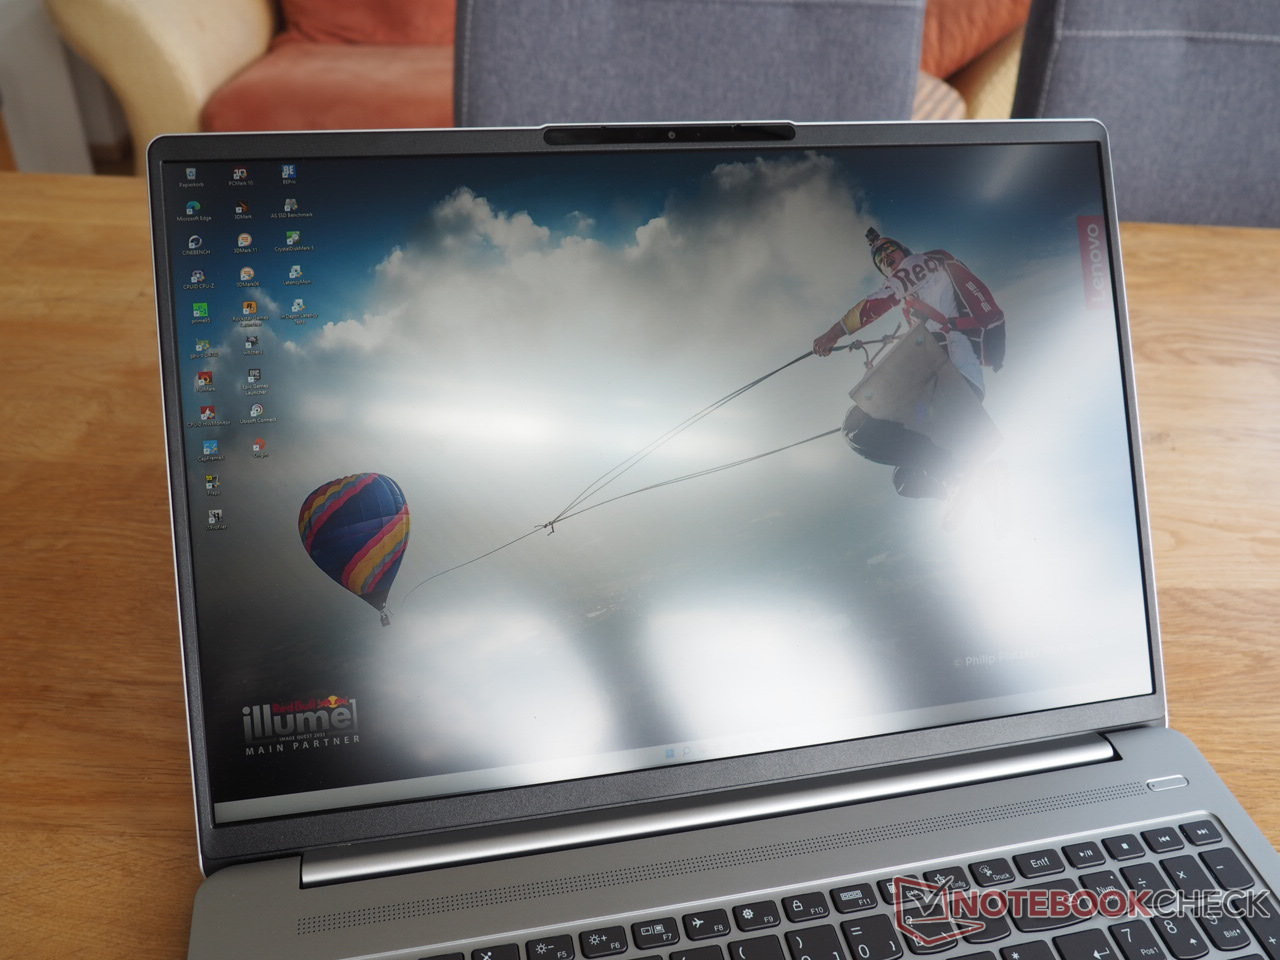
Display
One of the largest highlights and purchase arguments for the 16ARH7 is the excellent display that doesn't commit even a single slip up in any discipline.
| |||||||||||||||||||||||||
Brightness Distribution: 91 %
Center on Battery: 415 cd/m²
Contrast: 1297:1 (Black: 0.32 cd/m²)
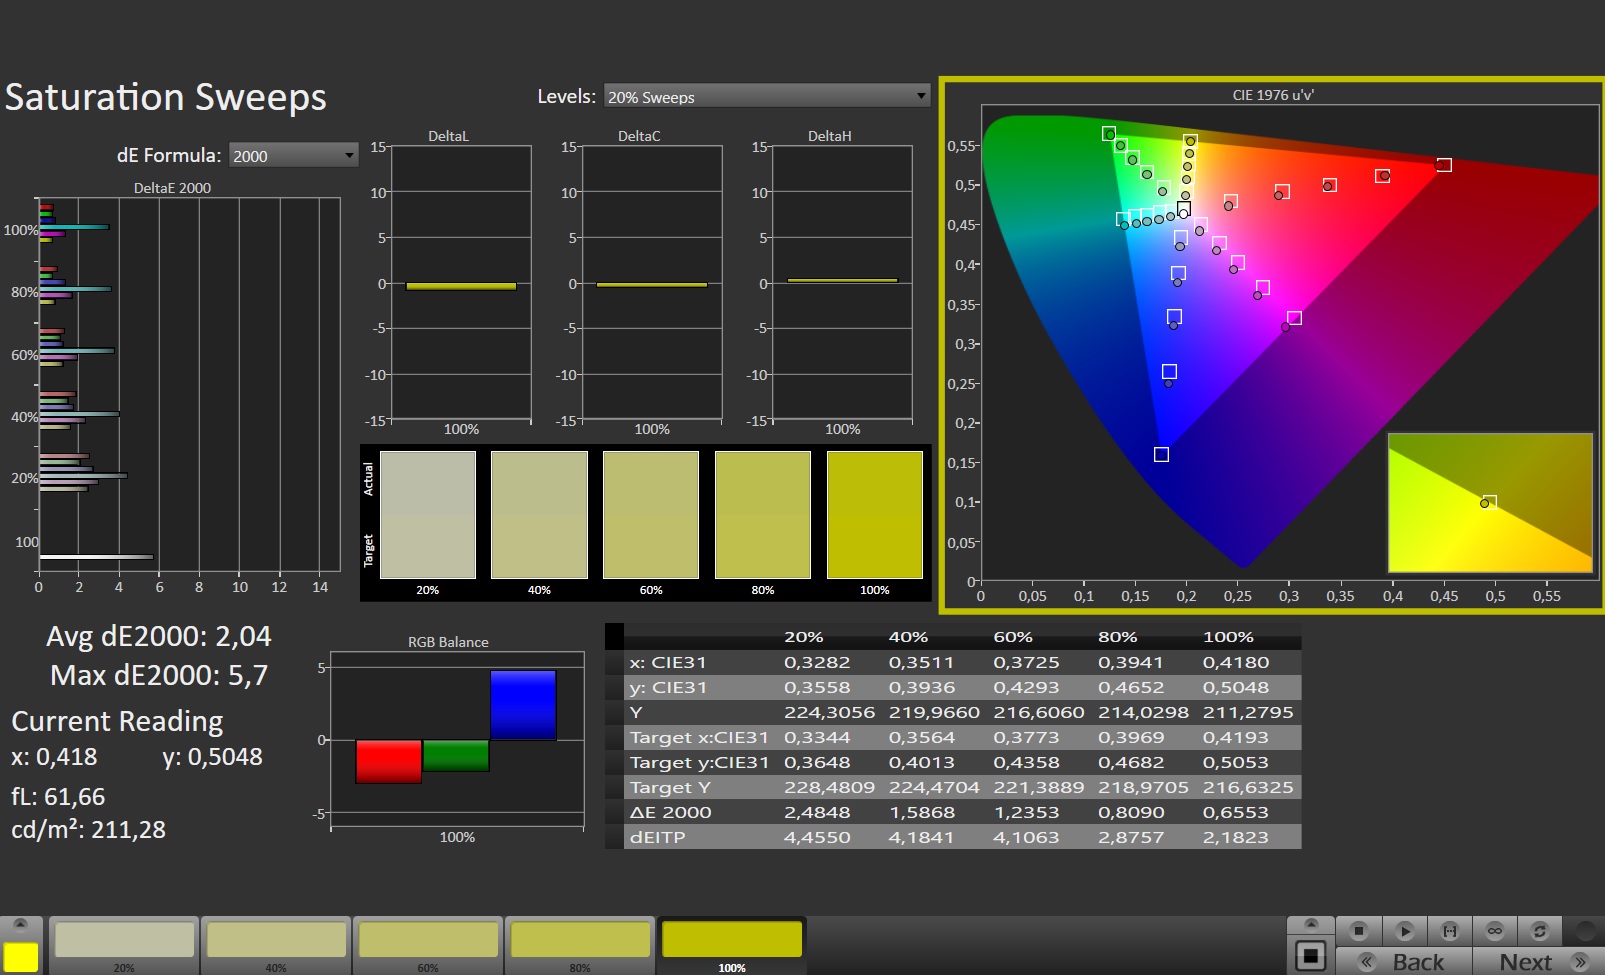
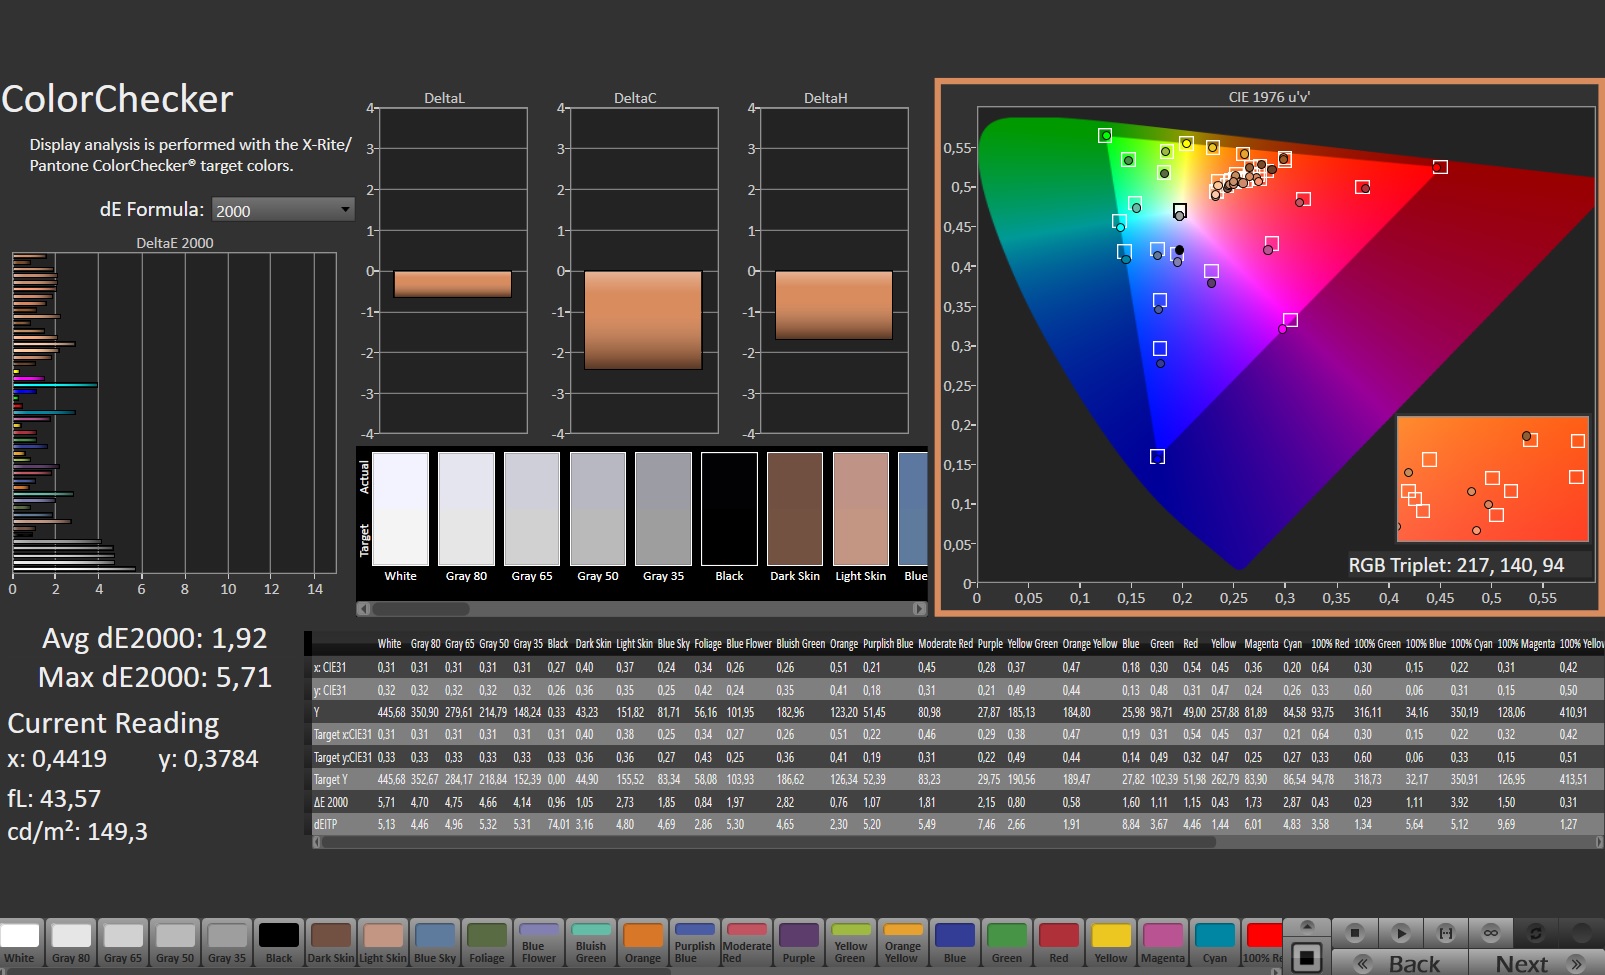
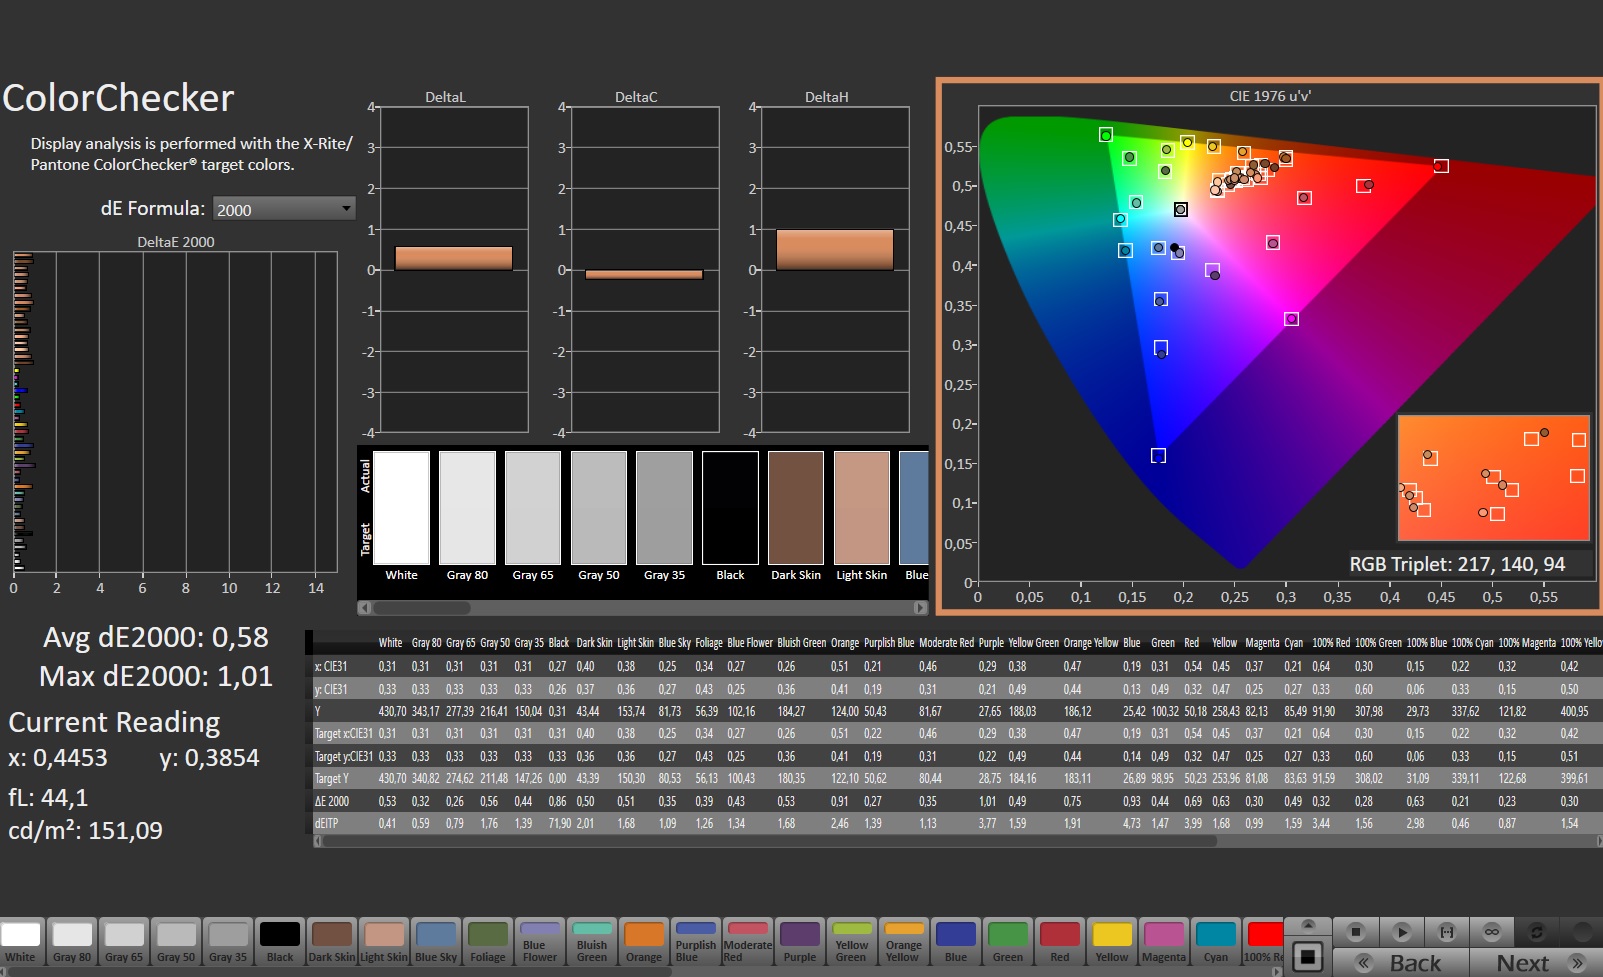
ΔE ColorChecker Calman: 1.92 | ∀{0.5-29.43 Ø4.73}
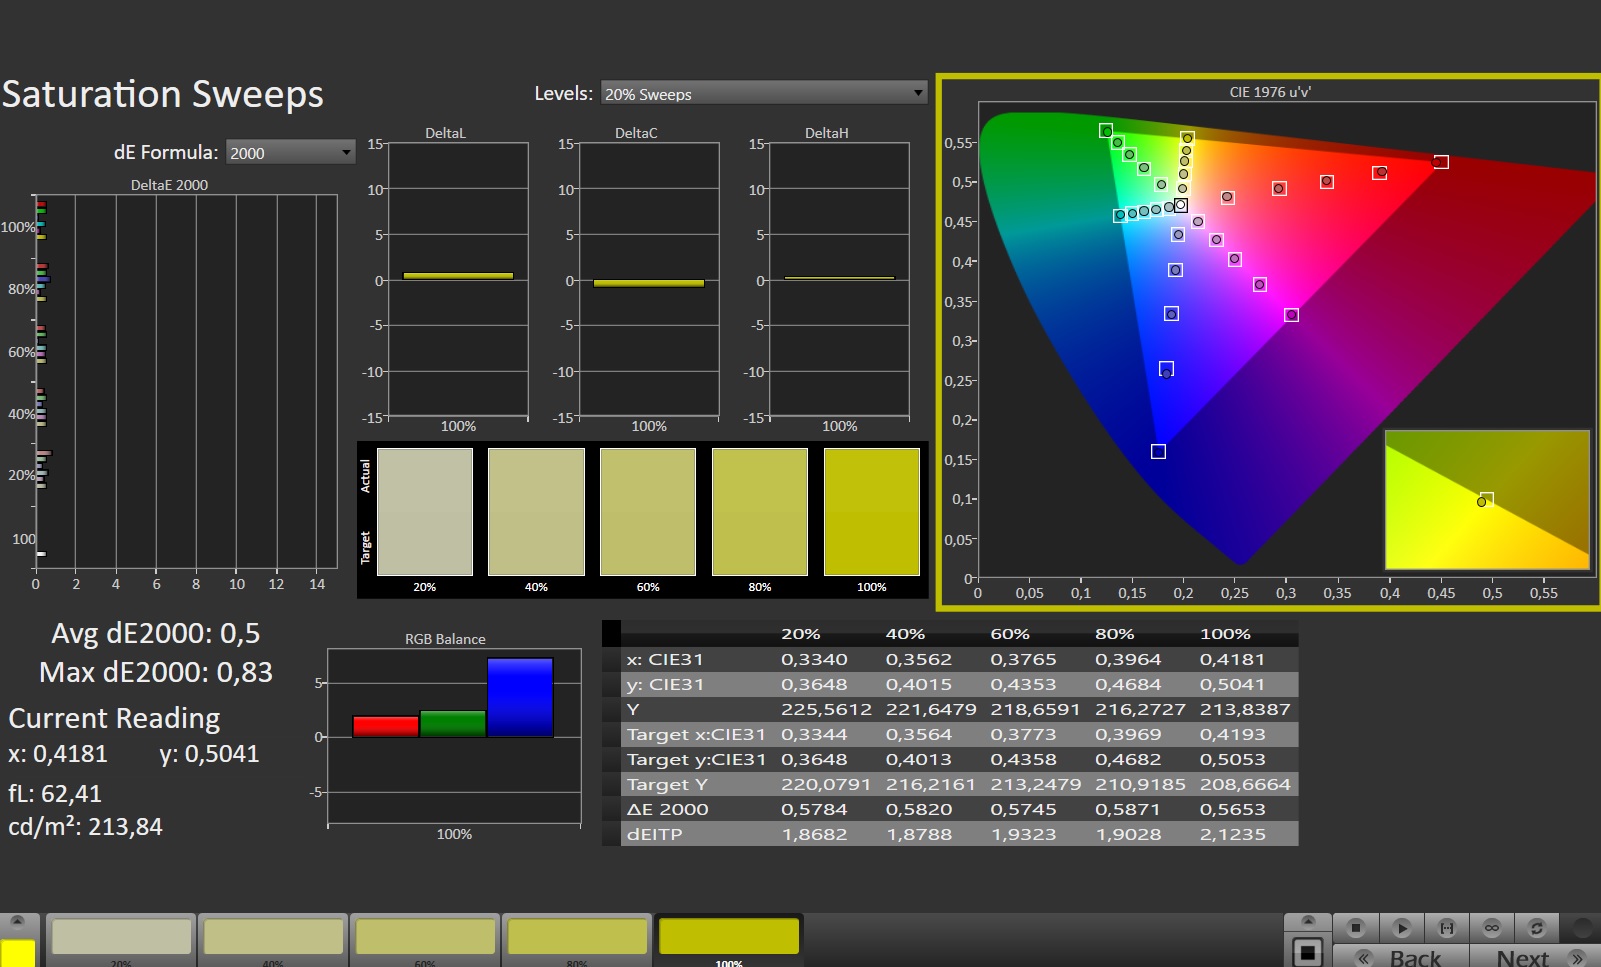
calibrated: 0.58
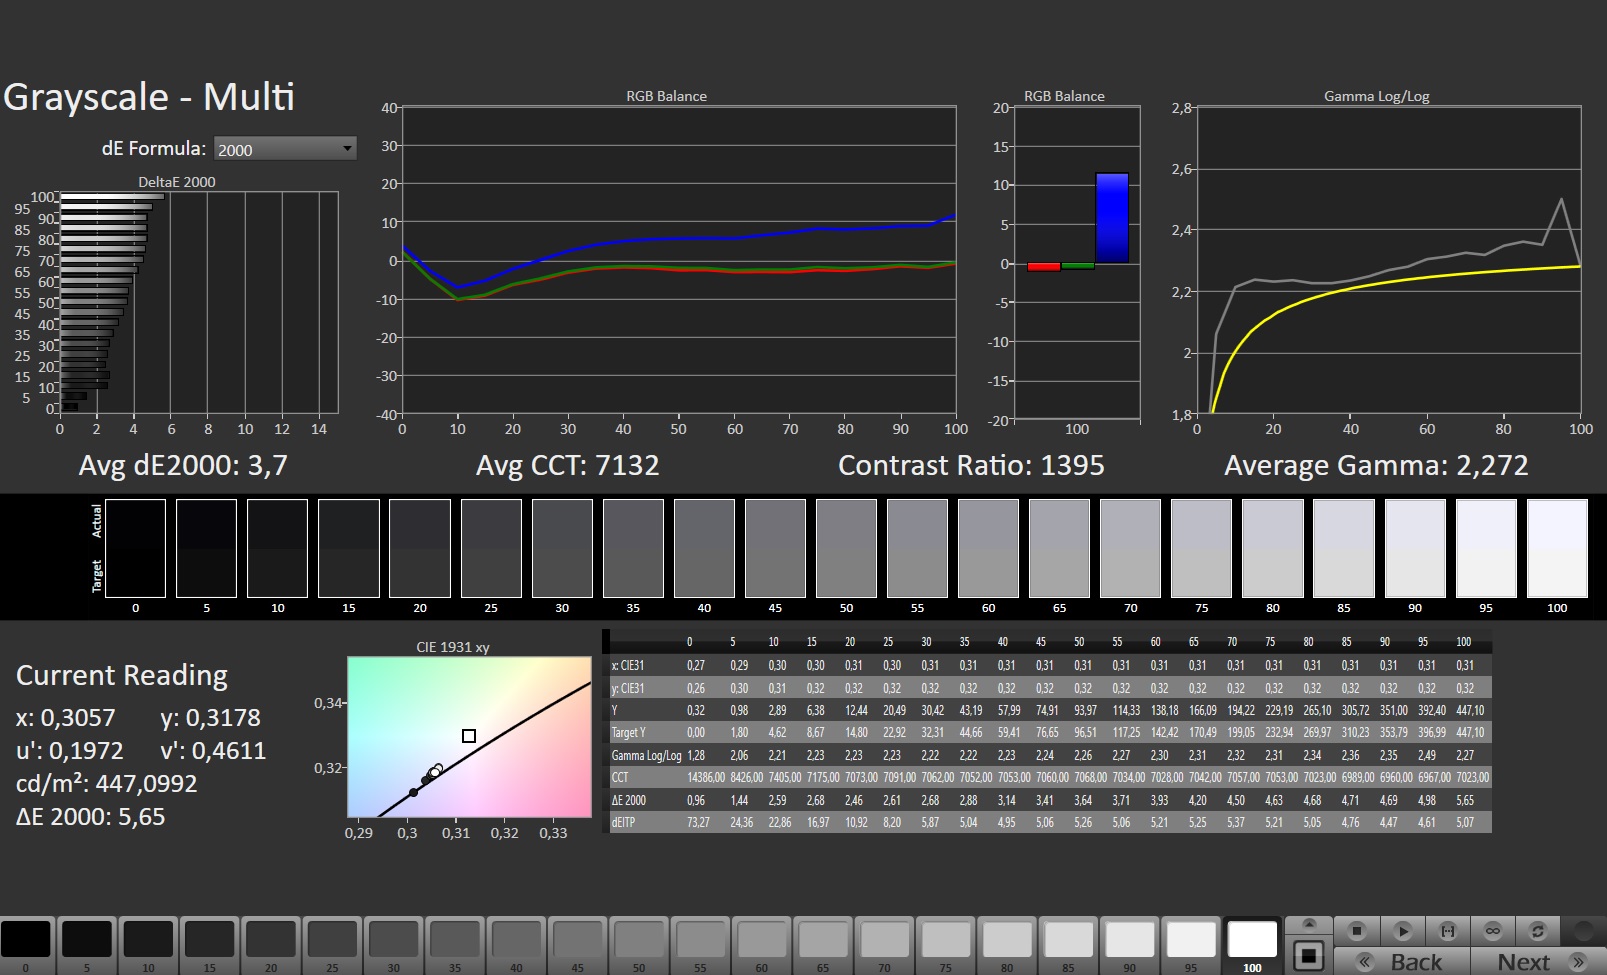
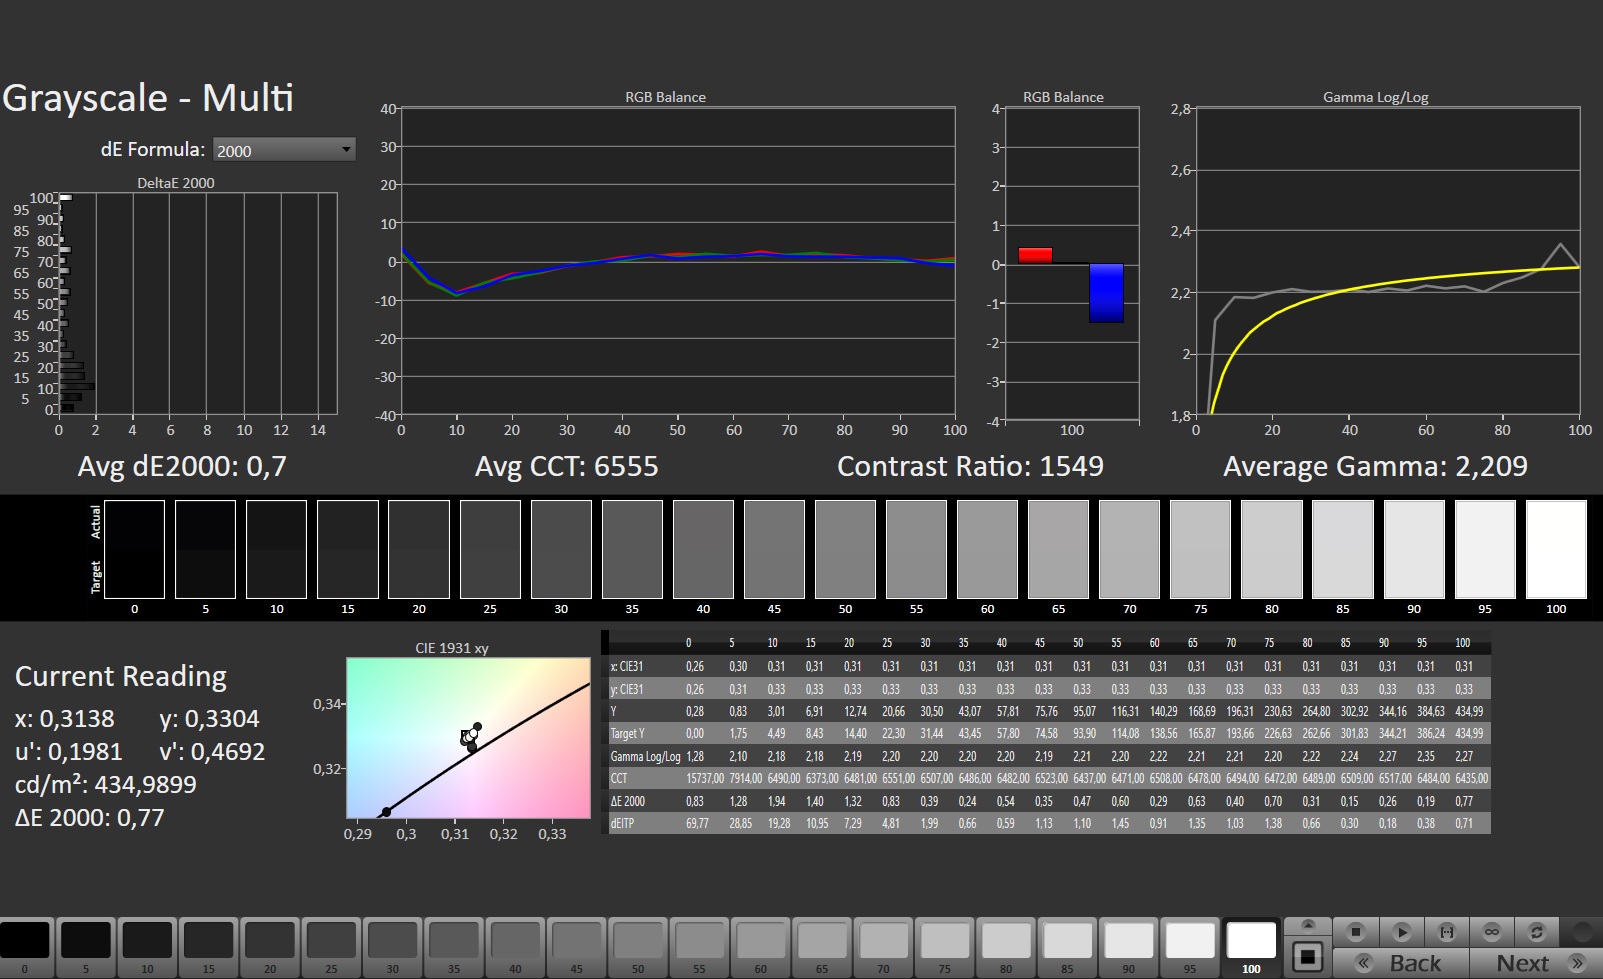
ΔE Greyscale Calman: 3.7 | ∀{0.09-98 Ø4.97}
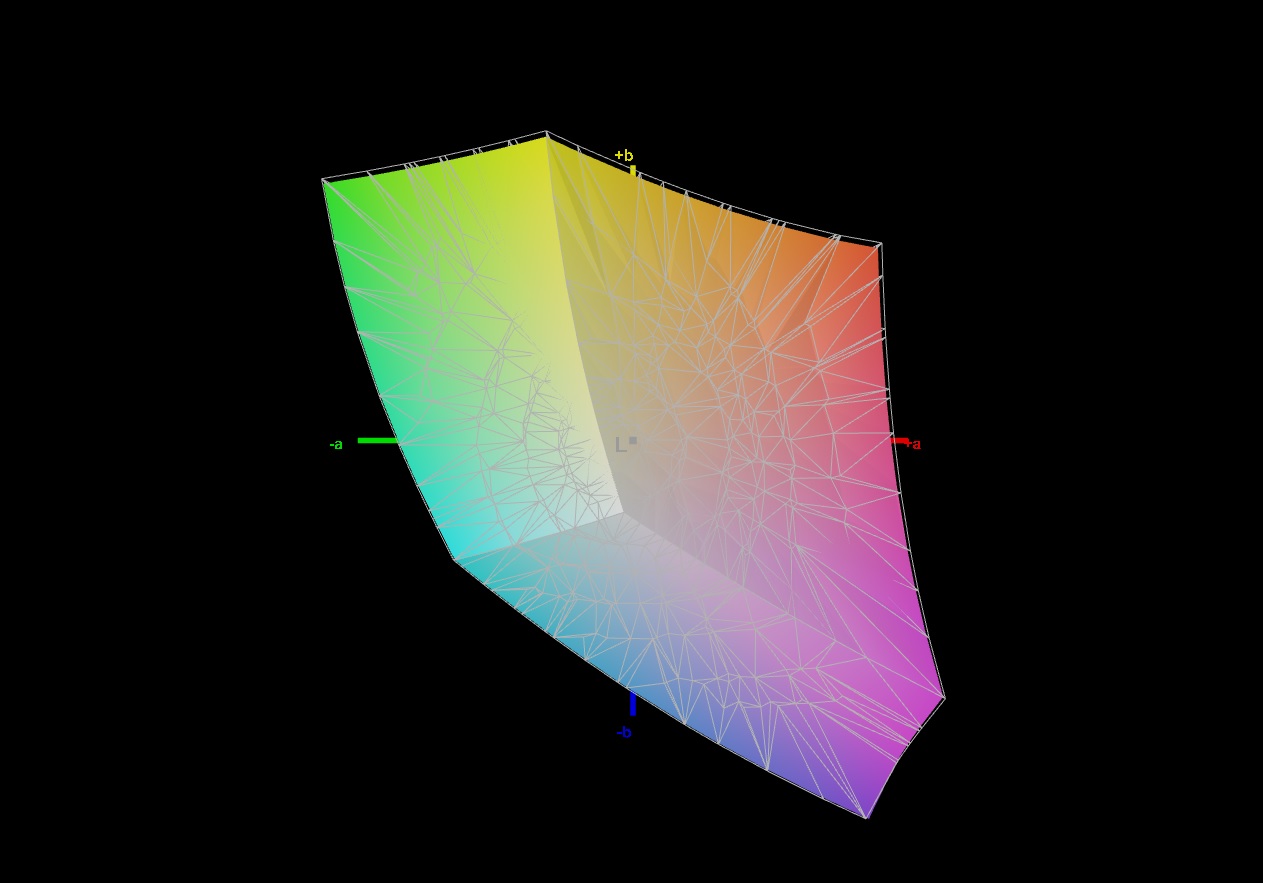
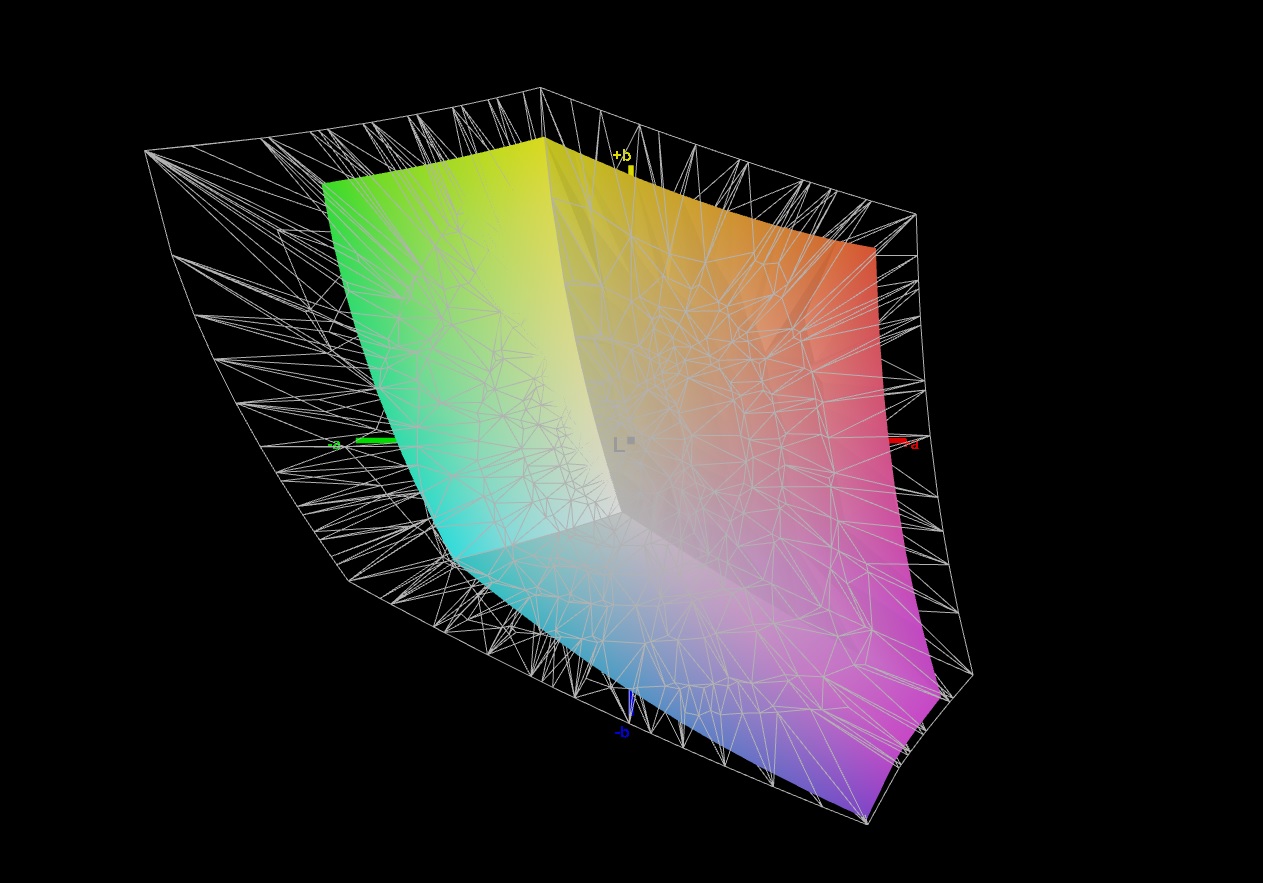
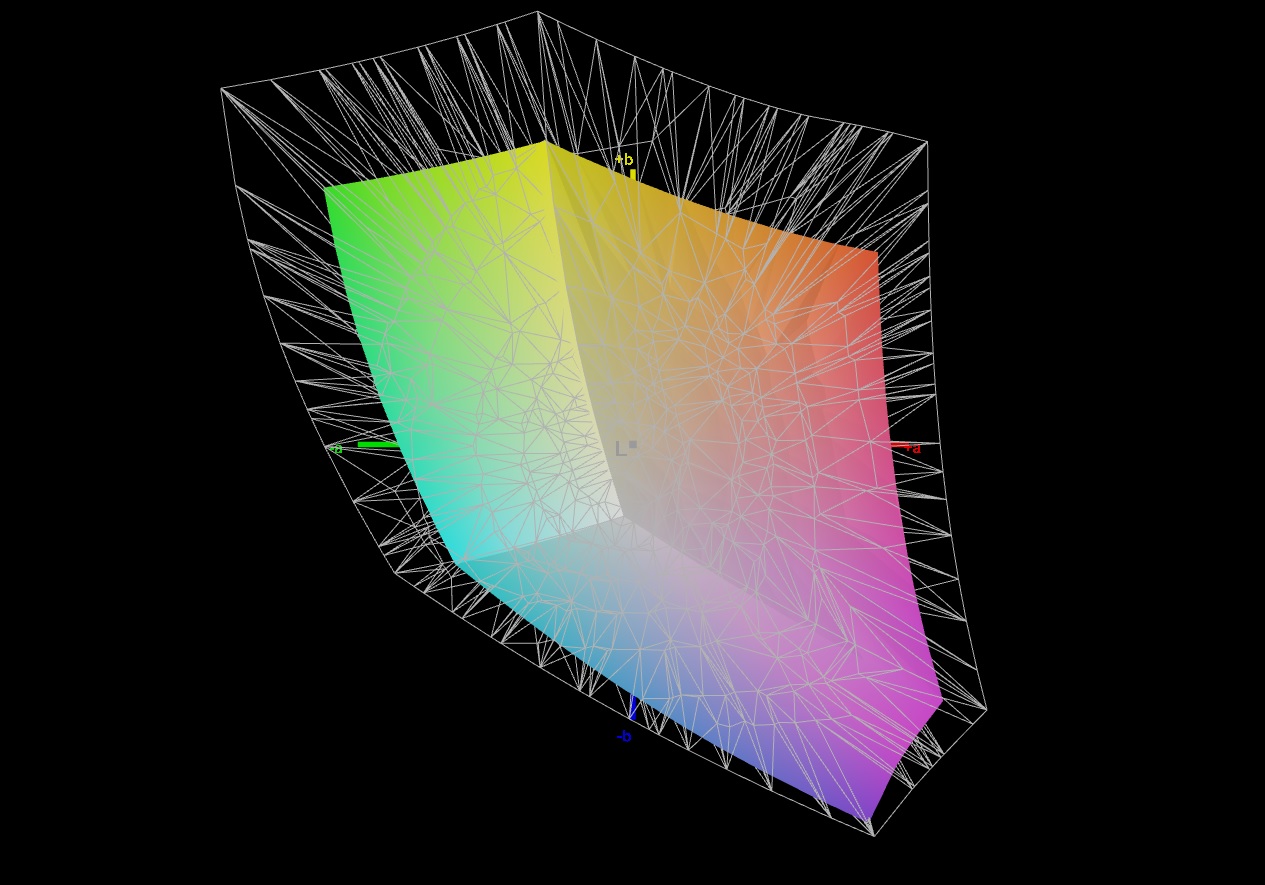
67.2% AdobeRGB 1998 (Argyll 3D)
98% sRGB (Argyll 3D)
65% Display P3 (Argyll 3D)
Gamma: 2.272
CCT: 7132 K
| Lenovo IdeaPad 5 Pro 16ARH7 AUO B160QAN02.H, IPS, 2560x1600, 16" | Huawei MateBook D 16 2022 BOE NV160WUM-NH0, IPS, 1920x1200, 16" | Acer Swift 3 SF316-51 Chi Mei CMN160B, IPS, 1920x1080, 16.1" | LG Gram 16 (2021) LG Philips LP160WQ1-SPA1, IPS, 2560x1600, 16" | Lenovo Yoga 7 16IAP7 Lenovo LEN160WQXGA, IPS, 2560x1600, 16" | |
|---|---|---|---|---|---|
| Display | 1% | 2% | 25% | 1% | |
| Display P3 Coverage (%) | 65 | 66.2 2% | 66.6 2% | 95.8 47% | 67 3% |
| sRGB Coverage (%) | 98 | 96.4 -2% | 99.5 2% | 99.8 2% | 95.7 -2% |
| AdobeRGB 1998 Coverage (%) | 67.2 | 68.3 2% | 68.5 2% | 83.8 25% | 69.3 3% |
| Response Times | -140% | -155% | -197% | -202% | |
| Response Time Grey 50% / Grey 80% * (ms) | 14.1 ? | 30.5 ? -116% | 32 ? -127% | 44 ? -212% | 36 ? -155% |
| Response Time Black / White * (ms) | 7.1 ? | 18.7 ? -163% | 20 ? -182% | 20 ? -182% | 24.8 ? -249% |
| PWM Frequency (Hz) | 2500 ? | ||||
| Screen | -25% | 15% | -83% | -3% | |
| Brightness middle (cd/m²) | 415 | 319 -23% | 304 -27% | 331 -20% | 393.7 -5% |
| Brightness (cd/m²) | 409 | 317 -22% | 284 -31% | 309 -24% | 367 -10% |
| Brightness Distribution (%) | 91 | 90 -1% | 88 -3% | 88 -3% | 84 -8% |
| Black Level * (cd/m²) | 0.32 | 0.23 28% | 0.165 48% | 0.22 31% | 0.38 -19% |
| Contrast (:1) | 1297 | 1387 7% | 1842 42% | 1505 16% | 1036 -20% |
| Colorchecker dE 2000 * | 1.92 | 3.4 -77% | 1.44 25% | 4.64 -142% | 1.97 -3% |
| Colorchecker dE 2000 max. * | 5.71 | 8.1 -42% | 3.62 37% | 9.82 -72% | 5.46 4% |
| Colorchecker dE 2000 calibrated * | 0.58 | 0.8 -38% | 3.16 -445% | 0.62 -7% | |
| Greyscale dE 2000 * | 3.7 | 5.7 -54% | 2.6 30% | 6.9 -86% | 2.1 43% |
| Gamma | 2.272 97% | 2.1 105% | 2.41 91% | 2.34 94% | 2.1 105% |
| CCT | 7132 91% | 7433 87% | 6527 100% | 7904 82% | 6461 101% |
| Color Space (Percent of AdobeRGB 1998) (%) | 68.5 | 75.1 | |||
| Color Space (Percent of sRGB) (%) | 99.5 | 100 | |||
| Total Average (Program / Settings) | -55% /
-36% | -46% /
-14% | -85% /
-76% | -68% /
-30% |
* ... smaller is better
The 16-inch display comes in the 16:10 format and delivers a quite sharp image, thanks to its fairly high resolution of 2560 x 1600 pixels. A 100% sRGB coverage is also respectable, but all the competitors achieve the same here. However, in terms of the response time, none of the competitors is able to keep up with the IdeaPad 5. Around 7 ms black-to-white and 14 ms grey-to-grey is otherwise known more from gaming laptops. This is not surprising, since Lenovo has equipped the 16-inch laptop with a 120-Hz panel.
In terms of the brightness, the IdeaPad also places on top. An average of 409 cd/m² is an extremely good value that also allows using it outdoors. The viewing angles are at IPS typical levels, so they are also generous.
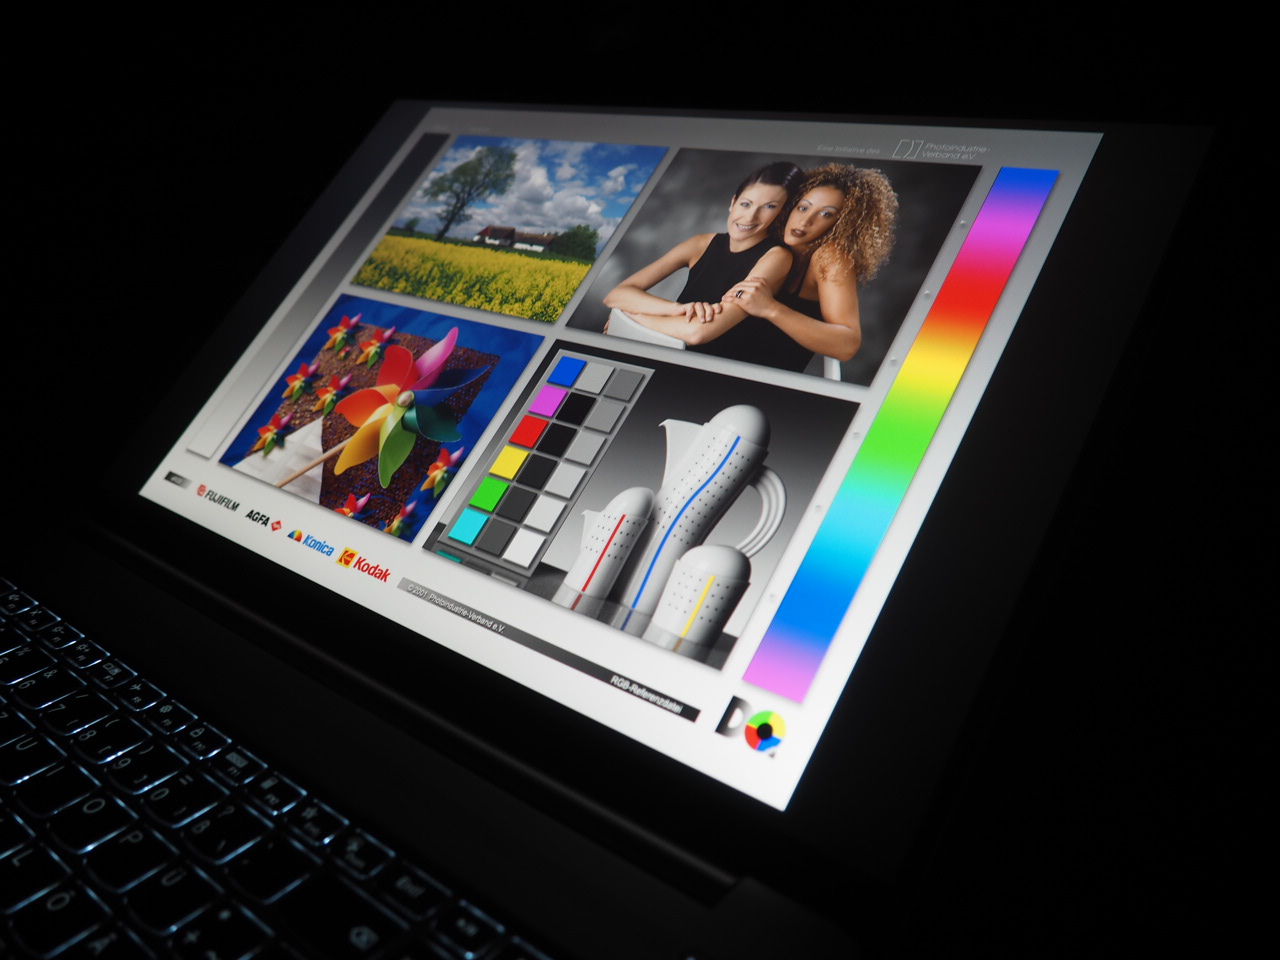
Lenovo also deserves some praise for the high color accuracy. Already in the state of delivery, the display produces very natural colors that can even be improved further by a calibration. The black value of 0.32 cd/m² and contrast of 1,297:1 also give no reason for complaint, even if it isn't sufficient for the top position here.
Display Response Times
| ↔ Response Time Black to White | ||
|---|---|---|
| 7.1 ms ... rise ↗ and fall ↘ combined | ↗ 3 ms rise | 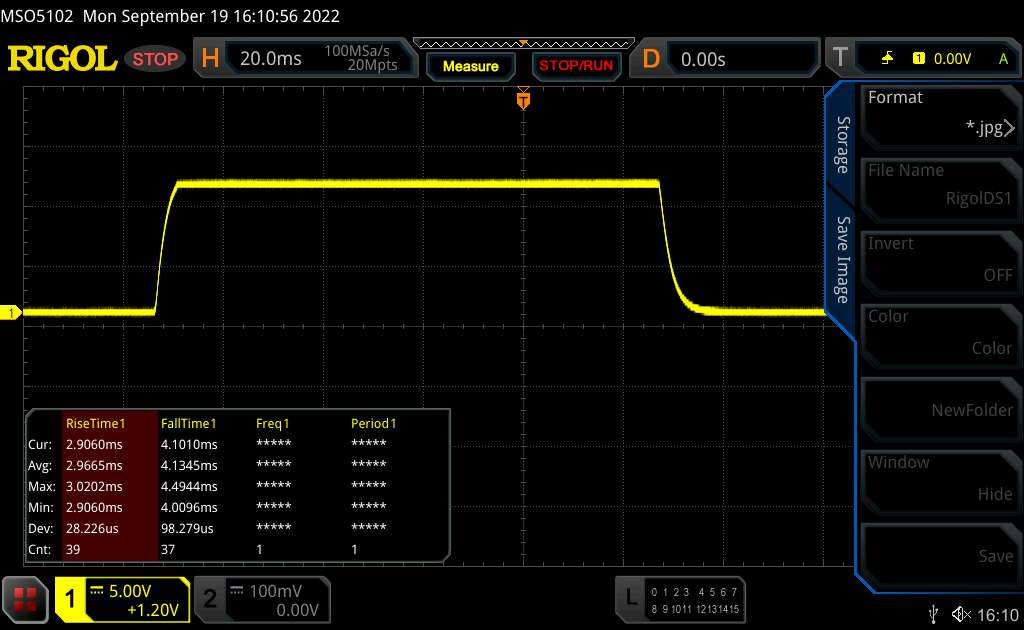 |
| ↘ 4.1 ms fall | ||
| The screen shows very fast response rates in our tests and should be very well suited for fast-paced gaming. In comparison, all tested devices range from 0.1 (minimum) to 240 (maximum) ms. » 21 % of all devices are better. This means that the measured response time is better than the average of all tested devices (19.9 ms). | ||
| ↔ Response Time 50% Grey to 80% Grey | ||
| 14.1 ms ... rise ↗ and fall ↘ combined | ↗ 6.7 ms rise | 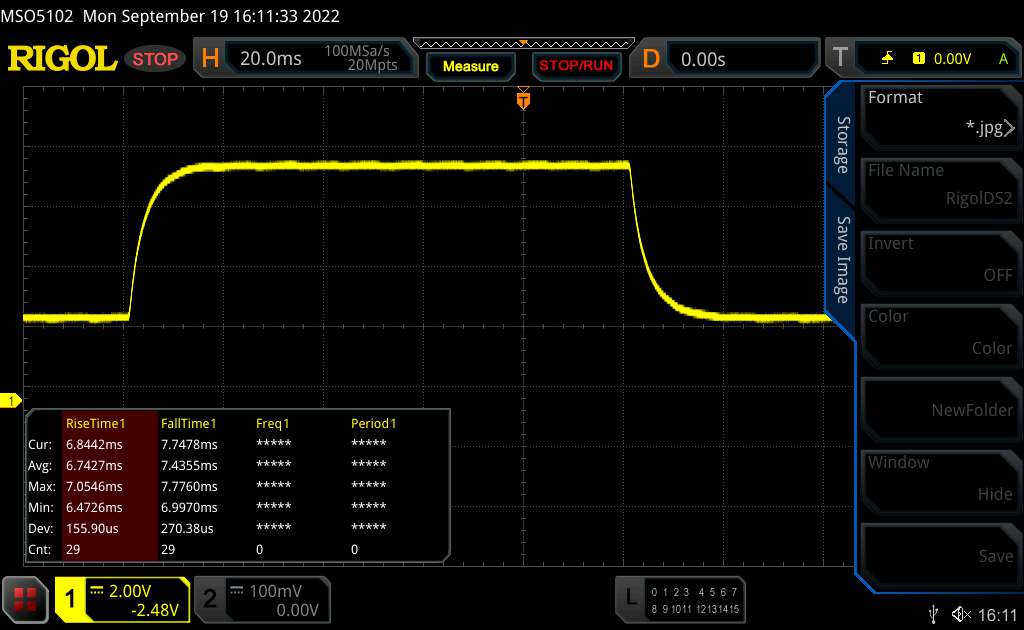 |
| ↘ 7.4 ms fall | ||
| The screen shows good response rates in our tests, but may be too slow for competitive gamers. In comparison, all tested devices range from 0.165 (minimum) to 636 (maximum) ms. » 28 % of all devices are better. This means that the measured response time is better than the average of all tested devices (31.1 ms). | ||
Screen Flickering / PWM (Pulse-Width Modulation)
| Screen flickering / PWM not detected |  | ||
In comparison: 52 % of all tested devices do not use PWM to dim the display. If PWM was detected, an average of 7798 (minimum: 5 - maximum: 343500) Hz was measured. | |||
Performance
The performance of the IdeaPad 5 Pro 16ARH7 can be considered mid-range. A hexa-core processor should offer sufficient performance in future years, just like 16 GB of RAM and an NVMe SSD. As expected, the 16-inch device shows some weaknesses in the 3D speed.
Test Conditions
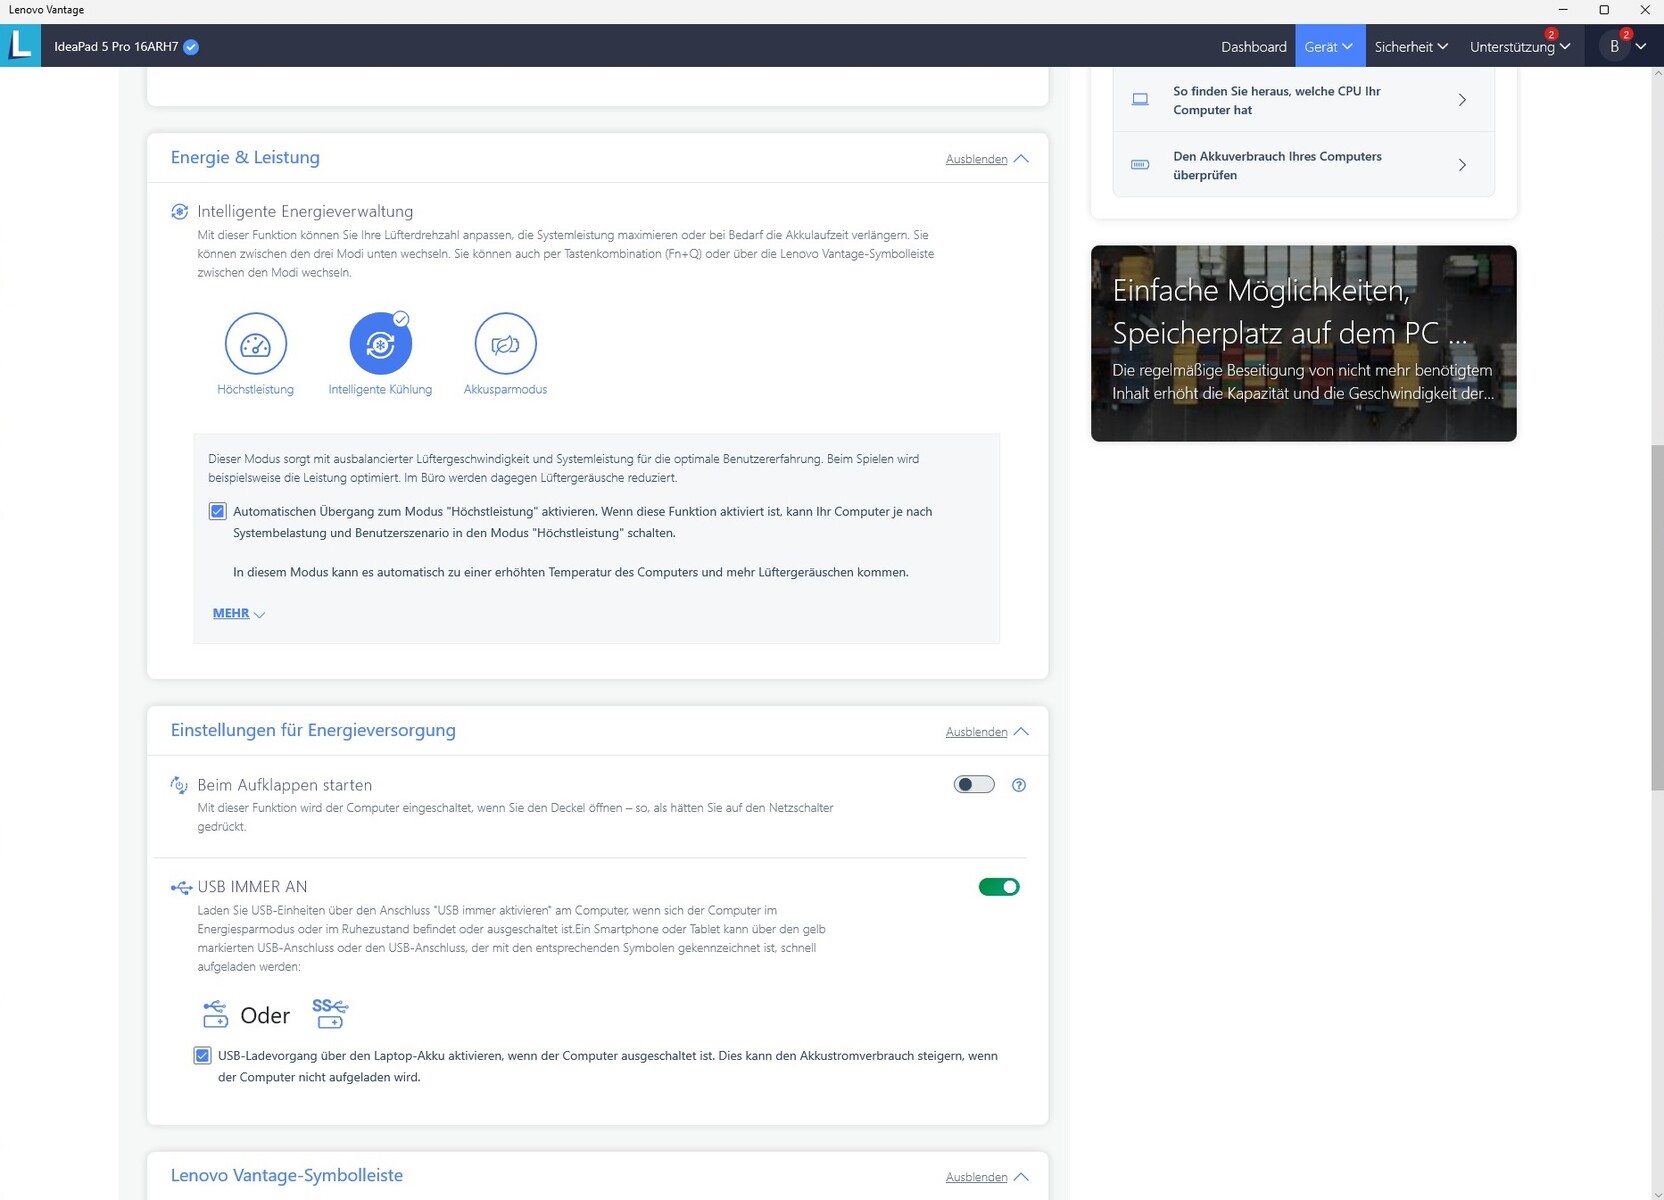
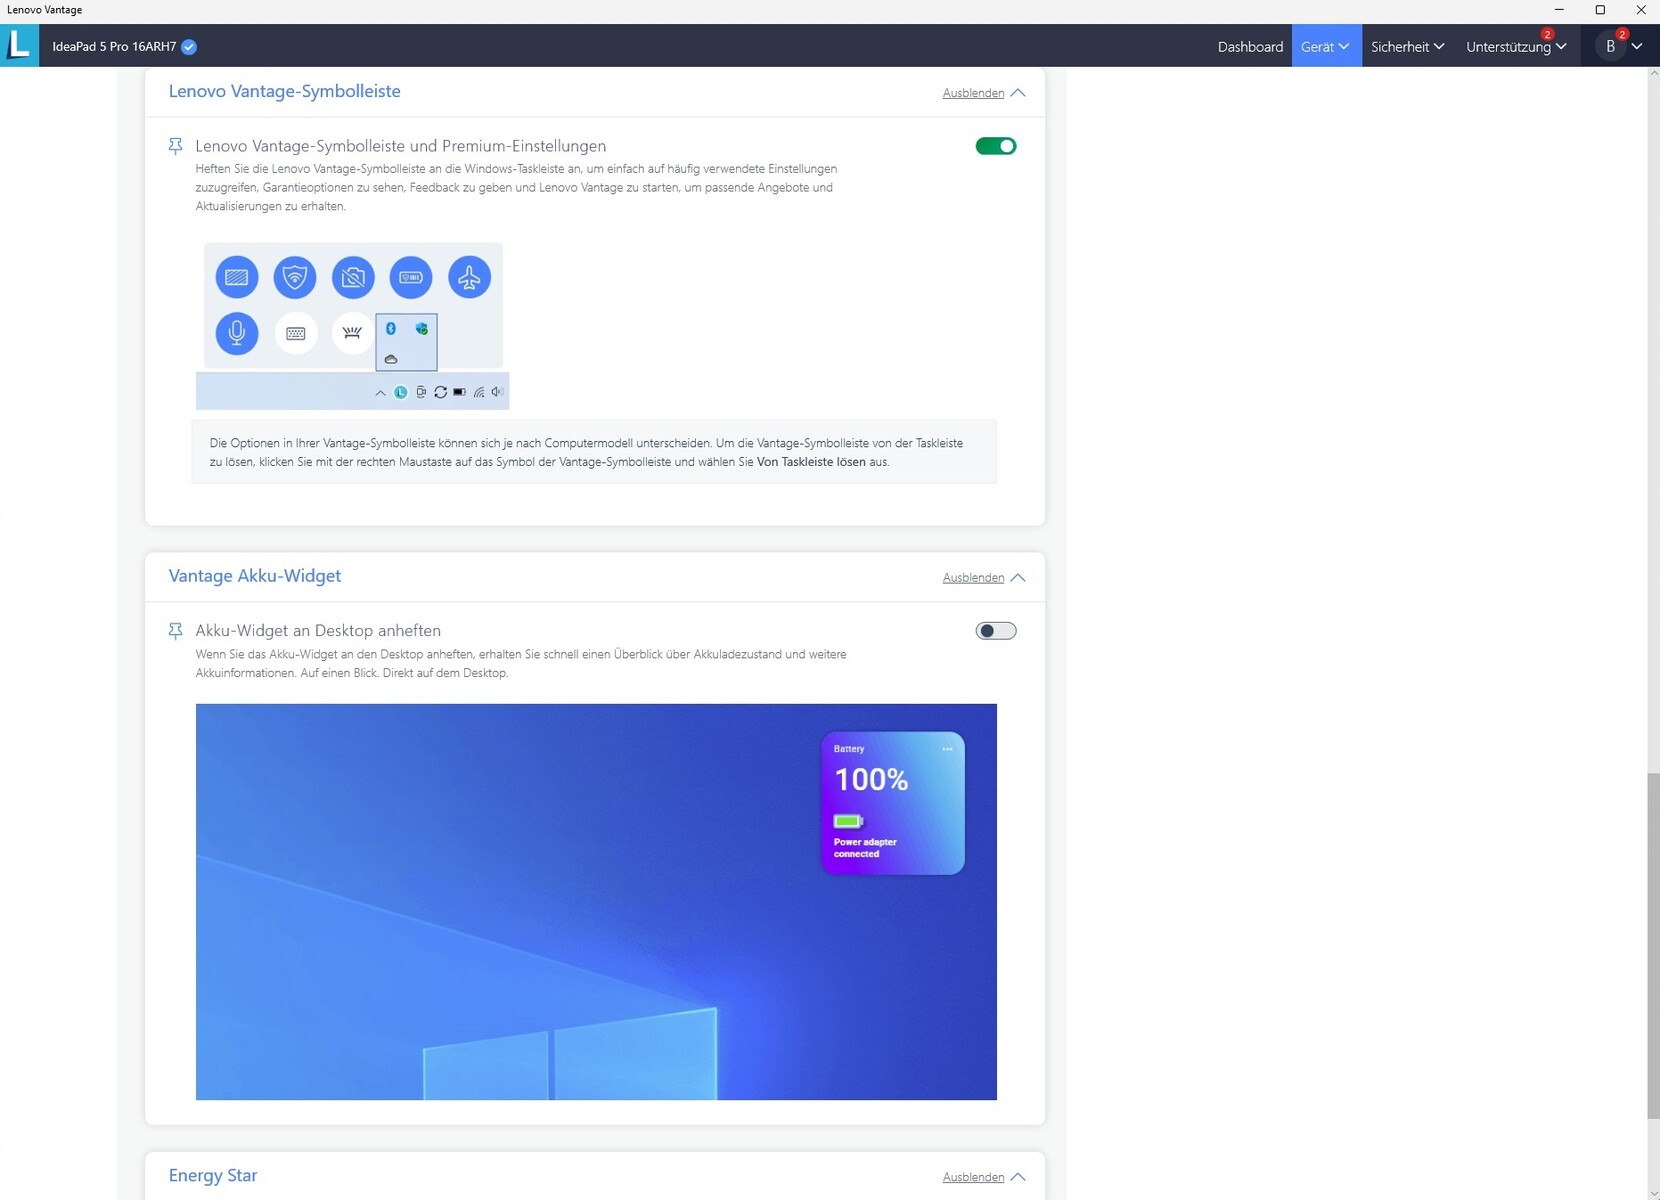
The preinstalled Lenovo Vantage software offers a large number of options to adjust the system to your personal preferences. Particularly relevant in this regard is the "Power & Performance" item, which includes three profiles (see screenshot). All of our measurements were taken using the "Intelligent Cooling" mode with the "Automatically switch to High Performance mode" box checked. This is supposed to allow the system to use its full performance in demanding tasks, without getting unnecessarily loud or consuming too much power during simple tasks such as office, video, or web chores.
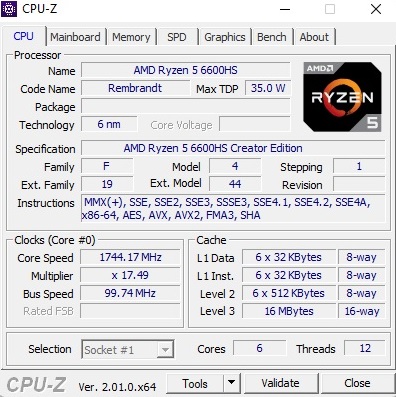
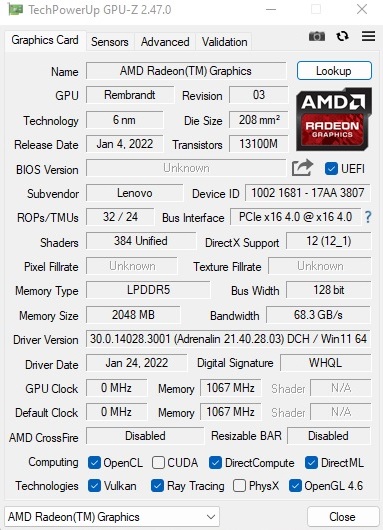
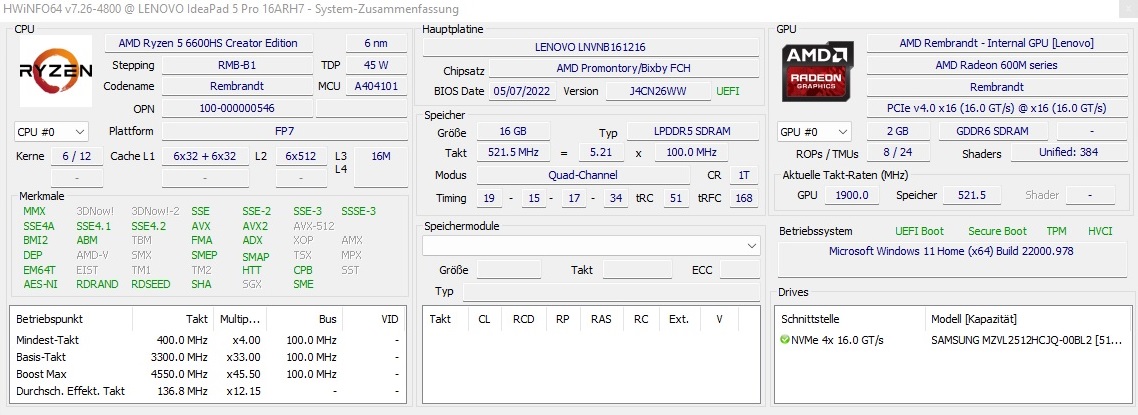
Processor
The Ryzen 5 6600HS is a current hexa-core model from AMD's Rembrandt generation, which tries to attract customers with 16 MB L3 cache and a clock speed of up to 4.5 GHz. The 6-nm chip is able to work on 12 threads in parallel via SMT. AMD specifies a TDP of 35 watts, which falls between classic performance CPUs (more than 40 watts) and power-saving versions (less than 30 watts). In our loop test with Cinebench R15, the 6600HS strikes a good figure. In contrast to many other laptops, the speed remains very constant, which speaks for the cooling system. The constant performance is significantly ahead of the Core i7-1260P, Core i7-1165G7, and Core i7-11370H. The AMD chip performs more at a level of the Core i7-12700H.
Cinebench R15 Multi Constant Load Test
| CPU Performance rating - Percent | |
| Average of class Multimedia | |
| Huawei MateBook D 16 2022 | |
| Lenovo Yoga 7 16IAP7 | |
| Lenovo IdeaPad 5 Pro 16ARH7 | |
| Average AMD Ryzen 5 6600HS | |
| Acer Swift 3 SF316-51 | |
| LG Gram 16 (2021) | |
* ... smaller is better
AIDA64: FP32 Ray-Trace | FPU Julia | CPU SHA3 | CPU Queen | FPU SinJulia | FPU Mandel | CPU AES | CPU ZLib | FP64 Ray-Trace | CPU PhotoWorxx
| Performance rating | |
| Average of class Multimedia | |
| Huawei MateBook D 16 2022 | |
| Lenovo IdeaPad 5 Pro 16ARH7 | |
| Average AMD Ryzen 5 6600HS | |
| Lenovo Yoga 7 16IAP7 | |
| LG Gram 16 (2021) | |
| AIDA64 / FP32 Ray-Trace | |
| Average of class Multimedia (2214 - 50388, n=60, last 2 years) | |
| Lenovo IdeaPad 5 Pro 16ARH7 | |
| Average AMD Ryzen 5 6600HS (n=1) | |
| Huawei MateBook D 16 2022 | |
| Lenovo Yoga 7 16IAP7 | |
| LG Gram 16 (2021) | |
| AIDA64 / FPU Julia | |
| Average of class Multimedia (12867 - 201874, n=61, last 2 years) | |
| Lenovo IdeaPad 5 Pro 16ARH7 | |
| Average AMD Ryzen 5 6600HS (n=1) | |
| Huawei MateBook D 16 2022 | |
| Lenovo Yoga 7 16IAP7 | |
| LG Gram 16 (2021) | |
| AIDA64 / CPU SHA3 | |
| Average of class Multimedia (653 - 8623, n=61, last 2 years) | |
| Huawei MateBook D 16 2022 | |
| Lenovo IdeaPad 5 Pro 16ARH7 | |
| Average AMD Ryzen 5 6600HS (n=1) | |
| Lenovo Yoga 7 16IAP7 | |
| LG Gram 16 (2021) | |
| AIDA64 / CPU Queen | |
| Huawei MateBook D 16 2022 | |
| Lenovo Yoga 7 16IAP7 | |
| Lenovo IdeaPad 5 Pro 16ARH7 | |
| Average AMD Ryzen 5 6600HS (n=1) | |
| Average of class Multimedia (13483 - 181505, n=49, last 2 years) | |
| LG Gram 16 (2021) | |
| AIDA64 / FPU SinJulia | |
| Lenovo IdeaPad 5 Pro 16ARH7 | |
| Average AMD Ryzen 5 6600HS (n=1) | |
| Average of class Multimedia (1240 - 28794, n=61, last 2 years) | |
| Huawei MateBook D 16 2022 | |
| Lenovo Yoga 7 16IAP7 | |
| LG Gram 16 (2021) | |
| AIDA64 / FPU Mandel | |
| Average of class Multimedia (6395 - 105740, n=60, last 2 years) | |
| Lenovo IdeaPad 5 Pro 16ARH7 | |
| Average AMD Ryzen 5 6600HS (n=1) | |
| Huawei MateBook D 16 2022 | |
| Lenovo Yoga 7 16IAP7 | |
| LG Gram 16 (2021) | |
| AIDA64 / CPU AES | |
| Huawei MateBook D 16 2022 | |
| Average of class Multimedia (13243 - 126790, n=61, last 2 years) | |
| LG Gram 16 (2021) | |
| Lenovo Yoga 7 16IAP7 | |
| Lenovo IdeaPad 5 Pro 16ARH7 | |
| Average AMD Ryzen 5 6600HS (n=1) | |
| AIDA64 / CPU ZLib | |
| Average of class Multimedia (167.2 - 2022, n=61, last 2 years) | |
| Huawei MateBook D 16 2022 | |
| Lenovo IdeaPad 5 Pro 16ARH7 | |
| Average AMD Ryzen 5 6600HS (n=1) | |
| Lenovo Yoga 7 16IAP7 | |
| LG Gram 16 (2021) | |
| AIDA64 / FP64 Ray-Trace | |
| Average of class Multimedia (1014 - 26875, n=61, last 2 years) | |
| Lenovo IdeaPad 5 Pro 16ARH7 | |
| Average AMD Ryzen 5 6600HS (n=1) | |
| Huawei MateBook D 16 2022 | |
| Lenovo Yoga 7 16IAP7 | |
| LG Gram 16 (2021) | |
| AIDA64 / CPU PhotoWorxx | |
| Average of class Multimedia (12860 - 88154, n=61, last 2 years) | |
| LG Gram 16 (2021) | |
| Lenovo Yoga 7 16IAP7 | |
| Huawei MateBook D 16 2022 | |
| Lenovo IdeaPad 5 Pro 16ARH7 | |
| Average AMD Ryzen 5 6600HS (n=1) | |
System Performance
According to PCMark 10, the IdeaPad 5 Pro places second in the system performance, just barely behind the Huawei MateBook D16. The computer also responds comfortably fast subjectively.
CrossMark: Overall | Productivity | Creativity | Responsiveness
| PCMark 10 / Score | |
| Average of class Multimedia (4325 - 10386, n=58, last 2 years) | |
| Huawei MateBook D 16 2022 | |
| Lenovo IdeaPad 5 Pro 16ARH7 | |
| Lenovo Yoga 7 16IAP7 | |
| Acer Swift 3 SF316-51 | |
| LG Gram 16 (2021) | |
| PCMark 10 / Essentials | |
| Huawei MateBook D 16 2022 | |
| Lenovo Yoga 7 16IAP7 | |
| Average of class Multimedia (8025 - 11664, n=57, last 2 years) | |
| Acer Swift 3 SF316-51 | |
| LG Gram 16 (2021) | |
| Lenovo IdeaPad 5 Pro 16ARH7 | |
| PCMark 10 / Productivity | |
| Average of class Multimedia (7323 - 18233, n=57, last 2 years) | |
| Lenovo IdeaPad 5 Pro 16ARH7 | |
| Huawei MateBook D 16 2022 | |
| Acer Swift 3 SF316-51 | |
| Lenovo Yoga 7 16IAP7 | |
| LG Gram 16 (2021) | |
| PCMark 10 / Digital Content Creation | |
| Average of class Multimedia (3651 - 16240, n=57, last 2 years) | |
| Lenovo Yoga 7 16IAP7 | |
| Huawei MateBook D 16 2022 | |
| Lenovo IdeaPad 5 Pro 16ARH7 | |
| Acer Swift 3 SF316-51 | |
| LG Gram 16 (2021) | |
| CrossMark / Overall | |
| Huawei MateBook D 16 2022 | |
| Average of class Multimedia (866 - 2728, n=67, last 2 years) | |
| Lenovo Yoga 7 16IAP7 | |
| CrossMark / Productivity | |
| Huawei MateBook D 16 2022 | |
| Average of class Multimedia (931 - 2489, n=67, last 2 years) | |
| Lenovo Yoga 7 16IAP7 | |
| CrossMark / Creativity | |
| Average of class Multimedia (907 - 3465, n=67, last 2 years) | |
| Huawei MateBook D 16 2022 | |
| Lenovo Yoga 7 16IAP7 | |
| CrossMark / Responsiveness | |
| Huawei MateBook D 16 2022 | |
| Average of class Multimedia (605 - 2024, n=67, last 2 years) | |
| Lenovo Yoga 7 16IAP7 | |
| PCMark 10 Score | 5855 points | |
Help | ||
| AIDA64 / Memory Copy | |
| Average of class Multimedia (21158 - 132135, n=61, last 2 years) | |
| Lenovo Yoga 7 16IAP7 | |
| LG Gram 16 (2021) | |
| Huawei MateBook D 16 2022 | |
| Lenovo IdeaPad 5 Pro 16ARH7 | |
| Average AMD Ryzen 5 6600HS (n=1) | |
| AIDA64 / Memory Read | |
| Average of class Multimedia (19699 - 174586, n=61, last 2 years) | |
| Lenovo Yoga 7 16IAP7 | |
| LG Gram 16 (2021) | |
| Huawei MateBook D 16 2022 | |
| Lenovo IdeaPad 5 Pro 16ARH7 | |
| Average AMD Ryzen 5 6600HS (n=1) | |
| AIDA64 / Memory Write | |
| Lenovo IdeaPad 5 Pro 16ARH7 | |
| Average AMD Ryzen 5 6600HS (n=1) | |
| Average of class Multimedia (17733 - 134998, n=61, last 2 years) | |
| LG Gram 16 (2021) | |
| Lenovo Yoga 7 16IAP7 | |
| Huawei MateBook D 16 2022 | |
| AIDA64 / Memory Latency | |
| Lenovo IdeaPad 5 Pro 16ARH7 | |
| Average AMD Ryzen 5 6600HS (n=1) | |
| Average of class Multimedia (7 - 535, n=60, last 2 years) | |
| Huawei MateBook D 16 2022 | |
| Lenovo Yoga 7 16IAP7 | |
| LG Gram 16 (2021) | |
* ... smaller is better
DPC Latencies
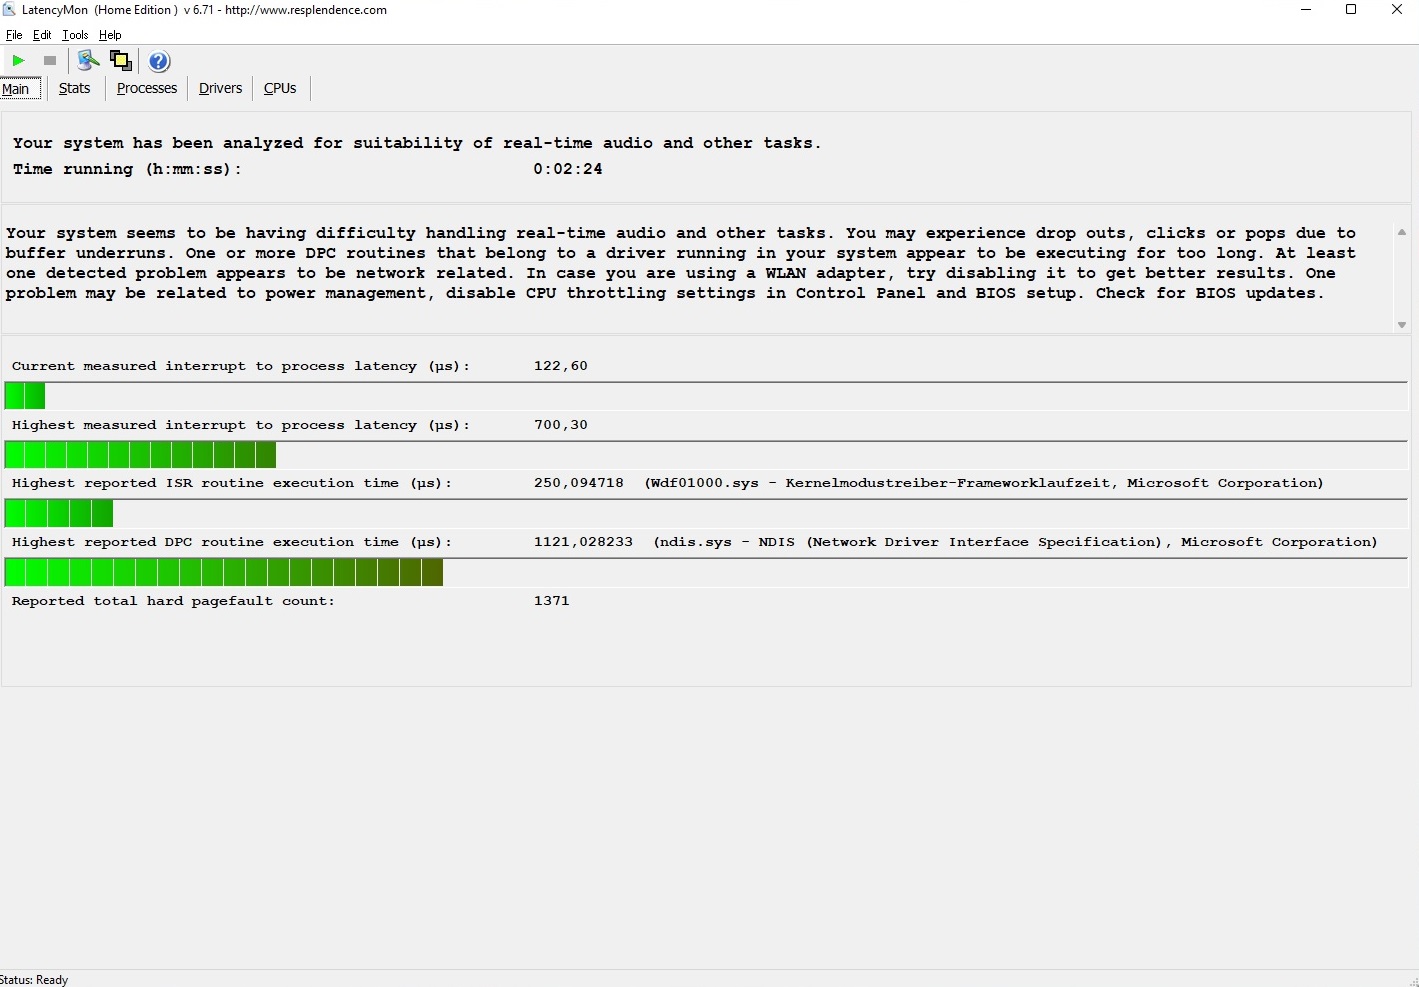
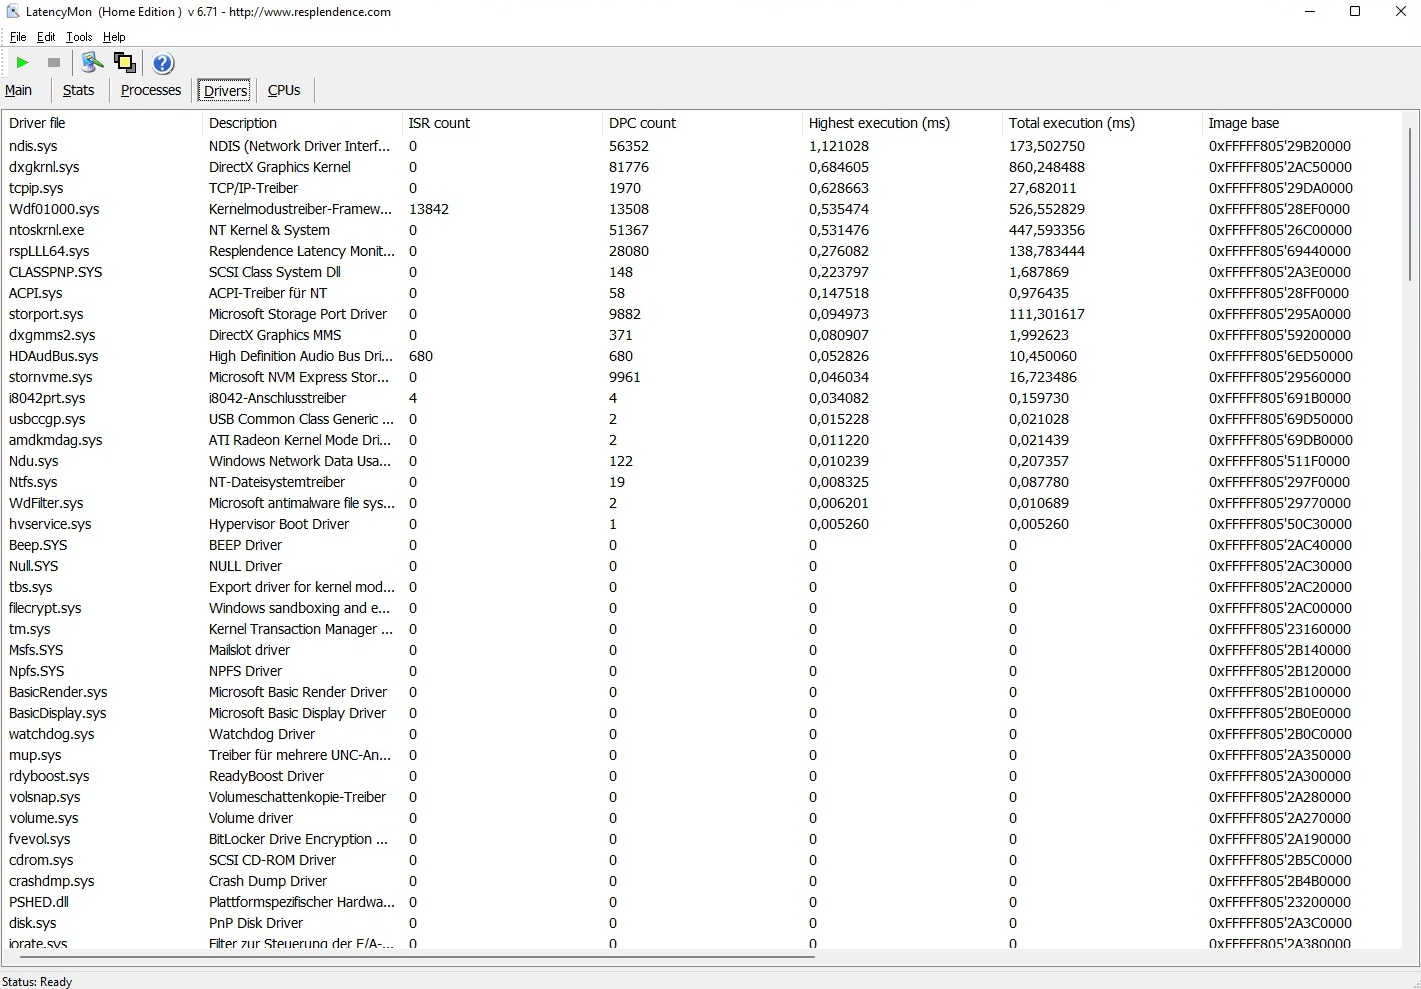
The 16-inch laptop reveals some minor weaknesses in the latencies. According to the LatencyMon tool, the laptop – like many of its competitors – is not ideally suited for audio and video processing in real-time.
| DPC Latencies / LatencyMon - interrupt to process latency (max), Web, Youtube, Prime95 | |
| Huawei MateBook D 16 2022 | |
| Lenovo Yoga 7 16IAP7 | |
| Lenovo IdeaPad 5 Pro 16ARH7 | |
| Acer Swift 3 SF316-51 | |
| LG Gram 16 (2021) | |
* ... smaller is better
Storage Solution
The storage solution delivers a mixed performance. While our measured performance values, the speeds during sequential reading and writing, etc., are quite convincing, after a while in the long-term test with DiskSpd, we see some strong variations. However, you shouldn't be able to notice the problem unless you pose some constant heavy demands on the 512 GB M.2 SSD from Samsung (PM9A1 model).

* ... smaller is better
Constant Performance Reading: DiskSpd Read Loop, Queue Depth 8
Graphics Card
Since the 16ARH7 doesn't offer a dedicated graphics card, the Radeon 660M integrated into the processor has to handle all the graphics computations. As the 3D measurements show, the performance is similar to that of the Iris Xe Graphics G7 with 96 EUs, which is integrated in some Tiger Lake and Alder Lake models from Intel. However, the driver support would tend to speak for AMD, in our experience (keyword: games).
| 3DMark Performance rating - Percent | |
| Average of class Multimedia | |
| Acer Swift 3 SF316-51 | |
| Huawei MateBook D 16 2022 | |
| Lenovo IdeaPad 5 Pro 16ARH7 | |
| LG Gram 16 (2021) | |
| Lenovo Yoga 7 16IAP7 | |
| Average AMD Radeon 660M | |
| 3DMark 11 Performance | 7360 points | |
| 3DMark Ice Storm Standard Score | 169560 points | |
| 3DMark Cloud Gate Standard Score | 24524 points | |
| 3DMark Fire Strike Score | 4664 points | |
| 3DMark Time Spy Score | 1776 points | |
Help | ||
Gaming Performance
The fact that the Radeon 660M cannot be considered a gaming graphics card shouldn't be surprising. Even when reducing the resolution from the native 2,560 x 1,600 pixels to Full-HD, i.e., 1,920 x 1,080, many modern games stutter also at minimum detail settings (for example, God of War, Elex 2, and Dying Light 2). To get a half-way smooth image, you have to either reduce the resolution way down or limit yourself to older or less computing intensive games. Those you will then be able to play at medium to high detail settings (for example, Dota 2, Star Wars Squadrons, and GRID Legends).
| The Witcher 3 | |
| 1920x1080 High Graphics & Postprocessing (Nvidia HairWorks Off) | |
| Average of class Multimedia (22 - 224, n=13, last 2 years) | |
| Huawei MateBook D 16 2022 | |
| Acer Swift 3 SF316-51 | |
| Lenovo Yoga 7 16IAP7 | |
| Lenovo IdeaPad 5 Pro 16ARH7 | |
| Average AMD Radeon 660M (18.5 - 28.6, n=10) | |
| LG Gram 16 (2021) | |
| 1920x1080 Ultra Graphics & Postprocessing (HBAO+) | |
| Average of class Multimedia (11 - 121, n=13, last 2 years) | |
| Acer Swift 3 SF316-51 | |
| LG Gram 16 (2021) | |
| Lenovo IdeaPad 5 Pro 16ARH7 | |
| Average AMD Radeon 660M (12.3 - 17.9, n=10) | |
| Huawei MateBook D 16 2022 | |
| Lenovo Yoga 7 16IAP7 | |
In contrast to the CPU performance, the GPU performance is not constant over longer time periods. In our 60-minute test with The Witcher 3 (FHD/Ultra), we saw some frame rate variations, as you can see in the chart below. On the other hand, the LG Gram 16 has to struggle with even stronger and more frequent performance jumps.
The Witcher 3 FPS Chart
| low | med. | high | ultra | |
|---|---|---|---|---|
| GTA V (2015) | 133.9 | 118.5 | 40 | 17.2 |
| The Witcher 3 (2015) | 93.2 | 58.5 | 28.6 | 15.3 |
| Dota 2 Reborn (2015) | 114.5 | 98.5 | 65.8 | 55.4 |
| Final Fantasy XV Benchmark (2018) | 53.4 | 23.8 | 16.3 | |
| X-Plane 11.11 (2018) | 49.2 | 37.4 | 33.8 | |
| Far Cry 5 (2018) | 63 | 30 | 26 | |
| Strange Brigade (2018) | 114.4 | 43.3 | 33.9 | 28.6 |
| Hunt Showdown (2020) | 70.8 | 24.2 | 19.2 | |
| Doom Eternal (2020) | 86.9 | 36.2 | 34.2 | |
| Gears Tactics (2020) | 132 | 47.4 | 28.5 | |
| Death Stranding (2020) | 58.1 | 30.6 | 29.1 | |
| Crysis Remastered (2020) | 88.1 | 39.2 | 10.9 | |
| Serious Sam 4 (2020) | 113 | 29.2 | 24.1 | |
| Mafia Definitive Edition (2020) | 48.2 | 20.7 | 19.1 | |
| Star Wars Squadrons (2020) | 170.4 | 66.6 | 57.4 | |
| Watch Dogs Legion (2020) | 49 | 26 | 22 | |
| Dirt 5 (2020) | 68.6 | 24.2 | 17.8 | |
| Assassin´s Creed Valhalla (2020) | 52 | 26 | 19 | |
| Yakuza Like a Dragon (2020) | 64.7 | 21.2 | 21.1 | |
| Hitman 3 (2021) | 91.1 | 34.5 | 30.5 | |
| Outriders (2021) | 35.3 | 30.4 | 27.9 | |
| Resident Evil Village (2021) | 75.3 | 33.4 | 29.9 | |
| Mass Effect Legendary Edition (2021) | 70 | 38.9 | ||
| Days Gone (2021) | 50 | 25.3 | 22.2 | |
| Deathloop (2021) | 45.5 | 23.3 | 18.1 | |
| Alan Wake Remastered (2021) | 53.6 | 32.7 | 26.4 | |
| Far Cry 6 (2021) | 50 | 21 | 18 | |
| Back 4 Blood (2021) | 104.3 | 40.4 | 34.3 | |
| Guardians of the Galaxy (2021) | 0 game wont start | 0 game wont start | 0 game wont start | |
| Riders Republic (2021) | 56 | 30 | 23 | |
| Forza Horizon 5 (2021) | 92 | 39 | 32 | |
| Farming Simulator 22 (2021) | 102 | 57.1 | 38.9 | |
| Halo Infinite (2021) | 39.6 | 20.3 | 17.1 | |
| God of War (2022) | 21.7 | 17.5 | 12.6 | |
| Rainbow Six Extraction (2022) | 45 | 35 | 30 | |
| Dying Light 2 (2022) | 19.7 | 15.4 | 12.4 | |
| GRID Legends (2022) | 71 | 53.4 | 40.4 | |
| Elden Ring (2022) | 39.6 | 29.9 | 26.9 | |
| Cyberpunk 2077 1.6 (2022) | 27 | 24 | 15 | |
| Elex 2 (2022) | 22.5 | 19.3 | 15.8 | |
| Ghostwire Tokyo (2022) | 25.9 | 24 | 23.9 | |
| Tiny Tina's Wonderlands (2022) | 34.2 | 27 | 17.6 | |
| Vampire Bloodhunt (2022) | 0 game wont start (crash) | 0 game wont start (crash) | 0 game wont start (crash) | |
| F1 22 (2022) | 48 | 42 | 28 | |
| The Quarry (2022) | 24.5 | 18 | 14.4 |
Emissions
Noise Emissions
The IdeaPad 5 Pro remains very quiet over longer periods of time. During idle operation, the fans often remain turned off. When they do turn on, the level is fairly low at 26 to 28 dB(A), which should hardly annoy anyone. Under load, the 16-inch laptop is also fairly quiet, and during The Witcher 3 and the stress test, we only measured 35 dB(A) coming from the device. On the other hand, the noise level was a bit more surprising in the 3DMark 06 benchmark, where the fans revved up to 44 dB(A), corresponding to a significantly more noticeable noise level.
Noise level
| Idle |
| 25 / 26 / 28 dB(A) |
| Load |
| 44 / 35 dB(A) |
 | ||
30 dB silent 40 dB(A) audible 50 dB(A) loud |
||
min: | ||
| Lenovo IdeaPad 5 Pro 16ARH7 R5 6600HS, Radeon 660M | Huawei MateBook D 16 2022 i7-12700H, Iris Xe G7 96EUs | Acer Swift 3 SF316-51 i7-11370H, Iris Xe G7 96EUs | LG Gram 16 (2021) i7-1165G7, Iris Xe G7 96EUs | Lenovo Yoga 7 16IAP7 i7-1260P, Iris Xe G7 96EUs | |
|---|---|---|---|---|---|
| Noise | -3% | 1% | 7% | 3% | |
| off / environment * (dB) | 25 | 24.2 3% | 26 -4% | 26 -4% | 23.6 6% |
| Idle Minimum * (dB) | 25 | 24.2 3% | 26 -4% | 26 -4% | 23.6 6% |
| Idle Average * (dB) | 26 | 25.8 1% | 26 -0% | 26 -0% | 23.6 9% |
| Idle Maximum * (dB) | 28 | 30.5 -9% | 27.7 1% | 26 7% | 23.6 16% |
| Load Average * (dB) | 44 | 39.8 10% | 32.7 26% | 30.8 30% | 37.7 14% |
| Witcher 3 ultra * (dB) | 35 | 39.8 -14% | 40 -14% | ||
| Load Maximum * (dB) | 35 | 39.8 -14% | 39 -11% | 31.1 11% | 40.2 -15% |
* ... smaller is better
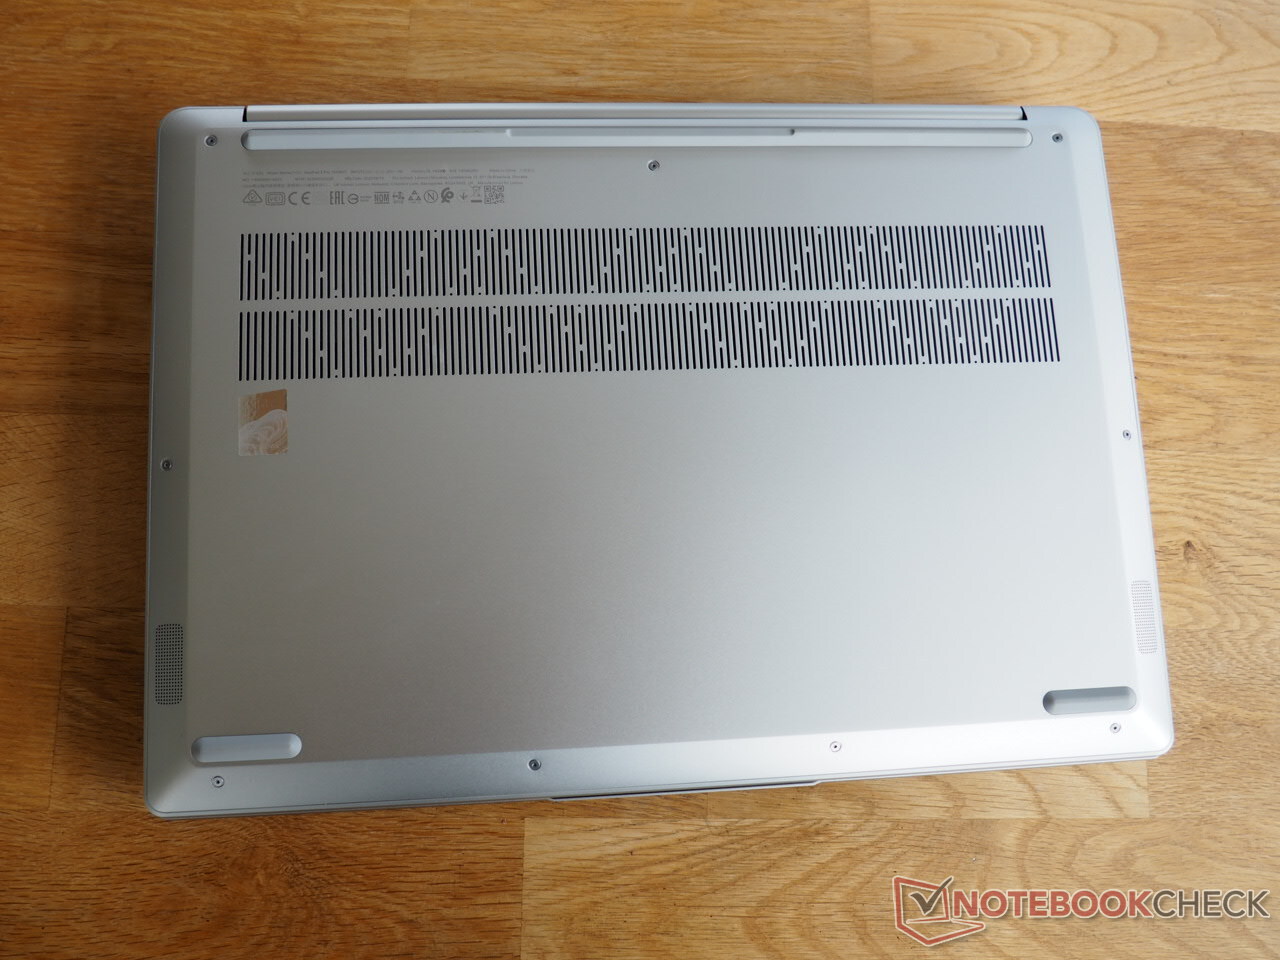
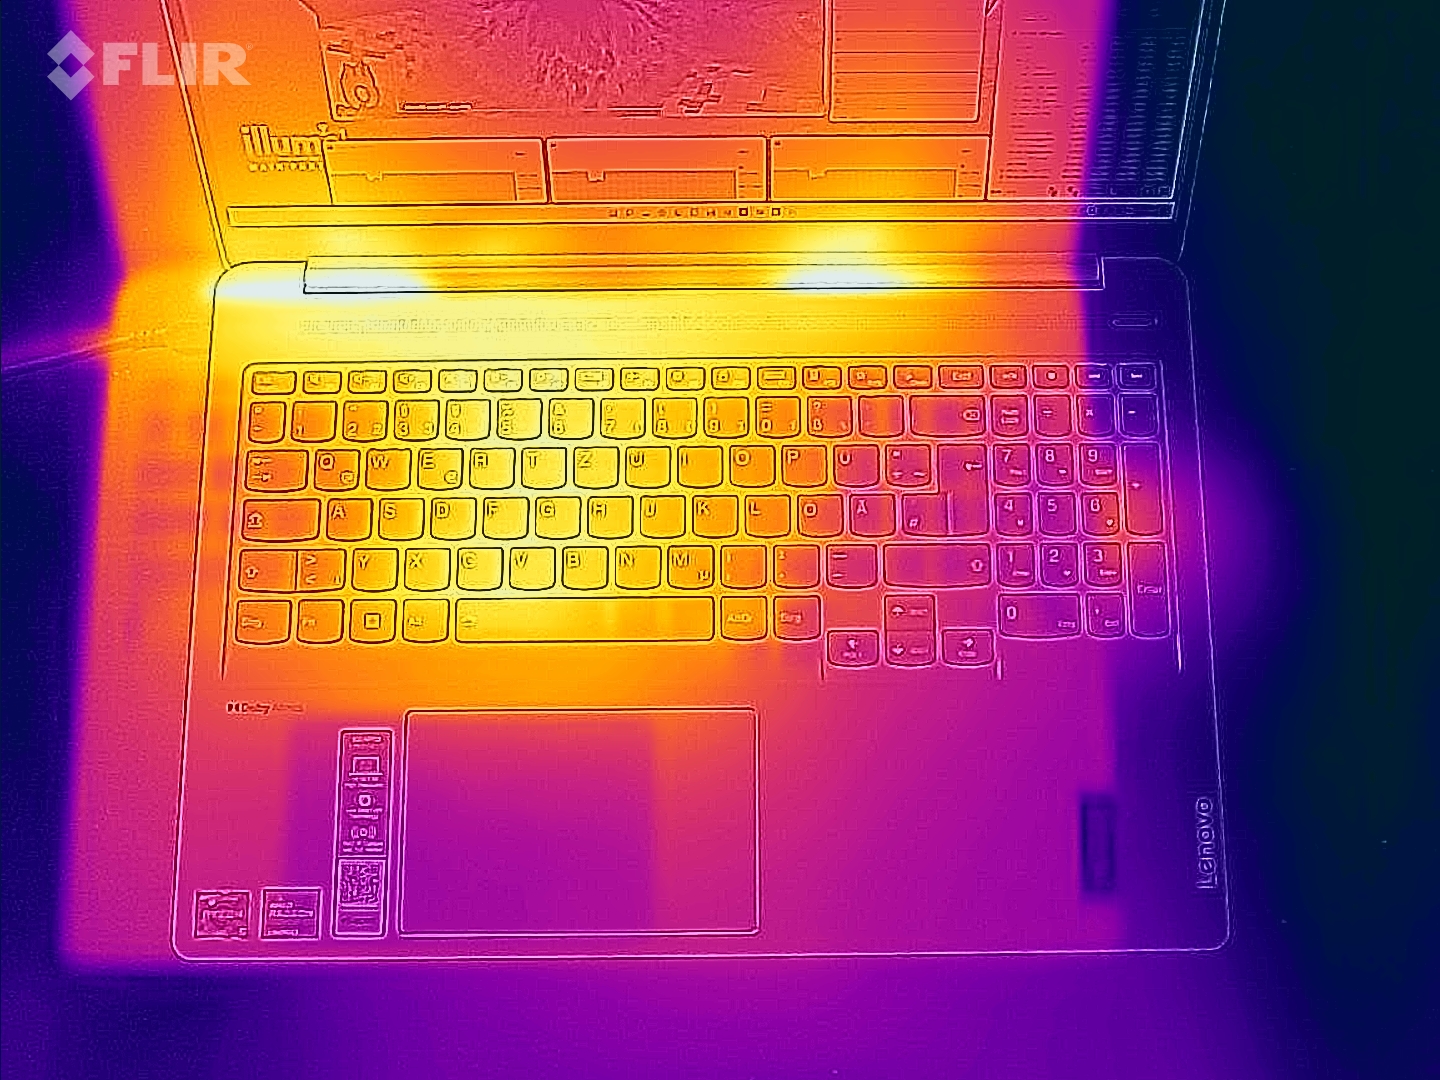
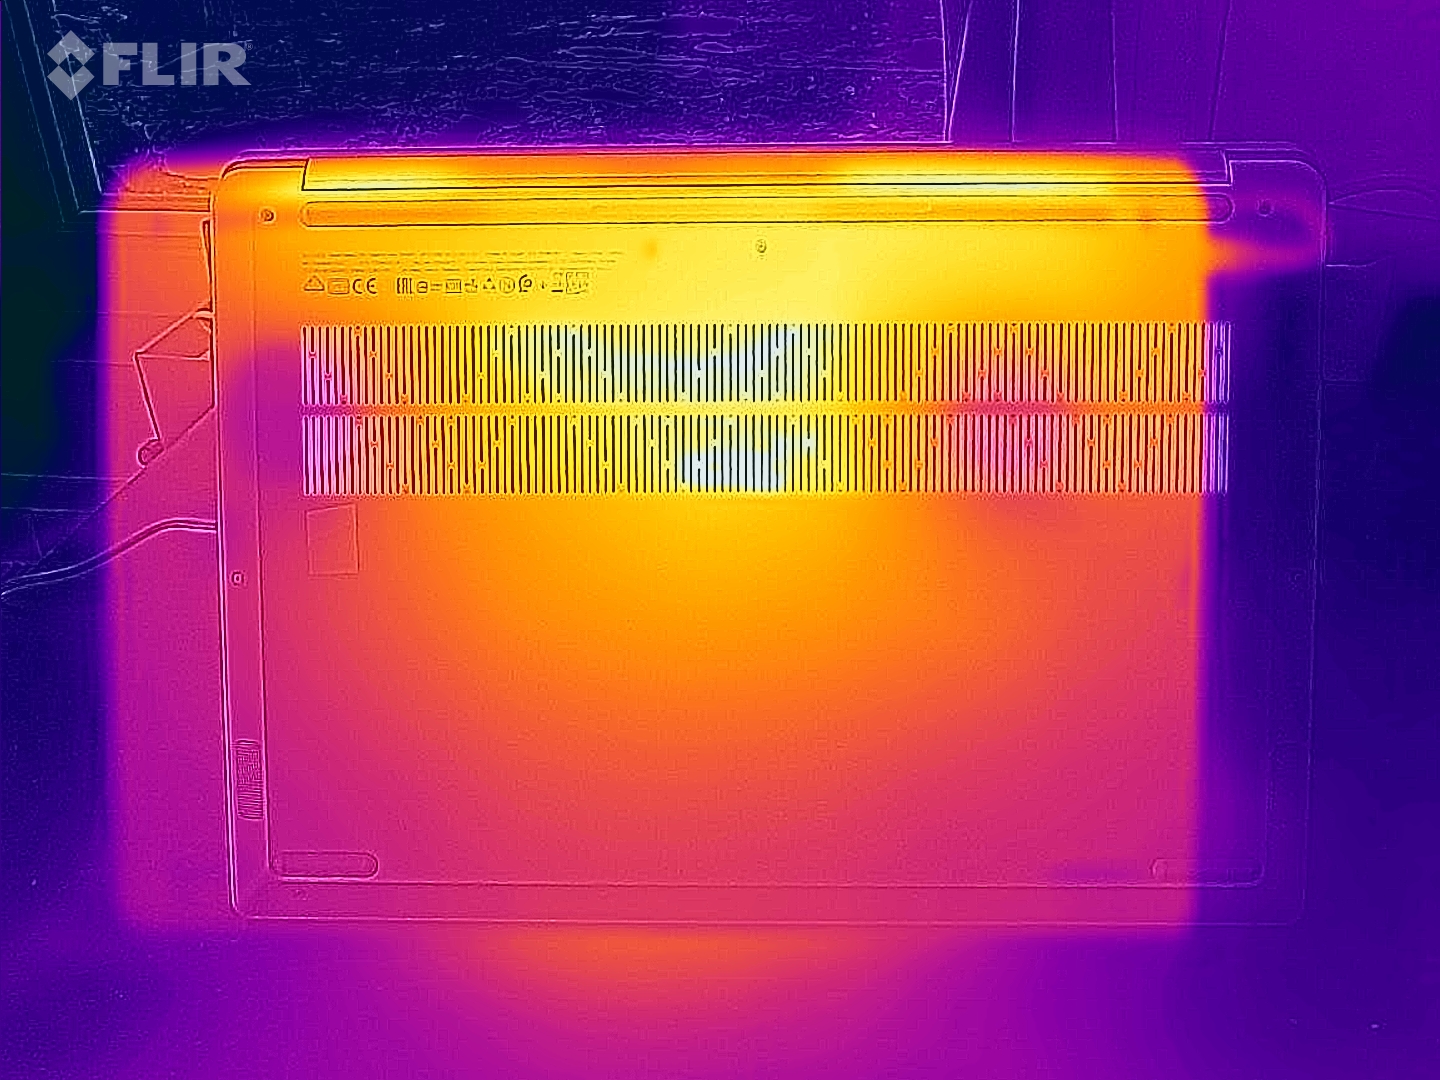
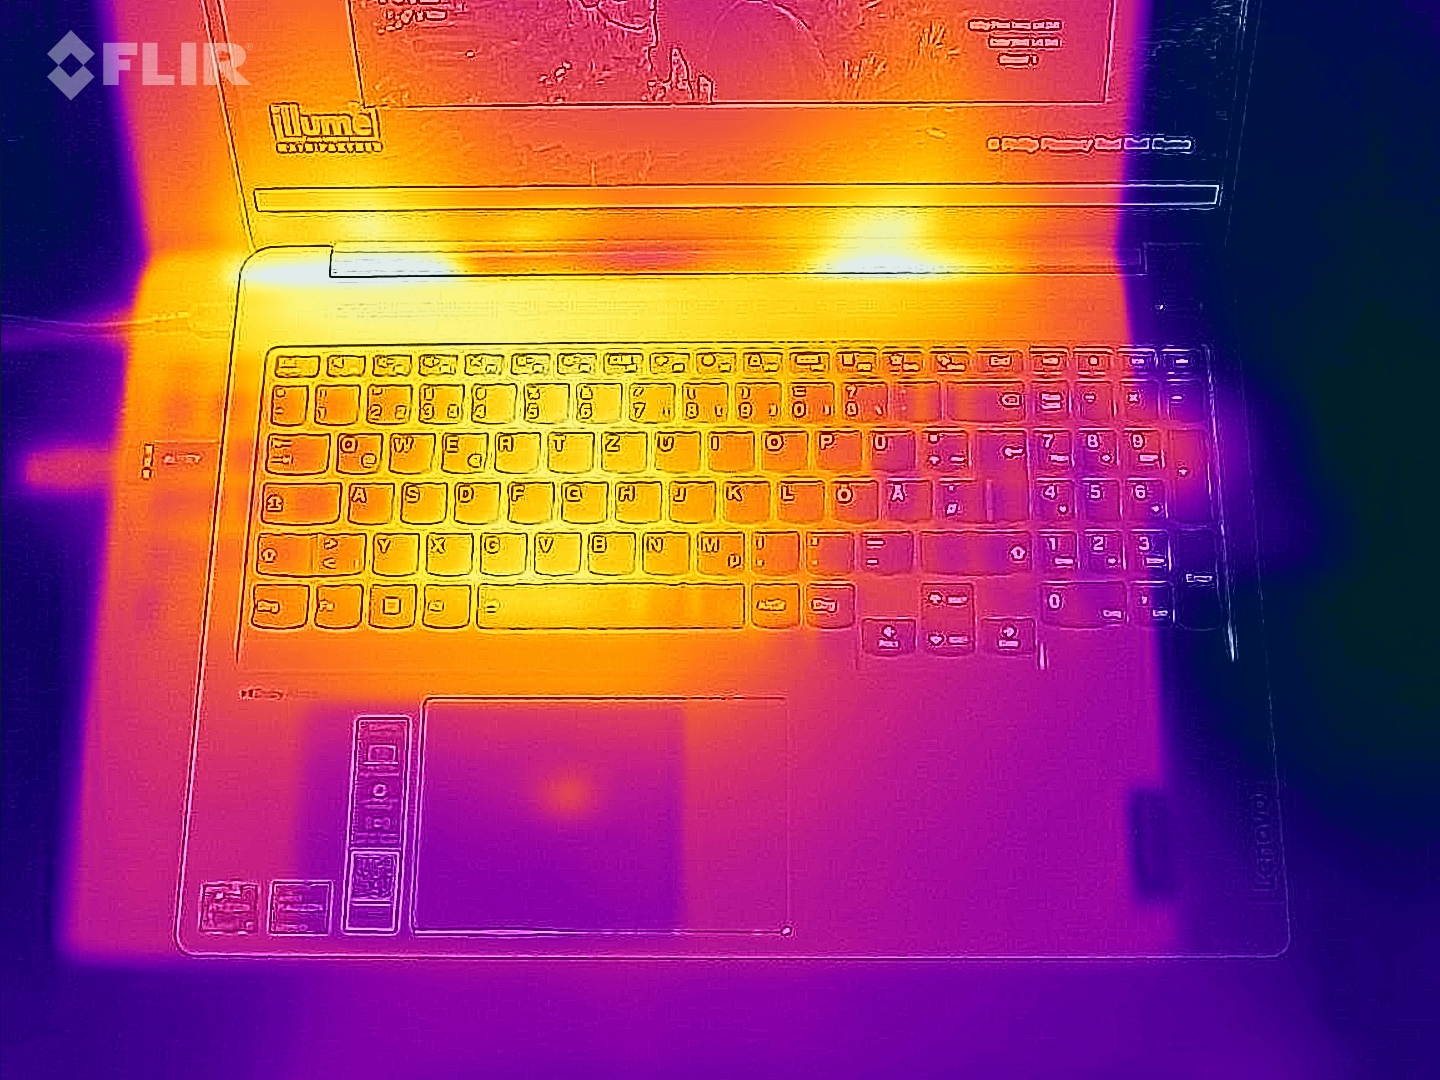
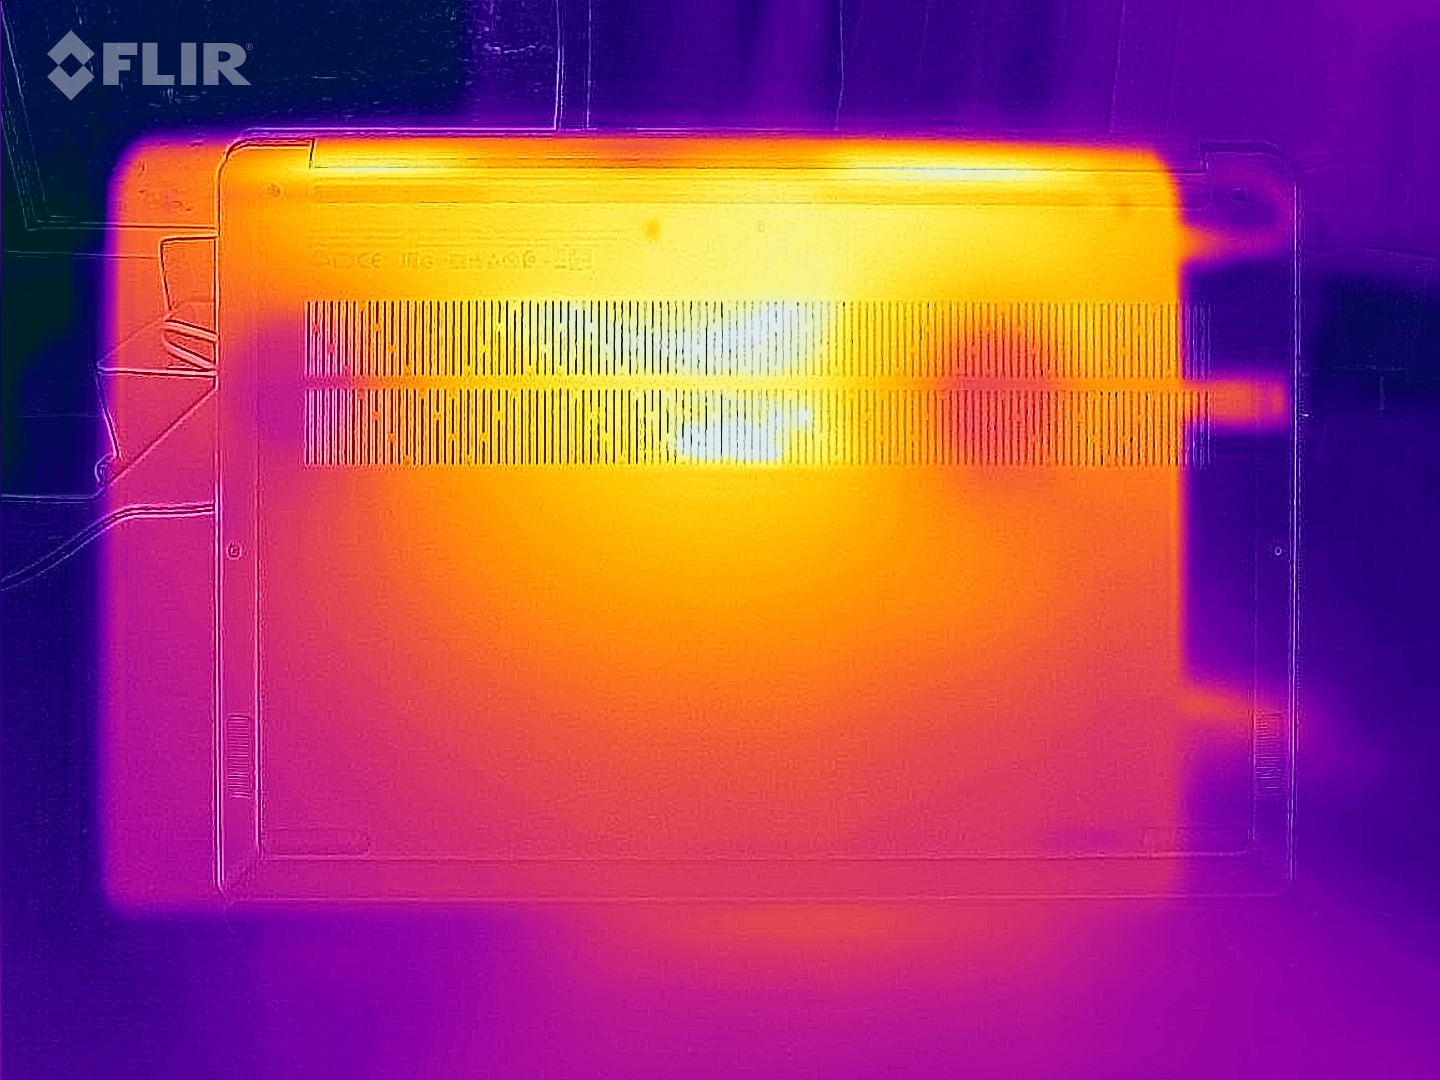
Temperatures
The temperature development is similar to that of the competitors. A maximum of 46 °C (115 °F) on top and 48 °C (118 °F) on the bottom of the case are neither particularly high nor particularly low. During idle operation, the whole case remains cooler than 30 °C (86 °F), so it is well suited for comfortable writing or web surfing.
(-) The maximum temperature on the upper side is 46 °C / 115 F, compared to the average of 36.8 °C / 98 F, ranging from 21 to 71 °C for the class Multimedia.
(-) The bottom heats up to a maximum of 48 °C / 118 F, compared to the average of 39.1 °C / 102 F
(+) In idle usage, the average temperature for the upper side is 26 °C / 79 F, compared to the device average of 31.3 °C / 88 F.
(±) Playing The Witcher 3, the average temperature for the upper side is 34.6 °C / 94 F, compared to the device average of 31.3 °C / 88 F.
(±) The palmrests and touchpad can get very hot to the touch with a maximum of 36 °C / 96.8 F.
(-) The average temperature of the palmrest area of similar devices was 28.7 °C / 83.7 F (-7.3 °C / -13.1 F).
| Lenovo IdeaPad 5 Pro 16ARH7 R5 6600HS, Radeon 660M | Huawei MateBook D 16 2022 i7-12700H, Iris Xe G7 96EUs | Acer Swift 3 SF316-51 i7-11370H, Iris Xe G7 96EUs | LG Gram 16 (2021) i7-1165G7, Iris Xe G7 96EUs | Lenovo Yoga 7 16IAP7 i7-1260P, Iris Xe G7 96EUs | |
|---|---|---|---|---|---|
| Heat | -1% | -3% | 5% | 22% | |
| Maximum Upper Side * (°C) | 46 | 41.8 9% | 40 13% | 46.9 -2% | 39 15% |
| Maximum Bottom * (°C) | 48 | 47.3 1% | 47 2% | 45.1 6% | 34.2 29% |
| Idle Upper Side * (°C) | 28 | 28.3 -1% | 30.1 -8% | 26.4 6% | 21.2 24% |
| Idle Bottom * (°C) | 27 | 30.2 -12% | 31.6 -17% | 24.1 11% | 21.6 20% |
* ... smaller is better
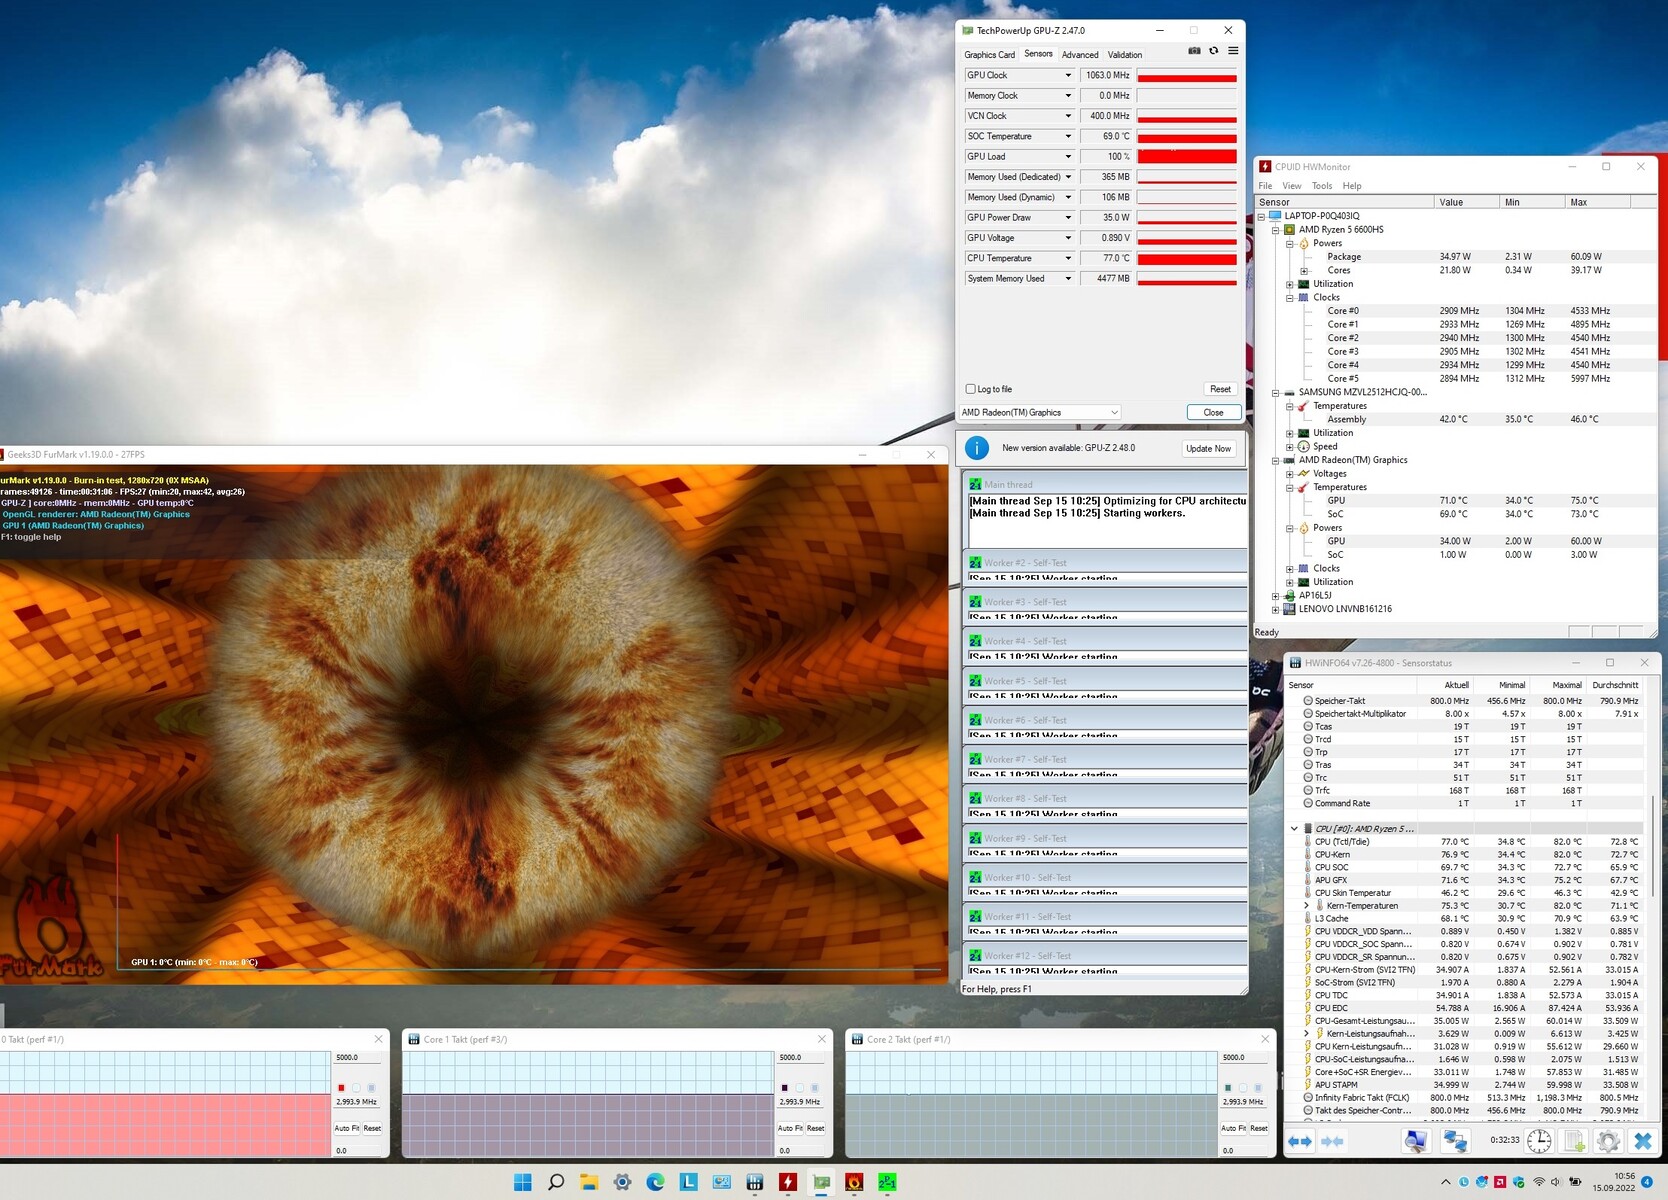
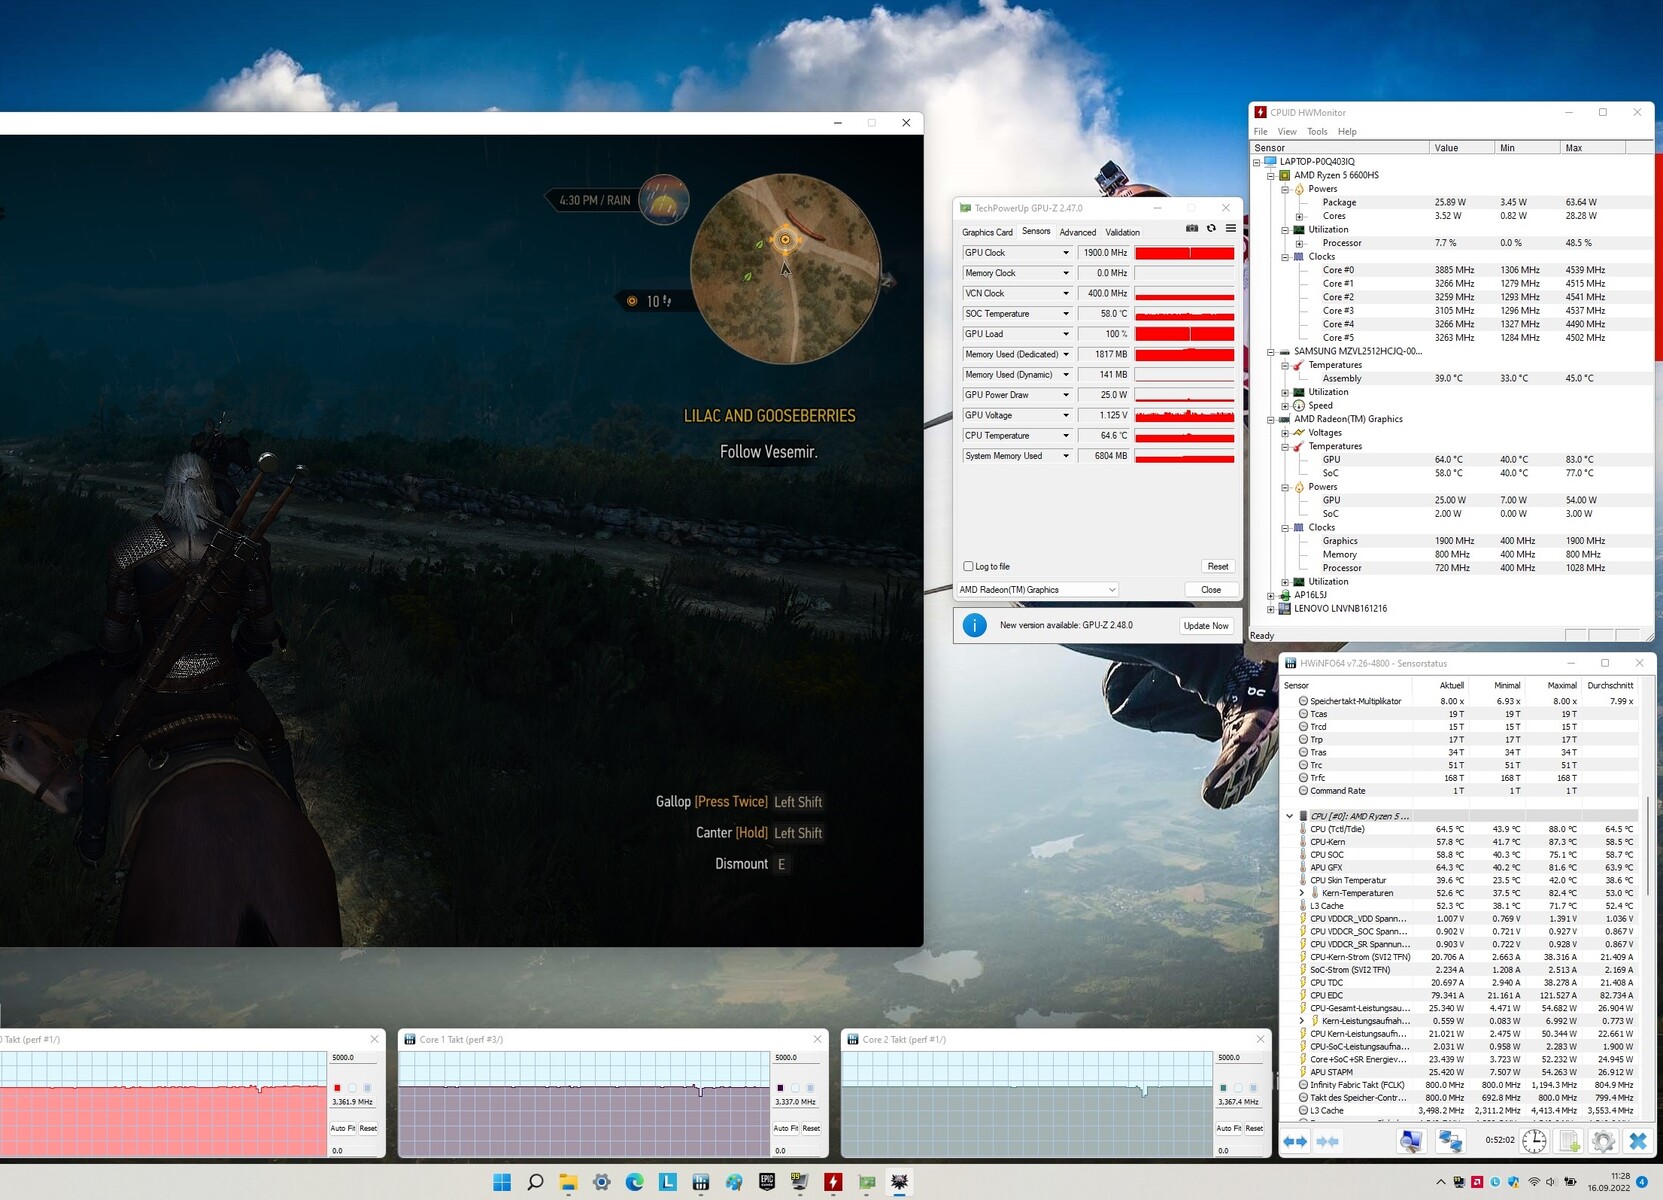
Stress Test
While the Radeon 660M runs at its maximum speed of 1,900 MHz in our The Witcher 3 test, the clock speed levels out at around 1,060 MHz under full load with the Furmark and Prime95 tools. At the same time, the Ryzen 5 6600HS reaches around 3.0 GHz instead of 3.4 GHz, which is a solid result for a longer stress situation.
Speaker
Lenovo IdeaPad 5 Pro 16ARH7 audio analysis
(±) | speaker loudness is average but good (77 dB)
Bass 100 - 315 Hz
(±) | reduced bass - on average 13.1% lower than median
(±) | linearity of bass is average (8.8% delta to prev. frequency)
Mids 400 - 2000 Hz
(±) | higher mids - on average 7.5% higher than median
(+) | mids are linear (6.6% delta to prev. frequency)
Highs 2 - 16 kHz
(+) | balanced highs - only 2.3% away from median
(+) | highs are linear (6.9% delta to prev. frequency)
Overall 100 - 16.000 Hz
(±) | linearity of overall sound is average (17.7% difference to median)
Compared to same class
» 51% of all tested devices in this class were better, 7% similar, 42% worse
» The best had a delta of 5%, average was 17%, worst was 45%
Compared to all devices tested
» 35% of all tested devices were better, 8% similar, 57% worse
» The best had a delta of 4%, average was 24%, worst was 134%
Huawei MateBook D 16 2022 audio analysis
(±) | speaker loudness is average but good (76 dB)
Bass 100 - 315 Hz
(-) | nearly no bass - on average 17.7% lower than median
(±) | linearity of bass is average (9.8% delta to prev. frequency)
Mids 400 - 2000 Hz
(+) | balanced mids - only 1.9% away from median
(+) | mids are linear (5.6% delta to prev. frequency)
Highs 2 - 16 kHz
(+) | balanced highs - only 4.4% away from median
(+) | highs are linear (3.1% delta to prev. frequency)
Overall 100 - 16.000 Hz
(±) | linearity of overall sound is average (16.2% difference to median)
Compared to same class
» 41% of all tested devices in this class were better, 7% similar, 51% worse
» The best had a delta of 5%, average was 17%, worst was 45%
Compared to all devices tested
» 26% of all tested devices were better, 6% similar, 68% worse
» The best had a delta of 4%, average was 24%, worst was 134%
Power Management
Power Consumption
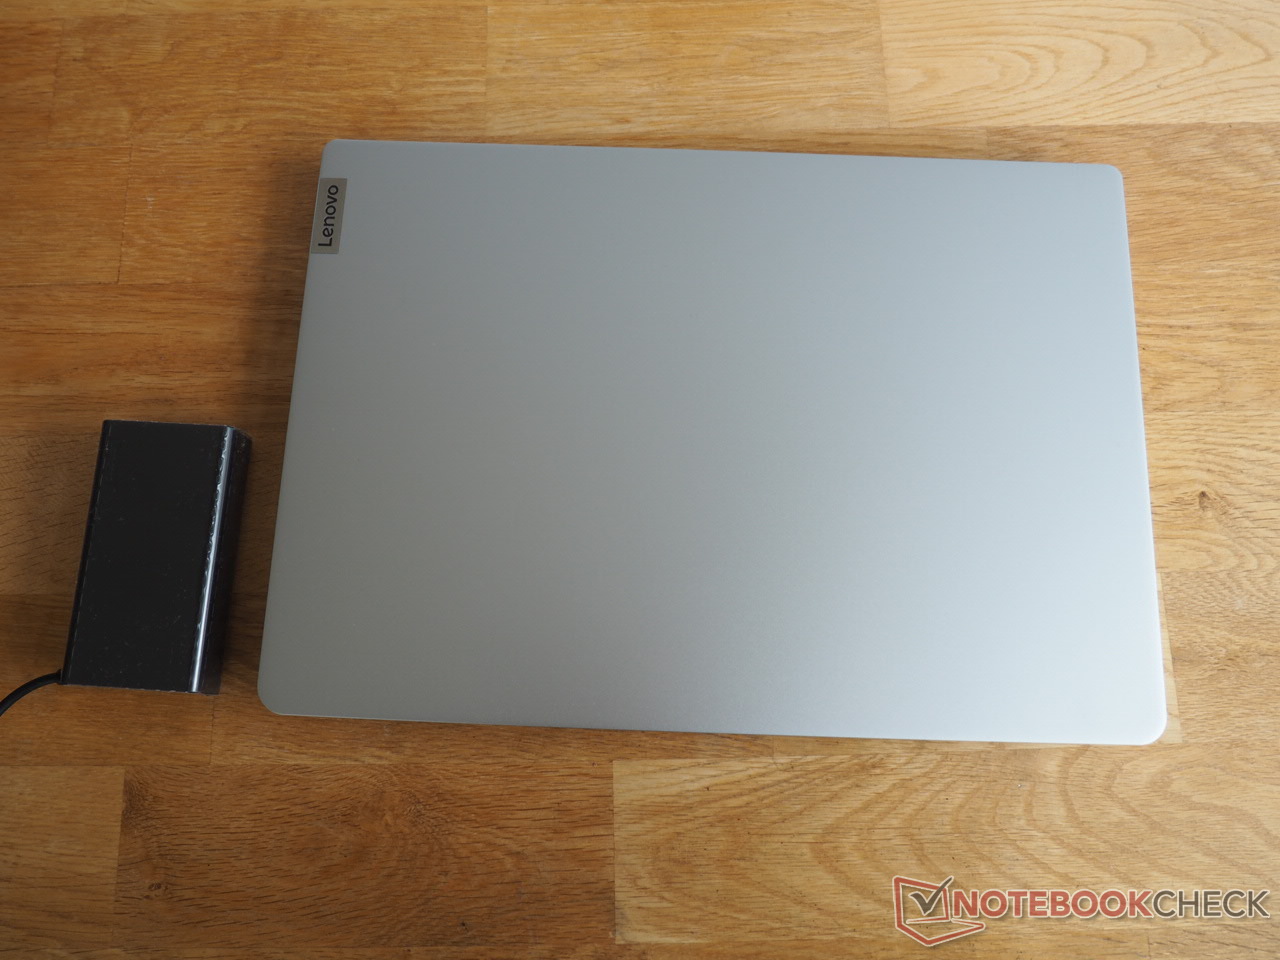
The power consumption is also inconspicuous. For the offered performance, between 4 and 13 watts during idle operation and between 43 and 88 watts under load are okay. The included, pleasantly compact and light 100-Watt power supply is sufficiently sized.
| Off / Standby | |
| Idle | |
| Load |
|
Key:
min: | |
| Lenovo IdeaPad 5 Pro 16ARH7 R5 6600HS, Radeon 660M | Huawei MateBook D 16 2022 i7-12700H, Iris Xe G7 96EUs | Acer Swift 3 SF316-51 i7-11370H, Iris Xe G7 96EUs | LG Gram 16 (2021) i7-1165G7, Iris Xe G7 96EUs | Lenovo Yoga 7 16IAP7 i7-1260P, Iris Xe G7 96EUs | Average of class Multimedia | |
|---|---|---|---|---|---|---|
| Power Consumption | -20% | 18% | 16% | -11% | -23% | |
| Idle Minimum * (Watt) | 4 | 6.1 -53% | 4.8 -20% | 3.8 5% | 6.6 -65% | 5.71 ? -43% |
| Idle Average * (Watt) | 7 | 10.6 -51% | 7.4 -6% | 9 -29% | 8.3 -19% | 10.1 ? -44% |
| Idle Maximum * (Watt) | 13 | 11.5 12% | 9 31% | 11.3 13% | 9.8 25% | 12.4 ? 5% |
| Load Average * (Watt) | 61 | 65.5 -7% | 34.9 43% | 35.2 42% | 66 -8% | 65 ? -7% |
| Witcher 3 ultra * (Watt) | 42.8 | 61.2 -43% | 34.9 18% | 52 -21% | ||
| Load Maximum * (Watt) | 88 | 68.4 22% | 51.4 42% | 43.5 51% | 67.1 24% | 112.2 ? -28% |
* ... smaller is better
Power Consumption The Witcher 3 / Stress Test
Power Consumption With External Monitor
Battery Life
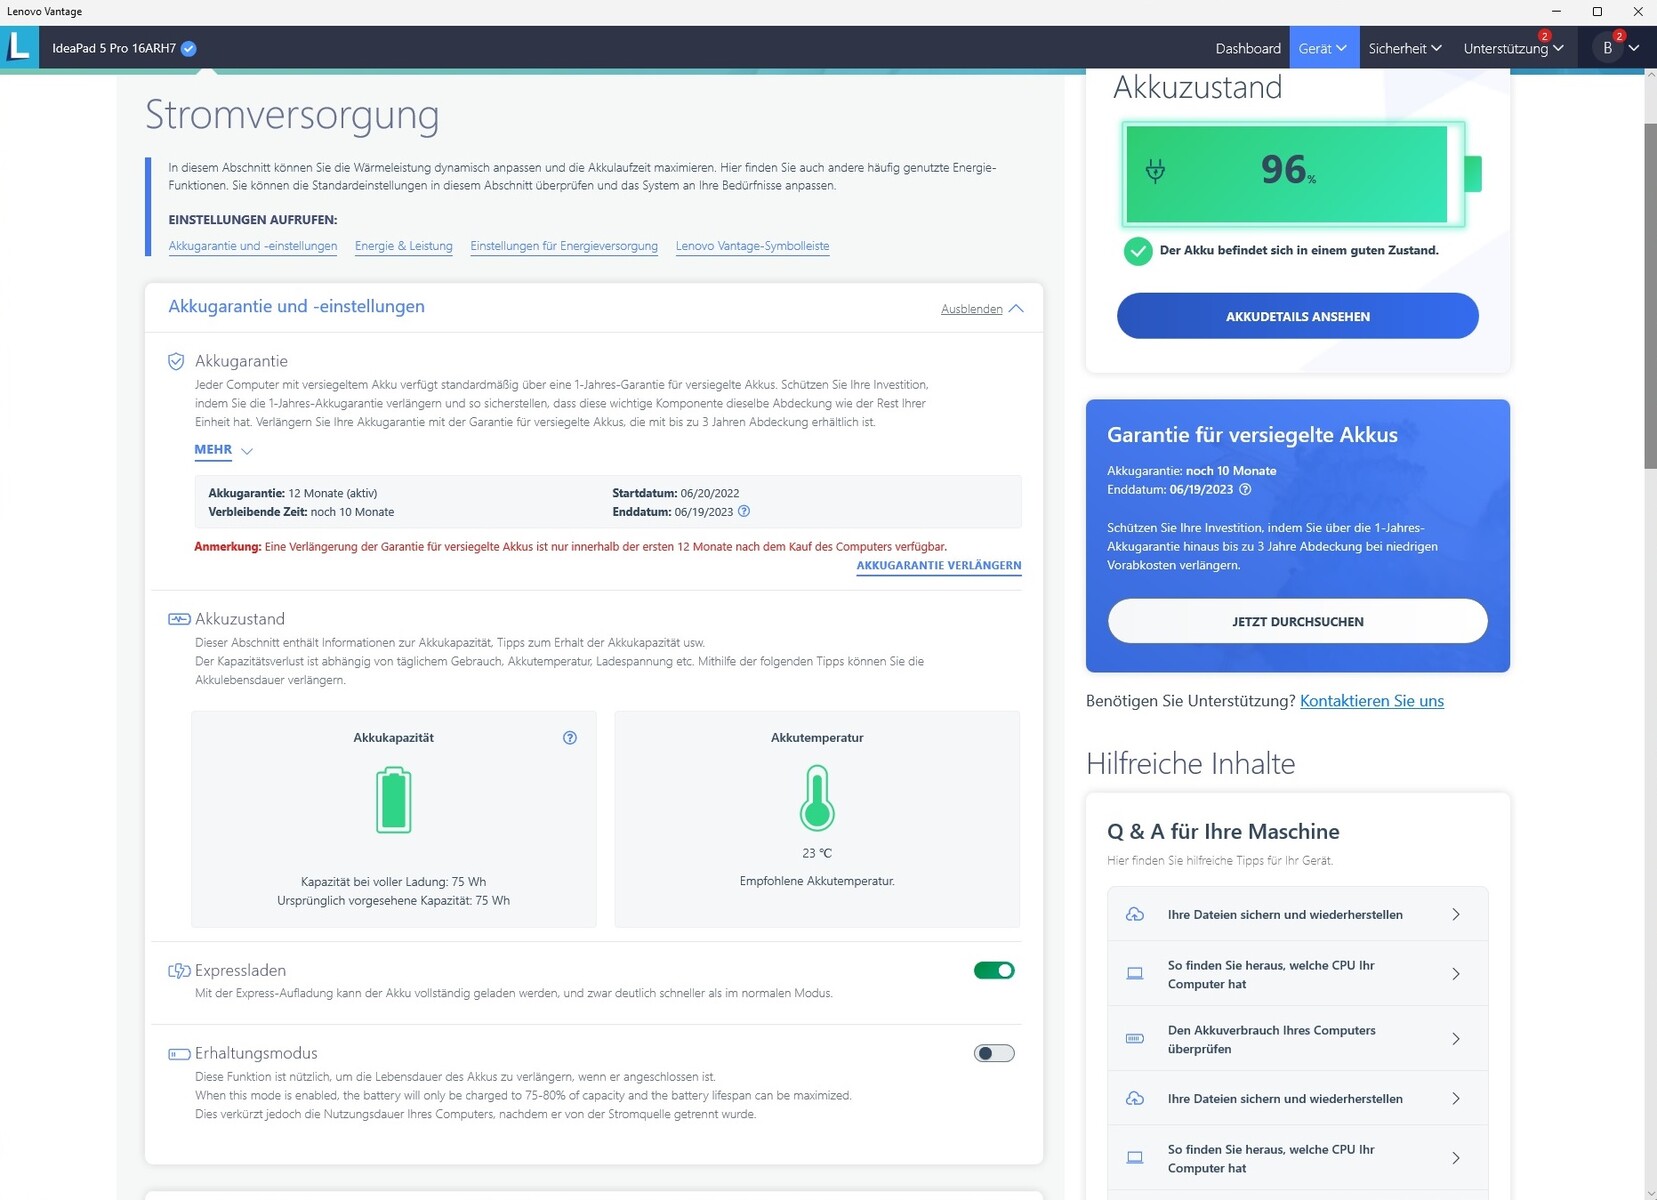
In addition to the display quality, another strength of the IdeaPad 5 Pro lies in the battery life. In our standardized WLAN test with the brightness reduced to 150 cd/m², the 75-Wh battery (competitors: 56 to 80 Wh) lasts for almost 10 hours. So longer trips shouldn't pose any problem with the laptop.
| Lenovo IdeaPad 5 Pro 16ARH7 R5 6600HS, Radeon 660M, 75 Wh | Huawei MateBook D 16 2022 i7-12700H, Iris Xe G7 96EUs, 60 Wh | Acer Swift 3 SF316-51 i7-11370H, Iris Xe G7 96EUs, 56 Wh | LG Gram 16 (2021) i7-1165G7, Iris Xe G7 96EUs, 80 Wh | Lenovo Yoga 7 16IAP7 i7-1260P, Iris Xe G7 96EUs, 71 Wh | Average of class Multimedia | |
|---|---|---|---|---|---|---|
| Battery runtime | -28% | 0% | 60% | -19% | 22% | |
| WiFi v1.3 (h) | 9.8 | 7.1 -28% | 9.8 0% | 15.7 60% | 7.9 -19% | 12 ? 22% |
| Reader / Idle (h) | 20.1 | 28.6 | 12.2 | 25.2 ? | ||
| H.264 (h) | 10.3 | 20.1 | 16.4 ? | |||
| Witcher 3 ultra (h) | 2.2 | |||||
| Load (h) | 1.7 | 4.3 | 1.9 | 1.675 ? |
Pros
Cons
Verdict
The IdeaPad 5 Pro 16ARH7 turns out a successful all-rounder that, aside from 3D applications, always strikes a good or very good figure.
This begins with the elegant metal case that isn't particularly light but fairly robust, giving a high-quality impression. The input devices are also better than those of many competitors. Both the keyboard and the touchpad are attractive and comfortable. In addition, the performance of the Ryzen 5 6600HS is easily able to keep up with the Intel competitors.
Additional positive points are earned by the ample battery life and the bright 16:10 screen, which also scores with a high color accuracy, short response, and sharp image display (2,560 x 1,600 pixels).
In brief, those who are looking for a versatile and mobile 16-inch laptop with a good display are exactly at the right address here.
Price and Availability
The Lenovo IdeaPad 5 Pro 16ARH7 is available for example from Amazon for $1,169.
Lenovo IdeaPad 5 Pro 16ARH7
- 09/20/2022 v7 (old)
Florian Glaser
Price comparison

