Notebookcheck Logo

Watch Dogs Legion Laptop and Desktop Benchmarks

Fully featured. Watch Dogs Legion offers not only new gameplay features but also new graphical features. In this article, we shall provide a detailed performance analysis of the latest title in the Watch Dogs series. Do you really need a high-end PC to wreak some havoc in the game world?
Watch Dogs Legion

Technology

Four years after the release of the previous entry in the Watch Dogs series comes Ubisoft’s Watch Dogs Legion, which takes place in a dystopian, futuristic London as opposed to a US city. Watch Dogs Legion comes off darker and more insane than previous titles in the series.

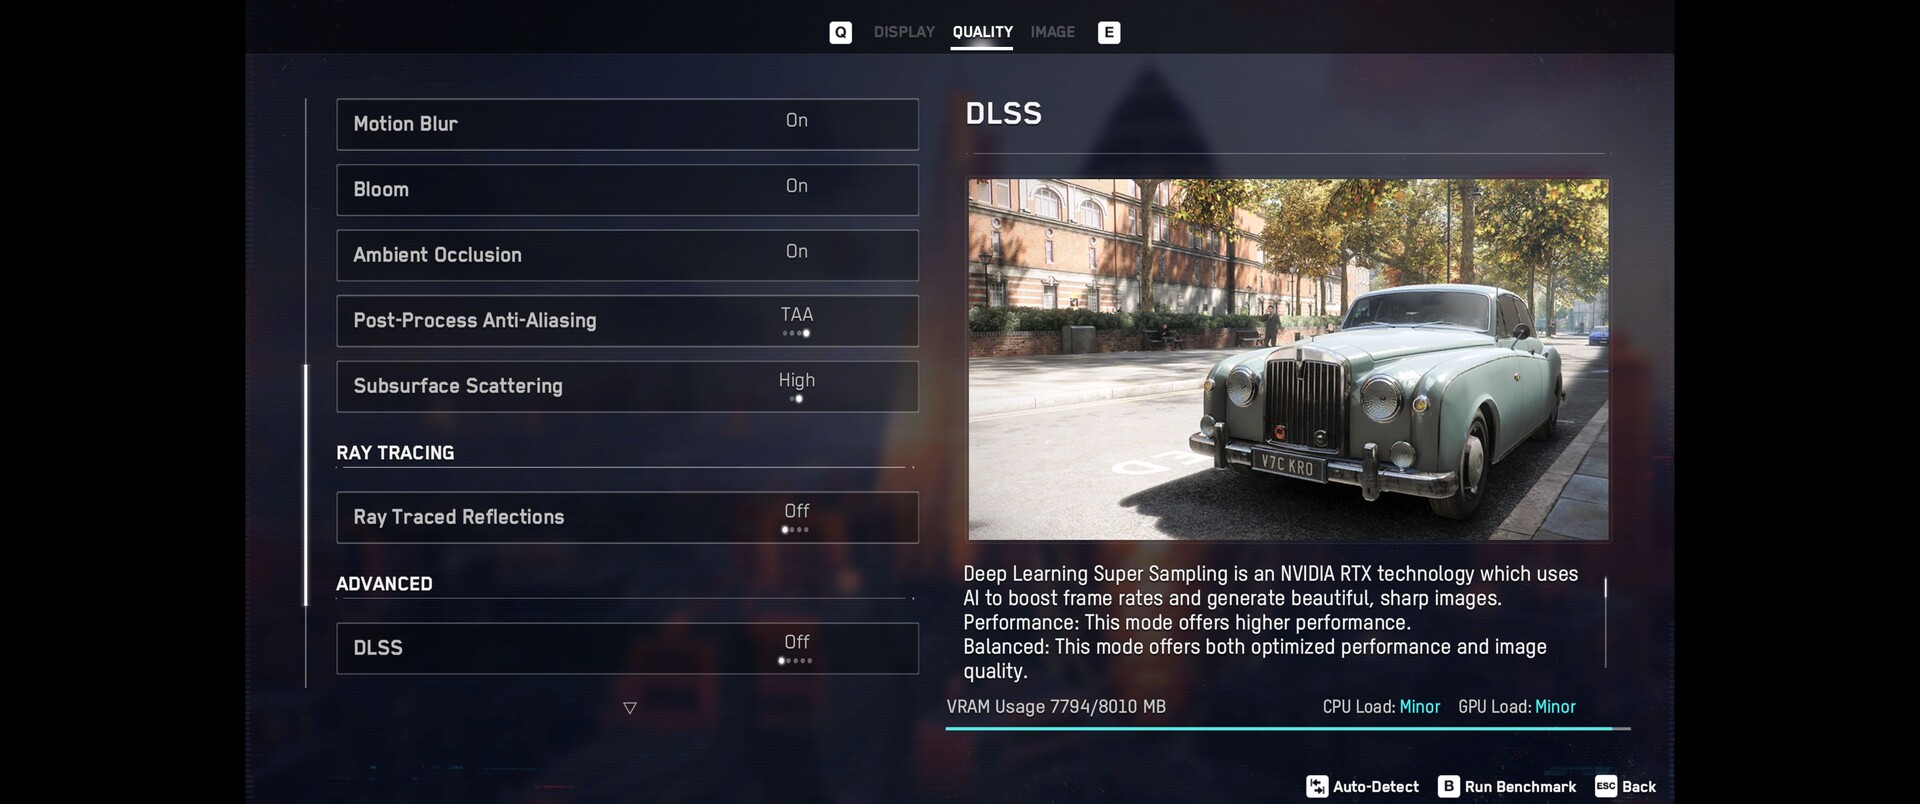
Ubisoft still relies on its proprietary Disrupt Engine, to which many changes have been made when compared to Watch Dogs 2. For instance, Watch Dogs Legion supports Nvidia’s DLSS (deep learning super sampling) and ray tracing (more on this later).

Watch Dogs Legion
Watch Dogs Legion
Watch Dogs Legion
Watch Dogs Legion
Watch Dogs Legion
Watch Dogs Legion

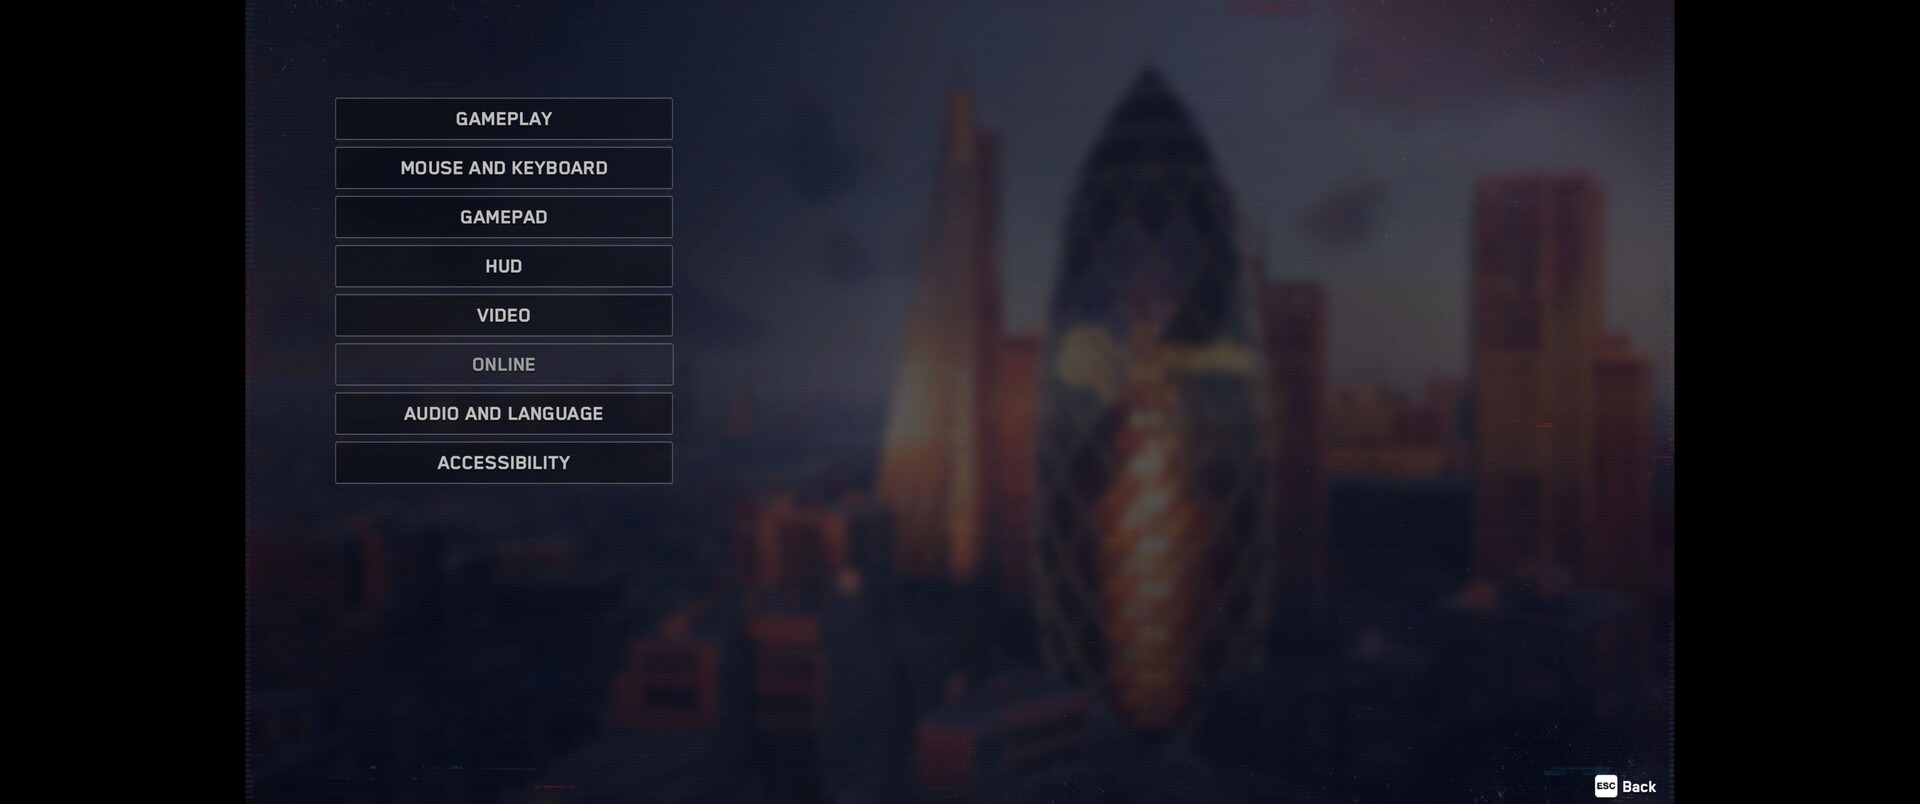
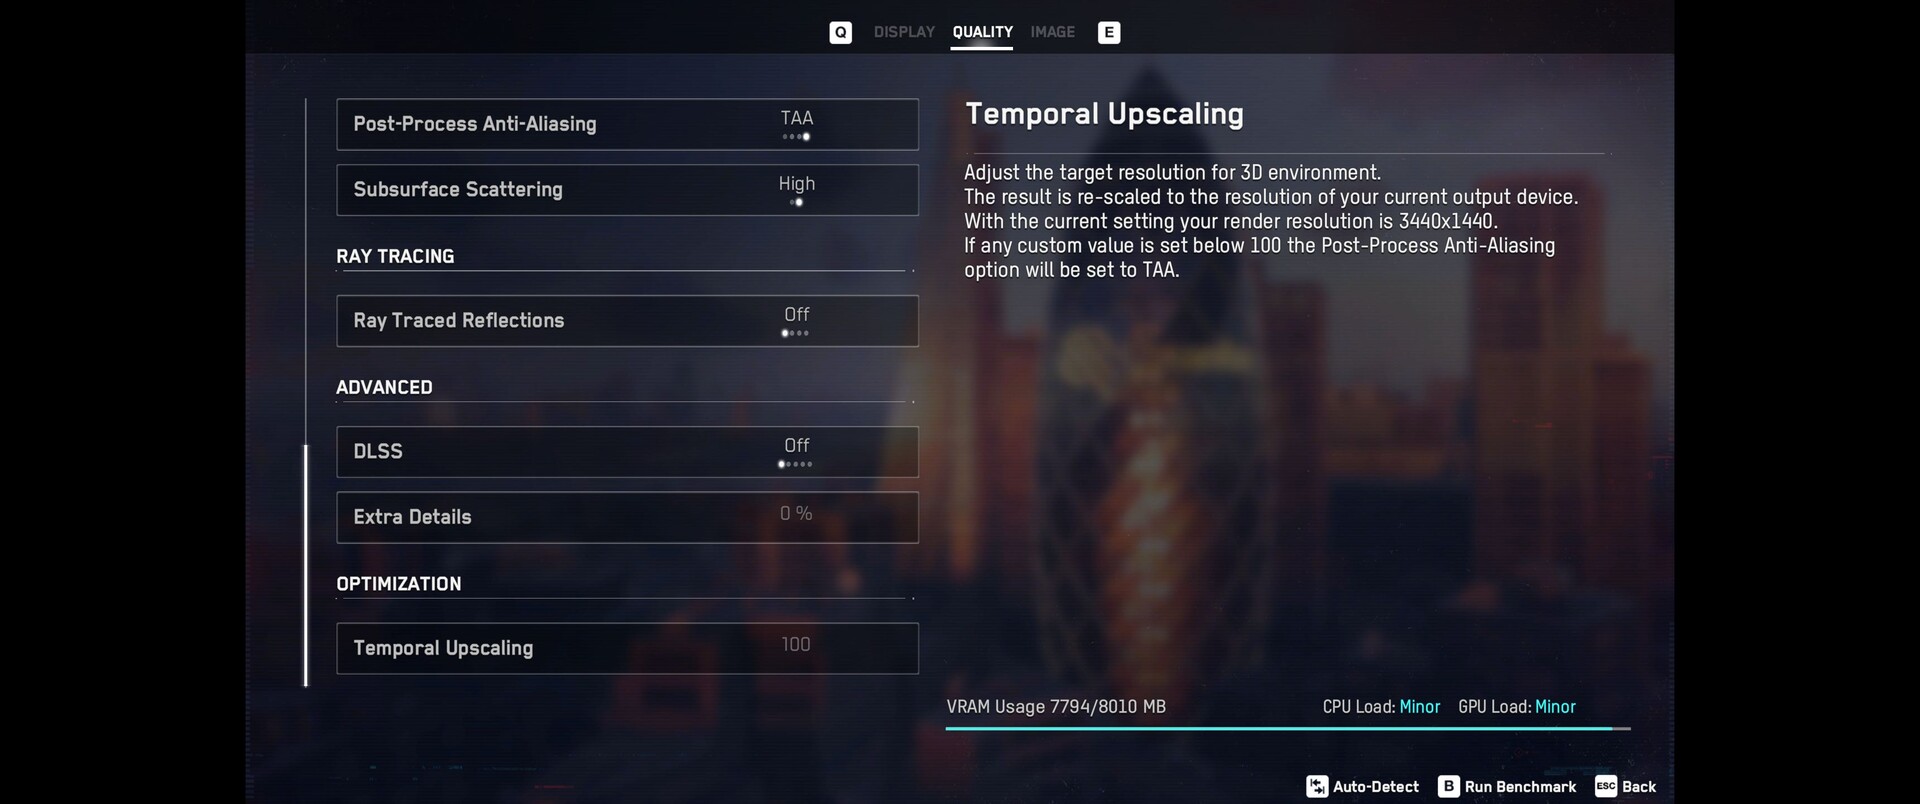
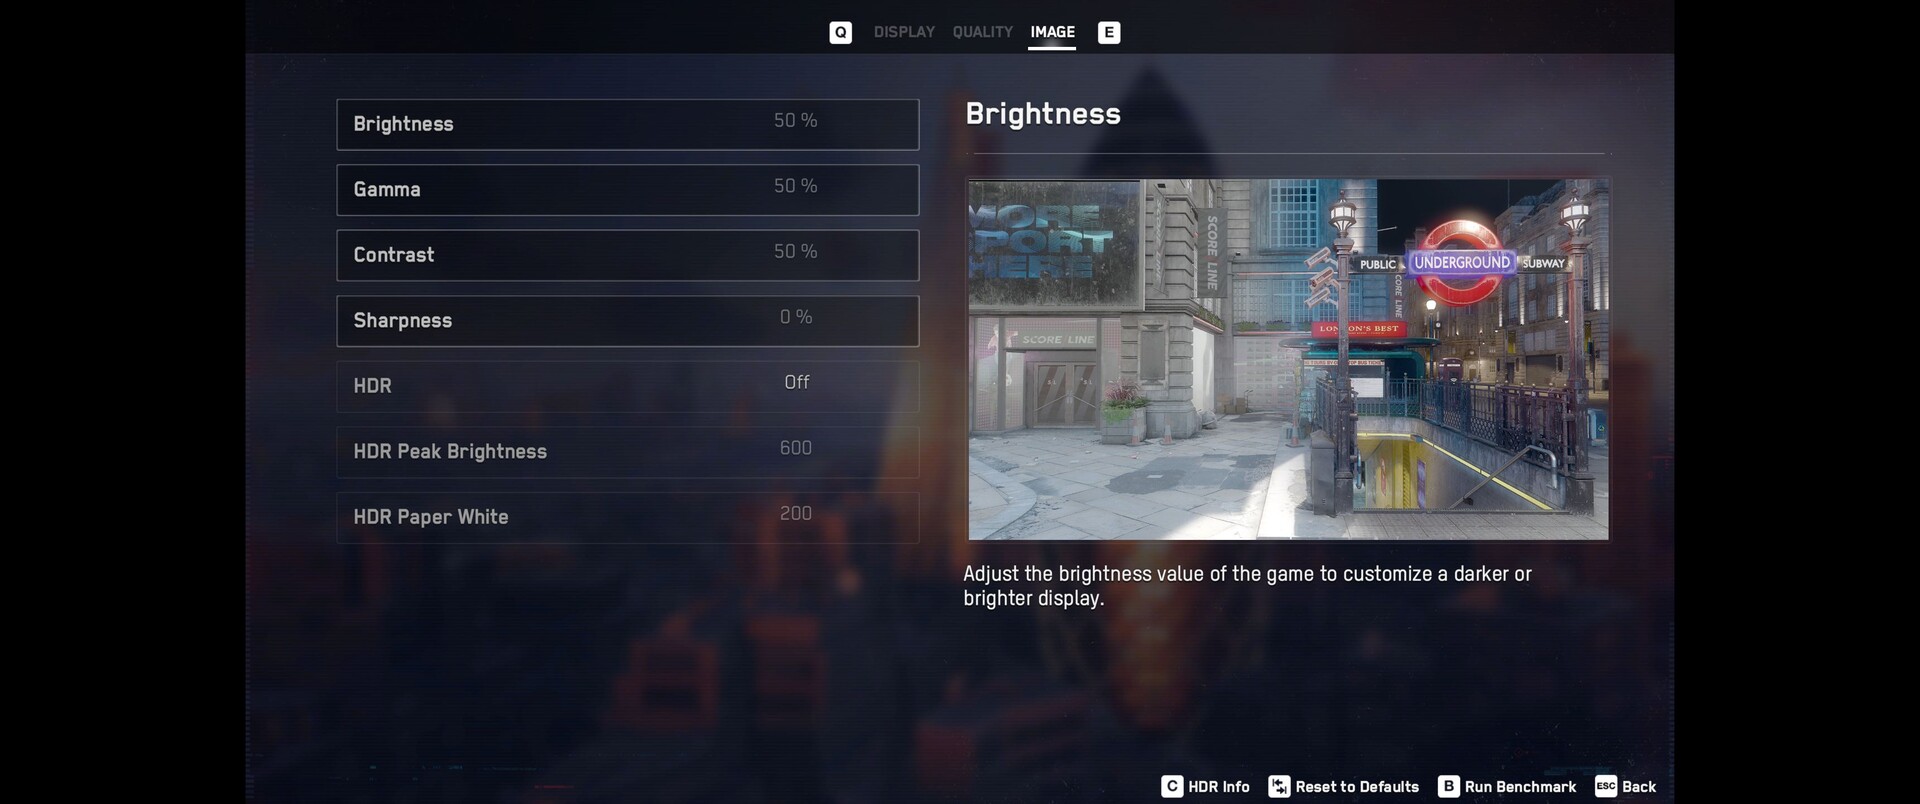
PC gamers will be happy to learn that Watch Dogs Legion offers a great many graphical settings, which are split into three sections for the ease of use (keyword: scrolling). In the leftmost section (display), users can adjust the resolution, refresh rate and the field of view. Here, you can also select the screen mode, enable/display vertical synchronisation and set an FPS cap. The rightmost section (image) provides settings for brightness, gamma, contrast, sharpness and HDR.

The middle section (quality) offers five presets and more than 10 graphics settings. Here, users can enable/disable ray tracing and DLSS. Players can choose between two graphics APIs: DirectX 11 and DirectX 12.

Watch Dogs Legion
Watch Dogs Legion
Watch Dogs Legion
Watch Dogs Legion
Watch Dogs Legion
Watch Dogs Legion

Positive: As long as you are not actively gaming, almost all settings can be applied without a restart. Moreover, the game provides relatively clear descriptions of what each setting does. The title requires 50 GB of storage space (HD texture pack included), which is not a lot in 2020.

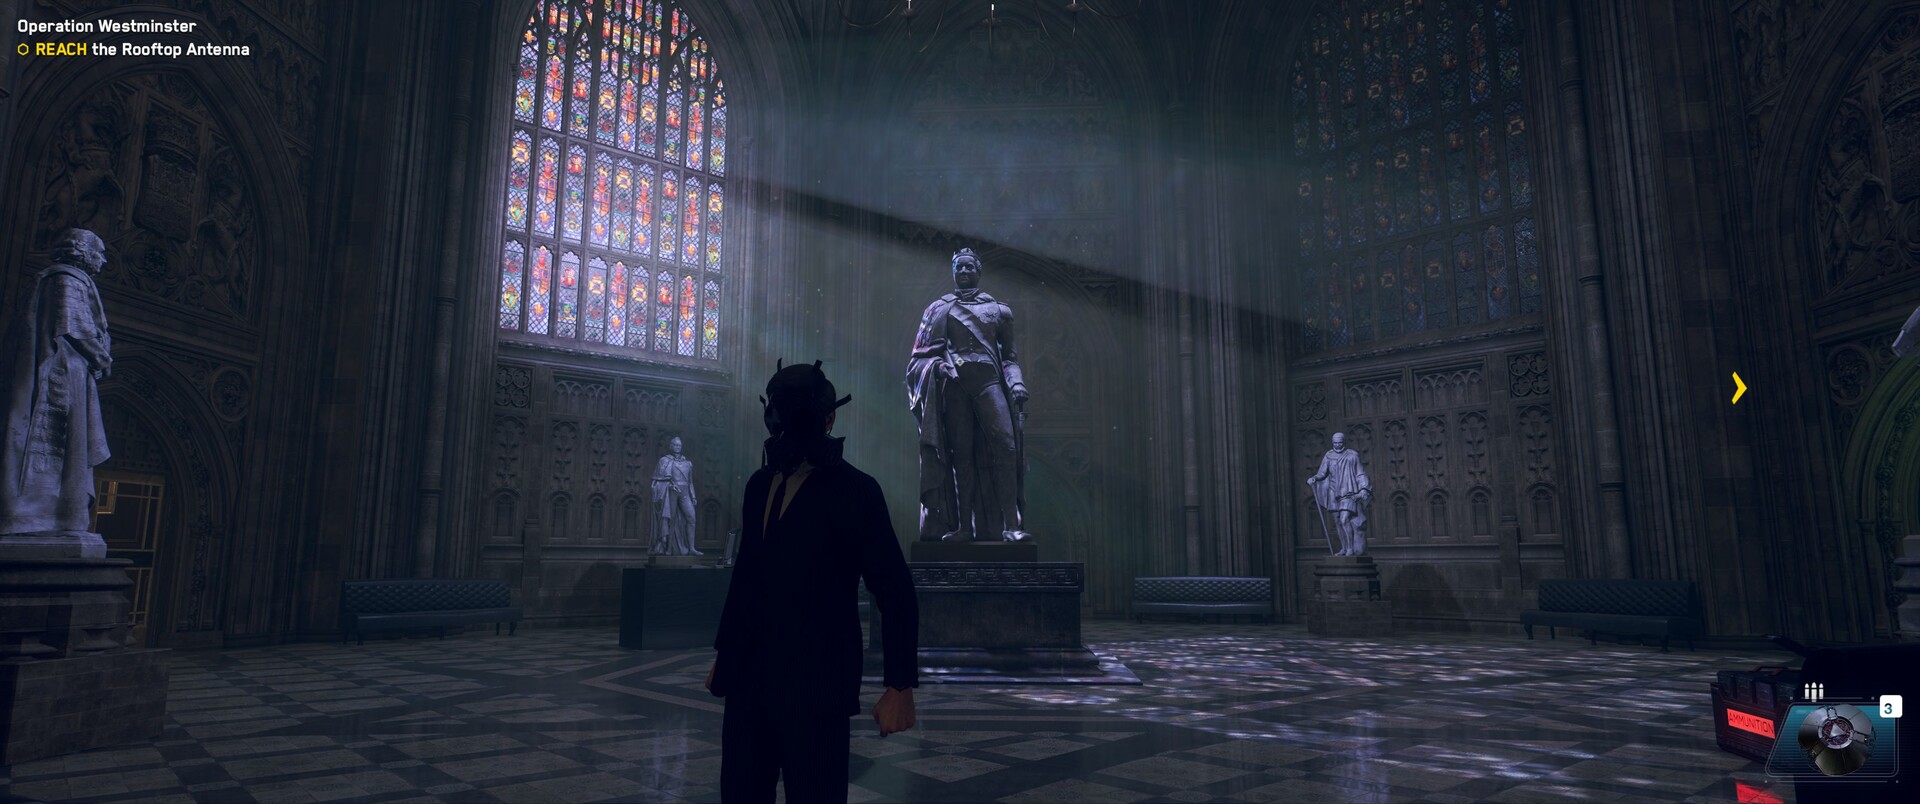
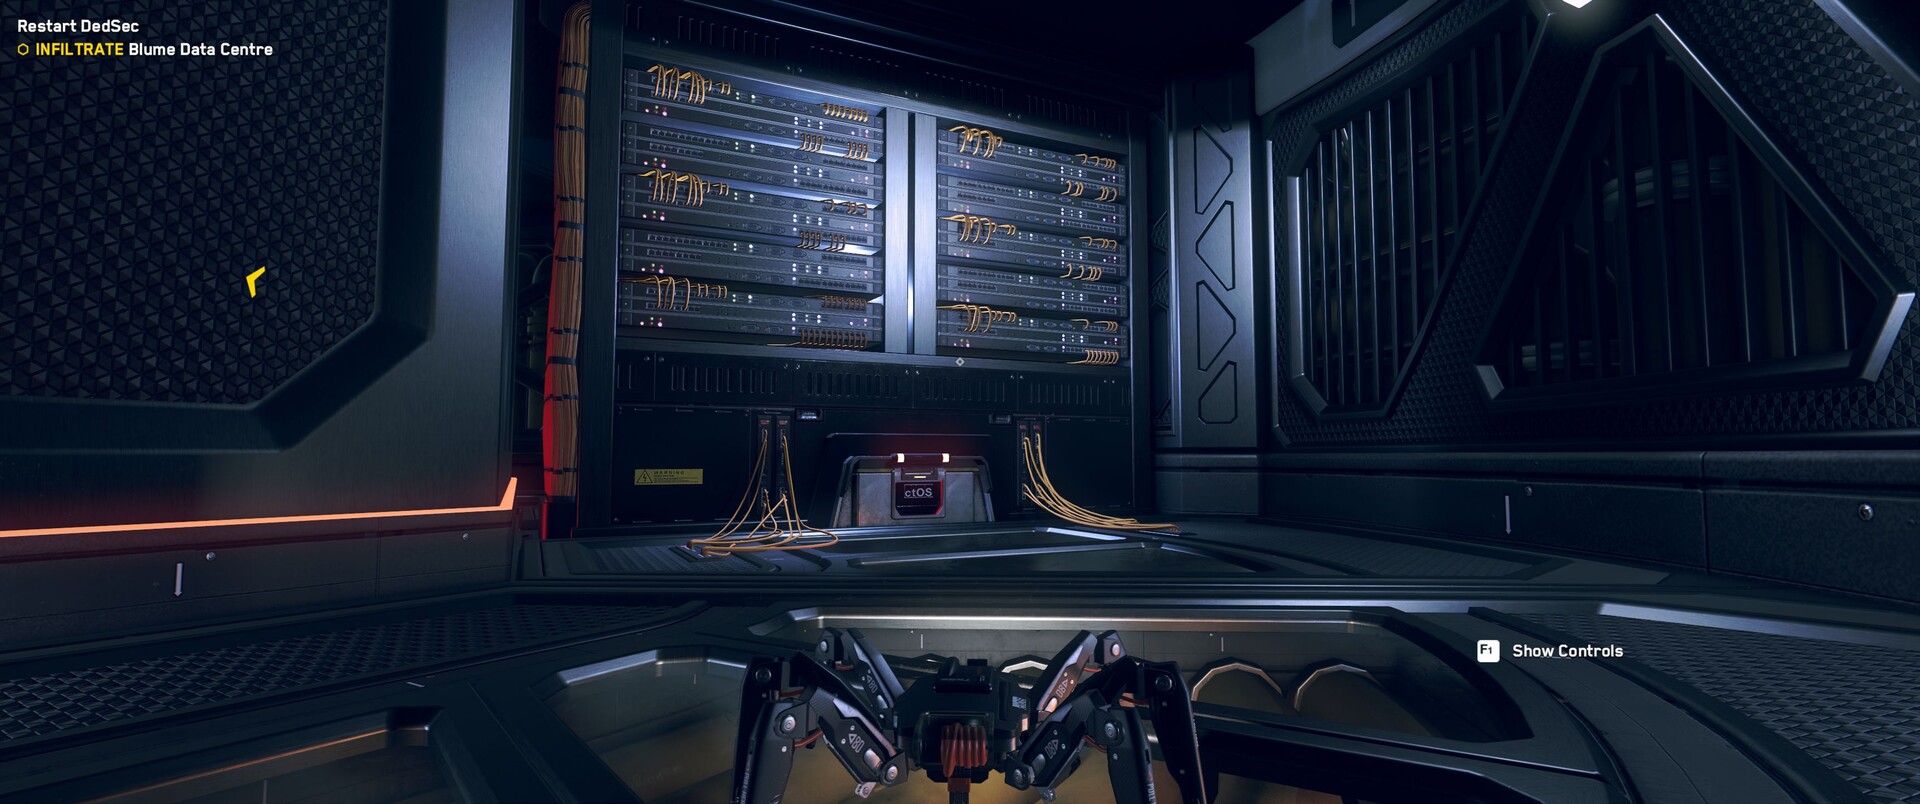
If you ignore mediocre animations, stutters and occasional crashes, then Watch Dogs Legion will look like a modern and well-made title. The open-world game scores some major points not only with its impressive view distance but also with its high-quality textures and slick effects (lighting, reflections, etc.), which afford the game world a very distinct atmosphere. All environments are highly detailed and the game appears cinematic.

Watch Dogs Legion
Watch Dogs Legion
Watch Dogs Legion
Watch Dogs Legion
Watch Dogs Legion
Watch Dogs Legion

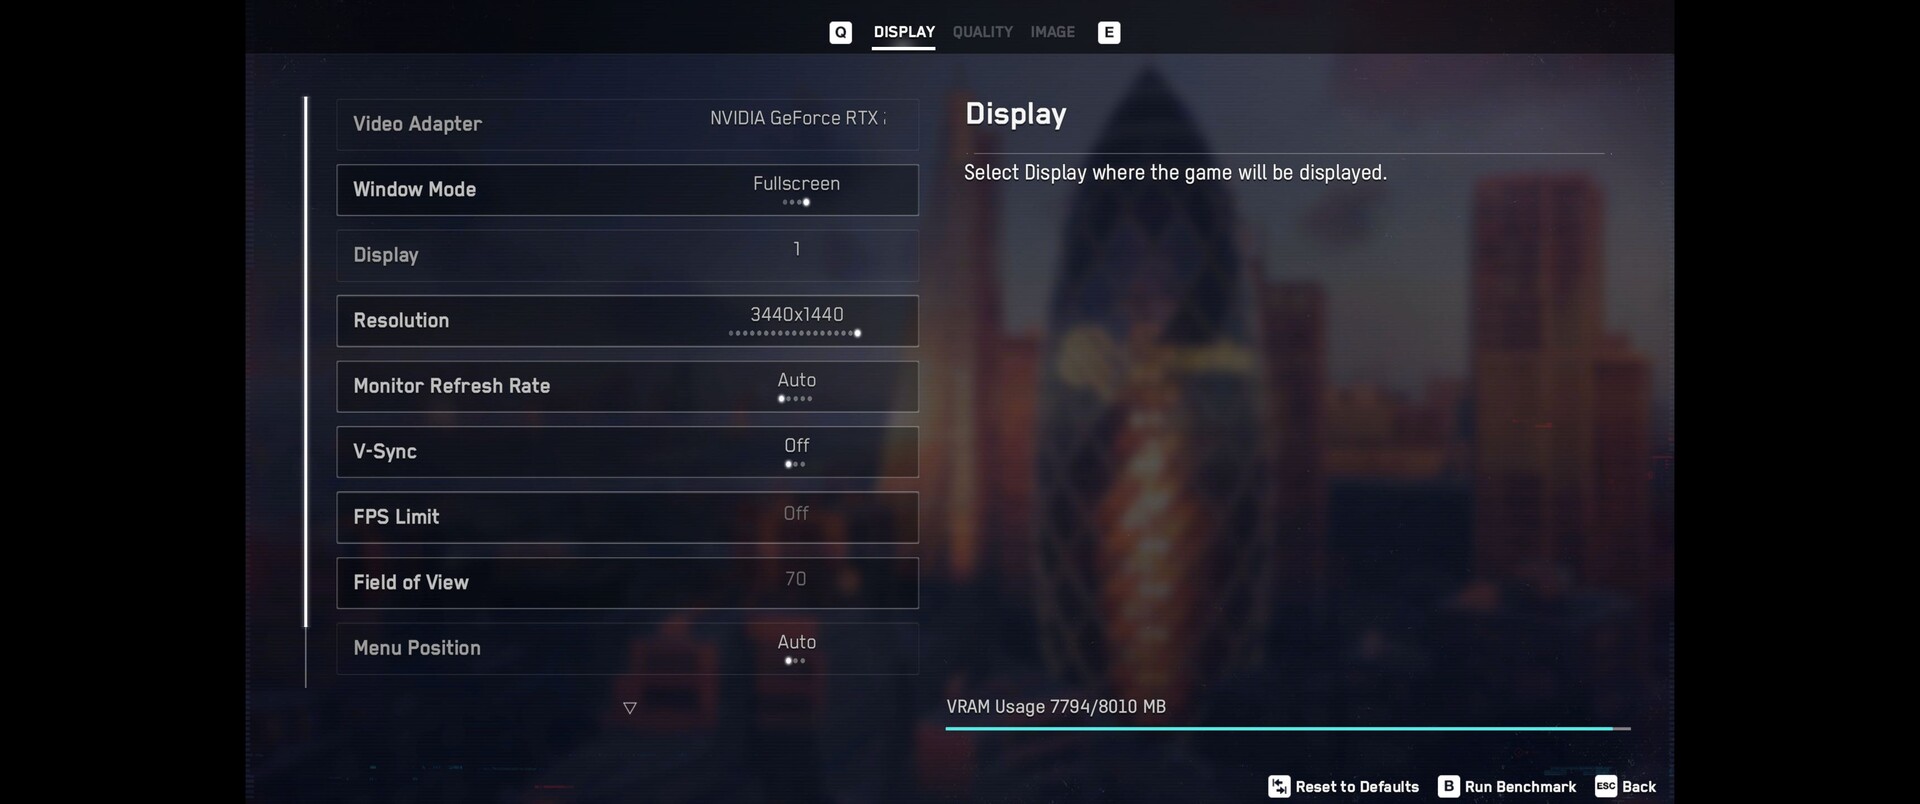
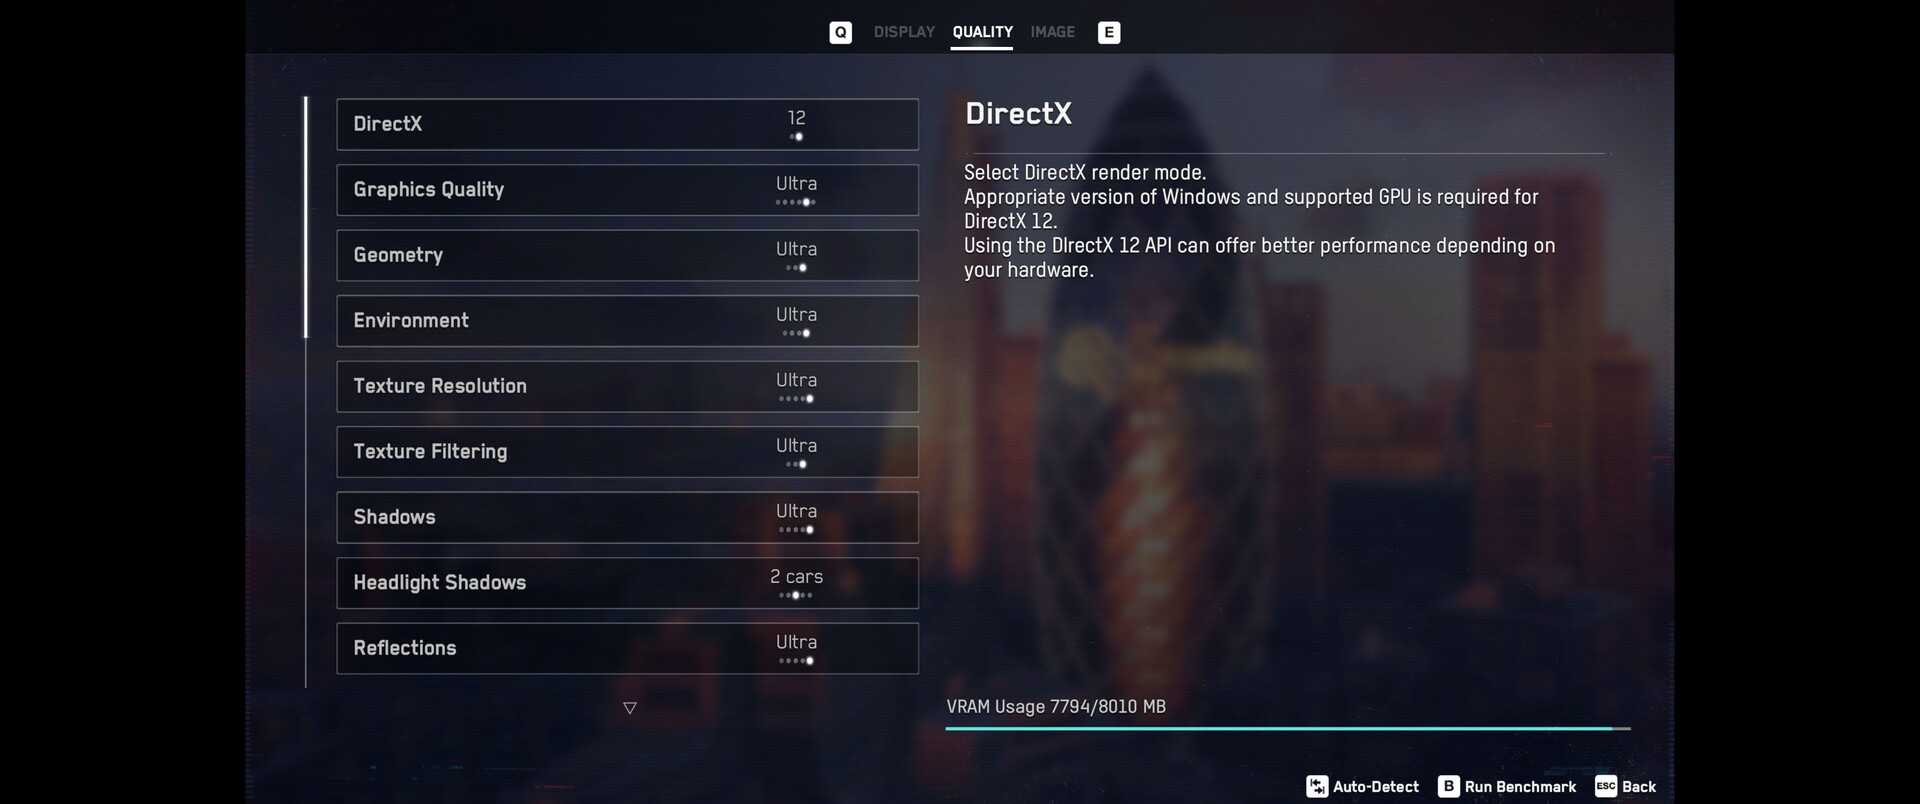
It is worth mentioning that the game requires a lot of VRAM. You will need at least 2 GB of video memory to run the game at 720p on the low preset. On the ultra preset, the title will gobble up 8 GB of VRAM. If your GPU has less than 4 GB of VRAM, then you should forgo getting Watch Dogs Legion.

Benchmark

As per usual, Ubisoft offers an in-game benchmark, which can be found in the settings menu. In the 1.5-minute benchmark pass, the camera sweeps through a lit alleyway at night, in which a gunfight eventually erupts (watch the video below). While during the benchmark pass you can only see the frame rates and the frame times, at the end of the benchmark you will be presented with detailed performance graphs and utilisation bars. Thanks to this, you can get a pretty good idea of the impact each setting has on the CPU, GPU and VRAM.  

Watch Dogs Legion
Watch Dogs Legion

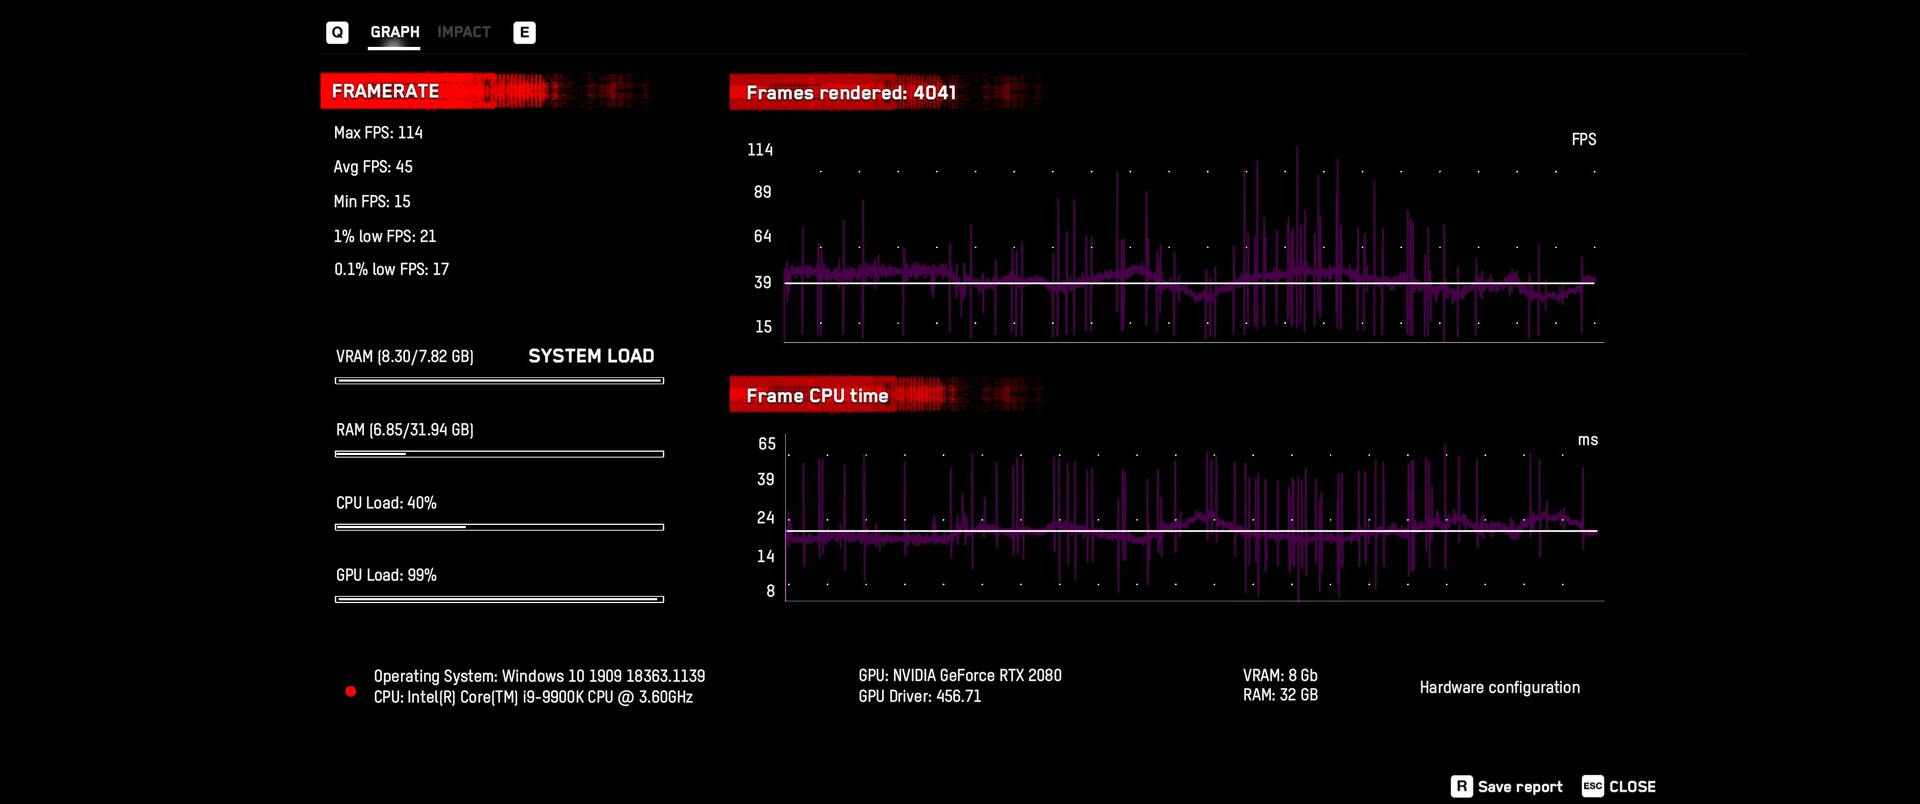
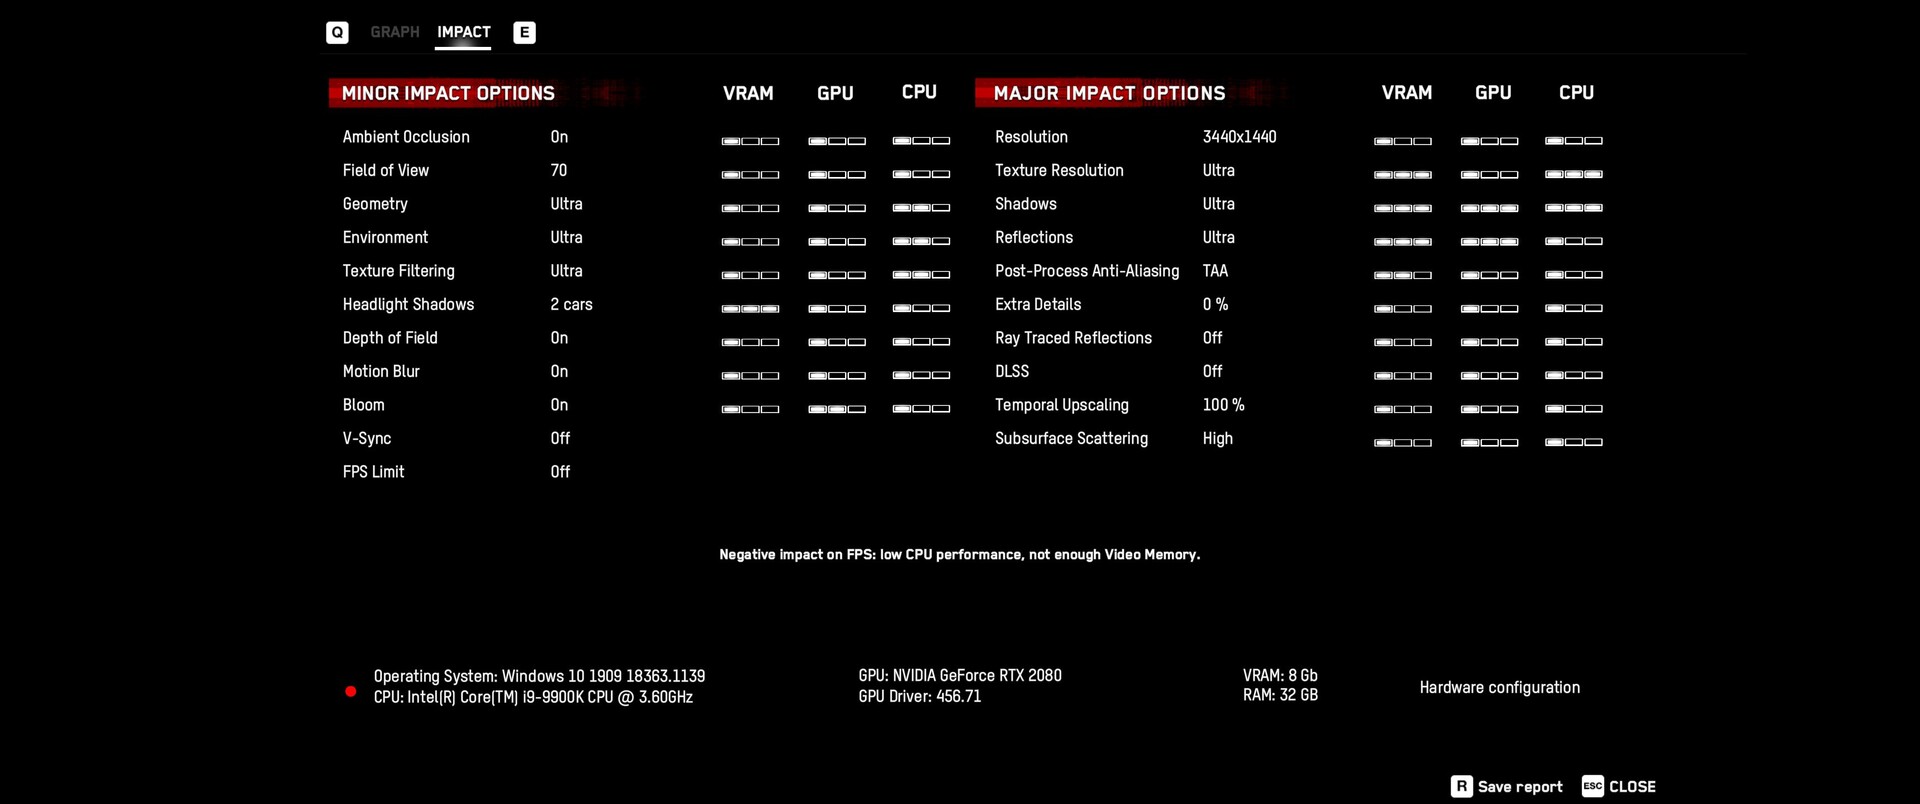
On the highest settings, Watch Dogs Legion is GPU-limited. However, at low resolutions and on low settings, the CPU can become the bottleneck.

Results

FHD (1920x1080)

Entry-level GPUs cannot handle Watch Dogs Legion. The GeForce MX330 and the MX350 cannot deliver playable frame rates even on low settings at 720p. For a smooth gameplay experience, you will need a lower mid-range GPU such as the GeForce GTX 1050. If you want to achieve playable frame rates at 1080p on the medium/high preset you will need an upper mid-range GPU (GeForce GTX 1650/Radeon RX 5500M or better). The high-end GeForce RTX 2060 can handle the game on the highest settings.

Watch Dogs Legion
    1920x1080 Medium Preset (DX12)     1920x1080 High Preset (DX12)     1920x1080 Ultra Preset (DX12)
NVIDIA GeForce RTX 2080 Mobile
MSI GT76 Titan DT 9SG, i9-9900K
114 (40.1min, 83.5P1) fps ∼35%
101 (39.81min, 74.33P1) fps ∼33%
70.7 (32.64min, 56.68P1) fps ∼27%
NVIDIA GeForce RTX 2080 Ti (Desktop)
MSI GeForce RTX 2080 Ti, i9-9900K
111 (41.22min, 82.63P1) fps ∼34%
98.7 (39.86min, 73.65P1) fps ∼32%
89.6 (38.16min, 65.46P1) fps ∼34%
NVIDIA GeForce RTX 2080 (Desktop)
MSI GeForce RTX 2080, i9-9900K
110 (46.39min, 82.24P1) fps ∼34%
97.5 (43.06min, 72.85P1) fps ∼32%
78.6 (27.14min, 59.65P1) fps ∼30%
NVIDIA GeForce RTX 2070 (Desktop)
MSI GeForce RTX 2070, i9-9900K
107 (47.18min, 81.55P1) fps ∼33%
94.1 (41.87min, 71.03P1) fps ∼30%
64.1 (21.16min, 42.75P1) fps ∼24%
NVIDIA GeForce RTX 2060 (Desktop)
MSI GeForce RTX 2060, i9-9900K
101 (24.46min, 76.42P1) fps ∼31%
87.4 (31.57min, 65.79P1) fps ∼28%
45.3 (14.9min, 18.44P1) fps ∼17%
NVIDIA GeForce RTX 2070 Mobile
MSI GP65 Leopard 9SF, i7-9750H
93.1 (43.4min, 66.69P1) fps ∼29%
81.6 (30.3min, 57.94P1) fps ∼26%
56.1 (34.32min, 44.63P1) fps ∼21%
NVIDIA GeForce RTX 2060 Mobile
MSI GE65 Raider 9SE, i7-9750H
85.5 (35.49min, 61.35P1) fps ∼26%
74.4 (33.64min, 53.49P1) fps ∼24%
40.5 (19.95min, 30.63P1) fps ∼15%
NVIDIA GeForce GTX 1660 Ti Mobile
MSI GP65 Leopard 9SD, i7-9750H
81.5 (35.98min, 59.37P1) fps ∼25%
70.9 (34.22min, 53.45P1) fps ∼23%
33.1 (16.78min, 21.15P1) fps ∼12%
NVIDIA GeForce GTX 1080 Mobile
Alienware 17 R4, i7-7820HK
77.3 (24.56min, 55.24P1) fps ∼24%
67.7 (20.53min, 49.56P1) fps ∼22%
51.2 (29.78min, 38.97P1) fps ∼19%
NVIDIA GeForce GTX 1070 Mobile
Asus G752VS, 6820HK
60.5 (23.98min, 37.67P1) fps ∼19%
53.3 (19.32min, 33.64P1) fps ∼17%
41.7 (16.84min, 27.67P1) fps ∼16%
AMD Radeon RX 5500M
MSI Alpha 15, R7 3750H
58.1 (34.22min, 44.48P1) fps ∼18%
51.4 (23.83min, 38.03P1) fps ∼17%
22.3 (13.38min, 14.71P1) fps ∼8%
NVIDIA GeForce GTX 1060 Mobile
MSI GT62VR, 6820HK
54.7 (27.9min, 40.56P1) fps ∼17%
48 (25.36min, 36.54P1) fps ∼16%
28.1 (17.11min, 22.9P1) fps ∼11%
NVIDIA GeForce GTX 1650 Mobile
MSI GP75 Leopard 9SC, i7-9750H
53.8 (26.13min, 39.24P1) fps ∼17%
45.3 (20.4min, 34.72P1) fps ∼15%
17.4 (2.15min, 6.93P1) fps ∼7%
NVIDIA GeForce GTX 1050 Ti Mobile
MSI GE72 7RE, i7-7700HQ
32.2 (20.75min, 25.03P1) fps ∼10%
27 (19.18min, 20.9P1) fps ∼9%
14.8 (11.22min, 11.97P1) fps ∼6%
NVIDIA GeForce GTX 1050 Mobile
MSI GL62M 7RD, i7-7700HQ
25.4 (6.76min, 19.26P1) fps ∼8%
22.1 (12.71min, 17.2P1) fps ∼7%
NVIDIA GeForce MX350
MSI Prestige 14, i7-10710U
16.8 (12.46min, 12.89P1) fps ∼5%
12.7 (9.64min, 10.56P1) fps ∼4%
NVIDIA GeForce MX330
MSI Prestige 14, i7-10510U
13.9 (9.49min, 10.84P1) fps ∼4%
12 (8.11min, 9.18P1) fps ∼4%

QHD (2560x1440)

The GeForce RTX 2070 can achieve playable frame rates in Watch Dogs Legion at 1440p on the ultra preset.

Watch Dogs Legion
    2560x1440 Ultra Preset (DX12)
NVIDIA GeForce RTX 2080 Ti (Desktop), i9-9900K
MSI GeForce RTX 2080 Ti
72.9 (20.82min, 52.94P1) fps ∼29%
NVIDIA GeForce RTX 2080 (Desktop), i9-9900K
MSI GeForce RTX 2080
58 (17.95min, 36.76P1) fps ∼23%
NVIDIA GeForce RTX 2080 Mobile, i9-9900K
MSI GT76 Titan DT 9SG
53 (23.37min, 42.94P1) fps ∼21%
NVIDIA GeForce RTX 2070 (Desktop), i9-9900K
MSI GeForce RTX 2070
46.6 (16.49min, 19.72P1) fps ∼18%
NVIDIA GeForce RTX 2070 Mobile, i7-9750H
MSI GP65 Leopard 9SF
41.6 (26.18min, 34.32P1) fps ∼16%
NVIDIA GeForce GTX 1080 Mobile, i7-7820HK
Alienware 17 R4
37 (21.41min, 26.67P1) fps ∼15%
NVIDIA GeForce RTX 2060 (Desktop), i9-9900K
MSI GeForce RTX 2060
30.3 (12.85min, 14.85P1) fps ∼12%
NVIDIA GeForce GTX 1070 Mobile, 6820HK
Asus G752VS
29.9 (14.53min, 21.33P1) fps ∼12%
NVIDIA GeForce RTX 2060 Mobile, i7-9750H
MSI GE65 Raider 9SE
27.9 (16.02min, 20.99P1) fps ∼11%
NVIDIA GeForce GTX 1660 Ti Mobile, i7-9750H
MSI GP65 Leopard 9SD
23.2 (12.77min, 14.75P1) fps ∼9%
NVIDIA GeForce GTX 1060 Mobile, 6820HK
MSI GT62VR
19.4 (11.53min, 14.85P1) fps ∼8%
AMD Radeon RX 5500M, R7 3750H
MSI Alpha 15
16 (10.61min, 11.72P1) fps ∼6%
NVIDIA GeForce GTX 1650 Mobile, i7-9750H
MSI GP75 Leopard 9SC
12.3 (1.29min, 3.91P1) fps ∼5%

UHD (3840x2160)

Currently, there are no laptop GPUs that can handle Watch Dogs Legion at 4K on ultra settings. Only a desktop graphics card such as the GeForce RTX 2080 Ti can run Watch Dogs Legion smoothly on these settings.

Watch Dogs Legion
    3840x2160 Ultra Preset (DX12)
NVIDIA GeForce RTX 2080 Ti (Desktop), i9-9900K
MSI GeForce RTX 2080 Ti
44 (15.41min, 18.83P1) fps ∼19%
NVIDIA GeForce RTX 2080 (Desktop), i9-9900K
MSI GeForce RTX 2080
34.7 (14.47min, 18.08P1) fps ∼15%
NVIDIA GeForce RTX 2080 Mobile, i9-9900K
MSI GT76 Titan DT 9SG
30.8 (14.23min, 23.4P1) fps ∼13%
NVIDIA GeForce RTX 2070 (Desktop), i9-9900K
MSI GeForce RTX 2070
26.6 (11.89min, 14.14P1) fps ∼11%
NVIDIA GeForce RTX 2070 Mobile, i7-9750H
MSI GP65 Leopard 9SF
23.4 (11.68min, 17.65P1) fps ∼10%
NVIDIA GeForce GTX 1080 Mobile, i7-7820HK
Alienware 17 R4
20.5 (11.15min, 15.17P1) fps ∼9%
NVIDIA GeForce RTX 2060 (Desktop), i9-9900K
MSI GeForce RTX 2060
17.4 (9.45min, 10.44P1) fps ∼7%
NVIDIA GeForce GTX 1070 Mobile, 6820HK
Asus G752VS
16.1 (8.58min, 12.18P1) fps ∼7%
NVIDIA GeForce RTX 2060 Mobile, i7-9750H
MSI GE65 Raider 9SE
15.3 (7.7min, 11.28P1) fps ∼6%
NVIDIA GeForce GTX 1660 Ti Mobile, i7-9750H
MSI GP65 Leopard 9SD
13 (6.8min, 8.59P1) fps ∼5%

Ray Tracing

Those who want to game with ray tracing on will have to deal with a heavy performance penalty. On the highest DirectX ray-tracing setting, the frame rate is halved, at least in the case of Nvidia’s RTX 2000 GPUs (non-RTX graphics cards fare even worse). The new RTX 3000 GPUs, which feature a number of improvements, should do somewhat better here. For gaming at 1080p on ultra settings, we recommend an RTX 2080 or better.

Watch Dogs Legion
    1920x1080 Ultra Preset + Ultra Ray Tracing (DX12)
NVIDIA GeForce RTX 2080 Ti (Desktop), i9-9900K
MSI GeForce RTX 2080 Ti
55.8 (19.2min, 42.63P1) fps ∼35%
NVIDIA GeForce RTX 2080 (Desktop), i9-9900K
MSI GeForce RTX 2080
44.6 (8.67min, 19.6P1) fps ∼28%
NVIDIA GeForce RTX 2080 Mobile, i9-9900K
MSI GT76 Titan DT 9SG
42.1 (26.53min, 34.06P1) fps ∼26%
NVIDIA GeForce RTX 2070 (Desktop), i9-9900K
MSI GeForce RTX 2070
33.6 (6.32min, 11.23P1) fps ∼21%
NVIDIA GeForce RTX 2070 Mobile, i7-9750H
MSI GP65 Leopard 9SF
32.3 (18.52min, 25.53P1) fps ∼20%
NVIDIA GeForce RTX 2060 (Desktop), i9-9900K
MSI GeForce RTX 2060
24 (6.99min, 10.57P1) fps ∼15%
NVIDIA GeForce RTX 2060 Mobile, i7-9750H
MSI GE65 Raider 9SE
22.4 (11.5min, 15P1) fps ∼14%
NVIDIA GeForce GTX 1080 Mobile, i7-7820HK
Alienware 17 R4
17.3 (9.42min, 12.45P1) fps ∼11%
NVIDIA GeForce GTX 1660 Ti Mobile, i7-9750H
MSI GP65 Leopard 9SD
14.5 (7.74min, 10.09P1) fps ∼9%
NVIDIA GeForce GTX 1070 Mobile, 6820HK
Asus G752VS
14.2 (7.22min, 10.27P1) fps ∼9%
NVIDIA GeForce GTX 1060 Mobile, 6820HK
MSI GT62VR
8.13 (2.25min, 3.04P1) fps ∼5%

Note

Because benchmarking video games is very time-consuming and is often constrained by installation/activation limits, at the time of publishing, we were able only to provide a part of our performance analysis of Watch Dogs Legion. Other graphics cards will be added in the coming days and weeks.

Overview

Show Restrictions
PosModel< PrevNext >Watch Dogs Legion
 Watch Dogs Legion (2020)
low
1280x720
Low Preset (DX12)
med.
1920x1080
Medium Preset (DX12)
high
1920x1080
High Preset (DX12)
ultra
1920x1080
Ultra Preset (DX12)
QHD
2560x1440
Ultra Preset (DX12)
4K
3840x2160
Ultra Preset (DX12)
NVIDIA GeForce RTX 4090
189.5n3
187.7n3
172.5n3
152.9n3
151.9n3
116.7n3
NVIDIA GeForce RTX 4080
187
191.3
173.4
163.5
142.4
86.8
NVIDIA GeForce RTX 3090 Ti
171.4n2
154.2n2
130.2n2
107.8n2
70.1n2
NVIDIA GeForce RTX 4070 Ti SUPER
171.2
159.3
144.2
115.9
68.6
NVIDIA GeForce RTX 4070 Ti
175.9n2
151.9n2
121n2
68.4n2
AMD Radeon RX 6950 XT
130
130
115
107
103
65
NVIDIA GeForce RTX 4090 Laptop GPU
152
144
131
120n3
109n3
69n3
NVIDIA GeForce RTX 3090
130n2
129n2
115.5n2
105n2
89n2
58.95n2
NVIDIA GeForce RTX 3080 Ti
97
88.5
58.7
NVIDIA GeForce RTX 4070 SUPER
169.2
159.1
138.9n2
107.6n2
62.4n2
AMD Radeon RX 6900 XT
191
190
170
120.5n2
91.25n2
53.55n2
NVIDIA GeForce RTX 4080 Laptop GPU
140
129
121
110
93
56
NVIDIA GeForce RTX 3080 12 GB
123
118.1
107.8
95.2
83.5
55.2
NVIDIA GeForce RTX 3080
134.5n2
133.5n2
119n2
101.15n2
81.35n2
53.8n2
NVIDIA GeForce RTX 4070
163.7
124.4
93.3
49.5
AMD Radeon RX 6800 XT
173
169
150
112
84.5
49.3
AMD Radeon RX 6800
114
115
104
87.7
72.3
44.5
NVIDIA Titan RTX
113
112
97.4
85.5
69.9
43.4
NVIDIA GeForce RTX 3080 Ti Laptop GPU
137n3
125.2n4
114.5n4
84n4
66.5n2
42
PosModel< PrevNext >Watch Dogs Legion
low med. high ultra QHD 4K
NVIDIA GeForce RTX 4070 Laptop GPU
130
89
64
33
NVIDIA GeForce RTX 3070
123.5n4
120.5n4
110.5n4
85.45n4
66n4
37.95n4
AMD Radeon RX 6750 XT
133
134.95n2
125.15n2
98.25n2
73n2
40.7n2
NVIDIA GeForce RTX 2080 Ti (Desktop)
111
98.7
89.6
72.9
44
AMD Radeon RX 6700 XT
196
134
84.1
61.9
35.3
NVIDIA GeForce RTX 3080 Laptop GPU
112n3
110n3
97n5
73n5
56n3
32n3
NVIDIA GeForce RTX 3060 Ti
124
122
109
76.6
59.1
33
Intel Arc A770
102.9
101.7
93.3
73.6
58.5
36.6
AMD Radeon RX 6850M XT
120
119
108
83
60
NVIDIA GeForce RTX 3070 Ti Laptop GPU
121
106.5n2
96.65n2
67.8n2
50
29
NVIDIA GeForce RTX 4060 Laptop GPU
65
44
25
NVIDIA GeForce RTX 2080 Super (Desktop)
117
114
99.3
75.4
57.3
34.4
AMD Radeon RX 6800M
87
85
79
69
55
33
AMD Radeon RX 6650 XT
137
133
119
65
49
23
AMD Radeon RX 6600 XT
132
120
104
61
44
24
NVIDIA GeForce RTX 2080 (Desktop)
110
97.5
78.6
58
34.7
NVIDIA GeForce RTX 3070 Laptop GPU
108n3
89n4
74.5n6
59.9n7
55n3
27n3
AMD Radeon RX 6800S
117
104
66
48
25
AMD Radeon RX 7600M XT
142
136
123
49
34
17
Intel Arc A750
101
96
89
63
50
30
PosModel< PrevNext >Watch Dogs Legion
low med. high ultra QHD 4K
NVIDIA GeForce RTX 3060
123
108
94.7
59.1
45.1
26.8
NVIDIA GeForce RTX 2080 Mobile
114
101
70.7
53
30.8
AMD Radeon RX 6700M
96
87
64
NVIDIA Titan X Pascal
108
104
91.1
63.6
46
26
NVIDIA GeForce RTX 2070 Super (Desktop)
118
111
96.4
68.3
51.4
29.2
AMD Radeon VII
147
113
99
63
48.4
29.1
AMD Radeon RX 5700 XT (Desktop)
142
121
106
66.8
46.4
12.7
NVIDIA GeForce RTX 2070 (Desktop)
107
94.1
64.1
46.6
26.6
NVIDIA GeForce RTX 3060 Laptop GPU
86.55n2
81n2
70.7n3
46n3
33.9n3
19
AMD Radeon RX 7600S
122.6
118.5
106.6
69.5
NVIDIA GeForce RTX 2070 Super Mobile
112.1n2
103.85n2
91.05n2
60.5n4
44
25
Intel Arc A580
101
93
86
60
47
27
NVIDIA GeForce RTX 2060 Super (Desktop)
118
104
90.4
59.1
43.7
24.7
AMD Radeon RX 6600
119
105
93.8
58.4
40.7
20.8
AMD Radeon RX 5700 (Desktop)
141
108
94.2
58
37.5
11.4
AMD Radeon RX 6650M
109
104
94
62
AMD Radeon RX 6600M
120.6
119.7
107.4
59
41.6
21.4
AMD Radeon RX 6700S
109
96
59
38
NVIDIA GeForce RTX 2070 Mobile
93.1
81.6
56.1
41.6
23.4
NVIDIA GeForce RTX 2060 (Desktop)
101
87.4
45.3
30.3
17.4
PosModel< PrevNext >Watch Dogs Legion
low med. high ultra QHD 4K
AMD Radeon RX Vega 64
139
100
86.7
54.1
38.1
20.7
NVIDIA GeForce GTX 1080 Mobile
77.3
67.7
51.2
37
20.5
NVIDIA GeForce RTX 2070 Super Max-Q
100
96
84
59
NVIDIA GeForce RTX 2070 Max-Q
115n2
88.1n2
77.25n2
51.25n2
NVIDIA GeForce RTX 2060 Mobile
85.5
70.2n2
38.25n2
27.9
15.3
NVIDIA GeForce RTX 3050
124
85
73
71
33
19
AMD Radeon RX 5600 XT (Desktop)
140
104
88.6
35
21.4
10.8
NVIDIA GeForce GTX 1080 Max-Q
65.7
65.6
58.5
47.5
NVIDIA GeForce GTX 1070 Mobile
60.5
53.3
41.7
29.9
16.1
NVIDIA GeForce GTX 1660 Super (Desktop)
115
82.5
70.8
31.4
23.5
12.3
AMD Radeon RX 6500 XT
117
73.7
57.6
24.8
18.5
9.68
AMD Radeon RX 5500 XT (Desktop)
116
73.5
63.8
35.8
25.5
14.4
NVIDIA GeForce RTX 4050 Laptop GPU
129.65n2
118.15n2
106n2
51.95n2
34.9n2
26
Intel Arc A730M
85
75
48
35
AMD Radeon RX 5600M
78
70
32
26
13
NVIDIA GeForce GTX 1660 Ti Mobile
81.5
70.9
33.1
23.2
13
NVIDIA GeForce RTX 3050 Ti Laptop GPU
60.5n2
59n3
55n3
28n3
20n2
10
NVIDIA GeForce GTX 1660 (Desktop)
114
77.9
65.9
29.4
19.4
12
NVIDIA GeForce GTX 1650 Super (Desktop)
110
71.3
60.6
20.9
14.3
8.09
NVIDIA GeForce RTX 3050 4GB Laptop GPU
80
66n2
57n2
26
19
PosModel< PrevNext >Watch Dogs Legion
low med. high ultra QHD 4K
AMD Radeon RX 6500M
81.1
70
59.1
24.6
AMD Radeon RX 590 (Desktop)
113
72.2
59.2
34.8
24.8
12.8
NVIDIA GeForce GTX 1060 Mobile
66.2
54.7
48
28.1
19.4
NVIDIA GeForce GTX 1650 Ti Mobile
99.5n2
59.55n2
51.55n2
22.45n2
Intel Arc A370M
77
45
34
15
11
AMD Radeon RX 5500M
66.4
58.1
51.4
22.3
16
NVIDIA GeForce RTX 2050 Mobile
64
46
39
18
NVIDIA GeForce GTX 1650 (Desktop)
92.9
56
47.6
21.2
14.3
8.02
NVIDIA GeForce GTX 1650 Mobile
80.4n3
48n3
41.6n3
17.4n3
12.3
NVIDIA GeForce GTX 1650 Ti Max-Q
79.5n2
48.5n2
39n3
16n2
14
NVIDIA T1200 Laptop GPU
66
54
47
19
12
AMD Radeon 780M
72
41
33
18
NVIDIA GeForce GTX 1050 Ti Mobile
55.8
32.2
27
14.8
AMD Radeon 680M
60
39
33
18
NVIDIA GeForce MX450
46.1n2
25.4n2
18n2
6.81n2
4.67
NVIDIA GeForce GTX 1050 Mobile
46.7
25.4
22.1
AMD Radeon 660M
49
26
22
AMD Radeon RX 560X (Laptop)
48.4
29.2
25
10.7
Intel Iris Xe Graphics G7 96EUs
37.1n2
21.9n2
14
NVIDIA GeForce MX350
34.35n4
18.4n3
13.7n3
6.34
PosModel< PrevNext >Watch Dogs Legion
low med. high ultra QHD 4K
AMD Radeon RX 550 (Laptop)
20.3
9.51
7.87
3.68
NVIDIA GeForce GT 1030 (Desktop)
25.5
13.1
11.6
5.65
NVIDIA GeForce MX330
26.2
13.9
12
NVIDIA GeForce MX150
26.9
14.1
11.1
Intel Iris Xe Graphics G7 80EUs
27.3n2
15.8n2
13.6n2
AMD Radeon 540X
23.4
13
AMD Radeon RX Vega 10
25
13.9
11.8
AMD Radeon RX Vega 8 (Ryzen 4000/5000)
38.2n2
20.55n2
17.05n2
12.1
8.4
AMD Radeon RX Vega 7
34.1n2
17.05n2
14.7n2
NVIDIA GeForce MX130
20.6
10.8
AMD Radeon RX Vega 8 (Ryzen 2000/3000)
21
11.6
NVIDIA GeForce 930MX
16
8.96
AMD Radeon RX Vega 6 (Ryzen 4000/5000)
26.15n2
13.65n2
AMD Radeon RX Vega 6 (Ryzen 2000/3000)
14.8
8.71
AMD Radeon RX Vega 5
23.1
12
10.2
Intel UHD Graphics Xe 16EUs (Tiger Lake-H)
12.3
6.23
AMD Radeon RX Vega 3
11.3
6.26
(-) * Smaller values are better. / n123 Number of benchmarks for this median value / * Approximate position


Legend
5Stutters – This game is very likely to stutter and have poor frame rates. Based on all known benchmarks using the specified graphical settings, average frame rates are expected to fall below 25fps
May Stutter – This graphics card has not been explicitly tested on this game. Based on interpolated information from surrounding graphics cards of similar performance levels, stutters and poor frame rates are expected.
30Fluent – Based on all known benchmarks using the specified graphical settings, this game should run at or above 25fps
40Fluent – Based on all known benchmarks using the specified graphical settings, this game should run at or above 35fps
60Fluent – Based on all known benchmarks using the specified graphical settings, this game should run at or above 58fps
May Run Fluently – This graphics card has not been explicitly tested on this game. Based on interpolated information from surrounding graphics cards of similar performance levels, fluent frame rates are expected.
?Uncertain – This graphics card experienced unexpected performance issues during testing for this game. A slower card may be able to achieve better and more consistent frame rates than this particular GPU running the same benchmark scene.
Uncertain – This graphics card has not been explicitly tested on this game and no reliable interpolation can be made based on the performances of surrounding cards of the same class or family.
The value in the fields displays the average frame rate of all values in the database. Move your cursor over the value to see individual results.

Benchmark Systems

Device Graphics Card Processor Memory OS
Desktop-PC I MSI GeForce RTX 2080 Ti (11 GB GDDR6)
MSI GeForce RTX 2080 (8 GB GDDR6)
MSI GeForce RTX 2070 (8 GB GDDR6)
MSI GeForce RTX 2060 (6 GB GDDR6)
Intel Core i9-9900K 4 x 8 GB DDR4 Windows 10 64 Bit
Desktop-PC II Nvidia GeForce GTX 1080 Ti (11 GB GDDR5X)
Asus GeForce GTX 980 Ti (6 GB GDDR5)
XFX Radeon R9 Fury (4 GB HBM)
Sapphire Radeon R9 290X (4 GB GDDR5)
Sapphire Radeon R9 280X (3 GB GDDR5)
MSI Radeon R7 370 (2 GB GDDR5)
Intel Core i7-8086K, Aorus Z370 Ultra Gaming 2 x 8 GB DDR4 Windows 10 64 Bit
Desktop-PC III Nvidia Titan RTX (24 GB GDDR6)
Nvidia GeForce RTX 2080 Super (8 GB GDDR6)
Nvidia GeForce RTX 2070 Super (8 GB GDDR6)
Nvidia GeForce RTX 2060 Super (8 GB GDDR6)
KFA2 GeForce RTX 2060 Super (8 GB GDDR6)
Nvidia Titan X (Pascal) (12 GB GDDR5X)
KFA2 GeForce GTX 1660 Super (6 GB GDDR6)
PNY GeForce GTX 1660 (6 GB GDDR5)
Gainward GeForce GTX 1650 (4 GB GDDR5)
Zotac GeForce GT 1030 (2 GB GDDR5)
AMD Radeon RX 5700 XT (8 GB GDDR6)
AMD Radeon RX 5700 (8 GB GDDR6)
AMD Radeon RX 5600 XT (8 GB GDDR6))
AMD Radeon RX Vega 64 (8 GB HBM2)
XFX AMD Radeon RX 590 (8 GB GDDR5)
AMD Ryzen 9 3900X 2 x 8 GB DDR4 Windows 10 64 Bit
MSI GT76 Nvidia GeForce RTX 2080 (8 GB GDDR6) Intel Core i9-9900K 2 x 16 GB DDR4 Windows 10 64 Bit
MSI GP65 Nvidia GeForce RTX 2070 (8 GB GDDR6) Intel Core i7-9750H 2 x 16 GB DDR4 Windows 10 64 Bit
MSI GE65 Nvidia GeForce RTX 2060 (6 GB GDDR6) Intel Core i7-9750H 2 x 8 GB DDR4 Windows 10 64 Bit
MSI GP65 Nvidia GeForce GTX 1660 Ti (6 GB GDDR6) Intel Core i7-9750H 2 x 16 GB DDR4 Windows 10 64 Bit
MSI GP75 Nvidia GeForce GTX 1650 (4 GB GDDR5) Intel Core i7-9750H 2 x 8 GB DDR4 Windows 10 64 Bit
Alienware 17 R4 Nvidia GeForce GTX 1080 (8 GB GDDR5X) Intel Core i7-7820HK 2 x 16 GB DDR4 Windows 10 64 Bit
Asus G752VS Nvidia GeForce GTX 1070 (8 GB GDDR5) Intel Core i7-6820HK 2 x 16 GB DDR4 Windows 10 64 Bit
MSI GT62VR Nvidia GeForce GTX 1060 (6 GB GDDR5) Intel Core i7-6820HK 2 x 8 GB DDR4 Windows 10 64 Bit
MSI GE72 Nvidia GeForce GTX 1050 Ti (2 GB GDDR5) Intel Core i7-7700HQ 2 x 4 GB DDR4 Windows 10 64 Bit
MSI GL62 Nvidia GeForce GTX 1050 (2 GB GDDR5) Intel Core i7-7700HQ 2 x 4 GB DDR4 Windows 10 64 Bit
MSI Prestige 14 Nvidia GeForce MX350 (2 GB GDDR5) Intel Core i7-10710U 1 x 16 GB DDR4 Windows 10 64 Bit
MSI Prestige 14 Nvidia GeForce MX330 (2 GB GDDR5) Intel Core i7-10510U 1 x 16 GB DDR4 Windows 10 64 Bit
MSI Alpha 15 AMD Radeon RX5500M (4 GB GDDR6) AMD Ryzen 7 3750H 2 x 8 GB DDR4 Windows 10 64 Bit
4K monitors Nvidia drivers AMD drivers
Asus PB287Q, Philips Brilliance 329P9H ForceWare 457.09 Adrenalin 20.10.1
static version load dynamic
Loading Comments
Comment on this article
Please share our article, every link counts!
> Expert Reviews and News on Laptops, Smartphones and Tech Innovations > Reviews > Watch Dogs Legion Laptop and Desktop Benchmarks
Florian Glaser, 2020-11- 2 (Update: 2022-01-21)