


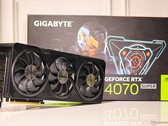
Gigabyte GeForce RTX 4070 Super Gaming OC 12G Review: Beats the RTX 3090 and RX 7800 XT for a $50 premium over the Founders Edition
The Gigabyte GeForce RTX 4070 Super Gaming OC presents a faster AD104 die and better cooling that fully distinguishes it from the Founders Edition card. The RTX 4070 Super Gaming OC offers palpable gains over the RTX 3090 and the AMD Radeon RX 7800 XT. Our review looks into whether this is worth the US$50 moolah over the RTX 4070 Super Founders Edition.
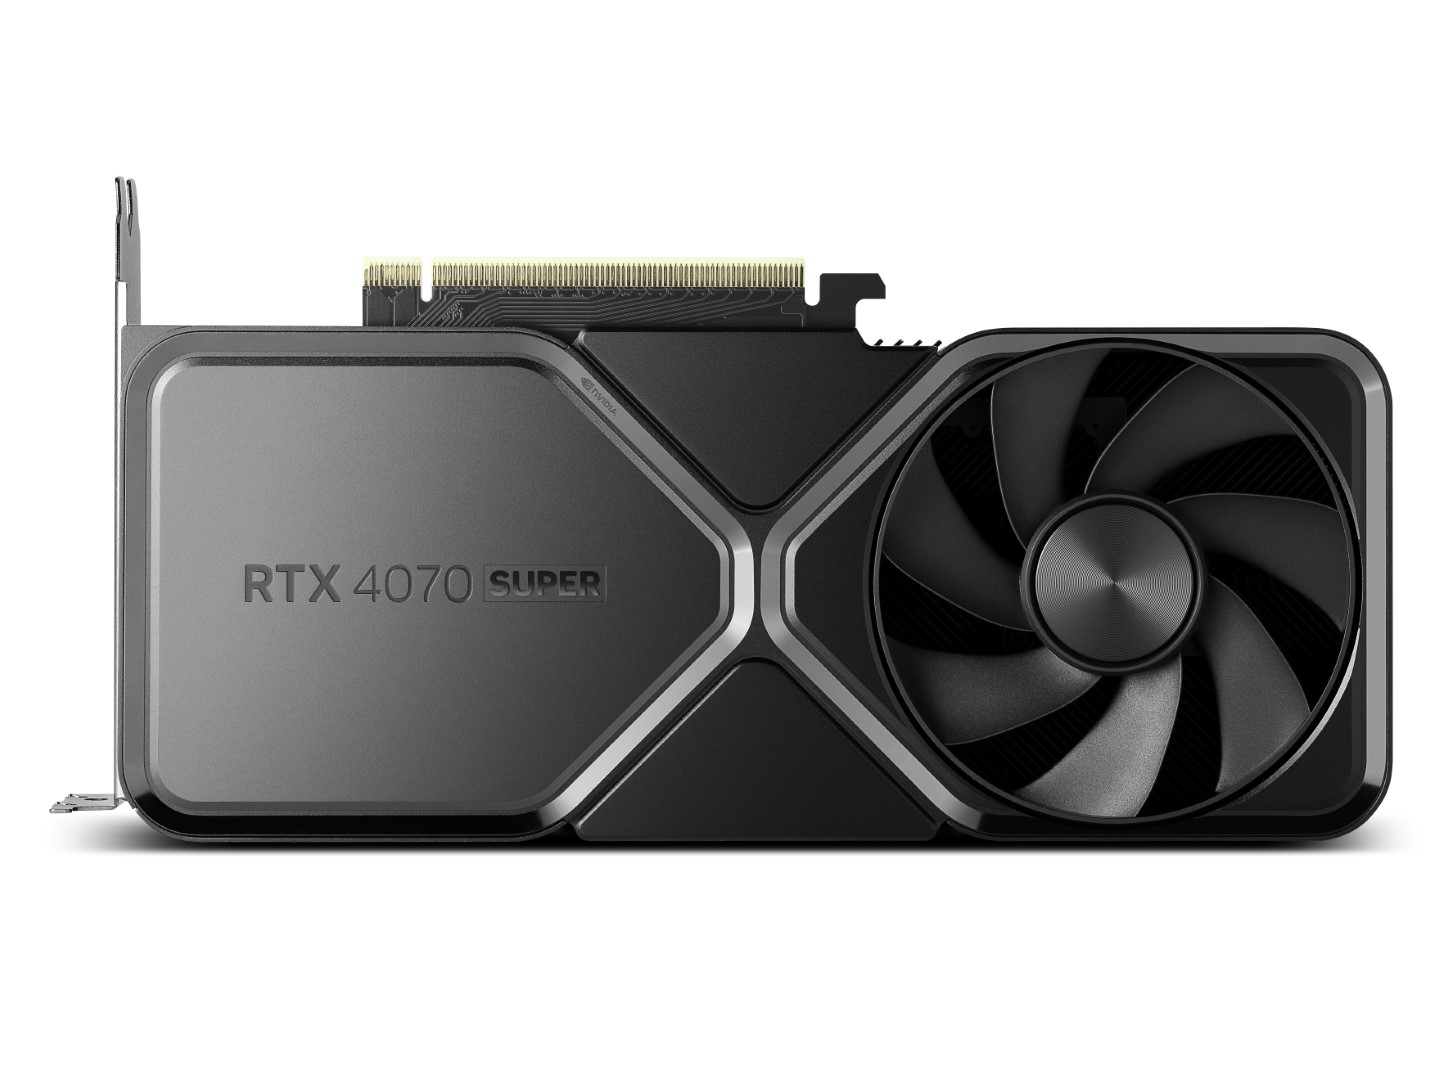
Intel Core i9-13900K, NVIDIA GeForce RTX 4070 SUPER