


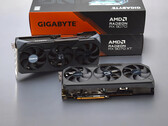
Amazing value for money: The AMD Radeon RX 9070 XT and RX 9070 take on the overpriced GeForce RTX 5000 graphics cards
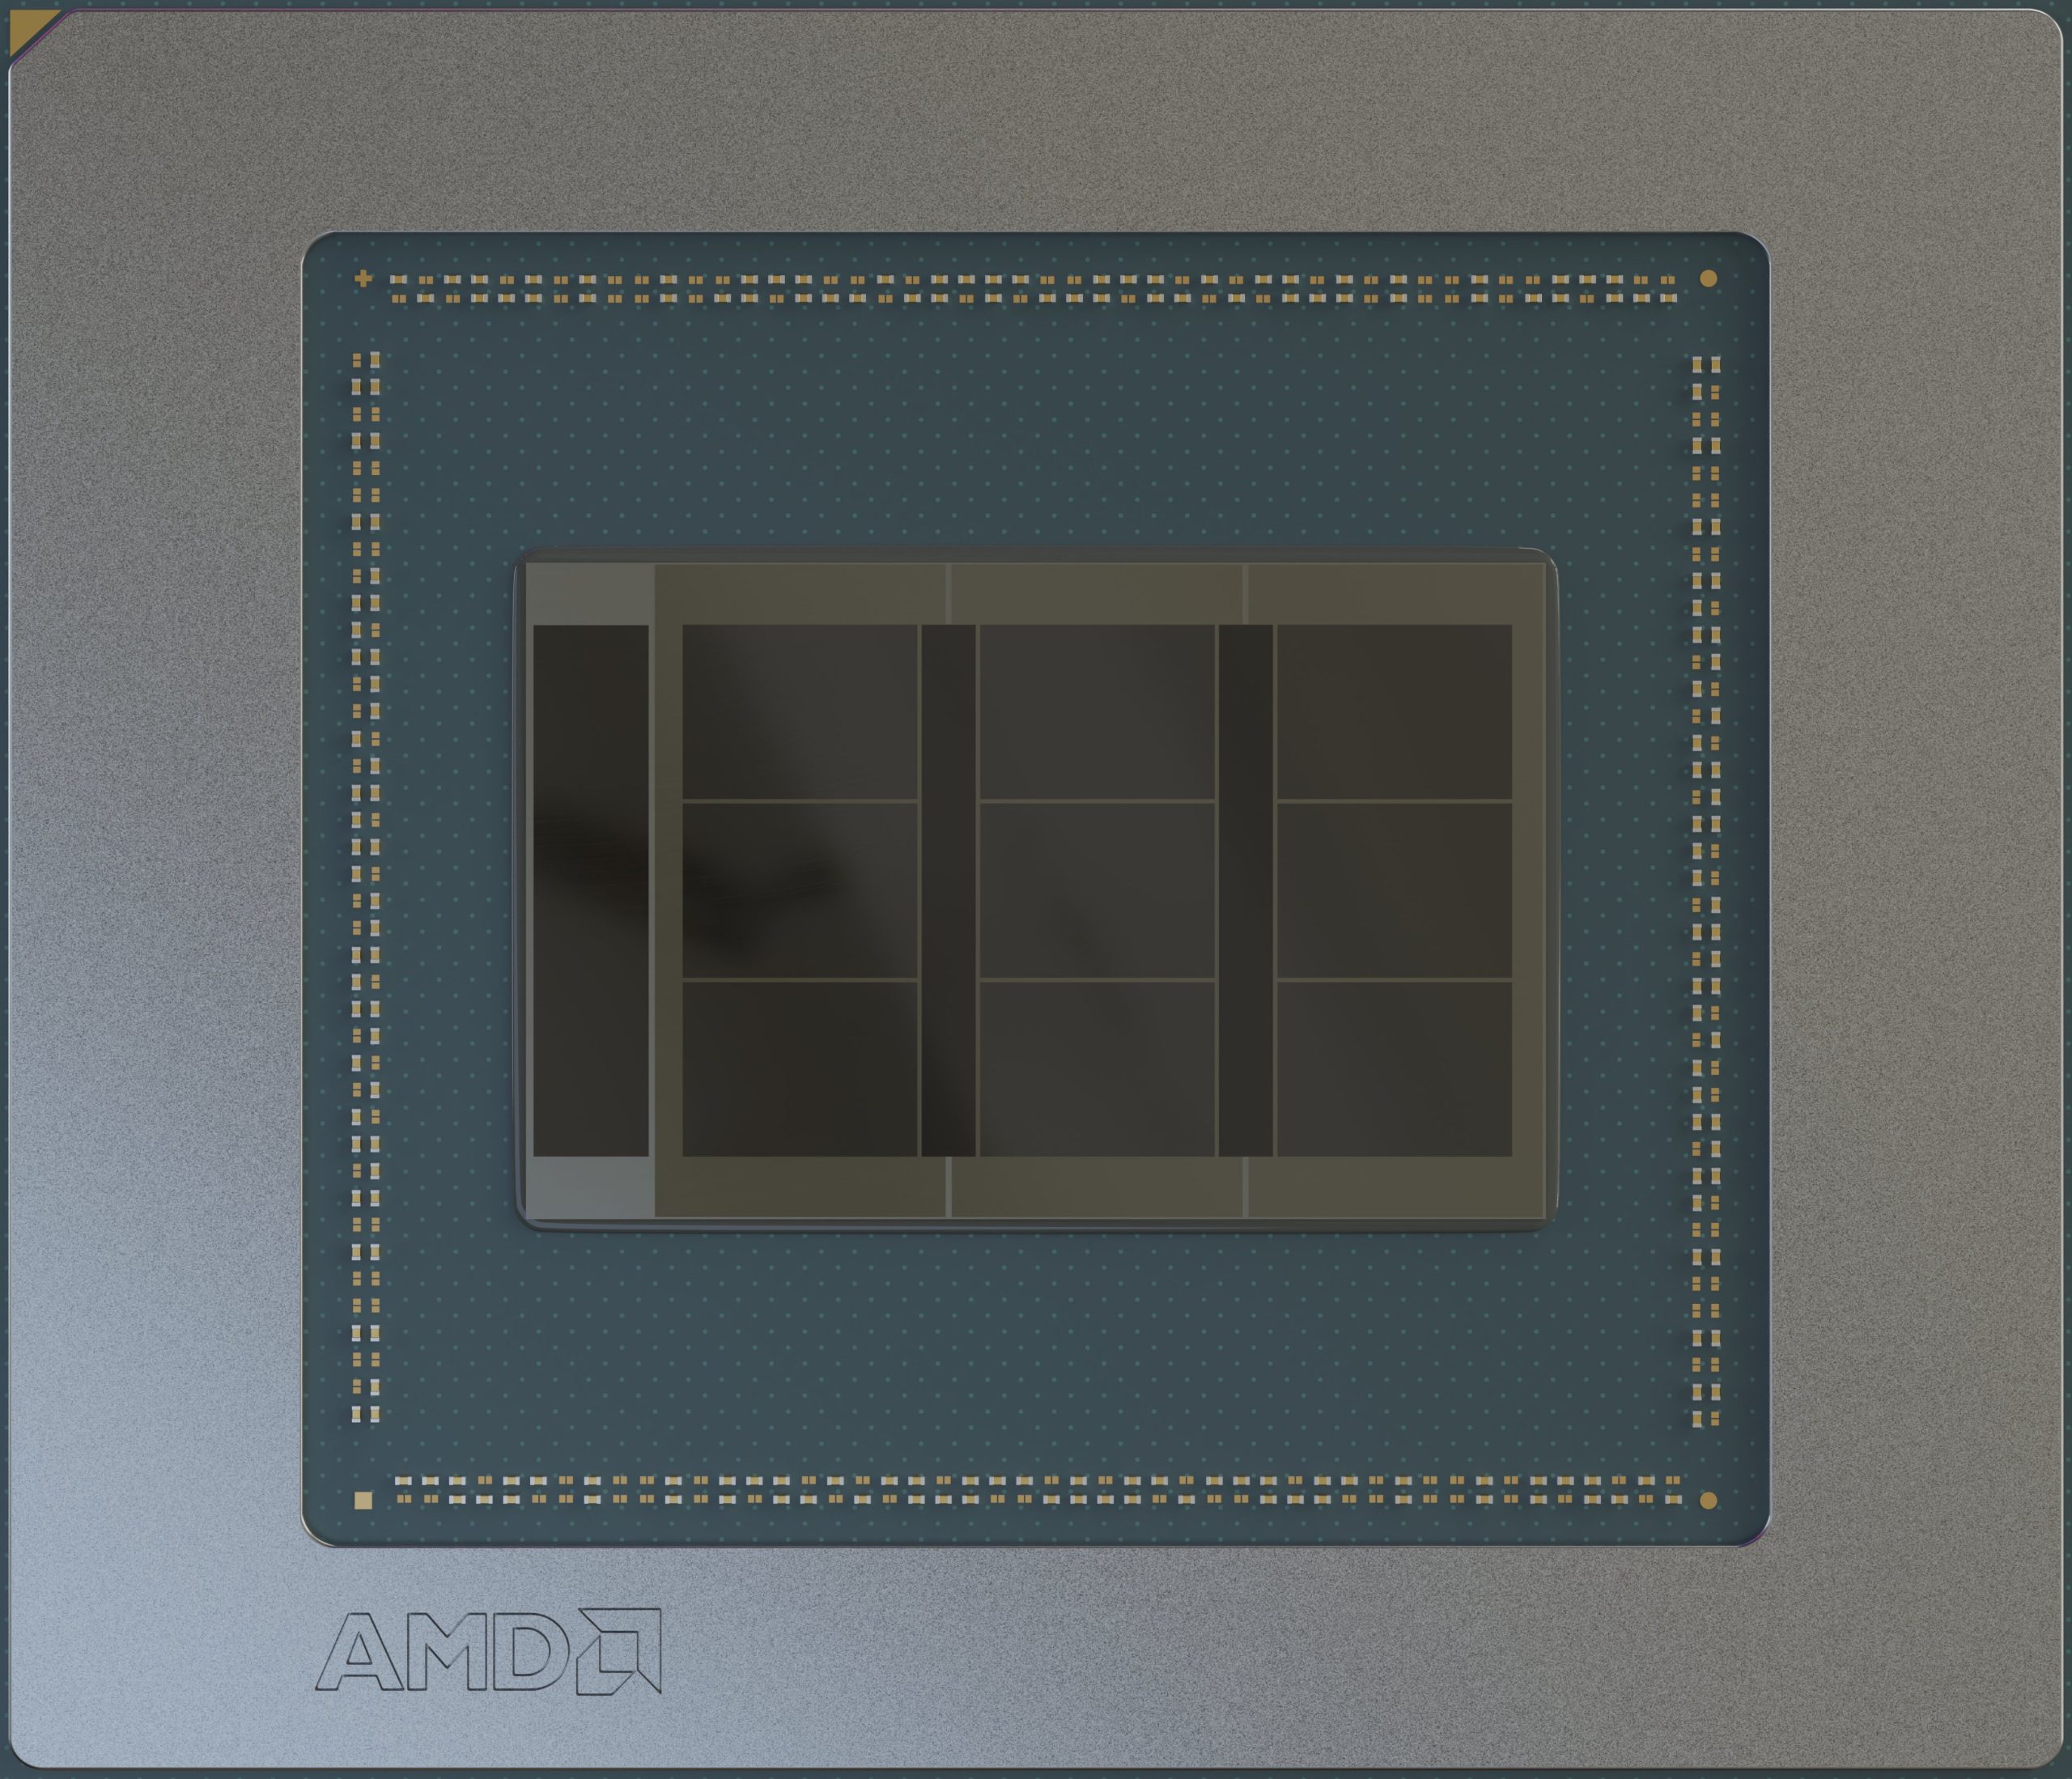
AMD's RDNA4 is a new generation of graphics cards featuring higher efficiency, improved performance and attractive prices. AMD promises a better gaming experience in combination with FSR4 in particular. But is this enough to give Nvidia some competition? Our review will unveil whether AMD was able to fulfill our expectations.
AMD Ryzen 7 9800X3D, Radeon RX 9070 XT, 1.3 kg