


AMD Radeon RX 7900 XTX and AMD Radeon RX 7900 XT Review: High-end RDNA 3 GPUs for 4K gaming that don't break the bank
AMD RDNA 3 architecture marks the use of a multi-chip module design for the first time in consumer GPUs, similar to what we have been seeing with Ryzen on the CPU side. The smaller dies seem to afford higher yields and reduced manufacturing costs, which are being passed on to the consumer. In this review, we take the new Radeon RX 7900 XTX and RX 7900 XT for a spin and see if they are indeed capable of taking on Nvidia's Ada juggernaut at more reasonable price points.
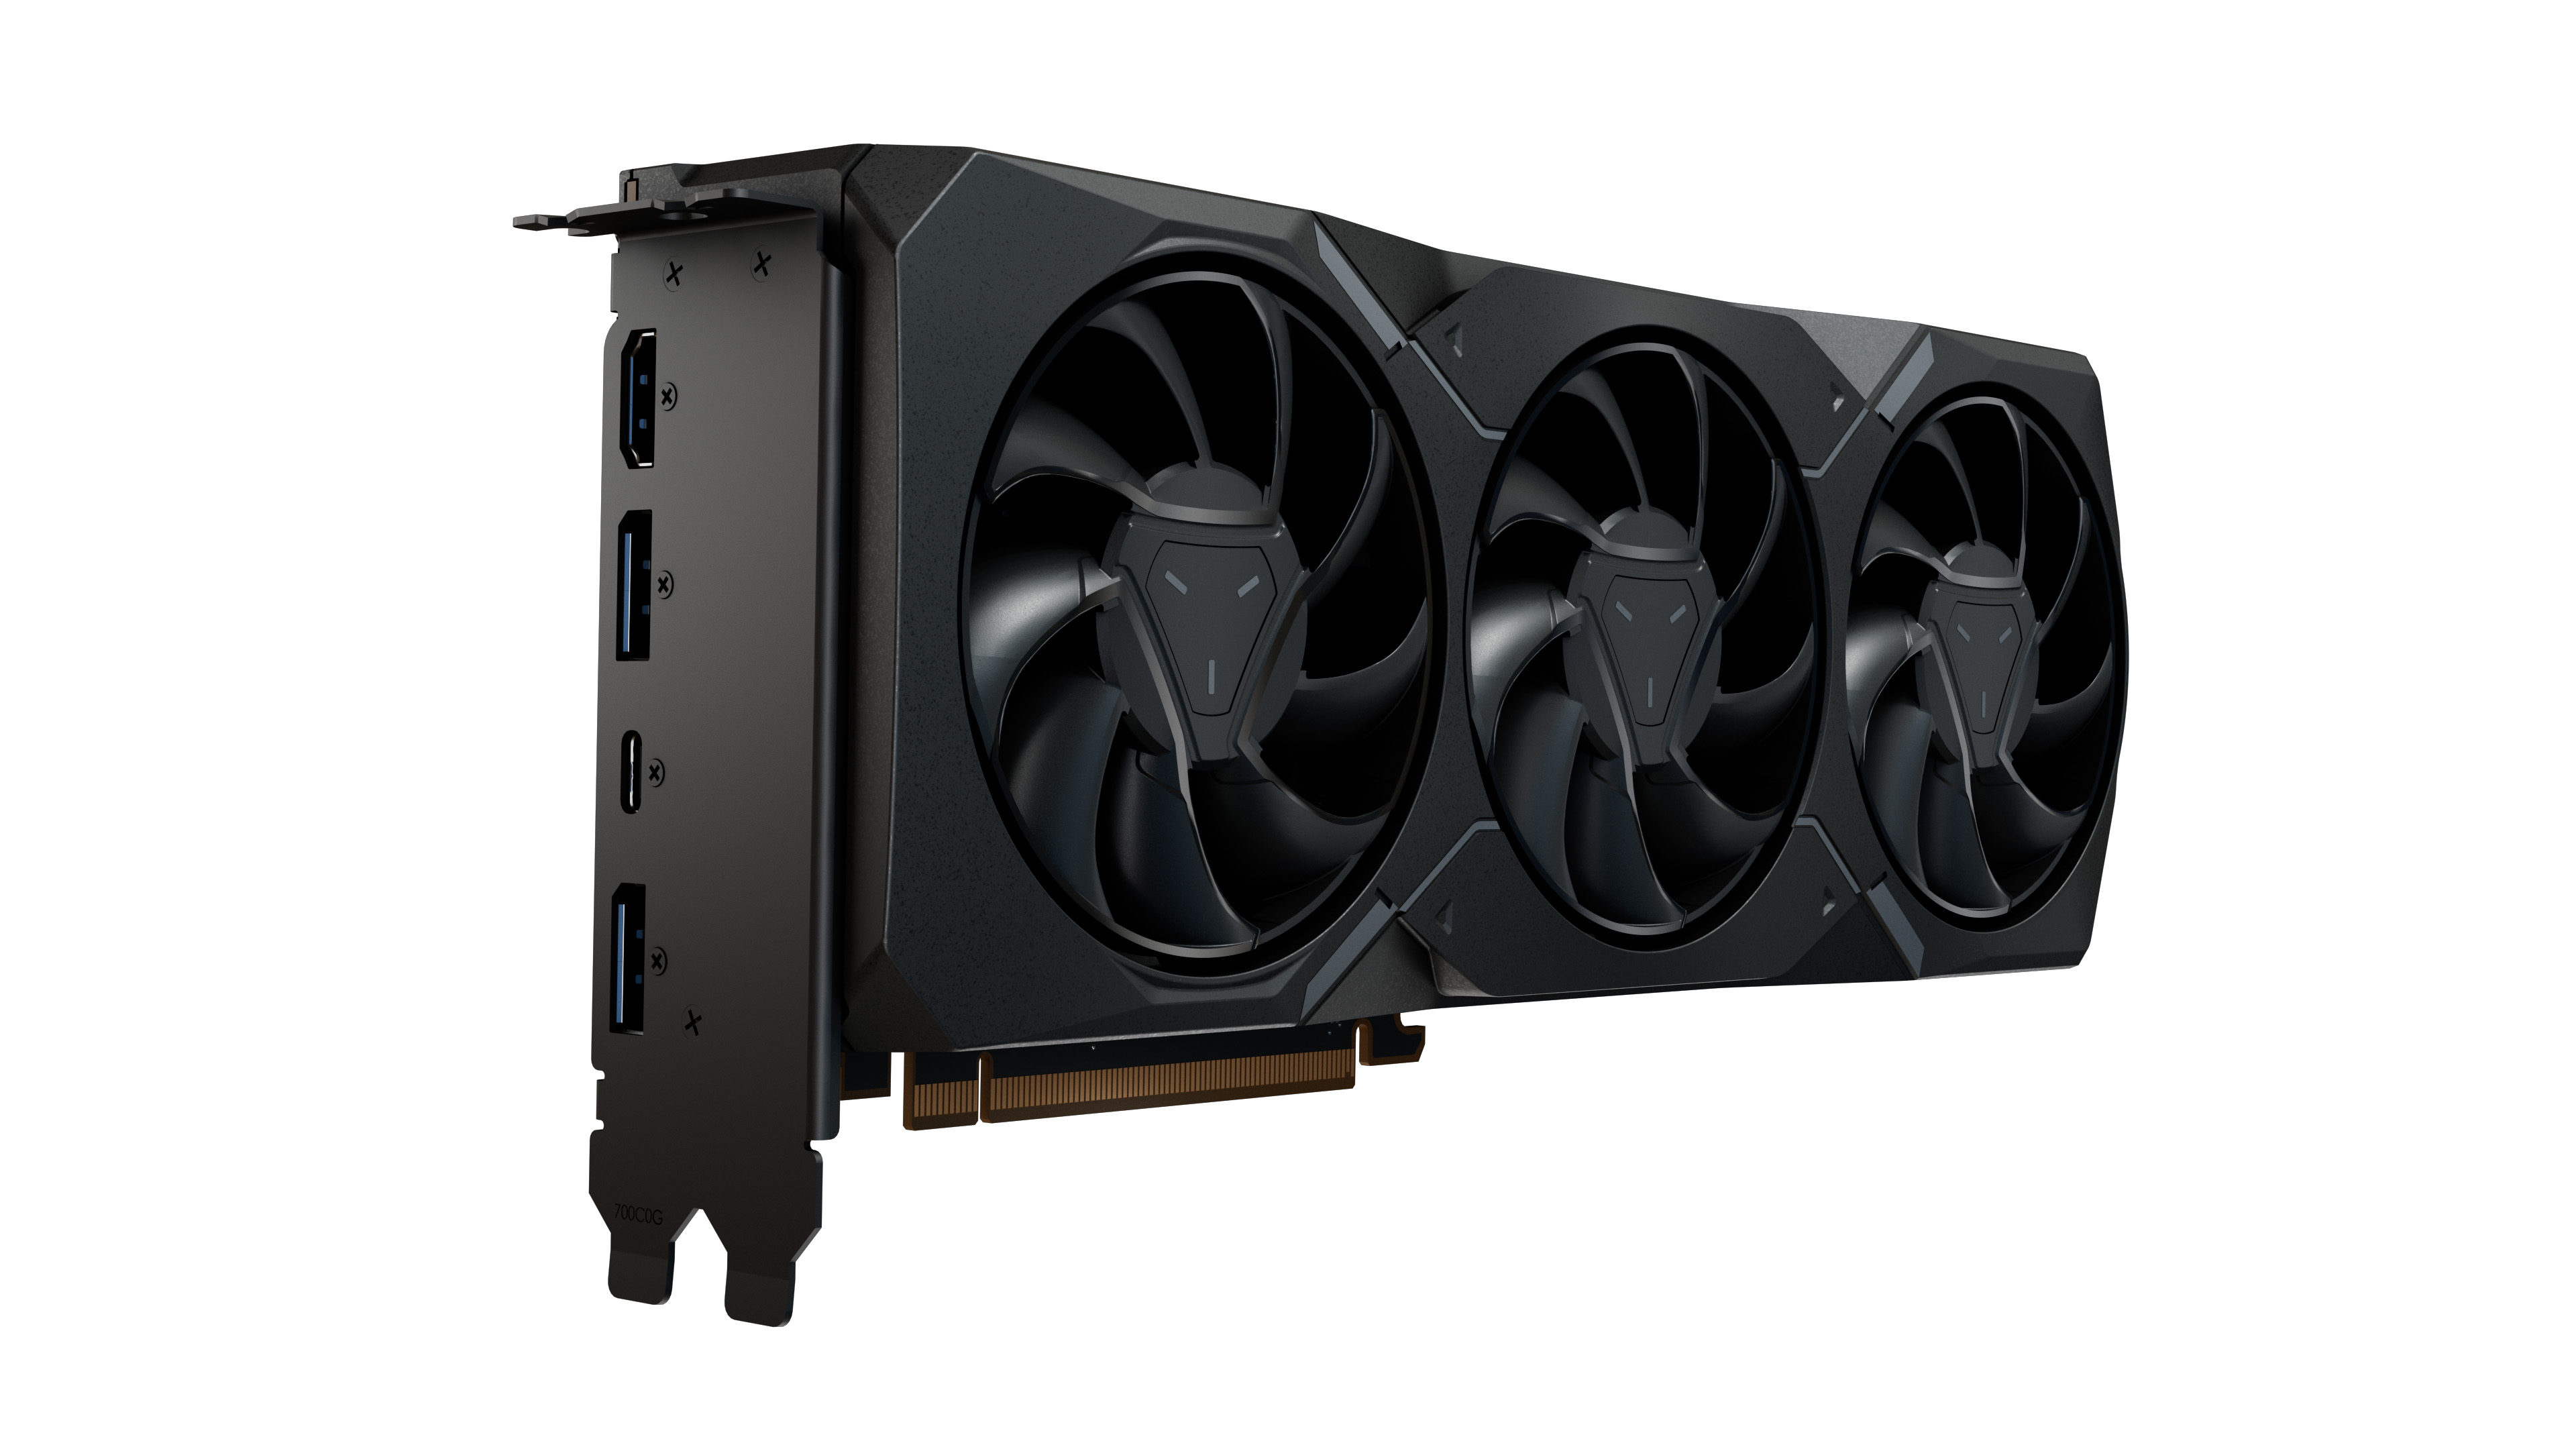
AMD Ryzen 9 7950X, Radeon RX 7900 XT