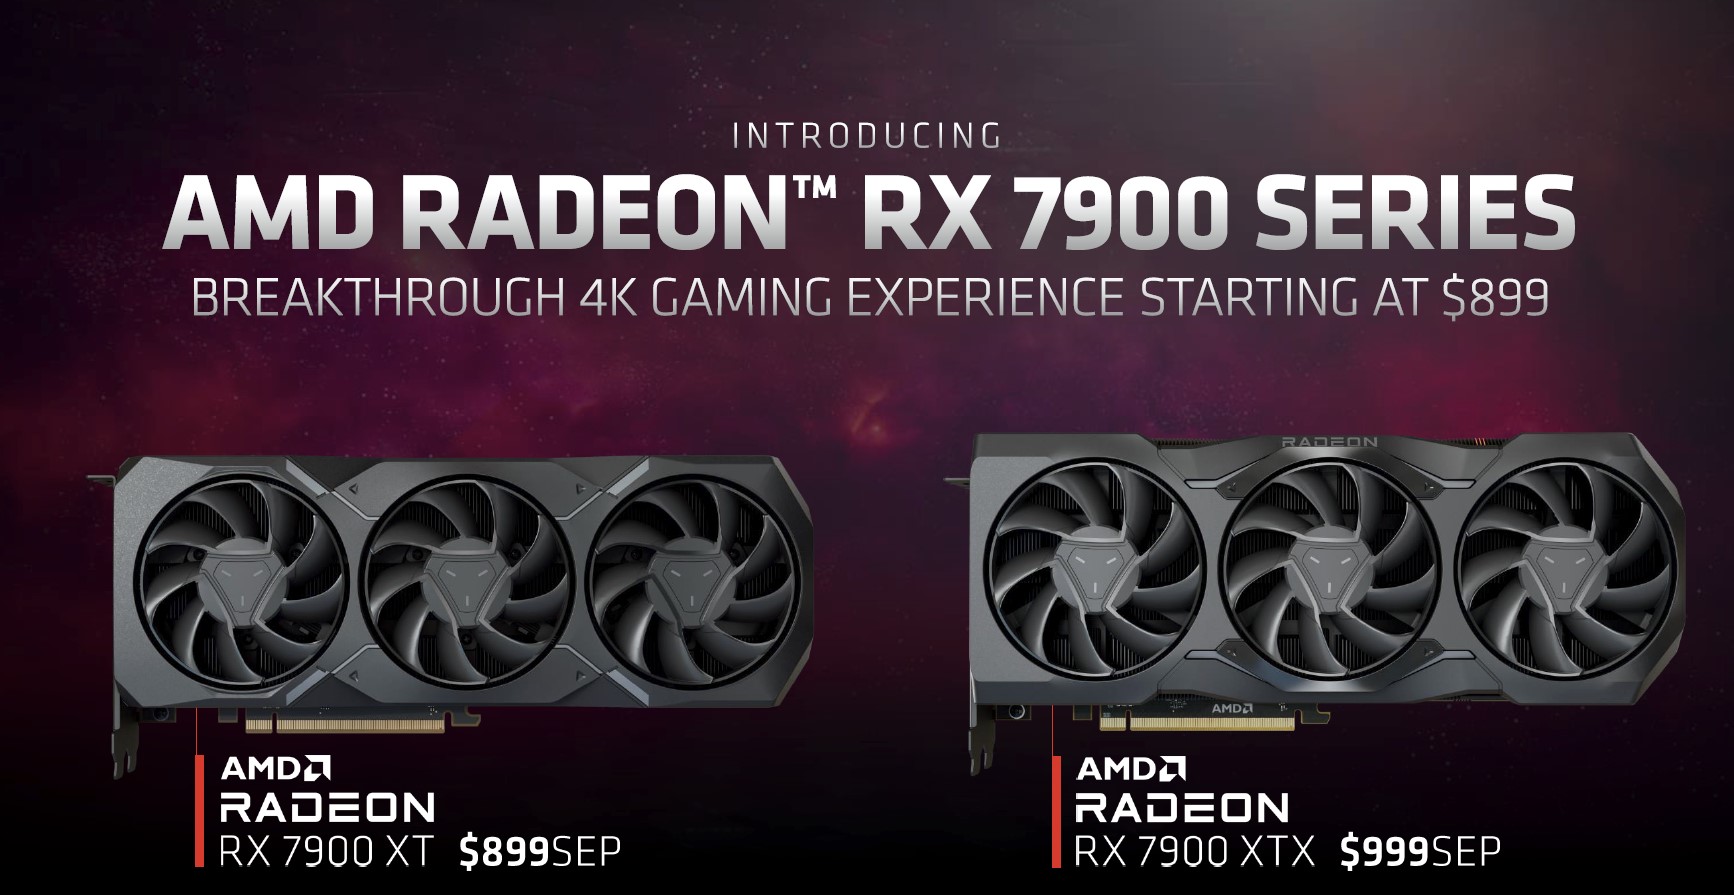
AMD Radeon RX 7900 XTX and AMD Radeon RX 7900 XT Review: High-end RDNA 3 GPUs for 4K gaming that don't break the bank
Update 12/15: Added more ray tracing comparisons and fan noise level measurements.

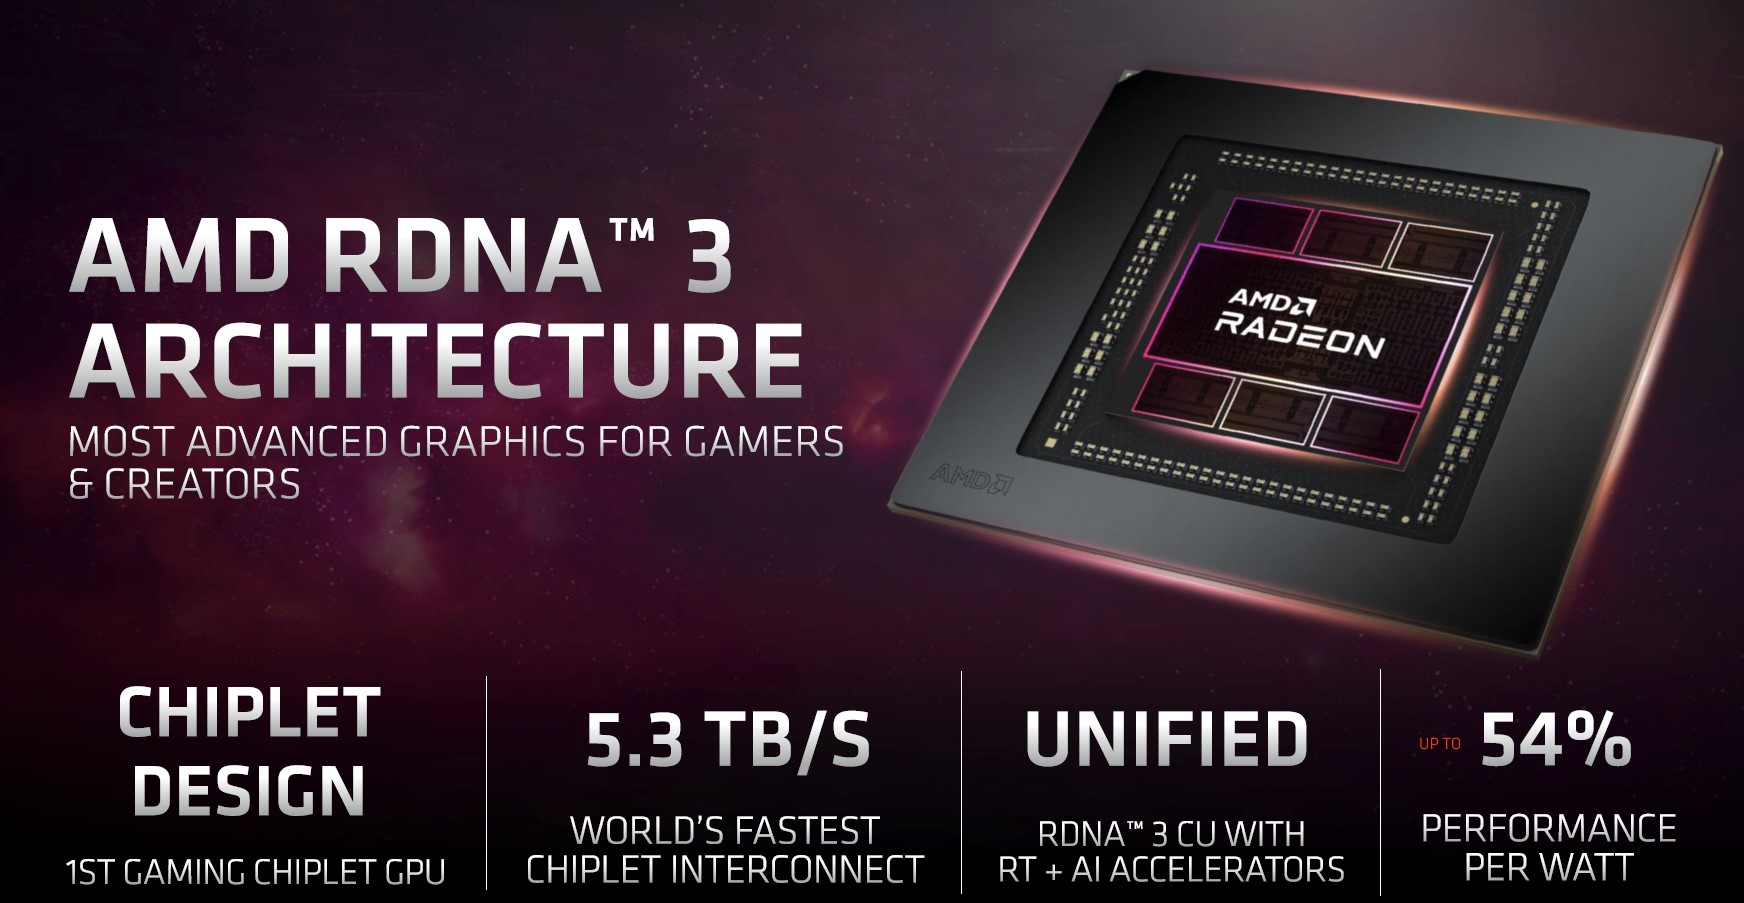
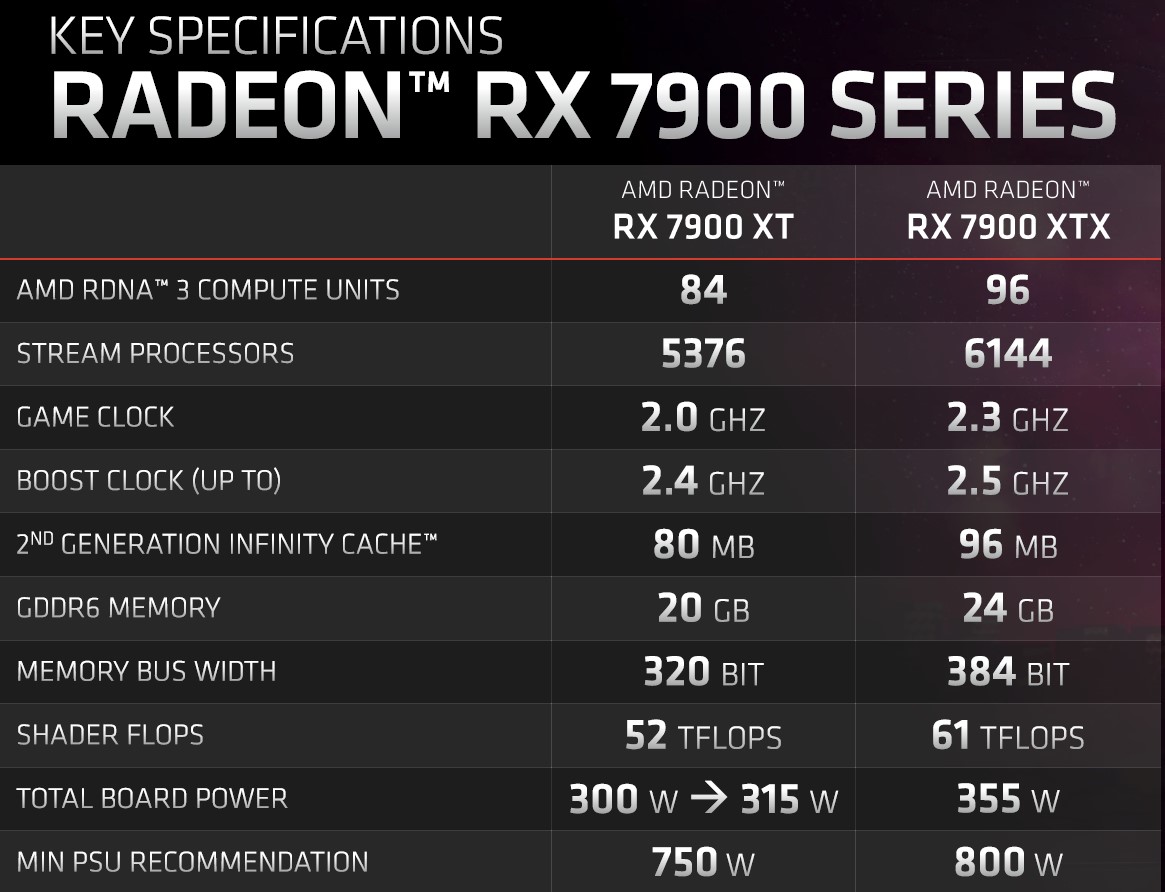
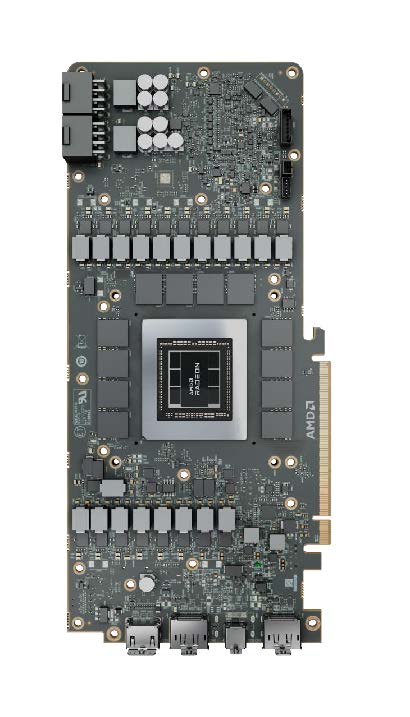
The new Navi 31 GPUs — the Radeon RX 7900 XTX and the Radeon RX 7900 XT — are based on AMD's latest RDNA 3 architecture. The Radeon RX 7900 XTX uses the full graphics Navi 31 chip configuration, which results in a total of 6,144 stream processors (SPs). The smaller RX 7900 XT is no slouch with 5,376 SPs under the hood.
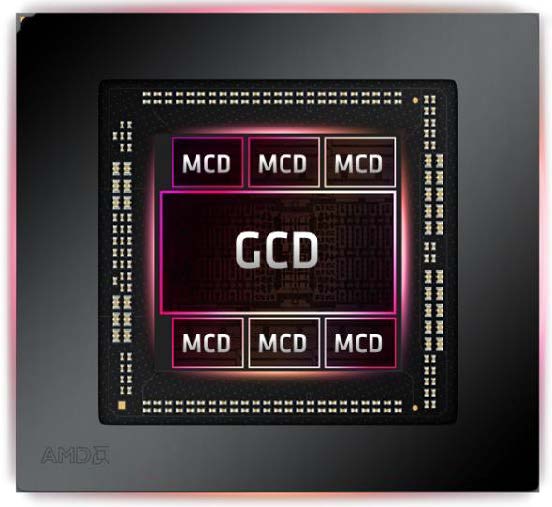
Compared to RDNA 2, the RDNA 3 architecture has undergone a complete revision. The new multi-chip module (MCM) package now combines six memory cache dies (MCDs) and a graphics compute die (GCD) in the RX 7900 XTX. The manufacturing process has now shifted to a smaller node compared to RDNA 2, but this does not result in any significant changes in the clock rates.
In addition to the revamped ray tracing units, which now include up to 96 ray accelerators, there are also 192 AI units. However, these do not yet match up to the raw performance afforded by Nvidia's tensor cores. AMD is very generous when it comes to VRAM capacities and equips the top model with 24 GB of GDDR6 memory. This is mostly on par with the Nvidia GeForce RTX 4090. The RX 7900 XT makes do with 20 GB GDDR6 but is at a slight advantage compared to the Nvidia GeForce RTX 4080, as the second-fastest Ada GPU only offers 16 GB of VRAM.
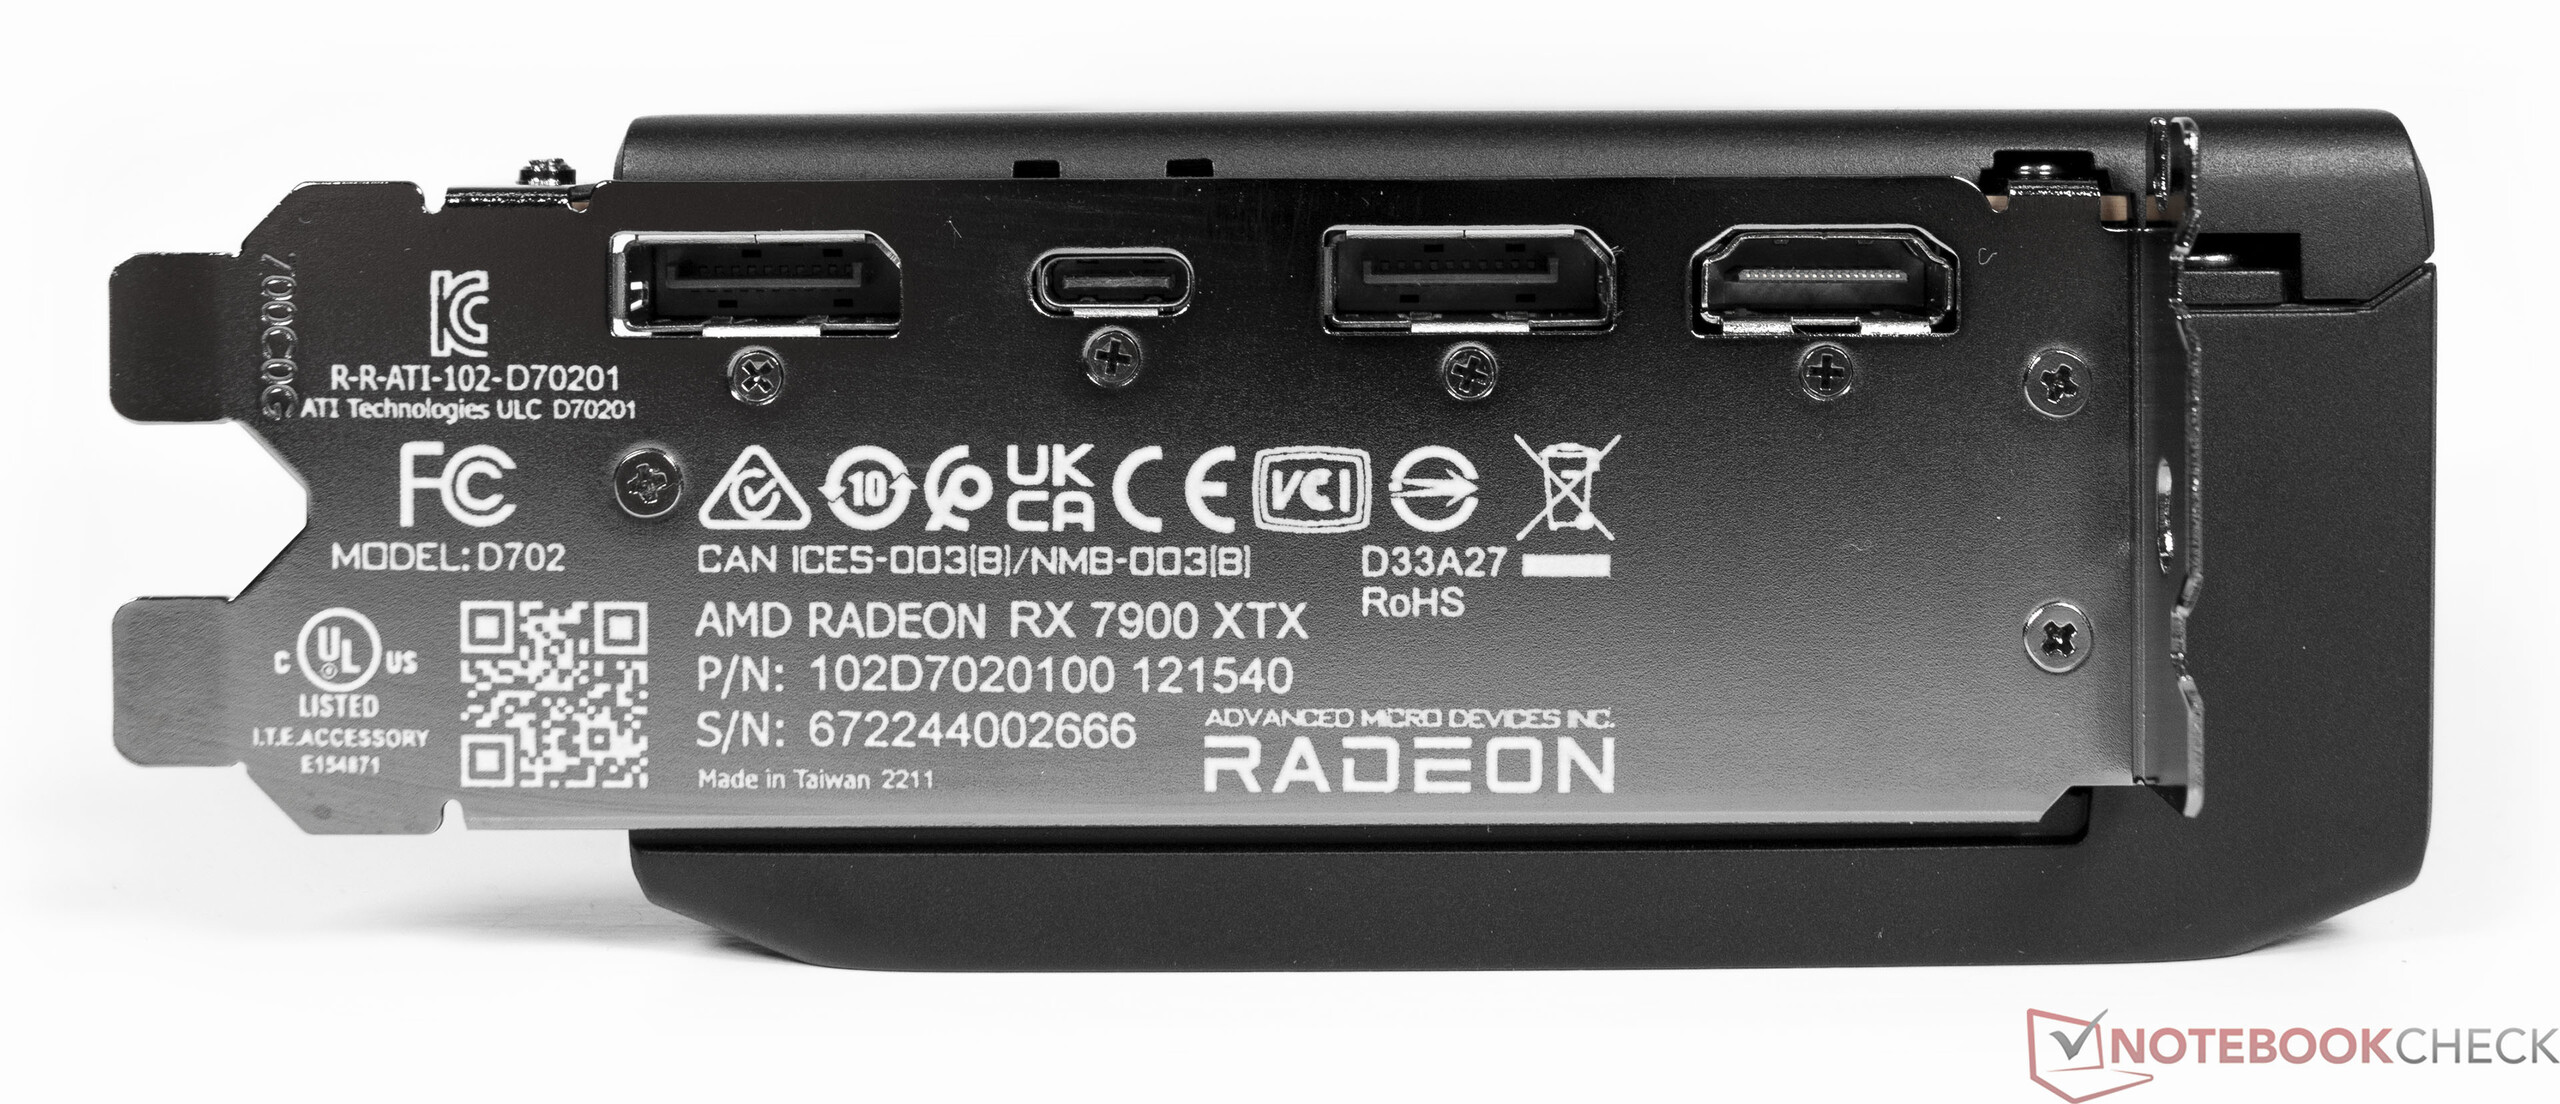
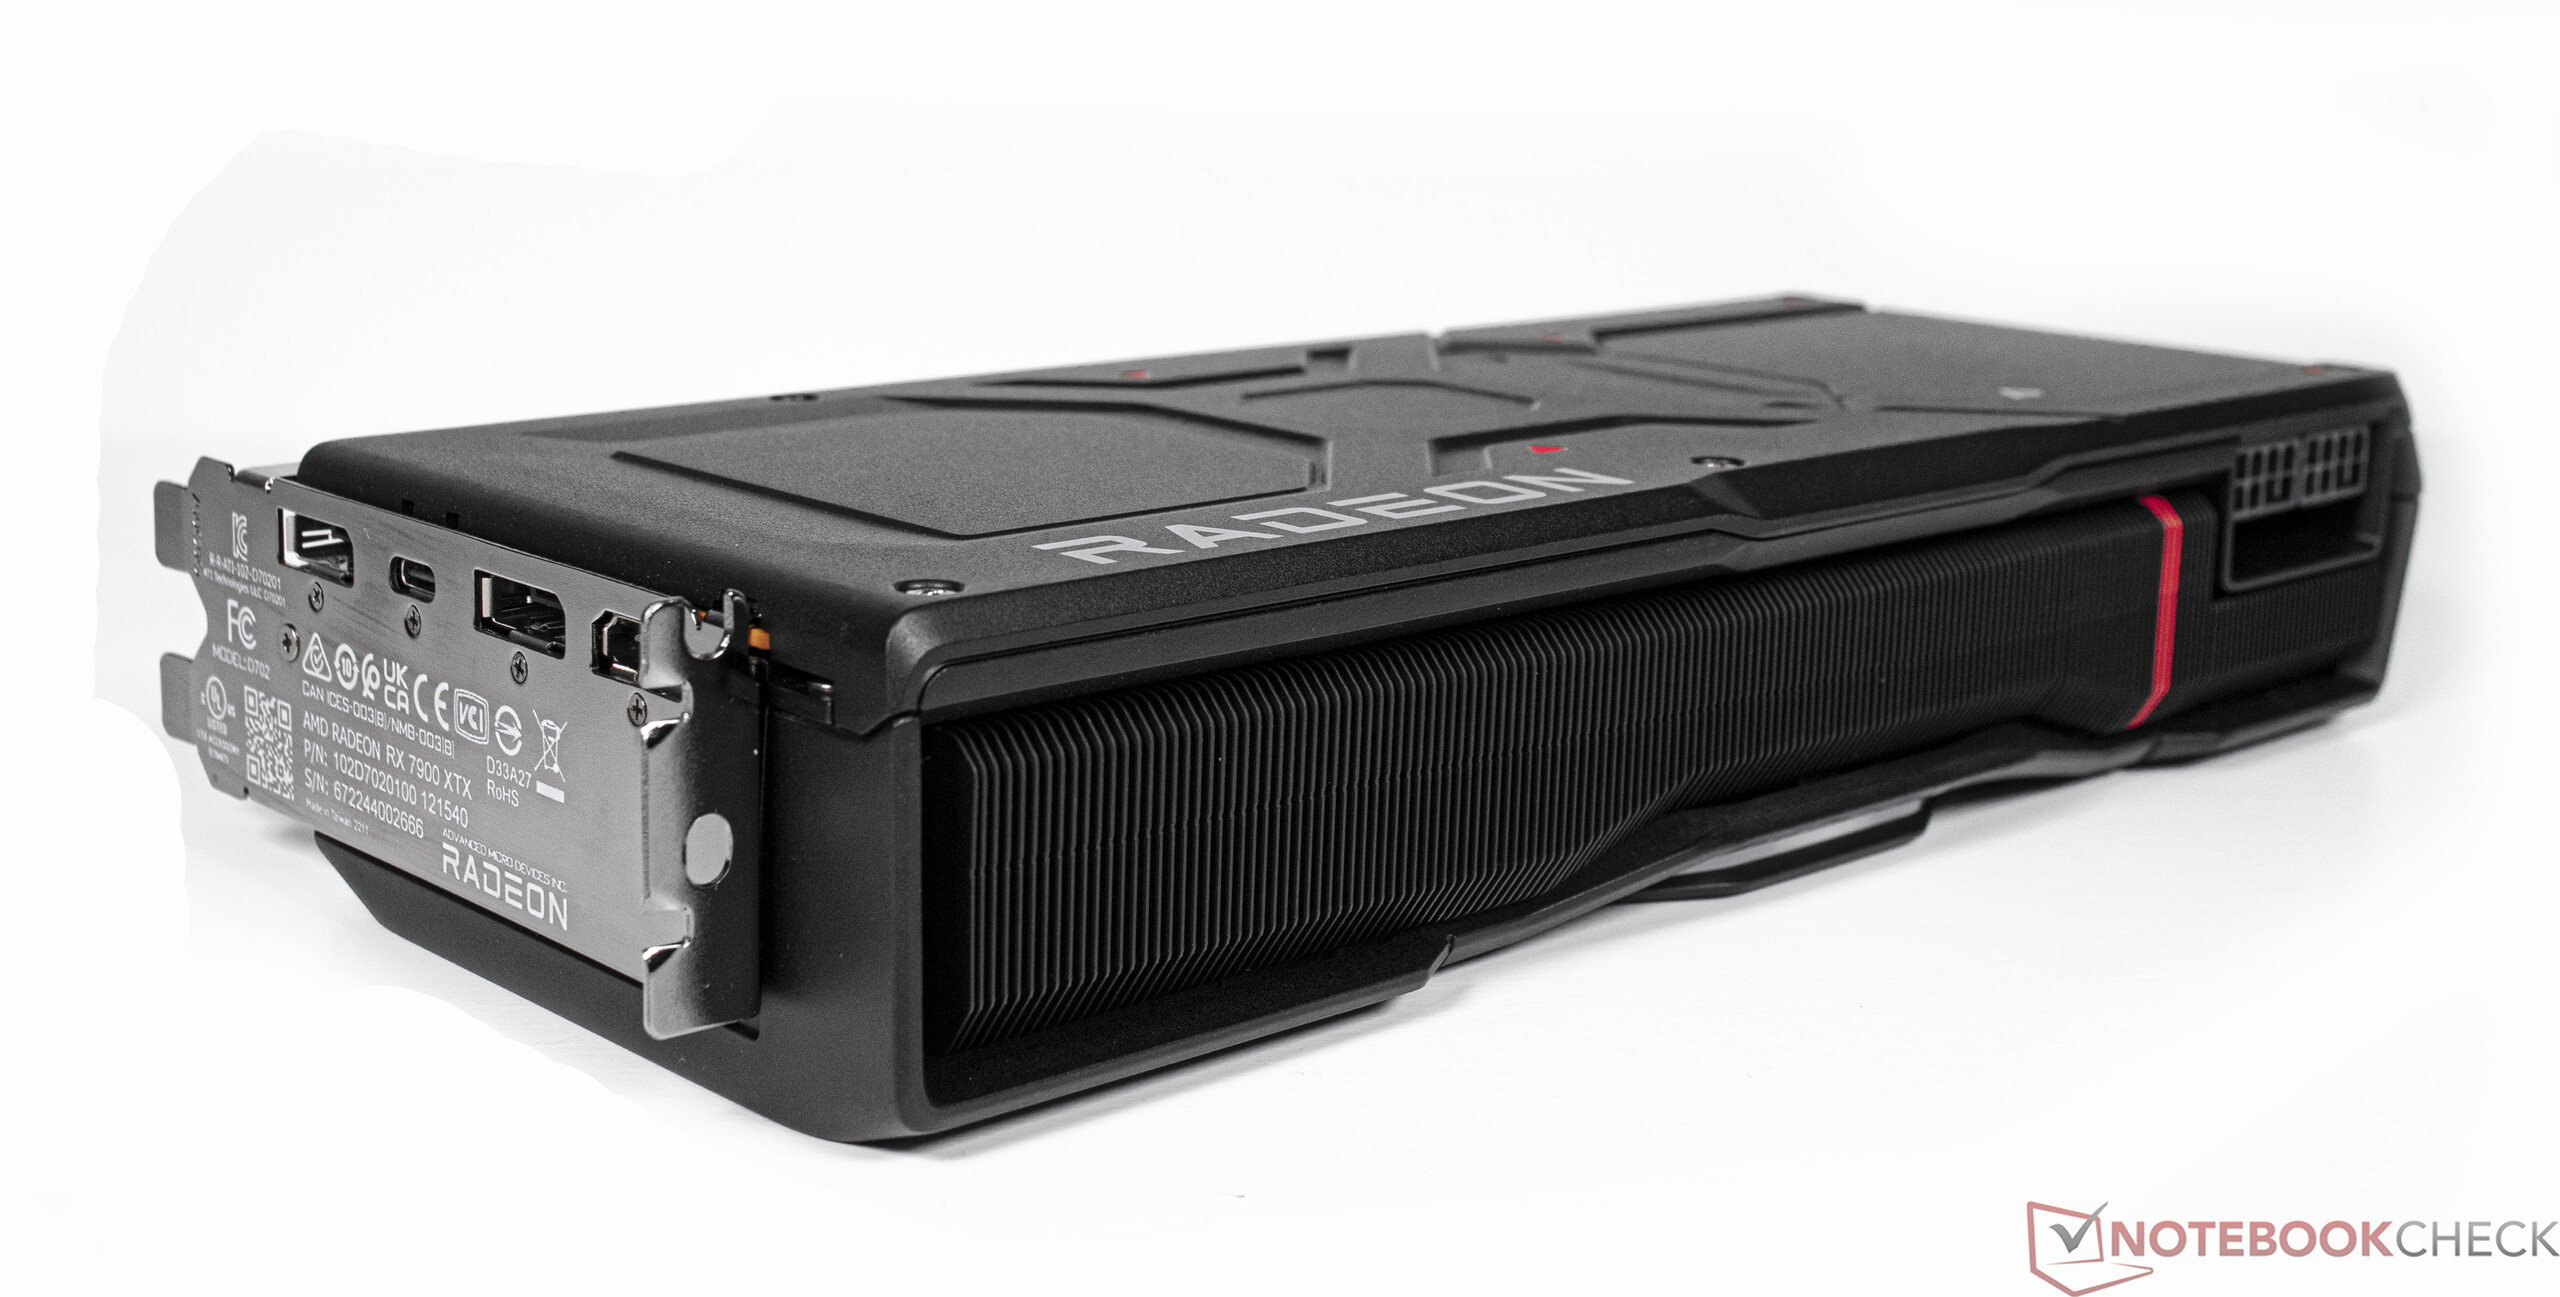
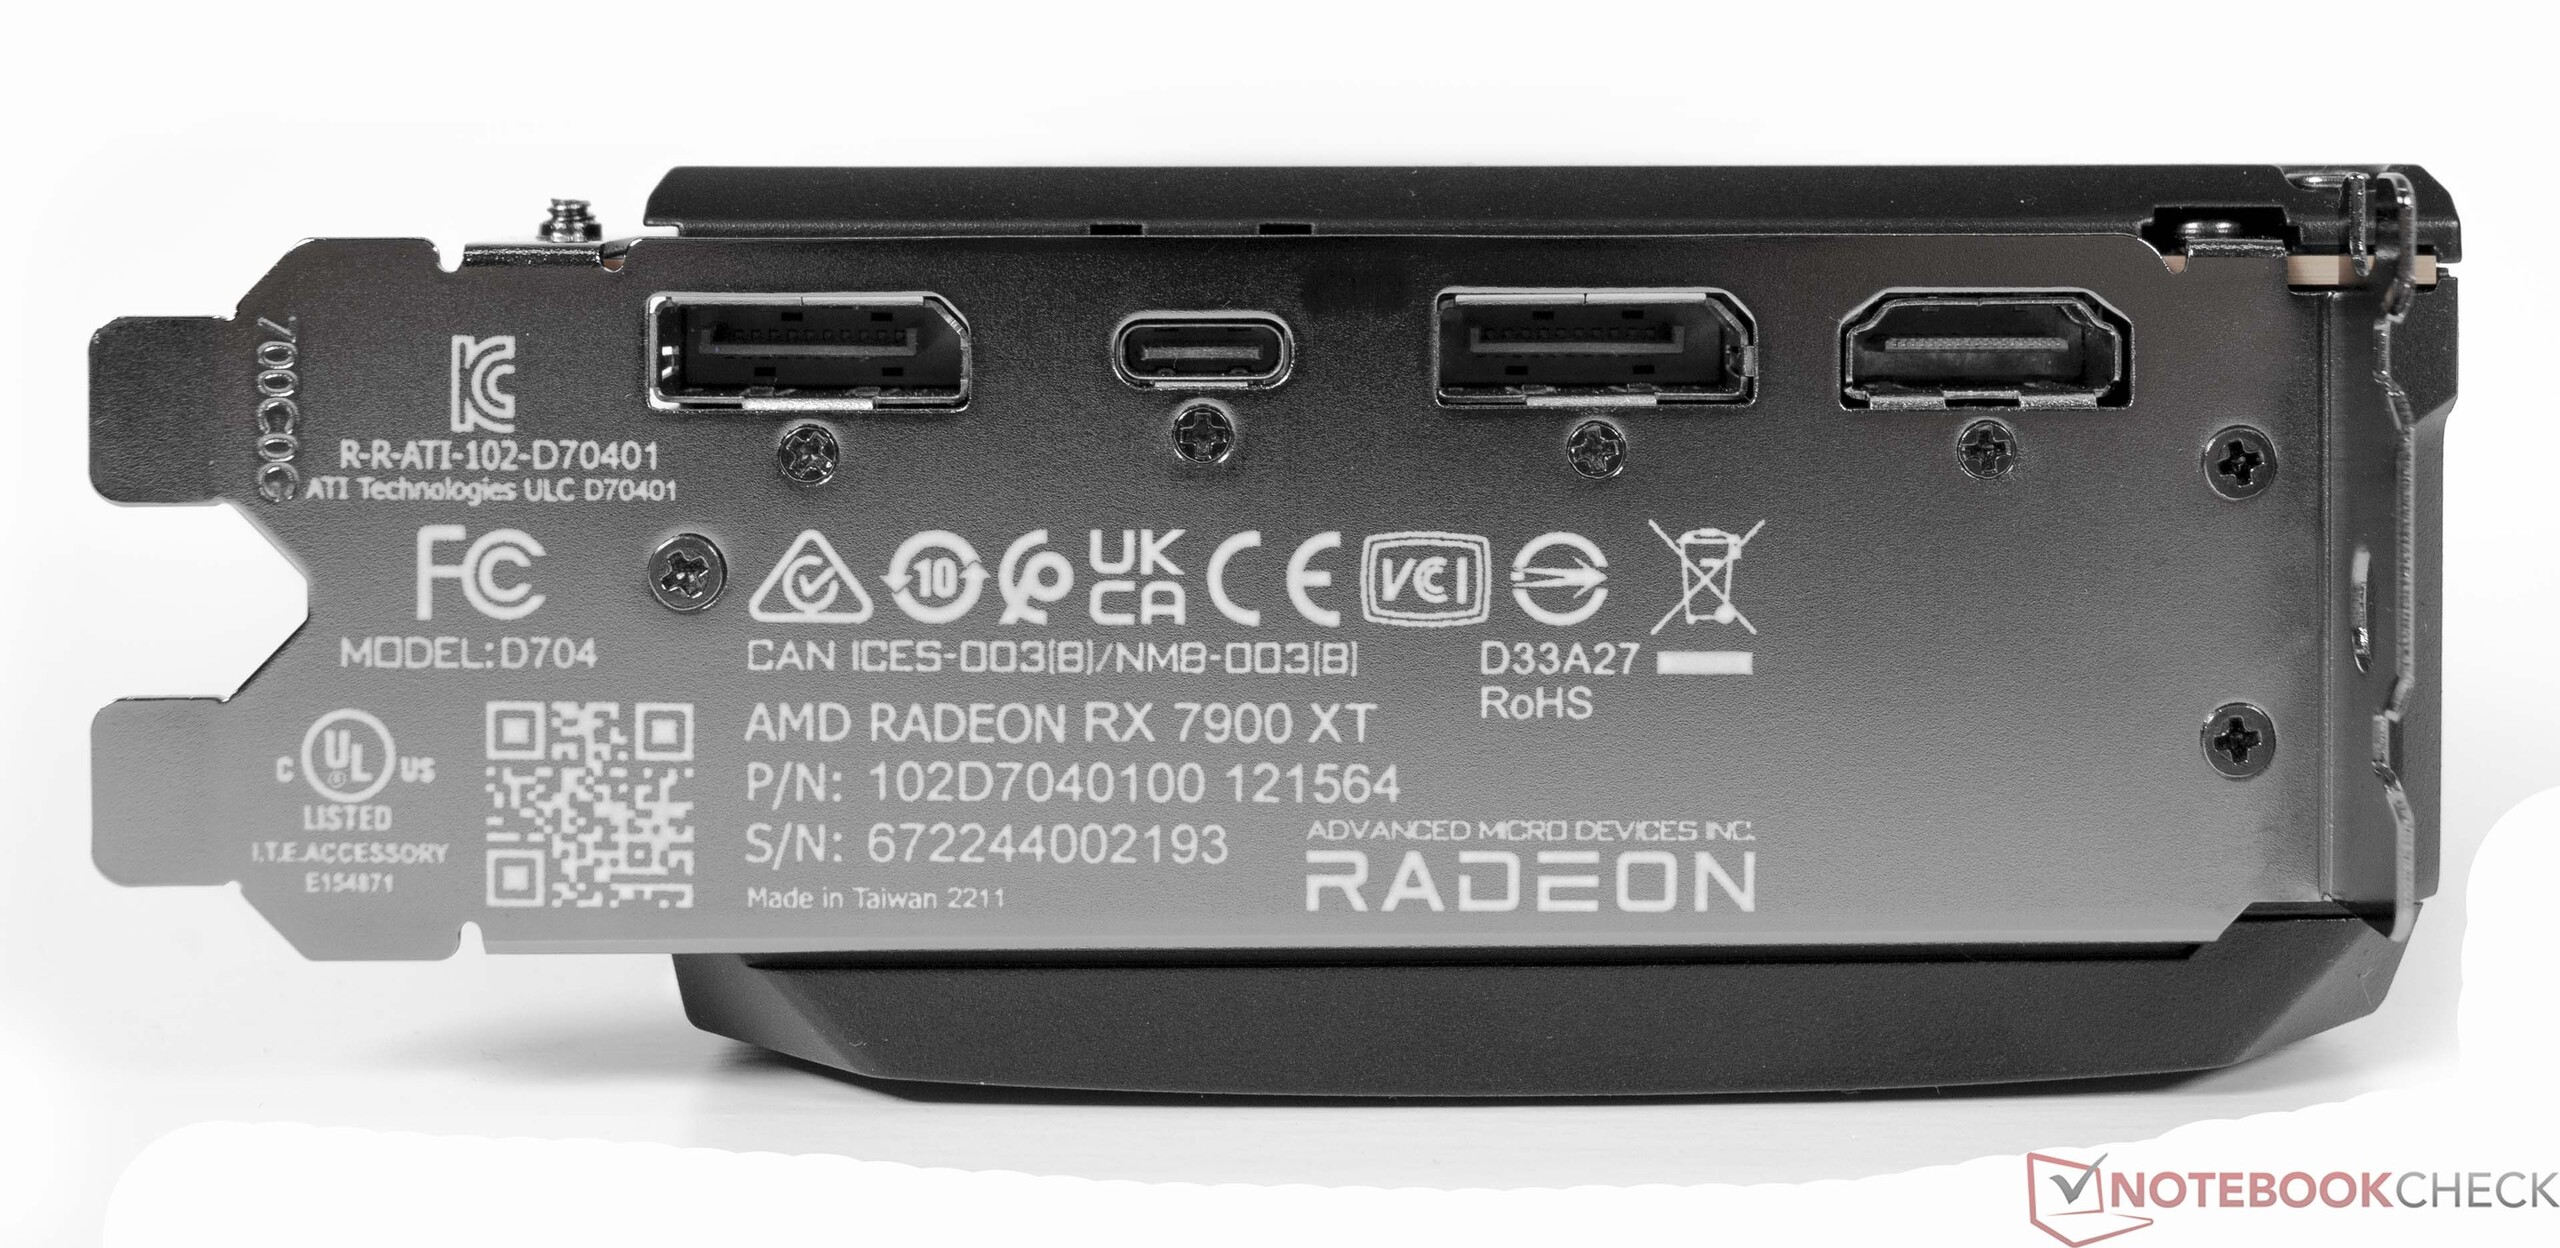
The media engine has also been revised and AV1 is supported on the hardware side for both encoding and decoding. AMD embraces the latest DisplayPort 2.1 connectivity standard, which Nvidia has omitted from its RTX 4000 models. In total, up to four displays can be operated simultaneously on the Radeon RX 7900 XTX and the Radeon RX 7900 XT.
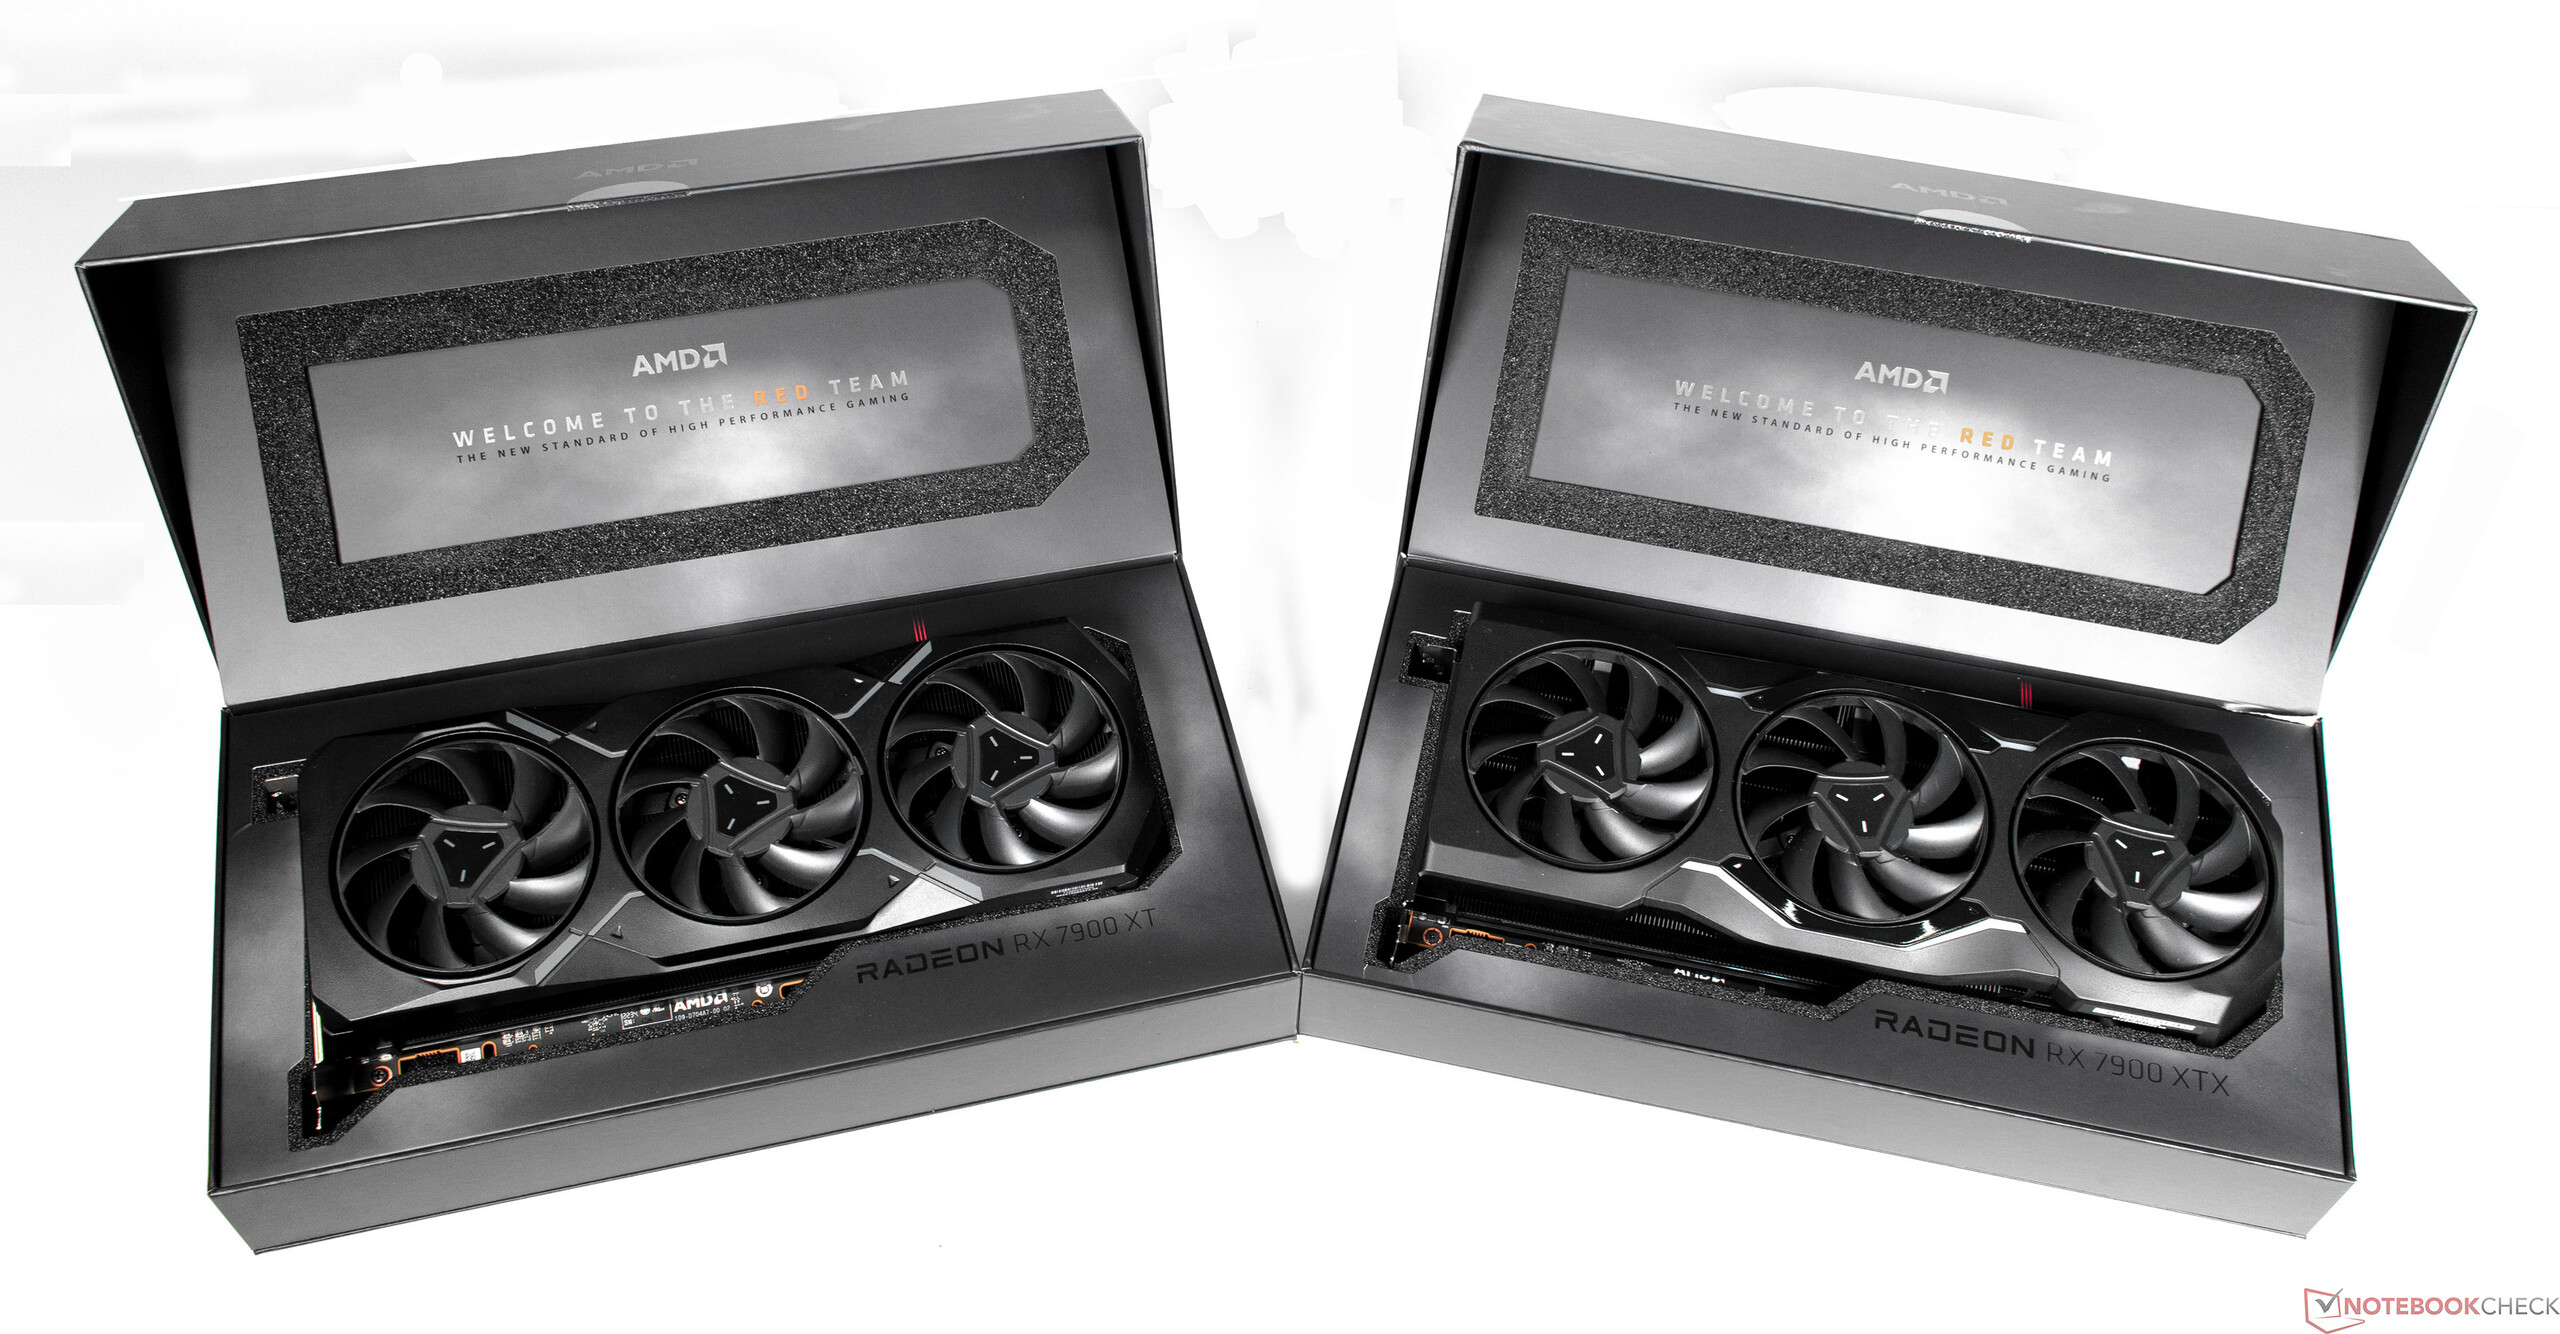
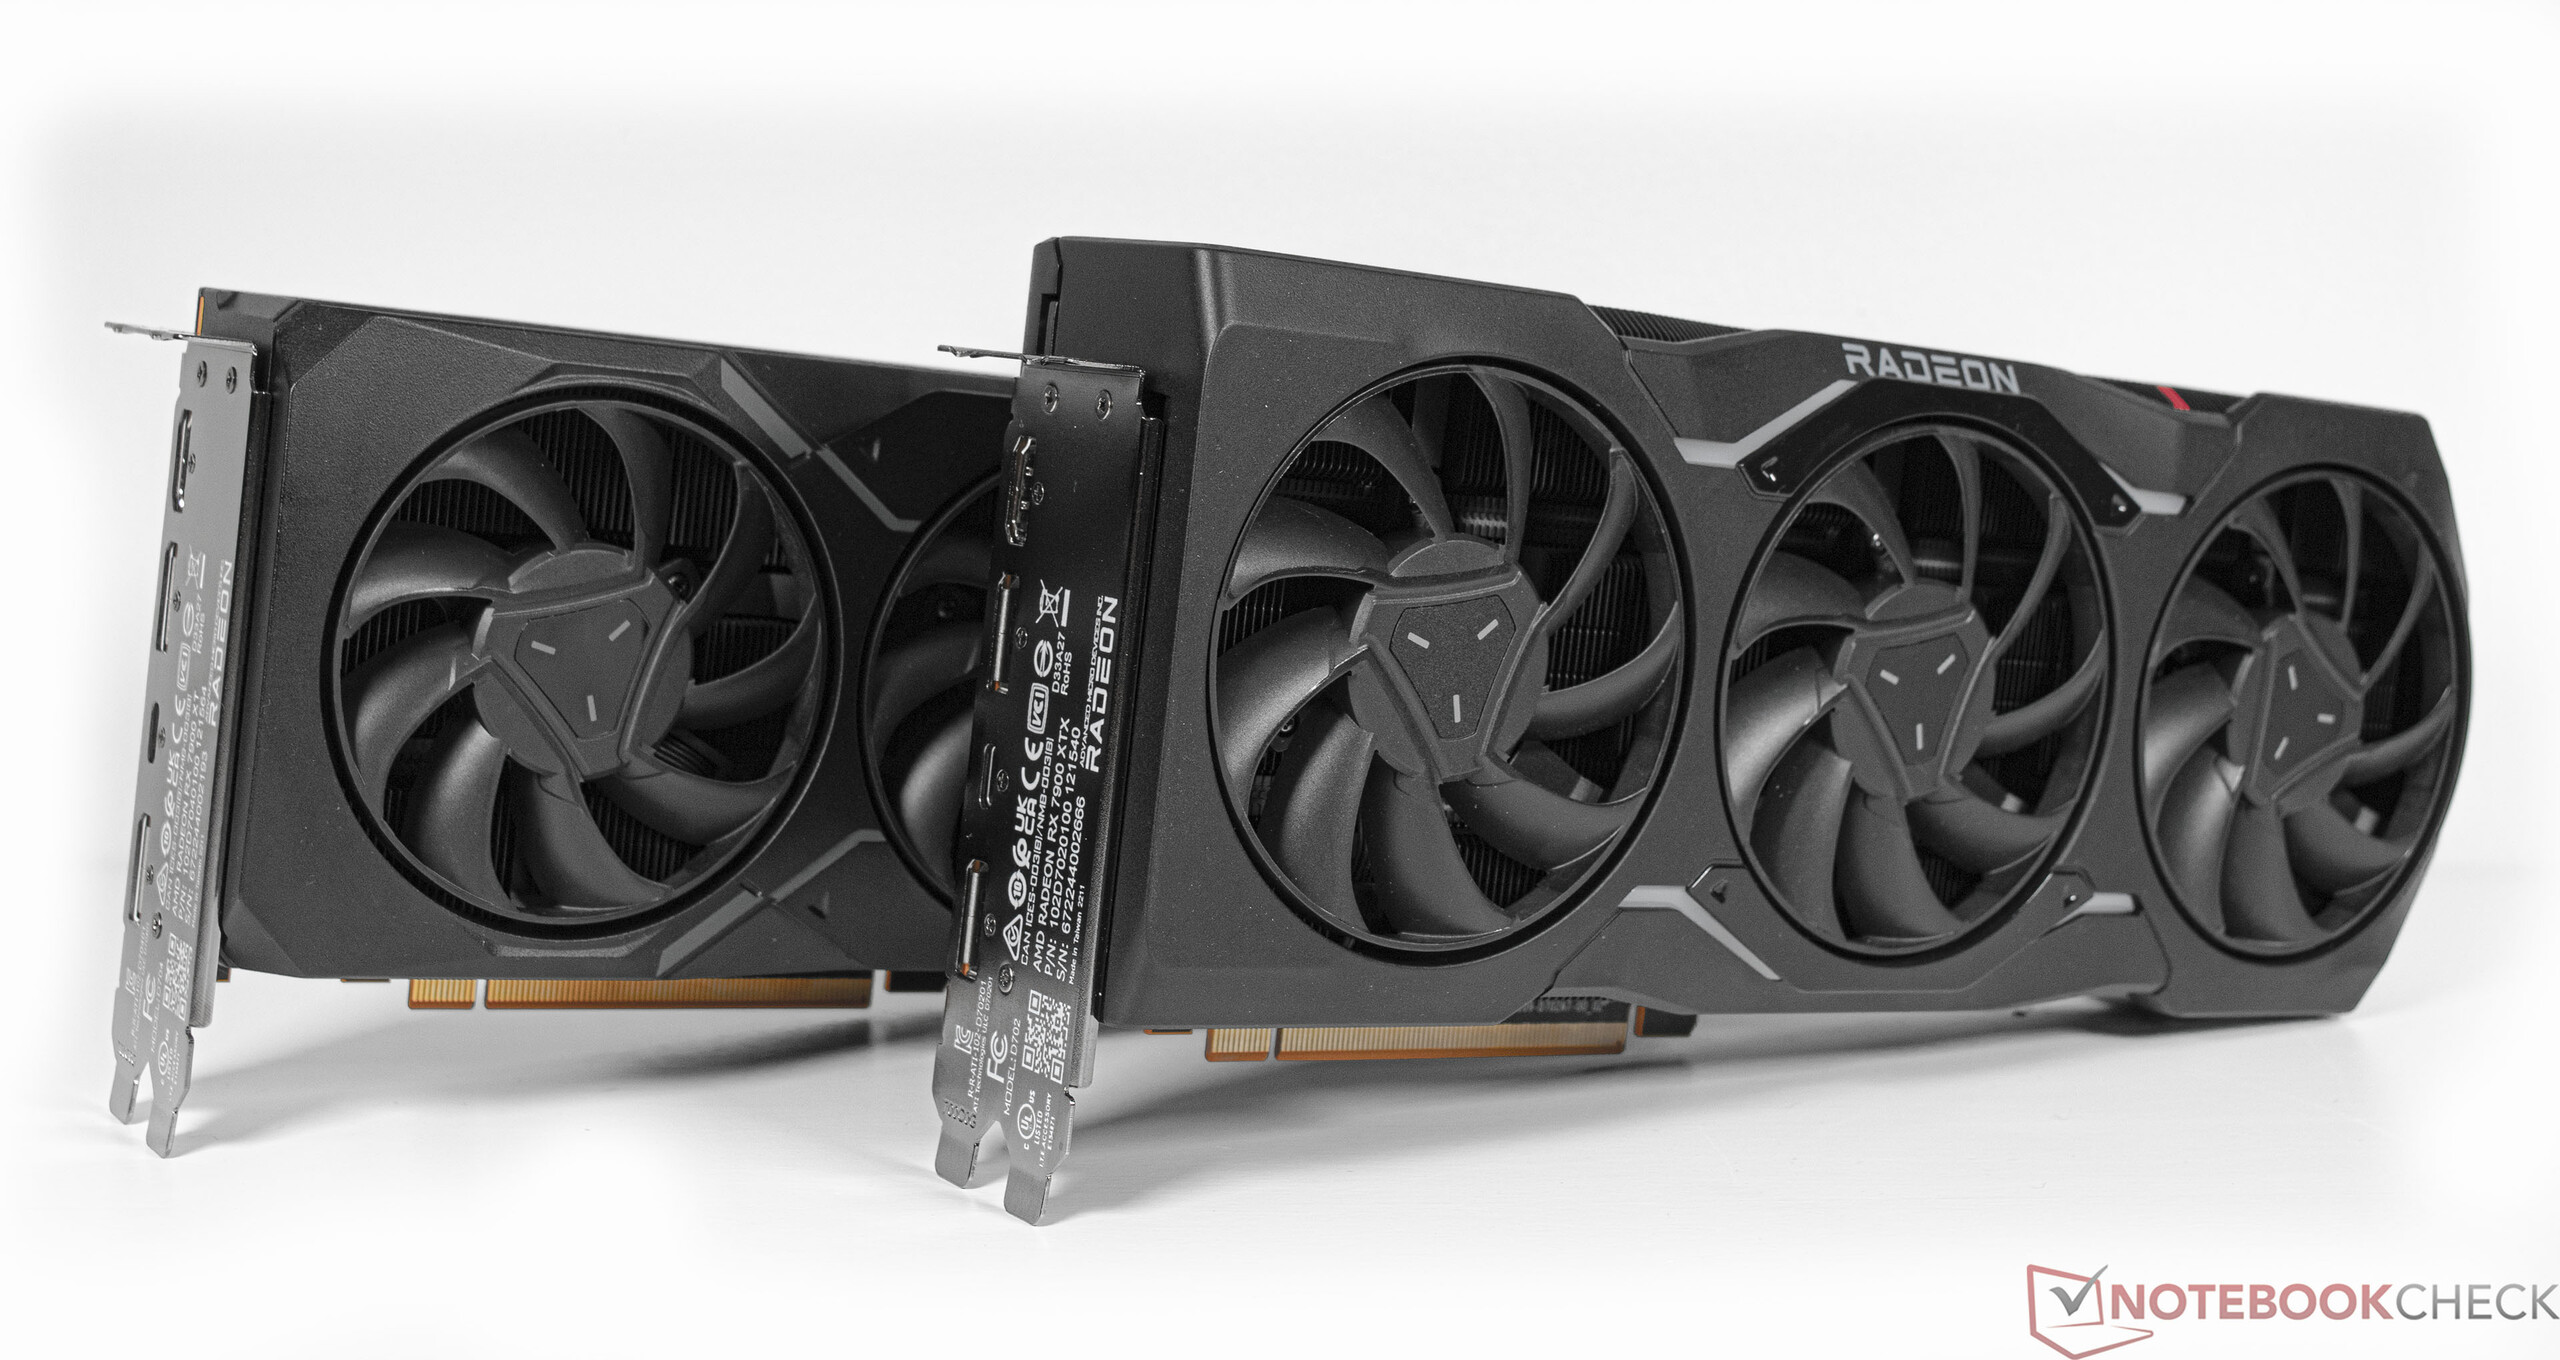
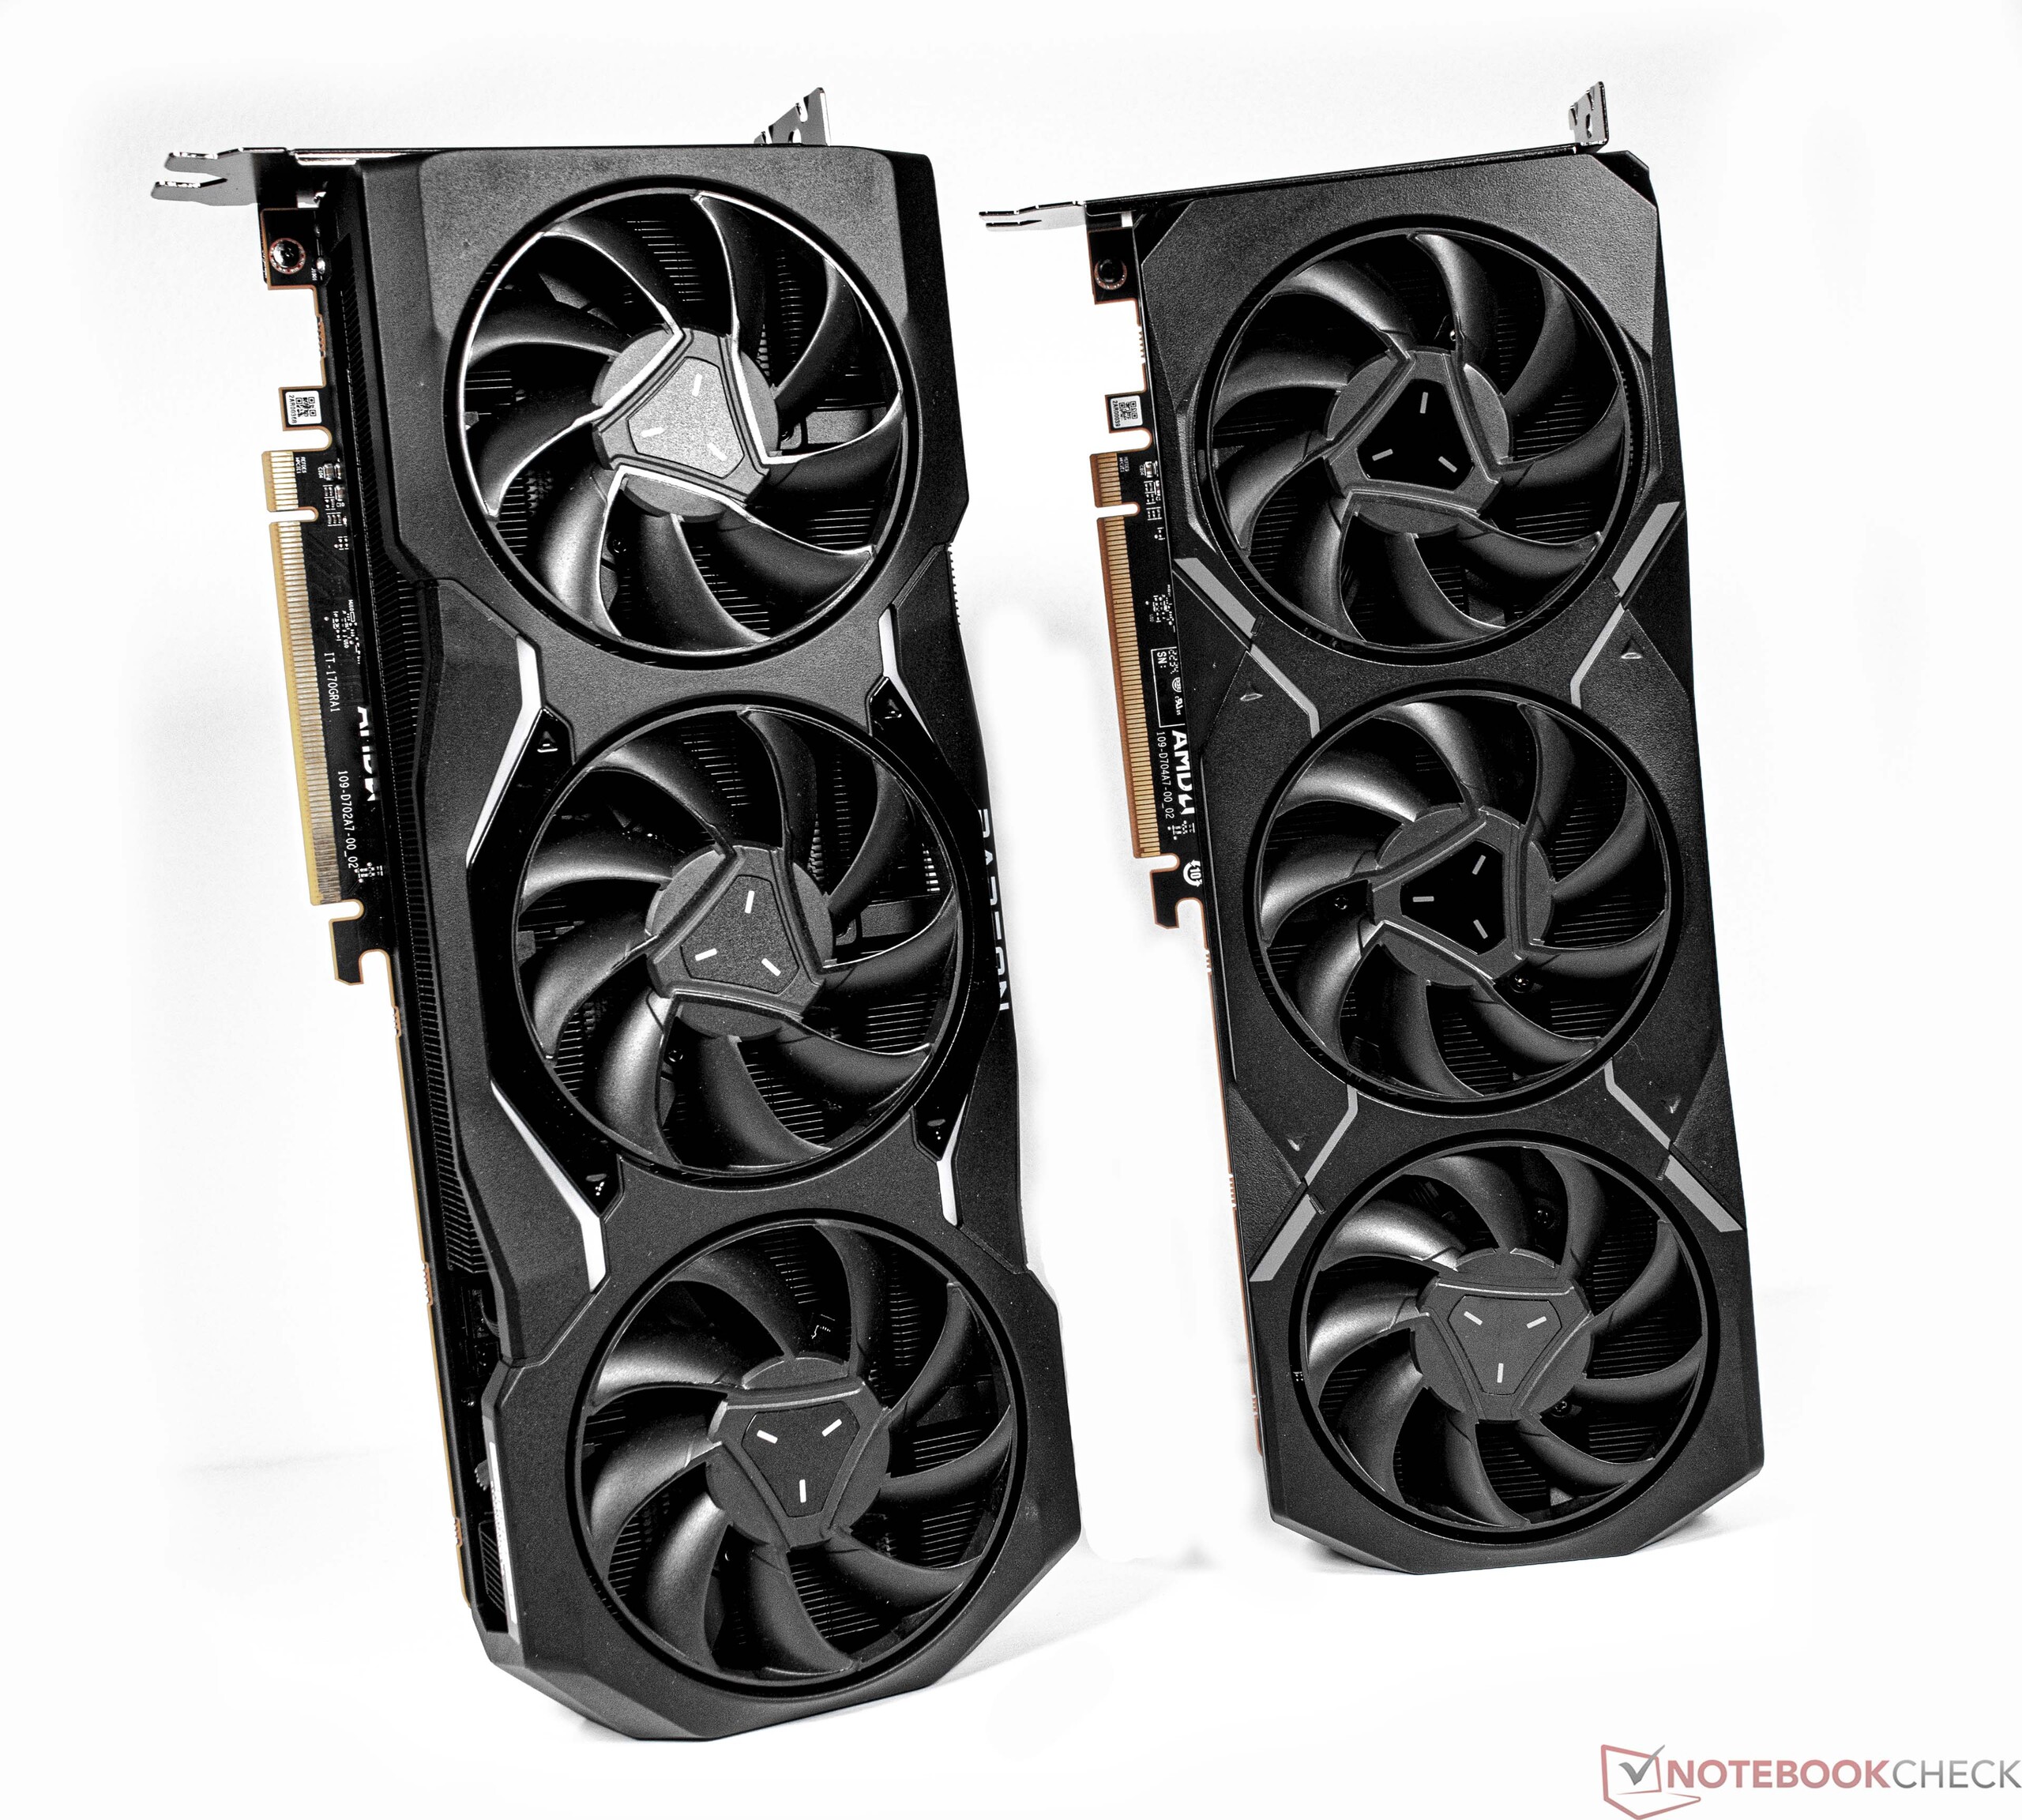
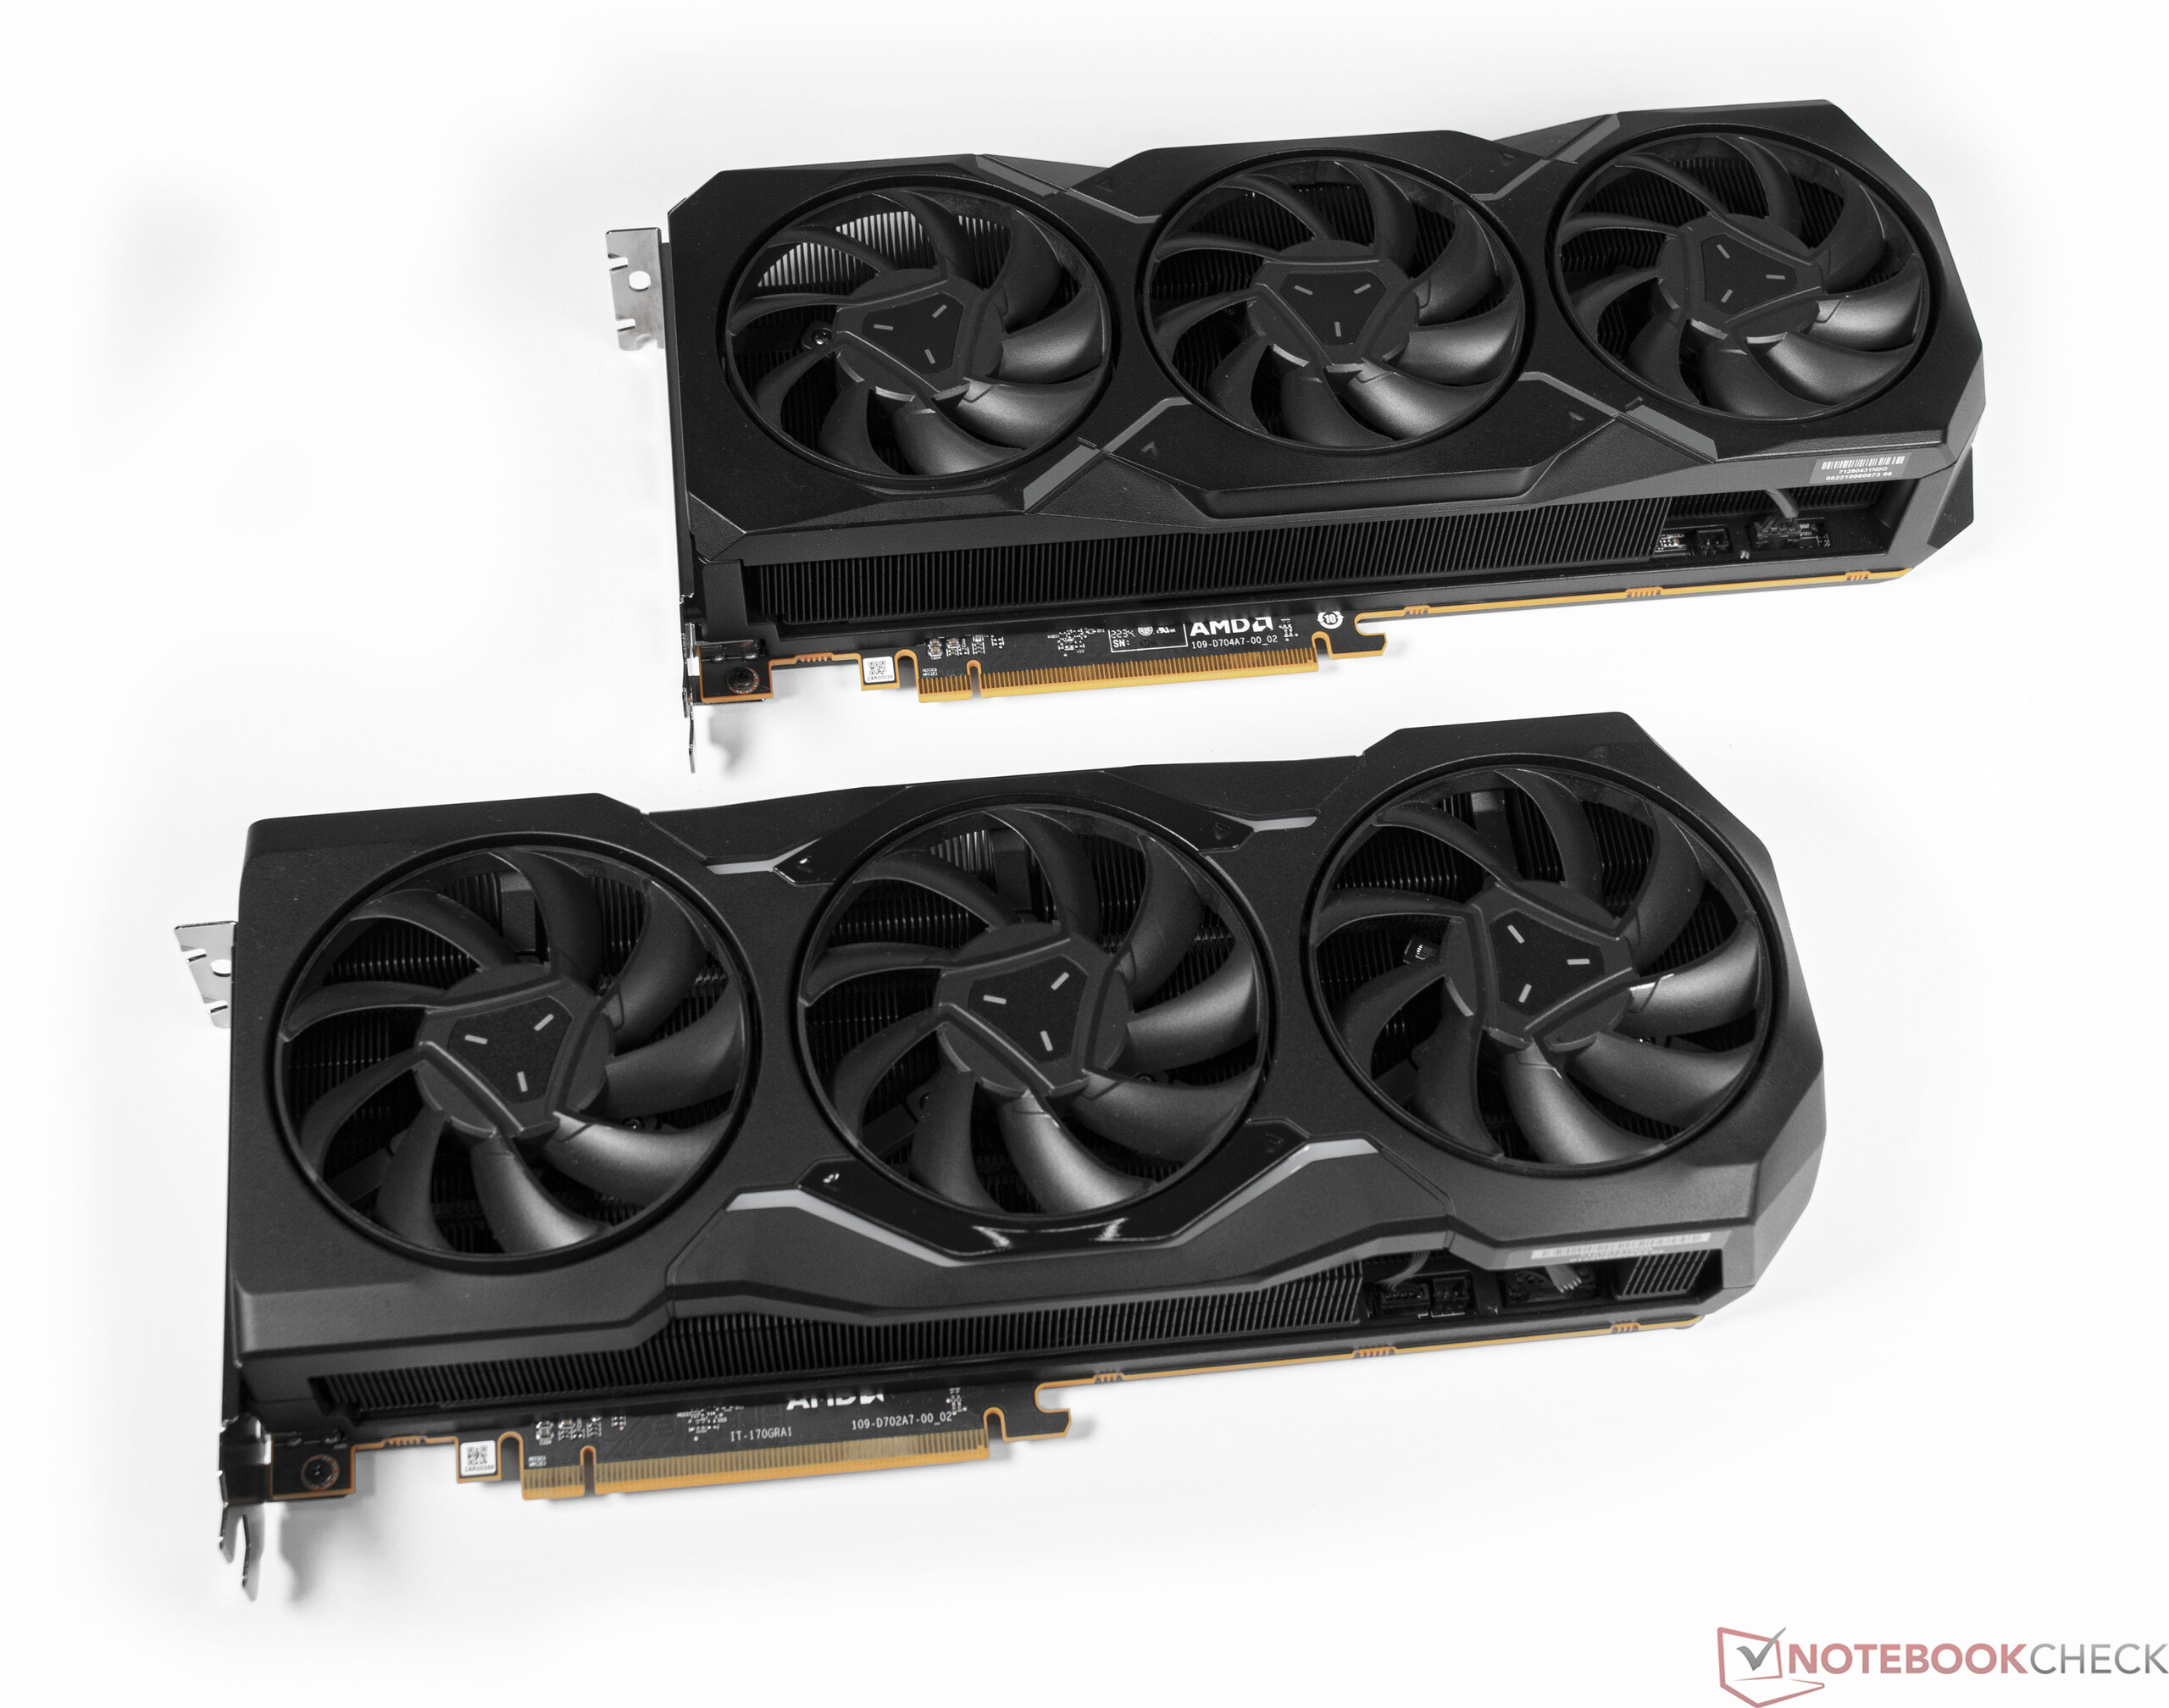
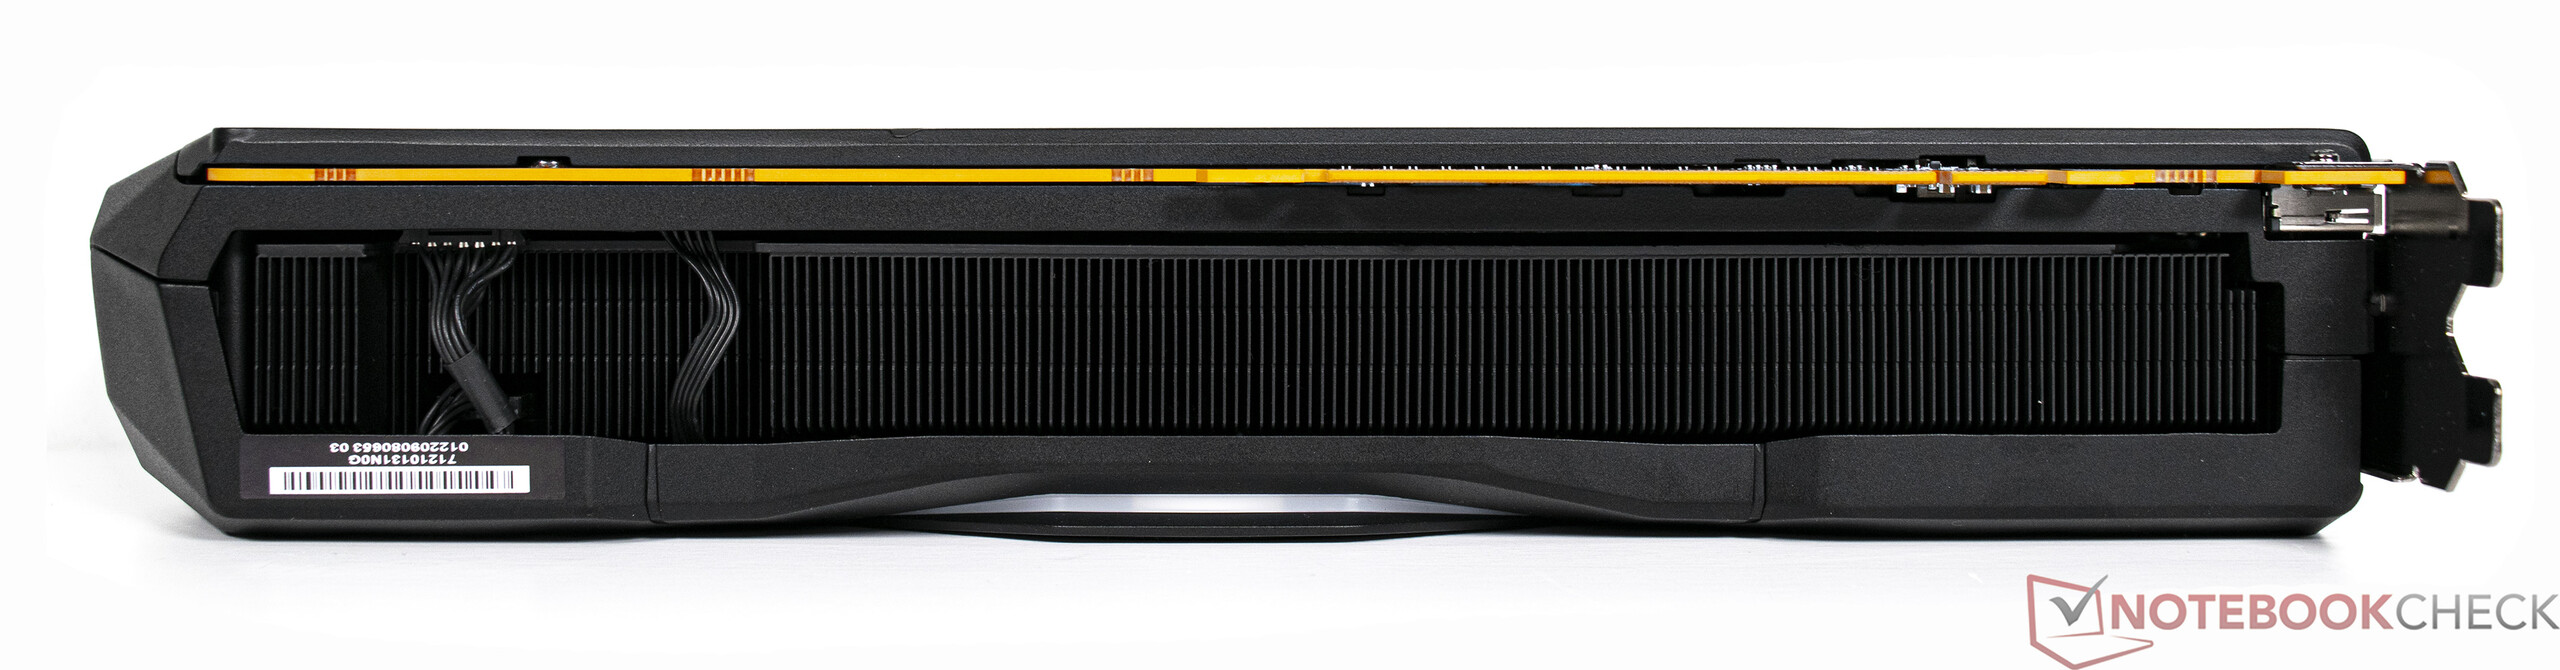
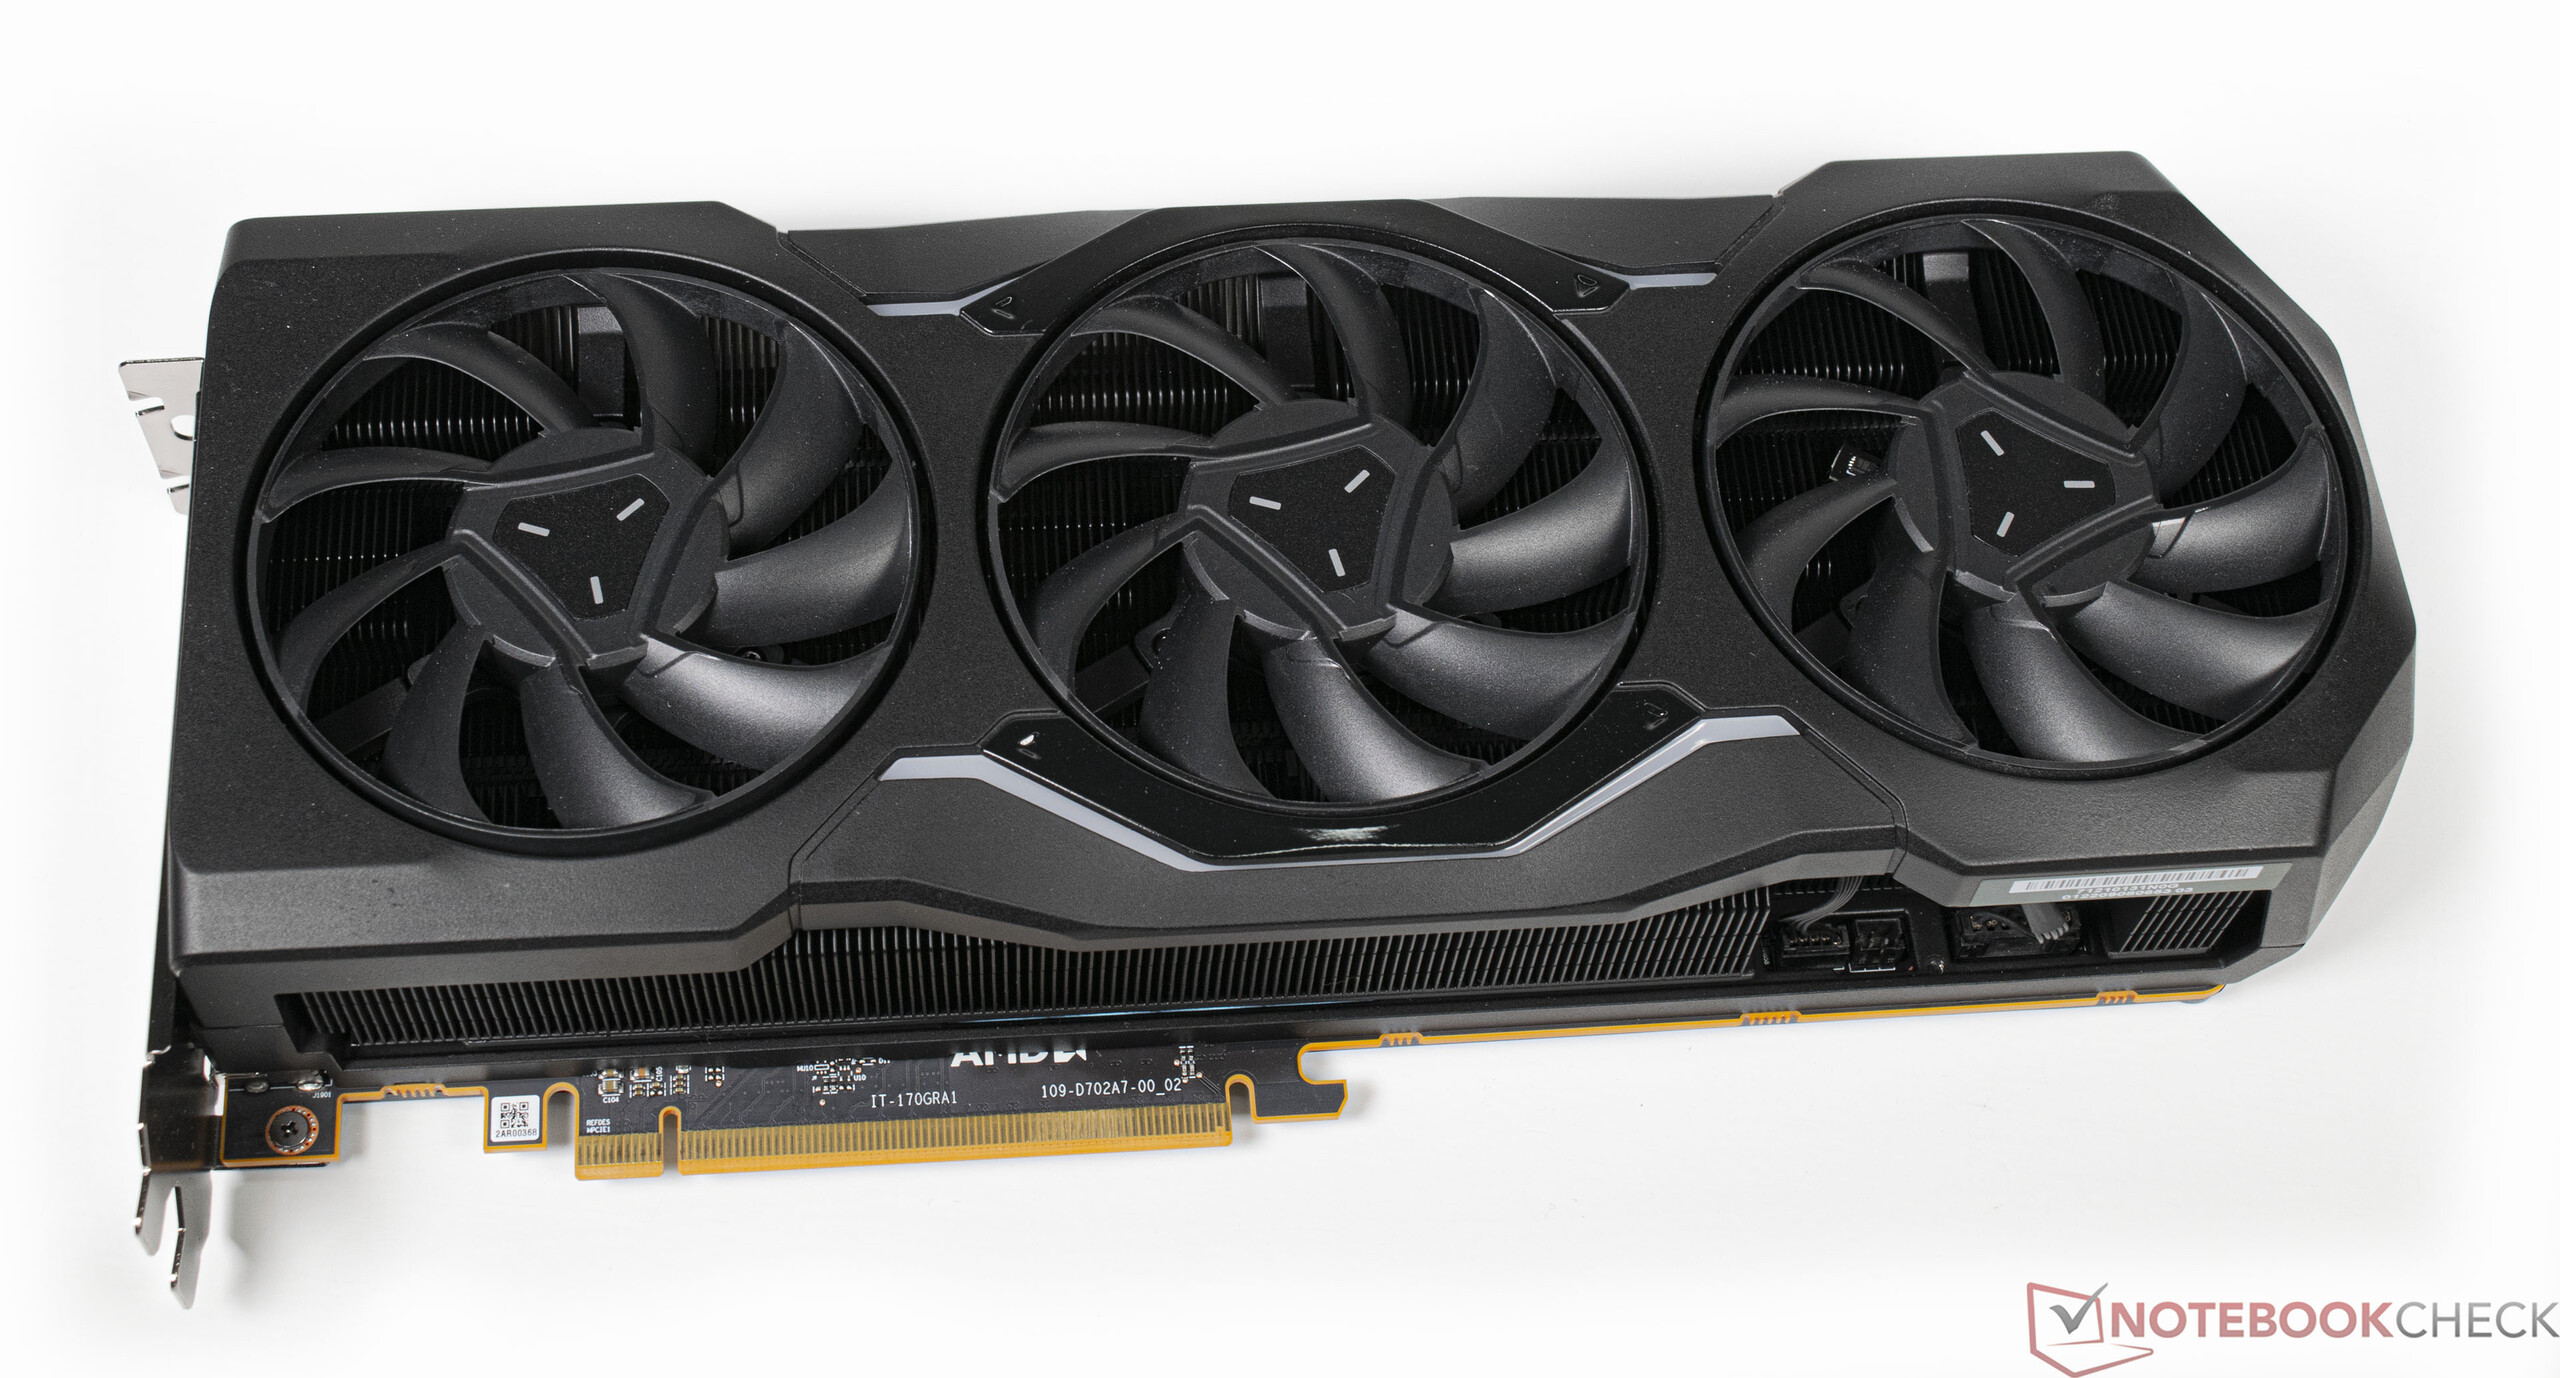
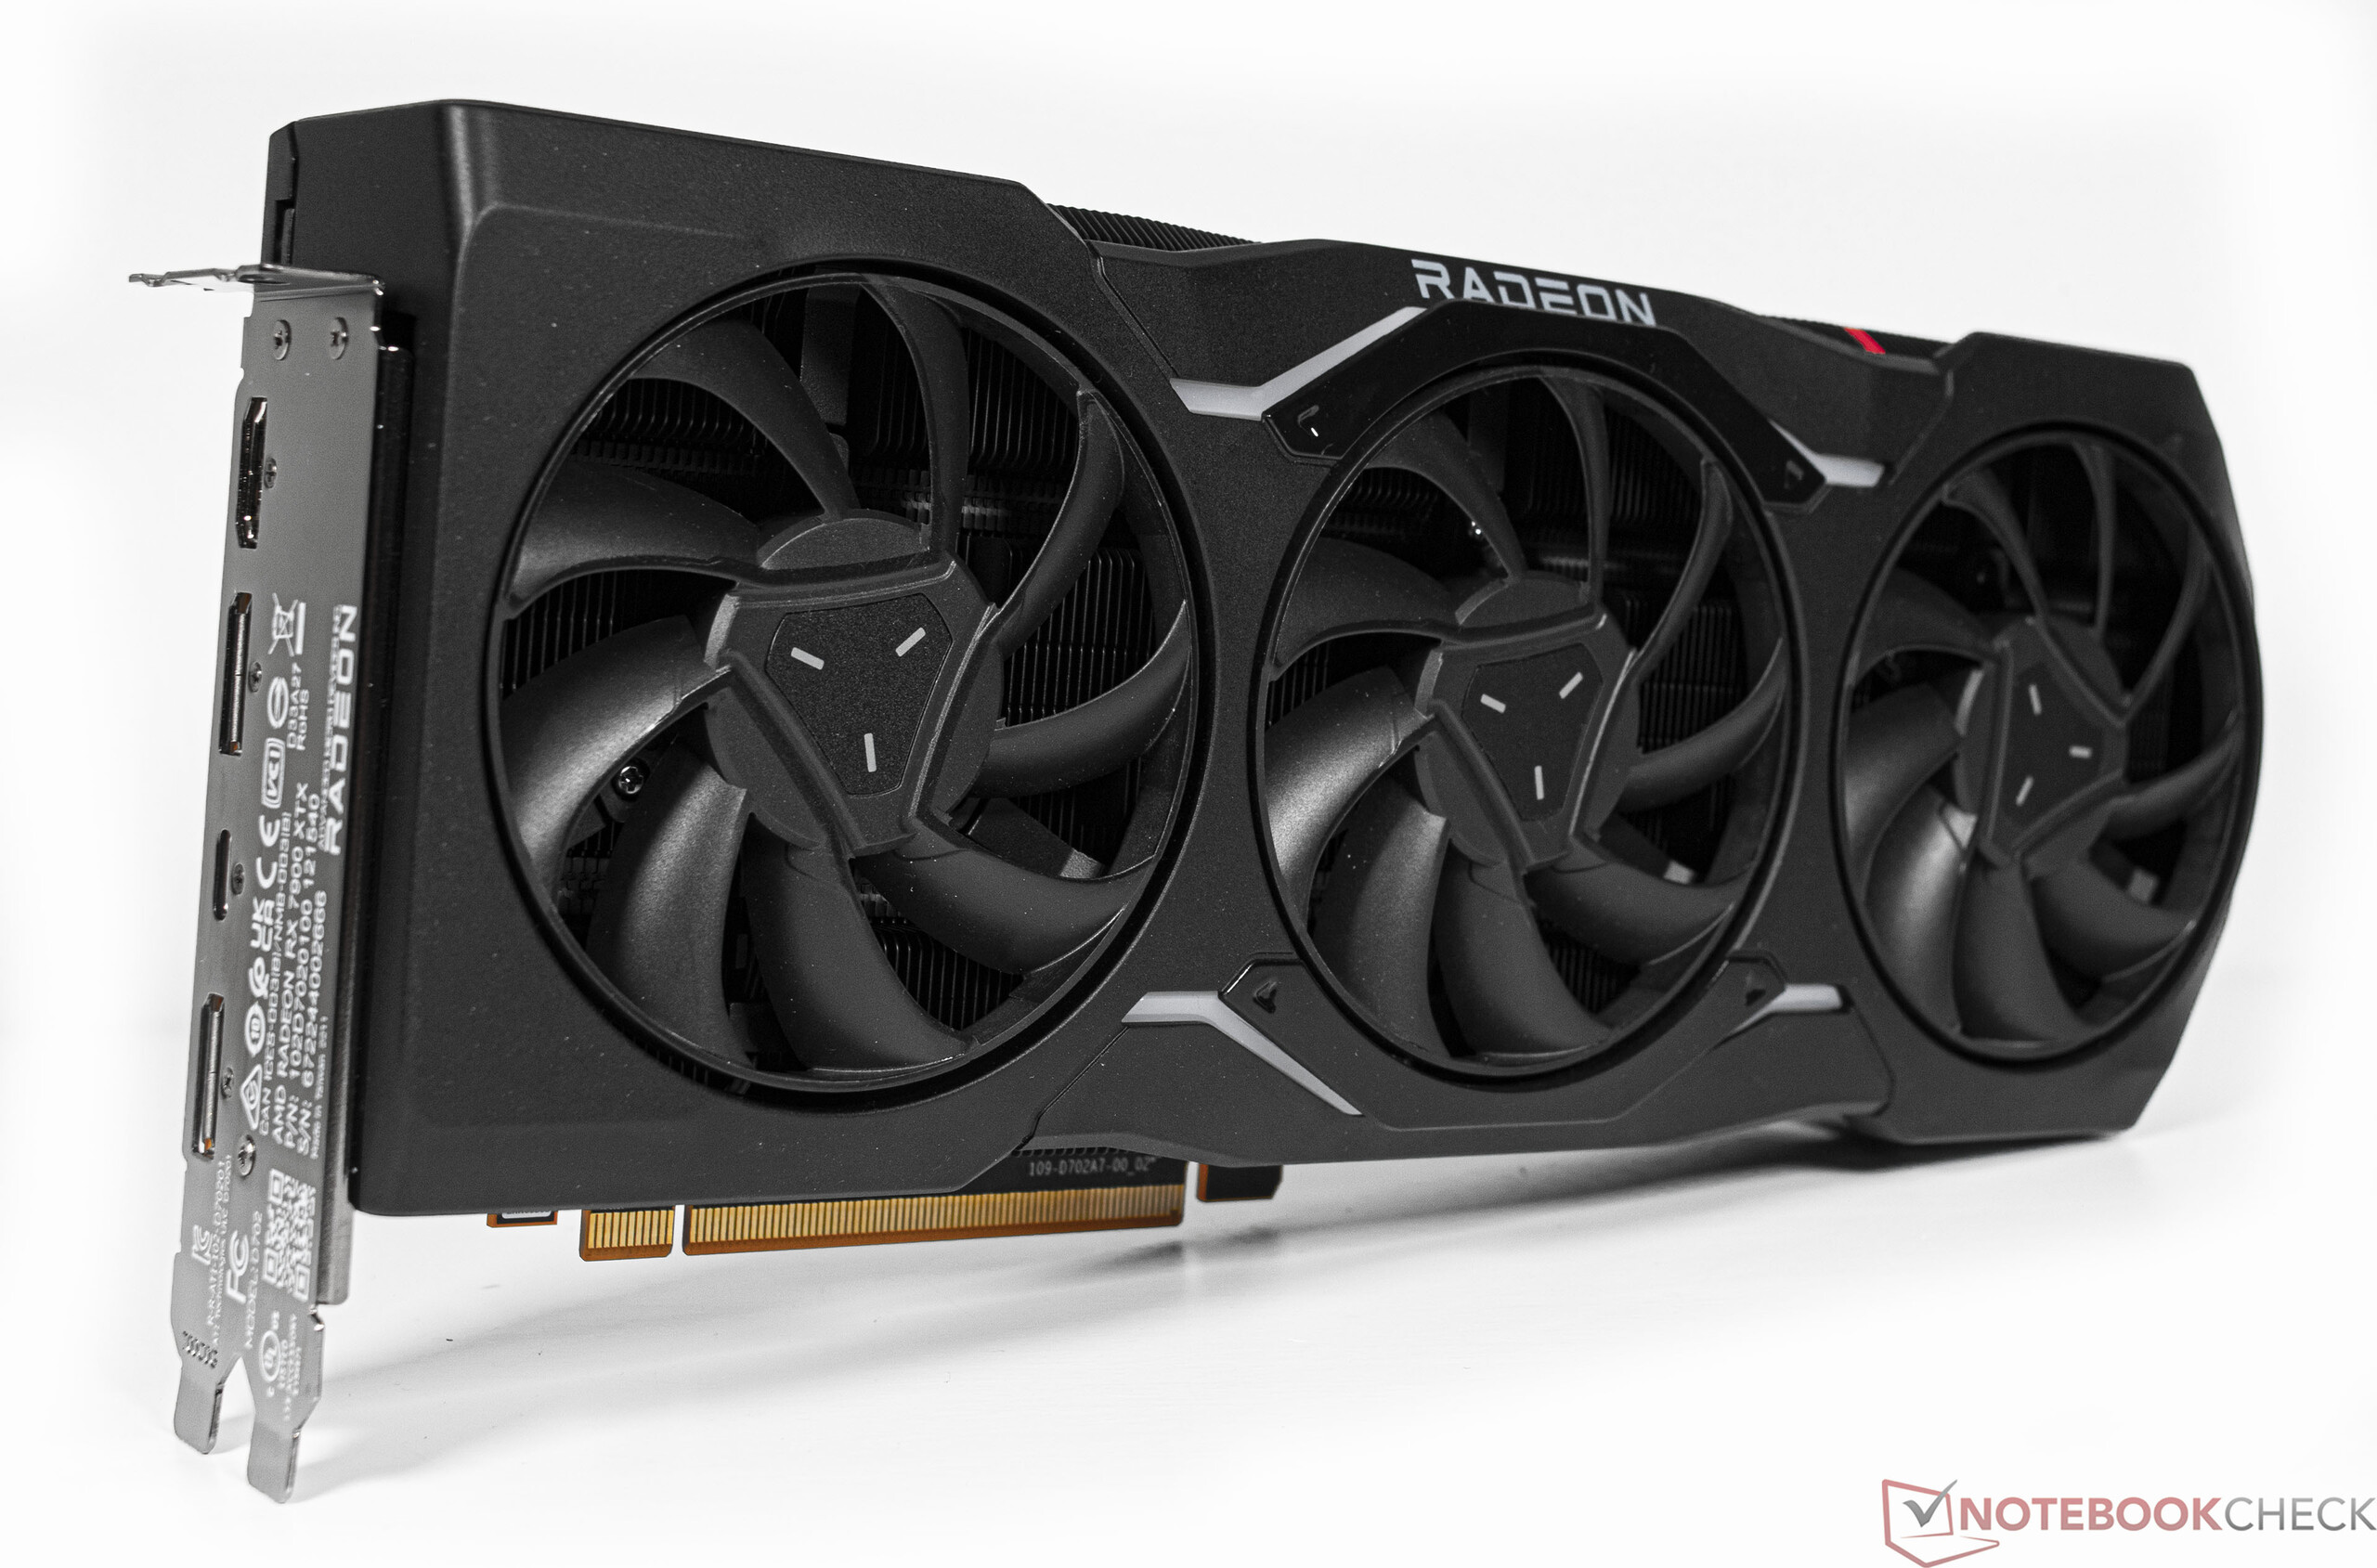
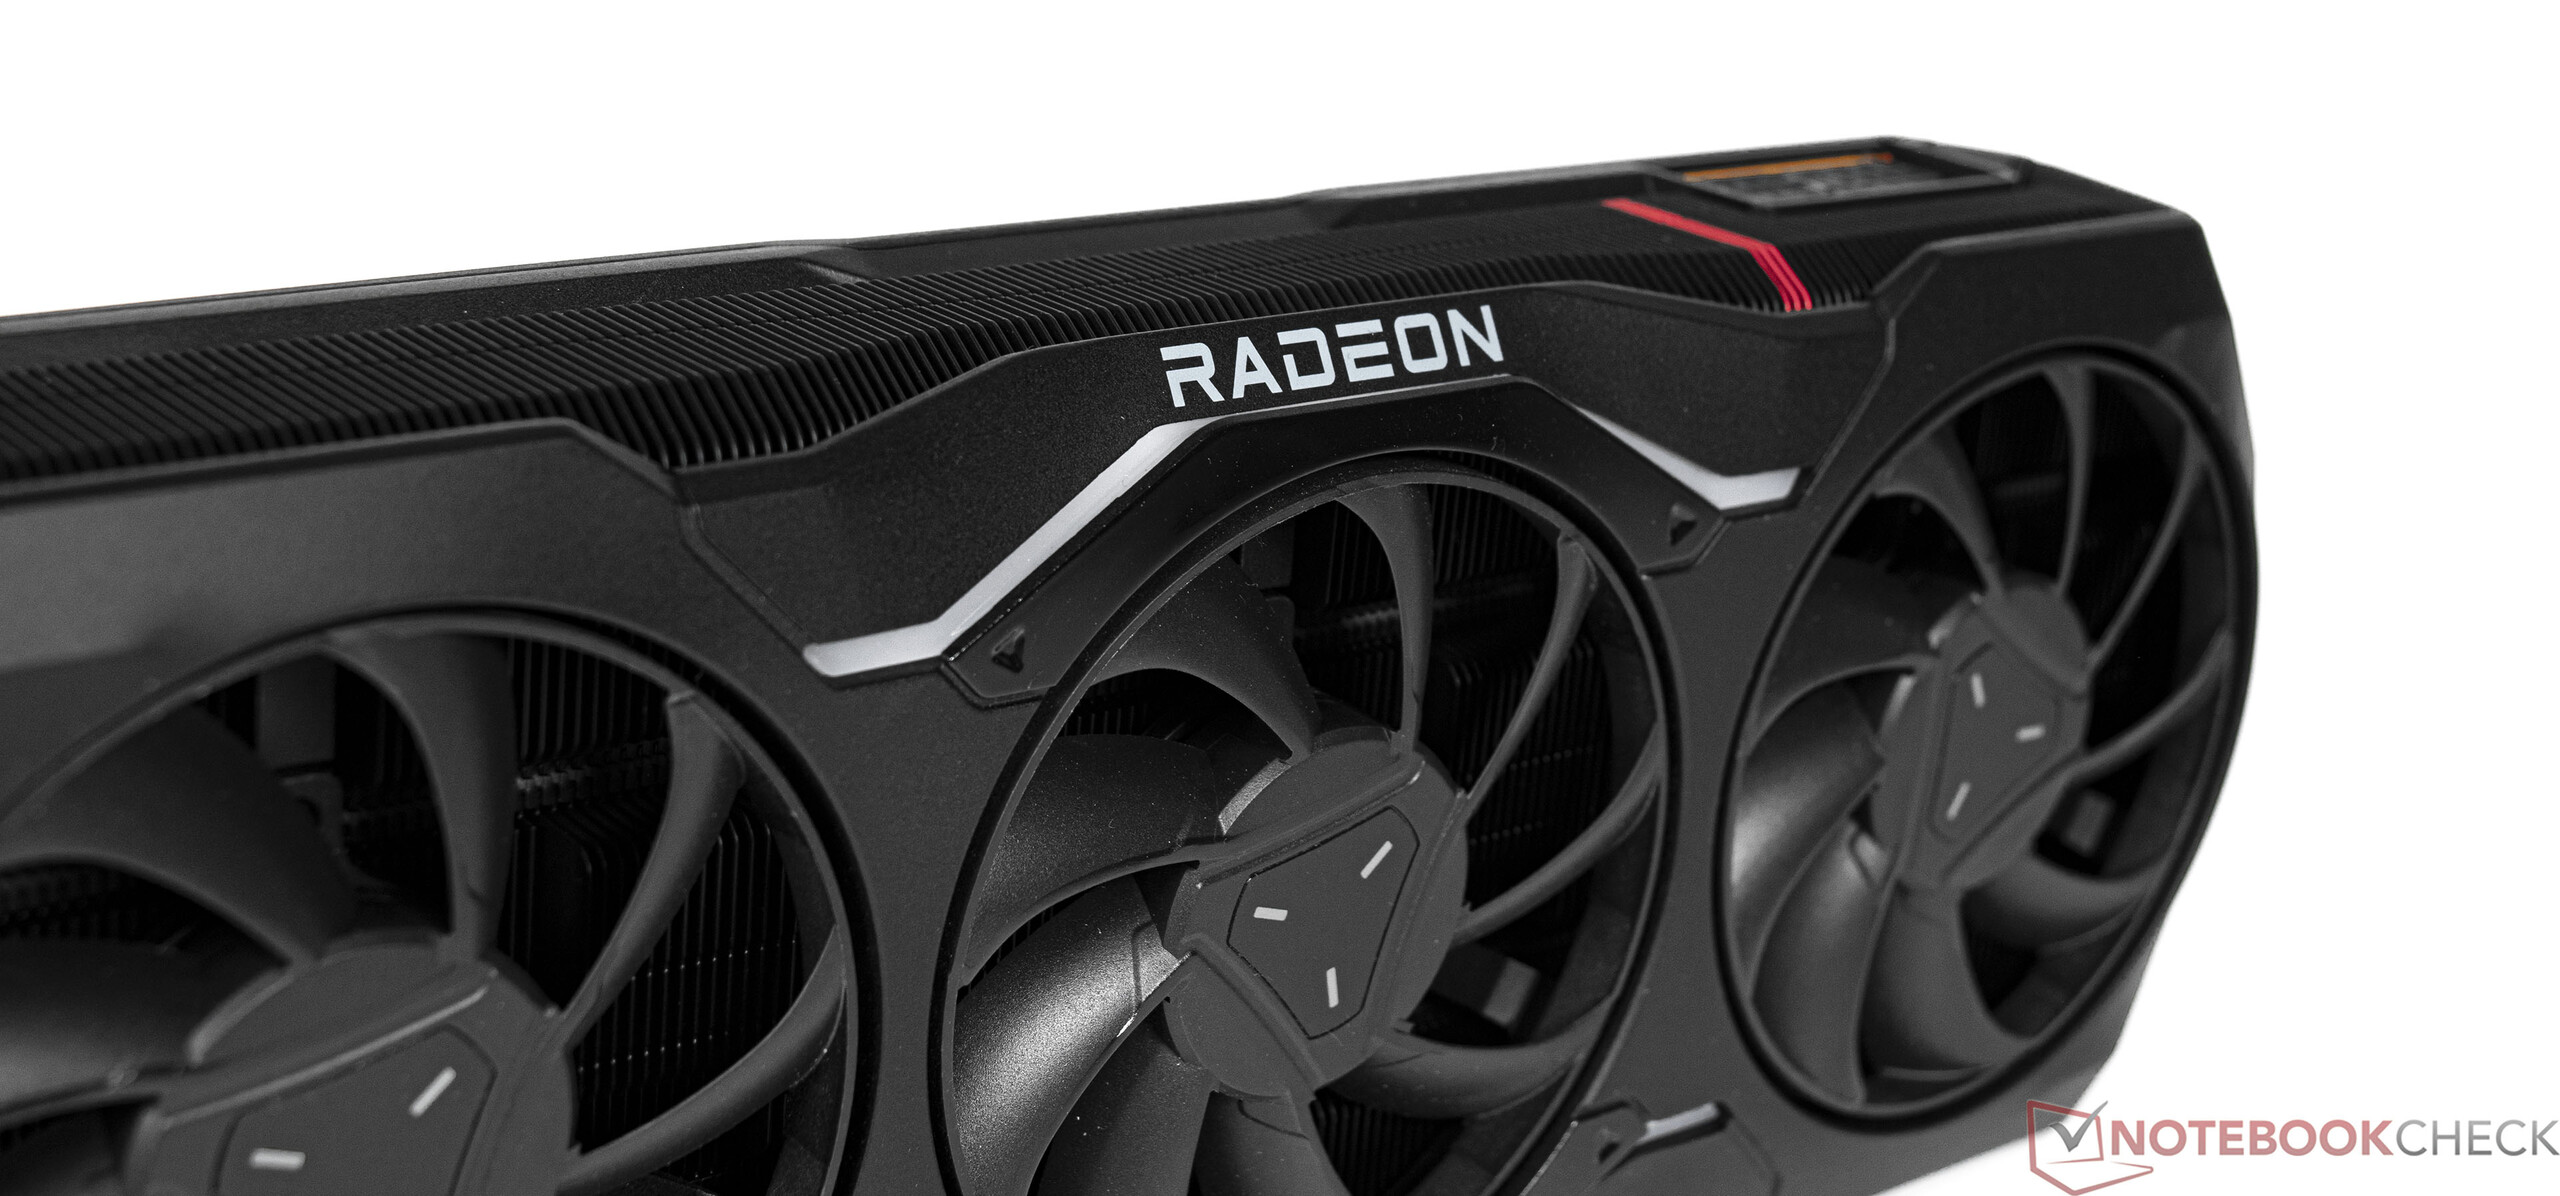
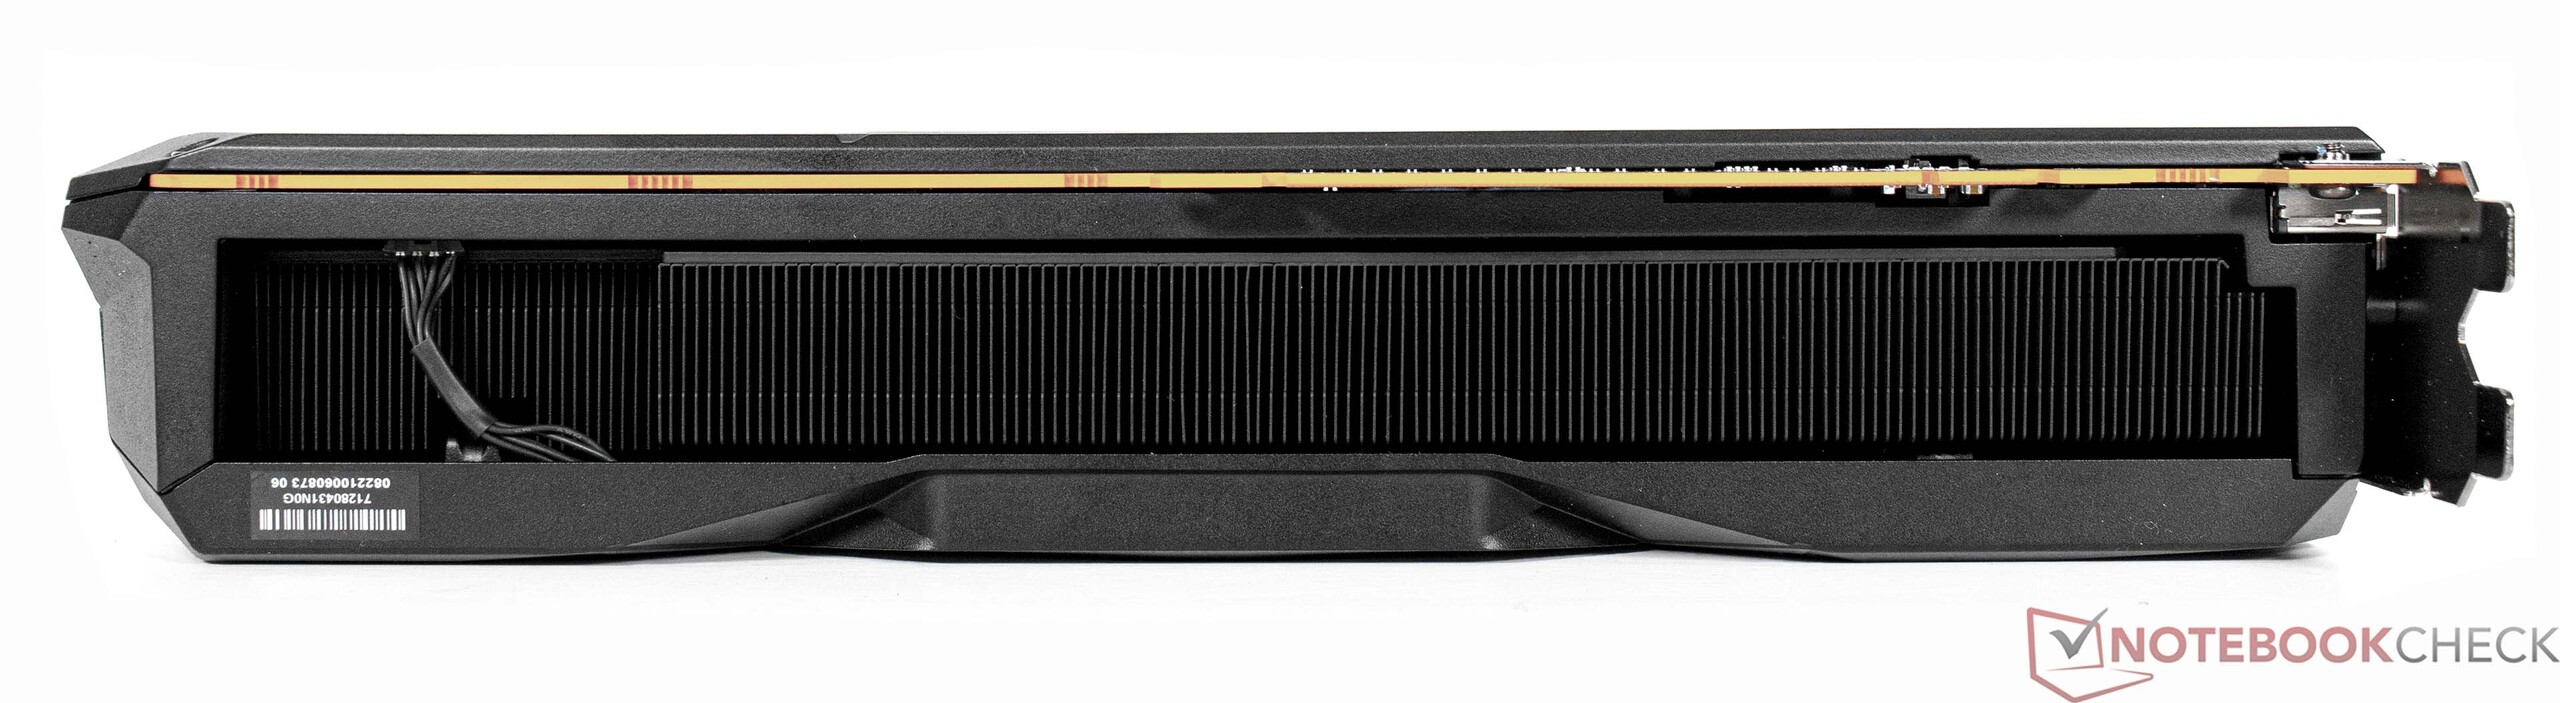
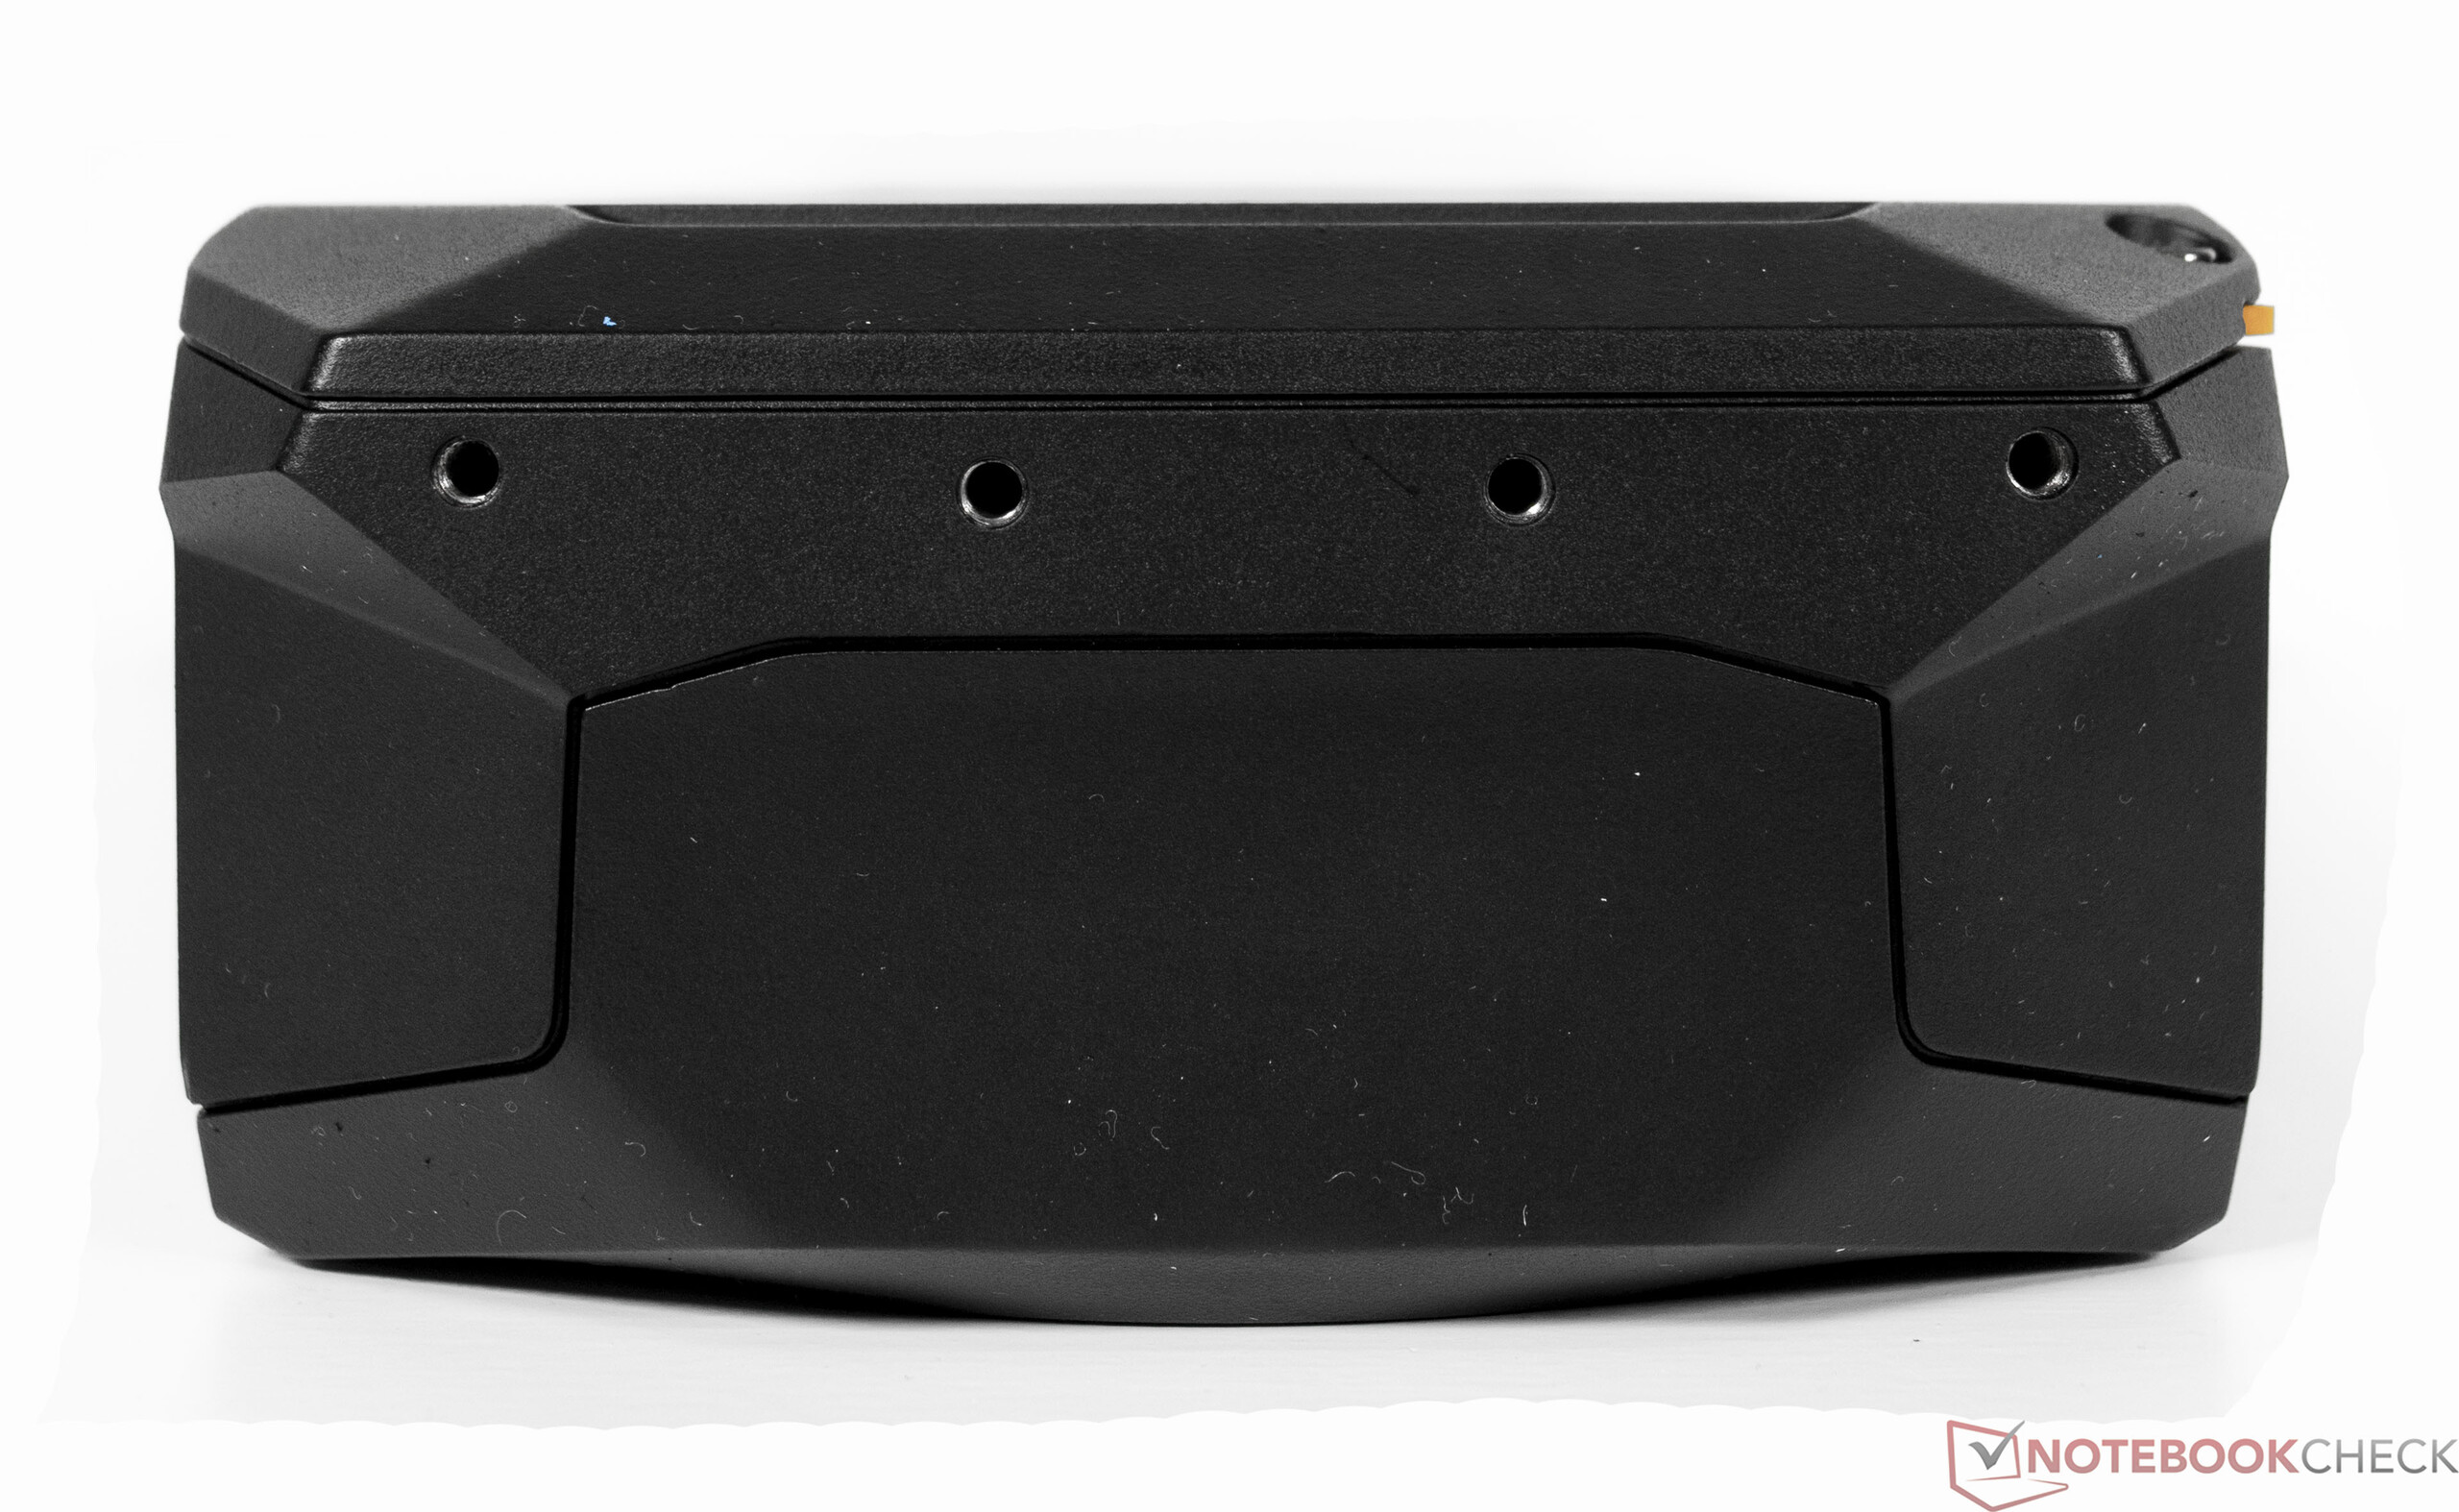
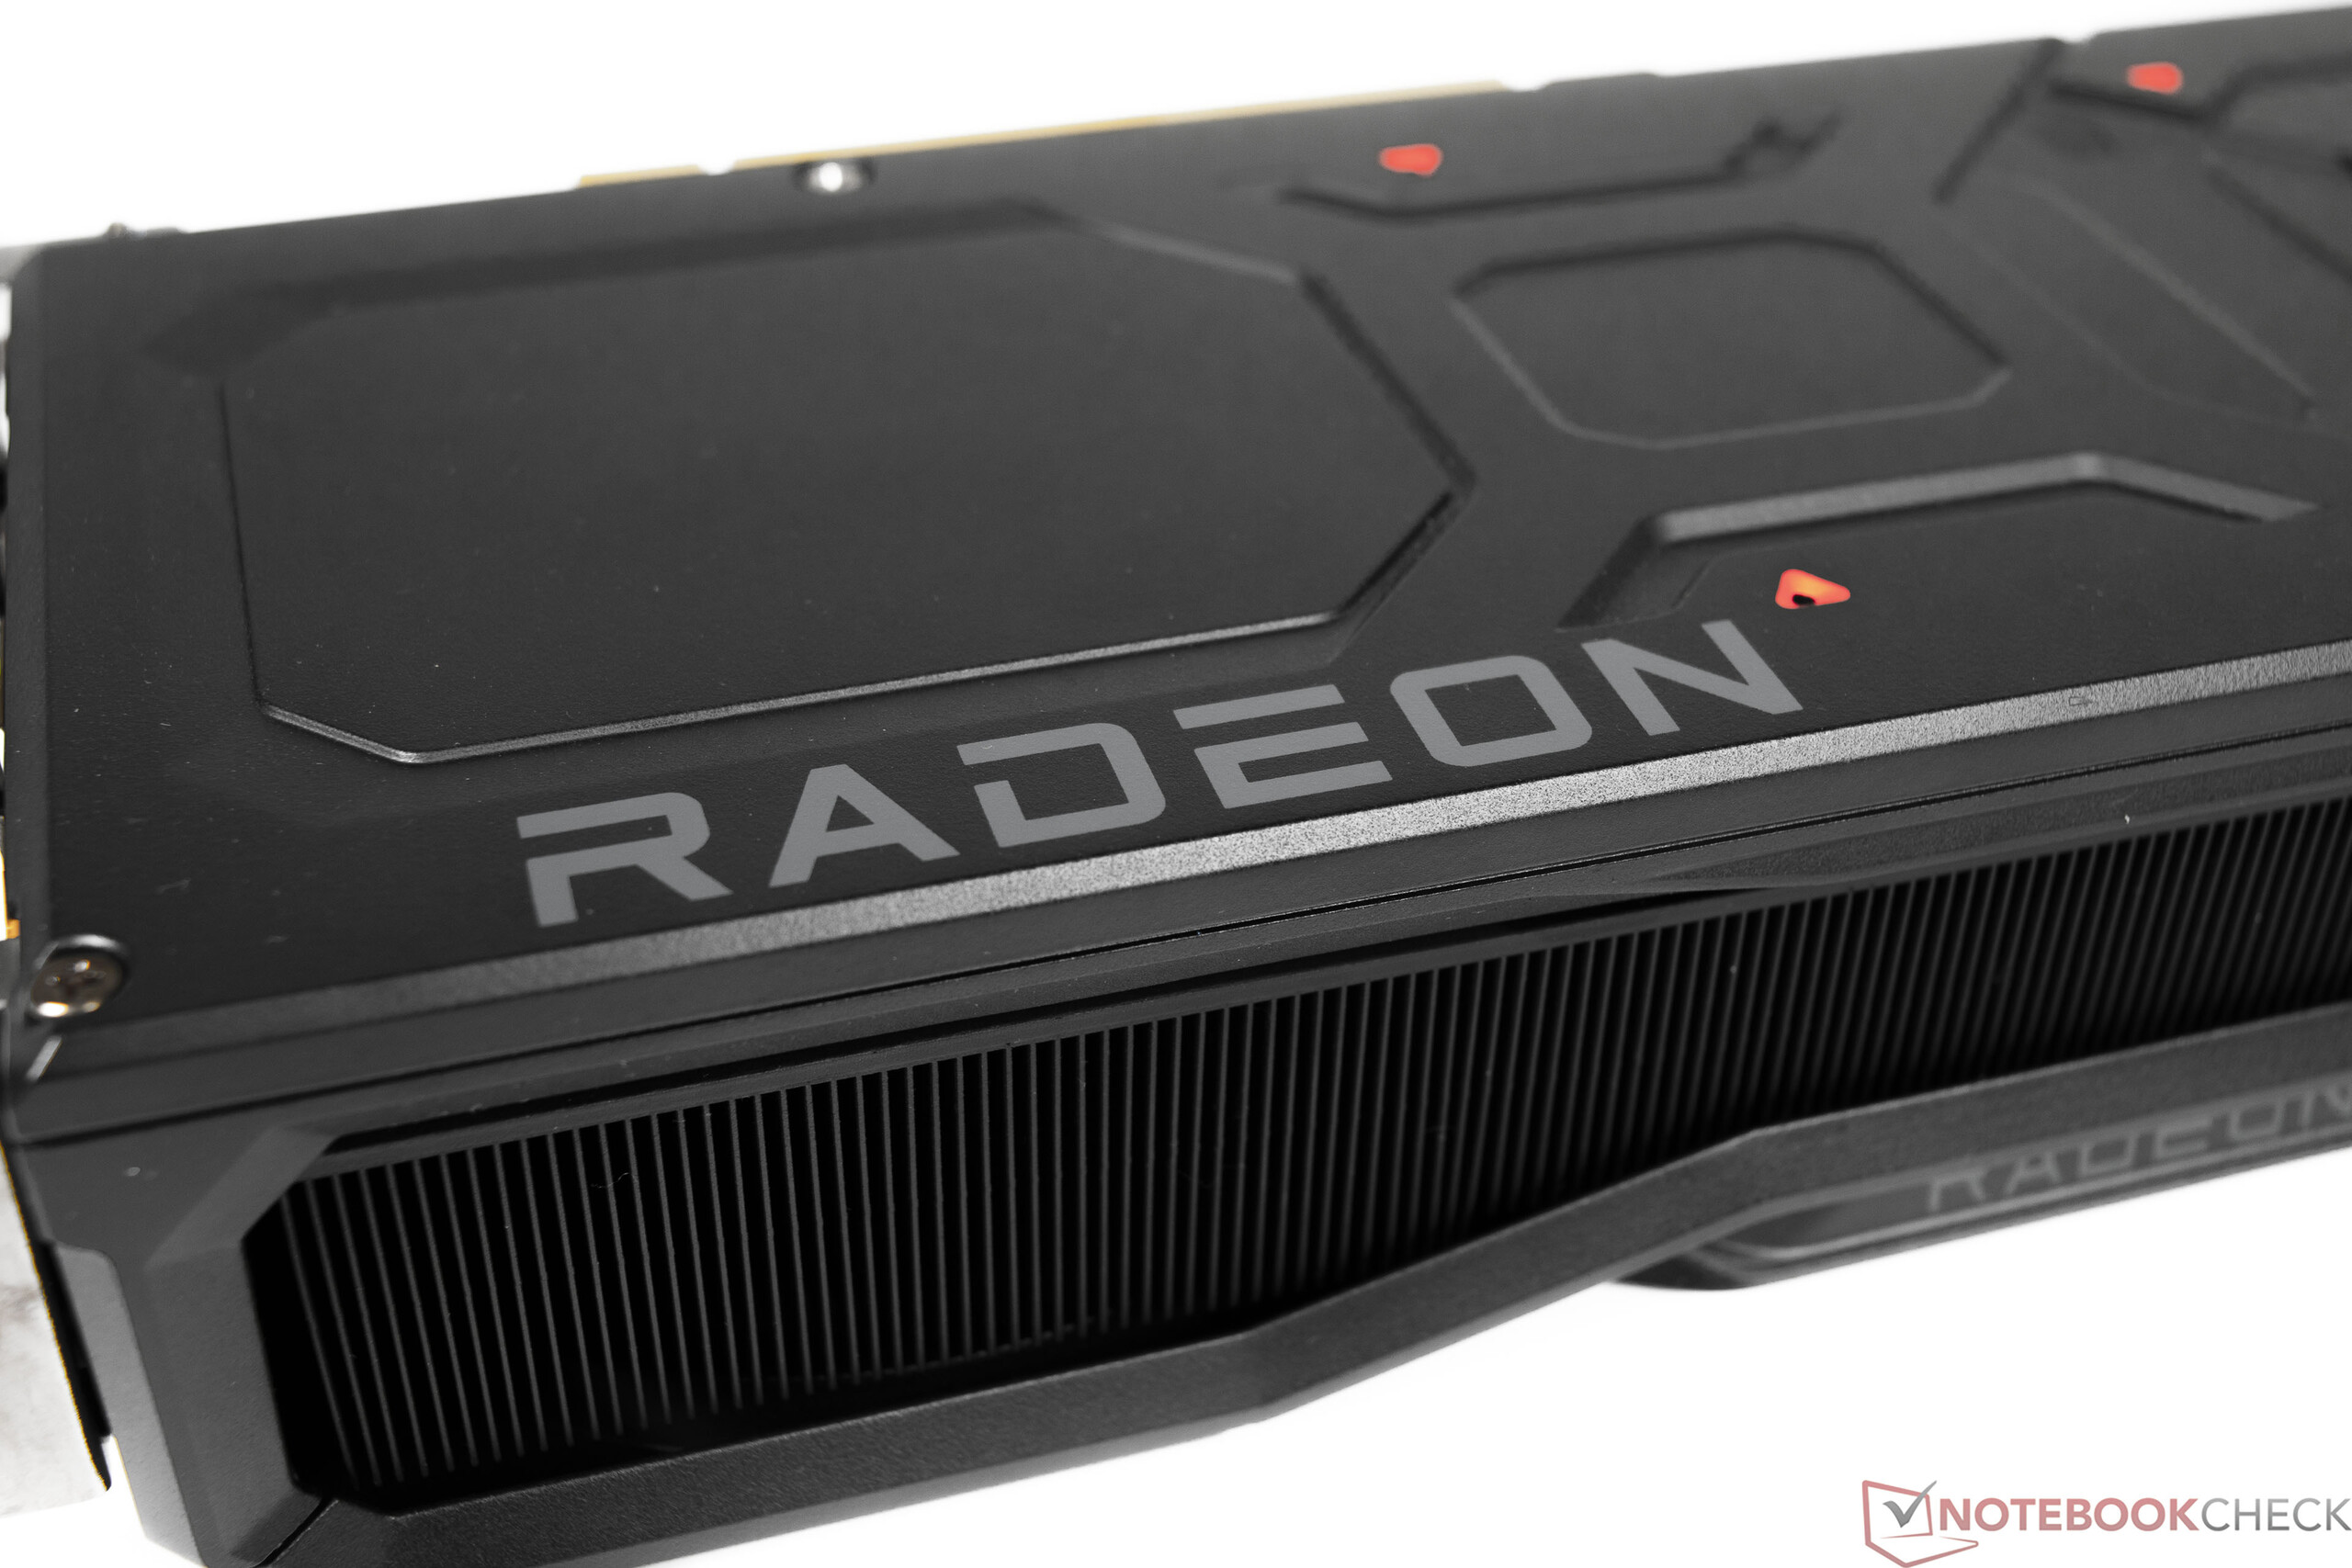
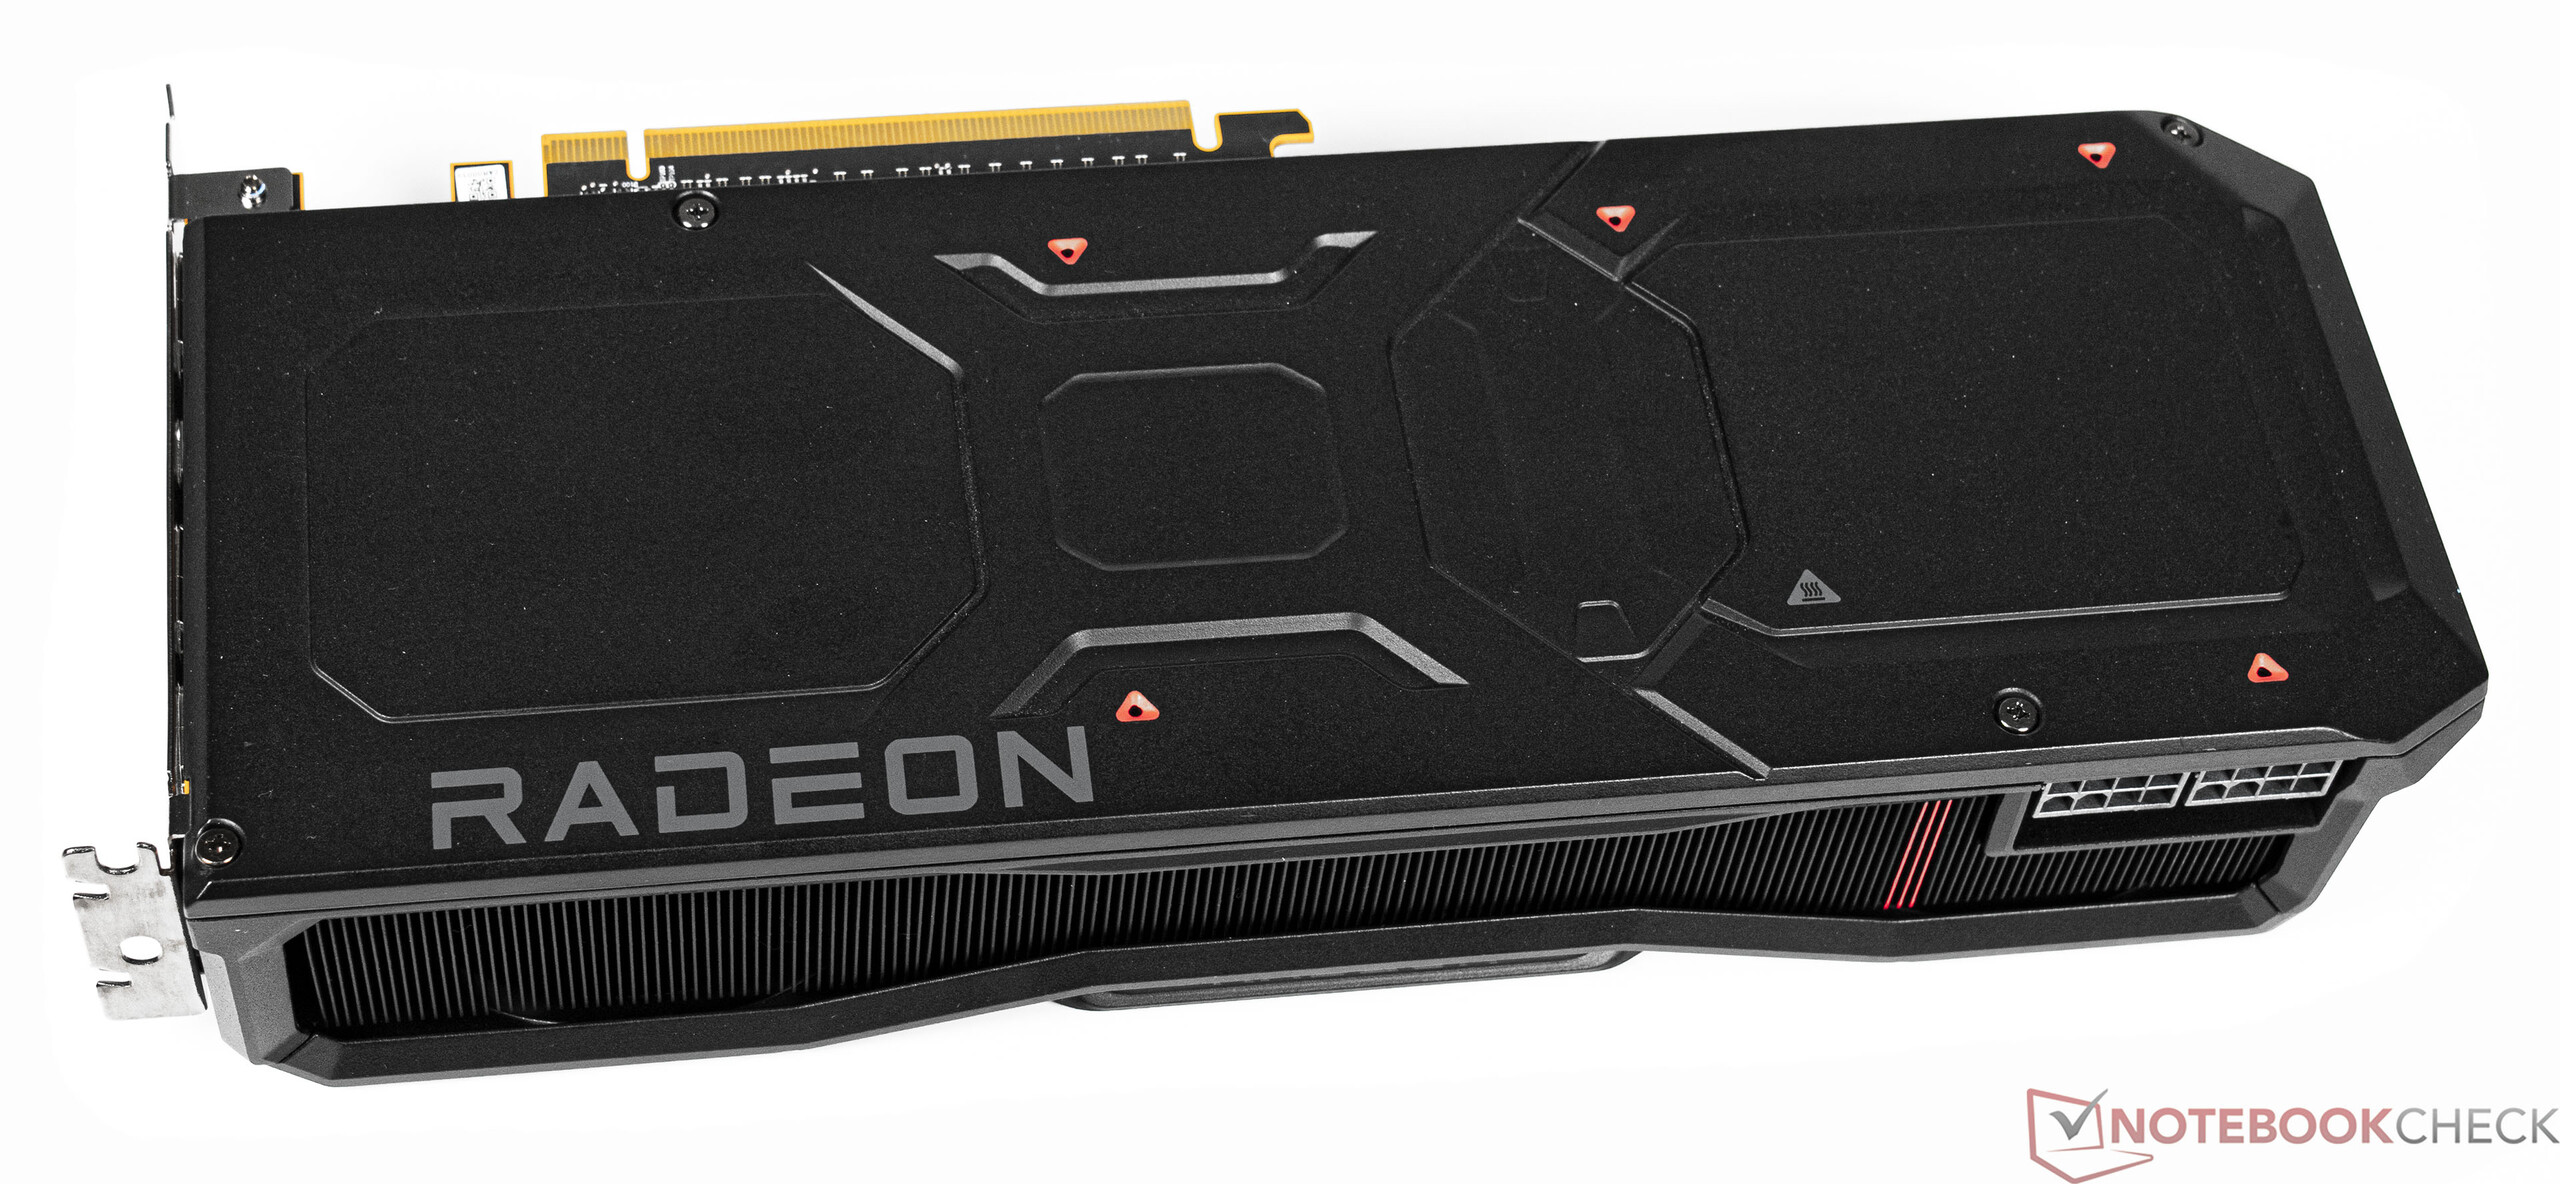
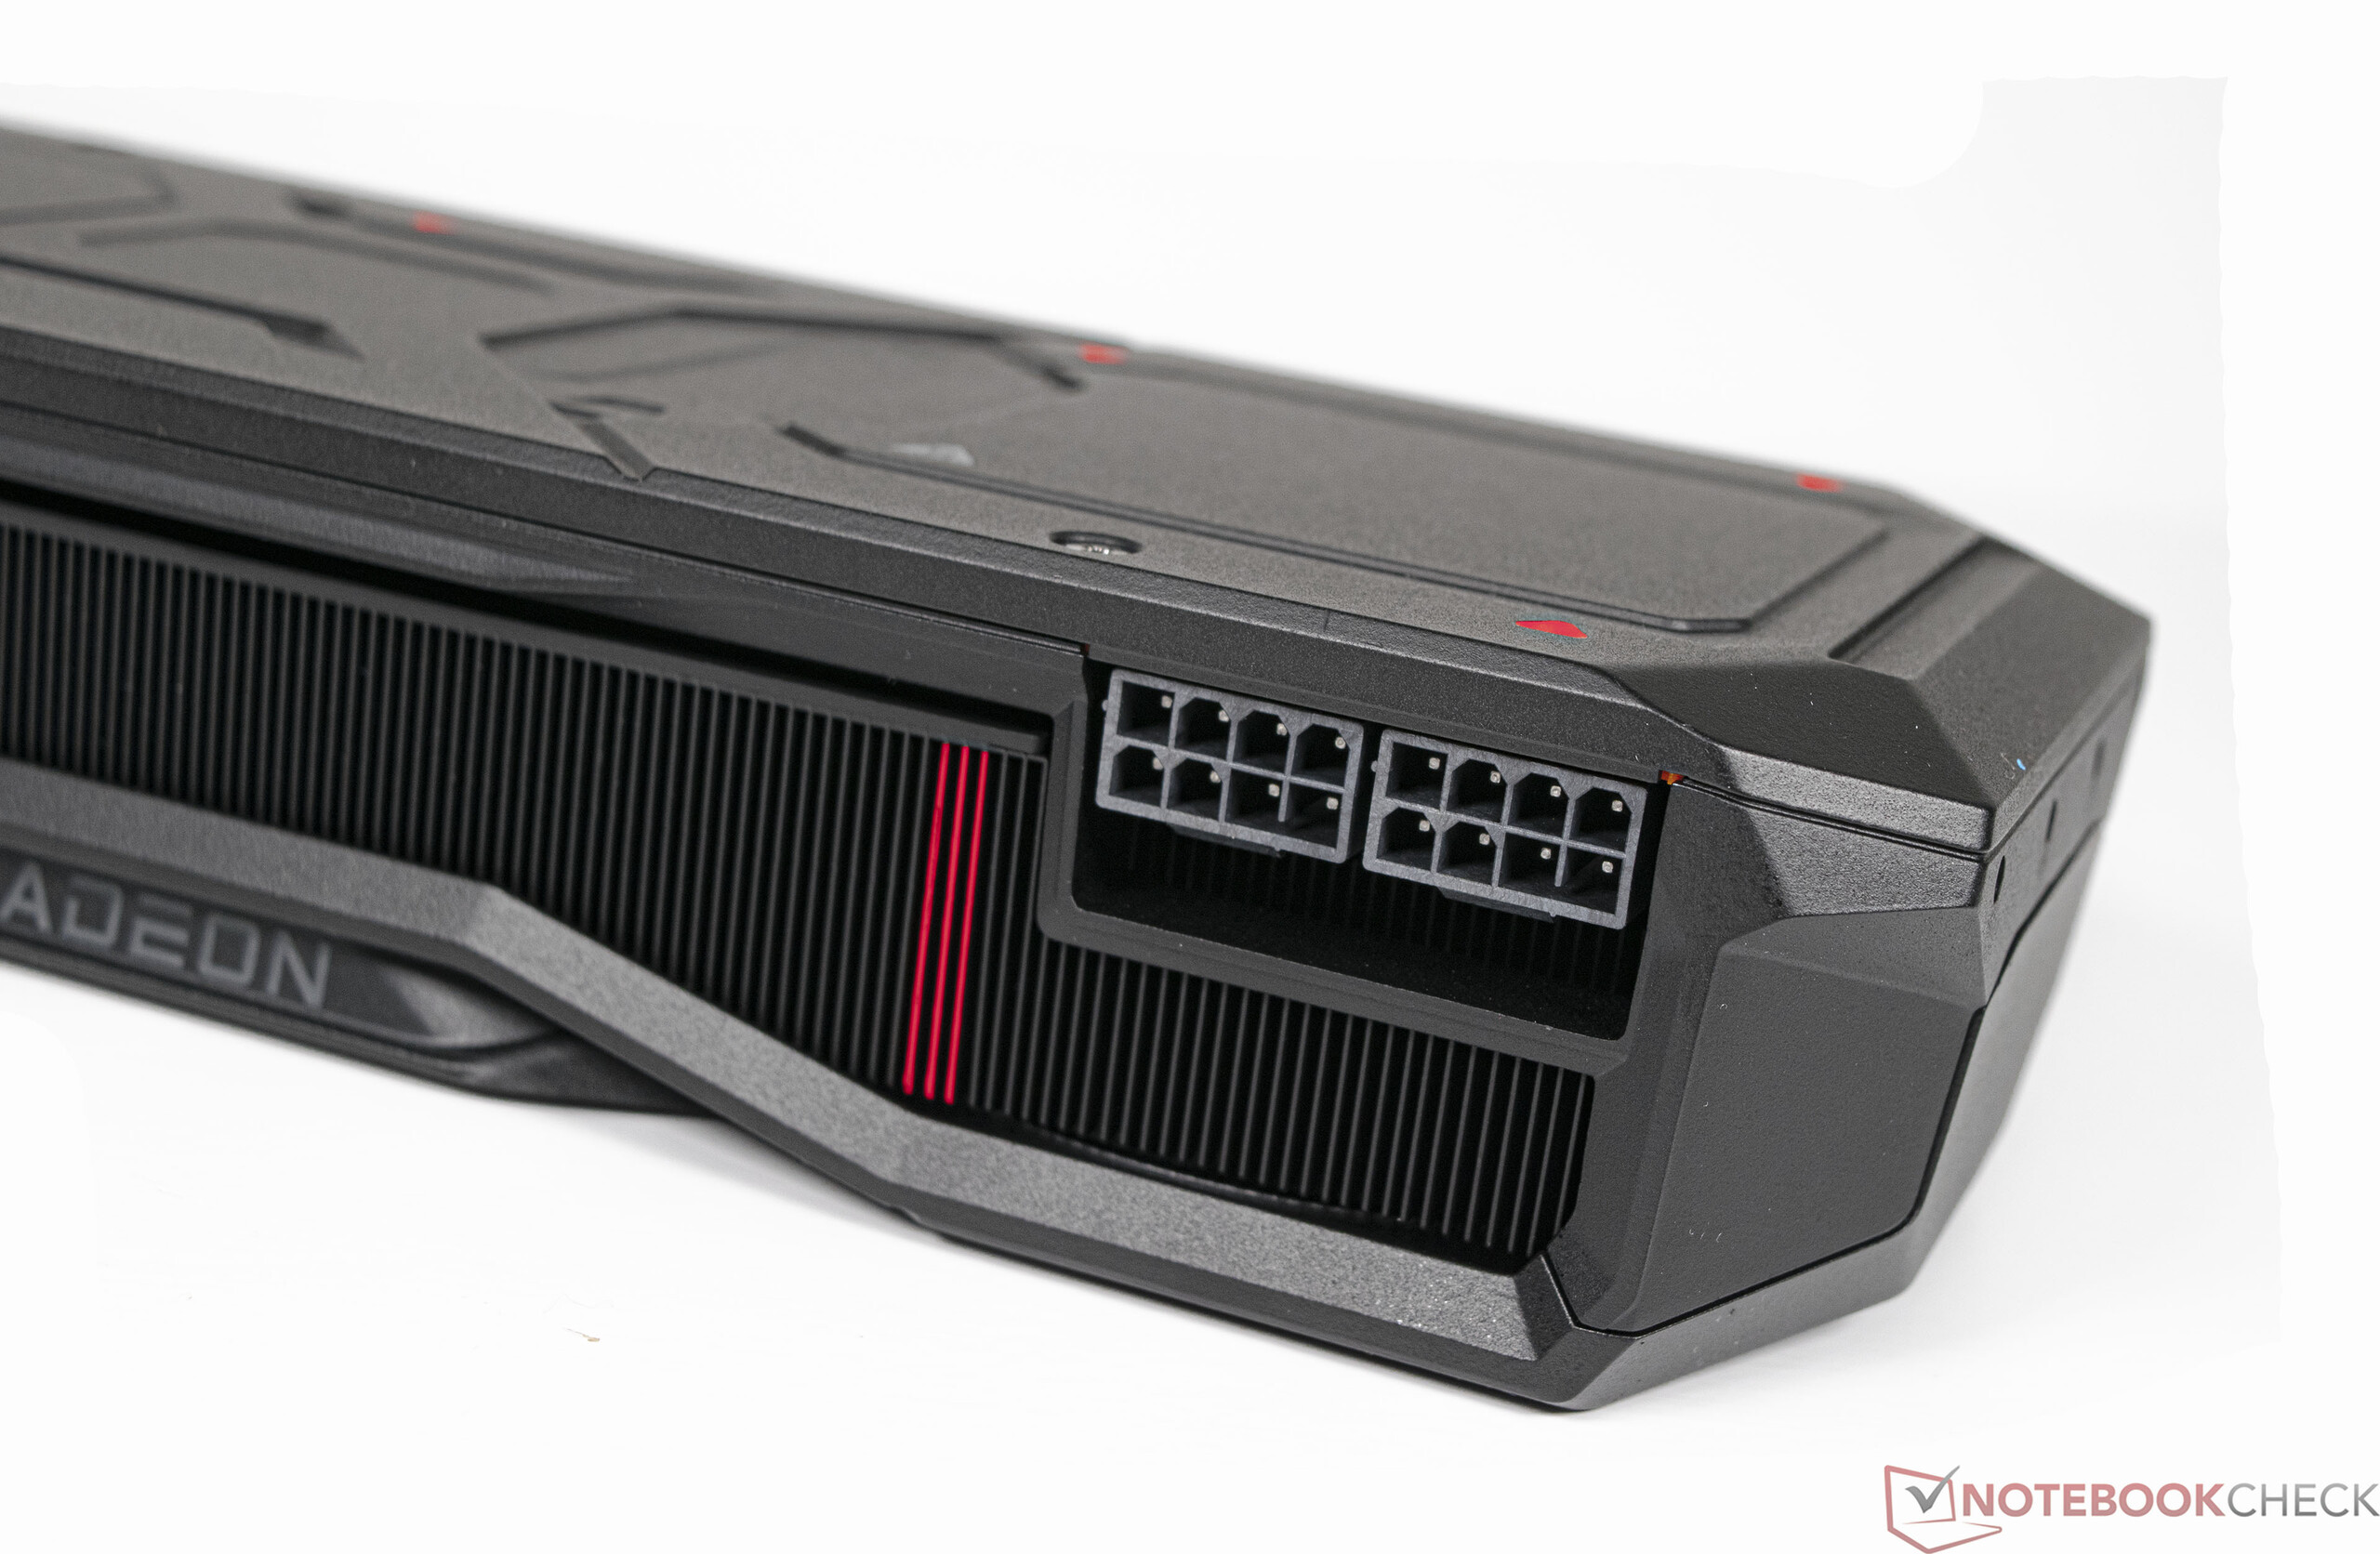
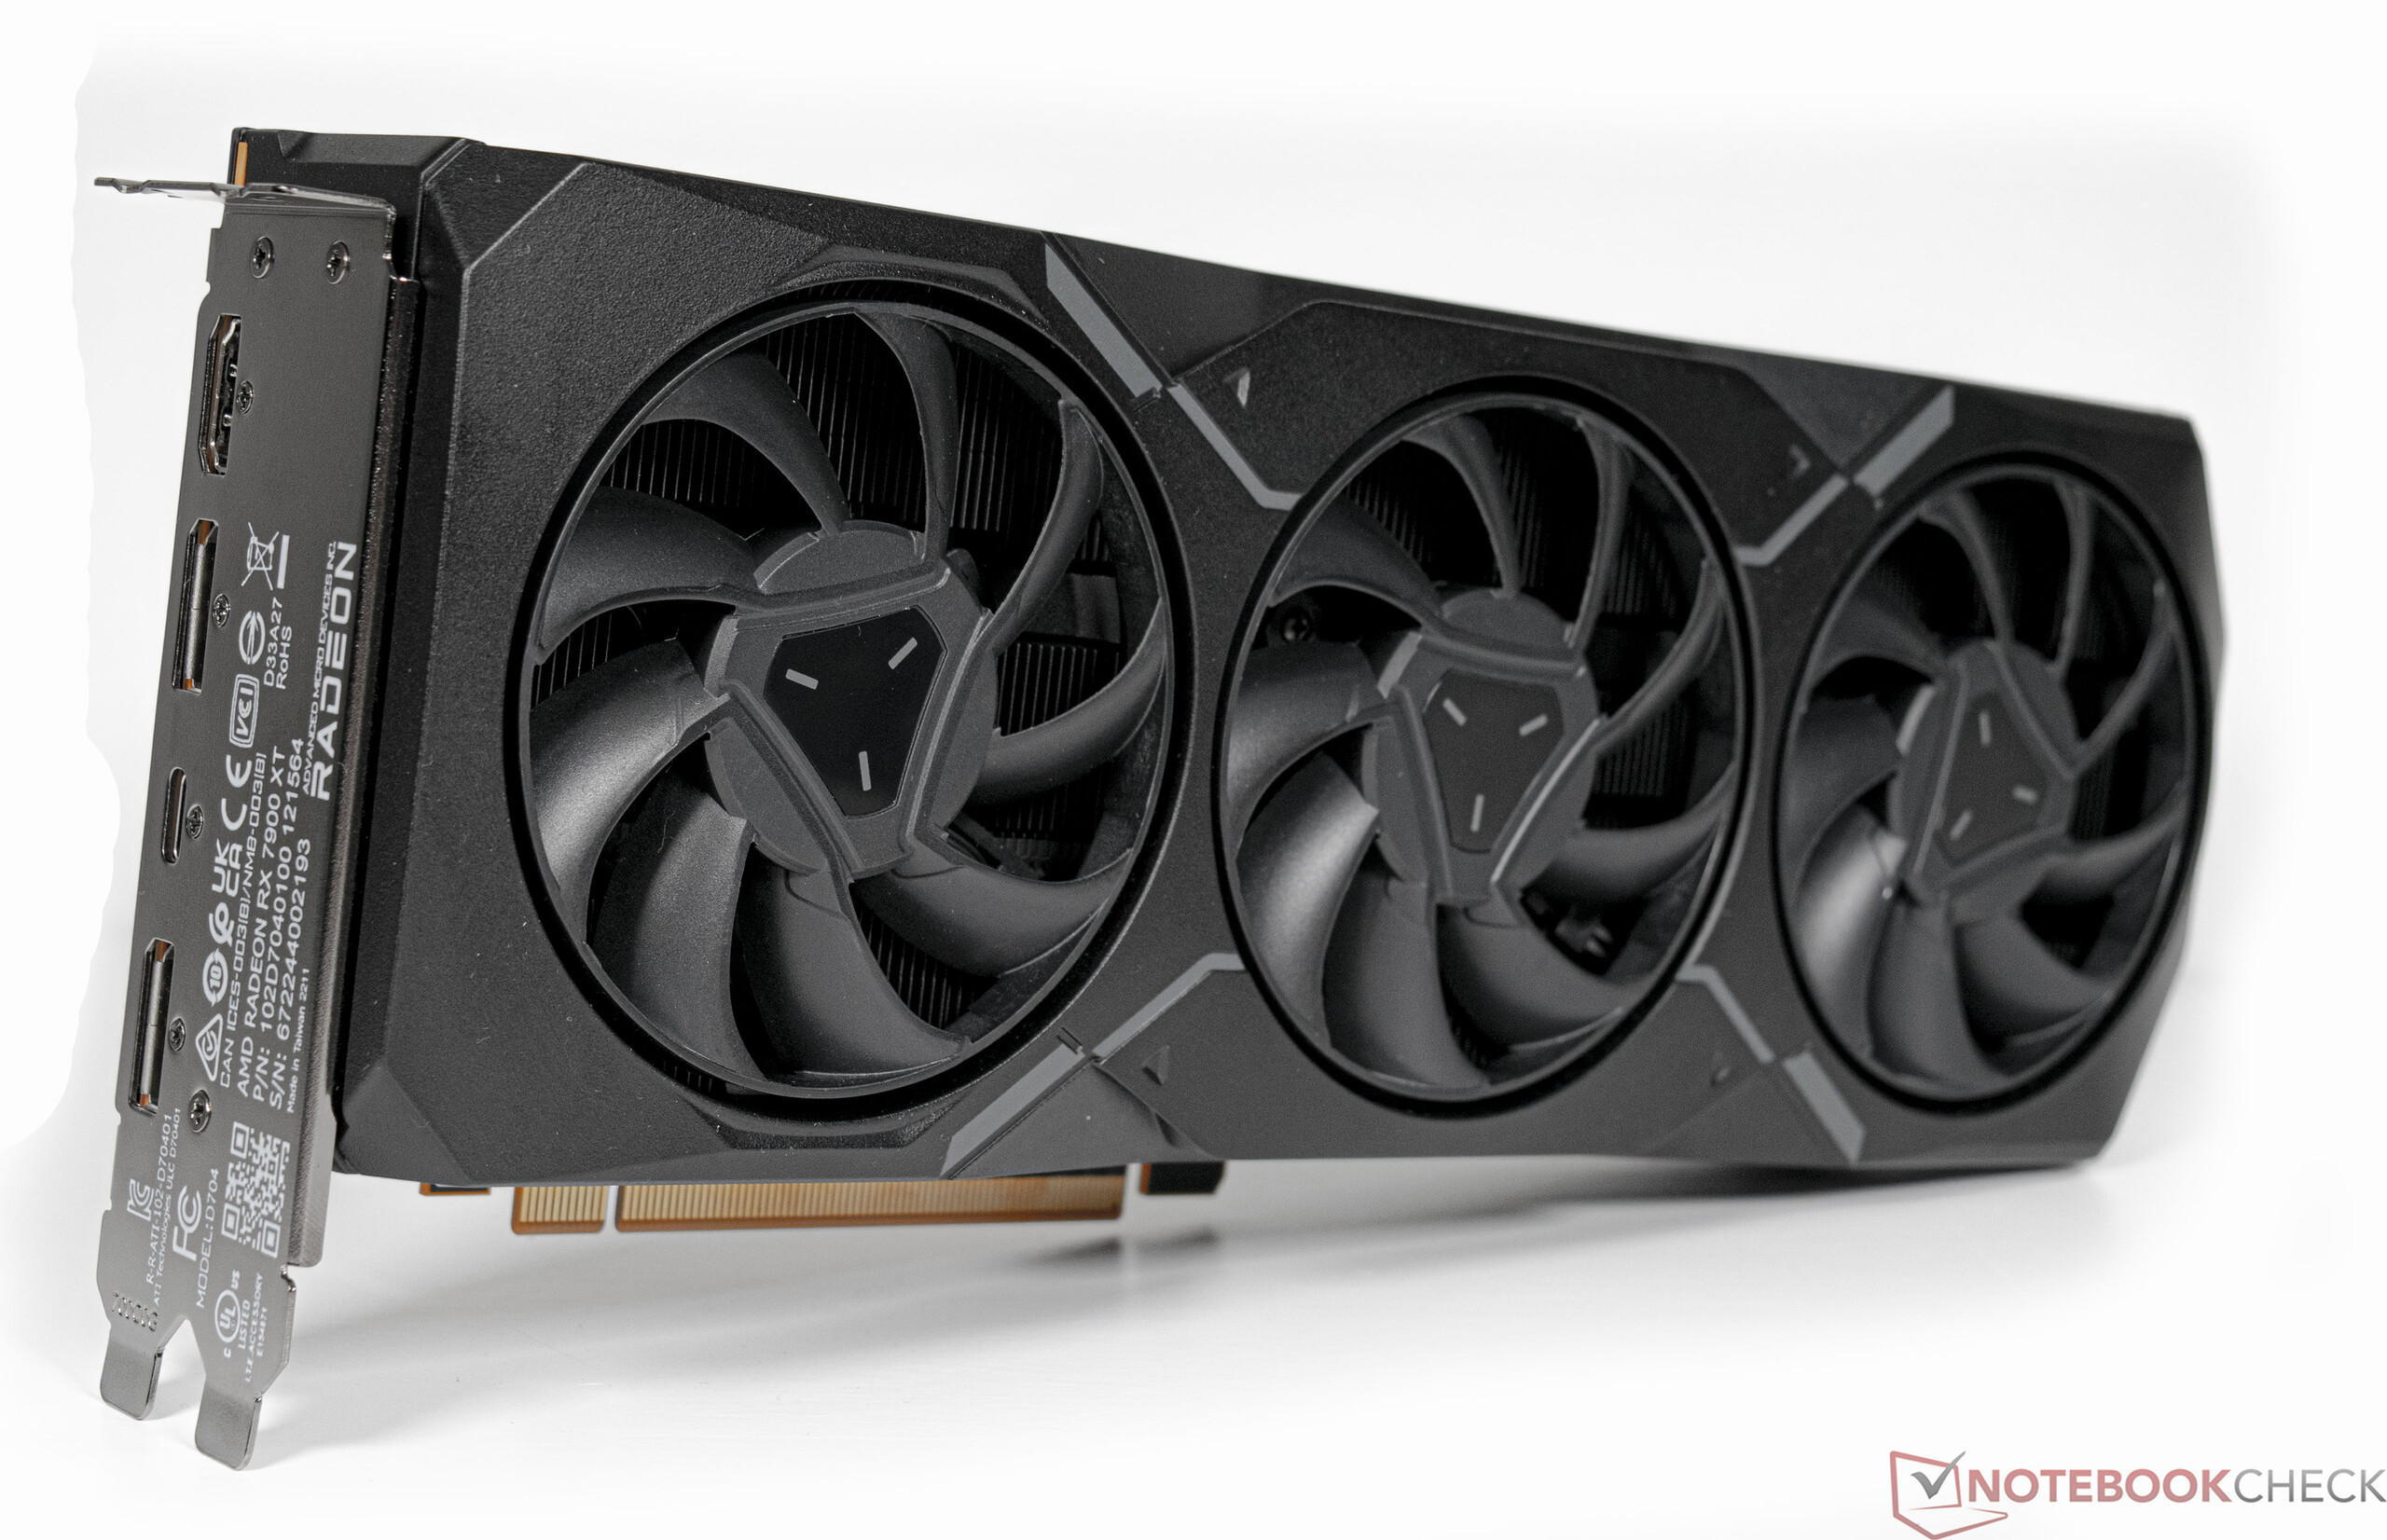
The test samples here are reference models from AMD. Both the cards are equipped with a 2.5-slot cooler, which uses three axial fans. However, unlike the RTX 4090 and RTX 4080 Founders Edition cards, the cooling unit differs between the two RDNA 3 cards.
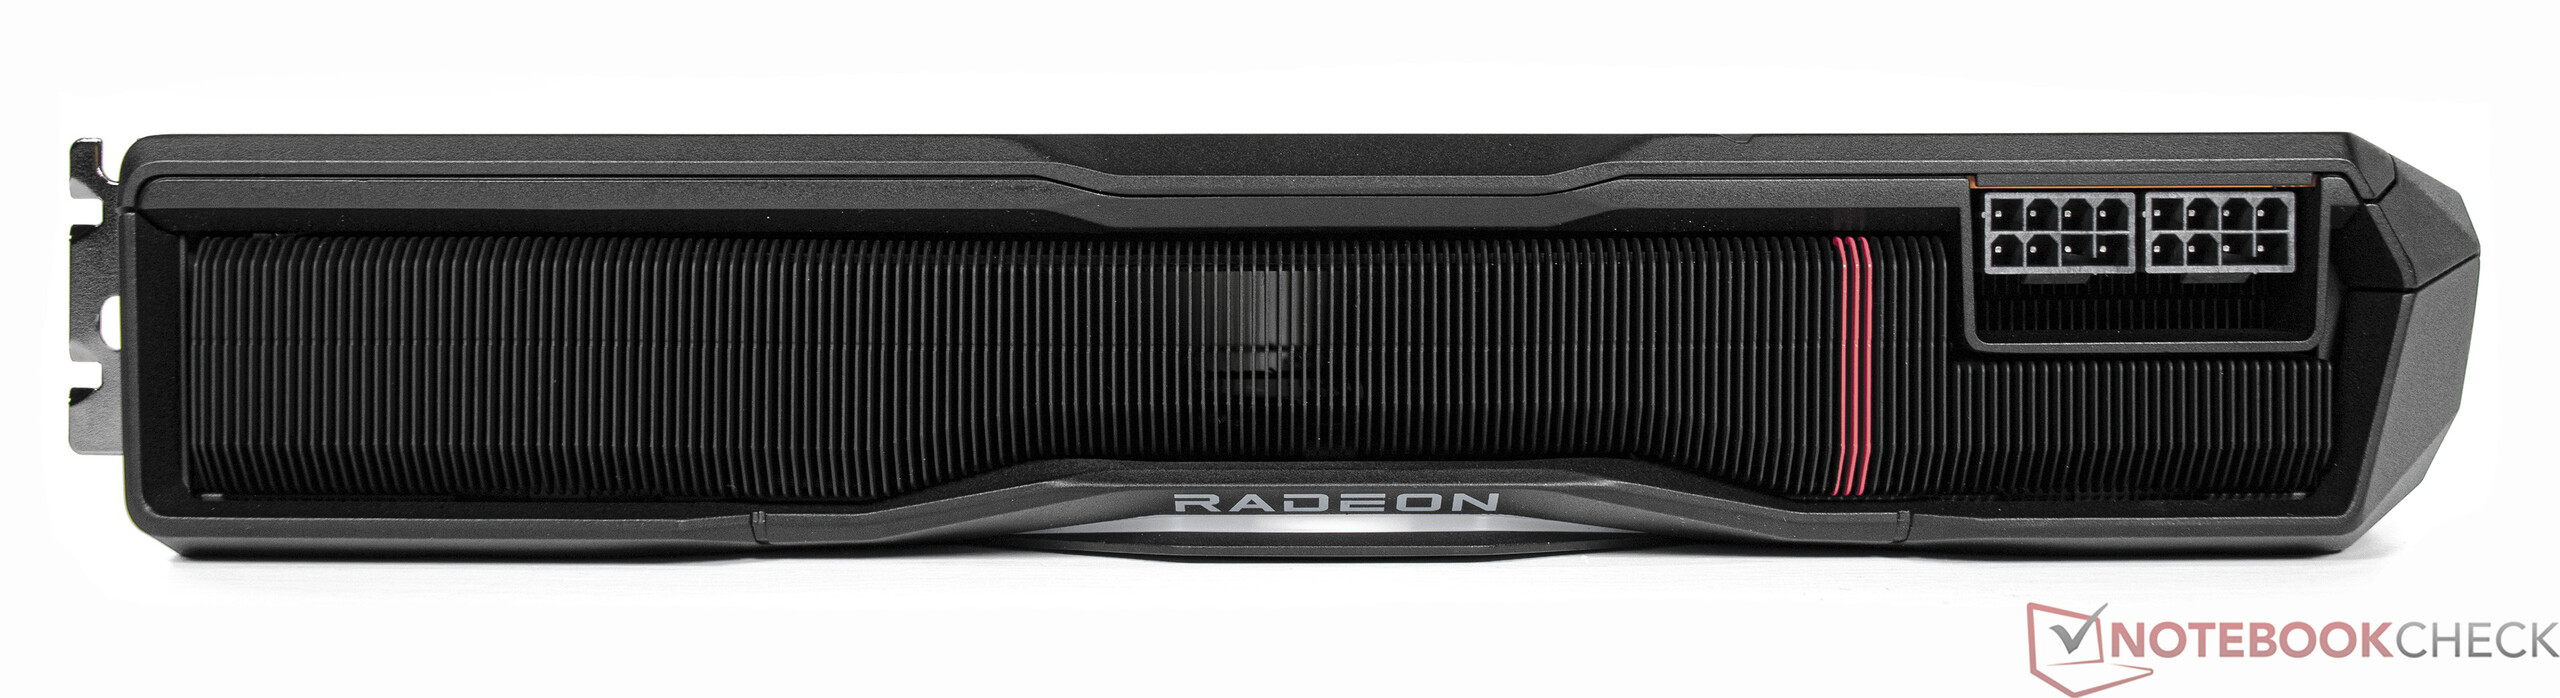
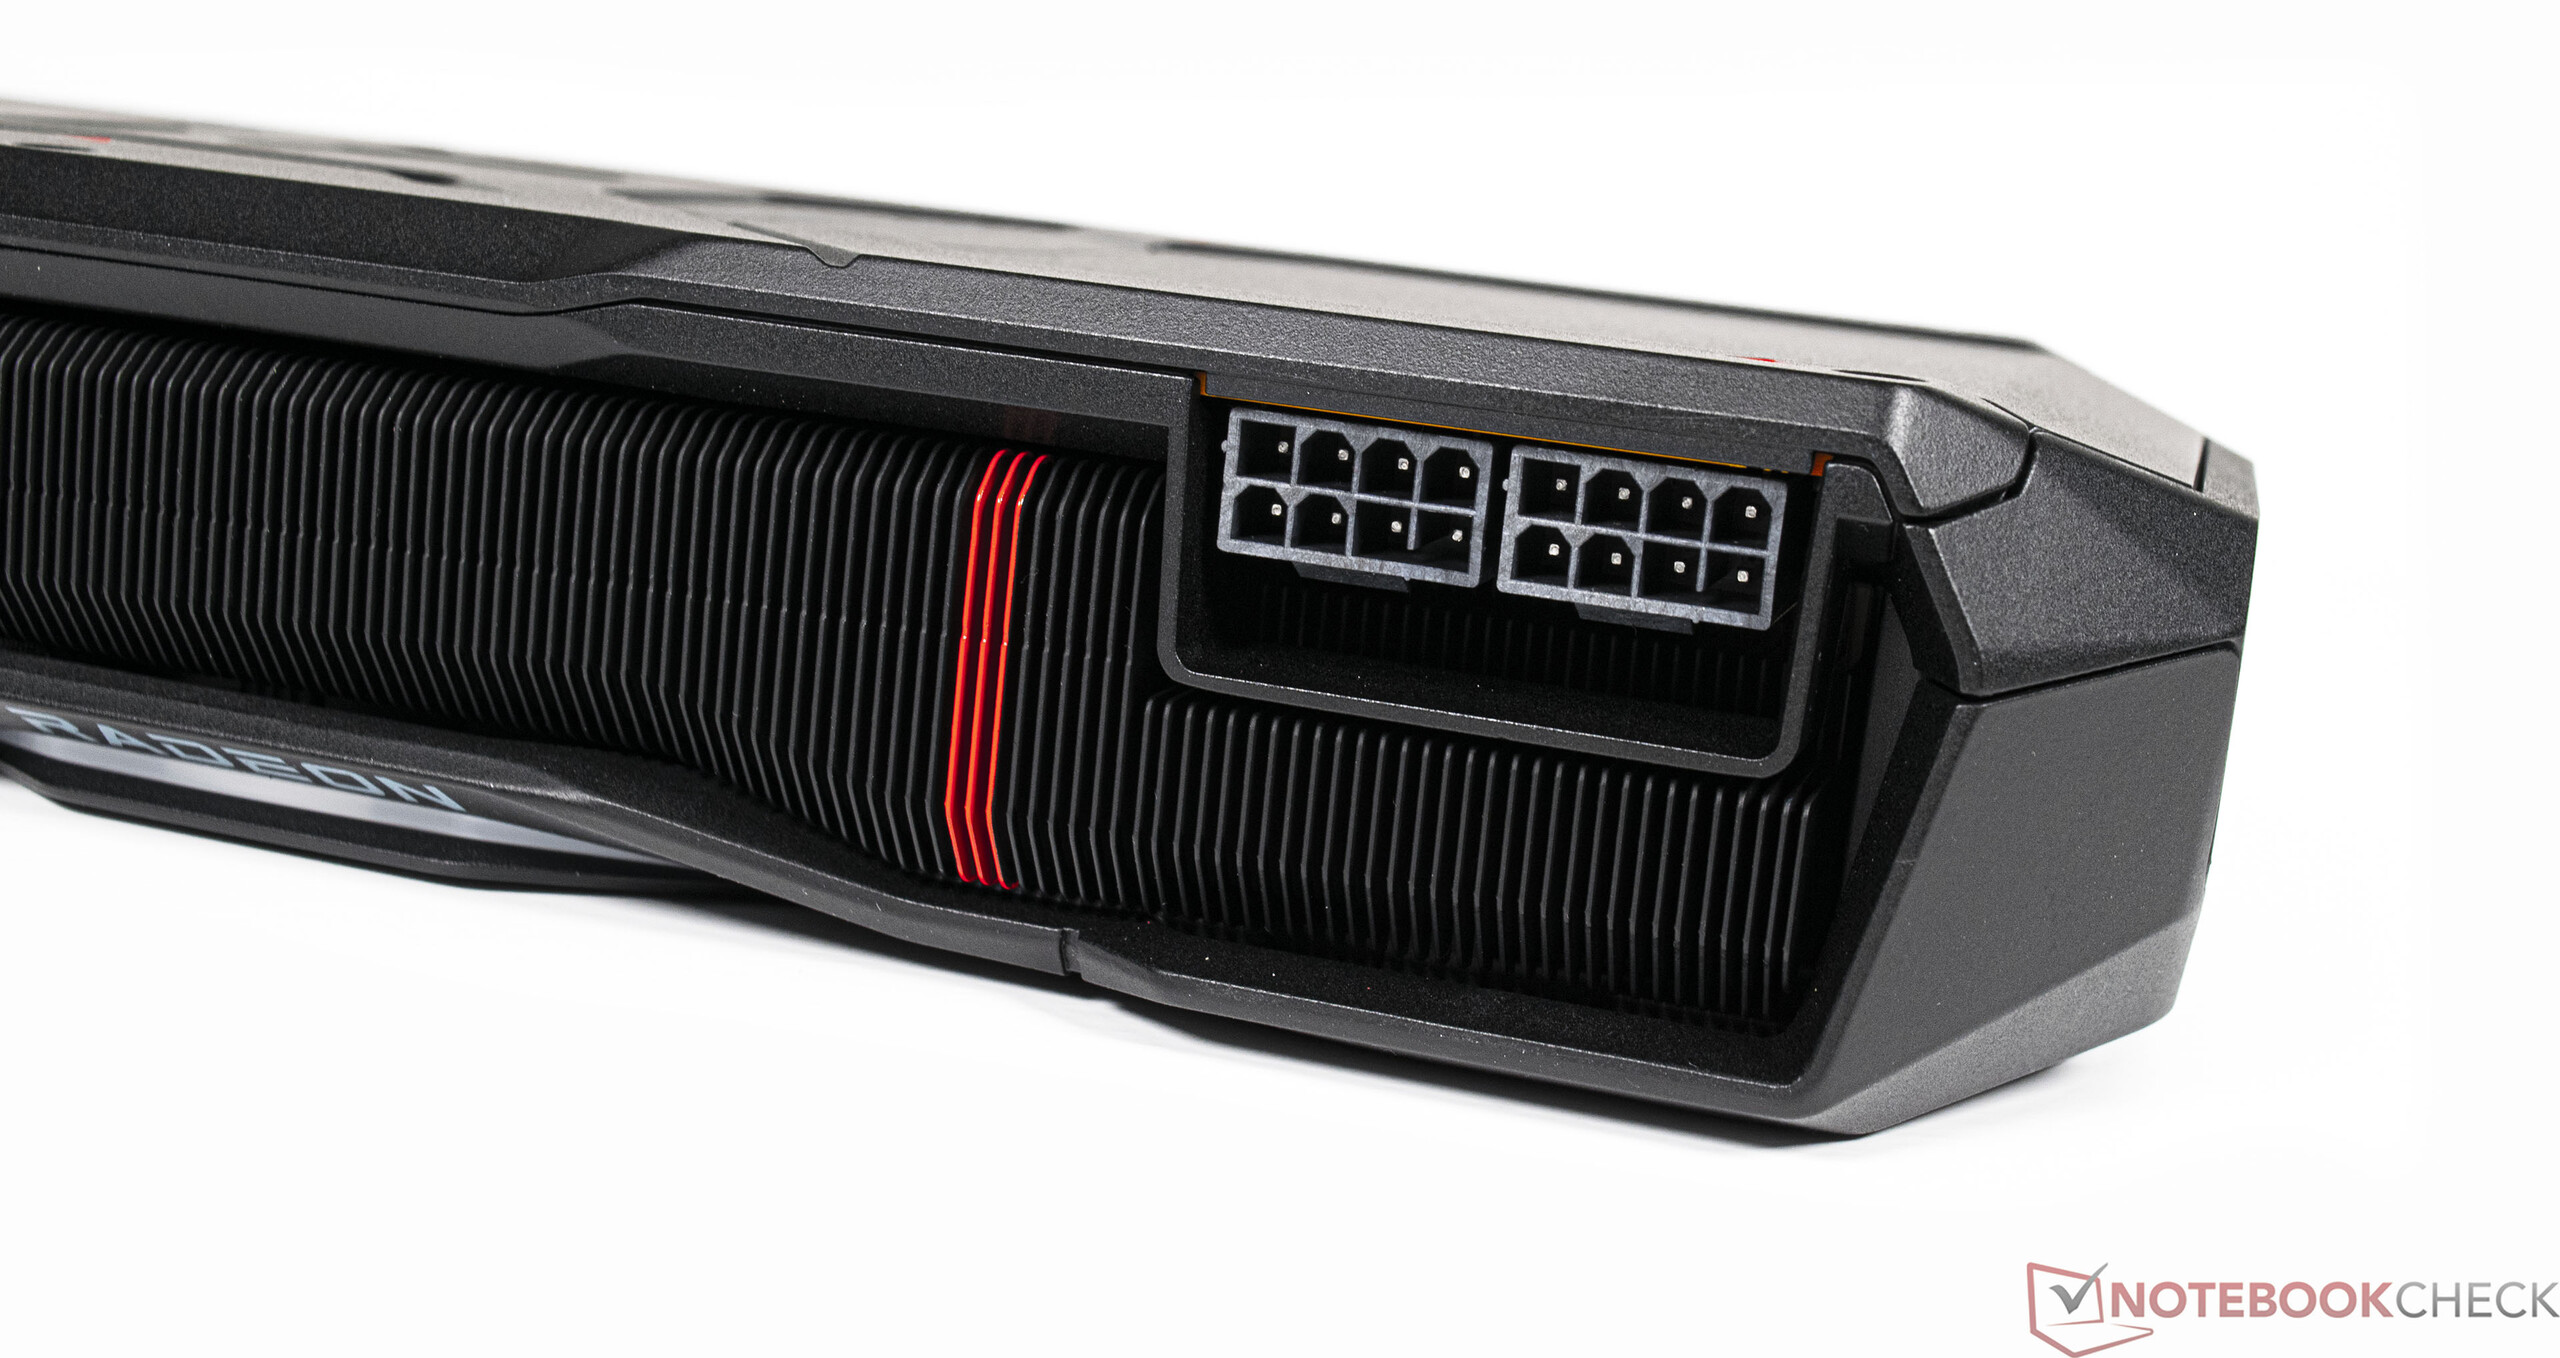
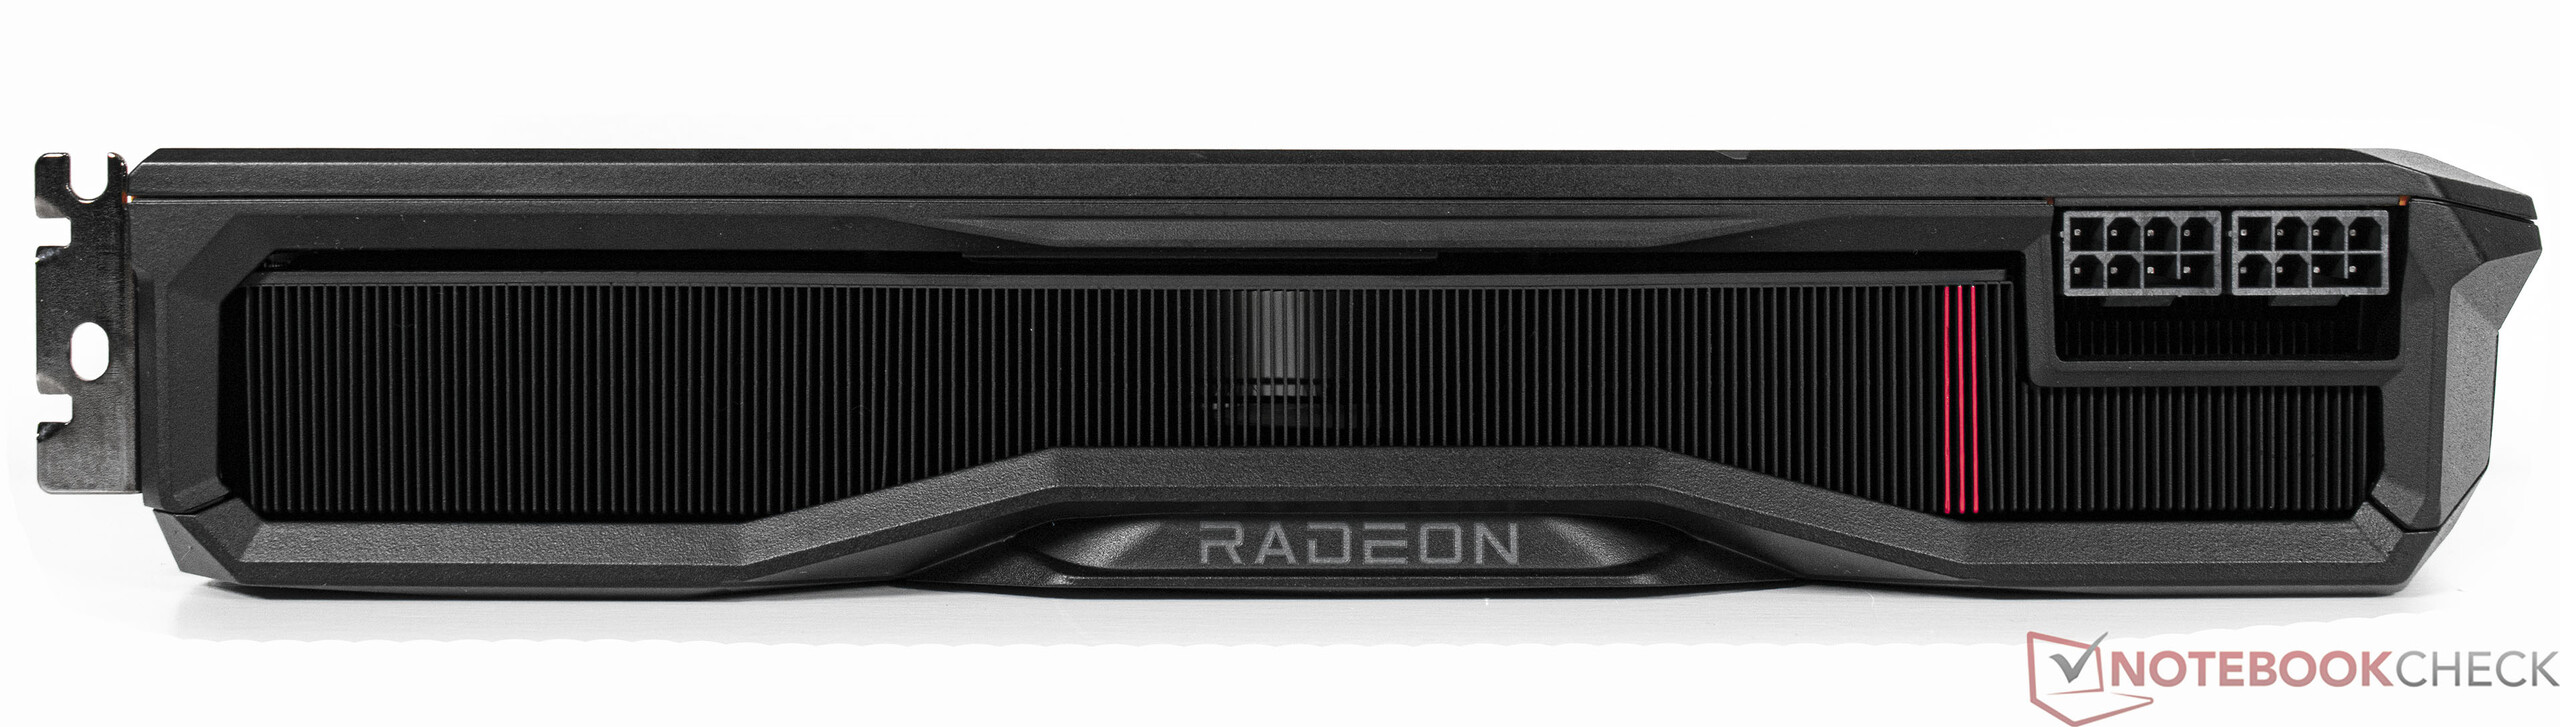
The new graphics cards are also significantly smaller than the RTX 4090, so there should be fewer problems accommodating them in compact PCs. Many users will probably breathe a sigh of relief when it comes to power supply connections — AMD sticks to the tried and tested 6+2 pin connectors on both models.

Comparison of the Radeon RX 7900 series with other AMD GPUs
| Specifications | Radeon RX 7900 XTX | Radeon RX 7900 XT | Radeon RX 6950 XT | Radeon RX 6900 XT | Radeon RX 6800 XT | Radeon RX 6800 |
| GPU | Navi 31 XTX | Navi 31 XT | Navi 21 XTX | Navi 21 XTX | Navi 21 XT | Navi 21 XL |
| Manufacturing Process | 5/6 nm | 5/6 nm | 7 nm | 7 nm | 7 nm | 7 nm |
| Compute Units | 96 | 84 | 80 | 80 | 72 | 60 |
| Shading Units | 6.144 | 5.376 | 5.120 | 5.120 | 4.608 | 3.840 |
| Texture Mapping Units | 384 | 336 | 320 | 320 | 288 | 240 |
| Ray Accelerators | 96 | 84 | 80 | 80 | 72 | 60 |
| Base Clock | 2.270 MHz | 2.000 MHz | 1.925 MHz | 1.825 MHz | 1.825 MHz | 1.700 MHz |
| Game Clock | 2.300 MHz | 2.000 MHz | 2.116 MHz | 2.015 MHz | 2.015 MHz | 1.815 MHz |
| Boost Clock | 2.500 MHz | 2.400 MHz | 2.324 MHz | 2.250 MHz | 2.250 MHz | 2.105 MHz |
| Infinity Cache | 96 MB | 80 MB | 128 MB | 128 MB | 128 MB | 128 MB |
| Memory Bus Width | 384-bit | 320-bit | 256-bit | 256-bit | 256-bit | 256-bit |
| Memory Bandwidth | 960 GB/s | 800 GB/s | 576 GB/s | 512 GB/s | 512 GB/s | 512 GB/s |
| Memory Size | 24 GB GDDR6 | 20 GB GDDR6 | 16 GB GDDR6 | 16 GB GDDR6 | 16 GB GDDR6 | 16 GB GDDR6 |
| TBP | 355 W | 315 W | 335 W | 300 W | 300 W | 250 W |
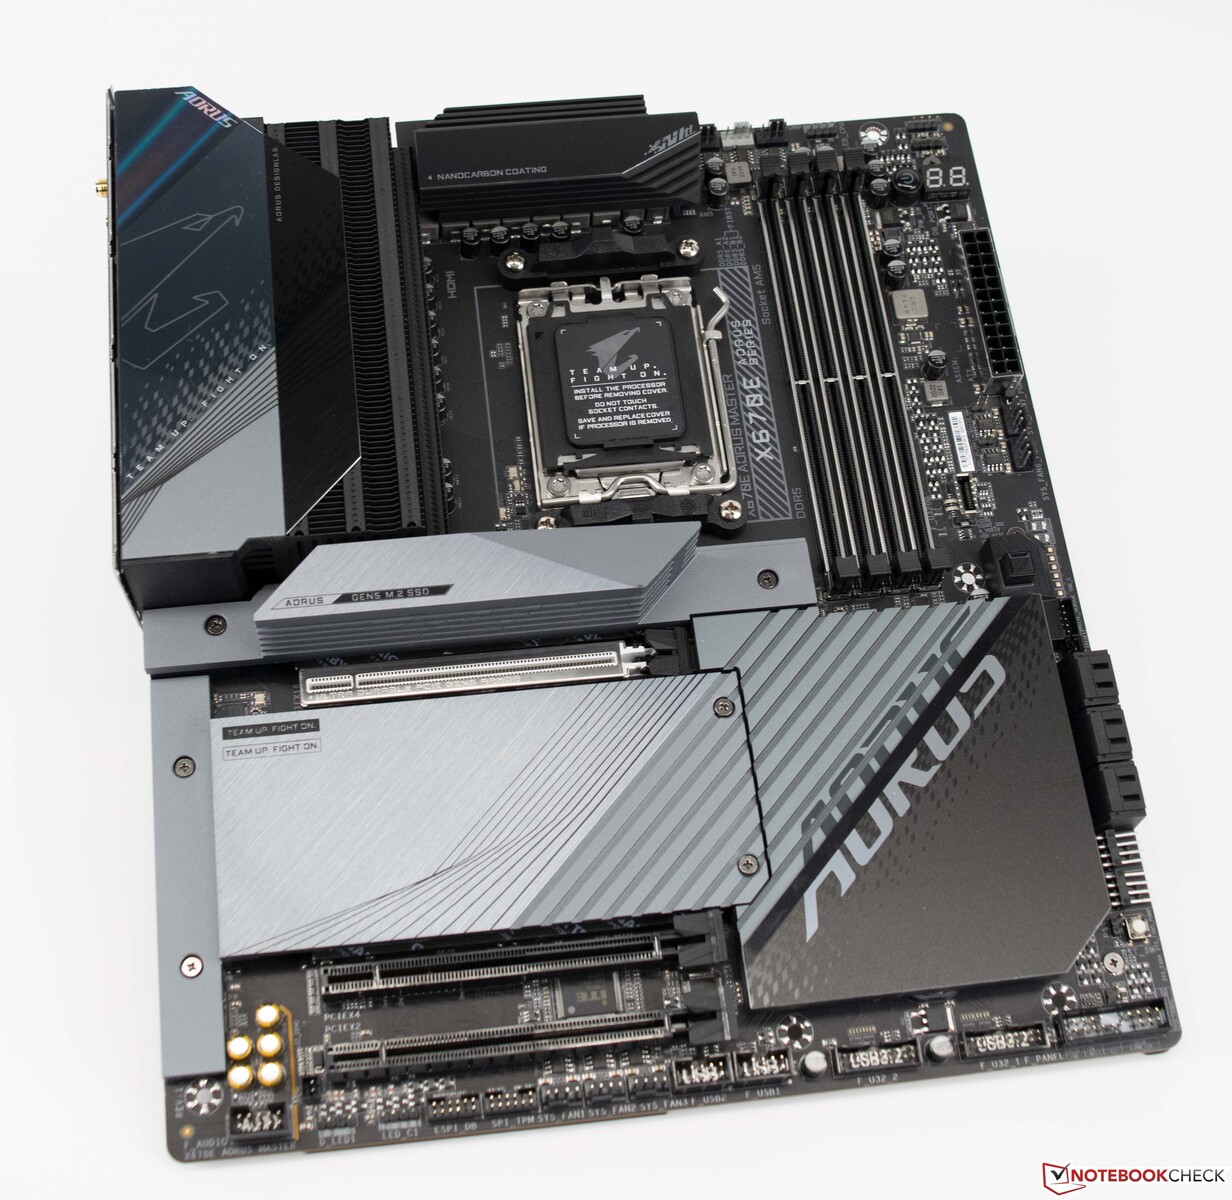
The test bench: RDNA 3 in combination with the AMD Ryzen 9 7950X
An AMD Ryzen 9 7950X platform based on the Gigabyte X670E Aorus Master serves as our test system for this review. The CPU is ably cooled by the Alphacool Eisbear Aurora 360 AiO cooler. The 32 GB DDR5-6000 RAM comes from G.Skill and is operated with the appropriate EXPO profile. We used the Gigabyte M32U as the monitor of choice.
The complete system specs include:
- Lian-Li O11 Dynamic case
- AMD Ryzen 9 7950X
- Gigabyte X670E Aorus Master, BIOS: F8a
- Alphacool Eisbear 360 AiO cooler
- Corsair RM 1000x PSU
- G.Skill Trident Z5 Neo DDR5-6000 2x 16 GB, EXPO (DDR5-6000 CL30-38-38-96)
- Corsair MP600 2 TB
- Crucial MX500 2 TB
- Microsoft Windows 11 Professional 64-Bit (Version 22H2)
Test conditions
A beta Adrenalin Edition driver version 22.40.00.57 was made available to us for testing the AMD Radeon RX 7900 XTX and the RX 7900 XT. All gaming tests were performed in the native resolution. Upscaling features like FSR were not used.
Synthetic benchmarks: RX 7900 XTX sits between the RTX 4090 and RTX 4080
In synthetic tests, the Radeon RX 7900 XTX places itself just ahead of the RTX 4080, but Nvidia's flagship RTX 4090 remains unmatched with a 21% lead. Compared to the AMD Radeon RX 6950 XT, we see a 35% increase in cumulative performance. AMD's second-fastest model is at a respectable 10% distance behind the RTX 4080. The performance gain relative to the previous top-end model from Team Red is still significant at 16%.
We do notice discrepancies with the Radeon 7000 LuxMark scores. This could be due to a compute unit scaling limitation with the benchmark. Either that, or there could be an issue with the beta Adrenalin drivers not playing well here.
| Performance rating - Percent | |
| NVIDIA GeForce RTX 4090 | |
| AMD Radeon RX 7900 XTX | |
| NVIDIA GeForce RTX 4080 | |
| AMD Radeon RX 7900 XT | |
| NVIDIA GeForce RTX 3090 Ti | |
| NVIDIA GeForce RTX 3090 | |
| AMD Radeon RX 6950 XT | |
| AMD Radeon RX 6900 XT | |
| AMD Radeon RX 6800 XT | |
| 3DMark 11 - 1280x720 Performance GPU | |
| NVIDIA GeForce RTX 4090 | |
| NVIDIA GeForce RTX 4080 | |
| AMD Radeon RX 7900 XTX | |
| AMD Radeon RX 7900 XT | |
| AMD Radeon RX 6950 XT | |
| NVIDIA GeForce RTX 3090 Ti | |
| NVIDIA GeForce RTX 3090 | |
| AMD Radeon RX 6900 XT | |
| AMD Radeon RX 6800 XT | |
| 3DMark | |
| 1920x1080 Fire Strike Graphics | |
| AMD Radeon RX 7900 XTX | |
| NVIDIA GeForce RTX 4090 | |
| AMD Radeon RX 7900 XT | |
| AMD Radeon RX 6950 XT | |
| NVIDIA GeForce RTX 4080 | |
| NVIDIA GeForce RTX 3090 Ti | |
| AMD Radeon RX 6900 XT | |
| AMD Radeon RX 6800 XT | |
| NVIDIA GeForce RTX 3090 | |
| 3840x2160 Fire Strike Ultra Graphics | |
| NVIDIA GeForce RTX 4090 | |
| AMD Radeon RX 7900 XTX | |
| NVIDIA GeForce RTX 4080 | |
| AMD Radeon RX 7900 XT | |
| AMD Radeon RX 6950 XT | |
| NVIDIA GeForce RTX 3090 Ti | |
| AMD Radeon RX 6900 XT | |
| AMD Radeon RX 6800 XT | |
| NVIDIA GeForce RTX 3090 | |
| Fire Strike Extreme Graphics | |
| NVIDIA GeForce RTX 4090 | |
| AMD Radeon RX 7900 XTX | |
| AMD Radeon RX 7900 XT | |
| NVIDIA GeForce RTX 4080 | |
| AMD Radeon RX 6950 XT | |
| NVIDIA GeForce RTX 3090 Ti | |
| AMD Radeon RX 6900 XT | |
| AMD Radeon RX 6800 XT | |
| NVIDIA GeForce RTX 3090 | |
| 2560x1440 Time Spy Graphics | |
| NVIDIA GeForce RTX 4090 | |
| AMD Radeon RX 7900 XTX | |
| NVIDIA GeForce RTX 4080 | |
| AMD Radeon RX 7900 XT | |
| AMD Radeon RX 6950 XT | |
| NVIDIA GeForce RTX 3090 Ti | |
| NVIDIA GeForce RTX 3090 | |
| AMD Radeon RX 6900 XT | |
| AMD Radeon RX 6800 XT | |
| Unigine Heaven 4.0 | |
| Extreme Preset DX11 | |
| NVIDIA GeForce RTX 4090 | |
| NVIDIA GeForce RTX 4080 | |
| AMD Radeon RX 7900 XTX | |
| AMD Radeon RX 7900 XT | |
| NVIDIA GeForce RTX 3090 | |
| NVIDIA GeForce RTX 3090 Ti | |
| AMD Radeon RX 6950 XT | |
| AMD Radeon RX 6900 XT | |
| AMD Radeon RX 6800 XT | |
| Extreme Preset OpenGL | |
| NVIDIA GeForce RTX 4090 | |
| AMD Radeon RX 7900 XTX | |
| NVIDIA GeForce RTX 4080 | |
| AMD Radeon RX 7900 XT | |
| NVIDIA GeForce RTX 3090 Ti | |
| NVIDIA GeForce RTX 3090 | |
| AMD Radeon RX 6950 XT | |
| AMD Radeon RX 6900 XT | |
| AMD Radeon RX 6800 XT | |
| Unigine Valley 1.0 | |
| 1920x1080 Extreme HD DirectX AA:x8 | |
| NVIDIA GeForce RTX 4090 | |
| NVIDIA GeForce RTX 4080 | |
| AMD Radeon RX 7900 XTX | |
| NVIDIA GeForce RTX 3090 | |
| AMD Radeon RX 7900 XT | |
| AMD Radeon RX 6950 XT | |
| NVIDIA GeForce RTX 3090 Ti | |
| AMD Radeon RX 6900 XT | |
| AMD Radeon RX 6800 XT | |
| 1920x1080 Extreme HD Preset OpenGL AA:x8 | |
| NVIDIA GeForce RTX 4090 | |
| NVIDIA GeForce RTX 4080 | |
| AMD Radeon RX 7900 XTX | |
| AMD Radeon RX 7900 XT | |
| NVIDIA GeForce RTX 3090 | |
| NVIDIA GeForce RTX 3090 Ti | |
| AMD Radeon RX 6950 XT | |
| AMD Radeon RX 6900 XT | |
| AMD Radeon RX 6800 XT | |
| Photoshop PugetBench | |
| GPU Score | |
| AMD Radeon RX 7900 XT | |
| AMD Radeon RX 7900 XTX | |
| NVIDIA GeForce RTX 3080 Ti | |
| NVIDIA GeForce RTX 3090 | |
| AMD Radeon RX 6950 XT | |
| AMD Radeon RX 6800 XT | |
| Overall Score | |
| AMD Radeon RX 7900 XT | |
| AMD Radeon RX 7900 XTX | |
| NVIDIA GeForce RTX 3080 Ti | |
| NVIDIA GeForce RTX 3090 | |
| AMD Radeon RX 6800 XT | |
| AMD Radeon RX 6950 XT | |
| Affinity Photo 2 - Combined (Single / Multi GPU) | |
| NVIDIA GeForce RTX 3080 Ti | |
| AMD Radeon RX 7900 XTX | |
| AMD Radeon RX 7900 XT | |
| Blender | |
| v3.3 Classroom HIP/AMD | |
| AMD Radeon RX 7900 XT | |
| AMD Radeon RX 7900 XTX | |
| v3.3 Classroom CUDA | |
| NVIDIA GeForce RTX 3090 | |
| NVIDIA GeForce RTX 3080 Ti | |
* ... smaller is better
Professional applications: RDNA 3 beats driver-optimized Quadros
AMD cards have traditionally offered more performance in SPECviewperf tests compared to Nvidia's consumer offerings. The new RDNA 3 graphics cards take things a notch higher, by leaving behind even the driver-optimized Nvidia RTX A6000 and Titan RTX cards, and definitely the newer Ada GPUs.
That being said, it helps to evaluate the card's performance for your required workload. For instance, the RTX 4090 does have an edge over the RX 7900 XTX in 3D workflows such as Maya, Showcase, and 3Ds Max. Of course, those into CUDA-dependent workflows have no option but to choose Nvidia's offerings over AMD's.
| AMD Radeon RX 7900 XTX R9 7950X | AMD Radeon RX 7900 XT R9 7950X | NVIDIA GeForce RTX 4090 i9-13900K | NVIDIA GeForce RTX 3090 Ti R7 5800X3D | AMD Radeon RX 6950 XT R9 5900X | AMD Radeon RX 6900 XT R9 5950X | AMD Radeon RX 6800 XT R9 5950X | NVIDIA GeForce RTX 3090 i9-13900K | NVIDIA RTX A6000 TR Pro 3975WX | NVIDIA Titan RTX R9 7950X | Average of class | |
|---|---|---|---|---|---|---|---|---|---|---|---|
| SPECviewperf 12 | -10% | -29% | -60% | -55% | -54% | -61% | -55% | -40% | -39% | -74% | |
| 1900x1060 Solidworks (sw-03) (fps) | 360 | 342 -5% | 119 -67% | 85.7 -76% | 157 -56% | 167 -54% | 150 -58% | 106 -71% | 225 -37% | 207 -43% | 89.4 ? -75% |
| 1900x1060 Siemens NX (snx-02) (fps) | 400 | 373 -7% | 28.8 -93% | 15.6 -96% | 49.4 -88% | 47.7 -88% | 45.07 -89% | 17.1 -96% | 351 -12% | 283 -29% | 60.9 ? -85% |
| 1900x1060 Showcase (showcase-01) (fps) | 322 | 278 -14% | 410 27% | 265 -18% | 308 -4% | 241 -25% | 223 -31% | 263 -18% | 255 -21% | 197 -39% | 103.7 ? -68% |
| 1900x1060 Medical (medical-01) (fps) | 347 | 288 -17% | 288 -17% | 87.1 -75% | 58.3 -83% | 88.4 -75% | 77.3 -78% | 90 -74% | 159 -54% | 101 -71% | 59.2 ? -83% |
| 1900x1060 Maya (maya-04) (fps) | 367 | 347 -5% | 324 -12% | 197 -46% | 90.7 -75% | 151 -59% | 118 -68% | 306 -17% | 144 -61% | 260 -29% | 117.7 ? -68% |
| 1900x1060 Energy (energy-01) (fps) | 85.2 | 72.4 -15% | 82.6 -3% | 27.6 -68% | 23 -73% | 30.8 -64% | 28.39 -67% | 26 -69% | 39.8 -53% | 28.8 -66% | 16.9 ? -80% |
| 1900x1060 Creo (creo-01) (fps) | 187 | 176 -6% | 122 -35% | 76.4 -59% | 115 -39% | 127 -32% | 119 -36% | 101 -46% | 136 -27% | 197 5% | 66.6 ? -64% |
| 1900x1060 Catia (catia-04) (fps) | 536 | 481 -10% | 274 -49% | 150 -72% | 199 -63% | 292 -46% | 238 -56% | 177 -67% | 229 -57% | 332 -38% | 113.6 ? -79% |
| 1900x1060 3ds Max (3dsmax-05) (fps) | 553 | 502 -9% | 473 -14% | 371 -33% | 484 -12% | 318 -42% | 167 -70% | 369 -33% | 336 -39% | 315 -43% | 206 ? -63% |
| SPECviewperf 13 | -11% | -26% | -54% | -43% | -49% | -54% | -51% | -35% | -43% | -68% | |
| Solidworks (sw-04) (fps) | 323 | 307 -5% | 190 -41% | 118 -63% | 210 -35% | 214 -34% | 193 -40% | 154 -52% | 192 -41% | 218 -33% | 124.1 ? -62% |
| Siemens NX (snx-03) (fps) | 725 | 675 -7% | 51.4 -93% | 28 -96% | 89.7 -88% | 85.8 -88% | 81.4 -89% | 30.7 -96% | 638 -12% | 512 -29% | 136.6 ? -81% |
| Showcase (showcase-02) (fps) | 323 | 279 -14% | 412 28% | 265 -18% | 312 -3% | 241 -25% | 232 -28% | 262 -19% | 255 -21% | 198 -39% | 126.2 ? -61% |
| Medical (medical-02) (fps) | 263 | 237 -10% | 182 -31% | 113 -57% | 157 -40% | 148 -44% | 130 -51% | 107 -59% | 184 -30% | 92 -65% | 88.4 ? -66% |
| Maya (maya-05) (fps) | 735 | 670 -9% | 838 14% | 493 -33% | 372 -49% | 395 -46% | 348 -53% | 580 -21% | 415 -44% | 499 -32% | 278 ? -62% |
| Energy (energy-02) (fps) | 187 | 147 -21% | 119 -36% | 48.4 -74% | 60.3 -68% | 60.6 -68% | 58.4 -69% | 45.1 -76% | 132 -29% | 51.8 -72% | 39.7 ? -79% |
| Creo (creo-02) (fps) | 613 | 567 -8% | 580 -5% | 353 -42% | 323 -47% | 292 -52% | 276 -55% | 397 -35% | 366 -40% | 386 -37% | 216 ? -65% |
| Catia (catia-05) (fps) | 825 | 728 -12% | 406 -51% | 230 -72% | 450 -45% | 468 -43% | 412 -50% | 252 -69% | 371 -55% | 534 -35% | 211 ? -74% |
| 3ds Max (3dsmax-06) (fps) | 564 | 506 -10% | 474 -16% | 373 -34% | 483 -14% | 317 -44% | 284 -50% | 369 -35% | 338 -40% | 321 -43% | 196.9 ? -65% |
| SPECviewperf 2020 | -13% | -27% | -55% | -52% | -59% | -58% | -45% | -32% | -37% | -61% | |
| 3840x2160 Solidworks (solidworks-05) (fps) | 305 | 197 | 125 | 112 | 108 | 192 | 169 | 158 | 117.6 ? | ||
| 3840x2160 Siemens NX (snx-04) (fps) | 514 | 476 -7% | 44 -91% | 23.7 -95% | 88.6 -83% | 85 -83% | 81.7 -84% | 25.6 -95% | 481 -6% | 375 -27% | 88.6 ? -83% |
| 3840x2160 Medical (medical-03) (fps) | 62.3 | 53.9 -13% | 39.3 -37% | 22.2 -64% | 34.4 -45% | 30.4 -51% | 27.84 -55% | 20.3 -67% | 37.9 -39% | 16.5 -74% | 24 ? -61% |
| 3840x2160 Maya (maya-06) (fps) | 481 | 401 -17% | 508 6% | 353 -27% | 296 -38% | 266 -45% | 224 -53% | 356 -26% | 329 -32% | 274 -43% | 221 ? -54% |
| 3840x2160 Energy (energy-03) (fps) | 129 | 99.6 -23% | 65.3 -49% | 31.6 -76% | 47.6 -63% | 32.6 -75% | 60.8 -53% | 101 -22% | 63 -51% | 93.9 -27% | 50.1 ? -61% |
| 3840x2160 Creo (creo-03) (fps) | 187 | 173 -7% | 142 -24% | 84.5 -55% | 73.1 -61% | 65.4 -65% | 65 -65% | 118 -37% | 111 -41% | 135 -28% | 78.3 ? -58% |
| 3840x2160 CATIA (catia-06) (fps) | 127 | 113 -11% | 95.6 -25% | 58.6 -54% | 53 -58% | 44.6 -65% | 42.4 -67% | 60.4 -52% | 82.4 -35% | 90.9 -28% | 49 ? -61% |
| 3840x2160 3ds Max (3dsmax-07) (fps) | 167 | 143 -14% | 213 28% | 145 -13% | 144 -14% | 121 -28% | 114 -32% | 143 -14% | 137 -18% | 118 -29% | 85 ? -49% |
| Total Average (Program / Settings) | -11% /
-11% | -27% /
-27% | -56% /
-57% | -50% /
-50% | -54% /
-54% | -58% /
-58% | -50% /
-51% | -36% /
-36% | -40% /
-40% | -68% /
-68% |
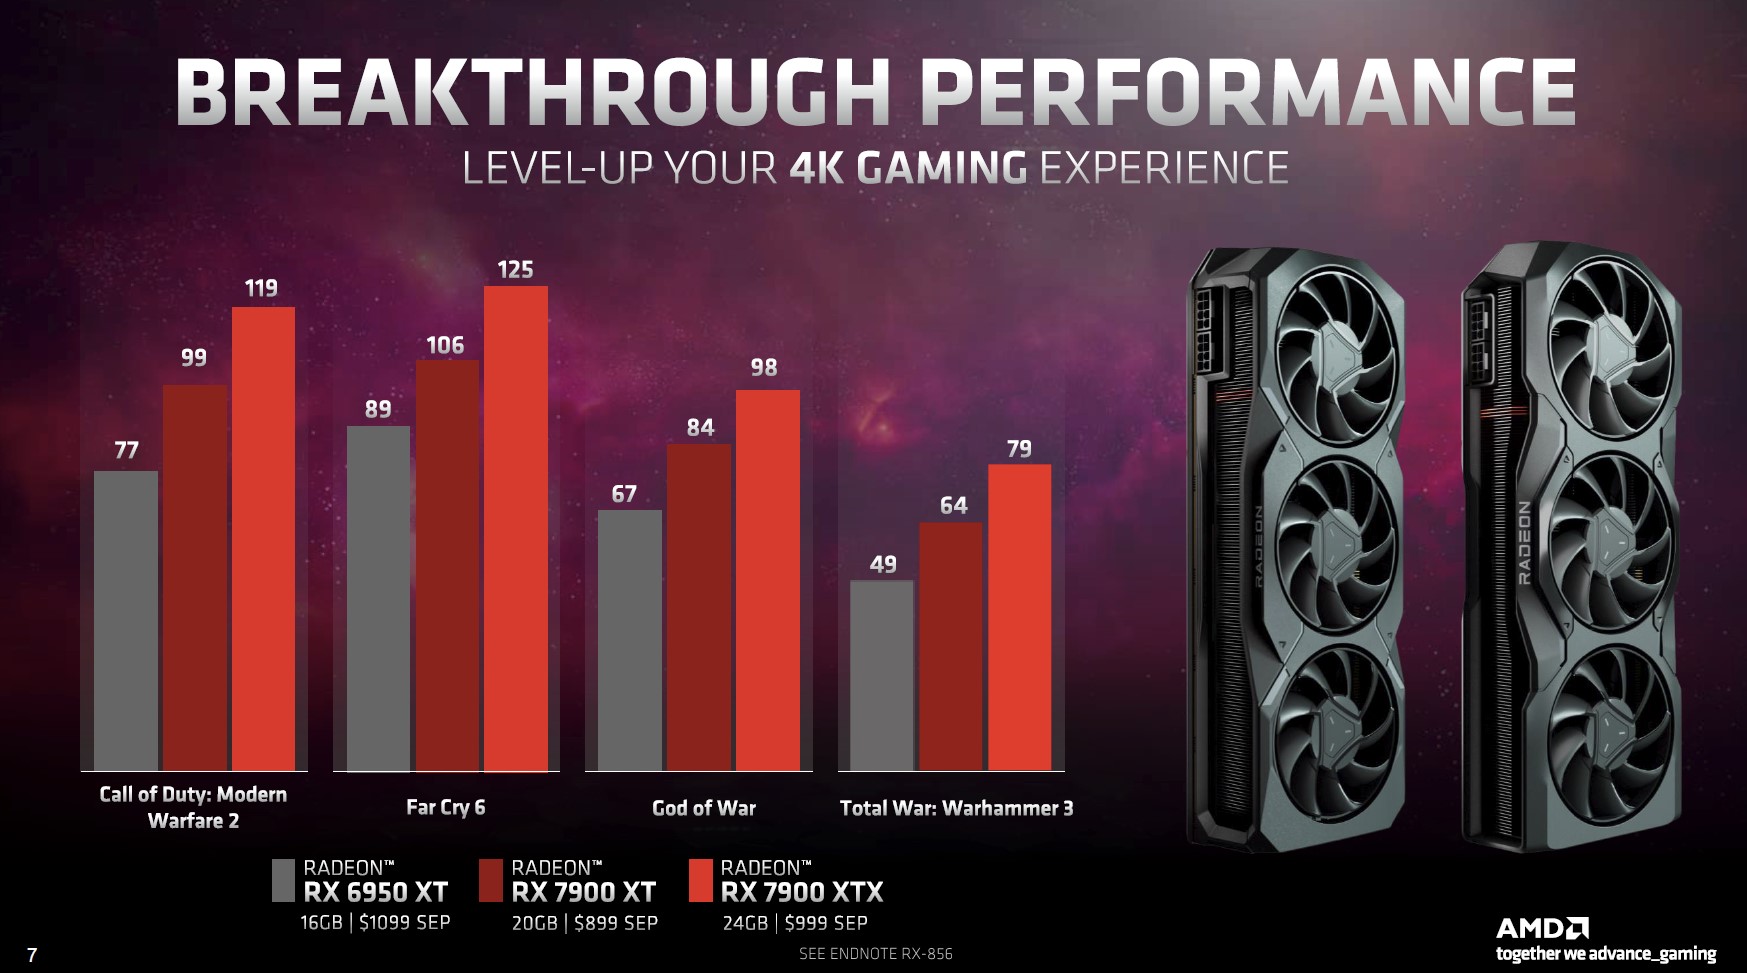
Gaming benchmarks: 4K 100 fps in most titles with scope for further gains
Let's be upfront here. AMD cannot beat Nvidia's flagship GPU when it comes to pure raster gaming performance. Depending on the game, resolution, and quality settings, the performance differences between the Ada and RDNA 3 flagships can vary significantly. But there's more to the equation.
Although Nvidia does have leads at 4K, 2K, and 1080p Ultra settings, both AMD RX 7900 cards are perfectly suitable for 4K 100 fps gaming in many titles. As a note, it should also be mentioned that the manufacturer has only provided a beta driver for the preliminary tests so far. AMD has repeatedly proven with past graphics cards that driver updates can afford perceivable performance gains down the line.
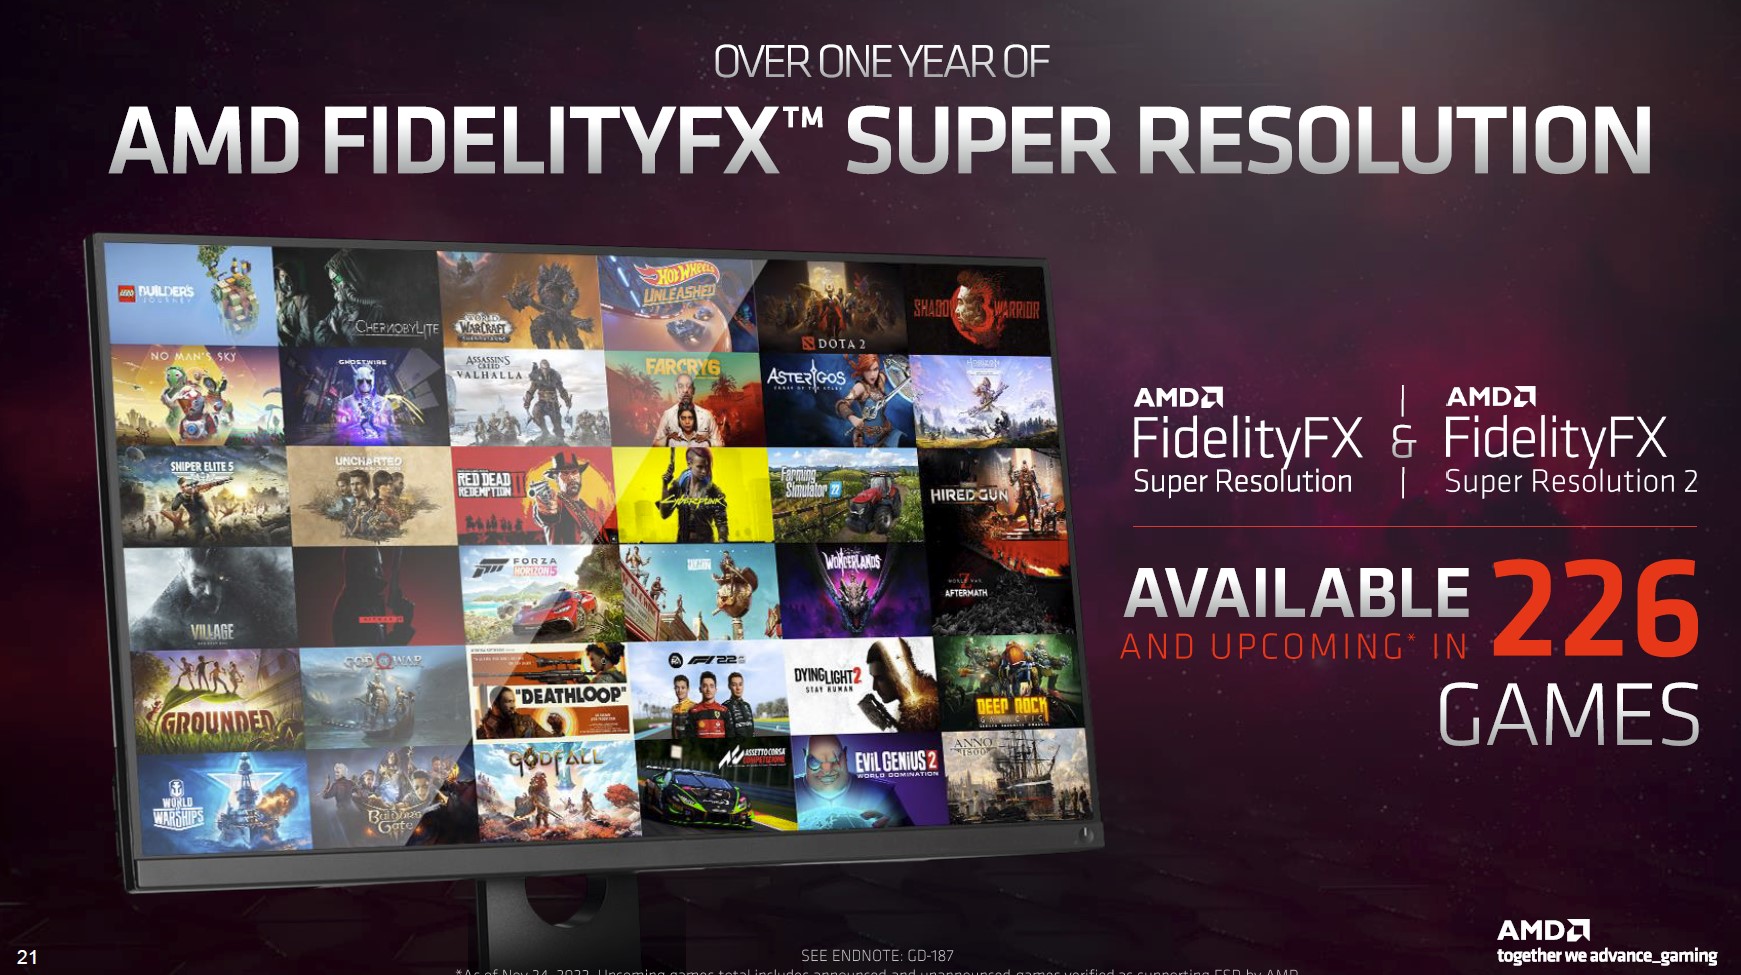
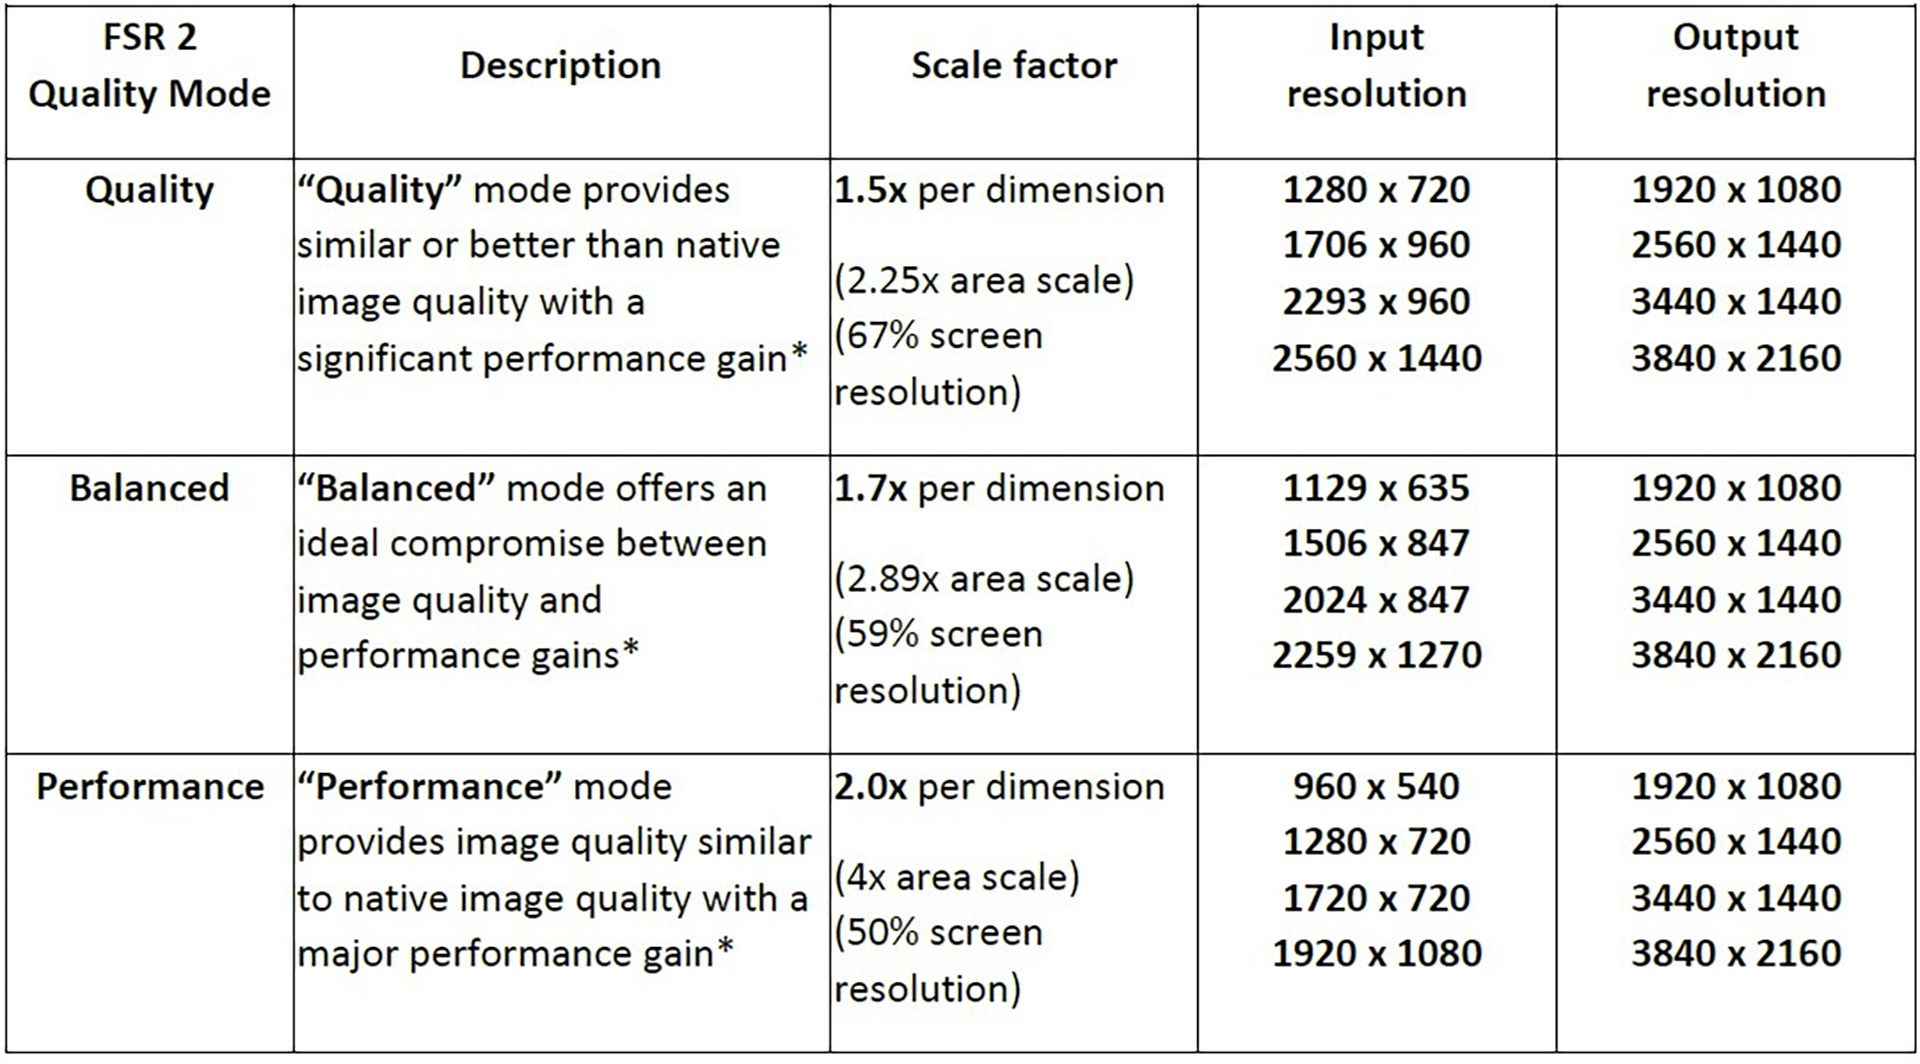
AMD's FSR 2 upscaling technology is also finding increasing acceptance among game developers, and we will also get to see FSR 3 incorporating frame generation tech in just a few months from now.
| Performance rating - Percent | |
| NVIDIA GeForce RTX 4090 | |
| NVIDIA GeForce RTX 4080 | |
| AMD Radeon RX 7900 XTX | |
| AMD Radeon RX 7900 XT | |
| NVIDIA GeForce RTX 3080 Ti | |
| NVIDIA GeForce RTX 3090 | |
| AMD Radeon RX 6950 XT | |
| AMD Radeon RX 6800 | |
| The Witcher 3 | |
| 3840x2160 High Graphics & Postprocessing (Nvidia HairWorks Off) | |
| NVIDIA GeForce RTX 4090 | |
| NVIDIA GeForce RTX 4080 | |
| AMD Radeon RX 7900 XTX | |
| AMD Radeon RX 7900 XT | |
| NVIDIA GeForce RTX 3080 Ti | |
| NVIDIA GeForce RTX 3090 | |
| AMD Radeon RX 6950 XT | |
| AMD Radeon RX 6800 | |
| 1920x1080 Ultra Graphics & Postprocessing (HBAO+) | |
| NVIDIA GeForce RTX 4090 | |
| AMD Radeon RX 7900 XTX | |
| AMD Radeon RX 7900 XT | |
| NVIDIA GeForce RTX 4080 | |
| AMD Radeon RX 6950 XT | |
| NVIDIA GeForce RTX 3080 Ti | |
| NVIDIA GeForce RTX 3090 | |
| AMD Radeon RX 6800 | |
| Metro Exodus | |
| 3840x2160 Ultra Quality AF:16x | |
| NVIDIA GeForce RTX 4090 | |
| NVIDIA GeForce RTX 4080 | |
| AMD Radeon RX 7900 XTX | |
| AMD Radeon RX 7900 XT | |
| NVIDIA GeForce RTX 3080 Ti | |
| AMD Radeon RX 6950 XT | |
| NVIDIA GeForce RTX 3090 | |
| AMD Radeon RX 6800 | |
| 2560x1440 Ultra Quality AF:16x | |
| NVIDIA GeForce RTX 4090 | |
| NVIDIA GeForce RTX 4080 | |
| AMD Radeon RX 7900 XTX | |
| AMD Radeon RX 7900 XT | |
| NVIDIA GeForce RTX 3080 Ti | |
| AMD Radeon RX 6950 XT | |
| NVIDIA GeForce RTX 3090 | |
| AMD Radeon RX 6800 | |
| 1920x1080 Ultra Quality AF:16x | |
| NVIDIA GeForce RTX 4090 | |
| AMD Radeon RX 7900 XTX | |
| NVIDIA GeForce RTX 4080 | |
| AMD Radeon RX 7900 XT | |
| NVIDIA GeForce RTX 3080 Ti | |
| AMD Radeon RX 6950 XT | |
| NVIDIA GeForce RTX 3090 | |
| AMD Radeon RX 6800 | |
| Far Cry 5 | |
| 3840x2160 Ultra Preset AA:T | |
| NVIDIA GeForce RTX 4090 | |
| AMD Radeon RX 7900 XTX | |
| NVIDIA GeForce RTX 4080 | |
| AMD Radeon RX 7900 XT | |
| AMD Radeon RX 6950 XT | |
| NVIDIA GeForce RTX 3080 Ti | |
| NVIDIA GeForce RTX 3090 | |
| AMD Radeon RX 6800 | |
| 2560x1440 Ultra Preset AA:T | |
| NVIDIA GeForce RTX 4080 | |
| NVIDIA GeForce RTX 4090 | |
| NVIDIA GeForce RTX 3080 Ti | |
| AMD Radeon RX 7900 XTX | |
| AMD Radeon RX 7900 XT | |
| NVIDIA GeForce RTX 3090 | |
| AMD Radeon RX 6800 | |
| AMD Radeon RX 6950 XT | |
| 1920x1080 Ultra Preset AA:T | |
| NVIDIA GeForce RTX 4080 | |
| NVIDIA GeForce RTX 4090 | |
| NVIDIA GeForce RTX 3080 Ti | |
| AMD Radeon RX 6800 | |
| NVIDIA GeForce RTX 3090 | |
| AMD Radeon RX 7900 XTX | |
| AMD Radeon RX 7900 XT | |
| AMD Radeon RX 6950 XT | |
| Far Cry 6 | |
| 3840x2160 Ultra Graphics Quality + HD Textures AA:T | |
| NVIDIA GeForce RTX 4090 | |
| AMD Radeon RX 7900 XTX | |
| NVIDIA GeForce RTX 4080 | |
| AMD Radeon RX 7900 XT | |
| AMD Radeon RX 6950 XT | |
| NVIDIA GeForce RTX 3080 Ti | |
| NVIDIA GeForce RTX 3090 | |
| AMD Radeon RX 6800 | |
| 2560x1440 Ultra Graphics Quality + HD Textures AA:T | |
| NVIDIA GeForce RTX 4080 | |
| AMD Radeon RX 7900 XTX | |
| NVIDIA GeForce RTX 4090 | |
| AMD Radeon RX 7900 XT | |
| NVIDIA GeForce RTX 3080 Ti | |
| NVIDIA GeForce RTX 3090 | |
| AMD Radeon RX 6800 | |
| AMD Radeon RX 6950 XT | |
| 1920x1080 Ultra Graphics Quality + HD Textures AA:T | |
| AMD Radeon RX 7900 XTX | |
| AMD Radeon RX 7900 XT | |
| NVIDIA GeForce RTX 4080 | |
| NVIDIA GeForce RTX 4090 | |
| NVIDIA GeForce RTX 3080 Ti | |
| AMD Radeon RX 6800 | |
| NVIDIA GeForce RTX 3090 | |
| AMD Radeon RX 6950 XT | |
| F1 2021 | |
| 3840x2160 Ultra High Preset + Raytracing AA:T AF:16x | |
| NVIDIA GeForce RTX 4090 (874931) | |
| NVIDIA GeForce RTX 4080 (874931) | |
| AMD Radeon RX 7900 XTX (874931) | |
| AMD Radeon RX 7900 XT (874931) | |
| NVIDIA GeForce RTX 3080 Ti (874931) | |
| NVIDIA GeForce RTX 3090 (874931) | |
| AMD Radeon RX 6950 XT (874931) | |
| AMD Radeon RX 6800 (874931) | |
| 2560x1440 Ultra High Preset + Raytracing AA:T AF:16x | |
| NVIDIA GeForce RTX 4090 (874931) | |
| NVIDIA GeForce RTX 4080 (874931) | |
| AMD Radeon RX 7900 XTX (874931) | |
| AMD Radeon RX 7900 XT (874931) | |
| NVIDIA GeForce RTX 3080 Ti (874931) | |
| AMD Radeon RX 6950 XT (874931) | |
| NVIDIA GeForce RTX 3090 (874931) | |
| AMD Radeon RX 6800 (874931) | |
| 1920x1080 Ultra High Preset + Raytracing AA:T AF:16x | |
| NVIDIA GeForce RTX 4080 (874931) | |
| NVIDIA GeForce RTX 4090 (874931) | |
| AMD Radeon RX 7900 XTX (874931) | |
| AMD Radeon RX 7900 XT (874931) | |
| NVIDIA GeForce RTX 3080 Ti (874931) | |
| NVIDIA GeForce RTX 3090 (874931) | |
| AMD Radeon RX 6950 XT (874931) | |
| AMD Radeon RX 6800 (874931) | |
| F1 22 | |
| 3840x2160 Ultra High Preset AA:T AF:16x | |
| NVIDIA GeForce RTX 4090 (923662) | |
| NVIDIA GeForce RTX 4080 (928484) | |
| AMD Radeon RX 7900 XTX (939134) | |
| AMD Radeon RX 7900 XT (939134) | |
| NVIDIA GeForce RTX 3080 Ti (939134) | |
| NVIDIA GeForce RTX 3090 (928484) | |
| AMD Radeon RX 6950 XT (905427) | |
| AMD Radeon RX 6800 (928484) | |
| 2560x1440 Ultra High Preset AA:T AF:16x | |
| NVIDIA GeForce RTX 4090 (923662) | |
| NVIDIA GeForce RTX 4080 (928484) | |
| AMD Radeon RX 7900 XTX (939134) | |
| AMD Radeon RX 7900 XT (939134) | |
| NVIDIA GeForce RTX 3080 Ti (939134) | |
| NVIDIA GeForce RTX 3090 (928484) | |
| AMD Radeon RX 6950 XT (905427) | |
| AMD Radeon RX 6800 (928484) | |
| 1920x1080 Ultra High Preset AA:T AF:16x | |
| NVIDIA GeForce RTX 4090 | |
| NVIDIA GeForce RTX 4080 (928484) | |
| AMD Radeon RX 7900 XTX (939134) | |
| NVIDIA GeForce RTX 3080 Ti (939134) | |
| AMD Radeon RX 7900 XT (939134) | |
| NVIDIA GeForce RTX 3090 (928484) | |
| AMD Radeon RX 6950 XT (905427) | |
| AMD Radeon RX 6800 | |
| Forza Horizon 5 | |
| 3840x2160 Extreme Preset | |
| NVIDIA GeForce RTX 4090 | |
| NVIDIA GeForce RTX 4080 | |
| AMD Radeon RX 7900 XTX | |
| AMD Radeon RX 7900 XT | |
| AMD Radeon RX 6950 XT | |
| NVIDIA GeForce RTX 3080 Ti | |
| NVIDIA GeForce RTX 3090 | |
| AMD Radeon RX 6800 | |
| 2560x1440 Extreme Preset | |
| NVIDIA GeForce RTX 4090 | |
| NVIDIA GeForce RTX 4080 | |
| AMD Radeon RX 7900 XTX | |
| AMD Radeon RX 7900 XT | |
| AMD Radeon RX 6950 XT | |
| NVIDIA GeForce RTX 3080 Ti | |
| NVIDIA GeForce RTX 3090 | |
| AMD Radeon RX 6800 | |
| 1920x1080 Extreme Preset | |
| NVIDIA GeForce RTX 4090 | |
| NVIDIA GeForce RTX 4080 | |
| AMD Radeon RX 7900 XTX | |
| AMD Radeon RX 7900 XT | |
| AMD Radeon RX 6950 XT | |
| NVIDIA GeForce RTX 3080 Ti | |
| NVIDIA GeForce RTX 3090 | |
| AMD Radeon RX 6800 | |
| Cyberpunk 2077 1.6 | |
| 3840x2160 Ultra Preset | |
| NVIDIA GeForce RTX 4090 (1.6) | |
| AMD Radeon RX 7900 XTX (1.61) | |
| NVIDIA GeForce RTX 4080 (1.6) | |
| AMD Radeon RX 7900 XT (1.61) | |
| NVIDIA GeForce RTX 3080 Ti (1.61) | |
| NVIDIA GeForce RTX 3090 (1.6) | |
| AMD Radeon RX 6950 XT | |
| AMD Radeon RX 6800 (1.61) | |
| 2560x1440 Ultra Preset | |
| NVIDIA GeForce RTX 4090 (1.6) | |
| AMD Radeon RX 7900 XTX (1.61) | |
| NVIDIA GeForce RTX 4080 (1.6) | |
| AMD Radeon RX 7900 XT (1.61) | |
| NVIDIA GeForce RTX 3080 Ti (1.61) | |
| NVIDIA GeForce RTX 3090 (1.6) | |
| AMD Radeon RX 6950 XT | |
| AMD Radeon RX 6800 (1.61) | |
| 1920x1080 Ultra Preset | |
| NVIDIA GeForce RTX 4090 (1.6) | |
| AMD Radeon RX 7900 XTX (1.61) | |
| NVIDIA GeForce RTX 4080 (1.6) | |
| AMD Radeon RX 7900 XT (1.61) | |
| NVIDIA GeForce RTX 3080 Ti (1.61) | |
| NVIDIA GeForce RTX 3090 (1.6) | |
| AMD Radeon RX 6800 (1.61) | |
| AMD Radeon RX 6950 XT | |
Ray tracing performance
We observe ray tracing performance increases significantly by up to 50% compared to RDNA 2 with RDNA 3's second generation ray tracing accelerators.
That being said, AMD still lags behind compared to Nvidia in this aspect overall. We will update this review with more ray tracing benchmarks shortly for a more holistic comparison.
| Metro Exodus - 1920x1080 Ultra Quality DXR AF:16x | |
| NVIDIA GeForce RTX 4090 | |
| AMD Radeon RX 7900 XTX | |
| NVIDIA GeForce RTX 4080 | |
| AMD Radeon RX 7900 XT | |
| NVIDIA GeForce RTX 3080 Ti | |
| NVIDIA GeForce RTX 3090 | |
| Far Cry 6 - 1920x1080 Ultra Graphics Quality + HD Textures + DXR AA:T | |
| NVIDIA GeForce RTX 4080 | |
| AMD Radeon RX 7900 XTX | |
| AMD Radeon RX 7900 XT | |
| NVIDIA GeForce RTX 4090 | |
| NVIDIA GeForce RTX 3080 Ti | |
| NVIDIA GeForce RTX 3090 | |
| AMD Radeon RX 6800 | |
| AMD Radeon RX 6950 XT | |
| Cyberpunk 2077 1.6 | |
| 3840x2160 Ray Tracing Ultra Preset (DLSS off) | |
| NVIDIA GeForce RTX 4090 (1.6) | |
| NVIDIA GeForce RTX 4080 (1.6) | |
| NVIDIA GeForce RTX 3090 (1.6) | |
| AMD Radeon RX 7900 XTX (1.61) | |
| NVIDIA GeForce RTX 3080 Ti (1.61) | |
| AMD Radeon RX 7900 XT (1.61) | |
| AMD Radeon RX 6800 (1.61) | |
| 1920x1080 Ray Tracing Ultra Preset (DLSS off) | |
| NVIDIA GeForce RTX 4090 (1.6) | |
| NVIDIA GeForce RTX 4080 (1.6) | |
| NVIDIA GeForce RTX 3080 Ti (1.61) | |
| NVIDIA GeForce RTX 3090 (1.6) | |
| AMD Radeon RX 7900 XTX (1.61) | |
| AMD Radeon RX 7900 XT (1.61) | |
| AMD Radeon RX 6800 (1.61) | |
| Control - 1920x1080 High Quality Preset & High Ray Tracing Preset (DX12) | |
| NVIDIA GeForce RTX 4090 | |
| NVIDIA GeForce RTX 4080 | |
| AMD Radeon RX 7900 XTX | |
| NVIDIA GeForce RTX 3080 Ti | |
| AMD Radeon RX 7900 XT | |
| AMD Radeon RX 6950 XT | |
| Ghostwire Tokyo - 1920x1080 Highest Settings + Maximum Ray Tracing | |
| NVIDIA GeForce RTX 4090 | |
| NVIDIA GeForce RTX 4080 | |
| AMD Radeon RX 7900 XTX | |
| NVIDIA GeForce RTX 3080 Ti | |
| AMD Radeon RX 7900 XT | |
| Guardians of the Galaxy - 1920x1080 Ultra Preset + Ultra Ray-Tracing | |
| AMD Radeon RX 7900 XTX | |
| AMD Radeon RX 7900 XT | |
| The Callisto Protocol - 1920x1080 Ultra Preset (without FSR Upscaling) + Full Ray-Tracing | |
| AMD Radeon RX 7900 XTX | |
| NVIDIA GeForce RTX 4090 | |
| AMD Radeon RX 7900 XT | |
| NVIDIA GeForce RTX 3080 Ti | |
| AMD Radeon RX 6800 | |
AMD Radeon RX 7900 XTX
| low | med. | high | ultra | QHD | 4K | |
|---|---|---|---|---|---|---|
| GTA V (2015) | 187.9 | 187.1 | 185.6 | 159.4 | 160.4 | 184.8 |
| The Witcher 3 (2015) | 844 | 612 | 538 | 297 | 163.8 | |
| Dota 2 Reborn (2015) | 259.5 | 242.9 | 196.9 | 178.3 | 158.5 | |
| Final Fantasy XV Benchmark (2018) | 235 | 234 | 216 | 172.8 | 101.6 | |
| X-Plane 11.11 (2018) | 195.3 | 150.7 | 117.1 | 88 | ||
| Far Cry 5 (2018) | 222 | 198 | 191 | 175 | 174 | 155 |
| Strange Brigade (2018) | 770 | 580 | 492 | 424 | 325 | 172.6 |
| Shadow of the Tomb Raider (2018) | 365 | 325 | 319 | 301 | 230 | 130.1 |
| Far Cry New Dawn (2019) | 186 | 166 | 160 | 143 | 143 | 138 |
| Metro Exodus (2019) | 333 | 285 | 183.5 | 154.5 | 103.5 | |
| Control (2019) | 240 | 240 | 240 | 184.9 | 89.4 | |
| Borderlands 3 (2019) | 251 | 220 | 203 | 180.2 | 152.2 | 88.4 |
| F1 2020 (2020) | 624 | 523 | 497 | 395 | 320 | 199.6 |
| F1 2021 (2021) | 706 | 665 | 535 | 262 | 220 | 133.6 |
| New World (2021) | 210 | 185.1 | 168.1 | 158.8 | 156.5 | 103.3 |
| Far Cry 6 (2021) | 236 | 208 | 190.5 | 183.6 | 176.4 | 124 |
| Guardians of the Galaxy (2021) | 204 | 202 | 202 | 197 | 196 | 141 |
| Forza Horizon 5 (2021) | 317 | 241 | 218 | 166 | 150 | 118 |
| God of War (2022) | 224 | 223 | 222 | 185.3 | 153.8 | 102.1 |
| GRID Legends (2022) | 448 | 399 | 339 | 289 | 259 | 187 |
| Cyberpunk 2077 1.6 (2022) | 242 | 231 | 208 | 199.3 | 141.1 | 71.4 |
| Ghostwire Tokyo (2022) | 295 | 294 | 293 | 292 | 253 | 127.6 |
| Tiny Tina's Wonderlands (2022) | 463 | 367 | 282 | 226 | 160.7 | 85.6 |
| F1 22 (2022) | 506 | 483 | 457 | 148.5 | 102.1 | 52.4 |
| The Quarry (2022) | 381 | 293 | 246 | 196.5 | 136.9 | 73.9 |
| A Plague Tale Requiem (2022) | 215 | 197.3 | 157.7 | 121.4 | 97.5 | 58.9 |
| Uncharted Legacy of Thieves Collection (2022) | 163.9 | 163.3 | 153.2 | 147.9 | 122.4 | 80.4 |
| Call of Duty Modern Warfare 2 2022 (2022) | 353 | 339 | 272 | 271 | 200 | 124 |
| Spider-Man Miles Morales (2022) | 180.2 | 172.3 | 170.3 | 162.8 | 146.3 | 97.9 |
| The Callisto Protocol (2022) | 263 | 237 | 160 | 158 | 125 | 77 |
| Need for Speed Unbound (2022) | 209 | 197.5 | 169.7 | 142.5 | 124.5 | 86.7 |
AMD Radeon RX 7900 XT
| low | med. | high | ultra | QHD | 4K | |
|---|---|---|---|---|---|---|
| GTA V (2015) | 188.4 | 187.5 | 185.4 | 159.9 | 159.2 | 175.1 |
| The Witcher 3 (2015) | 816 | 614 | 483 | 265 | 158.5 | |
| Dota 2 Reborn (2015) | 265.7 | 217.1 | 198.9 | 183.6 | 153.2 | |
| Final Fantasy XV Benchmark (2018) | 234 | 233 | 197.2 | 149.9 | 84.9 | |
| X-Plane 11.11 (2018) | 179.2 | 140.4 | 109.8 | 81.4 | ||
| Far Cry 5 (2018) | 221 | 196 | 187 | 173 | 173 | 132 |
| Strange Brigade (2018) | 770 | 580 | 492 | 424 | 325 | 172.6 |
| Shadow of the Tomb Raider (2018) | 370 | 311 | 307 | 282 | 203 | 109.6 |
| Far Cry New Dawn (2019) | 182 | 163 | 157 | 142 | 141 | 129 |
| Metro Exodus (2019) | 331 | 274 | 164.6 | 135 | 86.9 | |
| Control (2019) | 240 | 240 | 233 | 156.4 | 75.8 | |
| Borderlands 3 (2019) | 248 | 220 | 199.2 | 169.4 | 135.2 | 74.6 |
| F1 2020 (2020) | 581 | 484 | 466 | 350 | 277 | 165.5 |
| F1 2021 (2021) | 644 | 615 | 493 | 248 | 192.8 | 112.3 |
| New World (2021) | 213 | 177.8 | 164.1 | 156.9 | 147 | 84.4 |
| Far Cry 6 (2021) | 233 | 208 | 190 | 181.9 | 167.9 | 104.1 |
| Guardians of the Galaxy (2021) | 202 | 201 | 200 | 197 | 191 | 118 |
| Forza Horizon 5 (2021) | 315 | 244 | 223 | 154 | 138 | 104 |
| God of War (2022) | 230 | 229 | 219 | 165 | 136.7 | 88.1 |
| GRID Legends (2022) | 444 | 390 | 324 | 273 | 241 | 164.9 |
| Cyberpunk 2077 1.6 (2022) | 237 | 212 | 189.7 | 178.6 | 122.4 | 60 |
| Ghostwire Tokyo (2022) | 295 | 294 | 293 | 292 | 228 | 104 |
| Tiny Tina's Wonderlands (2022) | 435 | 348 | 250 | 194.2 | 136 | 71.3 |
| F1 22 (2022) | 478 | 434 | 410 | 129.8 | 88.1 | 44.9 |
| The Quarry (2022) | 342 | 258 | 216 | 169.3 | 118.7 | 62.4 |
| A Plague Tale Requiem (2022) | 215 | 183.9 | 142.3 | 106 | 84.1 | 47.9 |
| Uncharted Legacy of Thieves Collection (2022) | 155.8 | 153.9 | 141.6 | 136.5 | 111.1 | 71 |
| Call of Duty Modern Warfare 2 2022 (2022) | 349 | 331 | 261 | 256 | 189 | 117 |
| Spider-Man Miles Morales (2022) | 178.5 | 171.4 | 158.7 | 156.2 | 135 | 83.9 |
| The Callisto Protocol (2022) | 255 | 224 | 146 | 145 | 110 | 67 |
| Need for Speed Unbound (2022) | 207 | 193.4 | 161.5 | 134.2 | 115.1 | 76 |
Power consumption and emissions: RX 7900 XT shows higher energy requirements than an RTX 4080
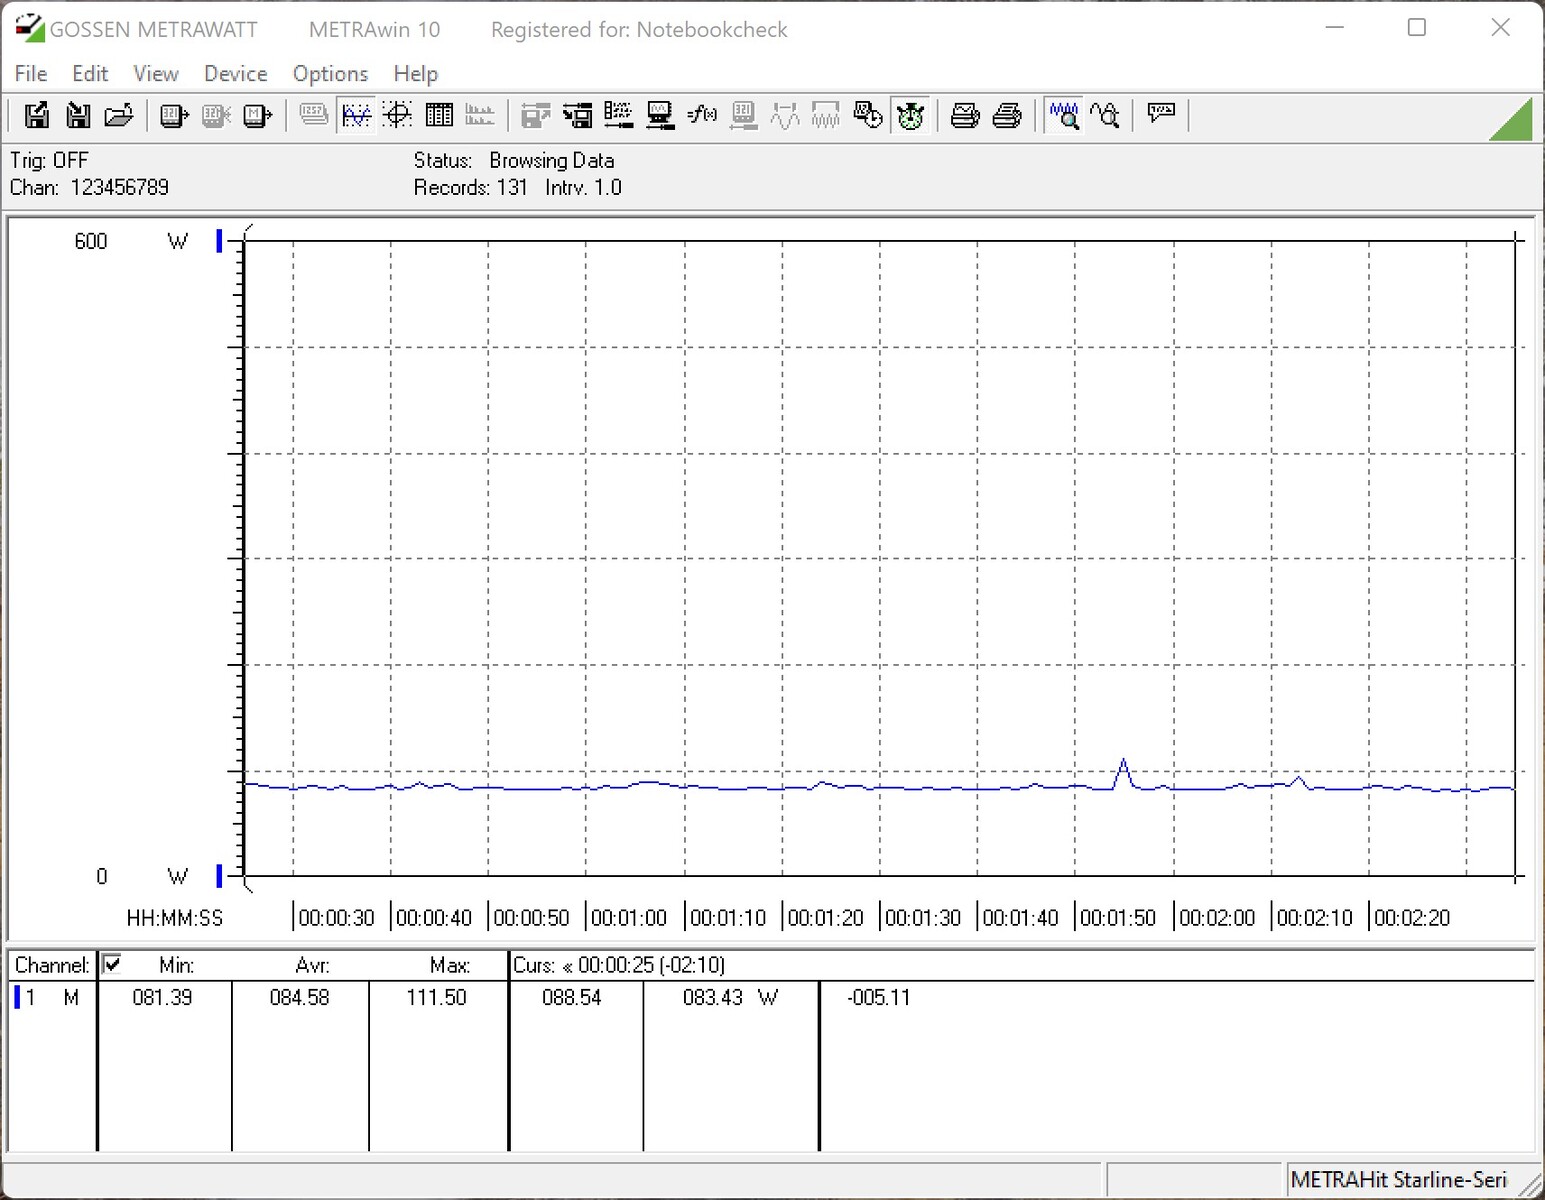
The AMD Radeon RX 7900 series is able to convince with a clearly noticeable increase in performance. The TBPs of 355 W and 315 W for the RX 7900 XTX and the RX 7900 XT, respectively, are only slightly higher than their RDNA 2 predecessors. The total system power consumption is about 8% less compared to a Radeon RX 6950 XT-based PC.
Having said that, the RX 7900 XTX is comparable to the GeForce RTX 4090's energy consumption when gaming. The likely reason could be that the CPU can quickly bottleneck and slow down the high-performing RTX 4090, particularly at 1080p, which isn't the case with the RX 7900 XTX.
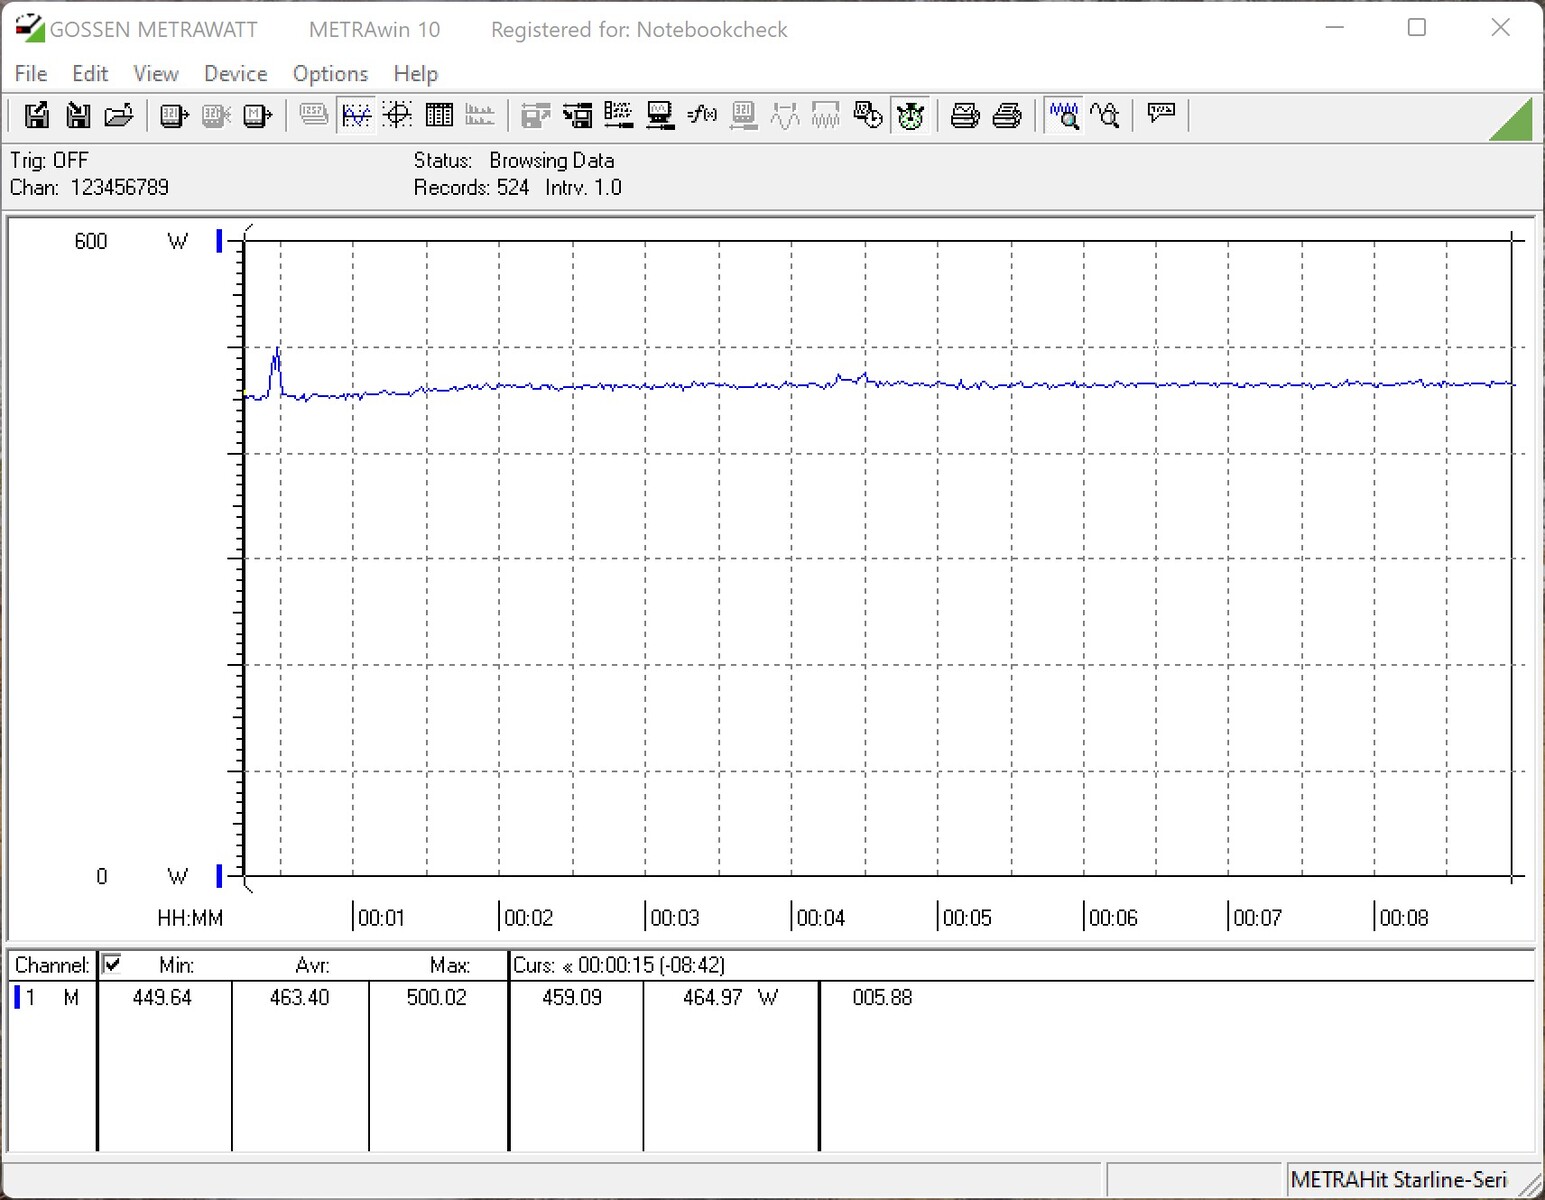
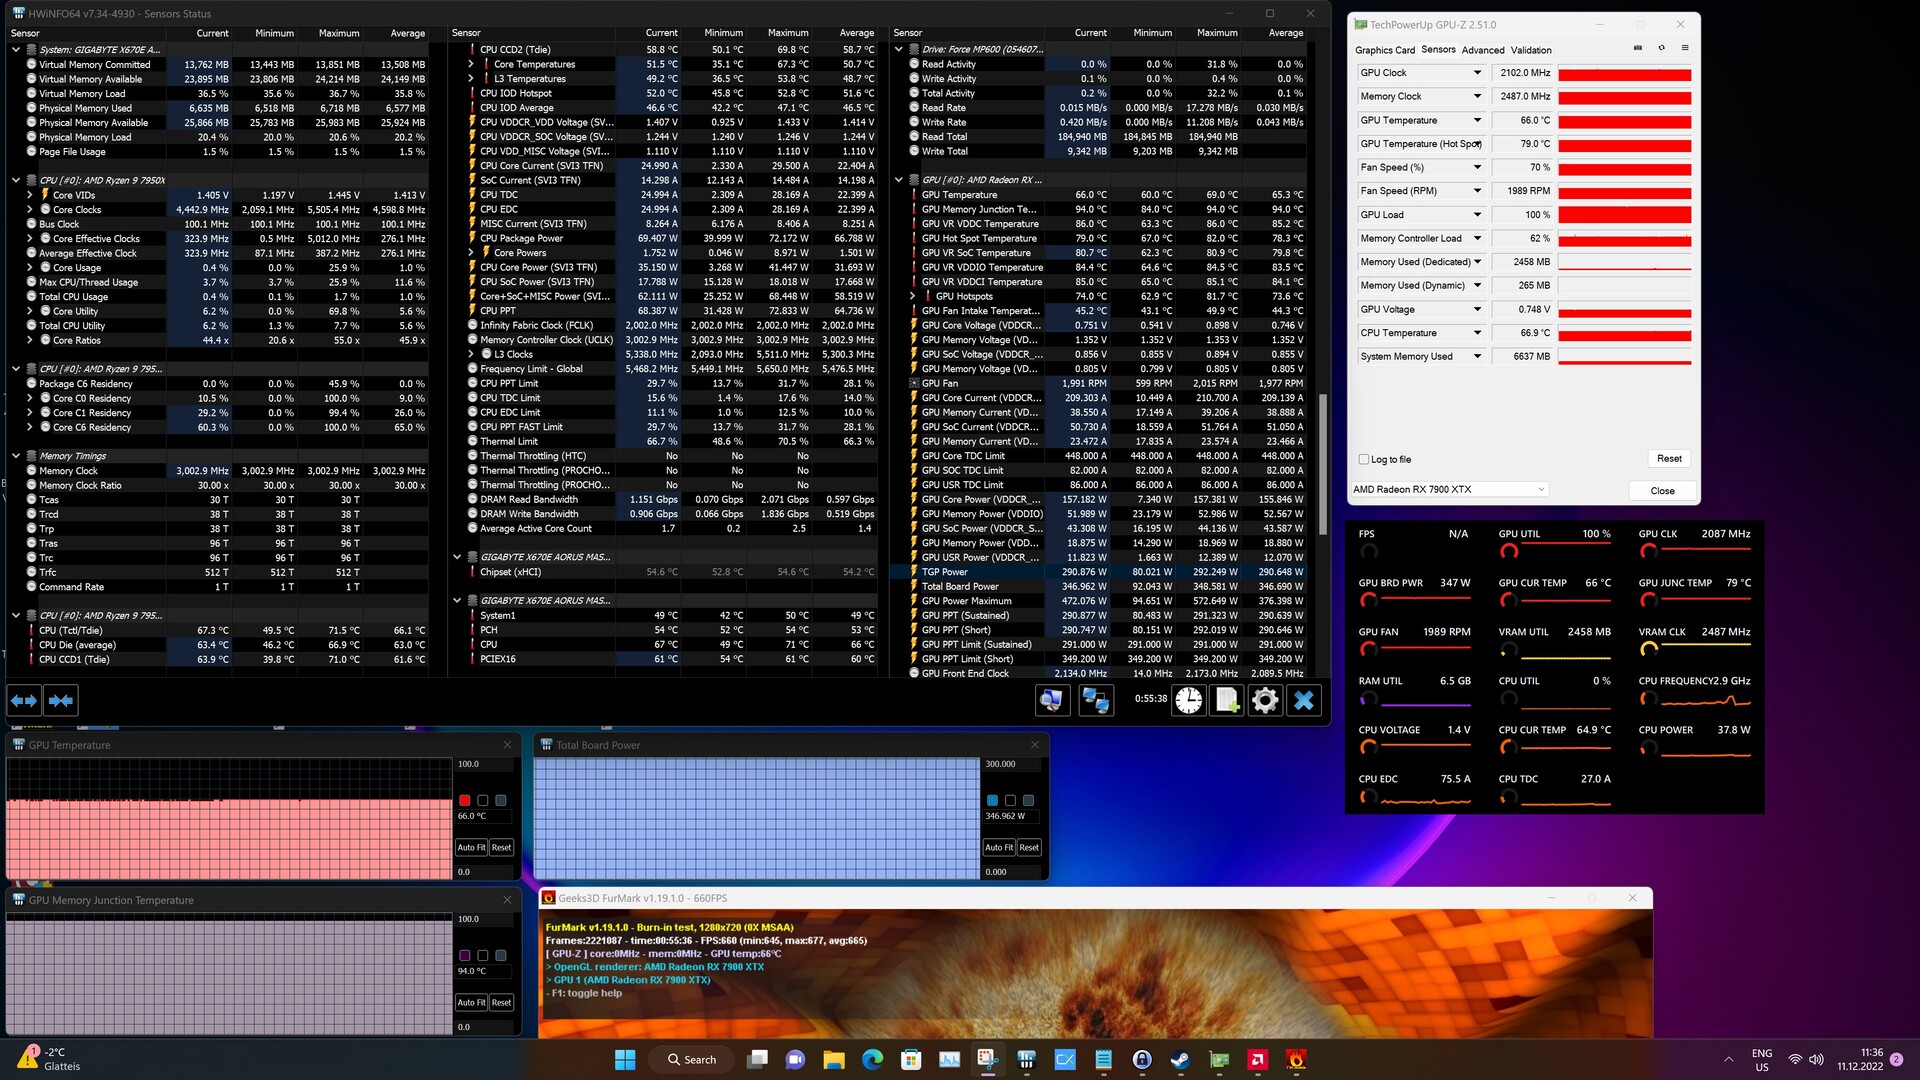
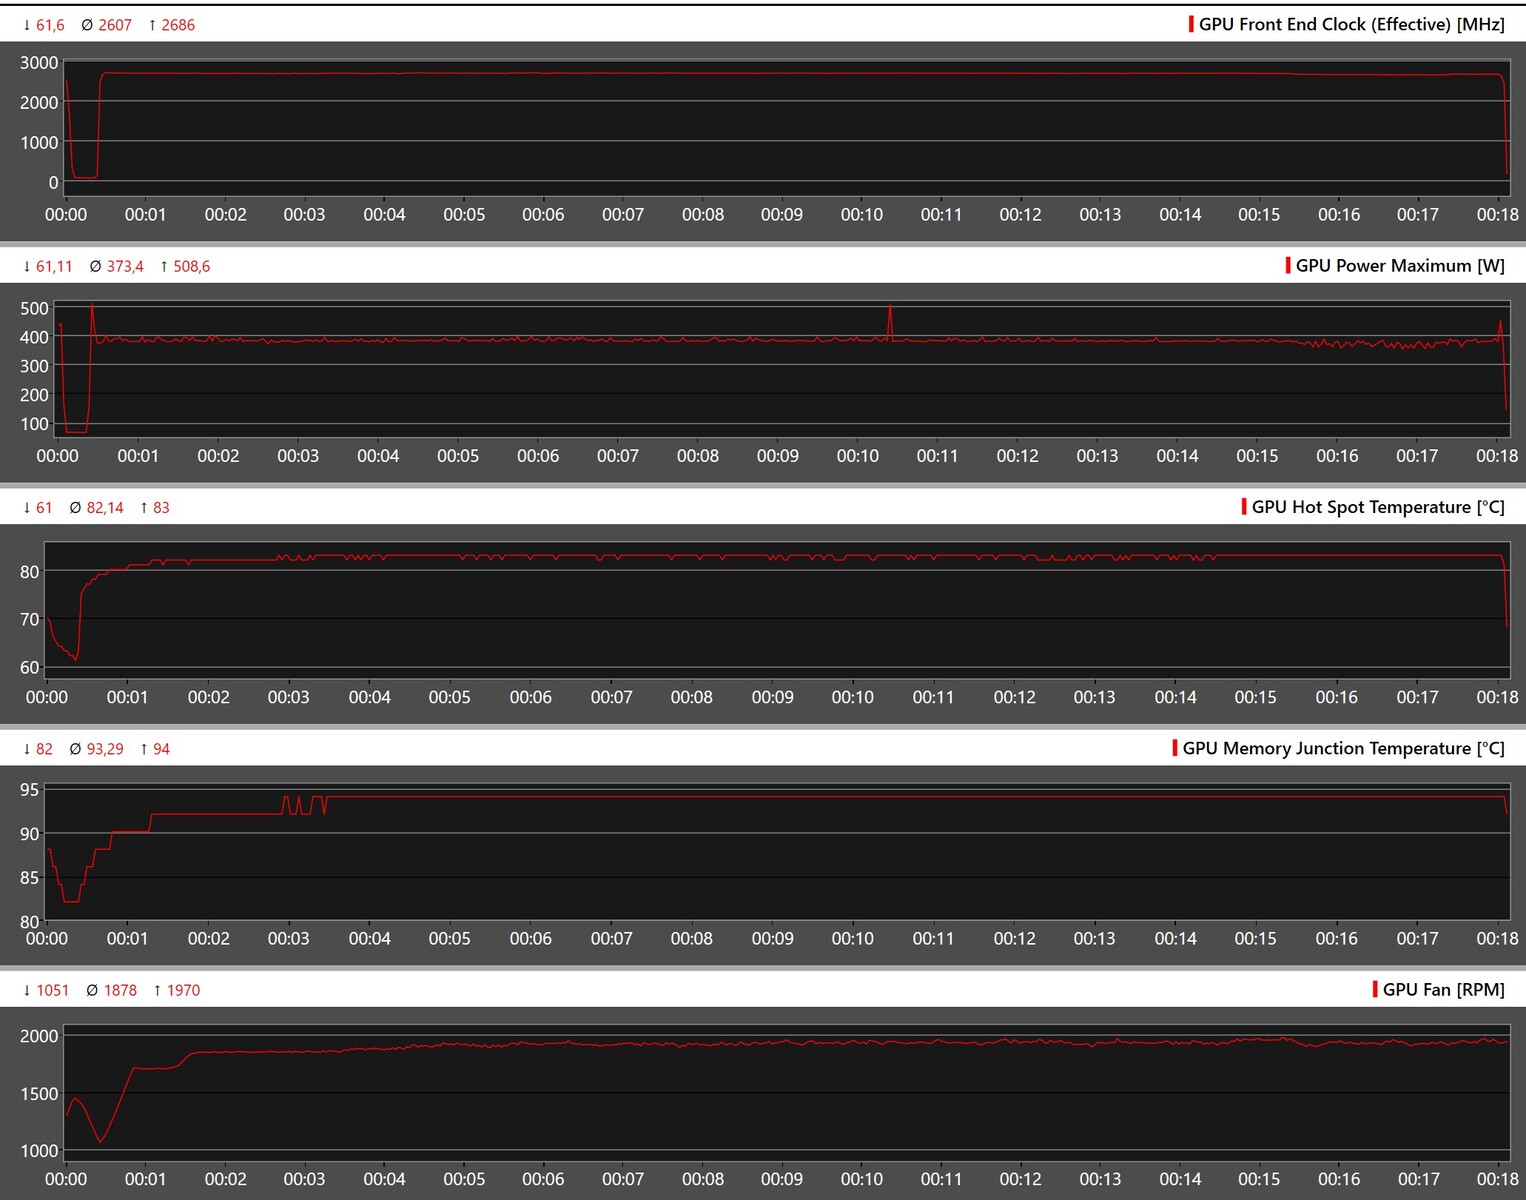
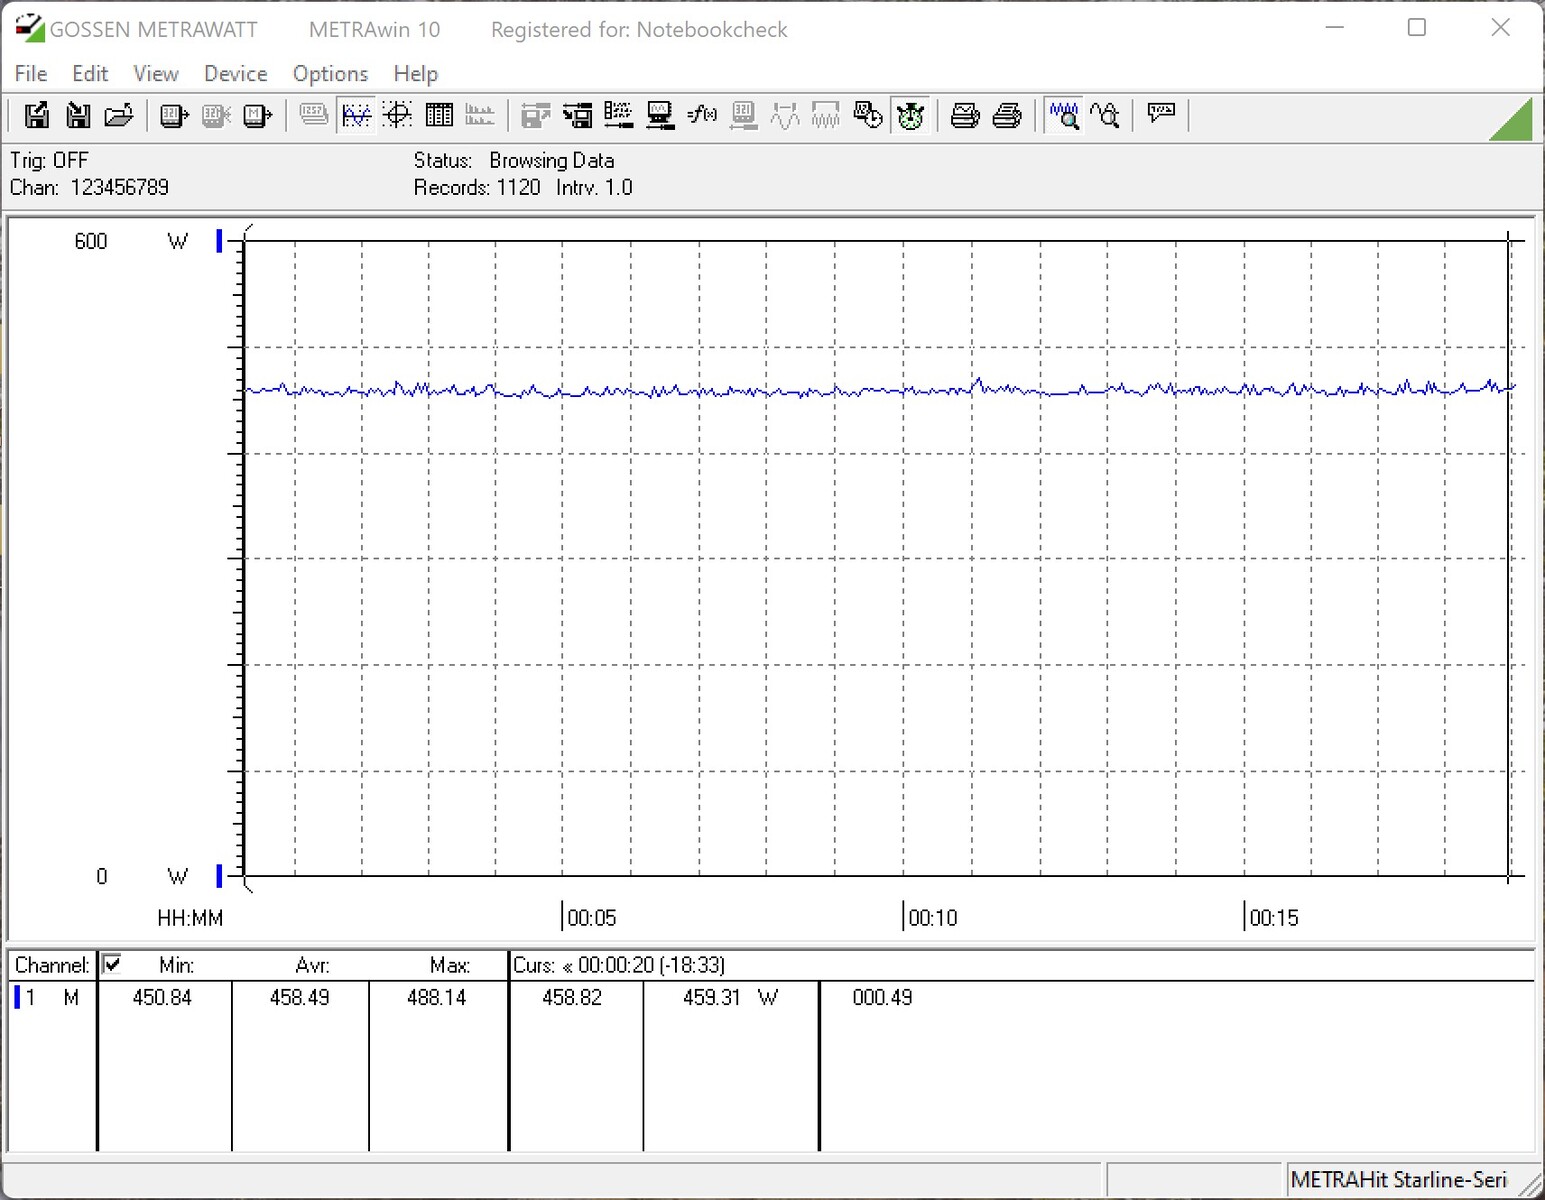
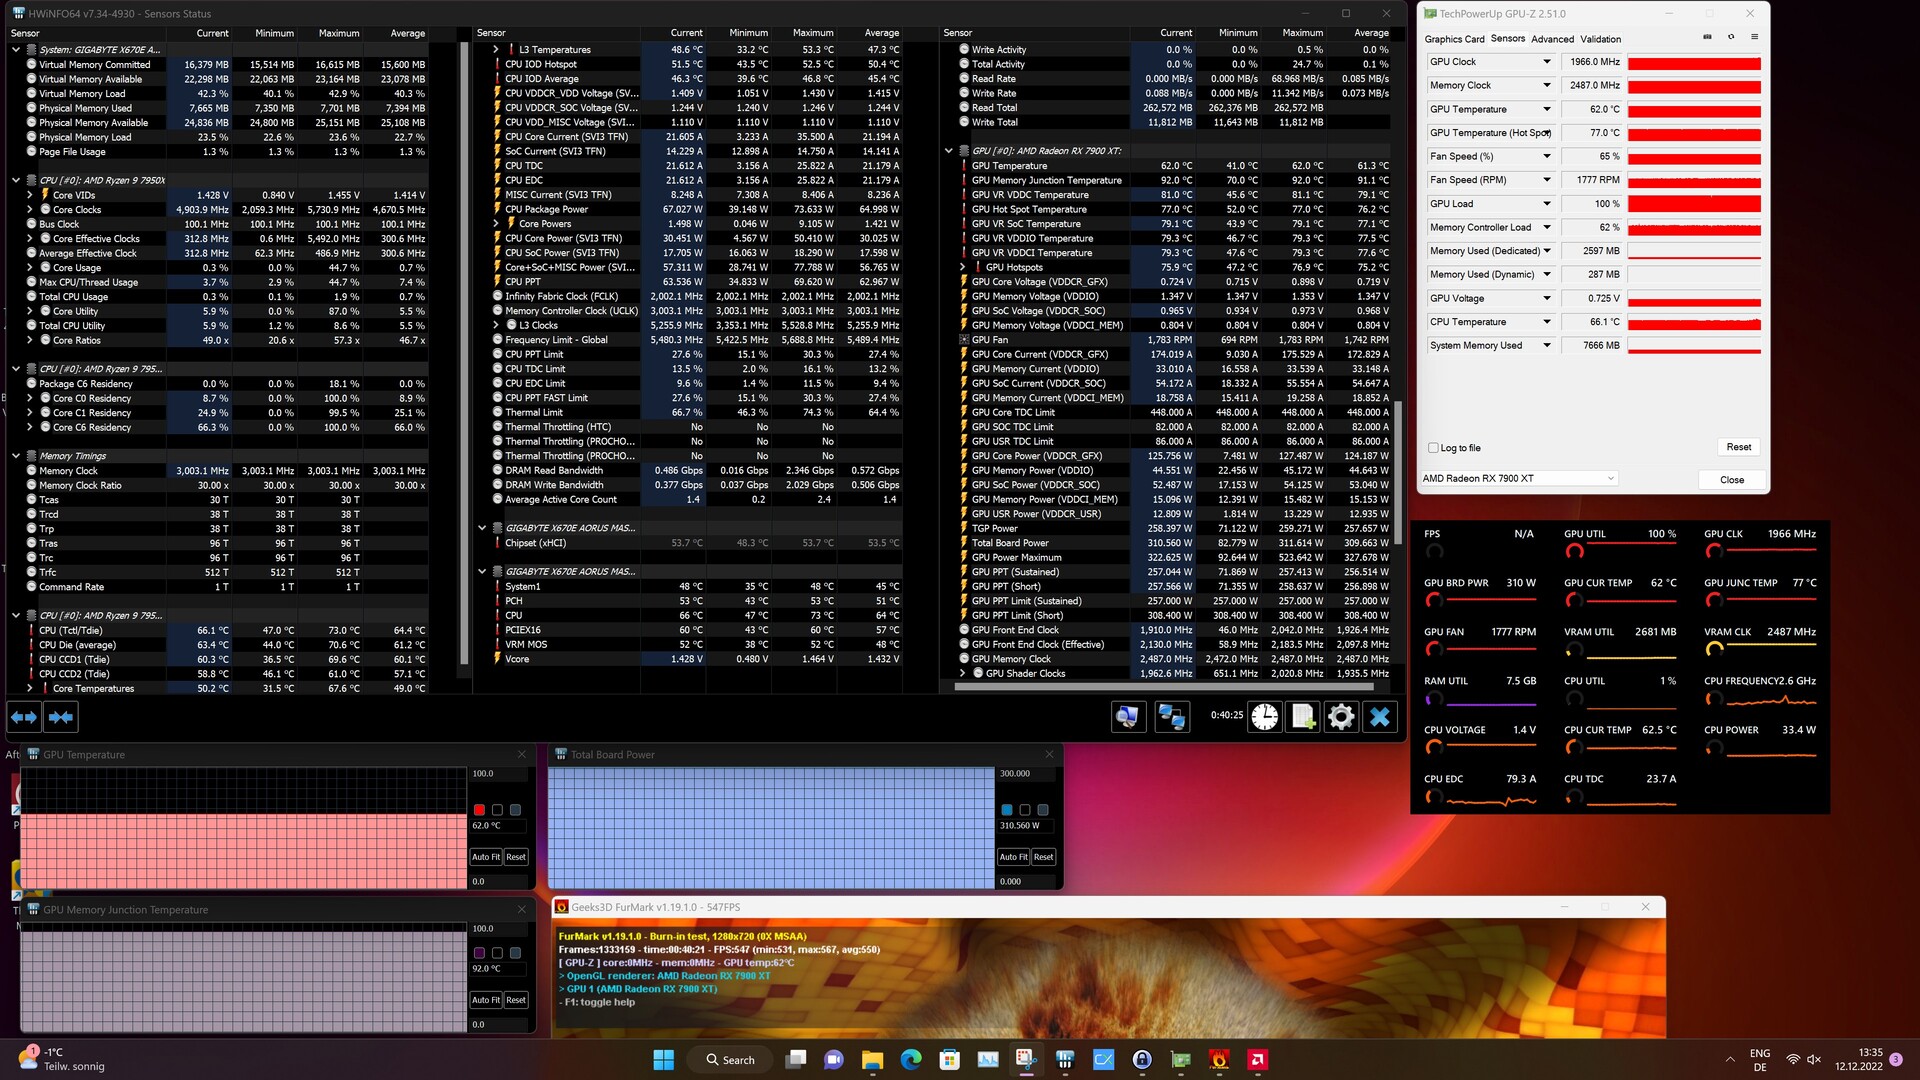
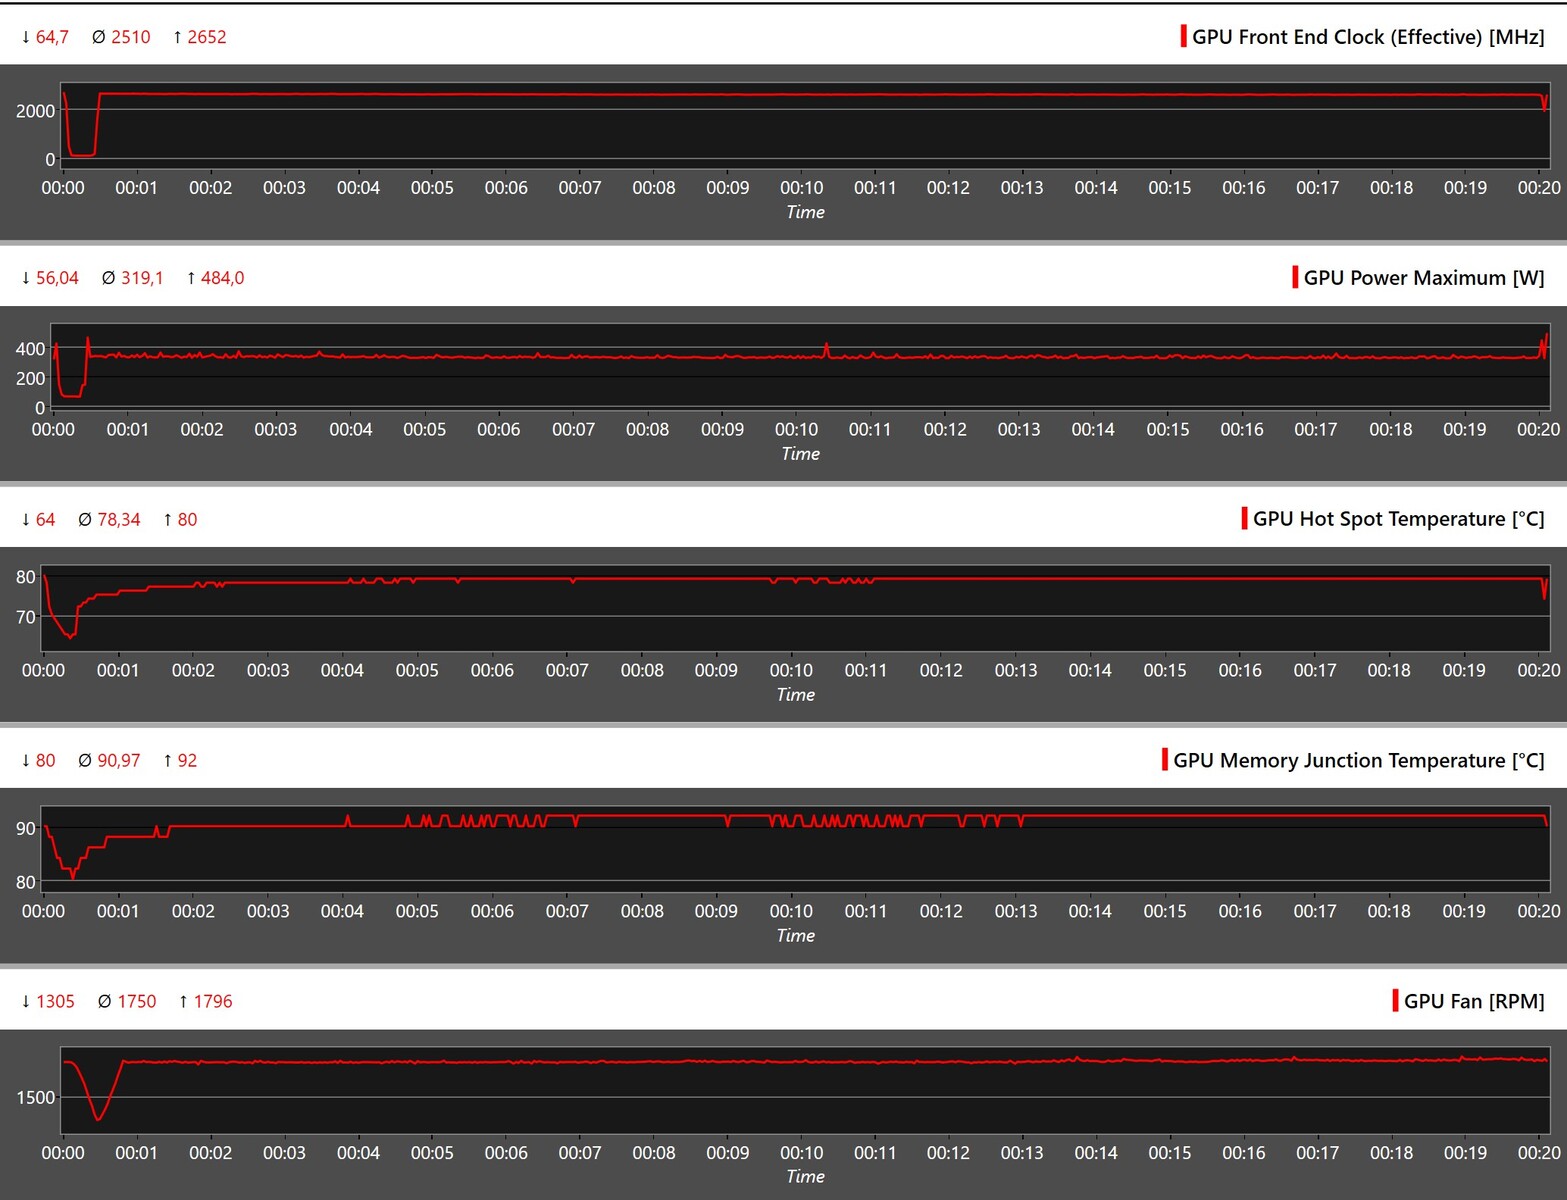
The tables turn during FurMark stress test with the Radeon RX 7900 XTX-based system consuming 15% less power than the one with an RTX 4090. We measured a high energy requirement with the RX 7900 XT even though specifications indicate a maximum of 315 W TBP for the graphics card.
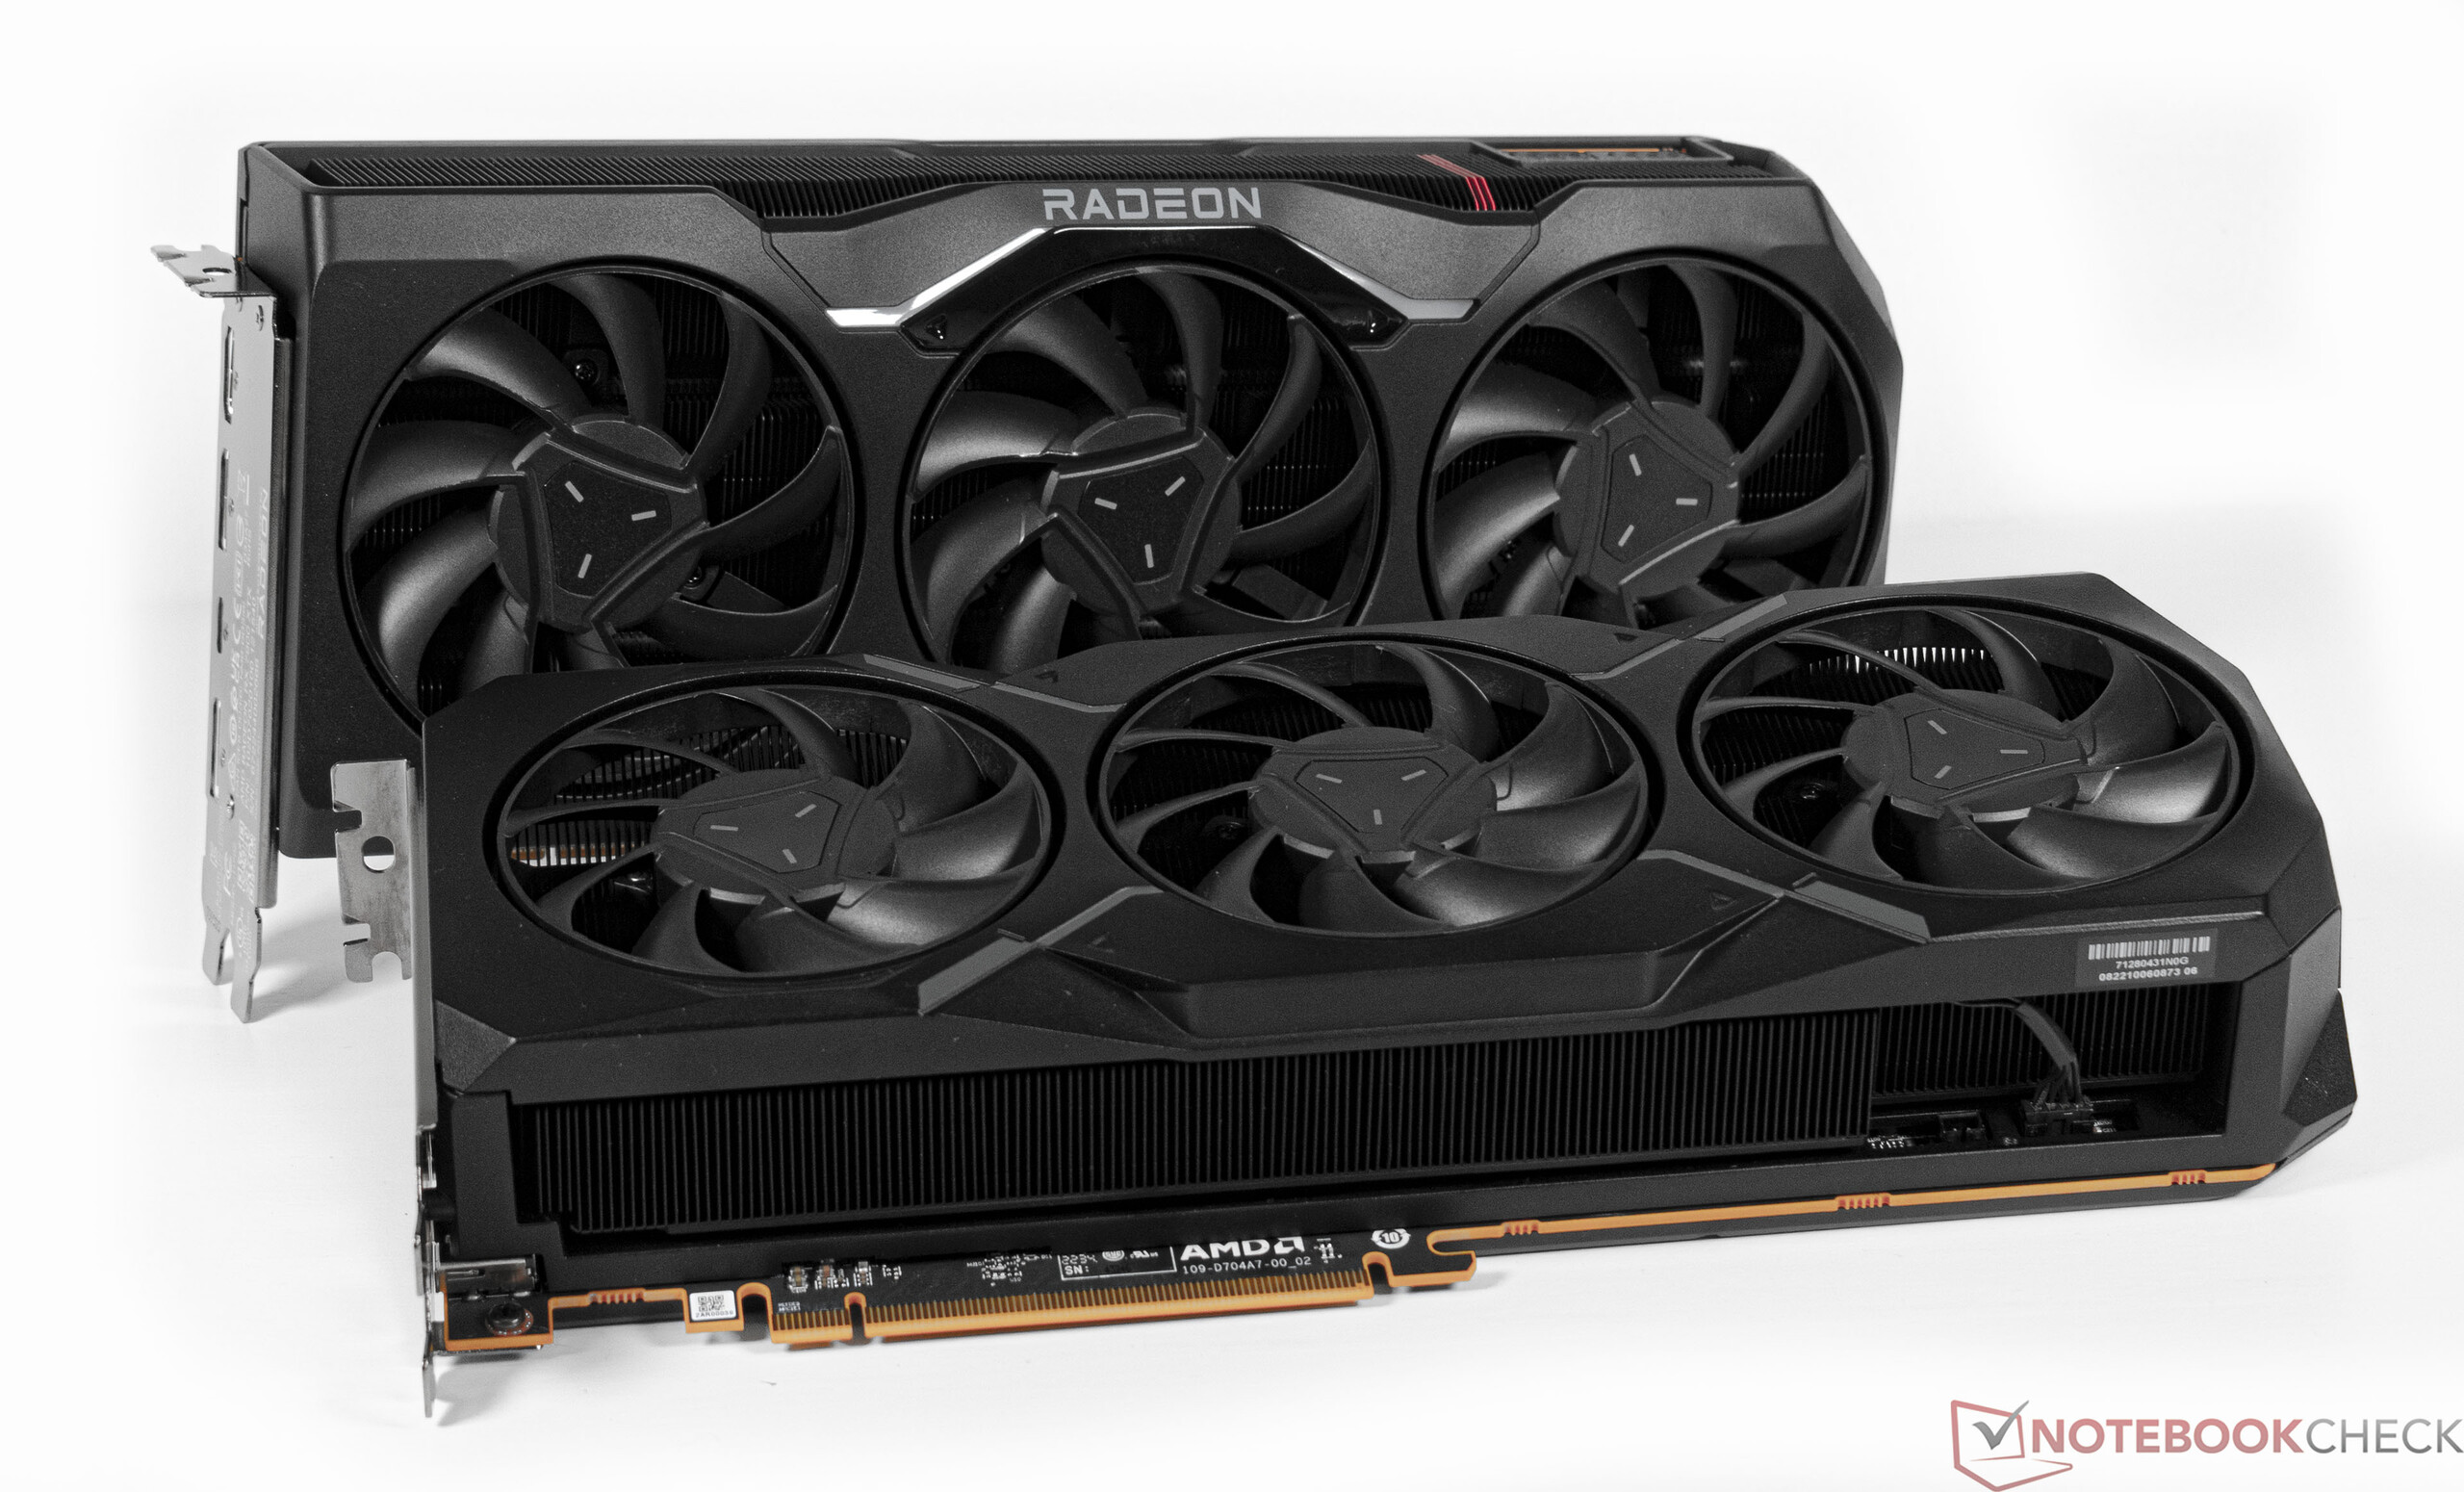
The cooling design of the Radeon RX 7900 graphics cards is visually reminiscent of the 6000 series. AMD continues to rely on vapor chamber cooling with three axial fans. In practice, both the cards have tolerable emissions even under full load with the temperatures remaining under critical regions.
We see a maximum of 86 °C as the GPU hotspot value for the XTX model. The GPU throttles only above 110 °C, which can result in performance loss. Meanwhile, the VRAM gets a bit warmer reaching 94 °C in the stress test. In the XT model, we see similarly high temperatures with the VRAM, although the GPU performs works consistently cooler than its bigger cousin.
It is possible to increase the power target by up to 15% on both models. However, due to the specifications and the already high power consumption, we advise against operating these graphics cards outside their specifications.
| Power Consumption / The Witcher 3 ultra (external Monitor) | |
| AMD Radeon RX 6950 XT | |
| AMD Radeon RX 7900 XTX (Idle: 86.5 W) | |
| NVIDIA GeForce RTX 3090 (Idle: 95.2 W) | |
| NVIDIA GeForce RTX 4090 | |
| NVIDIA GeForce RTX 3080 Ti (Idle: 78.2 W) | |
| NVIDIA GeForce RTX 4080 (Idle: 78.45 W) | |
| NVIDIA GeForce RTX 4080 (Idle: 78.45 W) | |
| AMD Radeon RX 7900 XT (Idle: 84.6 W) | |
| Power Consumption / FurMark 1.19 GPU Stress Test (external Monitor) | |
| NVIDIA GeForce RTX 4090 | |
| AMD Radeon RX 6950 XT | |
| AMD Radeon RX 7900 XTX (Idle: 86.5 W) | |
| NVIDIA GeForce RTX 3080 Ti (Idle: 78.2 W) | |
| AMD Radeon RX 7900 XT (Idle: 84.6 W) | |
| NVIDIA GeForce RTX 4080 (Idle: 78.45 W) | |
| NVIDIA GeForce RTX 4080 (Idle: 78.45 W) | |
* ... smaller is better
AMD Radeon RX 7900 XTX

AMD Radeon RX 7900 XT


Noise levels: Moderate fan noise levels but noticeable coil whine
Both the Radeon RX 7900 XTX and the RX 7900 XT perform well in terms of fan noise levels under load. We deactivated the case fans in order to measure fan noise coming from the GPU alone.
We measured a maximum of 43 dB(A) sound pressure level (SPL) in the stress test with the XTX, though the XT only reached 39.5 dB(A). Coil whine is quite noticeable with these cards, which can be heard from time to time in the main menus of various games.
When gaming, the Radeon RX 7900 XT's fan noise levels were similar to what we had observed during the stress test. The Radeon RX 7900 XTX had lower emissions 40.3 db(A) when gaming compared to what we had seen in the FurMark stress test.
AMD Radeon RX 7900 XTX
Noise level
| Idle |
| 30.8 / 30.8 / 30.8 dB(A) |
| Load |
| 30.9 / 43.1 dB(A) |
 | ||
30 dB silent 40 dB(A) audible 50 dB(A) loud |
||
min: | ||
AMD Radeon RX 7900 XT
Noise level
| Idle |
| 30.9 / 30.9 / 30.9 dB(A) |
| Load |
| 30.9 / 39.5 dB(A) |
|
| ||
30 dB silent 40 dB(A) audible 50 dB(A) loud |
||
min: | ||
Pros
Cons
Verdict: RDNA 3 offers excellent value for money

Nvidia scored a home run by setting a high bar with its latest Ada Lovelace-based GPUs, such as the GeForce RTX 4090 and RTX 4080. AMD's RDNA 3 announcement was awaited with bated breath by the press and gamers alike to see how Team Red would respond in terms of performance. Now, we are able to finally evaluate flagship RDNA 3 cards of the likes of the Radeon RX 7900 XTX and the Radeon RX 7900 XT and see for ourselves how the latest GPUs stack up to each other.
Our findings show that AMD has substantially improved performance vis-à-vis RDNA 2, even though it's the absolute best we've seen yet. The new cards are able competitors to the RTX 4080, with Nvidia's second best Ada card at times getting sandwiched between the RX 7900 XT and the RX 7900 XTX. While the RX 7900 XTX does fare well against the RTX 4080, the RX 7900 XT takes on the RTX 3080 Ti.
With the Radeon RX 7900 XTX and RX 7900 XT, AMD has significantly upped the ante with its high-end GPUs without raising the TGP to absurd levels. These RDNA 3 GPUs now present an incredibly exciting prospect thanks to their good performance and significantly more attractive pricing.
With an MSRP of US$999 (~€1,149) and US$899 (~€1,049) for the RX 7900 XTX and the RX 7900 XT, respectively, AMD veers away from Nvidia's habit of ridiculously high launch MSRPs. The Nvidia GeForce RTX 4080 and 4090 Founders Edition cards still retail for US$1,199 and US$1,599, respectively, so they are clearly in for some much-needed price cuts. AMD definitely has an edge in this regard, since the higher-end RX 7900 XTX is still less expensive while also being faster overall.
But what good is a worthwhile graphics card when it is out of stock? Poor availability has already been a problem since the launch of the GeForce RTX 4090. Time will tell whether AMD's attempts to fill up the shelves of retailers before the impending launch tomorrow is successful. On a similar note, it will be interesting to see how Nvidia reacts to the pricing, performance, and performance-per-dollar salvo from the new RDNA 3 GPUs.
With many innovations and much-improved overall feature set, the AMD Radeon RX 7900 XTX and RX 7900 XT are great products for playing all kinds of modern AAA games. Furthermore, the potential increase in performance in the form of better drivers that was often observed in the past gives us hope that this trend will also continue with the current GPU lineup. In addition, upscaling technologies such as FSR 2.0 will become increasingly important in the future with more and more game developers looking to implementing this feature in their games.
In times of energy consumption, we welcome the fact that AMD doesn't pump up to 450 W into the graphics card like Nvidia does. Compared to the AMD Radeon RX 6950 XT, however, the efficiency has been increased significantly. Nevertheless, we are still critical of the general trend of increasing power consumption in modern graphics cards, given the fact that higher TBP values can be seen again and again from generation to generation.
