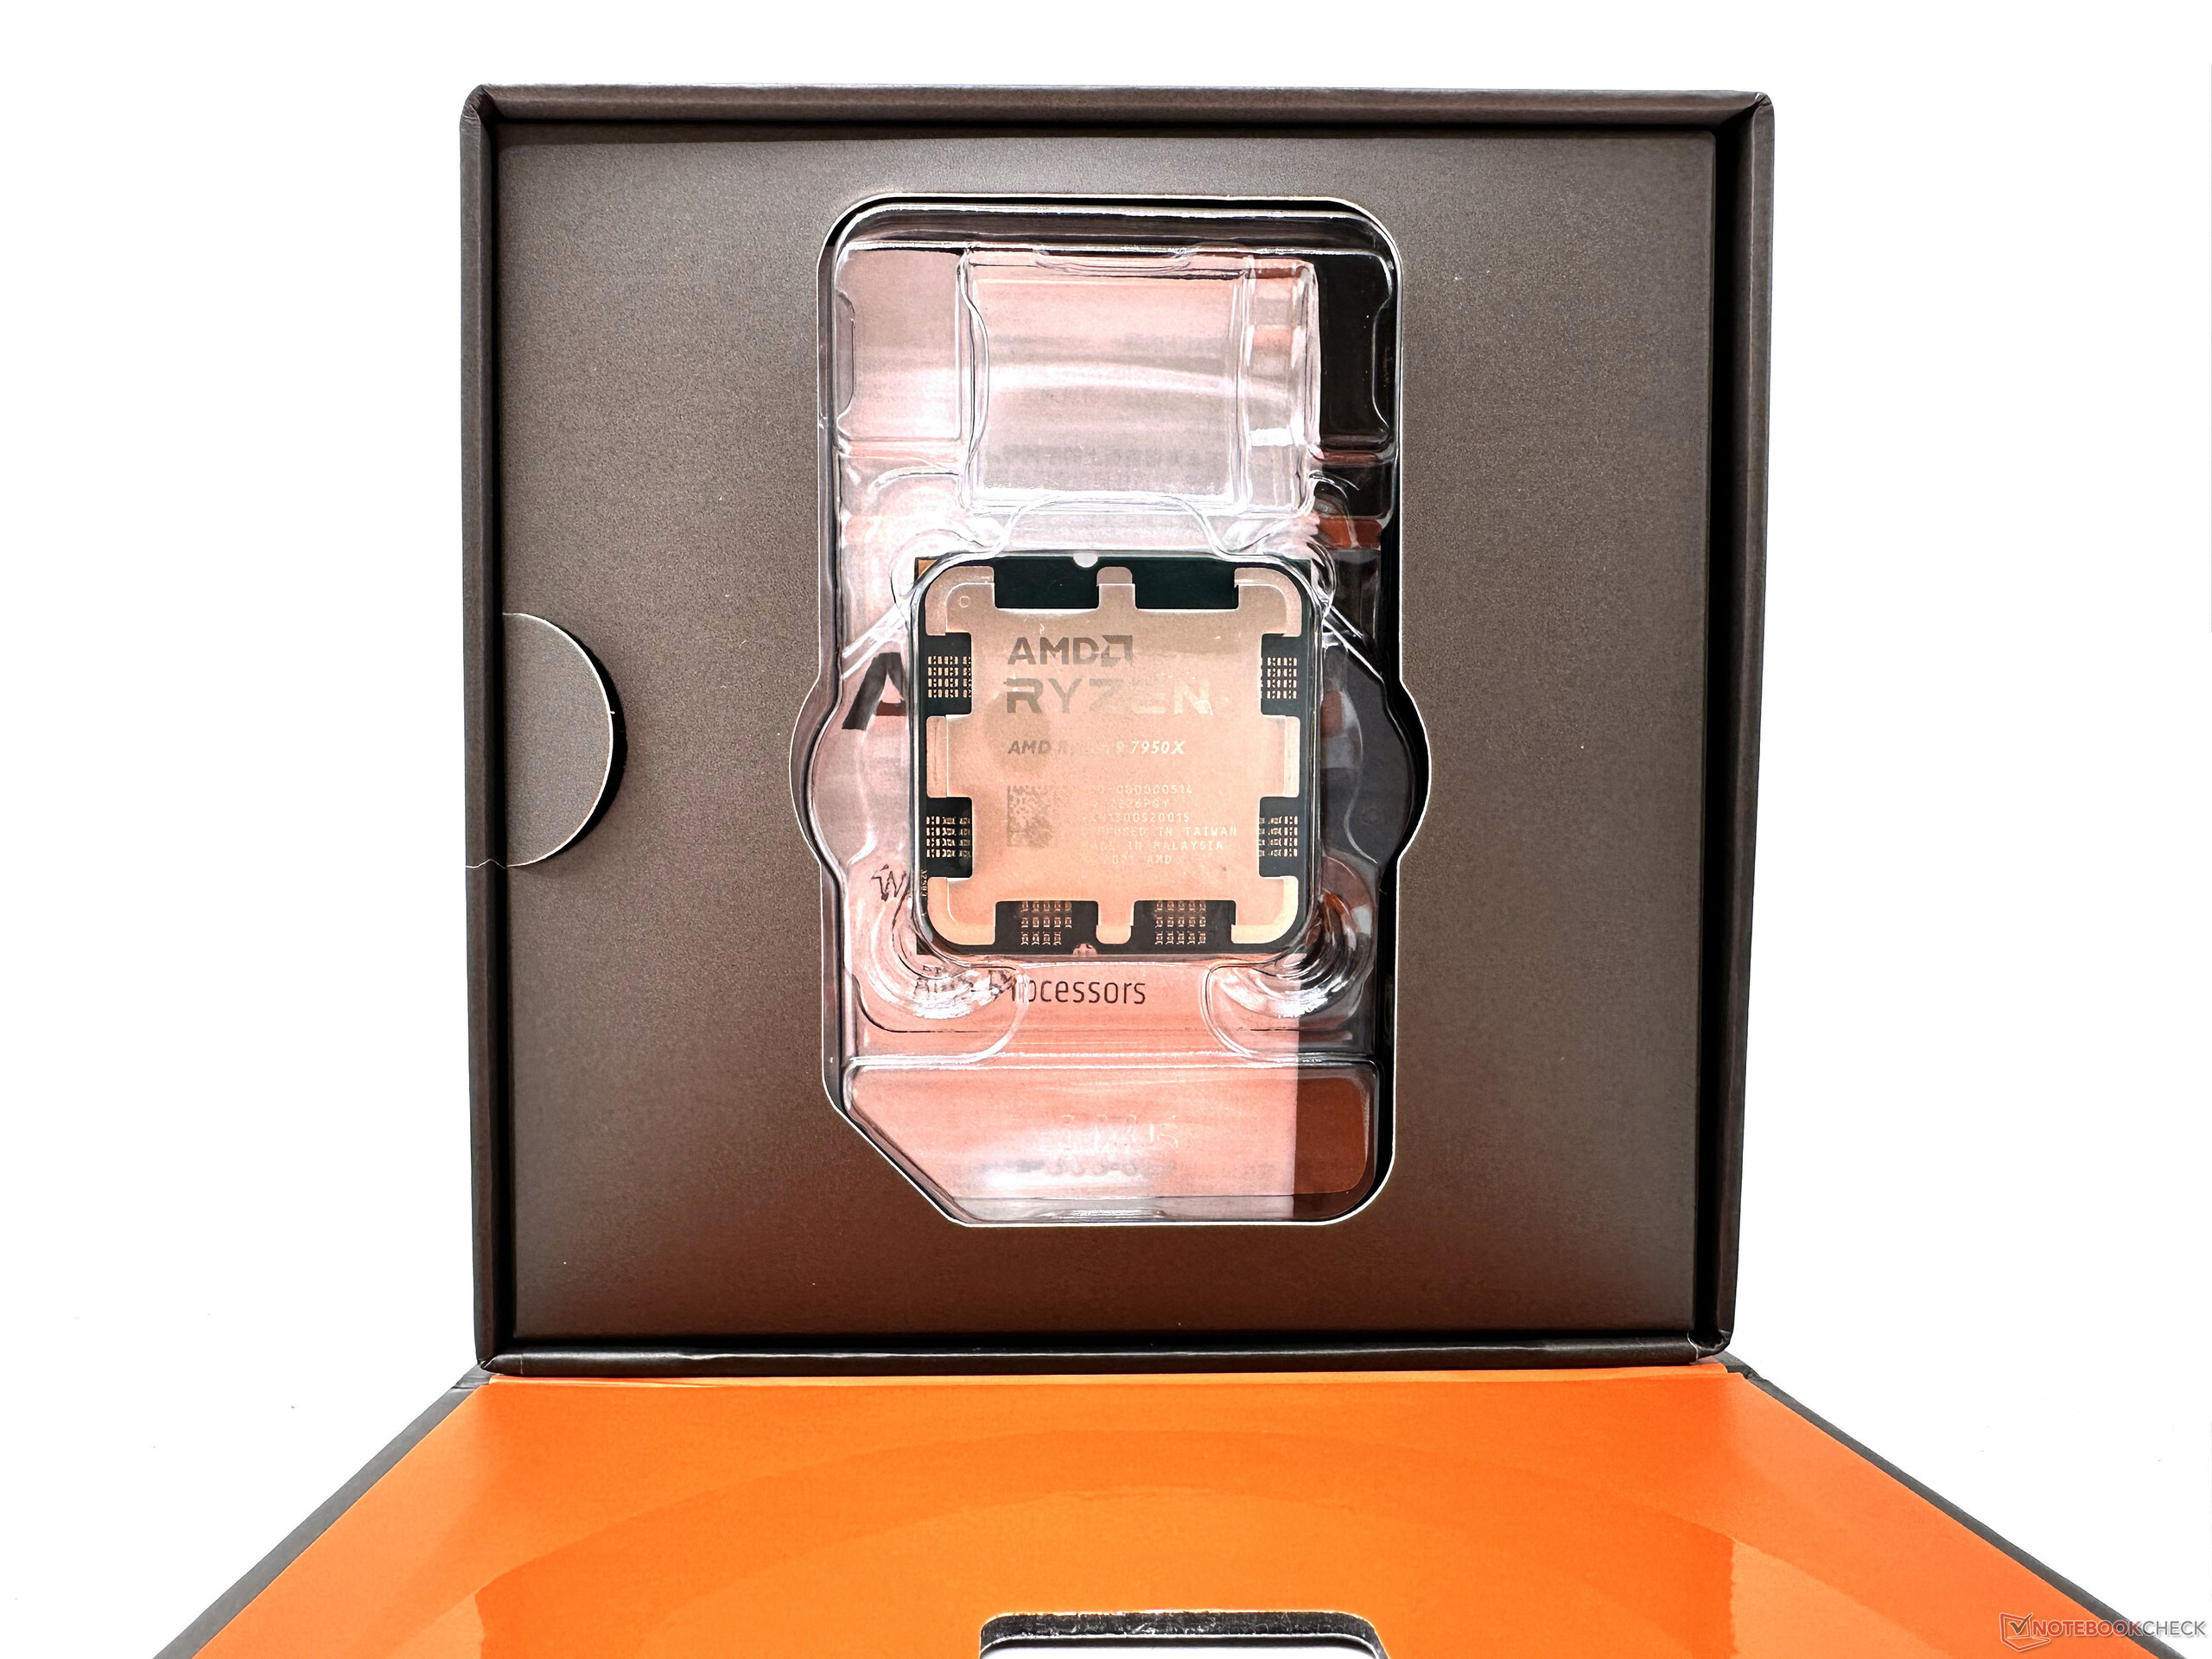
AMD Ryzen 9 7950X and AMD Ryzen 7 7700X Review: Superlative performance and efficiency gains that give Raptor Lake a run for the money
After having held on to the AM4 platform for more than half a decade, Zen 4 marks AMD's first generational shift to a new era of PC computing. The Raphael Zen 4 lineup, which has four SKUs so far, brings with it native support for DDR5 and PCIe Gen 5 technologies. Apart from these, Zen 4 processors come with AVX-512 instruction support, a built-in RDNA 2 iGPU, and the promise of increased IPC gains and power efficiency.
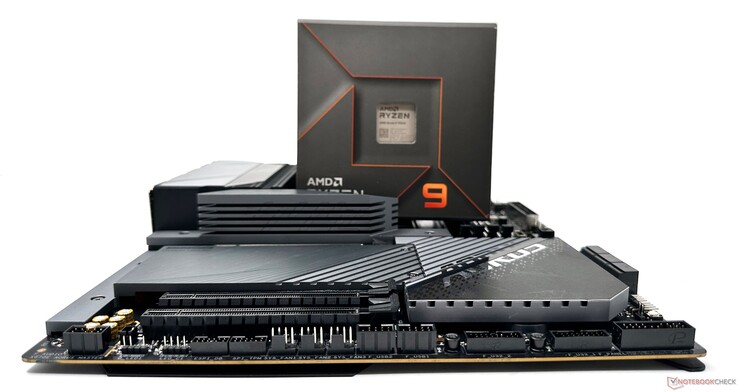
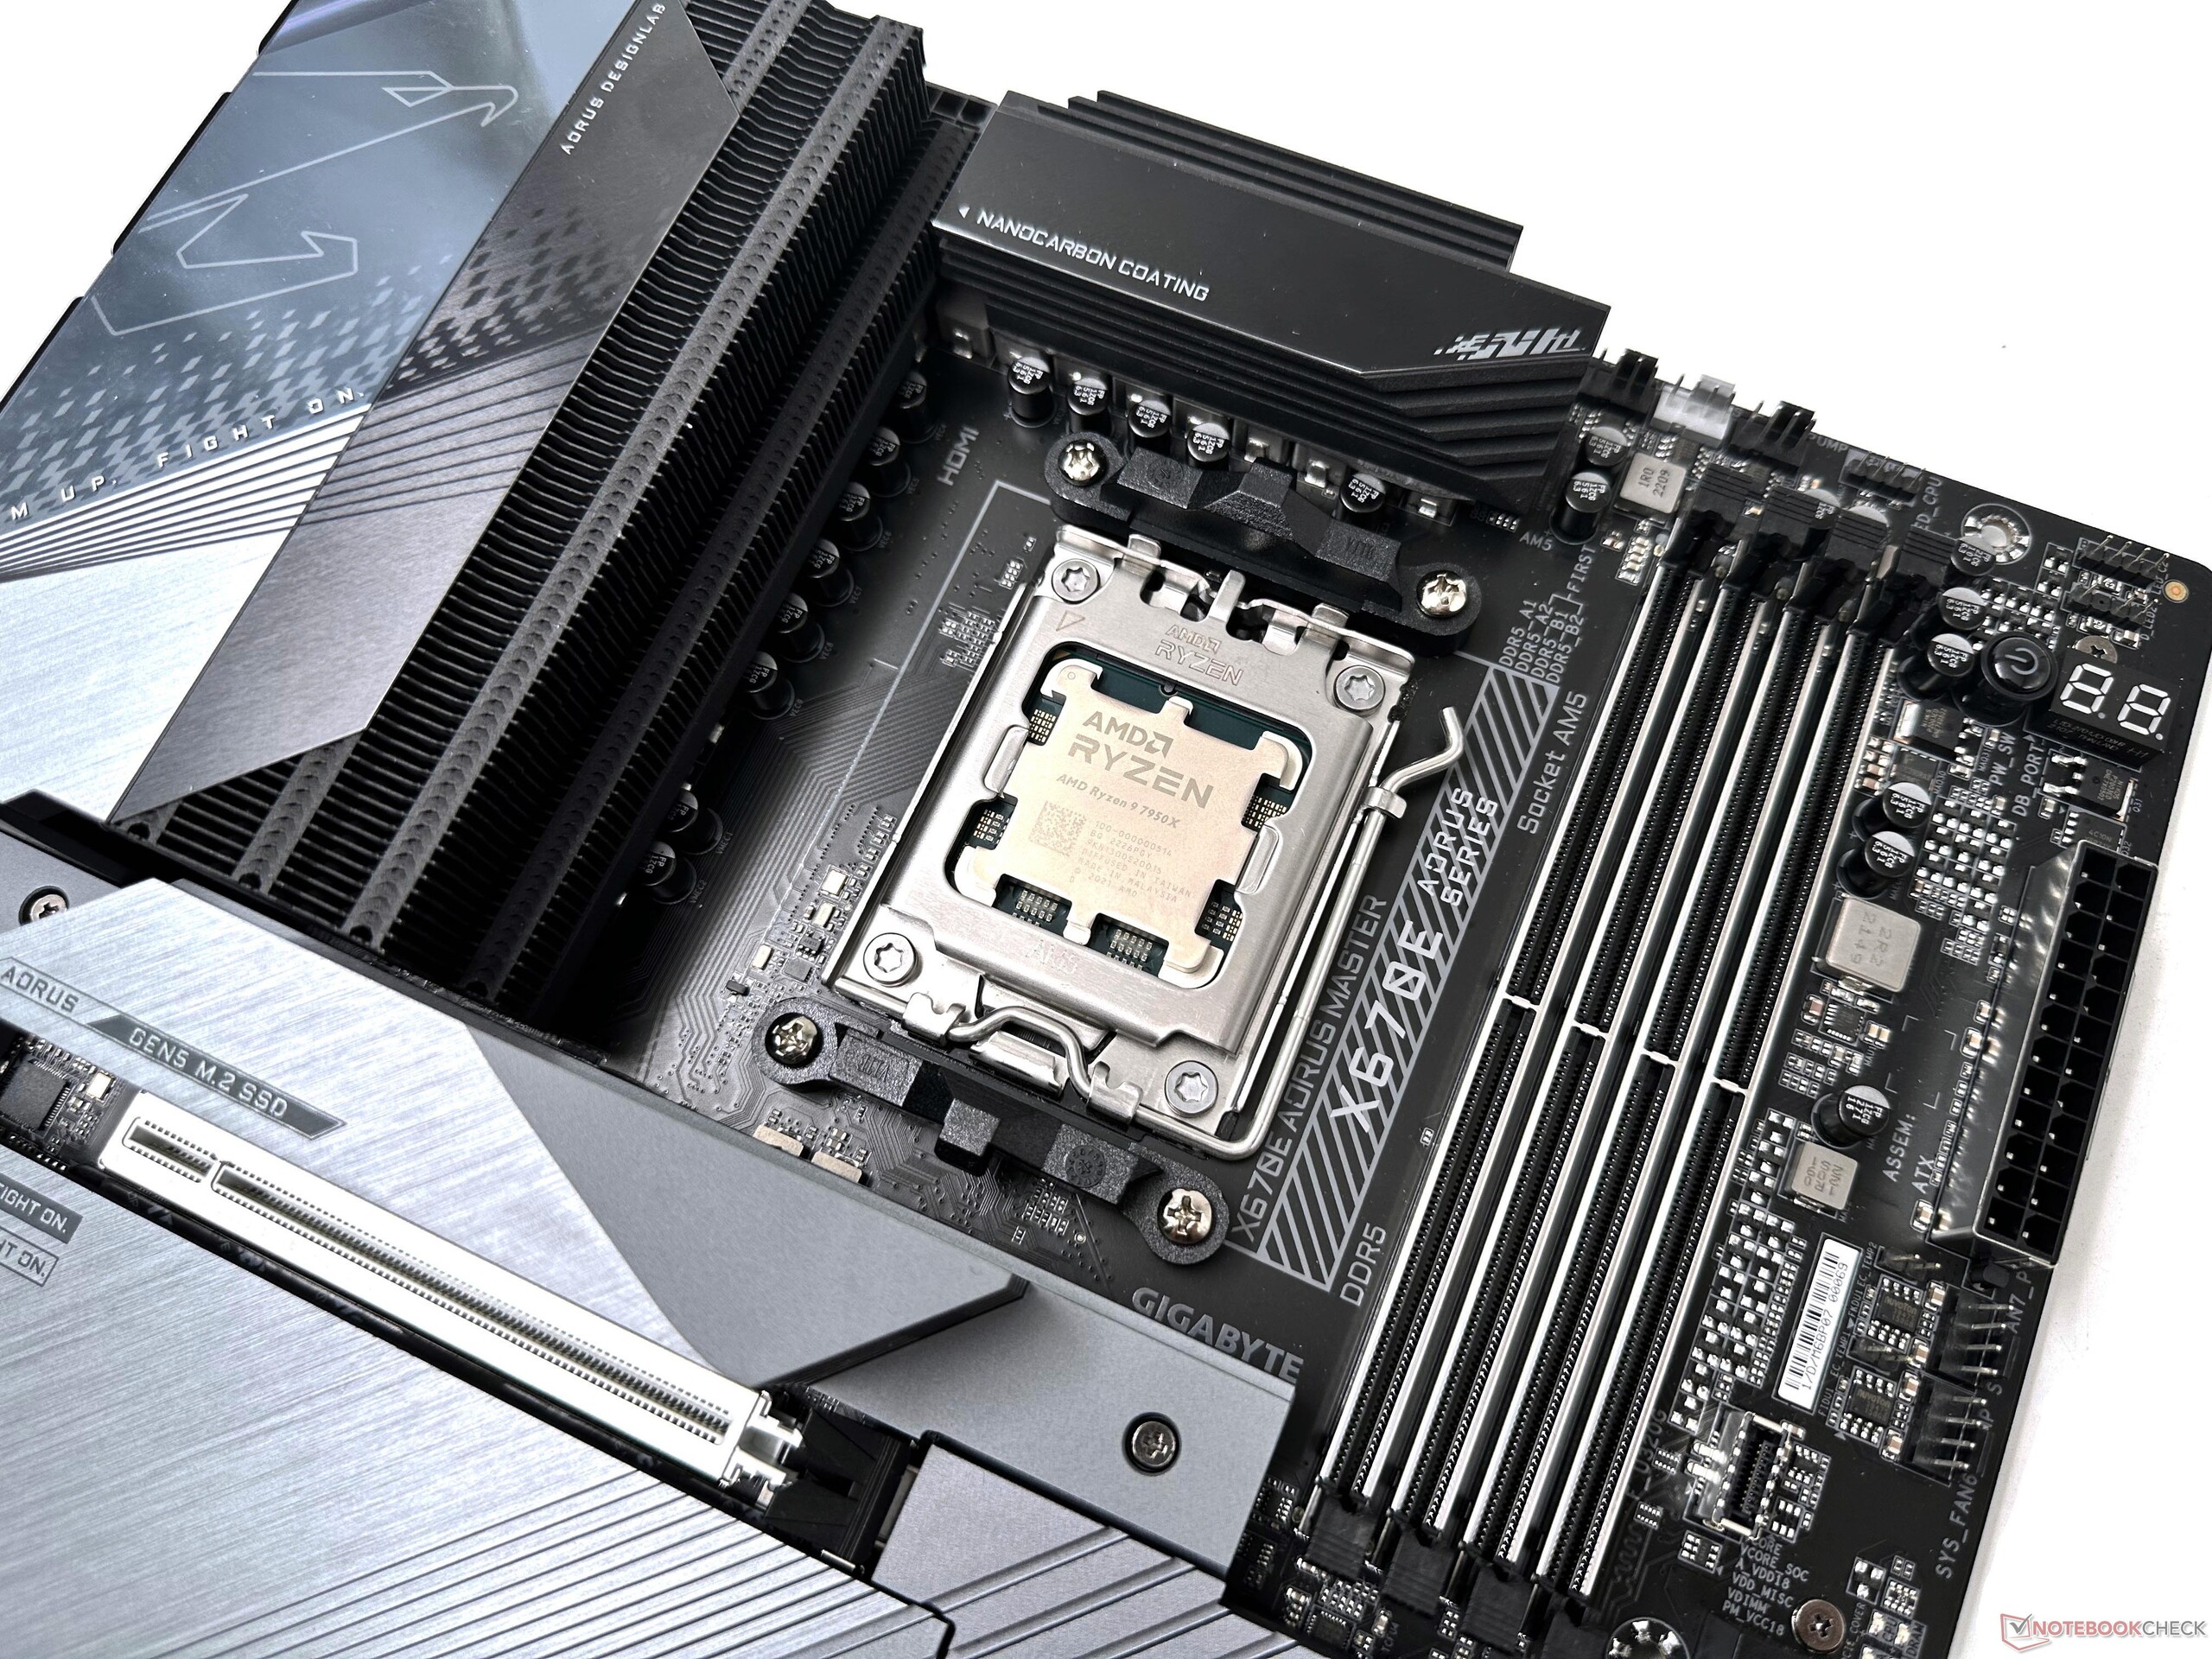
The Zen 4 Ryzen 7000 series require new socket AM5-based motherboards, with the flagship X670E boards even featuring daisy-chained dual-PROM21 chipsets. The new LGA 1718 socket allows for increased power limits up to 230 W PPT, which can accommodate CPUs up to 170 W TDP.
Zen 4's core complex dies (CCDs) are fabbed on the TSMC 5 nm node while the I/O die, which houses the 2-CU RDNA 2 iGPU, PCIe Gen 5 lanes, and the DDR5 memory controller, uses TSMC 6 nm. Unlike Intel Raptor Lake, which supports both DDR4 and DDR5, AM5 supports only DDR5 memory.
While this does bring several engineering advantages, there is a short term hiccup for the consumer since DDR5 prices remain on the higher side compared to DDR4.
With AM4, users had to configure the fabric, memory controller, and memory clocks to run in a 1:1:1 ratio, which meant that DDR4-3600 RAM was the sweet spot for Ryzen 5000. In Ryzen 7000, the fabric clock can be set to Auto while the memory controller and memory clocks can run in a 1:1 ratio.
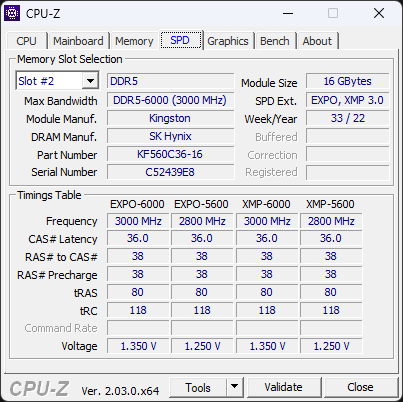
AMD recommends DDR5-6000 RAM as the sweet spot for Ryzen 7000. Users can select from pre-determined EXPO profiles, which is basically AMD's royalty-free way of defining one-click memory OC, similar in many ways to Intel's XMP. Our test platform took an unusually long time for adjusting to new EXPO profiles, but newer BIOS updates should enable faster changes.
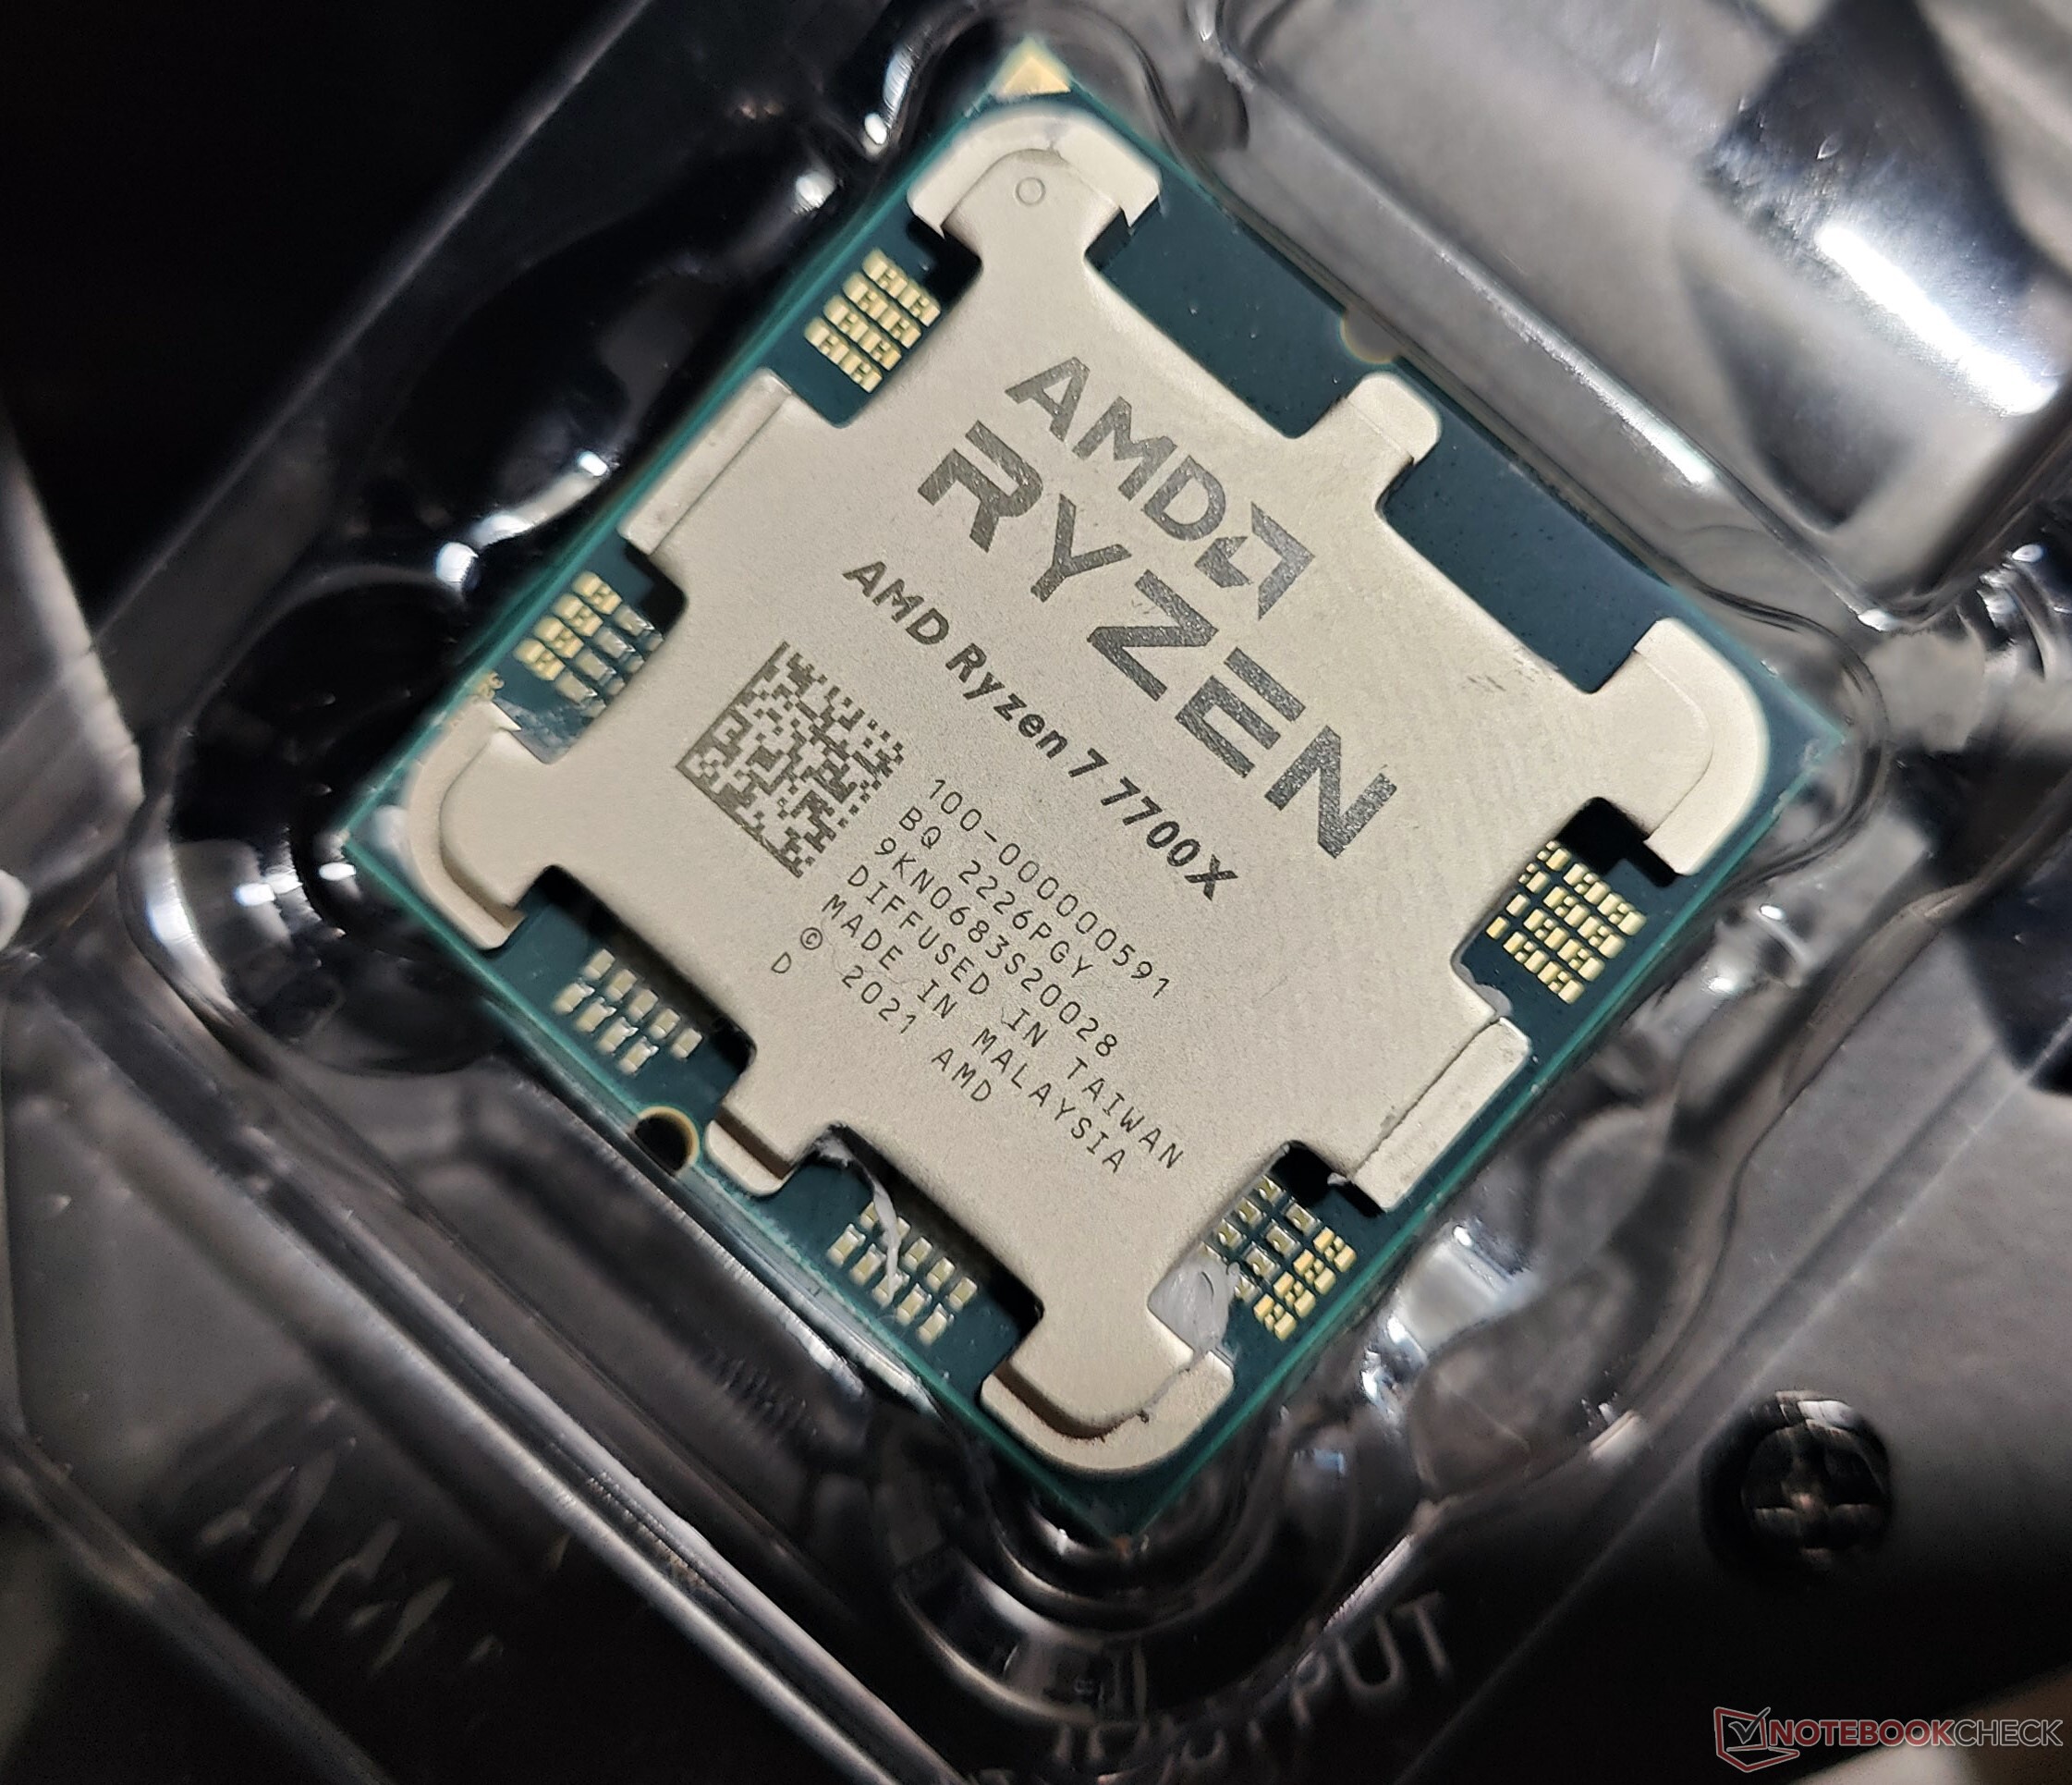
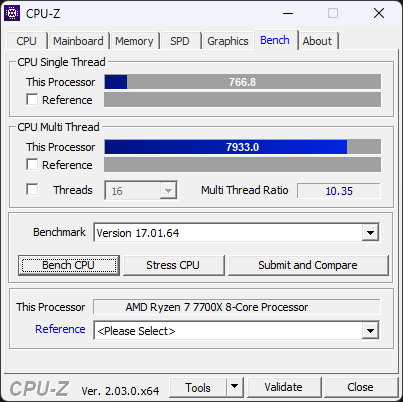
We have previously reviewed the AMD Ryzen 9 7900X and the Ryzen 5 7600X and came out pretty impressed with what's on offer. In this review, we complete the current Zen 4 Ryzen 7000 stack by testing out the Ryzen 9 7950X and the Ryzen 7 7700X in detail. Now that Intel's Raptor Lake lineup is also available, the comparisons become even more interesting.

An overview of AMD 'Raphael' Zen 4 Ryzen 7000 desktop processors
| SKU | Cores/Threads | Base Clock | Turbo Clock | L2 Cache | L3 Cache | TDP | PPT | Launch Price |
|---|---|---|---|---|---|---|---|---|
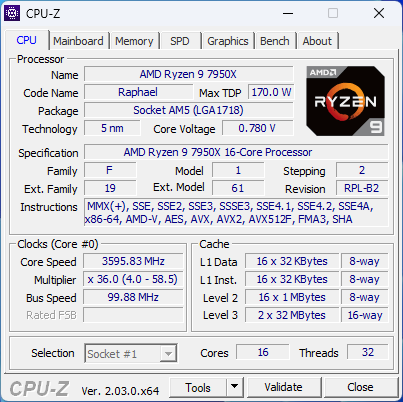
| Ryzen 9 7950X | 16/32 | 4.5 GHz | 5.7 GHz | 16x 1 MB | 64 MB | 170 W | 230 W | US$699 / €849 |
| Ryzen 9 7900X | 12/24 | 4.7 GHz | 5.6 GHz | 12x 1 MB | 64 MB | 170 W | 230 W | US$549 / €669 |
| Ryzen 7 7700X | 8/16 | 4.5 GHz | 5.4 GHz | 8x 1 MB | 32 MB | 105 W | 142 W | US$399 / €479 |
| Ryzen 5 7600X | 6/12 | 4.7 GHz | 5.3 GHz | 6x 1 MB | 32 MB | 105 W | 142 W | US$299 / €359 |
The test bench: Zen 4 gets paired with the RTX 3090
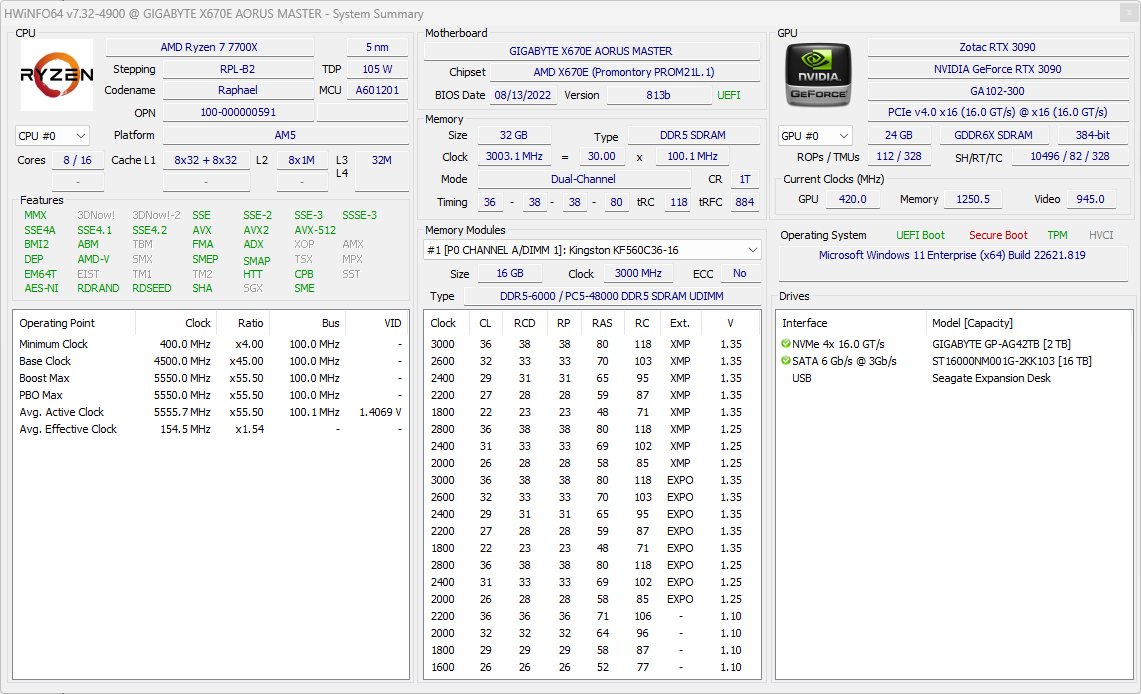
We used the following components for testing the Ryzen 7 7700X and the Ryzen 9 7950X:
- Cooler Master MasterFrame 700 test bench
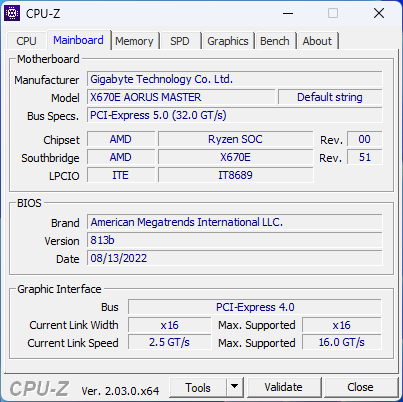
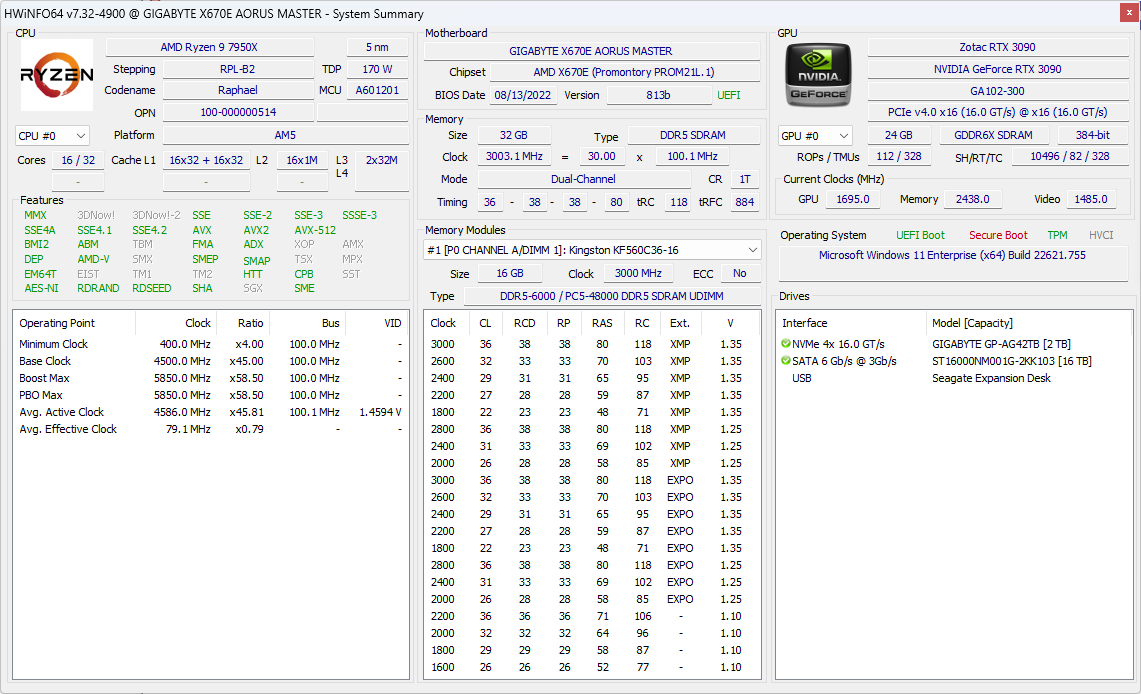
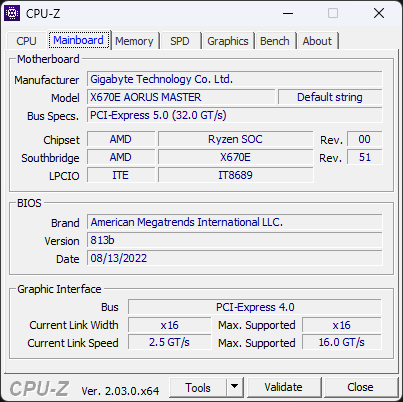
- Gigabyte X670E Aorus Master motherboard with reference BIOS version 813b
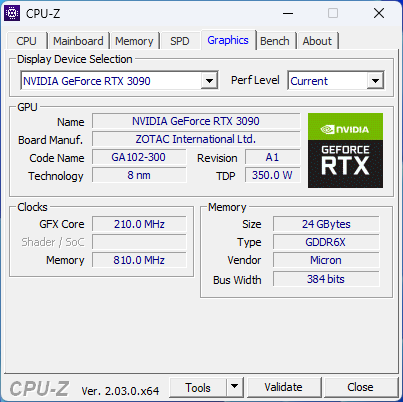
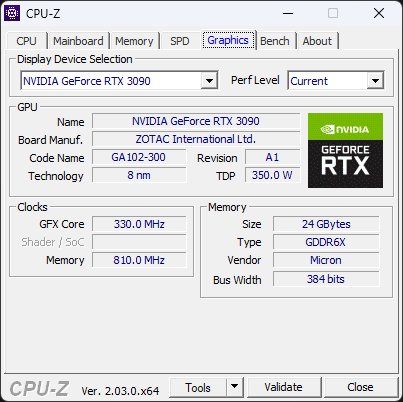
- Zotac Gaming GeForce RTX 3090 Trinity GPU
- Gigabyte Aorus Gen 4 2 TB NVMe SSD for benchmarks and games
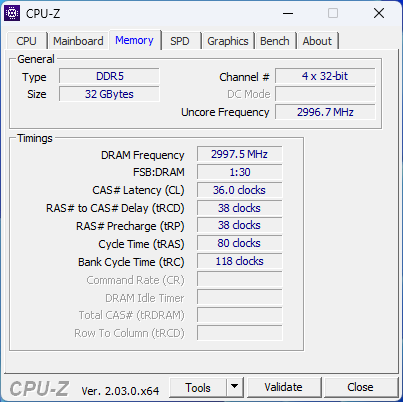
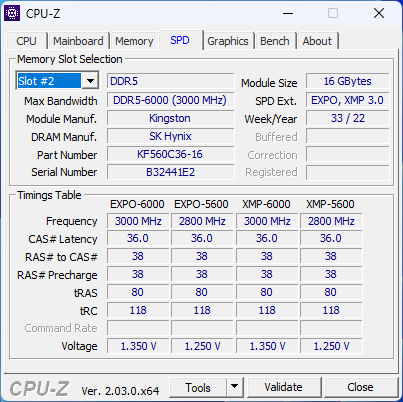
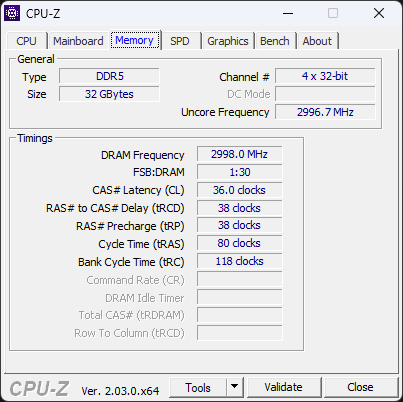
- 2x 16 GB Kingston Fury Beast DDR5-6000 RAM with timings 36-38-38-80 at 1.35 V
- Gigabyte M28U 4K 144 Hz monitor
- Cooler Master MasterLiquid ML360L V2 ARGB AIO cooler
- Cooler Master MVE Gold 1250 V2 fully modular PSU
We would like to thank AMD for supplying the Ryzen 7 7700X and Ryzen 9 7950X CPUs, the X670E Aorus Master motherboard, and the Kingston DDR5 memory kit. We also would like to thank Zotac for the RTX 3090 Trinity GPU, Gigabyte for the M28U monitor and Aorus NVMe SSD, and finally Cooler Master for the test bench, AIO cooler, and the power supply.
CPU benchmarks: Cut-throat competition with Raptor Lake
While cumulative scores see the Intel and AMD flagships tieing with each other, individual benchmarks do show some differences. For instance, the Ryzen 9 7950X is about 11% slower in Cinebench R23 single-core compared to the Core i9-13900K.
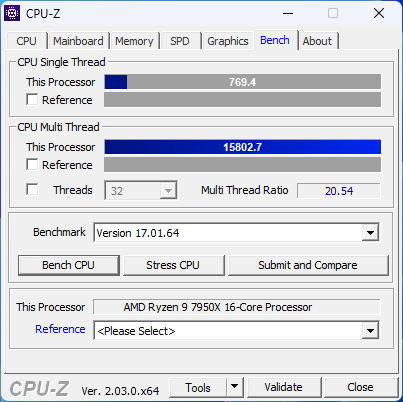
AMD Ryzen 9 7950X
The delta between the Ryzen 9 7950X and the Core i9-13900K is not of much significance in Cinebench R20, Cinebench R15, and Geekbench single-core tests.
The Ryzen 9 7950X does have a 20% lead over the Core i9-13900K in TrueCrypt and is able to beat the Raptor Lake flagship by a whisker in HWBOT x264 4K and 7-Zip multi. In most other cases, the performances of both the Ryzen 9 7950X and the Core i9-13900K are virtually identical.
The Core i9-13900K seems to have an ever-so slight advantage in multi-core runs, but the overall results are in line with what we would consider to be run-to-run variations.
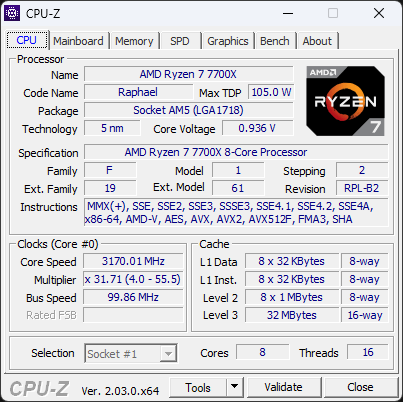
AMD Ryzen 7 7700X
Interestingly, the 8C/16T Ryzen 7 7700X could muster an edge over the 14C/20T Core i5-13600K in cumulative scores across all tests. While both the Core i5-13600K and the Ryzen 7 7700X show near-identical single-core performance, the former can lead by up to 24% in Cinebench multi-core tests.
The Ryzen 7000 processors in general seem to be performing better than their Intel counterparts in the 7-Zip single-core test, with the Ryzen 7 7700X leading the Core i5-13600K by as much as 23%. The Ryzen 7 7700X also took the least amount of time among all CPUs in comparison in our LibreOffice 20-document PDF conversion benchmark.
* ... smaller is better
Overall, both the Ryzen 9 7950X and the Ryzen 7 7700X perform admirably in our CPU benchmark suite. The 16-core AMD Zen 4 flagship CPU ties with the Intel Raptor Lake Core i9-13900K in overall CPU performance, while the difference between the Ryzen 7 7700X and the Core i5-13600K are well within the margin of error.
The Ryzen 9 7950X offers a decent 29% improvement in cumulative CPU performance over the Ryzen 9 5950X. Users upgrading from the Alder Lake Core i9-12900K will find a substantial 36% gain in overall performance, with the benefits being largely with respect to multi-threaded workloads.
The Ryzen 7 7700X is able to comfortably position itself ahead of the Core i9-12900K single-core, which makes it a good value proposition for heavily single-threaded workflows such as games.
Cinebench R15 Multi Loop
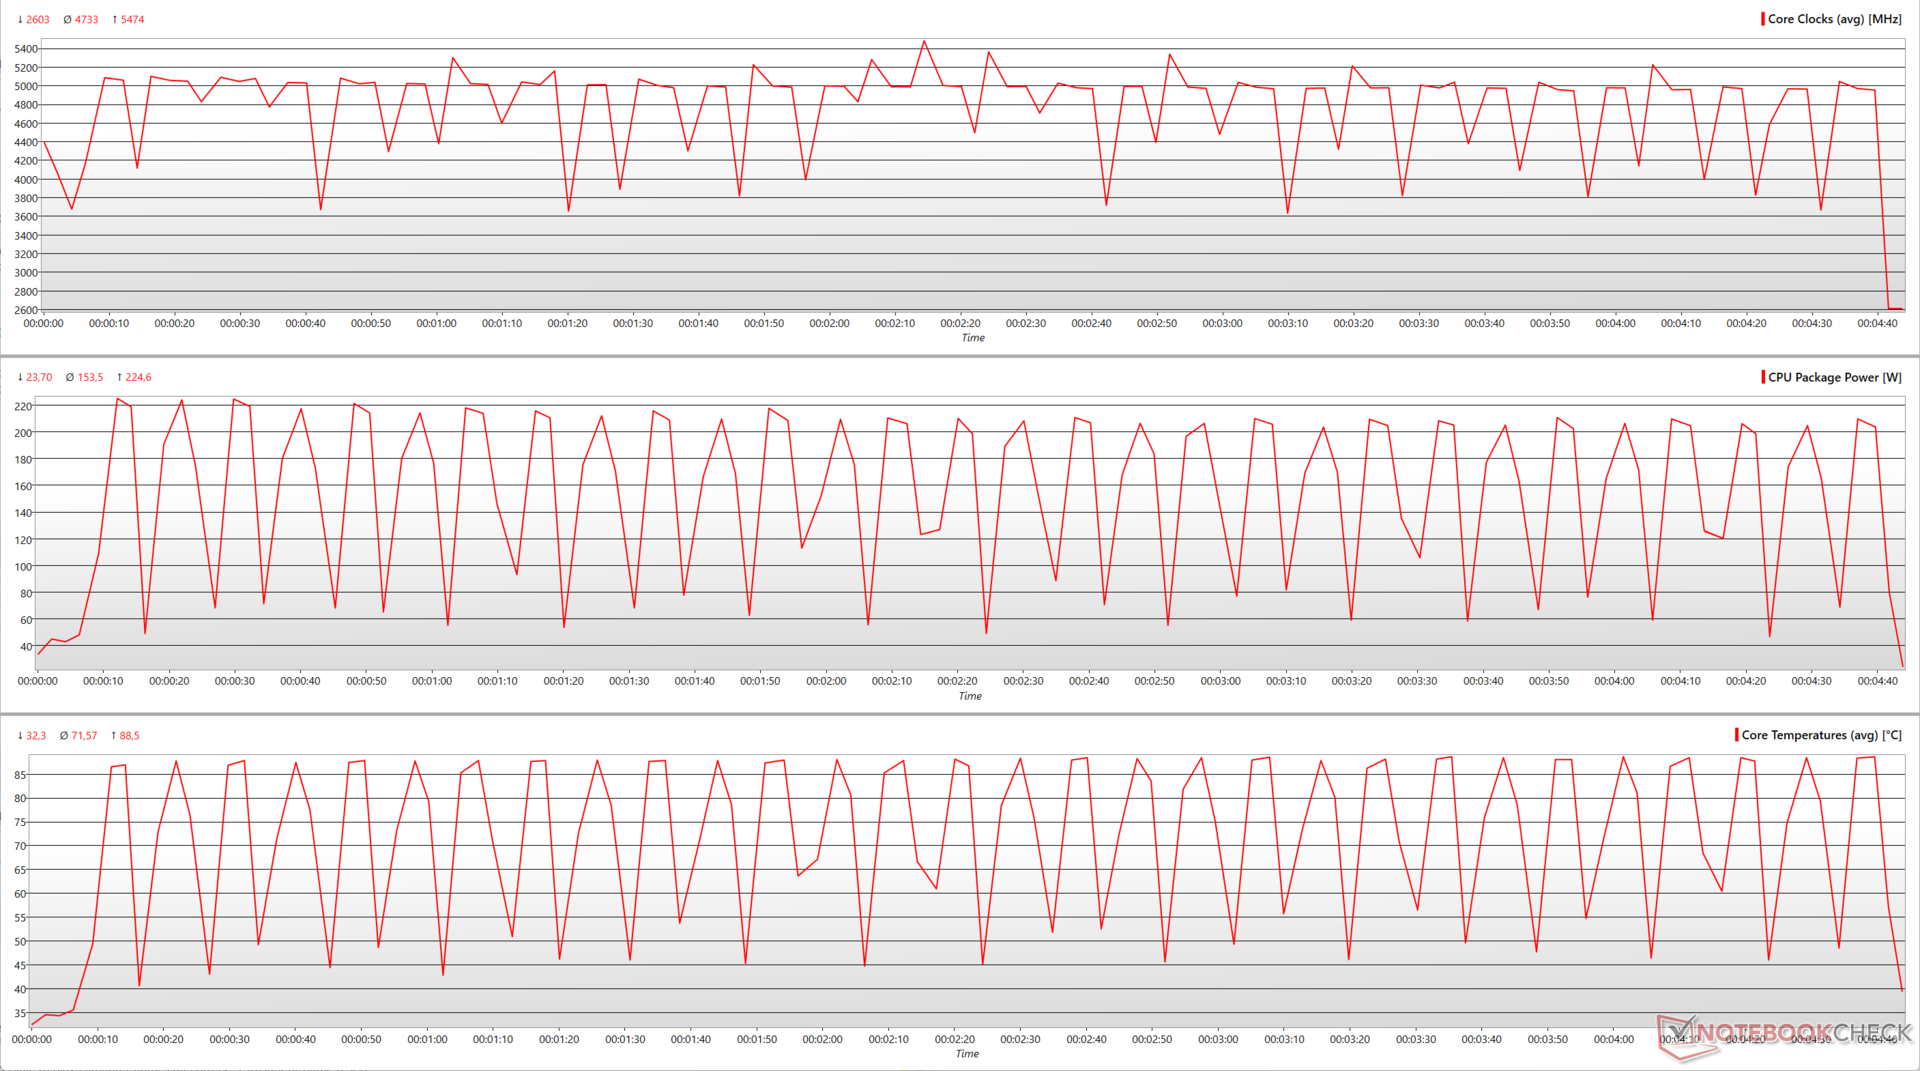
AMD does not supply a cooler in the box for either the Ryzen 9 7950X or the Ryzen 7 7700X, so you will have to rely on a capable third-party option. The Ryzen 7000 processors have received some criticism for the 95 °C TjMax, but AMD assures that this is not an issue.
According to the company, Ryzen 7000 series chips are designed to run at a 95 °C TjMax 24/7 without any risk of damage. Such a high maximum safe operating temperature allows the Precision Boost Overdrive boost algorithm to squeeze the most performance out of the processor. It is possible to override this to even higher values (up to a maximum of 115 °C) or switch to Eco mode for cooler operation (more on that shortly).
Both the Ryzen 9 7950X and the Ryzen 7 7700X offer a well-sustained, throttle-free operation thanks to the Cooler Master MasterLiquid ML360L V2 ARGB AIO's excellent cooling performance.
System performance: Significant productivity uplift over Zen 3
The Ryzen 9 7950X and the Ryzen 7 7700X have no qualms in running most productivity applications. AIDA64 tests consistently see the Ryzen 9 7950X leading the charts, often with significant leads over the Core i9-13900K. A similar situation is seen with the Ryzen 7 7700X and the Core i5-13600K as well. The CPU PhotoWorxx test, however, sees an Intel domination.
PCMark 10 would not run in the default settings of the Ryzen 7 7700X for some reason, though we could run the benchmark in the processor's Eco mode. Hence, we are not including the 7700X in the below chart.
CrossMark, on the other hand, sees the Ryzen 9 7950X almost on par with the Core i9-13900K, which is also the case with the Ryzen 7 7700X and Core i5-13600K pair.
Similar to what we had seen with CPU benchmarks earlier, the Ryzen 7000 series present significant gen-on-gen gains in productivity tests as well. For instance, the Ryzen 9 7950X shows a massive 69% increase in overall CrossMark scores, while also displaying an overwhelming performance advantage in most AIDA64 CPU tests.
In 3DMark CPU tests, the Core i9-13900K does have a slight lead over the Ryzen 9 7950X in Fire Strike Physics, while the Ryzen 7 7700X and Core i5-13600K are tied. Time Spy CPU test sees Intel processors leading in general, with the Ryzen 9 7950X trailing behind the Core i9-13900K by 18%.
| PCMark 10 Score | 10153 points | |
Help | ||
* ... smaller is better
Eco Mode: 65 W Ryzen 9 7950X outperforms Core i9-12900K
Eco mode is basically AMD-speak for running the CPU at a lower TDP. With Zen 4, the company is touting substantial power savings with little impact on performance. The offered TDP values depend on the SKU — a 170 W CPU can be configured to run at 105 W or 65 W, while a 105 W chip can be lowered to 65 W.
Our test Gigabyte X670E Aorus Master board could only be run with AMD's reference BIOS 813b. This meant that our setup did not offer a one-click option to enable Eco mode, although retail units should be able to upgrade to newer versions that offer a more straightforward approach. You can also enable these settings from the latest version of Ryzen Master as well.
Nevertheless, we used the following values provided by AMD in the firmware's PBO settings to enable the corresponding TDPs:
- 65 W TDP = 88,000 PPT; 75,000 TDC; 150,000 EDC
- 105 W TDP = 142,000 PPT; 110,000 TDC; 170,000 EDC
- 170 W TDP = 230,000 PPT; 160,000 TDC; 225,000 EDC
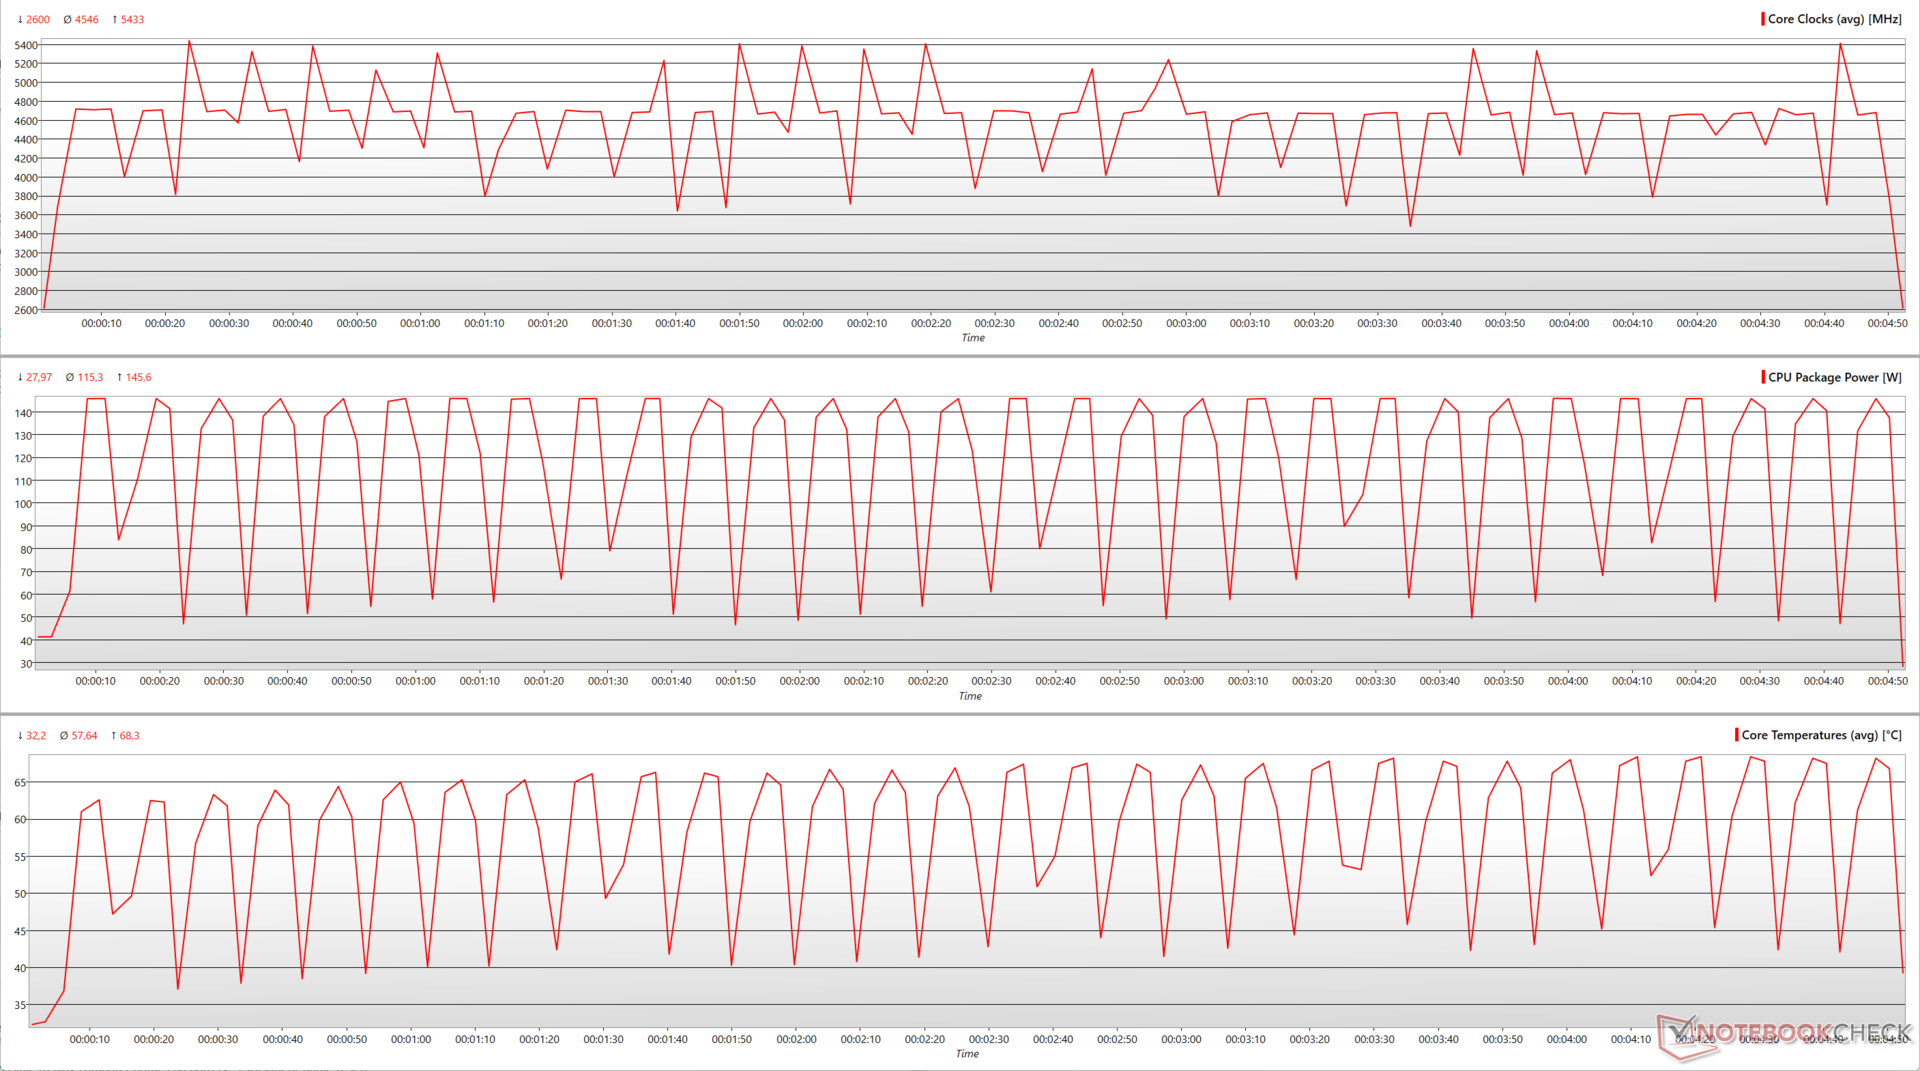
We immediately see the benefits of lowering the Ryzen 9 7950X's TDP in the Cinebench R15 multi-core 30-loop test. At 105 W TDP, the Ryzen 9 7950X loses just about 7% performance, with a slight drop in the maximum boost from 5.47 GHz to 5.43 GHz. Peak core temperatures also see a significant 22% drop from 88.5 °C to 68.3 °C.
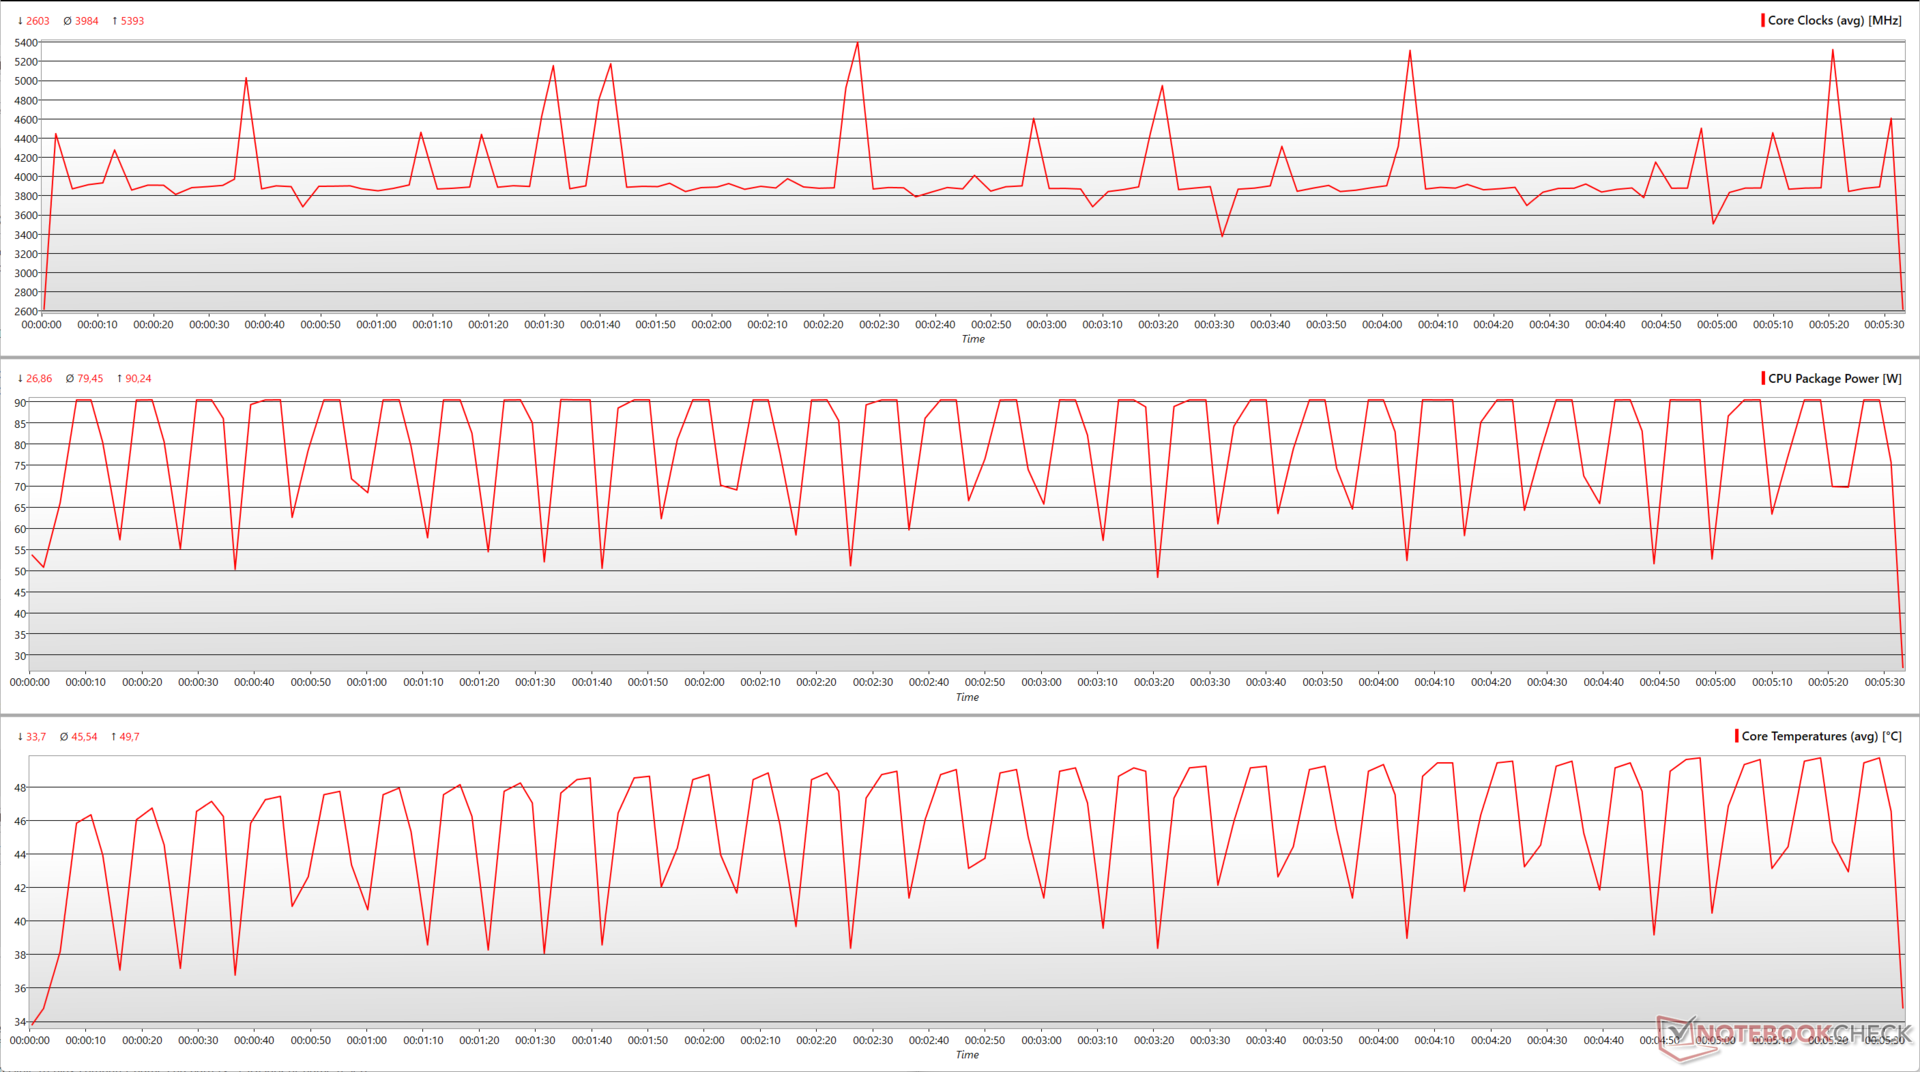
At 65 W, the Ryzen 9 7950X loses about 22.4% of its performance in the benchmark, given the marked reduction in core clocks. However, the processor now has a much lower core temperature of just about 50 °C with a maximum package power at just 90 W.
| Ryzen 9 7950X TDP | CB R15 Multi-Core Score | Average Core Clock (GHz) | Max. Core Clock (GHz) | Max. Package Power (W) | Max. Core Temperature (°C) |
|---|---|---|---|---|---|
| 170 W | 6,236 | 4.77 | 5.47 | 224.6 | 88.5 |
| 105 W | 5,800 (-7%) | 4.54 -(4.82%) | 5.43 (-0.73%) | 145.6 (-35.17%) | 68.3 (-22.82%) |
| 65 W | 4,836 (-22.4%) | 3.98 (-16.56%) | 5.39 (-1.46%) | 90.24 (-59.82%) | 49.7 (-43.84%) |
The overall performance hit in going from 170 W to 105 W is negligible for the most part, though very intensive multi-core workloads may take a slightly higher hit. The difference between 170 W and 65 W is more perceivable, with about a 9% cumulative reduction in tests.
Frame rates in The Witcher 3 at 1080p Ultra do not seem to be affected by the TDP reduction. We did notice marginally higher average fps at the lower TDPs, but the maximum fps values were lower compared to the default TDP.
| Performance rating - Percent | |
| Intel Core i9-13900K | |
| AMD Ryzen 9 7950X | |
| AMD Ryzen 9 7950X ECO 105 W | |
| AMD Ryzen 9 7900X | |
| AMD Ryzen 9 7950X ECO 65 W | |
| Intel Core i9-12900K | |
| Intel Core i5-13600K | |
| AMD Ryzen 7 7700X | |
| AMD Ryzen 7 7700X ECO 65 W | |
| AMD Ryzen 9 5950X | |
| AMD Ryzen 5 7600X | |
| AMD Ryzen 9 5900X | |
| Intel Core i5-12600K | |
| AMD Ryzen 7 5800X | |
| AMD Ryzen 7 5800X3D | |
| AMD Ryzen 5 5600X | |
| Cinebench R23 | |
| Single Core | |
| Intel Core i9-13900K | |
| AMD Ryzen 9 7900X | |
| AMD Ryzen 9 7950X | |
| Intel Core i5-13600K | |
| AMD Ryzen 9 7950X ECO 65 W | |
| AMD Ryzen 9 7950X ECO 105 W | |
| Intel Core i9-12900K | |
| AMD Ryzen 7 7700X ECO 65 W | |
| AMD Ryzen 7 7700X | |
| AMD Ryzen 5 7600X | |
| Intel Core i5-12600K | |
| AMD Ryzen 9 5950X | |
| AMD Ryzen 9 5900X | |
| AMD Ryzen 7 5800X | |
| AMD Ryzen 5 5600X | |
| AMD Ryzen 7 5800X3D | |
| Multi Core | |
| Intel Core i9-13900K | |
| AMD Ryzen 9 7950X | |
| AMD Ryzen 9 7950X ECO 105 W | |
| AMD Ryzen 9 7950X ECO 65 W | |
| AMD Ryzen 9 7900X | |
| AMD Ryzen 9 5950X | |
| Intel Core i9-12900K | |
| Intel Core i5-13600K | |
| AMD Ryzen 9 5900X | |
| AMD Ryzen 7 7700X | |
| AMD Ryzen 7 7700X ECO 65 W | |
| Intel Core i5-12600K | |
| AMD Ryzen 5 7600X | |
| AMD Ryzen 7 5800X | |
| AMD Ryzen 7 5800X3D | |
| AMD Ryzen 5 5600X | |
| Cinebench R20 | |
| CPU (Single Core) | |
| Intel Core i9-13900K | |
| AMD Ryzen 9 7900X | |
| AMD Ryzen 9 7950X | |
| AMD Ryzen 9 7950X ECO 65 W | |
| AMD Ryzen 9 7950X ECO 105 W | |
| Intel Core i5-13600K | |
| AMD Ryzen 7 7700X ECO 65 W | |
| AMD Ryzen 7 7700X | |
| Intel Core i9-12900K | |
| AMD Ryzen 5 7600X | |
| Intel Core i5-12600K | |
| AMD Ryzen 9 5950X | |
| AMD Ryzen 9 5900X | |
| AMD Ryzen 7 5800X | |
| AMD Ryzen 5 5600X | |
| AMD Ryzen 7 5800X3D | |
| CPU (Multi Core) | |
| Intel Core i9-13900K | |
| AMD Ryzen 9 7950X | |
| AMD Ryzen 9 7950X ECO 105 W | |
| AMD Ryzen 9 7950X ECO 65 W | |
| AMD Ryzen 9 7900X | |
| AMD Ryzen 9 5950X | |
| Intel Core i9-12900K | |
| Intel Core i5-13600K | |
| AMD Ryzen 9 5900X | |
| AMD Ryzen 7 7700X | |
| AMD Ryzen 7 7700X ECO 65 W | |
| Intel Core i5-12600K | |
| AMD Ryzen 7 5800X | |
| AMD Ryzen 5 7600X | |
| AMD Ryzen 7 5800X3D | |
| AMD Ryzen 5 5600X | |
| Cinebench R15 | |
| CPU Single 64Bit | |
| Intel Core i9-13900K | |
| AMD Ryzen 9 7900X | |
| AMD Ryzen 9 7950X | |
| AMD Ryzen 9 7950X ECO 105 W | |
| AMD Ryzen 7 7700X ECO 65 W | |
| AMD Ryzen 5 7600X | |
| AMD Ryzen 9 7950X ECO 65 W | |
| AMD Ryzen 7 7700X | |
| Intel Core i5-13600K | |
| Intel Core i9-12900K | |
| Intel Core i5-12600K | |
| AMD Ryzen 9 5950X | |
| AMD Ryzen 9 5900X | |
| AMD Ryzen 7 5800X | |
| AMD Ryzen 5 5600X | |
| AMD Ryzen 7 5800X3D | |
| CPU Multi 64Bit | |
| AMD Ryzen 9 7950X | |
| Intel Core i9-13900K | |
| AMD Ryzen 9 7950X ECO 105 W | |
| AMD Ryzen 9 7900X | |
| AMD Ryzen 9 7950X ECO 65 W | |
| AMD Ryzen 9 5950X | |
| Intel Core i9-12900K | |
| AMD Ryzen 9 5900X | |
| Intel Core i5-13600K | |
| AMD Ryzen 7 7700X | |
| AMD Ryzen 7 7700X ECO 65 W | |
| AMD Ryzen 7 5800X | |
| Intel Core i5-12600K | |
| AMD Ryzen 5 7600X | |
| AMD Ryzen 7 5800X3D | |
| AMD Ryzen 5 5600X | |
| Blender - v2.79 BMW27 CPU | |
| AMD Ryzen 5 5600X | |
| AMD Ryzen 7 5800X3D | |
| AMD Ryzen 5 7600X | |
| AMD Ryzen 7 5800X | |
| Intel Core i5-12600K | |
| AMD Ryzen 7 7700X ECO 65 W | |
| AMD Ryzen 7 7700X | |
| AMD Ryzen 9 5900X | |
| Intel Core i5-13600K | |
| Intel Core i9-12900K | |
| AMD Ryzen 9 5950X | |
| AMD Ryzen 9 7900X | |
| AMD Ryzen 9 7950X ECO 65 W | |
| AMD Ryzen 9 7950X ECO 105 W | |
| AMD Ryzen 9 7950X | |
| Intel Core i9-13900K | |
| Geekbench 5.5 | |
| Single-Core | |
| Intel Core i9-13900K | |
| AMD Ryzen 9 7900X | |
| AMD Ryzen 9 7950X ECO 65 W | |
| AMD Ryzen 9 7950X ECO 105 W | |
| AMD Ryzen 9 7950X | |
| AMD Ryzen 7 7700X | |
| AMD Ryzen 7 7700X ECO 65 W | |
| AMD Ryzen 5 7600X | |
| Intel Core i9-12900K | |
| Intel Core i5-13600K | |
| Intel Core i5-12600K | |
| AMD Ryzen 9 5950X | |
| AMD Ryzen 9 5900X | |
| AMD Ryzen 7 5800X | |
| AMD Ryzen 5 5600X | |
| AMD Ryzen 7 5800X3D | |
| Multi-Core | |
| Intel Core i9-13900K | |
| AMD Ryzen 9 7950X | |
| AMD Ryzen 9 7950X ECO 105 W | |
| AMD Ryzen 9 7950X ECO 65 W | |
| AMD Ryzen 9 7900X | |
| Intel Core i9-12900K | |
| AMD Ryzen 9 5950X | |
| Intel Core i5-13600K | |
| AMD Ryzen 7 7700X | |
| AMD Ryzen 7 7700X ECO 65 W | |
| AMD Ryzen 9 5900X | |
| Intel Core i5-12600K | |
| AMD Ryzen 5 7600X | |
| AMD Ryzen 7 5800X | |
| AMD Ryzen 7 5800X3D | |
| AMD Ryzen 5 5600X | |
| HWBOT x265 Benchmark v2.2 - 4k Preset | |
| AMD Ryzen 9 7950X | |
| Intel Core i9-13900K | |
| AMD Ryzen 9 7950X ECO 105 W | |
| AMD Ryzen 9 7900X | |
| AMD Ryzen 9 7950X ECO 65 W | |
| AMD Ryzen 9 5950X | |
| Intel Core i5-12600K | |
| Intel Core i9-12900K | |
| Intel Core i5-13600K | |
| AMD Ryzen 7 7700X | |
| AMD Ryzen 9 5900X | |
| AMD Ryzen 7 7700X ECO 65 W | |
| AMD Ryzen 5 7600X | |
| AMD Ryzen 7 5800X | |
| AMD Ryzen 7 5800X3D | |
| AMD Ryzen 5 5600X | |
| R Benchmark 2.5 - Overall mean | |
| AMD Ryzen 7 5800X3D | |
| AMD Ryzen 5 5600X | |
| AMD Ryzen 9 5950X | |
| AMD Ryzen 9 5900X | |
| AMD Ryzen 7 5800X | |
| Intel Core i5-12600K | |
| Intel Core i9-12900K | |
| Intel Core i5-13600K | |
| AMD Ryzen 7 7700X ECO 65 W | |
| AMD Ryzen 9 7950X | |
| AMD Ryzen 9 7950X ECO 65 W | |
| AMD Ryzen 9 7950X ECO 105 W | |
| AMD Ryzen 7 7700X | |
| AMD Ryzen 5 7600X | |
| AMD Ryzen 9 7900X | |
| Intel Core i9-13900K | |
| LibreOffice - 20 Documents To PDF | |
| Intel Core i5-12600K | |
| AMD Ryzen 7 5800X3D | |
| AMD Ryzen 9 5900X | |
| AMD Ryzen 9 5950X | |
| AMD Ryzen 5 5600X | |
| AMD Ryzen 7 5800X | |
| Intel Core i9-12900K | |
| AMD Ryzen 5 7600X | |
| Intel Core i9-13900K | |
| AMD Ryzen 9 7950X | |
| Intel Core i5-13600K | |
| AMD Ryzen 9 7900X | |
| AMD Ryzen 7 7700X ECO 65 W | |
| AMD Ryzen 7 7700X | |
| AMD Ryzen 9 7950X ECO 65 W | |
| AMD Ryzen 9 7950X ECO 105 W | |
| The Witcher 3 - 1920x1080 Ultra Graphics & Postprocessing (HBAO+) | |
| AMD Ryzen 7 5800X3D | |
| AMD Ryzen 9 7900X | |
| AMD Ryzen 5 7600X | |
| Intel Core i5-13600K | |
| Intel Core i9-13900K | |
| AMD Ryzen 9 7950X ECO 105 W | |
| AMD Ryzen 9 7950X ECO 65 W | |
| AMD Ryzen 9 7950X | |
| AMD Ryzen 7 7700X | |
| AMD Ryzen 7 7700X ECO 65 W | |
| Intel Core i5-12600K | |
| AMD Ryzen 9 5900X | |
| AMD Ryzen 9 5950X | |
| AMD Ryzen 7 5800X | |
| AMD Ryzen 5 5600X | |
| Intel Core i9-12900K | |
* ... smaller is better
| Ryzen 7 7700X TDP | CB R15 Multi-Core Score | Average Core Clock (GHz) | Max. Core Clock (GHz) | Max. Package Power (W) | Max. Core Temperature (°C) |
|---|---|---|---|---|---|
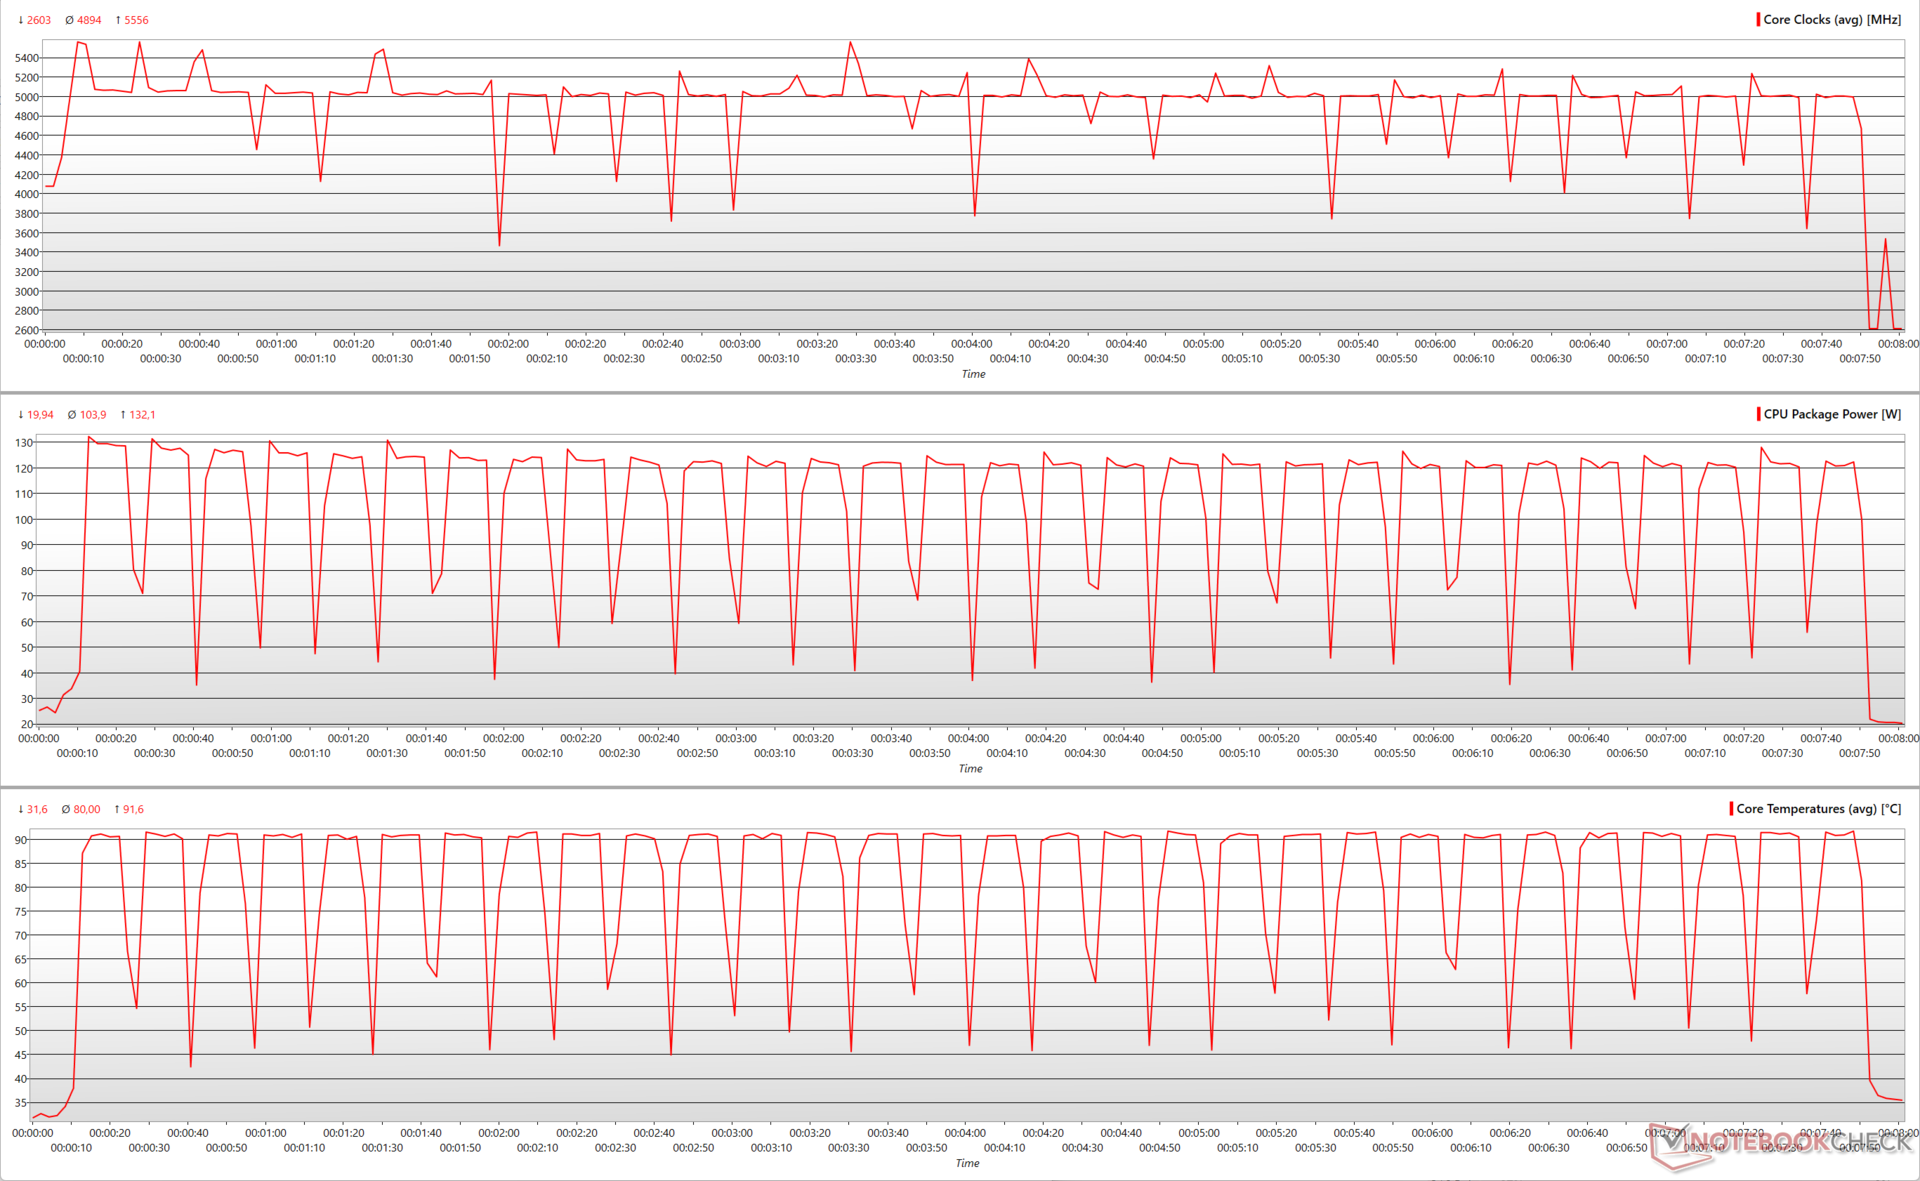
| 105 W | 3191 | 4.89 | 5.55 | 132.1 | 91.6 |
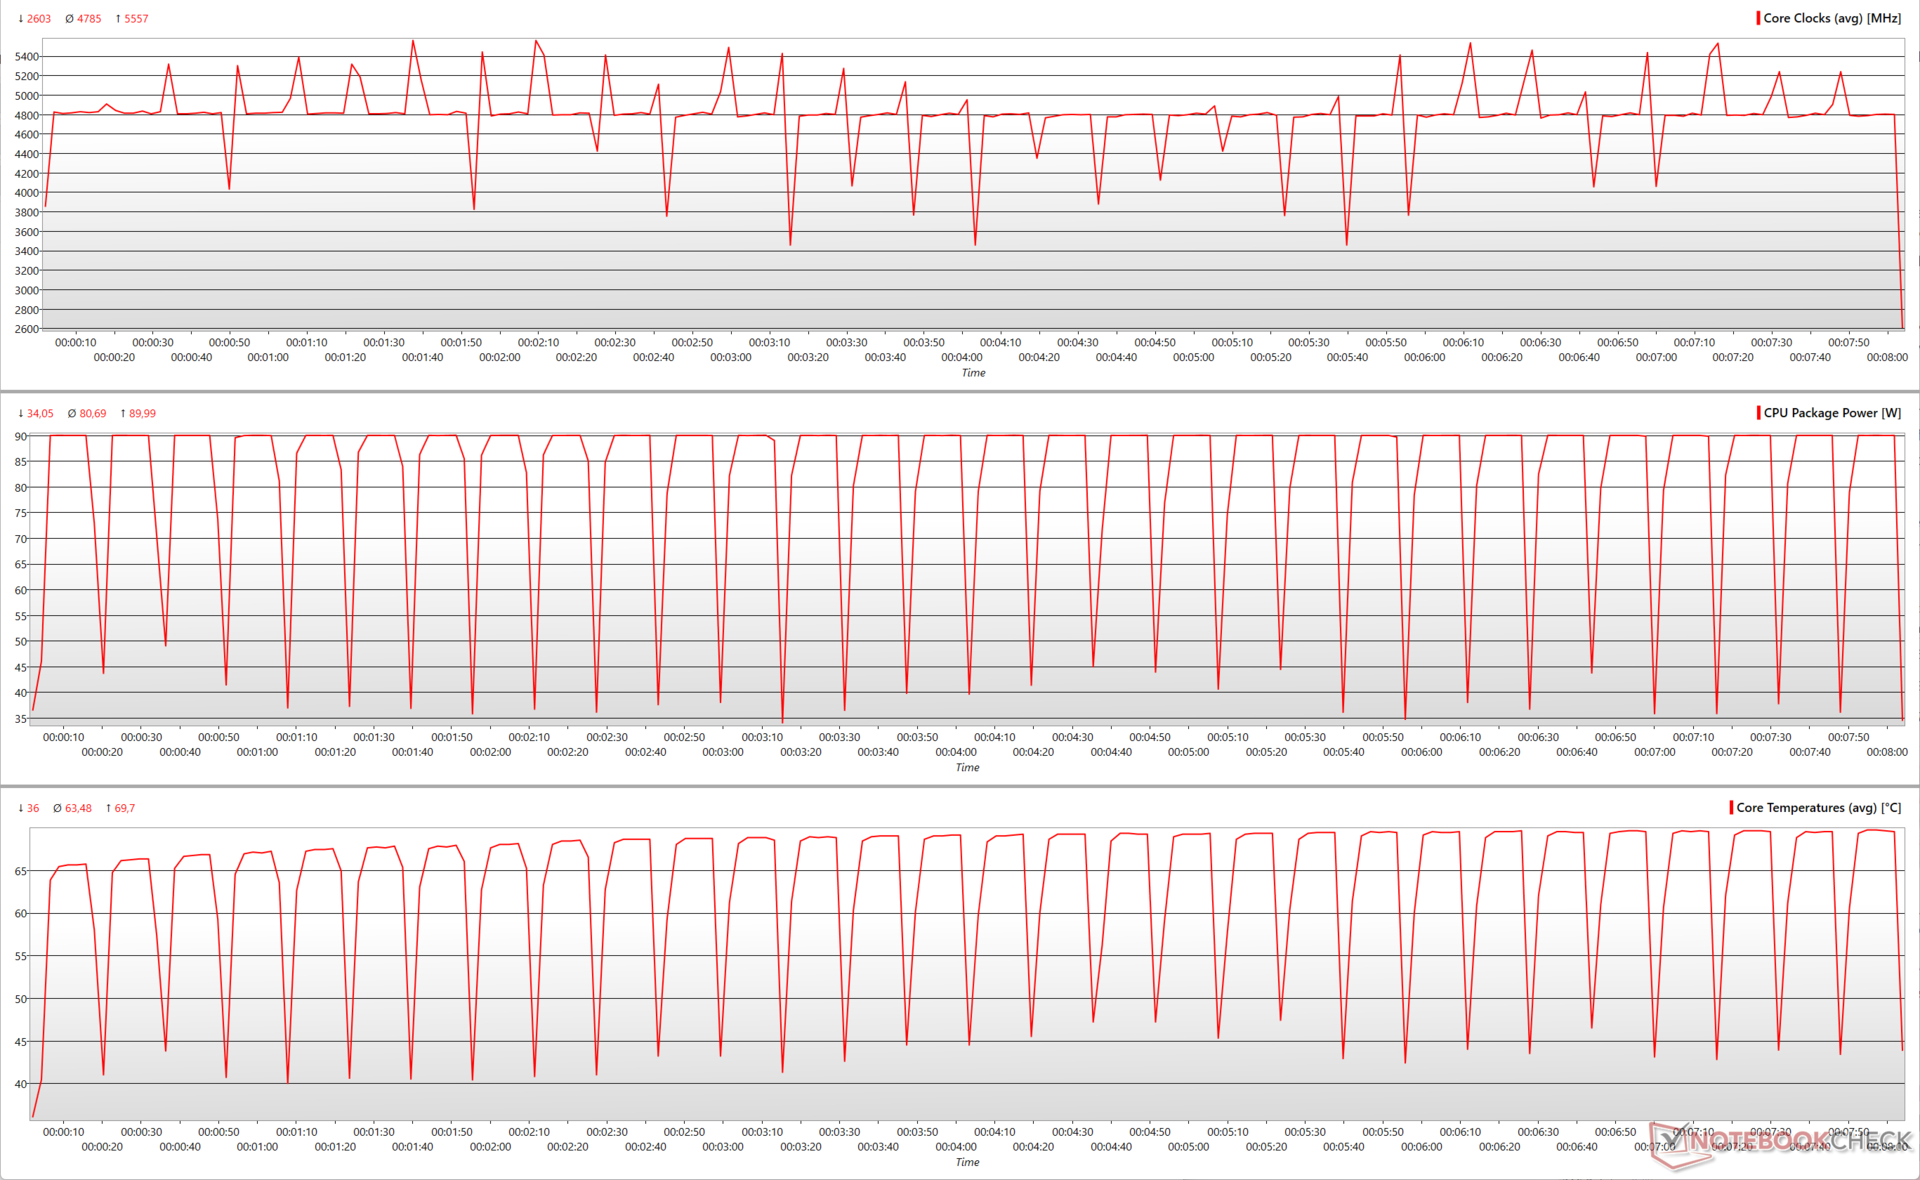
| 65 W | 3036 (-4.85%) | 4.78 (-2.24%) | 5.55 | 90 (-31.86%) | 69.7 (-23.9%) |
Lowering to 65 W from 105 W with the Ryzen 7 7700X is less drastic, with only close to a 5% reduction in Cinebench R15 multi-core scores. Though we see a slight reduction in average core clocks, the maximum clock speed still peaks at 5.55 GHz during the run.
The max. core temperature at 65 W is now close to 70 °C, which is a 24% reduction from the default setting that can result in temperatures close to 92 °C.
Cumulatively, the Ryzen 7 7700X does not lose much if operated at a 65 W TDP. The Witcher 3 at 1080p Ultra once again sees marginally higher frames at 1080p Ultra, but this can be considered as within the margin of error.
Overall, the Ryzen 9 7950X at 65 W is still 14% faster than a Core i9-12900K running at a PL1=PL2 of 241 W, which is excellent efficiency. Compared to the Core i9-13900K, the Ryzen 9 7950X lags by just 5% at 105 W.
Similarly, the Ryzen 7 7700X at 65 W virtually ties with the Ryzen 9 5950X running at the default 105 W TDP (142 W PL2) while just being 6% slower than default Core i5-13600K (125 W PL1, 181 W PL2).
We recommend running the Ryzen 9 7950X and Ryzen 7 7700X in Eco mode unless you need to unleash the full raw power of these processors for demanding workflows.
3D and gaming performance: Close contest with Intel's best
The Ryzen 9 7950X and the Ryzen 7 7700X show slight regressions in 3DMark GPU performance compared to the Ryzen 5 7600X and the Ryzen 9 7900X. However, the performance is on par with that of the Core i5-13600K and Core i9-13900K.
| Performance rating - Percent | |
| AMD Ryzen 5 7600X | |
| AMD Ryzen 9 7900X | |
| Intel Core i5-13600K | |
| Intel Core i9-13900K | |
| AMD Ryzen 9 7950X | |
| AMD Ryzen 7 7700X | |
| 3DMark | |
| 1920x1080 Fire Strike Graphics | |
| AMD Ryzen 5 7600X | |
| AMD Ryzen 9 7900X | |
| Intel Core i5-13600K | |
| Intel Core i9-13900K | |
| AMD Ryzen 9 7950X | |
| AMD Ryzen 7 7700X | |
| 2560x1440 Time Spy Graphics | |
| AMD Ryzen 9 7900X | |
| AMD Ryzen 5 7600X | |
| Intel Core i9-13900K | |
| Intel Core i5-13600K | |
| AMD Ryzen 7 7700X | |
| AMD Ryzen 9 7950X | |
| 3DMark 11 - 1280x720 Performance GPU | |
| AMD Ryzen 5 7600X | |
| AMD Ryzen 9 7900X | |
| Intel Core i5-13600K | |
| Intel Core i9-13900K | |
| AMD Ryzen 9 7950X | |
| AMD Ryzen 7 7700X | |
| 3DMark 11 Performance | 48825 points | |
| 3DMark Fire Strike Score | 42285 points | |
| 3DMark Time Spy Score | 18279 points | |
Help | ||
It's not often that we find Intel and AMD CPUs compete neck-to-neck in gaming. Both the Ryzen 9 7950X and the Ryzen 7 7700X make excellent gaming CPUs, especially when paired with fast GPUs such as the GeForce RTX 30 series or the Radeon RX 6000 series and above. The cumulative performance difference between Intel Raptor Lake and corresponding AMD Zen 4 CPUs seem negligible.
That being said, individual games may favor one platform over the other. For instance, we see the Ryzen 9 7950X achieving a 21% lead over the Core i9-13900K in Final Fantasy XV 1080p High, while the latter edges out the 7950X by 13% in Far Cry 5 at 1080p Ultra. The Ryzen 9 7900X, on the other hand, leads the Ryzen 9 7950X by 7% in The Witcher 3 at 1080p Ultra.
Overall, both the Ryzen 9 7950X and the Ryzen 7 7700X are on par with each other in gaming. If you are primarily a gamer, you can save a good amount of money by opting for the Ryzen 7 7700X or even the Ryzen 5 7600X.
| Performance rating - Percent | |
| Intel Core i9-13900K | |
| AMD Ryzen 9 7900X | |
| AMD Ryzen 5 7600X | |
| Average of class Desktop | |
| AMD Ryzen 9 7950X | |
| AMD Ryzen 7 7700X | |
| Intel Core i5-13600K | |
| The Witcher 3 | |
| 1920x1080 Ultra Graphics & Postprocessing (HBAO+) | |
| Average of class Desktop (7.8 - 369, n=43, last 2 years) | |
| AMD Ryzen 9 7900X | |
| AMD Ryzen 5 7600X | |
| Intel Core i5-13600K | |
| Intel Core i9-13900K | |
| AMD Ryzen 9 7950X | |
| AMD Ryzen 7 7700X | |
| 1024x768 Low Graphics & Postprocessing | |
| AMD Ryzen 9 7900X | |
| Intel Core i9-13900K | |
| AMD Ryzen 7 7700X | |
| AMD Ryzen 5 7600X | |
| AMD Ryzen 9 7950X | |
| Average of class Desktop (39.3 - 841, n=26, last 2 years) | |
| Intel Core i5-13600K | |
| GTA V | |
| 1920x1080 Highest AA:4xMSAA + FX AF:16x | |
| Intel Core i9-13900K | |
| AMD Ryzen 9 7900X | |
| AMD Ryzen 7 7700X | |
| AMD Ryzen 9 7950X | |
| AMD Ryzen 5 7600X | |
| Intel Core i5-13600K | |
| Average of class Desktop (9.61 - 172.5, n=15, last 2 years) | |
| 1920x1080 Lowest Settings possible | |
| AMD Ryzen 9 7950X | |
| AMD Ryzen 7 7700X | |
| Intel Core i9-13900K | |
| Intel Core i5-13600K | |
| AMD Ryzen 9 7900X | |
| AMD Ryzen 5 7600X | |
| Average of class Desktop (61.3 - 188.2, n=14, last 2 years) | |
| Cyberpunk 2077 1.6 | |
| 3840x2160 Ultra Preset | |
| Average of class Desktop (44.9 - 63, n=2, last 2 years) | |
| AMD Ryzen 9 7950X | |
| AMD Ryzen 7 7700X | |
| AMD Ryzen 9 7900X | |
| AMD Ryzen 5 7600X | |
| 2560x1440 Ultra Preset | |
| Average of class Desktop (92.8 - 127.9, n=2, last 2 years) | |
| AMD Ryzen 9 7950X | |
| AMD Ryzen 7 7700X | |
| AMD Ryzen 9 7900X | |
| AMD Ryzen 5 7600X | |
| 1920x1080 Ultra Preset | |
| AMD Ryzen 9 7900X | |
| Average of class Desktop (146 - 187.8, n=2, last 2 years) | |
| AMD Ryzen 7 7700X | |
| AMD Ryzen 9 7950X | |
| AMD Ryzen 5 7600X | |
| F1 22 | |
| 3840x2160 Ultra High Preset AA:T AF:16x | |
| Average of class Desktop (31.1 - 113.3, n=13, last 2 years) | |
| AMD Ryzen 5 7600X | |
| AMD Ryzen 9 7900X | |
| Intel Core i5-13600K | |
| AMD Ryzen 9 7950X | |
| AMD Ryzen 7 7700X | |
| Intel Core i9-13900K | |
| 2560x1440 Ultra High Preset AA:T AF:16x | |
| Average of class Desktop (64.1 - 194.3, n=13, last 2 years) | |
| AMD Ryzen 5 7600X | |
| Intel Core i5-13600K | |
| AMD Ryzen 7 7700X | |
| AMD Ryzen 9 7900X | |
| AMD Ryzen 9 7950X | |
| Intel Core i9-13900K | |
| 1920x1080 Ultra High Preset AA:T AF:16x | |
| Average of class Desktop (100.2 - 219, n=13, last 2 years) | |
| Intel Core i5-13600K | |
| AMD Ryzen 9 7950X | |
| AMD Ryzen 7 7700X | |
| AMD Ryzen 5 7600X | |
| AMD Ryzen 9 7900X | |
| Intel Core i9-13900K | |
| Far Cry 6 | |
| 3840x2160 Ultra Graphics Quality + HD Textures AA:T | |
| Average of class Desktop (31.7 - 190.9, n=18, last 2 years) | |
| Intel Core i9-13900K | |
| Intel Core i5-13600K | |
| AMD Ryzen 9 7950X | |
| AMD Ryzen 7 7700X | |
| 2560x1440 Ultra Graphics Quality + HD Textures AA:T | |
| Average of class Desktop (106.2 - 248, n=18, last 2 years) | |
| AMD Ryzen 9 7950X | |
| Intel Core i9-13900K | |
| Intel Core i5-13600K | |
| AMD Ryzen 7 7700X | |
| 1920x1080 Ultra Graphics Quality + HD Textures AA:T | |
| Average of class Desktop (134.7 - 254, n=20, last 2 years) | |
| Intel Core i9-13900K | |
| Intel Core i5-13600K | |
| AMD Ryzen 9 7950X | |
| AMD Ryzen 7 7700X | |
| Shadow of the Tomb Raider | |
| 3840x2160 Highest Preset AA:T | |
| Average of class Desktop (96.7 - 239, n=12, last 2 years) | |
| AMD Ryzen 5 7600X | |
| AMD Ryzen 9 7900X | |
| Intel Core i9-13900K | |
| Intel Core i5-13600K | |
| AMD Ryzen 9 7950X | |
| AMD Ryzen 7 7700X | |
| 2560x1440 Highest Preset AA:T | |
| Average of class Desktop (188 - 356, n=12, last 2 years) | |
| AMD Ryzen 9 7900X | |
| AMD Ryzen 5 7600X | |
| AMD Ryzen 9 7950X | |
| AMD Ryzen 7 7700X | |
| Intel Core i9-13900K | |
| Intel Core i5-13600K | |
| 1920x1080 Highest Preset AA:T | |
| Average of class Desktop (9.4 - 387, n=13, last 2 years) | |
| AMD Ryzen 9 7900X | |
| AMD Ryzen 9 7950X | |
| Intel Core i9-13900K | |
| AMD Ryzen 5 7600X | |
| AMD Ryzen 7 7700X | |
| Intel Core i5-13600K | |
| Borderlands 3 | |
| 3840x2160 Badass Overall Quality (DX11) | |
| Average of class Desktop (68.9 - 168, n=12, last 2 years) | |
| AMD Ryzen 9 7900X | |
| AMD Ryzen 5 7600X | |
| Intel Core i5-13600K | |
| Intel Core i9-13900K | |
| AMD Ryzen 9 7950X | |
| AMD Ryzen 7 7700X | |
| 2560x1440 Badass Overall Quality (DX11) | |
| Average of class Desktop (129.5 - 223, n=12, last 2 years) | |
| AMD Ryzen 9 7900X | |
| AMD Ryzen 5 7600X | |
| Intel Core i9-13900K | |
| Intel Core i5-13600K | |
| AMD Ryzen 9 7950X | |
| AMD Ryzen 7 7700X | |
| 1920x1080 Badass Overall Quality (DX11) | |
| AMD Ryzen 9 7900X | |
| Average of class Desktop (6.4 - 248, n=13, last 2 years) | |
| Intel Core i9-13900K | |
| AMD Ryzen 5 7600X | |
| Intel Core i5-13600K | |
| AMD Ryzen 9 7950X | |
| AMD Ryzen 7 7700X | |
AMD Ryzen 9 7950X with Nvidia GeForce RTX 3090
| low | med. | high | ultra | QHD | 4K | |
|---|---|---|---|---|---|---|
| GTA V (2015) | 187.8 | 187.8 | 187.3 | 155.4 | 150.1 | 181.9 |
| The Witcher 3 (2015) | 703 | 551 | 358 | 175.2 | 150.9 | |
| Dota 2 Reborn (2015) | 293.2 | 259.3 | 248.5 | 222.3 | 208.1 | |
| Final Fantasy XV Benchmark (2018) | 235 | 229 | 229 | 142.4 | 86.8 | |
| X-Plane 11.11 (2018) | 216 | 187.9 | 141 | 122.5 | ||
| Far Cry 5 (2018) | 216 | 196 | 189 | 176 | 169 | 105 |
| Strange Brigade (2018) | 694 | 503 | 404 | 351 | 265 | 158.1 |
| Shadow of the Tomb Raider (2018) | 304 | 255 | 247 | 232 | 169 | 96 |
| Far Cry New Dawn (2019) | 176 | 160 | 156 | 142 | 139 | 105 |
| Metro Exodus (2019) | 281 | 215 | 170.4 | 137 | 112.5 | 73.5 |
| Borderlands 3 (2019) | 219 | 201 | 179.4 | 156.3 | 126.3 | 72.6 |
| F1 2021 (2021) | 619 | 542 | 436 | 225 | 172.8 | 101.8 |
| Far Cry 6 (2021) | 205 | 189 | 169 | 151 | 134 | 84 |
| Forza Horizon 5 (2021) | 337 | 223 | 202 | 129 | 114 | 84 |
| Cyberpunk 2077 1.6 (2022) | 209 | 175.6 | 149.8 | 137.5 | 93.1 | 46.5 |
| Tiny Tina's Wonderlands (2022) | 349 | 289 | 209 | 165.9 | 122 | 69 |
| F1 22 (2022) | 412 | 424 | 355 | 127.9 | 83.3 | 42 |
AMD Ryzen 7 7700X with Nvidia GeForce RTX 3090
| low | med. | high | ultra | QHD | 4K | |
|---|---|---|---|---|---|---|
| GTA V (2015) | 187.8 | 187.6 | 186.4 | 155.8 | 148.3 | 180 |
| The Witcher 3 (2015) | 726 | 529 | 344 | 172.4 | 148.3 | |
| Dota 2 Reborn (2015) | 292.3 | 256.4 | 249.8 | 231.1 | 203.5 | |
| Final Fantasy XV Benchmark (2018) | 237 | 237 | 178.3 | 138.4 | 84.3 | |
| X-Plane 11.11 (2018) | 224 | 190.7 | 145.9 | 124 | ||
| Far Cry 5 (2018) | 233 | 201 | 194 | 177 | 168 | 104 |
| Strange Brigade (2018) | 797 | 509 | 404 | 352 | 263 | 157.6 |
| Shadow of the Tomb Raider (2018) | 307 | 252 | 240 | 223 | 168 | 96 |
| Far Cry New Dawn (2019) | 192 | 169 | 162 | 144 | 138 | 104 |
| Metro Exodus (2019) | 317 | 219 | 171.6 | 136.6 | 112.1 | 73.3 |
| Borderlands 3 (2019) | 230 | 197.3 | 174.9 | 153 | 122.6 | 70.3 |
| F1 2021 (2021) | 663 | 543 | 453 | 222 | 169.3 | 101.1 |
| Far Cry 6 (2021) | 196 | 183 | 163 | 149 | 127 | 82 |
| Forza Horizon 5 (2021) | 295 | 205 | 193 | 129 | 114 | 84 |
| Cyberpunk 2077 1.6 (2022) | 205 | 172.1 | 151.3 | 137.7 | 92.8 | 46.2 |
| Tiny Tina's Wonderlands (2022) | 359 | 287 | 204 | 161.8 | 118.8 | 67.5 |
| F1 22 (2022) | 400 | 415 | 352 | 127.2 | 83.9 | 42 |
Power Consumption: Substantial multi-core efficiency gains in Eco mode
AMD 'Raphael' Zen 4 seems to be quite power-efficient when compared to the Raptor Lake competition. Total system power consumption in the Cinebench R15 multi-core test with the Ryzen 9 7950X-based system is 24% lesser compared to the Core i9-13900K PC, though it is also 12% higher compared to the Core i9-12900K.
The Ryzen 7 7700X-based setup sips 16% lesser power from the wall in Cinebench R15 multi-core compared to the Core i5-13600K and is more or less similar to a Ryzen 9 5900X-powered system.
Eco mode further helps in achieving significant power efficiency gains. In the case of the Ryzen 9 7950X, the 105 W and 65 W runs are 29% and 47% more efficient, respectively, than the default 170 W TDP in Cinebench R15 multi-core.
Similarly, the 65 W Ryzen 7700X can afford a 17% higher efficiency in the same benchmark compared to the CPU's default 105 W operating TDP.
Since single-core performance is relatively unaffected with the TDP change, there seems to be no perceivable efficiency advantage for gaming as seen in The Witcher 3 1080p Ultra efficiency charts. That being said, operating these chips at lower TDPs does result in reduced power consumption overall.
Power Consumption: External Monitor
| Power Consumption / Cinebench R15 Multi Efficiency (external Monitor) | |
| AMD Ryzen 9 7950X ECO 65 W, NVIDIA GeForce RTX 3090 | |
| Average of class Desktop (13.7 - 41.2, n=11, last 2 years) | |
| AMD Ryzen 9 7950X ECO 105 W, NVIDIA GeForce RTX 3090 | |
| AMD Ryzen 9 5950X, NVIDIA Titan RTX | |
| AMD Ryzen 9 7950X, NVIDIA GeForce RTX 3090 | |
| Average NVIDIA GeForce RTX 3090 (11.7 - 25.2, n=13) | |
| AMD Ryzen 9 5900X, NVIDIA Titan RTX | |
| AMD Ryzen 9 7900X, NVIDIA GeForce RTX 3090 | |
| AMD Ryzen 7 7700X ECO 65 W, NVIDIA GeForce RTX 3090 | |
| AMD Ryzen 7 7700X, NVIDIA GeForce RTX 3090 | |
| Intel Core i9-13900K, NVIDIA GeForce RTX 3090 | |
| Intel Core i5-13600K, NVIDIA GeForce RTX 3090 | |
| Intel Core i9-12900K, NVIDIA Titan RTX | |
| Intel Core i5-12600K, NVIDIA Titan RTX | |
| AMD Ryzen 7 5800X, NVIDIA Titan RTX | |
| AMD Ryzen 5 7600X, NVIDIA GeForce RTX 3090 | |
| AMD Ryzen 5 5600X, NVIDIA Titan RTX | |
| AMD Ryzen 7 5800X3D, NVIDIA GeForce RTX 3090 Ti | |
| Power Consumption / Witcher 3 ultra Efficiency (external Monitor) | |
| Average of class Desktop (0.113 - 0.653, n=40, last 2 years) | |
| Intel Core i5-13600K, NVIDIA GeForce RTX 3090 | |
| AMD Ryzen 5 7600X, NVIDIA GeForce RTX 3090 | |
| Intel Core i5-12600K, NVIDIA Titan RTX | |
| Average NVIDIA GeForce RTX 3090 (0.268 - 0.3954, n=15) | |
| AMD Ryzen 7 5800X3D, NVIDIA GeForce RTX 3090 Ti | |
| AMD Ryzen 5 5600X, NVIDIA Titan RTX | |
| AMD Ryzen 9 7900X, NVIDIA GeForce RTX 3090 | |
| Intel Core i9-13900K, NVIDIA GeForce RTX 3090 | |
| AMD Ryzen 7 7700X, NVIDIA GeForce RTX 3090 | |
| AMD Ryzen 7 5800X, NVIDIA Titan RTX | |
| AMD Ryzen 9 7950X ECO 105 W, NVIDIA GeForce RTX 3090 | |
| AMD Ryzen 9 7950X ECO 65 W, NVIDIA GeForce RTX 3090 | |
| AMD Ryzen 9 7950X, NVIDIA GeForce RTX 3090 | |
| AMD Ryzen 7 7700X ECO 65 W, NVIDIA GeForce RTX 3090 | |
| AMD Ryzen 9 5900X, NVIDIA Titan RTX | |
| AMD Ryzen 9 5950X, NVIDIA Titan RTX | |
| Intel Core i9-12900K, NVIDIA Titan RTX | |
* ... smaller is better
Pros
Cons
Verdict: You cannot go wrong with Zen 4

2022 has turned out to be a very interesting year for PC enthusiasts. We have seen Nvidia and AMD introduce their Ada Lovelace and RDNA 3 GPU architectures, while Intel and AMD take each other head-on with their Raptor Lake and Zen 4 Raphael lineups.
The AMD Ryzen 9 7950X presents a convincing option for anyone looking for a flagship mainstream desktop CPU to power their creative projects and pose no bottlenecks in gaming. The Ryzen 9 7950X performs on par with the Core i9-13900K in overall CPU benchmarks. Individually, some tests do favor the Raptor Lake flagship, but the differences are not drastic to be perceivable in the real world.
Comparatively, the Ryzen 7 7700X lags behind the Ryzen 9 7950X by 25%. However, this 8C/16T chip can perform better than a Core i5-13600K or even a Core i9-12900K, which deserves appreciation.
The AMD Ryzen 9 7950X and the Ryzen 7 7700X present a substantial upgrade over Zen 3 and ensure Intel's Raptor Lake offerings do not go unchallenged. The option to leverage Eco mode without significant performance penalties is an icing on the cake.”
Both the Ryzen 9 7950X and the Ryzen 7 7700X are great for general productivity. The Ryzen 9 7950X seems to be a better option compared to the Core i9-13900K, if your workflow includes a lot of floating point math, as evidenced by our AIDA64 tests.
Eco is mode is perhaps the best selling point of this generation of AMD CPUs. The fact that you can get a pretty significant gain with a 65 W Ryzen 9 7950X over a 241 W Core i9-12900K is nothing to scoff at. Users looking for increased power efficiency for less-demanding workflows will find operating the Ryzen 9 7950X at 65 W can be up to 47% more efficient than at stock settings.
The Ryzen 7 7700X is already quite an efficient chip in its own right, but lowering the TDP to 65 W still results in palpable power savings. Gamers needn't worry about losing a lot of performance at lower TDPs, since the single-core performance remains relatively unaffected.
Socket AM4 has been supplanted by the new AM5 platform, which brings with it native DDR5 and PCIe Gen 5 support. Unlike Intel, AMD chose to make AM5 DDR5-exclusive. DDR5 comes at a premium as of now, and it will take a while before pricing becomes more stable and comparable to that of DDR4.
You should also factor in costs of a motherboard upgrade — X670 motherboards often start around the US$400 mark, with fully loaded X670E flagships even crossing US$1,200 for the board alone. The good news, however, is that your current cooling system will most likely fit and the platform will be supported at least till 2025.
With the Ryzen 9 7950X and Ryzen 7 7700X, and also with the Ryzen 9 7900X and Ryzen 5 7600X, AMD has allayed fears that the 'Raphael' Zen 4 chips may not match up to Intel's Raptor Lake. Zen 4 presents a compelling upgrade, initial investment in the AM5 platform notwithstanding.
The imminent arrival of Ryzen 7000 X3D chips in the coming months presents an even more enticing prospect, and it can only get better from here.
Price and Availability
Intel did seem to have an edge with the launch MSRPs this time around. The Core i9-13900K launched at US$589 MSRP, but it is currently retailing at US$660. The AMD Ryzen 9 7950X, on the other hand, launched at US$699, but you can now get the 16C/32T behemoth for US$574 on Best Buy and Newegg. Pricing on the Amazon US store, however, seems to have increased to US$748.
In India, the Ryzen 9 7950X launched at a ₹67,999 MSRP but is now available for ₹62,749 on Amazon India and for about ₹58,000 at other retailers.
The AMD Ryzen 7 7700X is also available at a reduced price of US$350 on Best Buy and Newegg. In India, the CPU had a launch price of ₹39,499 but can be availed for about ₹34,000 on Amazon India and other stores.
Price comparison
