Notebookcheck Logo

AMD Ryzen 7 7700 65 W Ryzen 7000 Review: Able Core i9-12900K and Core i5-13600K challenger that is US$70 less than Ryzen 7 7700X

Raphael without the X factor. The AMD 65 W Ryzen 7000 non-X lineup seeks to make Zen 4 available at more affordable price points. Today, we test the AMD Ryzen 7 7700 and see how it performs vis-à-vis its higher TDP cousins and also against the Intel Raptor Lake competition. While the Ryzen 7 7700 can get you near-Core i9-12900K performance for US$70 less than the Ryzen 7 7700X's MSRP, extraneous factors such as high DDR5 prices can put a spanner in the works.

After having introduced the Ryzen 7000 lineup late last year, AMD has introduced a few additions to the Raphael Zen 4 family at CES 2023. The original launch included four processors led by the 16C/32T Ryzen 9 7950X.

The Ryzen 7x0X lineup are rated at 105 W TDP, with the 12C/24T Ryzen 9 7900X and the 16C/32T Ryzen 9 7950X going up to 170 W. Users can run these CPUs at lower TDPs of 105 W and 65 W as the case may be resulting in substantial power savings with negligible performance loss.

Today, AMD is making available the new 65 W Ryzen 7000 CPUs revealed at CES. These non-X CPUs are based on the new AM5 platform and are targeted at budget price points. Even though these are non-X processors, they are fully unlocked, support overclocking, and even come with a Wraith cooler in the box.

An overview of AMD 'Raphael' Zen 4 Ryzen 7000 desktop processors

AMD Ryzen 7000 SKU Cores / Threads Base Clock Turbo Clock L2 Cache L3 Cache TDP PPT Launch Price
AMD Ryzen 9 7950X 16 / 32 4.5 GHz 5.7 GHz 16x 1 MB 64 MB 170 W 230 W US$699
AMD Ryzen 9 7900X 12 / 24 4.7 GHz 5.6 GHz 12x 1 MB 64 MB 170 W 230 W US$549
AMD Ryzen 9 7900 12 / 24 3.7 GHz 5.4 GHz 12x 1 MB 64 MB 65 W 88 W US$429
AMD Ryzen 7 7700X 8 / 16 4.5 GHz 5.4 GHz 8x 1 MB 32 MB 105 W 142 W US$399
AMD Ryzen 7 7700 8 / 16 3.8 GHz 5.3 GHz 8x 1 MB 32 MB 65 W 88 W US$329
AMD Ryzen 5 7600X 6 / 12 4.7 GHz 5.3 GHz 6x 1 MB 32 MB 105 W 142 W US$299
AMD Ryzen 5 7600 6 / 12 3.8 GHz 5.1 GHz 6x 1 MB 32 MB 65 W 88 W US$229

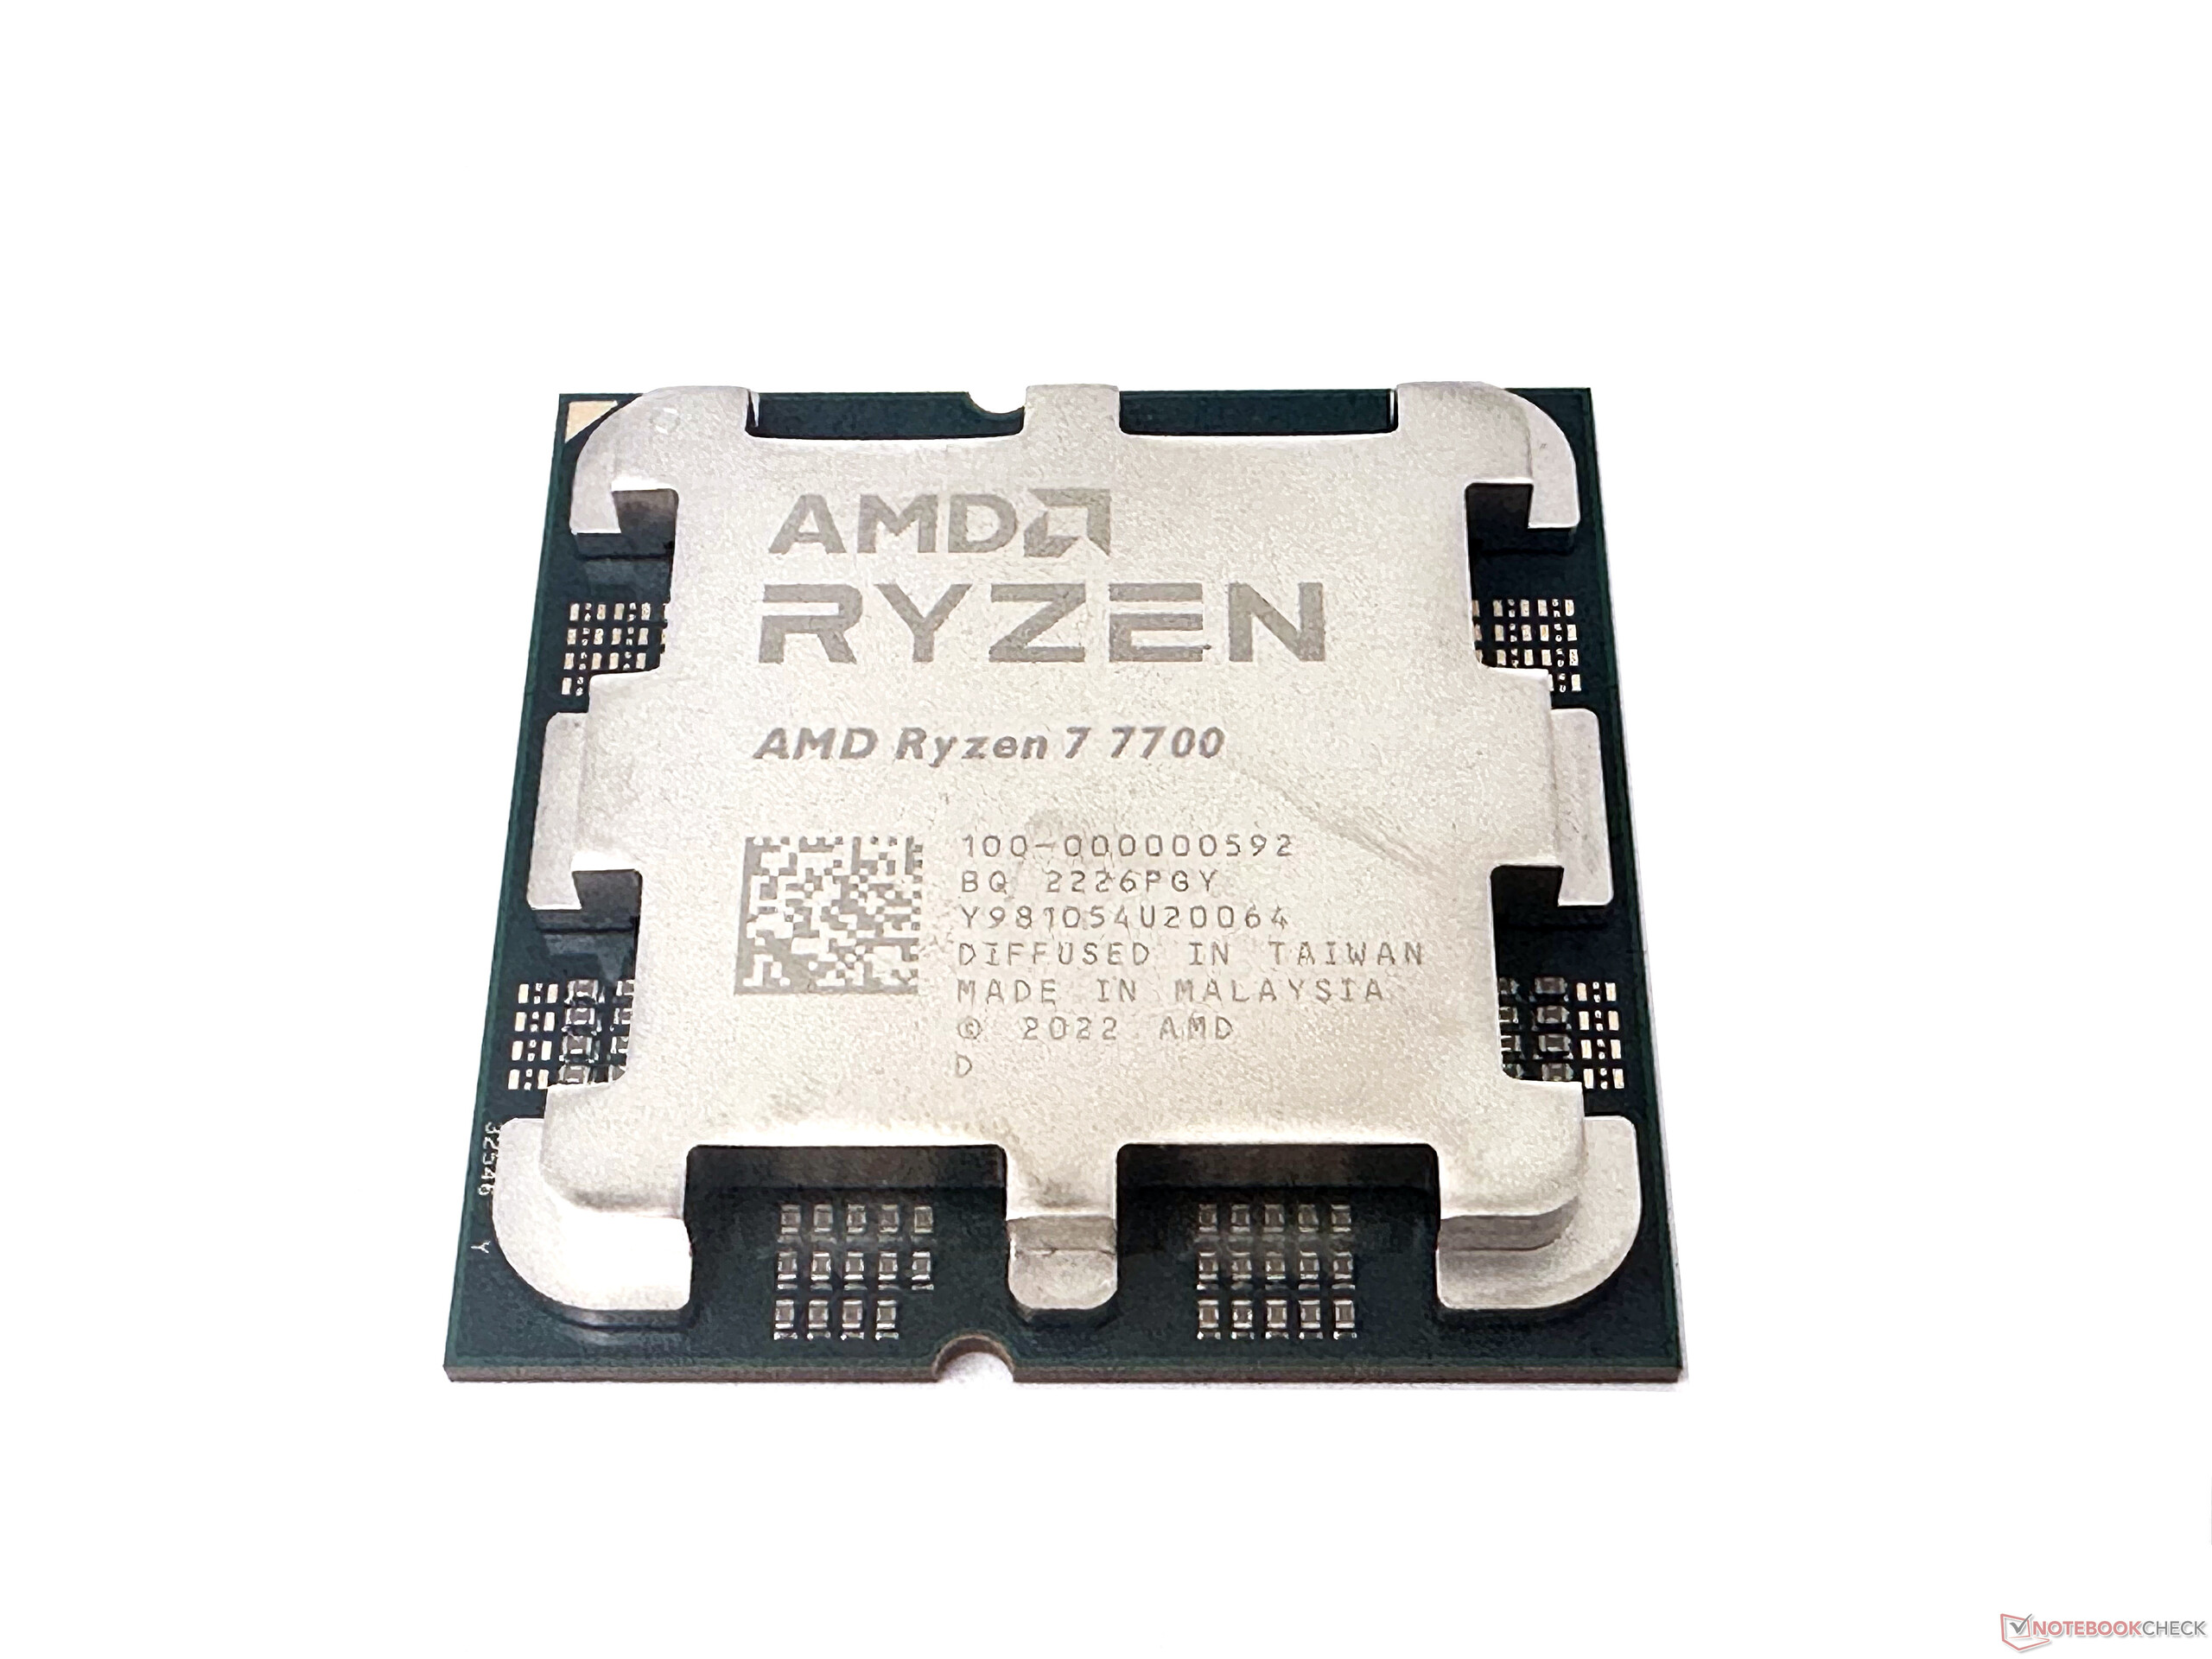
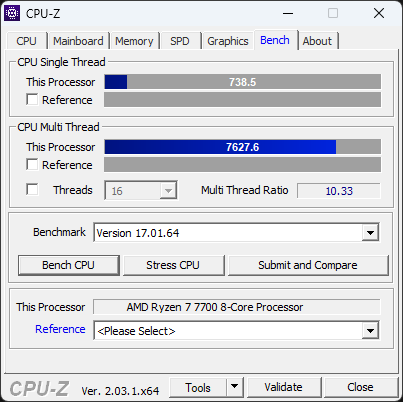
We have with us the AMD Ryzen 7 7700. The Ryzen 7 7700 is in many ways akin to the Ryzen 7 7700X but runs at lower base and boost clocks by default, which requires a lesser TDP. The processor is also about US$70 cheaper than its X cousin. 

In this review, we take a look at the AMD Ryzen 7 7700 and see how well the US$329 asking price corelates in terms of performance with its more expensive cousins.

AMD Ryzen 7 7700
AMD Ryzen 7 7700
AMD Ryzen 7 7700 with ASRock B650E Steel Legend Wi-Fi

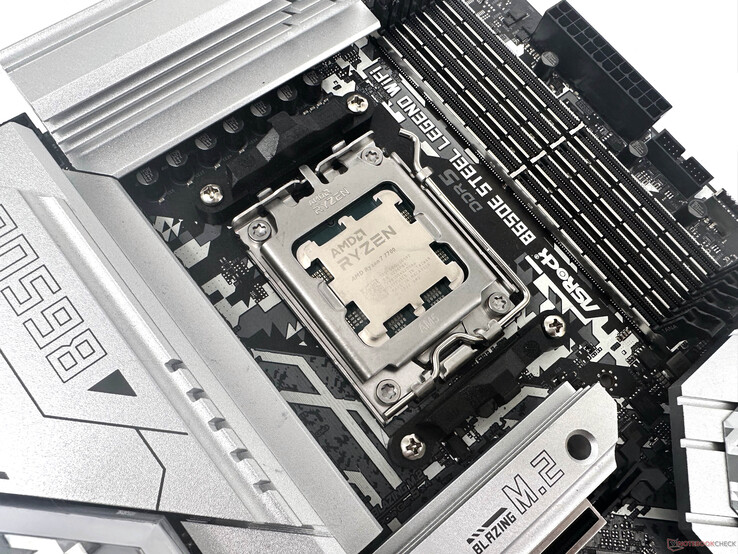
The test bench: Ryzen 7 7700 gets paired with the RTX 3090

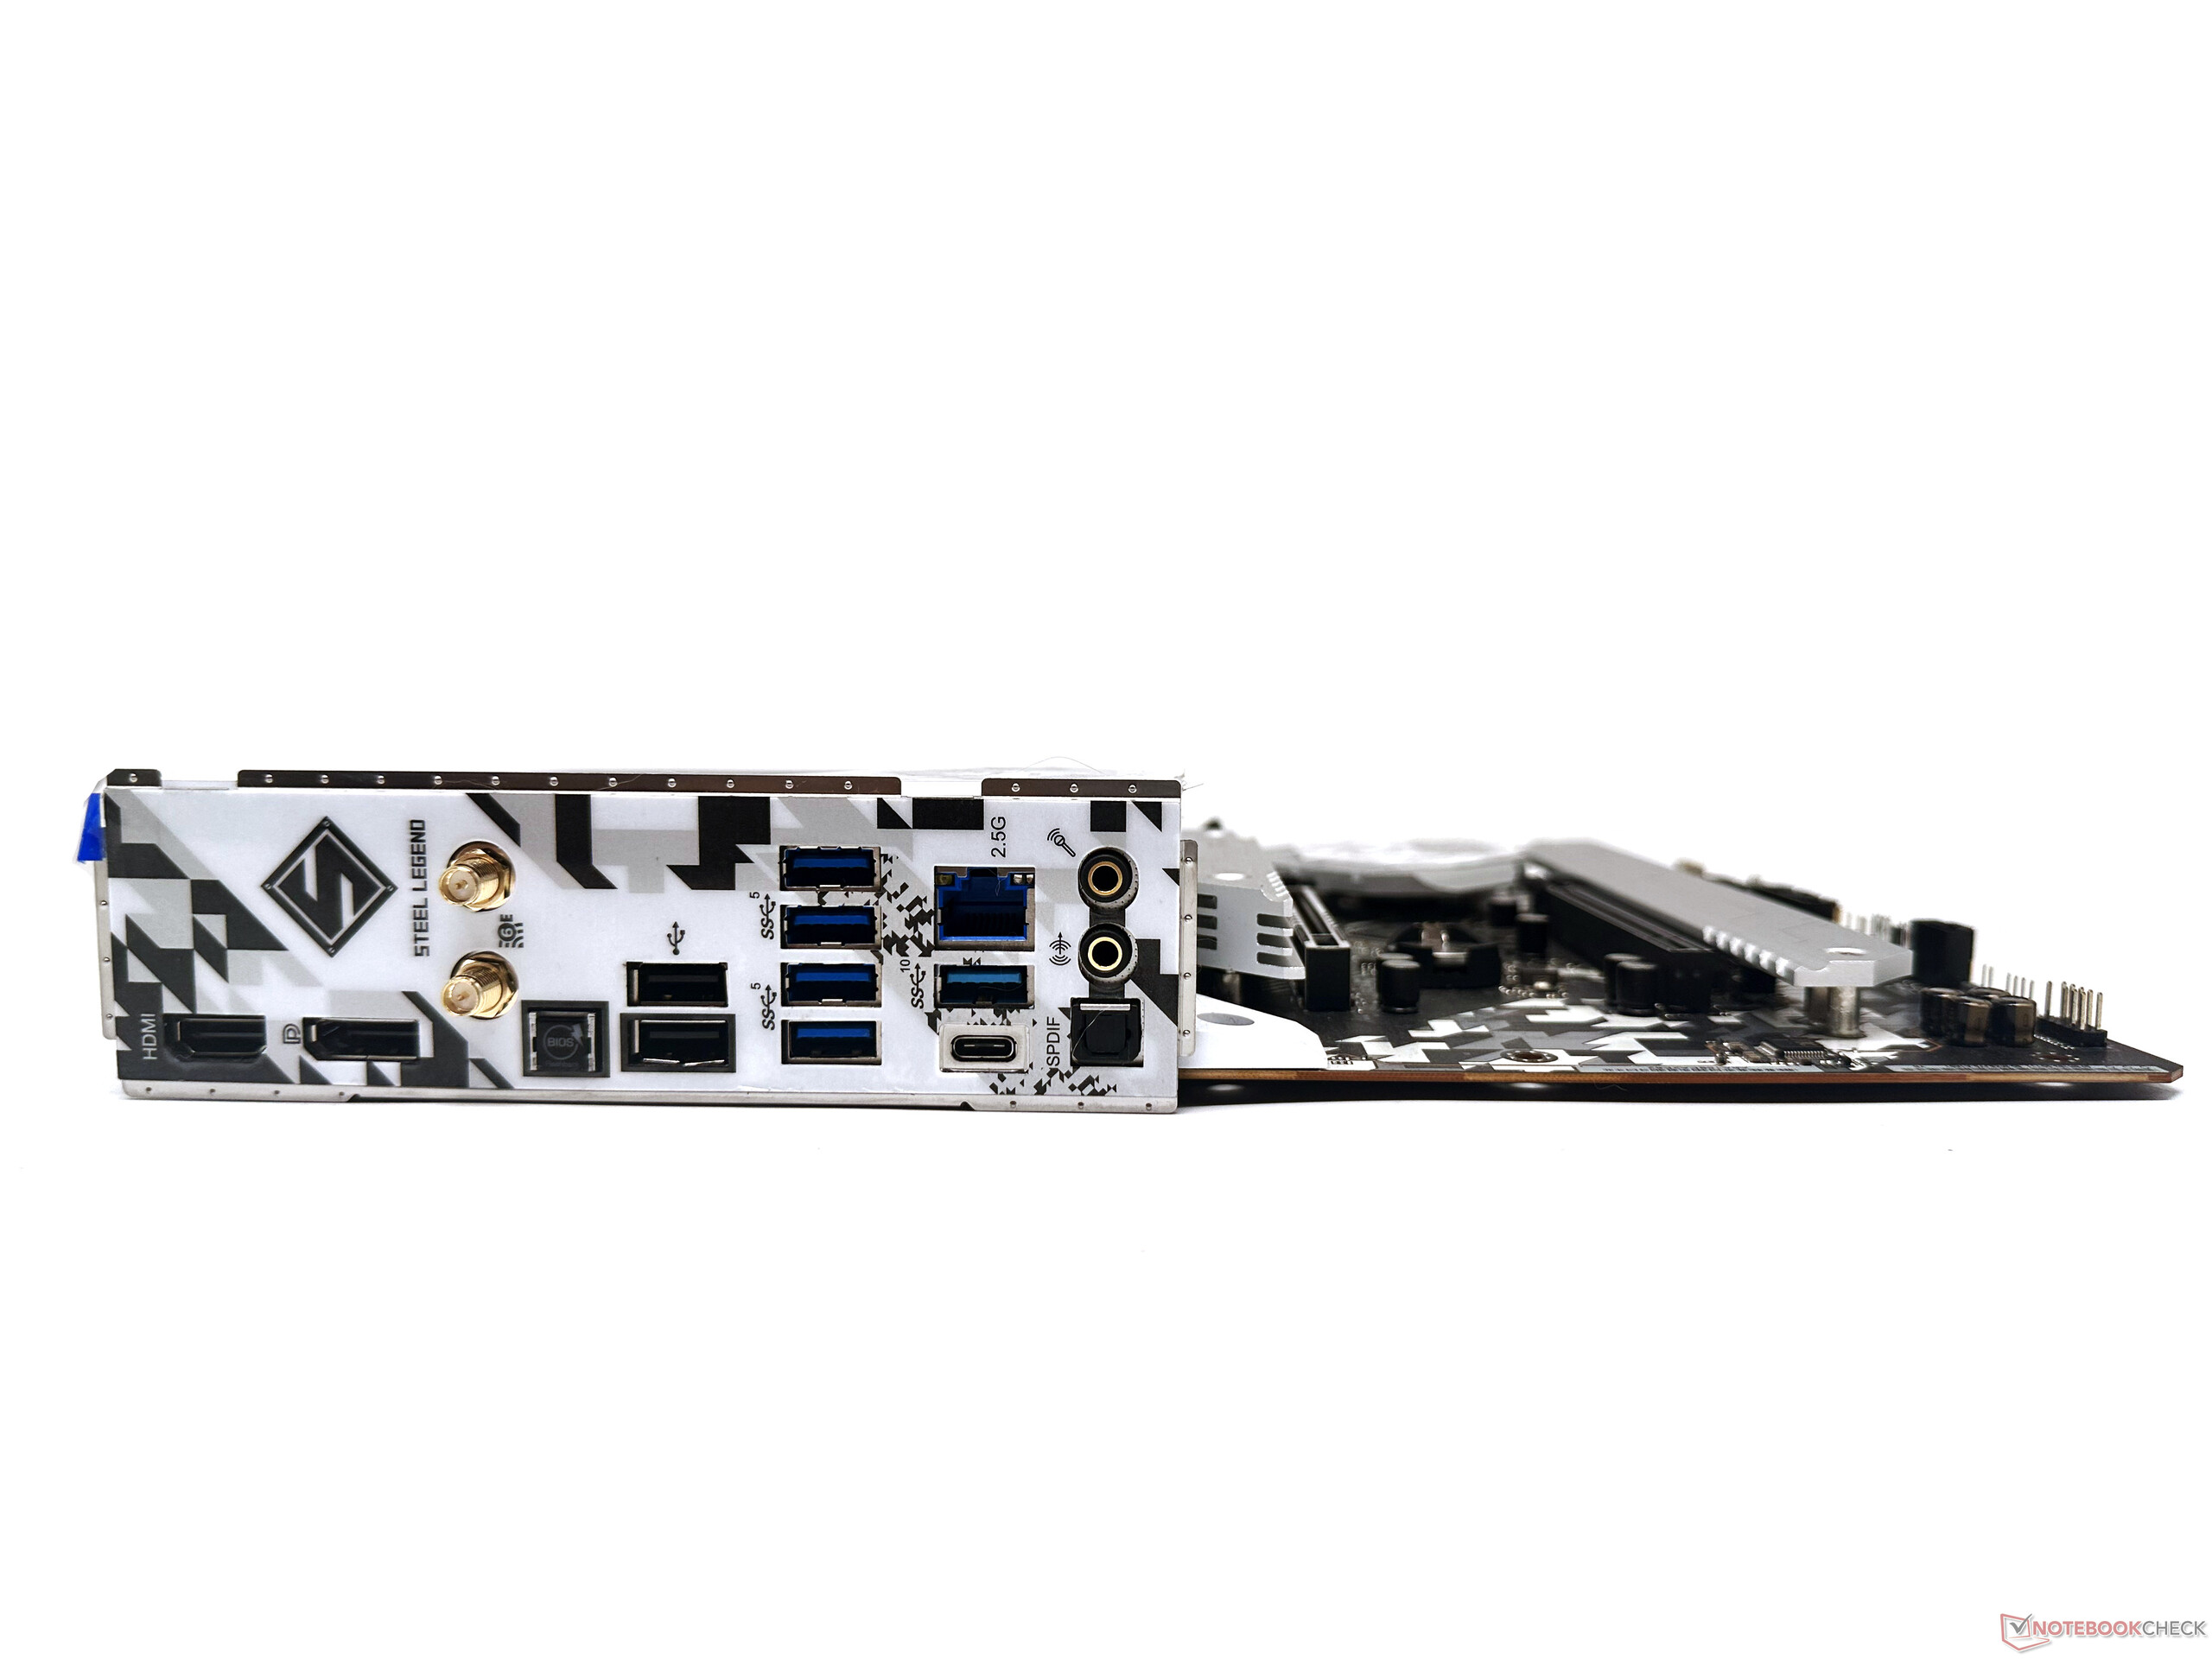
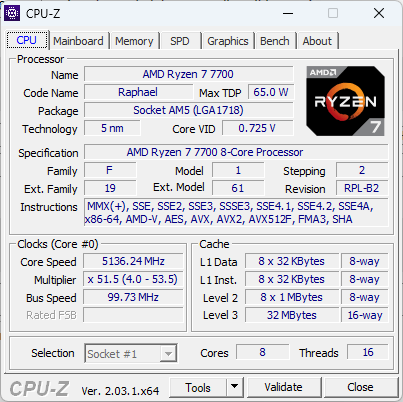
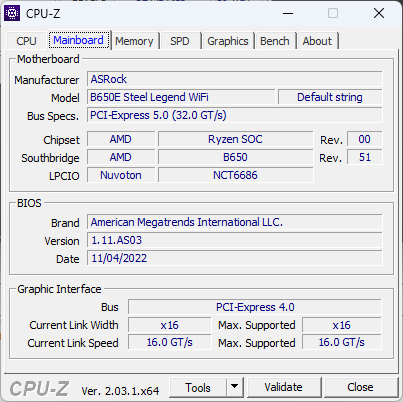
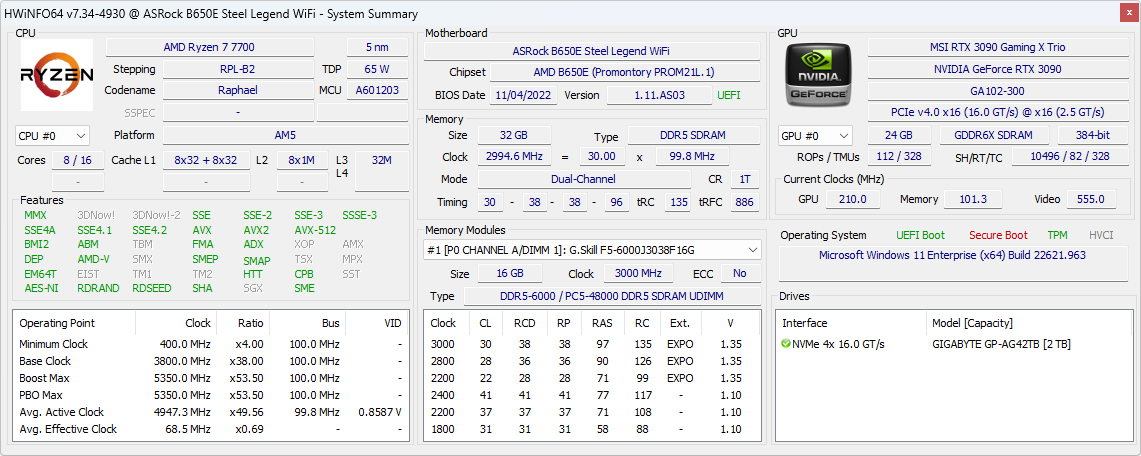
Our test bench for the AMD Ryzen 7 7700 is based on the new B650E chipset. This includes the following components:

  • Cooler Master MasterFrame 700 test bench
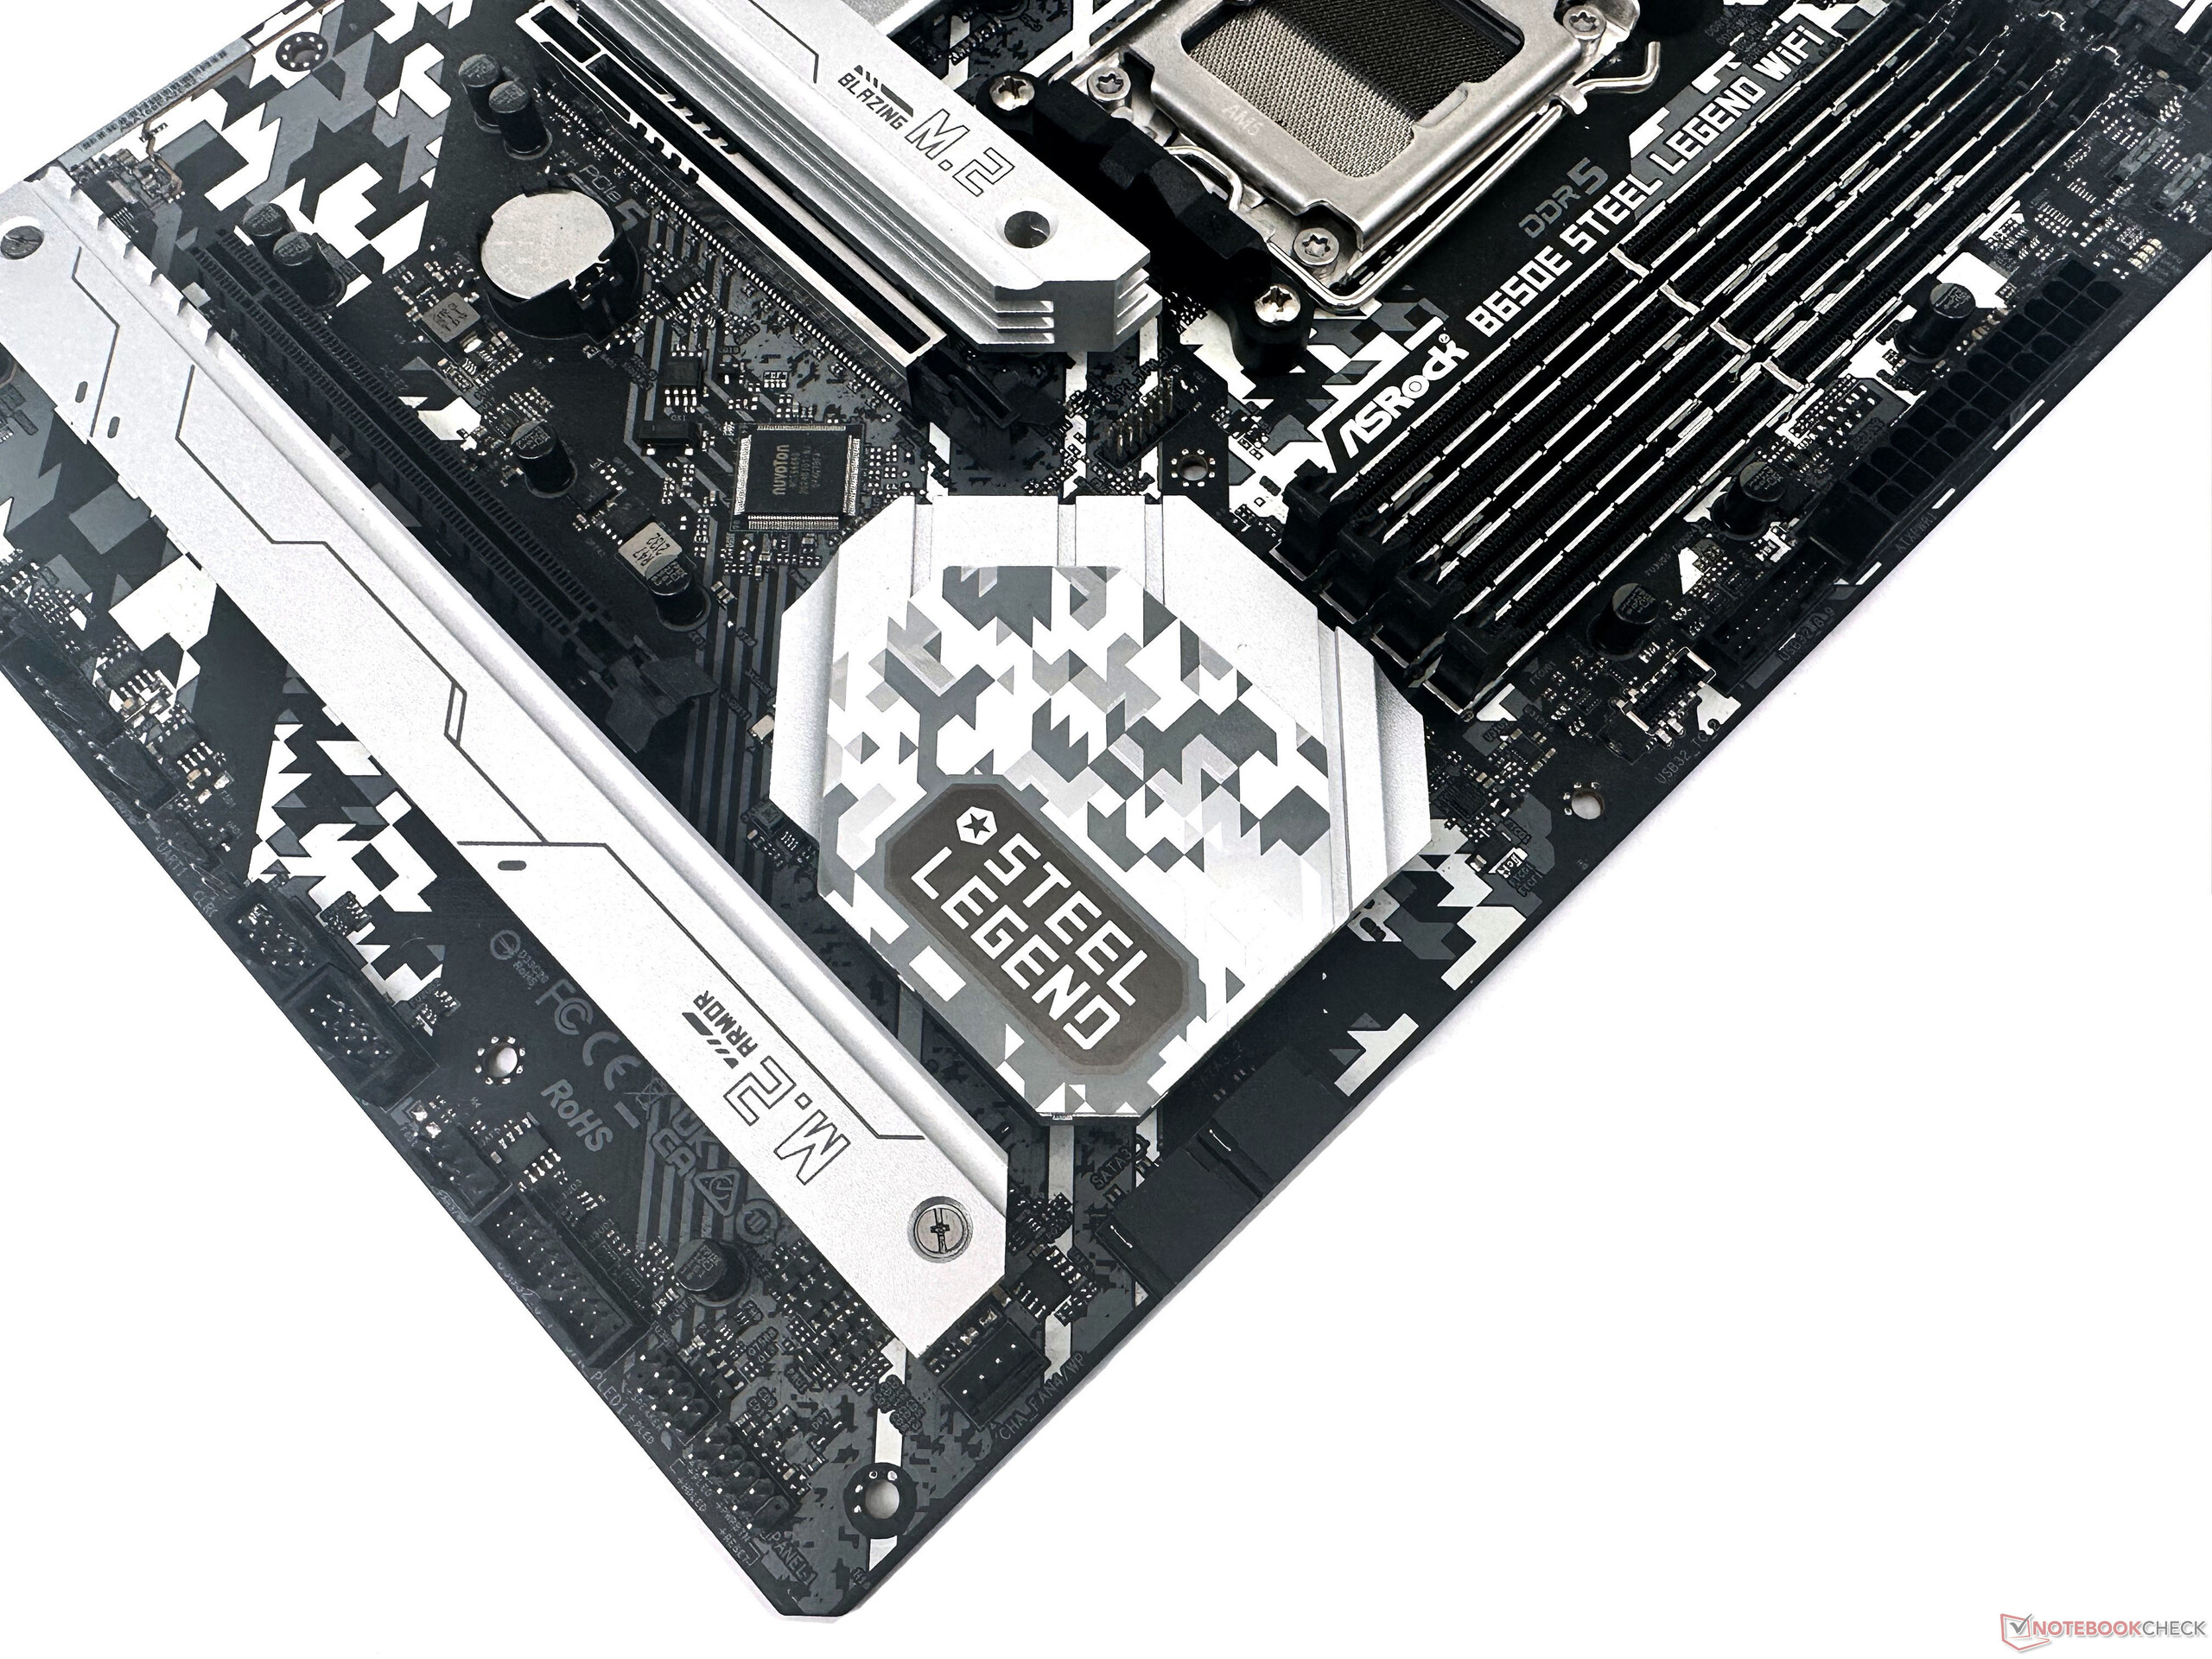
  • ASRock B650E Steel Legend Wi-Fi running BIOS 1.11.AS03
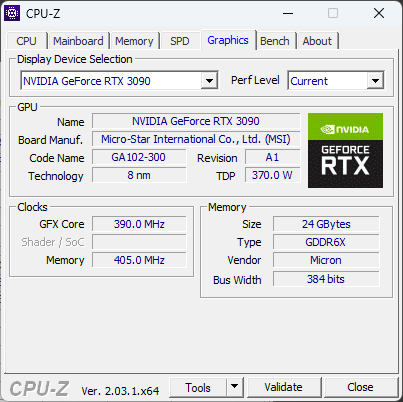
  • MSI Gaming X Trio GeForce RTX 3090 GPU
  • Gigabyte Aorus Gen 4 2 TB NVMe SSD for benchmarks and games
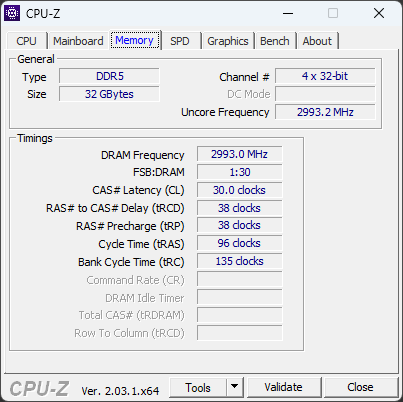
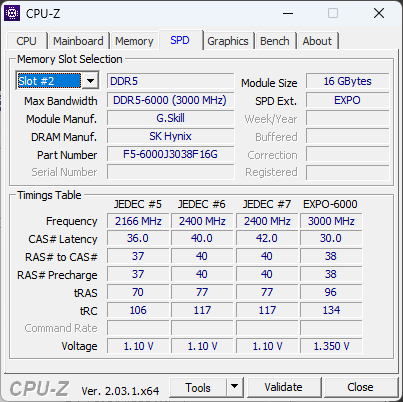
  • 2x 16 GB G.SKILL Trident Z5 Neo DDR5-6000 RAM with timings 30-38-38-96 at 1.35 V
  • Gigabyte M28U 4K 144 Hz monitor
  • Cooler Master MasterLiquid ML360L V2 ARGB AIO cooler
  • Thermaltake ToughPower Grand RGB 850 W PSU

We would like to thank AMD for supplying the Ryzen 7 7700 CPU, the ASRock B650E motherboard, and the G.SKILL DDR5 memory kit. We also would like to thank MSI for the Gaming X Trio RTX 3090 GPU, Gigabyte for the M28U monitor and Aorus NVMe SSD, and finally Cooler Master for the test bench and AIO cooler.

CPU benchmarks: Right on the heels of the Core i9-12900K in single-core

Cumulative CPU benchmarks show the Ryzen 7 7700 gnawing on the hells of the Intel Alder Lake Core i9-12900K while being just 4% behind the Ryzen 7 7700X. While this is a great show, individual benchmarks help paint a clearer picture.

In Cinebench R23, R20, and R15, the Ryzen 7 7700 shows very good single-core performance that is on par with the rest of the Ryzen 7000 stack. The latest Zen 4 CPU trails the Intel Raptor Lake Core i9-13900K by up to 15% in these tests. In Cinebench multi-core tests, the Ryzen 7 7700 cannot match up to the likes of the Core i9-12900K or even the Core i5-13600K owing to the reduced thread count.

The lower boost clocks compared to the Ryzen 7 7700X puts the non-X version at a slight 5% disadvantage in Cinebench multi-core tests.

Similar trends are seen in Geekbench as well, but the delta between the Core i9-13900K and the Ryzen 7 7700 is much lower in single-core tests compared to what we've seen with Cinebench. 

The Ryzen 7 7700 tries to close the gap with the Core i9-12900K in tests such as wPrime, R Benchmark, and LibreOffice. It cannot quite surpass the last gen Intel flagship, but it is able to come pretty close. 

Essentially, the Ryzen 7 7700's performance is exactly the same as that of a 65 W TDP-limited Ryzen 7 7700X with the advantage here being that users running single-threaded workloads stand to get Ryzen 9 7950X-levels of performance while saving significant dough.

Performance Rating - Percent
AMD Ryzen 9 7950X
88.9 pt
Intel Core i9-13900K
88.9 pt
AMD Ryzen 9 7950X ECO 105 W -12!
84.1 pt
AMD Ryzen 9 7900X
77.8 pt
AMD Ryzen 9 7950X ECO 65 W -14!
75.7 pt
AMD Ryzen 9 5950X
69.1 pt
AMD Ryzen 7 7700X
66.7 pt
Intel Core i5-13600K
65.3 pt
Intel Core i9-12900K
65.3 pt
AMD Ryzen 7 7700
64.2 pt
AMD Ryzen 7 7700X ECO 65 W -12!
63.7 pt
AMD Ryzen 9 5900X -2!
61.7 pt
AMD Ryzen 5 7600X
60.3 pt
AMD Ryzen 7 5800X
54.4 pt
Intel Core i5-12600K
50.4 pt
AMD Ryzen 7 5800X3D
49.5 pt
AMD Ryzen 5 5600X
45.5 pt
Cinebench R23
Single Core
Intel Core i9-13900K
2267 Points +17%
AMD Ryzen 9 7900X
2039 Points +6%
AMD Ryzen 9 7950X
2017 Points +5%
Intel Core i5-13600K
2010 Points +4%
AMD Ryzen 9 7950X ECO 65 W
2001 Points +4%
AMD Ryzen 9 7950X ECO 105 W
1999 Points +4%
Intel Core i9-12900K
1998 Points +4%
AMD Ryzen 7 7700X ECO 65 W
1988 Points +3%
AMD Ryzen 7 7700X
1986 Points +3%
AMD Ryzen 5 7600X
1967 Points +2%
AMD Ryzen 7 7700
1930 Points
Intel Core i5-12600K
1907 Points -1%
AMD Ryzen 9 5950X
1649 Points -15%
AMD Ryzen 9 5900X
1568 Points -19%
AMD Ryzen 7 5800X
1554 Points -19%
AMD Ryzen 5 5600X
1541 Points -20%
AMD Ryzen 7 5800X3D
1452 Points -25%
Multi Core
Intel Core i9-13900K
40103 Points +114%
AMD Ryzen 9 7950X
38248 Points +104%
AMD Ryzen 9 7950X ECO 105 W
35693 Points +90%
AMD Ryzen 9 7950X ECO 65 W
29882 Points +59%
AMD Ryzen 9 7900X
29480 Points +57%
AMD Ryzen 9 5950X
27062 Points +44%
Intel Core i9-12900K
27005 Points +44%
Intel Core i5-13600K
24268 Points +29%
AMD Ryzen 9 5900X
20634 Points +10%
AMD Ryzen 7 7700X
19509 Points +4%
AMD Ryzen 7 7700
18760 Points
AMD Ryzen 7 7700X ECO 65 W
18667 Points 0%
Intel Core i5-12600K
17491 Points -7%
AMD Ryzen 5 7600X
15322 Points -18%
AMD Ryzen 7 5800X
15241 Points -19%
AMD Ryzen 7 5800X3D
14317 Points -24%
AMD Ryzen 5 5600X
11838 Points -37%
Cinebench R20
CPU (Single Core)
Intel Core i9-13900K
828 Points +10%
AMD Ryzen 9 7900X
786 Points +5%
AMD Ryzen 9 7950X
783 Points +4%
AMD Ryzen 9 7950X ECO 65 W
778 Points +4%
AMD Ryzen 9 7950X ECO 105 W
776 Points +3%
Intel Core i5-13600K
775 Points +3%
AMD Ryzen 7 7700X ECO 65 W
773 Points +3%
AMD Ryzen 7 7700X
772 Points +3%
Intel Core i9-12900K
766 Points +2%
AMD Ryzen 5 7600X
761 Points +1%
AMD Ryzen 7 7700
750 Points
Intel Core i5-12600K
734 Points -2%
AMD Ryzen 9 5950X
641 Points -15%
AMD Ryzen 9 5900X
639 Points -15%
AMD Ryzen 7 5800X
625 Points -17%
AMD Ryzen 5 5600X
601 Points -20%
AMD Ryzen 7 5800X3D
566 Points -25%
CPU (Multi Core)
Intel Core i9-13900K
15181 Points +109%
AMD Ryzen 9 7950X
14891 Points +105%
AMD Ryzen 9 7950X ECO 105 W
13945 Points +92%
AMD Ryzen 9 7950X ECO 65 W
11727 Points +62%
AMD Ryzen 9 7900X
11563 Points +59%
AMD Ryzen 9 5950X
10482 Points +44%
Intel Core i9-12900K
10240 Points +41%
Intel Core i5-13600K
9265 Points +28%
AMD Ryzen 9 5900X
8629 Points +19%
AMD Ryzen 7 7700X
7617 Points +5%
AMD Ryzen 7 7700X ECO 65 W
7308 Points +1%
AMD Ryzen 7 7700
7259 Points
Intel Core i5-12600K
6692 Points -8%
AMD Ryzen 7 5800X
6068 Points -16%
AMD Ryzen 5 7600X
5985 Points -18%
AMD Ryzen 7 5800X3D
5479 Points -25%
AMD Ryzen 5 5600X
4567 Points -37%
Cinebench R15
CPU Single 64Bit
Intel Core i9-13900K
327 Points +6%
AMD Ryzen 9 7900X
324 Points +5%
AMD Ryzen 9 7950X
317 Points +3%
AMD Ryzen 9 7950X ECO 105 W
316 Points +3%
AMD Ryzen 7 7700X ECO 65 W
316 Points +3%
AMD Ryzen 5 7600X
315 Points +2%
AMD Ryzen 9 7950X ECO 65 W
315 Points +2%
AMD Ryzen 7 7700X
314 Points +2%
AMD Ryzen 7 7700
308 Points
Intel Core i5-13600K
289 Points -6%
Intel Core i9-12900K
286 Points -7%
Intel Core i5-12600K
275 Points -11%
AMD Ryzen 9 5950X
272 Points -12%
AMD Ryzen 9 5900X
271 Points -12%
AMD Ryzen 7 5800X
266 Points -14%
AMD Ryzen 5 5600X
254 Points -18%
AMD Ryzen 7 5800X3D
241 Points -22%
CPU Multi 64Bit
AMD Ryzen 9 7950X
6236 (6091.06min - 6236.36max) Points +105%
Intel Core i9-13900K
6191 Points +103%
AMD Ryzen 9 7950X ECO 105 W
5800 (5721.64min - 5799.62max) Points +90%
AMD Ryzen 9 7900X
4856 Points +59%
AMD Ryzen 9 7950X ECO 65 W
4836 (4772.13min - 4835.59max) Points +59%
AMD Ryzen 9 5950X
4492 Points +47%
Intel Core i9-12900K
4057 Points +33%
AMD Ryzen 9 5900X
3717 Points +22%
Intel Core i5-13600K
3643 Points +20%
AMD Ryzen 7 7700X
3191 (3116.72min - 3191.32max) Points +5%
AMD Ryzen 7 7700
3047 (2985.74min - 3046.92max) Points
AMD Ryzen 7 7700X ECO 65 W
3036 (2977.74min - 3035.82max) Points 0%
AMD Ryzen 7 5800X
2616 Points -14%
Intel Core i5-12600K
2555 Points -16%
AMD Ryzen 5 7600X
2507 Points -18%
AMD Ryzen 7 5800X3D
2413 (2388.2min - 2413.42max) Points -21%
AMD Ryzen 5 5600X
1968 Points -35%
Blender - v2.79 BMW27 CPU
AMD Ryzen 5 5600X
260.2 Seconds * -57%
AMD Ryzen 7 5800X3D
212.6 Seconds * -28%
AMD Ryzen 5 7600X
203 Seconds * -22%
AMD Ryzen 7 5800X
196.8 Seconds * -19%
Intel Core i5-12600K
189.5 Seconds * -14%
AMD Ryzen 7 7700X ECO 65 W
166 Seconds * -0%
AMD Ryzen 7 7700
166 Seconds *
AMD Ryzen 7 7700X
160 Seconds * +4%
AMD Ryzen 9 5900X
141 Seconds * +15%
Intel Core i5-13600K
135 Seconds * +19%
Intel Core i9-12900K
121.1 Seconds * +27%
AMD Ryzen 9 5950X
112.8 Seconds * +32%
AMD Ryzen 9 7900X
106 Seconds * +36%
AMD Ryzen 9 7950X ECO 65 W
103 Seconds * +38%
AMD Ryzen 9 7950X ECO 105 W
87 Seconds * +48%
AMD Ryzen 9 7950X
82 Seconds * +51%
Intel Core i9-13900K
80 Seconds * +52%
wPrime 2.10
32m
Intel Core i9-12900K
4.924 s * -81%
Intel Core i5-12600K
4.725 s * -74%
AMD Ryzen 5 5600X
3.891 s * -43%
AMD Ryzen 7 5800X3D
3.648 s * -34%
AMD Ryzen 7 5800X
3.037 s * -12%
AMD Ryzen 5 7600X
2.78 s * -2%
AMD Ryzen 7 7700
2.72 s *
AMD Ryzen 9 5950X
2.538 s * +7%
Intel Core i5-13600K
2.527 s * +7%
AMD Ryzen 7 7700X
2.154 s * +21%
Intel Core i9-13900K
1.818 s * +33%
AMD Ryzen 9 7900X
1.781 s * +35%
AMD Ryzen 9 7950X
1.557 s * +43%
1024m
Intel Core i5-12600K
202.7 s * -224%
Intel Core i9-12900K
190.6 s * -204%
Intel Core i5-13600K
177.592 s * -184%
AMD Ryzen 5 5600X
113.9 s * -82%
AMD Ryzen 7 5800X3D
92.572 s * -48%
AMD Ryzen 7 5800X
86.1 s * -37%
Intel Core i9-13900K
79.738 s * -27%
AMD Ryzen 5 7600X
74.491 s * -19%
AMD Ryzen 9 5950X
64.9 s * -4%
AMD Ryzen 7 7700
62.625 s *
AMD Ryzen 7 7700X
61.148 s * +2%
AMD Ryzen 9 7900X
39.954 s * +36%
AMD Ryzen 9 7950X
30.427 s * +51%
X264 HD Benchmark 4.0
Pass 1
Intel Core i9-13900K
412 (410min - 417max) fps +12%
Intel Core i5-13600K
388 (386min - 388max) fps +5%
AMD Ryzen 9 7950X
383 (381min - 386max) fps +4%
AMD Ryzen 9 7900X
376 (369min - 378max) fps +2%
AMD Ryzen 7 7700X
373.5 (363min - 381max) fps +1%
Intel Core i9-12900K
368.5 (366min - 369max) fps 0%
AMD Ryzen 7 7700
368 (359min - 370max) fps
AMD Ryzen 5 7600X
367 (363min - 371max) fps 0%
AMD Ryzen 7 5800X
339 (338min - 341max) fps -8%
AMD Ryzen 9 5950X
338.5 (337min - 340max) fps -8%
AMD Ryzen 9 5900X
335 (325min - 337max) fps -9%
Intel Core i5-12600K
333.5 (332min - 336max) fps -9%
AMD Ryzen 5 5600X
320 (319min - 321max) fps -13%
AMD Ryzen 7 5800X3D
292 (290min - 295max) fps -21%
Pass 2
AMD Ryzen 9 7950X
274 (272min - 274max) fps +57%
Intel Core i9-13900K
267 (266min - 271max) fps +53%
AMD Ryzen 9 7900X
241 (240min - 242max) fps +38%
AMD Ryzen 9 5950X
221 (220min - 221max) fps +26%
Intel Core i9-12900K
206 (206min - 206max) fps +18%
Intel Core i5-13600K
199 (198.5min - 199.4max) fps +14%
AMD Ryzen 9 5900X
191 (190min - 192max) fps +9%
AMD Ryzen 7 7700X
181.2 (181min - 181.4max) fps +4%
AMD Ryzen 7 7700
174.95 (174.4min - 175.5max) fps
AMD Ryzen 7 5800X
152 (151min - 152max) fps -13%
Intel Core i5-12600K
148 (147min - 148max) fps -15%
AMD Ryzen 5 7600X
147.8 (147.7min - 147.9max) fps -16%
AMD Ryzen 7 5800X3D
138.25 (137.7min - 138.6max) fps -21%
AMD Ryzen 5 5600X
117 (117min - 117max) fps -33%
WinRAR - Result
AMD Ryzen 9 7900X
17225 KB/s +16%
AMD Ryzen 5 7600X
16178 KB/s +9%
AMD Ryzen 7 5800X
15604 KB/s +5%
AMD Ryzen 9 7950X
15449 KB/s +4%
AMD Ryzen 7 7700X
14879 KB/s 0%
AMD Ryzen 7 7700
14860 KB/s
Intel Core i9-13900K
14836 KB/s 0%
AMD Ryzen 7 5800X3D
14431 KB/s -3%
AMD Ryzen 9 5900X
13361 KB/s -10%
AMD Ryzen 5 5600X
13282 KB/s -11%
AMD Ryzen 9 5950X
12503 KB/s -16%
Intel Core i5-13600K
10937 KB/s -26%
Intel Core i9-12900K
10792 KB/s -27%
Intel Core i5-12600K
6239 KB/s -58%
TrueCrypt
AES Mean 100MB
AMD Ryzen 9 7950X
32.5 GB/s +104%
Intel Core i9-13900K
27 GB/s +70%
AMD Ryzen 9 5950X
26.9 GB/s +69%
AMD Ryzen 9 5900X
21.2 GB/s +33%
Intel Core i5-13600K
18.8 GB/s +18%
Intel Core i9-12900K
18.5 GB/s +16%
AMD Ryzen 7 7700X
17.5 GB/s +10%
AMD Ryzen 7 7700
15.9 GB/s
AMD Ryzen 7 5800X
15 GB/s -6%
AMD Ryzen 9 7900X
14.8 GB/s -7%
AMD Ryzen 7 5800X3D
13.8 GB/s -13%
AMD Ryzen 5 7600X
13.2 GB/s -17%
Intel Core i5-12600K
12.8 GB/s -19%
AMD Ryzen 5 5600X
10.7 GB/s -33%
Twofish Mean 100MB
Intel Core i9-13900K
5.4 GB/s +135%
AMD Ryzen 9 7950X
4.6 GB/s +100%
AMD Ryzen 9 5950X
3.7 GB/s +61%
Intel Core i9-12900K
3.7 GB/s +61%
Intel Core i5-13600K
3.1 GB/s +35%
AMD Ryzen 9 5900X
2.9 GB/s +26%
AMD Ryzen 9 7900X
2.8 GB/s +22%
AMD Ryzen 7 7700X
2.3 GB/s 0%
AMD Ryzen 7 7700
2.3 GB/s
Intel Core i5-12600K
2.2 GB/s -4%
AMD Ryzen 7 5800X
2 GB/s -13%
AMD Ryzen 7 5800X3D
1.9 GB/s -17%
AMD Ryzen 5 7600X
1.8 GB/s -22%
AMD Ryzen 5 5600X
1.5 GB/s -35%
Serpent Mean 100MB
Intel Core i9-13900K
3 GB/s +100%
AMD Ryzen 9 7950X
2.9 GB/s +93%
AMD Ryzen 9 5950X
2.4 GB/s +60%
Intel Core i9-12900K
1.9 GB/s +27%
AMD Ryzen 9 5900X
1.8 GB/s +20%
Intel Core i5-13600K
1.7 GB/s +13%
AMD Ryzen 9 7900X
1.5 GB/s 0%
AMD Ryzen 7 7700
1.5 GB/s
AMD Ryzen 7 7700X
1.4 GB/s -7%
AMD Ryzen 7 5800X
1.3 GB/s -13%
Intel Core i5-12600K
1.3 GB/s -13%
AMD Ryzen 7 5800X3D
1.2 GB/s -20%
AMD Ryzen 5 7600X
1.1 GB/s -27%
AMD Ryzen 5 5600X
0.938 GB/s -37%
Geekbench 5.5
Single-Core
Intel Core i9-13900K
2290 Points +6%
AMD Ryzen 9 7900X
2274 Points +5%
AMD Ryzen 9 7950X ECO 65 W
2252 Points +4%
AMD Ryzen 9 7950X ECO 105 W
2250 Points +4%
AMD Ryzen 9 7950X
2241 Points +4%
AMD Ryzen 7 7700X
2218 Points +3%
AMD Ryzen 7 7700X ECO 65 W
2218 Points +3%
AMD Ryzen 5 7600X
2205 Points +2%
AMD Ryzen 7 7700
2161 Points
Intel Core i9-12900K
2042 Points -6%
Intel Core i5-13600K
1967 Points -9%
Intel Core i5-12600K
1904 Points -12%
AMD Ryzen 9 5950X
1682 Points -22%
AMD Ryzen 9 5900X
1669 Points -23%
AMD Ryzen 7 5800X
1665 Points -23%
AMD Ryzen 5 5600X
1657 Points -23%
AMD Ryzen 7 5800X3D
1622 Points -25%
Multi-Core
Intel Core i9-13900K
24157 Points +73%
AMD Ryzen 9 7950X
23948 Points +72%
AMD Ryzen 9 7950X ECO 105 W
22921 Points +65%
AMD Ryzen 9 7950X ECO 65 W
20496 Points +47%
AMD Ryzen 9 7900X
19987 Points +43%
Intel Core i9-12900K
17854 Points +28%
AMD Ryzen 9 5950X
16891 Points +21%
Intel Core i5-13600K
16651 Points +20%
AMD Ryzen 7 7700X
14373 Points +3%
AMD Ryzen 7 7700
13929 Points
AMD Ryzen 7 7700X ECO 65 W
13889 Points 0%
AMD Ryzen 9 5900X
12990 Points -7%
Intel Core i5-12600K
12797 Points -8%
AMD Ryzen 5 7600X
11917 Points -14%
AMD Ryzen 7 5800X
11354 Points -18%
AMD Ryzen 7 5800X3D
10856 Points -22%
AMD Ryzen 5 5600X
8980 Points -36%
Geekbench 5.0
5.0 Single-Core
Intel Core i9-13900K
2214 Points +7%
AMD Ryzen 9 7900X
2194 Points +6%
AMD Ryzen 9 7950X
2156 Points +4%
AMD Ryzen 5 7600X
2126 Points +2%
AMD Ryzen 7 7700X
2123 Points +2%
AMD Ryzen 7 7700
2078 Points
Intel Core i9-12900K
1968 Points -5%
Intel Core i5-13600K
1931 Points -7%
Intel Core i5-12600K
1821 Points -12%
AMD Ryzen 9 5950X
1683 Points -19%
AMD Ryzen 7 5800X
1673 Points -19%
AMD Ryzen 9 5900X
1667 Points -20%
AMD Ryzen 5 5600X
1587 Points -24%
AMD Ryzen 7 5800X3D
1526 Points -27%
5.0 Multi-Core
Intel Core i9-13900K
24021 Points +73%
AMD Ryzen 9 7950X
22891 Points +65%
AMD Ryzen 9 7900X
19975 Points +44%
Intel Core i9-12900K
17959 Points +29%
Intel Core i5-13600K
16635 Points +20%
AMD Ryzen 9 5950X
16570 Points +19%
AMD Ryzen 7 7700X
14215 Points +2%
AMD Ryzen 7 7700
13869 Points
AMD Ryzen 9 5900X
12974 Points -6%
Intel Core i5-12600K
12746 Points -8%
AMD Ryzen 5 7600X
11880 Points -14%
AMD Ryzen 7 5800X
11246 Points -19%
AMD Ryzen 7 5800X3D
10836 Points -22%
AMD Ryzen 5 5600X
8926 Points -36%
Geekbench 4.4
64 Bit Single-Core Score
Intel Core i9-13900K
9598 Points +10%
AMD Ryzen 9 7900X
9193 Points +5%
AMD Ryzen 9 7950X
9023 Points +3%
AMD Ryzen 7 7700X
8991 Points +3%
AMD Ryzen 5 7600X
8926 Points +2%
AMD Ryzen 7 7700
8753 Points
Intel Core i9-12900K
8665 Points -1%
Intel Core i5-13600K
8618 Points -2%
Intel Core i5-12600K
8223 Points -6%
AMD Ryzen 7 5800X
7333 Points -16%
AMD Ryzen 9 5900X
7297 Points -17%
AMD Ryzen 9 5950X
7216 Points -18%
AMD Ryzen 7 5800X3D
7187 Points -18%
AMD Ryzen 5 5600X
6953 Points -21%
64 Bit Multi-Core Score
Intel Core i9-13900K
86695 Points +56%
AMD Ryzen 9 7950X
85554 Points +54%
AMD Ryzen 9 7900X
74731 Points +35%
Intel Core i9-12900K
63583 Points +14%
AMD Ryzen 9 5950X
63233 Points +14%
Intel Core i5-13600K
60407 Points +9%
AMD Ryzen 7 7700X
56909 Points +2%
AMD Ryzen 7 7700
55542 Points
AMD Ryzen 9 5900X
51794 Points -7%
AMD Ryzen 5 7600X
47407 Points -15%
Intel Core i5-12600K
46557 Points -16%
AMD Ryzen 7 5800X
44131 Points -21%
AMD Ryzen 7 5800X3D
43687 Points -21%
AMD Ryzen 5 5600X
35617 Points -36%
7-Zip 18.03
7z b 4
AMD Ryzen 9 7950X
158242 MIPS +86%
AMD Ryzen 9 7950X ECO 105 W
151967 MIPS +78%
Intel Core i9-13900K
147068 MIPS +72%
AMD Ryzen 9 5950X
127792 MIPS +50%
AMD Ryzen 9 7900X
124975 MIPS +47%
Intel Core i9-12900K
97671 MIPS +15%
AMD Ryzen 9 5900X
95123 MIPS +12%
Intel Core i5-13600K
89647 MIPS +5%
AMD Ryzen 7 7700X
85789 MIPS +1%
AMD Ryzen 7 7700X ECO 65 W
85624 MIPS 0%
AMD Ryzen 7 7700
85260 MIPS
AMD Ryzen 7 5800X
74306 MIPS -13%
AMD Ryzen 7 5800X3D
69518 MIPS -18%
AMD Ryzen 5 7600X
69291 MIPS -19%
Intel Core i5-12600K
64260 MIPS -25%
AMD Ryzen 5 5600X
56607 MIPS -34%
7z b 4 -mmt1
AMD Ryzen 9 7900X
8282 MIPS +5%
AMD Ryzen 9 7950X
8211 MIPS +4%
AMD Ryzen 9 7950X ECO 105 W
8176 MIPS +4%
AMD Ryzen 7 7700X
8096 MIPS +3%
AMD Ryzen 5 7600X
8063 MIPS +2%
AMD Ryzen 7 7700X ECO 65 W
8052 MIPS +2%
AMD Ryzen 7 7700
7880 MIPS
Intel Core i9-13900K
7272 MIPS -8%
AMD Ryzen 9 5950X
6974 MIPS -11%
AMD Ryzen 7 5800X
6970 MIPS -12%
AMD Ryzen 7 5800X3D
6799 MIPS -14%
AMD Ryzen 9 5900X
6785 MIPS -14%
AMD Ryzen 5 5600X
6594 MIPS -16%
Intel Core i9-12900K
6571 MIPS -17%
Intel Core i5-13600K
6502 MIPS -17%
Intel Core i5-12600K
5944 MIPS -25%
HWBOT x265 Benchmark v2.2 - 4k Preset
AMD Ryzen 9 7950X
44 fps +76%
Intel Core i9-13900K
42.6 fps +70%
AMD Ryzen 9 7950X ECO 105 W
41.7 fps +67%
AMD Ryzen 9 7900X
36.2 fps +45%
AMD Ryzen 9 7950X ECO 65 W
36.2 fps +45%
AMD Ryzen 9 5950X
31.8 fps +27%
Intel Core i5-12600K
30.1 fps +20%
Intel Core i9-12900K
30 fps +20%
Intel Core i5-13600K
27.6 fps +10%
AMD Ryzen 7 7700X
26.1 fps +4%
AMD Ryzen 9 5900X
25.5 fps +2%
AMD Ryzen 7 7700
25 fps
AMD Ryzen 7 7700X ECO 65 W
24.8 fps -1%
AMD Ryzen 5 7600X
21.1 fps -16%
AMD Ryzen 7 5800X
20.8 fps -17%
AMD Ryzen 7 5800X3D
19.1 fps -24%
AMD Ryzen 5 5600X
15.7 fps -37%
R Benchmark 2.5 - Overall mean
AMD Ryzen 7 5800X3D
0.4784 sec * -19%
AMD Ryzen 5 5600X
0.4778 sec * -19%
AMD Ryzen 9 5950X
0.4556 sec * -13%
AMD Ryzen 9 5900X
0.4513 sec * -12%
AMD Ryzen 7 5800X
0.4509 sec * -12%
Intel Core i5-12600K
0.4456 sec * -11%
Intel Core i9-12900K
0.4216 sec * -5%
Intel Core i5-13600K
0.405 sec * -1%
AMD Ryzen 7 7700
0.4022 sec *
AMD Ryzen 7 7700X ECO 65 W
0.383 sec * +5%
AMD Ryzen 9 7950X
0.3776 sec * +6%
AMD Ryzen 9 7950X ECO 65 W
0.3773 sec * +6%
AMD Ryzen 9 7950X ECO 105 W
0.3769 sec * +6%
AMD Ryzen 7 7700X
0.3758 sec * +7%
AMD Ryzen 5 7600X
0.3749 sec * +7%
AMD Ryzen 9 7900X
0.3736 sec * +7%
Intel Core i9-13900K
0.3539 sec * +12%
LibreOffice - 20 Documents To PDF
Intel Core i5-12600K
71.8 s * -82%
AMD Ryzen 7 5800X3D
55 s * -39%
AMD Ryzen 9 5900X
47.65 s * -21%
AMD Ryzen 9 5950X
45.97 s * -16%
AMD Ryzen 5 5600X
45.14 s * -14%
AMD Ryzen 7 5800X
43.31 s * -10%
Intel Core i9-12900K
40.6 s * -3%
AMD Ryzen 7 7700
39.5 s *
AMD Ryzen 5 7600X
36.8 s * +7%
Intel Core i9-13900K
36.6 s * +7%
AMD Ryzen 9 7950X
36.6 s * +7%
Intel Core i5-13600K
35 s * +11%
AMD Ryzen 9 7900X
34.9 s * +12%
AMD Ryzen 7 7700X ECO 65 W
34.1 s * +14%
AMD Ryzen 7 7700X
33.6 s * +15%
AMD Ryzen 9 7950X ECO 65 W
33.1 s * +16%
AMD Ryzen 9 7950X ECO 105 W
33 s * +16%

* ... smaller is better

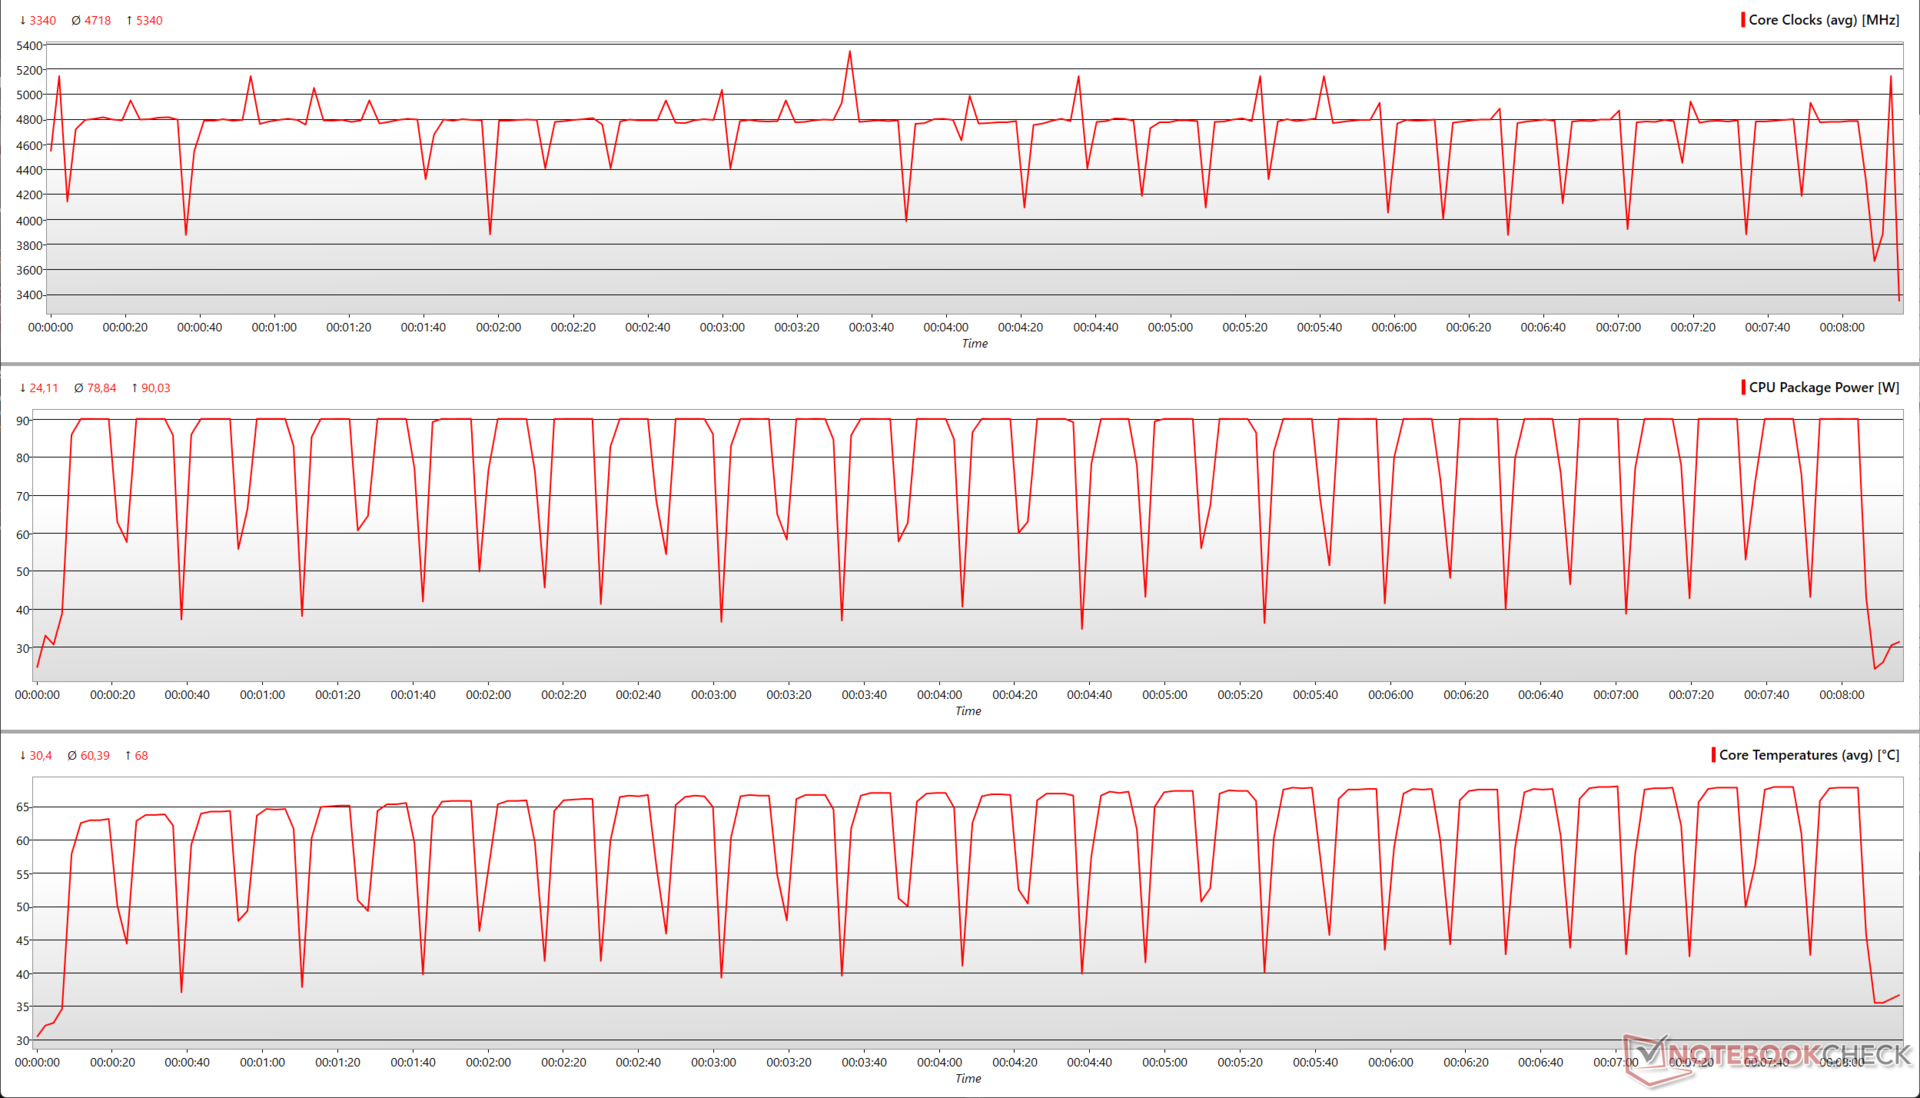
Cinebench R15 Multi Loop

Unlike the Ryzen 7000X series, AMD supplies a cooler in the box for the 65 W non-X processors. The Ryzen 9 7900 and the Ryzen 7 7700 come with a Wraith Prism cooler (ah, Zen 2 nostalgia!) while the Ryzen 5 7600 comes bundled with a Wraith Stealth low-profile cooler.

The Wraith coolers aren't the greatest out there, but they can come in very handy and can get the job done for non-intensive computing. The Ryzen 7 7700 offers a well-sustained performance in our Cinebench R15 multi-core loop test without any signs of throttling when paired with our Cooler Master MasterLiquid ML360L V2 ARGB AIO.

We recommend opting for a capable AIO solution if you plan on pushing the Ryzen 7 7700 to its limits.

01553104656207759301085124013951550170518602015217023252480263527902945Tooltip
AMD Ryzen 7 7700: Ø3021 (2985.74-3046.92)

During the loop, we see that the Ryzen 7 7700 is able to hit the 5.3 GHz mark albeit just once — the processor seems comfortable coasting around the 5.1 GHz mark in this test. The package power is maintained at a steady 90 W during each loop — it is higher than the rated 65 W TDP, but the core temperatures only reach a maximum of 68 °C.

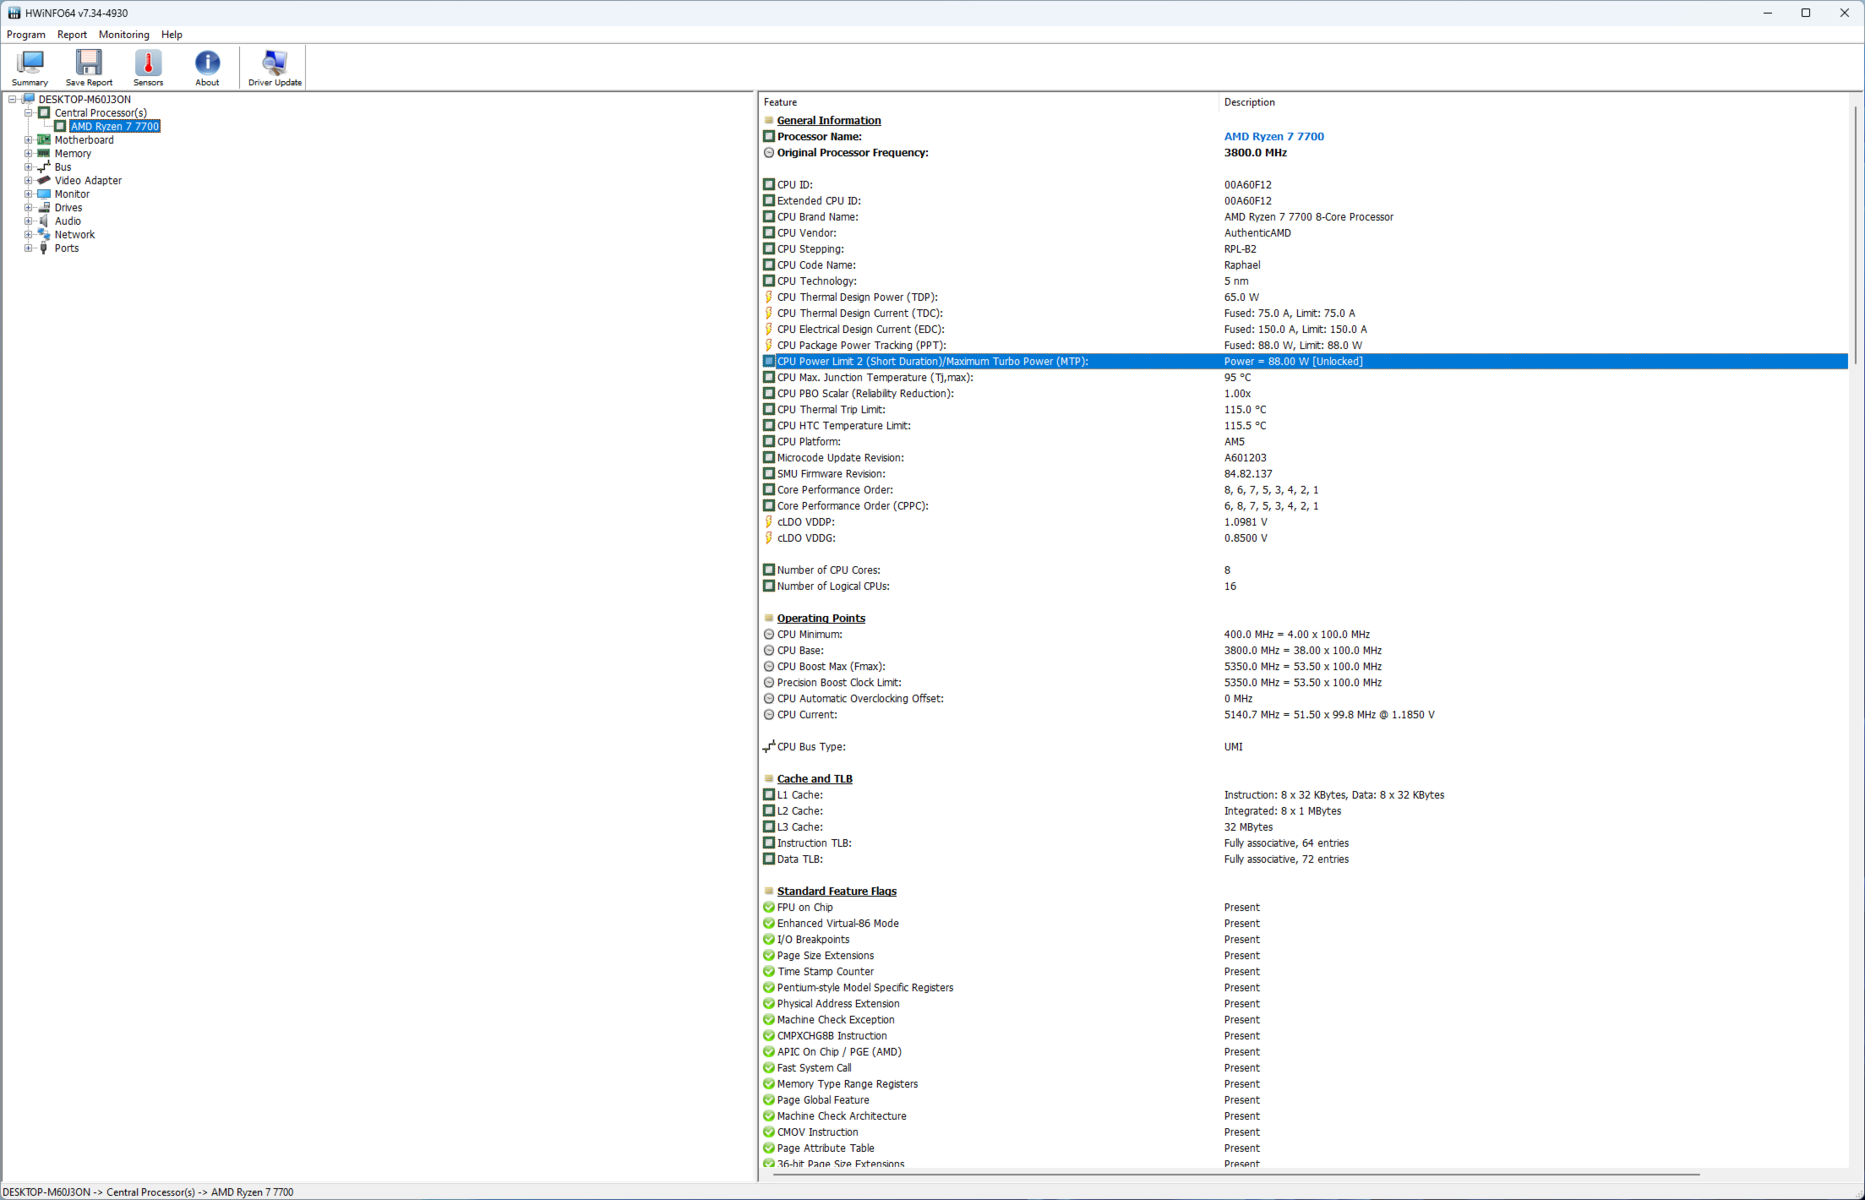
Like the X series chips, AMD mentions that the non-X counterparts also have a TjMax of 95 °C, but this limit is not usually reached during stress owing to the lower TDP. Still, the higher TjMax limit enables Precision Boost 2 to extract the maximum performance out of this chip.

AMD Ryzen 7 7700 - CPU parameters during Cinebench R15 multi-core loop
Cinebench R10 Rendering Multiple CPUs 32Bit
53881
Cinebench R10 Shading 32Bit
16110
Cinebench R10 Rendering Single 32Bit
8345
Cinebench R11.5 CPU Multi 64Bit
34.29 Points
Cinebench R11.5 OpenGL 64Bit
199.31 fps
Cinebench R11.5 CPU Single 64Bit
3.64 Points
Cinebench R15 CPU Single 64Bit
308 Points
Cinebench R15 Ref. Match 64Bit
99.6 %
Cinebench R15 OpenGL 64Bit
359 fps
Cinebench R15 CPU Multi 64Bit
3047 Points
Help

System performance: Within striking distance of a Ryzen 9 7900X

There are no hiccups in regular system performance with the Ryzen 7 7700. CrossMark puts the Ryzen 7 7700 on par with the Core i5-13600K and the Ryzen 5 7600X overall while the Productivity and Creativity components of the test see it vying for the Ryzen 9 7900X's spot.

Several AIDA64 tests even see the Ryzen 7 7700 handily beating the Core i9-12900K. Intel processors, on the other hand, seem to be having significant leads in 3DMark Time Spy CPU.

3DMark 11 - 1280x720 Performance Physics
AMD Ryzen 9 7950X
34239 Points +11%
Intel Core i9-13900K
32273 Points +4%
AMD Ryzen 7 7700
30945 Points
Intel Core i5-13600K
30480 Points -2%
AMD Ryzen 9 7900X
28618 Points -8%
Intel Core i9-12900K
28211 Points -9%
AMD Ryzen 7 5800X3D
27236 Points -12%
AMD Ryzen 5 7600X
25396 Points -18%
AMD Ryzen 9 5950X
25367 Points -18%
Intel Core i5-12600K
25017 Points -19%
AMD Ryzen 9 5900X
23423 Points -24%
AMD Ryzen 7 5800X
23381 Points -24%
AMD Ryzen 5 5600X
19649 Points -37%
3DMark - 2560x1440 Time Spy CPU
Intel Core i9-13900K
19392 Points +39%
Intel Core i9-12900K
18431 Points +32%
Intel Core i5-13600K
17124 Points +23%
AMD Ryzen 9 7900X
16616 Points +19%
AMD Ryzen 9 7950X
15856 Points +14%
AMD Ryzen 7 7700
13918 Points
Intel Core i5-12600K
13869 Points 0%
AMD Ryzen 9 5950X
13650 Points -2%
AMD Ryzen 9 5900X
12633 Points -9%
AMD Ryzen 7 5800X3D
11809 Points -15%
AMD Ryzen 7 5800X
11599 Points -17%
AMD Ryzen 5 7600X
10458 Points -25%
AMD Ryzen 5 5600X
8911 Points -36%
CrossMark
Overall
Intel Core i9-13900K
2589 Points +16%
AMD Ryzen 9 7950X
2495 Points +11%
AMD Ryzen 9 7900X
2405 Points +7%
Intel Core i5-13600K
2271 Points +1%
AMD Ryzen 7 7700
2238 Points
AMD Ryzen 5 7600X
2236 Points 0%
AMD Ryzen 7 5800X3D
1770 Points -21%
AMD Ryzen 9 5950X
1495 Points -33%
AMD Ryzen 5 5600X
1489 Points -33%
Productivity
Intel Core i9-13900K
2388 Points +13%
AMD Ryzen 9 7950X
2292 Points +8%
AMD Ryzen 9 7900X
2211 Points +4%
AMD Ryzen 7 7700
2119 Points
Intel Core i5-13600K
2115 Points 0%
AMD Ryzen 5 7600X
2101 Points -1%
AMD Ryzen 7 5800X3D
1706 Points -19%
AMD Ryzen 9 5950X
1359 Points -36%
Creativity
AMD Ryzen 9 7950X
2793 Points +15%
Intel Core i9-13900K
2784 Points +14%
AMD Ryzen 9 7900X
2673 Points +10%
AMD Ryzen 7 7700
2439 Points
AMD Ryzen 5 7600X
2414 Points -1%
Intel Core i5-13600K
2412 Points -1%
AMD Ryzen 7 5800X3D
1910 Points -22%
AMD Ryzen 9 5950X
1710 Points -30%
Responsiveness
Intel Core i9-13900K
2653 Points +30%
Intel Core i5-13600K
2350 Points +15%
AMD Ryzen 9 7950X
2297 Points +13%
AMD Ryzen 9 7900X
2251 Points +11%
AMD Ryzen 5 7600X
2145 Points +5%
AMD Ryzen 7 7700
2036 Points
AMD Ryzen 7 5800X3D
1574 Points -23%
AMD Ryzen 9 5950X
1332 Points -35%
AIDA64
FP32 Ray-Trace
AMD Ryzen 9 7950X
62786 KRay/s +110%
Intel Core i9-13900K
36939 KRay/s +24%
AMD Ryzen 9 7900X
33676 KRay/s +13%
AMD Ryzen 7 7700
29867 KRay/s
AMD Ryzen 9 5950X
28150 KRay/s -6%
Intel Core i5-13600K
23446 KRay/s -21%
AMD Ryzen 9 5900X
23391 KRay/s -22%
AMD Ryzen 5 7600X
17633 KRay/s -41%
AMD Ryzen 7 5800X
17545 KRay/s -41%
AMD Ryzen 7 5800X3D
17125 KRay/s -43%
Intel Core i9-12900K
13266 KRay/s -56%
AMD Ryzen 5 5600X
12482 KRay/s -58%
Intel Core i5-12600K
8243 KRay/s -72%
FPU Julia
AMD Ryzen 9 7950X
264044 Points +106%
AMD Ryzen 9 7900X
201995 Points +58%
Intel Core i9-13900K
183390 Points +43%
AMD Ryzen 9 5950X
144072 Points +12%
AMD Ryzen 7 7700
128212 Points
AMD Ryzen 9 5900X
114330 Points -11%
Intel Core i5-13600K
111374 Points -13%
AMD Ryzen 5 7600X
103526 Points -19%
AMD Ryzen 7 5800X3D
103015 Points -20%
AMD Ryzen 7 5800X
82429 Points -36%
AMD Ryzen 5 5600X
61688 Points -52%
Intel Core i9-12900K
59419 Points -54%
Intel Core i5-12600K
37321 Points -71%
CPU SHA3
AMD Ryzen 9 7950X
10362 MB/s +109%
Intel Core i9-13900K
9180 MB/s +85%
AMD Ryzen 9 7900X
7018 MB/s +42%
Intel Core i5-13600K
5253 MB/s +6%
AMD Ryzen 7 7700
4956 MB/s
Intel Core i9-12900K
4952 MB/s 0%
AMD Ryzen 9 5950X
4569 MB/s -8%
AMD Ryzen 5 7600X
3601 MB/s -27%
AMD Ryzen 9 5900X
3591 MB/s -28%
AMD Ryzen 7 5800X3D
3587 MB/s -28%
Intel Core i5-12600K
3250 MB/s -34%
AMD Ryzen 7 5800X
2542 MB/s -49%
AMD Ryzen 5 5600X
1920 MB/s -61%
CPU Queen
AMD Ryzen 9 7950X
205588 Points +59%
AMD Ryzen 9 7900X
172637 Points +33%
AMD Ryzen 9 5950X
164437 Points +27%
Intel Core i9-13900K
159676 Points +23%
AMD Ryzen 9 5900X
138724 Points +7%
AMD Ryzen 7 7700
129569 Points
Intel Core i5-13600K
120485 Points -7%
AMD Ryzen 7 5800X
113297 Points -13%
Intel Core i9-12900K
112694 Points -13%
AMD Ryzen 5 7600X
107954 Points -17%
AMD Ryzen 7 5800X3D
104367 Points -19%
Intel Core i5-12600K
88337 Points -32%
AMD Ryzen 5 5600X
85863 Points -34%
FPU SinJulia
AMD Ryzen 9 7950X
32855 Points +105%
AMD Ryzen 9 5950X
26364 Points +64%
AMD Ryzen 9 7900X
24881 Points +55%
Intel Core i9-13900K
19920 Points +24%
AMD Ryzen 9 5900X
19353 Points +21%
AMD Ryzen 7 7700
16050 Points
Intel Core i9-12900K
14664 Points -9%
AMD Ryzen 7 5800X
13527 Points -16%
AMD Ryzen 7 5800X3D
12794 Points -20%
AMD Ryzen 5 7600X
12774 Points -20%
Intel Core i5-13600K
12201 Points -24%
AMD Ryzen 5 5600X
10088 Points -37%
Intel Core i5-12600K
9510 Points -41%
FPU Mandel
AMD Ryzen 9 7950X
138291 Points +109%
AMD Ryzen 9 7900X
106620 Points +61%
Intel Core i9-13900K
91721 Points +38%
AMD Ryzen 9 5950X
78269 Points +18%
AMD Ryzen 7 7700
66267 Points
AMD Ryzen 9 5900X
62547 Points -6%
Intel Core i5-13600K
57797 Points -13%
AMD Ryzen 7 5800X3D
56568 Points -15%
AMD Ryzen 5 7600X
54555 Points -18%
AMD Ryzen 7 5800X
45369 Points -32%
Intel Core i9-12900K
38042 Points -43%
AMD Ryzen 5 5600X
33927 Points -49%
Intel Core i5-12600K
24230 Points -63%
CPU AES
AMD Ryzen 9 7950X
379659 MB/s +105%
Intel Core i9-13900K
297727 MB/s +61%
AMD Ryzen 9 7900X
279956 MB/s +51%
AMD Ryzen 7 7700
185246 MB/s
Intel Core i5-13600K
175556 MB/s -5%
AMD Ryzen 9 5950X
153484 MB/s -17%
AMD Ryzen 5 7600X
144365 MB/s -22%
AMD Ryzen 9 5900X
118228 MB/s -36%
Intel Core i9-12900K
94062 MB/s -49%
AMD Ryzen 7 5800X
82897 MB/s -55%
AMD Ryzen 7 5800X3D
66065 MB/s -64%
AMD Ryzen 5 5600X
62563 MB/s -66%
Intel Core i5-12600K
58635 MB/s -68%
CPU ZLib
Intel Core i9-13900K
2490 MB/s +111%
AMD Ryzen 9 7950X
2441 MB/s +107%
AMD Ryzen 9 7900X
1848 MB/s +56%
AMD Ryzen 9 5950X
1727 MB/s +46%
Intel Core i9-12900K
1560 MB/s +32%
Intel Core i5-13600K
1426 MB/s +21%
AMD Ryzen 9 5900X
1345 MB/s +14%
AMD Ryzen 7 7700
1181 MB/s
Intel Core i5-12600K
988 MB/s -16%
AMD Ryzen 5 7600X
945 MB/s -20%
AMD Ryzen 7 5800X
942 MB/s -20%
AMD Ryzen 7 5800X3D
890 MB/s -25%
AMD Ryzen 5 5600X
719 MB/s -39%
FP64 Ray-Trace
AMD Ryzen 9 7950X
33821 KRay/s +111%
Intel Core i9-13900K
20298 KRay/s +27%
AMD Ryzen 9 7900X
18490 KRay/s +15%
AMD Ryzen 7 7700
16020 KRay/s
AMD Ryzen 9 5950X
15213 KRay/s -5%
Intel Core i5-13600K
12806 KRay/s -20%
AMD Ryzen 9 5900X
12613 KRay/s -21%
AMD Ryzen 5 7600X
9488 KRay/s -41%
AMD Ryzen 7 5800X
9469 KRay/s -41%
AMD Ryzen 7 5800X3D
9090 KRay/s -43%
Intel Core i9-12900K
8078 KRay/s -50%
AMD Ryzen 5 5600X
6894 KRay/s -57%
Intel Core i5-12600K
5149 KRay/s -68%
CPU PhotoWorxx
Intel Core i9-13900K
48674 MPixel/s +51%
Intel Core i5-12600K
48577 MPixel/s +51%
Intel Core i5-13600K
48434 MPixel/s +50%
Intel Core i9-12900K
48307 MPixel/s +50%
AMD Ryzen 9 7900X
40893 MPixel/s +27%
AMD Ryzen 9 7950X
40261 MPixel/s +25%
AMD Ryzen 5 7600X
32202 MPixel/s 0%
AMD Ryzen 7 7700
32185 MPixel/s
AMD Ryzen 9 5950X
27530 MPixel/s -14%
AMD Ryzen 7 5800X
25309 MPixel/s -21%
AMD Ryzen 7 5800X3D
25224 MPixel/s -22%
AMD Ryzen 5 5600X
24352 MPixel/s -24%
AMD Ryzen 9 5900X
21433 MPixel/s -33%
Performance Rating - Percent
Intel Core i9-12900K -1!
95 pt
Intel Core i5-12600K -1!
92.3 pt
AMD Ryzen 9 7900X
74.7 pt
Intel Core i9-13900K
74.2 pt
AMD Ryzen 9 7950X
73.8 pt
Intel Core i5-13600K
69.1 pt
AMD Ryzen 5 7600X
67.9 pt
AMD Ryzen 7 7700
67.6 pt
AMD Ryzen 9 5900X
67.2 pt
AMD Ryzen 9 5950X
57.6 pt
AMD Ryzen 7 5800X
53.6 pt
AMD Ryzen 5 5600X
49.8 pt
AMD Ryzen 7 5800X3D
44.2 pt
AIDA64
Memory Copy
Intel Core i9-13900K
74937 MB/s +25%
Intel Core i9-12900K
73146 MB/s +22%
Intel Core i5-13600K
71725 MB/s +20%
Intel Core i5-12600K
70749 MB/s +18%
AMD Ryzen 9 7900X
69140 MB/s +16%
AMD Ryzen 9 7950X
68526 MB/s +15%
AMD Ryzen 9 5900X
66130 MB/s +11%
AMD Ryzen 5 7600X
59949 MB/s 0%
AMD Ryzen 7 7700
59838 MB/s
AMD Ryzen 9 5950X
59171 MB/s -1%
AMD Ryzen 7 5800X
57120 MB/s -5%
AMD Ryzen 5 5600X
53947 MB/s -10%
AMD Ryzen 7 5800X3D
49404 MB/s -17%
Memory Latency
Intel Core i5-13600K
81.1 ns * -26%
Intel Core i9-13900K
76.5 ns * -19%
AMD Ryzen 7 5800X3D
69.3 ns * -8%
AMD Ryzen 9 5950X
67.7 ns * -5%
AMD Ryzen 9 7950X
65.3 ns * -2%
AMD Ryzen 7 7700
64.3 ns *
AMD Ryzen 5 5600X
63.9 ns * +1%
AMD Ryzen 5 7600X
63.8 ns * +1%
AMD Ryzen 9 7900X
63.3 ns * +2%
AMD Ryzen 7 5800X
60.9 ns * +5%
AMD Ryzen 9 5900X
58.4 ns * +9%
Memory Read
Intel Core i9-13900K
83883 MB/s +42%
Intel Core i9-12900K
81059 MB/s +37%
Intel Core i5-12600K
76864 MB/s +30%
Intel Core i5-13600K
75757 MB/s +28%
AMD Ryzen 9 7950X
75590 MB/s +28%
AMD Ryzen 9 7900X
75338 MB/s +28%
AMD Ryzen 9 5900X
70692 MB/s +20%
AMD Ryzen 7 5800X
63645 MB/s +8%
AMD Ryzen 9 5950X
62991 MB/s +7%
AMD Ryzen 5 5600X
59238 MB/s 0%
AMD Ryzen 5 7600X
59007 MB/s 0%
AMD Ryzen 7 7700
58988 MB/s
AMD Ryzen 7 5800X3D
50995 MB/s -14%
Memory Write
AMD Ryzen 5 7600X
81320 MB/s 0%
AMD Ryzen 7 7700
80948 MB/s
AMD Ryzen 9 7900X
76967 MB/s -5%
AMD Ryzen 9 7950X
76515 MB/s -5%
Intel Core i9-13900K
74140 MB/s -8%
Intel Core i5-12600K
73824 MB/s -9%
Intel Core i9-12900K
73707 MB/s -9%
Intel Core i5-13600K
73484 MB/s -9%
AMD Ryzen 9 5900X
55525 MB/s -31%
AMD Ryzen 9 5950X
48748 MB/s -40%
AMD Ryzen 7 5800X
30399 MB/s -62%
AMD Ryzen 5 5600X
28798 MB/s -64%
AMD Ryzen 7 5800X3D
28787 MB/s -64%

* ... smaller is better

3D and gaming performance: On par with the Ryzen 9 7900X and Core i9-13900K

The Ryzen 7 7700 comes across as a highly capable gaming CPU that is right up there with the best that Intel and AMD have to offer in this generation.

The Ryzen 7 7700 ties with the Core i9-13900K, Ryzen 9 7900X, and the Ryzen 5 7600X in overall gaming performance. However, results can vary on a per-game basis.

For instance, F1 22 seems to be favoring AMD CPUs a lot more than Intel while the converse is true in the case of Far Cry 5. AMD's latest 8-core 65W CPU also manages to edge out the Ryzen 9 7900X ever-so-slightly in The Witcher 3 at 1080p Ultra while virtually tying with the Core i9-13900K at a very low 1024 x 768 resolution at the lowest possible graphics settings.

In any case, the Ryzen 7 7700 makes for an excellent gaming CPU especially if you are looking to push the maximum frames possible at 1080p or QHD.

Performance Rating - Percent
AMD Ryzen 7 7700
100 pt
AMD Ryzen 5 7600X
94.9 pt
AMD Ryzen 9 7900X
94.5 pt
Intel Core i5-13600K
92.8 pt
Intel Core i9-13900K
91.8 pt
AMD Ryzen 9 7950X
90.3 pt
3DMark - 2560x1440 Time Spy Graphics
AMD Ryzen 7 7700
20433 Points
AMD Ryzen 9 7900X
19467 Points -5%
AMD Ryzen 5 7600X
19403 Points -5%
Intel Core i9-13900K
19198 Points -6%
Intel Core i5-13600K
19164 Points -6%
AMD Ryzen 9 7950X
18786 Points -8%
3DMark 11 - 1280x720 Performance GPU
AMD Ryzen 7 7700
66934 Points
AMD Ryzen 5 7600X
63479 Points -5%
AMD Ryzen 9 7900X
62735 Points -6%
Intel Core i5-13600K
61518 Points -8%
Intel Core i9-13900K
59972 Points -10%
AMD Ryzen 9 7950X
59280 Points -11%
3DMark 11 Performance
50542 points
3DMark Time Spy Score
19092 points
Help
Performance Rating - Percent
AMD Ryzen 7 7700
AMD Ryzen 7 7700, NVIDIA GeForce RTX 3090
94.6 pt
Intel Core i9-13900K
Intel Core i9-13900K, NVIDIA GeForce RTX 3090
94.5 pt
AMD Ryzen 9 7900X
AMD Ryzen 9 7900X, NVIDIA GeForce RTX 3090
94.2 pt
AMD Ryzen 5 7600X
AMD Ryzen 5 7600X, NVIDIA GeForce RTX 3090
93.8 pt
AMD Ryzen 9 7950X
AMD Ryzen 9 7950X, NVIDIA GeForce RTX 3090
91.6 pt
Intel Core i5-13600K
Intel Core i5-13600K, NVIDIA GeForce RTX 3090
87.8 pt
Average of class Desktop
 
72 pt
F1 22
1920x1080 Ultra High Preset AA:T AF:16x
Average of class Desktop
  (61.9 - 199.2, n=18, last 2 years)
145.2 fps +6%
AMD Ryzen 7 7700
AMD Ryzen 7 7700, NVIDIA GeForce RTX 3090
136.9 (117min, 106P1) fps
Intel Core i5-13600K
Intel Core i5-13600K, NVIDIA GeForce RTX 3090
128.1 (110min, 102P1) fps -6%
AMD Ryzen 9 7950X
AMD Ryzen 9 7950X, NVIDIA GeForce RTX 3090
127.9 (109min, 101P1) fps -7%
AMD Ryzen 5 7600X
AMD Ryzen 5 7600X, NVIDIA GeForce RTX 3090
126.4 (109min, 100P1) fps -8%
AMD Ryzen 9 7900X
AMD Ryzen 9 7900X, NVIDIA GeForce RTX 3090
125.1 (108min, 100P1) fps -9%
Intel Core i9-13900K
Intel Core i9-13900K, NVIDIA GeForce RTX 3090
122.6 (104min, 98P1) fps -10%
1920x1080 Low Preset AA:T AF:16x
AMD Ryzen 9 7950X
AMD Ryzen 9 7950X, NVIDIA GeForce RTX 3090
412 (288min, 229P1) fps +3%
AMD Ryzen 7 7700
AMD Ryzen 7 7700, NVIDIA GeForce RTX 3090
399 (277min, 230P1) fps
Average of class Desktop
  (239 - 427, n=17, last 2 years)
371 fps -7%
AMD Ryzen 9 7900X
AMD Ryzen 9 7900X, NVIDIA GeForce RTX 3090
344 (260min, 201P1) fps -14%
AMD Ryzen 5 7600X
AMD Ryzen 5 7600X, NVIDIA GeForce RTX 3090
333 (255min, 199P1) fps -17%
Intel Core i5-13600K
Intel Core i5-13600K, NVIDIA GeForce RTX 3090
322 (252min, 186P1) fps -19%
Intel Core i9-13900K
Intel Core i9-13900K, NVIDIA GeForce RTX 3090
320 (269min, 180P1) fps -20%
The Witcher 3
1920x1080 Ultra Graphics & Postprocessing (HBAO+)
AMD Ryzen 7 7700
AMD Ryzen 7 7700, NVIDIA GeForce RTX 3090
192 (167min, 167.47P1) fps
AMD Ryzen 9 7900X
AMD Ryzen 9 7900X, NVIDIA GeForce RTX 3090
188.1 (93.6min, 119.6P0.1, 157P1) fps -2%
AMD Ryzen 5 7600X
AMD Ryzen 5 7600X, NVIDIA GeForce RTX 3090
186.4 (85.2min, 119.4P0.1, 152.4P1) fps -3%
Intel Core i5-13600K
Intel Core i5-13600K, NVIDIA GeForce RTX 3090
183.2 (34.9min, 116.1P0.1, 149.9P1) fps -5%
Intel Core i9-13900K
Intel Core i9-13900K, NVIDIA GeForce RTX 3090
179.8 (98.3min, 120.2P0.1, 148.7P1) fps -6%
AMD Ryzen 9 7950X
AMD Ryzen 9 7950X, NVIDIA GeForce RTX 3090
175.2 (158min, 158.56P1) fps -9%
Average of class Desktop
  (3.9 - 314, n=30, last 2 years)
165.5 fps -14%
1024x768 Low Graphics & Postprocessing
AMD Ryzen 9 7900X
AMD Ryzen 9 7900X, NVIDIA GeForce RTX 3090
773 (81.6min, 345P0.1, 543P1) fps +2%
AMD Ryzen 7 7700
AMD Ryzen 7 7700, NVIDIA GeForce RTX 3090
756 (630min, 637.5P1) fps
Intel Core i9-13900K
Intel Core i9-13900K, NVIDIA GeForce RTX 3090
752 (33.9min, 316P0.1, 533P1) fps -1%
AMD Ryzen 5 7600X
AMD Ryzen 5 7600X, NVIDIA GeForce RTX 3090
710 (99.8min, 384P0.1, 495P1) fps -6%
AMD Ryzen 9 7950X
AMD Ryzen 9 7950X, NVIDIA GeForce RTX 3090
703 (623min, 625.28P1) fps -7%
Intel Core i5-13600K
Intel Core i5-13600K, NVIDIA GeForce RTX 3090
611 (87.5min, 340P0.1, 454P1) fps -19%
Average of class Desktop
  (11.3 - 790, n=21, last 2 years)
430 fps -43%
Far Cry 5
1920x1080 Ultra Preset AA:T
Intel Core i9-13900K
Intel Core i9-13900K, NVIDIA GeForce RTX 3090
205 (155min) fps +16%
Intel Core i5-13600K
Intel Core i5-13600K, NVIDIA GeForce RTX 3090
188 (143min) fps +6%
AMD Ryzen 9 7900X
AMD Ryzen 9 7900X, NVIDIA GeForce RTX 3090
186 (133min) fps +5%
AMD Ryzen 5 7600X
AMD Ryzen 5 7600X, NVIDIA GeForce RTX 3090
183 (136min) fps +3%
AMD Ryzen 7 7700
AMD Ryzen 7 7700, NVIDIA GeForce RTX 3090
177 (133min) fps
AMD Ryzen 9 7950X
AMD Ryzen 9 7950X, NVIDIA GeForce RTX 3090
176 (132min) fps -1%
Average of class Desktop
  (8 - 219, n=23, last 2 years)
135.5 fps -23%
1280x720 Low Preset AA:T
Intel Core i9-13900K
Intel Core i9-13900K, NVIDIA GeForce RTX 3090
263 (199min) fps +16%
AMD Ryzen 9 7900X
AMD Ryzen 9 7900X, NVIDIA GeForce RTX 3090
244 (164min) fps +8%
Intel Core i5-13600K
Intel Core i5-13600K, NVIDIA GeForce RTX 3090
240 (175min) fps +6%
AMD Ryzen 5 7600X
AMD Ryzen 5 7600X, NVIDIA GeForce RTX 3090
238 (152min) fps +5%
AMD Ryzen 7 7700
AMD Ryzen 7 7700, NVIDIA GeForce RTX 3090
226 (170min) fps
AMD Ryzen 9 7950X
AMD Ryzen 9 7950X, NVIDIA GeForce RTX 3090
216 (160min) fps -4%
Average of class Desktop
  (8 - 259, n=20, last 2 years)
155.3 fps -31%
GTA V
1920x1080 Highest Settings possible AA:4xMSAA + FX AF:16x
Intel Core i9-13900K
Intel Core i9-13900K, NVIDIA GeForce RTX 3090
165.6 (9.1min, 125P1) fps +6%
AMD Ryzen 9 7900X
AMD Ryzen 9 7900X, NVIDIA GeForce RTX 3090
161.4 (8.93min, 125P1) fps +4%
AMD Ryzen 7 7700
AMD Ryzen 7 7700, NVIDIA GeForce RTX 3090
155.7 (8.09min, 111.1P1) fps
AMD Ryzen 9 7950X
AMD Ryzen 9 7950X, NVIDIA GeForce RTX 3090
155.4 (7.73min, 111.1P1) fps 0%
AMD Ryzen 5 7600X
AMD Ryzen 5 7600X, NVIDIA GeForce RTX 3090
155.2 (5.9min, 111.1P1) fps 0%
Intel Core i5-13600K
Intel Core i5-13600K, NVIDIA GeForce RTX 3090
154.9 (8.8min, 125P1) fps -1%
Average of class Desktop
  (3.38 - 172.4, n=27, last 2 years)
123.1 fps -21%
1920x1080 Lowest Settings possible
AMD Ryzen 9 7950X
AMD Ryzen 9 7950X, NVIDIA GeForce RTX 3090
187.9 (8.2min, 200P1) fps 0%
Intel Core i9-13900K
Intel Core i9-13900K, NVIDIA GeForce RTX 3090
187.8 (3.95min, 200P1) fps 0%
AMD Ryzen 7 7700
AMD Ryzen 7 7700, NVIDIA GeForce RTX 3090
187.7 (4.18min, 200P1) fps
Intel Core i5-13600K
Intel Core i5-13600K, NVIDIA GeForce RTX 3090
187.6 (1.325min, 200P1) fps 0%
AMD Ryzen 9 7900X
AMD Ryzen 9 7900X, NVIDIA GeForce RTX 3090
187.4 (6.53min, 200P1) fps 0%
AMD Ryzen 5 7600X
AMD Ryzen 5 7600X, NVIDIA GeForce RTX 3090
187.4 (9.49min, 200P1) fps 0%
Average of class Desktop
  (19 - 188.1, n=25, last 2 years)
159.7 fps -15%
X-Plane 11.11
1920x1080 high (fps_test=3)
AMD Ryzen 9 7900X
AMD Ryzen 9 7900X, NVIDIA GeForce RTX 3090
160.9 fps +9%
AMD Ryzen 5 7600X
AMD Ryzen 5 7600X, NVIDIA GeForce RTX 3090
151.8 fps +3%
Intel Core i9-13900K
Intel Core i9-13900K, NVIDIA GeForce RTX 3090
148.4 fps +1%
AMD Ryzen 7 7700
AMD Ryzen 7 7700, NVIDIA GeForce RTX 3090
147.5 fps
AMD Ryzen 9 7950X
AMD Ryzen 9 7950X, NVIDIA GeForce RTX 3090
141 fps -4%
Intel Core i5-13600K
Intel Core i5-13600K, NVIDIA GeForce RTX 3090
131.4 fps -11%
Average of class Desktop
  (4.64 - 166.3, n=31, last 2 years)
103.8 fps -30%
1280x720 low (fps_test=1)
Intel Core i9-13900K
Intel Core i9-13900K, NVIDIA GeForce RTX 3090
234 fps +7%
AMD Ryzen 5 7600X
AMD Ryzen 5 7600X, NVIDIA GeForce RTX 3090
227 fps +4%
AMD Ryzen 9 7900X
AMD Ryzen 9 7900X, NVIDIA GeForce RTX 3090
225 fps +3%
AMD Ryzen 7 7700
AMD Ryzen 7 7700, NVIDIA GeForce RTX 3090
218 fps
AMD Ryzen 9 7950X
AMD Ryzen 9 7950X, NVIDIA GeForce RTX 3090
216 fps -1%
Intel Core i5-13600K
Intel Core i5-13600K, NVIDIA GeForce RTX 3090
200 fps -8%
Average of class Desktop
  (7.76 - 251, n=31, last 2 years)
153.7 fps -29%
Dota 2 Reborn
1920x1080 ultra (3/3) best looking
AMD Ryzen 9 7900X
AMD Ryzen 9 7900X, NVIDIA GeForce RTX 3090
231.65 (196.5min) fps +5%
Intel Core i9-13900K
Intel Core i9-13900K, NVIDIA GeForce RTX 3090
229.2 (192.7min) fps +4%
AMD Ryzen 5 7600X
AMD Ryzen 5 7600X, NVIDIA GeForce RTX 3090
228.5 (193.7min) fps +4%
AMD Ryzen 9 7950X
AMD Ryzen 9 7950X, NVIDIA GeForce RTX 3090
222.3 (190.1min) fps +1%
AMD Ryzen 7 7700
AMD Ryzen 7 7700, NVIDIA GeForce RTX 3090
219.9 (187.6min) fps
Intel Core i5-13600K
Intel Core i5-13600K, NVIDIA GeForce RTX 3090
205.4 (178.9min) fps -7%
Average of class Desktop
  (5.2 - 246, n=33, last 2 years)
148.5 fps -32%
1280x720 min (0/3) fastest
AMD Ryzen 5 7600X
AMD Ryzen 5 7600X, NVIDIA GeForce RTX 3090
301.3 (255.5min) fps +3%
AMD Ryzen 9 7950X
AMD Ryzen 9 7950X, NVIDIA GeForce RTX 3090
293.2 (253.6min) fps 0%
AMD Ryzen 9 7900X
AMD Ryzen 9 7900X, NVIDIA GeForce RTX 3090
293.1 (253min) fps 0%
AMD Ryzen 7 7700
AMD Ryzen 7 7700, NVIDIA GeForce RTX 3090
292.6 (240.9min) fps
Intel Core i9-13900K
Intel Core i9-13900K, NVIDIA GeForce RTX 3090
285.3 (242.4min) fps -2%
Intel Core i5-13600K
Intel Core i5-13600K, NVIDIA GeForce RTX 3090
246.2 (214min) fps -16%
Average of class Desktop
  (24.3 - 303, n=33, last 2 years)
199.3 fps -32%
Strange Brigade
1920x1080 ultra AA:ultra AF:16
AMD Ryzen 7 7700
AMD Ryzen 7 7700, NVIDIA GeForce RTX 3090
378 (125.8min, 276P1) fps
AMD Ryzen 5 7600X
AMD Ryzen 5 7600X, NVIDIA GeForce RTX 3090
354 (60min, 259P1) fps -6%
AMD Ryzen 9 7950X
AMD Ryzen 9 7950X, NVIDIA GeForce RTX 3090
351 (100.5min, 254P1) fps -7%
Intel Core i9-13900K
Intel Core i9-13900K, NVIDIA GeForce RTX 3090
350 (57.6min, 258P1) fps -7%
Intel Core i5-13600K
Intel Core i5-13600K, NVIDIA GeForce RTX 3090
348 (59.9min, 256P1) fps -8%
AMD Ryzen 9 7900X
AMD Ryzen 9 7900X, NVIDIA GeForce RTX 3090
329 (127.3min, 237P1) fps -13%
Average of class Desktop
  (13.6 - 569, n=21, last 2 years)
295 fps -22%
1280x720 lowest AF:1
AMD Ryzen 5 7600X
AMD Ryzen 5 7600X, NVIDIA GeForce RTX 3090
819 (60.2min, 627P1) fps +8%
AMD Ryzen 7 7700
AMD Ryzen 7 7700, NVIDIA GeForce RTX 3090
756 (144min, 586P1) fps
Intel Core i9-13900K
Intel Core i9-13900K, NVIDIA GeForce RTX 3090
749 (60.3min, 591P1) fps -1%
AMD Ryzen 9 7900X
AMD Ryzen 9 7900X, NVIDIA GeForce RTX 3090
741 (352min, 583P1) fps -2%
AMD Ryzen 9 7950X
AMD Ryzen 9 7950X, NVIDIA GeForce RTX 3090
694 (143.1min, 555P1) fps -8%
Intel Core i5-13600K
Intel Core i5-13600K, NVIDIA GeForce RTX 3090
679 (62min, 496P1) fps -10%
Average of class Desktop
  (9.2 - 797, n=24, last 2 years)
436 fps -42%

AMD Ryzen 7 7700 with Nvidia GeForce RTX 3090

low med. high ultraQHD4K
GTA V (2015) 187 187.6 187.2 155.7 150.5 184.2
The Witcher 3 (2015) 756 591 379 192 160.2
Dota 2 Reborn (2015) 292.6 242.3 233.2 219.9 211.3
Final Fantasy XV Benchmark (2018) 235 196.1 153 92.4
X-Plane 11.11 (2018) 218 196.3 147.5 120.5
Far Cry 5 (2018) 226 202 194 177 171 115
Strange Brigade (2018) 756 542 433 378 282 169
F1 2021 (2021) 658 565 463 244 186.2 110
F1 22 (2022) 399 427 361 136.9 89.9 45.7

Energy management: More efficient than a 65 W Ryzen 7 7700X

The AMD Ryzen 7 7700 has a very frugal energy requirement relative to the competition. In Cinebench R15 multi, the Ryzen 7 7700 sips 24% lesser power than a TDP-limited 65W Ryzen 7 7700X making AMD's new 65 W chip up to 32% more efficient in terms of performance.

The Witcher 3 at 1080p Ultra sees the total power consumption with the Ryzen 7 7700 system more or less in line with the Core i9-13900K and Ryzen 9 7950X systems even when the latter are TDP-limited.

That being said, the Ryzen 7 7700 is able to offer additional frames compared to its rivals, which makes the processor move up in power efficiency rankings for this game.

Power Consumption: External Monitor

0306090120150180210240270300330360390420450480510Tooltip
AMD Ryzen 7 7700; Prime95 V2810 Stress (external Monitor): Ø163.2 (156.6-174.5)
AMD Ryzen 7 7700; Cinebench R15 Multi (external Monitor): Ø149.4 (148.6-150.3)
AMD Ryzen 7 7700; Cinebench R20 Multi (external Monitor): Ø148.6 (147.6-150.2)
AMD Ryzen 7 7700; Cinebench R20 Single (external Monitor): Ø97.2 (95.1-127)
AMD Ryzen 7 7700; Cinebench R23 Single (external Monitor): Ø98.1 (95.6-135.1)
AMD Ryzen 7 7700; Cinebench R23 Multi (external Monitor): Ø164.6 (163-166.5)
AMD Ryzen 7 7700; 1920x1080 The Witcher 3 ultra (external Monitor): Ø519 (511-532)
AMD Ryzen 7 7700; Idle 1min (external Monitor): Ø73.4 (71.8-81.7)
Power Consumption / Cinebench R15 Multi Efficiency (external Monitor)
AMD Ryzen 9 7950X ECO 65 W, NVIDIA GeForce RTX 3090
25.2 Points per Watt +24%
AMD Ryzen 9 7950X ECO 105 W, NVIDIA GeForce RTX 3090
22.1 Points per Watt +8%
AMD Ryzen 7 7700, NVIDIA GeForce RTX 3090
20.4 Points per Watt
AMD Ryzen 9 5950X, NVIDIA Titan RTX
19.9 Points per Watt -2%
AMD Ryzen 9 7950X, NVIDIA GeForce RTX 3090
17.1 Points per Watt -16%
Average NVIDIA GeForce RTX 3090 (11.7 - 25.2, n=13)
16.7 Points per Watt -18%
Average of class Desktop (10.1 - 26.5, n=20, last 2 years)
16.7 Points per Watt -18%
AMD Ryzen 9 5900X, NVIDIA Titan RTX
15.8 Points per Watt -23%
AMD Ryzen 9 7900X, NVIDIA GeForce RTX 3090
15.5 Points per Watt -24%
AMD Ryzen 7 7700X ECO 65 W, NVIDIA GeForce RTX 3090
15.5 Points per Watt -24%
AMD Ryzen 7 7700X, NVIDIA GeForce RTX 3090
13.3 Points per Watt -35%
Intel Core i9-13900K, NVIDIA GeForce RTX 3090
12.9 Points per Watt -37%
Intel Core i5-13600K, NVIDIA GeForce RTX 3090
12.7 Points per Watt -38%
Intel Core i9-12900K, NVIDIA Titan RTX
12.5 Points per Watt -39%
Intel Core i5-12600K, NVIDIA Titan RTX
12.4 Points per Watt -39%
AMD Ryzen 7 5800X, NVIDIA Titan RTX
11.9 Points per Watt -42%
AMD Ryzen 5 7600X, NVIDIA GeForce RTX 3090
11.7 Points per Watt -43%
AMD Ryzen 5 5600X, NVIDIA Titan RTX
11.6 Points per Watt -43%
AMD Ryzen 7 5800X3D, NVIDIA GeForce RTX 3090 Ti
11.5 Points per Watt -44%
Power Consumption / Witcher 3 ultra Efficiency (external Monitor)
Average of class Desktop (0.1429 - 0.652, n=26, last 2 years)
0.437 fps per Watt +18%
AMD Ryzen 7 7700, NVIDIA GeForce RTX 3090
0.3699 fps per Watt
Intel Core i5-13600K, NVIDIA GeForce RTX 3090
0.3664 fps per Watt -1%
AMD Ryzen 5 7600X, NVIDIA GeForce RTX 3090
0.3592 fps per Watt -3%
Intel Core i5-12600K, NVIDIA Titan RTX
0.3522 fps per Watt -5%
AMD Ryzen 7 5800X3D, NVIDIA GeForce RTX 3090 Ti
0.3447 fps per Watt -7%
Average NVIDIA GeForce RTX 3090 (0.268 - 0.3954, n=14)
0.3429 fps per Watt -7%
AMD Ryzen 5 5600X, NVIDIA Titan RTX
0.3397 fps per Watt -8%
AMD Ryzen 9 7900X, NVIDIA GeForce RTX 3090
0.3389 fps per Watt -8%
Intel Core i9-13900K, NVIDIA GeForce RTX 3090
0.3373 fps per Watt -9%
AMD Ryzen 7 7700X, NVIDIA GeForce RTX 3090
0.3341 fps per Watt -10%
AMD Ryzen 7 5800X, NVIDIA Titan RTX
0.332 fps per Watt -10%
AMD Ryzen 9 7950X ECO 105 W, NVIDIA GeForce RTX 3090
0.3286 fps per Watt -11%
AMD Ryzen 9 7950X ECO 65 W, NVIDIA GeForce RTX 3090
0.3284 fps per Watt -11%
AMD Ryzen 9 7950X, NVIDIA GeForce RTX 3090
0.325 fps per Watt -12%
AMD Ryzen 7 7700X ECO 65 W, NVIDIA GeForce RTX 3090
0.3218 fps per Watt -13%
AMD Ryzen 9 5900X, NVIDIA Titan RTX
0.3207 fps per Watt -13%
AMD Ryzen 9 5950X, NVIDIA Titan RTX
0.3201 fps per Watt -13%
Intel Core i9-12900K, NVIDIA Titan RTX
0.3002 fps per Watt -19%
Power Consumption / Cinebench R15 Multi (external Monitor)
Intel Core i9-13900K, NVIDIA GeForce RTX 3090
480 (263min, 277P1 - 553max) Watt * -221%
AMD Ryzen 9 7950X, NVIDIA GeForce RTX 3090 (Idle: 95.2 W)
364 (357min, 357P1 - 373max) Watt * -144%
Intel Core i9-12900K, NVIDIA Titan RTX (Idle: 70.5 W)
324.4 Watt * -117%
AMD Ryzen 9 7900X, NVIDIA GeForce RTX 3090
313 (214min, 221P1 - 406max) Watt * -110%
Intel Core i5-13600K, NVIDIA GeForce RTX 3090
286 (232min, 235P1 - 343max) Watt * -91%
Average NVIDIA GeForce RTX 3090 (Idle: 149.4 - 480, n=14 W)
272 Watt * -82%
AMD Ryzen 9 7950X ECO 105 W, NVIDIA GeForce RTX 3090 (Idle: 93.4 W)
263 (262min, 262P1 - 265max) Watt * -76%
AMD Ryzen 7 7700X, NVIDIA GeForce RTX 3090 (Idle: 89.8 W)
240 (236min, 236P1 - 252max) Watt * -61%
AMD Ryzen 9 5900X, NVIDIA Titan RTX (Idle: 78.1 W)
235.8 (204min - 238max) Watt * -58%
AMD Ryzen 9 5950X, NVIDIA Titan RTX (Idle: 78 W)
226.1 (160min - 249max) Watt * -51%
AMD Ryzen 7 5800X, NVIDIA Titan RTX (Idle: 77.5 W)
220.7 (219min - 222max) Watt * -48%
AMD Ryzen 5 7600X, NVIDIA GeForce RTX 3090
215 (134.8min, 135.6P1 - 259max) Watt * -44%
AMD Ryzen 7 5800X3D, NVIDIA GeForce RTX 3090 Ti (Idle: 102 W)
209 (208min, 208P1 - 212max) Watt * -40%
Intel Core i5-12600K, NVIDIA Titan RTX (Idle: 70.45 W)
205.9 (145min - 213max) Watt * -38%
AMD Ryzen 7 7700X ECO 65 W, NVIDIA GeForce RTX 3090
196.1 (195.3min, 195.3P1 - 196.7max) Watt * -31%
AMD Ryzen 9 7950X ECO 65 W, NVIDIA GeForce RTX 3090 (Idle: 93.1 W)
191.9 (191.1min, 191.1P1 - 192.5max) Watt * -28%
AMD Ryzen 5 5600X, NVIDIA Titan RTX (Idle: 79.23 W)
170.1 (165min - 210max) Watt * -14%
Average of class Desktop (Idle: 10.4 - 428, n=21, last 2 years W)
161.9 Watt * -8%
AMD Ryzen 7 7700, NVIDIA GeForce RTX 3090 (Idle: 73.4 W)
149.4 (148.6min, 148.6P1 - 150.3max) Watt *
Power Consumption / Prime95 V2810 Stress (external Monitor)
Intel Core i9-13900K, NVIDIA GeForce RTX 3090
471 (414min, 427P1 - 561max) Watt * -189%
Intel Core i5-13600K, NVIDIA GeForce RTX 3090
348 (283min, 288P1 - 496max) Watt * -113%
AMD Ryzen 9 7950X, NVIDIA GeForce RTX 3090 (Idle: 95.2 W)
335 (311min, 312P1 - 364max) Watt * -105%
AMD Ryzen 9 7900X, NVIDIA GeForce RTX 3090
319 (310min, 311P1 - 357max) Watt * -95%
Intel Core i9-12900K, NVIDIA Titan RTX (Idle: 70.5 W)
279.6 (261min - 357max) Watt * -71%
Average NVIDIA GeForce RTX 3090 (Idle: 163.2 - 471, n=14 W)
278 Watt * -70%
Intel Core i5-12600K, NVIDIA Titan RTX (Idle: 70.45 W)
256.5 (238min - 275max) Watt * -57%
AMD Ryzen 9 7950X ECO 105 W, NVIDIA GeForce RTX 3090 (Idle: 93.4 W)
254 (247min, 247P1 - 268max) Watt * -56%
AMD Ryzen 9 5950X, NVIDIA Titan RTX (Idle: 78 W)
252.3 (227min - 259max) Watt * -55%
AMD Ryzen 7 5800X, NVIDIA Titan RTX (Idle: 77.5 W)
242.3 (222min - 254max) Watt * -48%
AMD Ryzen 9 5900X, NVIDIA Titan RTX (Idle: 78.1 W)
235.6 (211min - 284max) Watt * -44%
AMD Ryzen 7 7700X, NVIDIA GeForce RTX 3090 (Idle: 89.8 W)
230 (216min, 217P1 - 265max) Watt * -41%
AMD Ryzen 5 7600X, NVIDIA GeForce RTX 3090
227 (218min, 219P1 - 245max) Watt * -39%
AMD Ryzen 7 5800X3D, NVIDIA GeForce RTX 3090 Ti (Idle: 102 W)
226 (221min, 222P1 - 234max) Watt * -38%
AMD Ryzen 7 7700X ECO 65 W, NVIDIA GeForce RTX 3090
189.8 (184.1min, 184.2P1 - 204max) Watt * -16%
AMD Ryzen 9 7950X ECO 65 W, NVIDIA GeForce RTX 3090 (Idle: 93.1 W)
186.8 (180.7min, 180.9P1 - 201max) Watt * -14%
AMD Ryzen 5 5600X, NVIDIA Titan RTX (Idle: 79.23 W)
175.8 (170min - 179max) Watt * -8%
AMD Ryzen 7 7700, NVIDIA GeForce RTX 3090 (Idle: 73.4 W)
163.2 (156.6min, 156.8P1 - 174.5max) Watt *
Average of class Desktop (Idle: 11.1 - 400, n=21, last 2 years W)
150.8 Watt * +8%
Power Consumption / The Witcher 3 ultra (external Monitor)
AMD Ryzen 7 5800X3D, NVIDIA GeForce RTX 3090 Ti (Idle: 102 W)
561 (533min, 542P1 - 582max) Watt * -8%
AMD Ryzen 9 7900X, NVIDIA GeForce RTX 3090
555 (547min, 549P1 - 607max) Watt * -7%
AMD Ryzen 9 7950X, NVIDIA GeForce RTX 3090 (Idle: 95.2 W)
539 (534min, 535P1 - 547max) Watt * -4%
AMD Ryzen 9 7950X ECO 105 W, NVIDIA GeForce RTX 3090 (Idle: 93.4 W)
539 (252min, 535P1 - 573max) Watt * -4%
AMD Ryzen 9 7950X ECO 65 W, NVIDIA GeForce RTX 3090 (Idle: 93.1 W)
539 (534min, 534P1 - 547max) Watt * -4%
Intel Core i9-13900K, NVIDIA GeForce RTX 3090
533 (520min, 525P1 - 568max) Watt * -3%
AMD Ryzen 7 7700X ECO 65 W, NVIDIA GeForce RTX 3090
524 (515min, 517P1 - 533max) Watt * -1%
Average NVIDIA GeForce RTX 3090 (Idle: 464 - 597, n=17 W)
524 Watt * -1%
AMD Ryzen 5 7600X, NVIDIA GeForce RTX 3090
519 (510min, 513P1 - 564max) Watt * -0%
AMD Ryzen 7 7700, NVIDIA GeForce RTX 3090 (Idle: 73.4 W)
519 (511min, 512P1 - 532max) Watt *
AMD Ryzen 7 7700X, NVIDIA GeForce RTX 3090 (Idle: 89.8 W)
516 (512min, 512P1 - 529max) Watt * +1%
Intel Core i5-13600K, NVIDIA GeForce RTX 3090
500 (491min, 493P1 - 528max) Watt * +4%
Intel Core i9-12900K, NVIDIA Titan RTX (Idle: 70.5 W)
463 (439min - 490max) Watt * +11%
AMD Ryzen 9 5950X, NVIDIA Titan RTX (Idle: 78 W)
440.5 (420min - 466max) Watt * +15%
AMD Ryzen 9 5900X, NVIDIA Titan RTX (Idle: 78.1 W)
439.6 (419min - 497max) Watt * +15%
AMD Ryzen 7 5800X, NVIDIA Titan RTX (Idle: 77.5 W)
418.7 (403min - 452max) Watt * +19%
AMD Ryzen 5 5600X, NVIDIA Titan RTX (Idle: 79.23 W)
409.2 (381min - 434max) Watt * +21%
Intel Core i5-12600K, NVIDIA Titan RTX (Idle: 70.45 W)
408.9 (401min - 460max) Watt * +21%
Average of class Desktop (Idle: 19.1 - 569, n=37, last 2 years W)
354 Watt * +32%

* ... smaller is better

Pros

+ Competes well with the Core i9-12900K in single-core performance
+ Significantly more power-efficient than a TDP-limited Ryzen 7 7700X
+ Manual and PBO overclocking support
+ Integrated RDNA 2 iGPU in I/O die
+ Included Wraith Prism cooler

Cons

- DDR5 prices still on the higher side
- Loses to Core i5-13600K in terms of backwards compatibility and DDR4 support
- Pricing can be lower

Verdict: Zen 4 for the masses but with caveats

AMD Ryzen 7 7700. Review unit courtesy of AMD India.

We wouldn't blame you if you weren't aware of new 65 W Ryzen 7000 processors hitting the shelves today given that most of the limelight was hogged by the Ryzen 7000X3D and Dragon Range-HX mobile processors during AMD's CES 2023 keynote. The new 65 W Zen 4 range may seem superfluous at first glance — they offer the same levels of performance as their non-X counterparts with insignificant trade-offs. However, these new Raphael processors do fill an important gap in the lineup.

The 65 W Ryzen 7000 processors significantly lower the entry bar for Zen 4. The Ryzen 7 7700 in question retails for US$329, which is US$70 less than the MSRP of the Ryzen 7 7700X. In our testing, the AMD Ryzen 7 7700 offers excellent single-core performance that is comparable to the rest of the Zen 4 lineup, even outperforming the 241 W Core i9-12900K in many benchmarks. 

In fact, all Zen 4 chips right from the entry-level Ryzen 5 7600X to the flagship Ryzen 9 7950X seem to vie with each other for single-core gains. That being said, Intel Raptor Lake does have the upper hand in multi-core and the Core i9-13900K can still give the Ryzen 9 7950X a tough time.

The Ryzen 7 7700's main competitor is the Core i5-13600K. While the Ryzen 7 7700 can edge out the Core i5-13600K in single-core performance and gaming, the latter inherently augurs well for multi-core, single-core, and gaming put together. Also, the Core i5-13600K is about US$10 cheaper than the Ryzen 7 7700 right now, so it makes for a good option if you already have a compatible Intel platform.

With a significantly lowered entry bar coupled with affordable B650E chipset motherboards and potential for overclocking, Zen 4 65 W, particularly the AMD Ryzen 7 7700, is a great choice for frugal performance enthusiasts looking to test AM5 waters."

The Ryzen 7 7700 performs exactly the same as a TDP-limited 65 W Ryzen 7 7700X. The corollary is that you can leverage Precision Boost Overdrive and support for EXPO memory profiles to narrow the performance gap with a Ryzen 7 7700X while still saving US$70. Not everything is rosy, however.

AMD's AM5 platform is still quite new and prices of DDR5 memory are still on the higher side, offsetting any savings benefit with the new 65 W Ryzens. One of the pangs of innovating on a new platform is ceding potential ground to your competitor.

At the moment, Intel has the upper hand when it comes to backwards compatibility — you can drop a Raptor Lake CPU in a last gen motherboard with DDR4 memory and still get comparable levels of performance for much less money.

That being said, AMD can be expected to support AM5 until 2025 at least. So, any investment you make now can be expected to last quite a while.

We've seen excellent power-efficiency with TDP-limited Ryzen 7 7700X and the Ryzen 9 7950X, and the new Ryzen 7 7700 continues the trend with even better figures. We will have a better perspective once we get to test Intel's new 65 W Rocket Lake parts that were announced at CES 2023, but for now 65 W Ryzen seems to be doing a great job.

The AMD Ryzen 7 7700, with the inclusion of a Wraith Prism cooler in the box, no doubt increases Zen 4's value proposition, but we recommend keeping a tab on motherboard and DDR5 RAM prices before splurging the moolah.

Price and Availability

The AMD Ryzen 7 7700 and the rest of the Ryzen 65 W lineup are slated to be available from today but are yet to be stocked online. We will update this section with purchase links as soon as stocks go live.

Pricecompare

Read all 7 comments / answer
static version load dynamic
Loading Comments
Comment on this article
Please share our article, every link counts!
> Expert Reviews and News on Laptops, Smartphones and Tech Innovations > Reviews > AMD Ryzen 7 7700 65 W Ryzen 7000 Review: Able Core i9-12900K and Core i5-13600K challenger that is US$70 less than Ryzen 7 7700X
Vaidyanathan Subramaniam, 2023-01- 9 (Update: 2023-01- 9)