Intel Alder Lake-S review: Does Intel have the fastest gaming CPU again?
Intel has a lot of plans with Alder Lake-S. For years, Intel was the benchmark standard for the fastest gaming CPU, until AMD accelerated things with its Ryzen 5000 and took the crown. For the end user, this cat-and-mouse game has many advantages, since it helps to get improvements quicker to the masses.
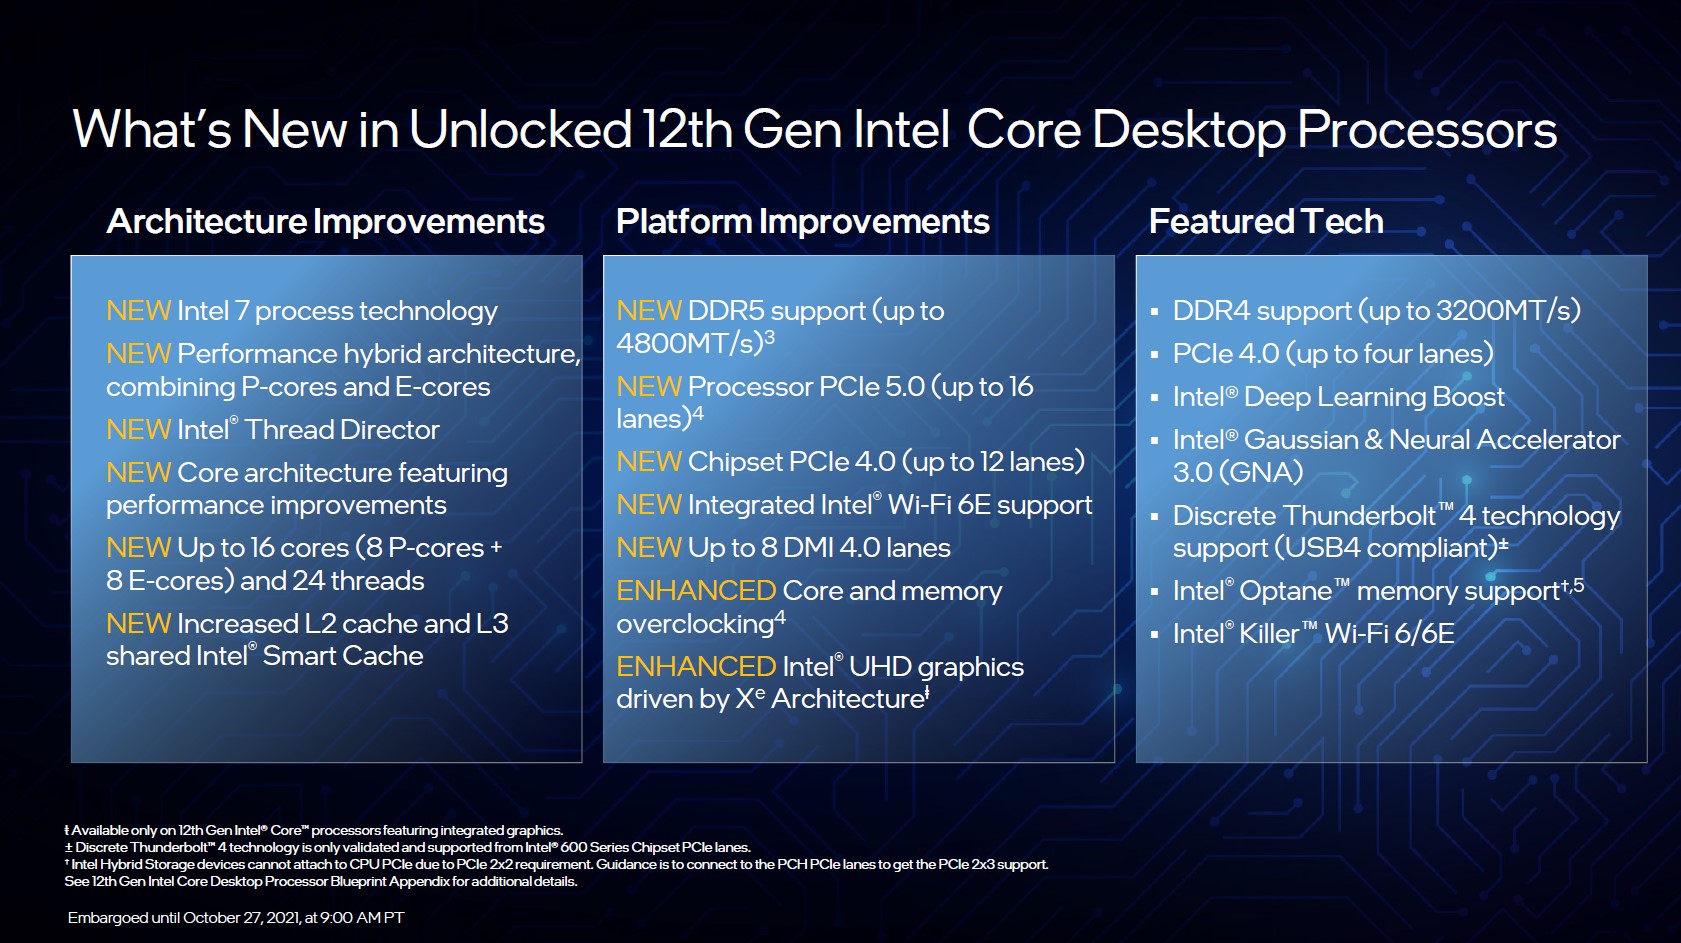
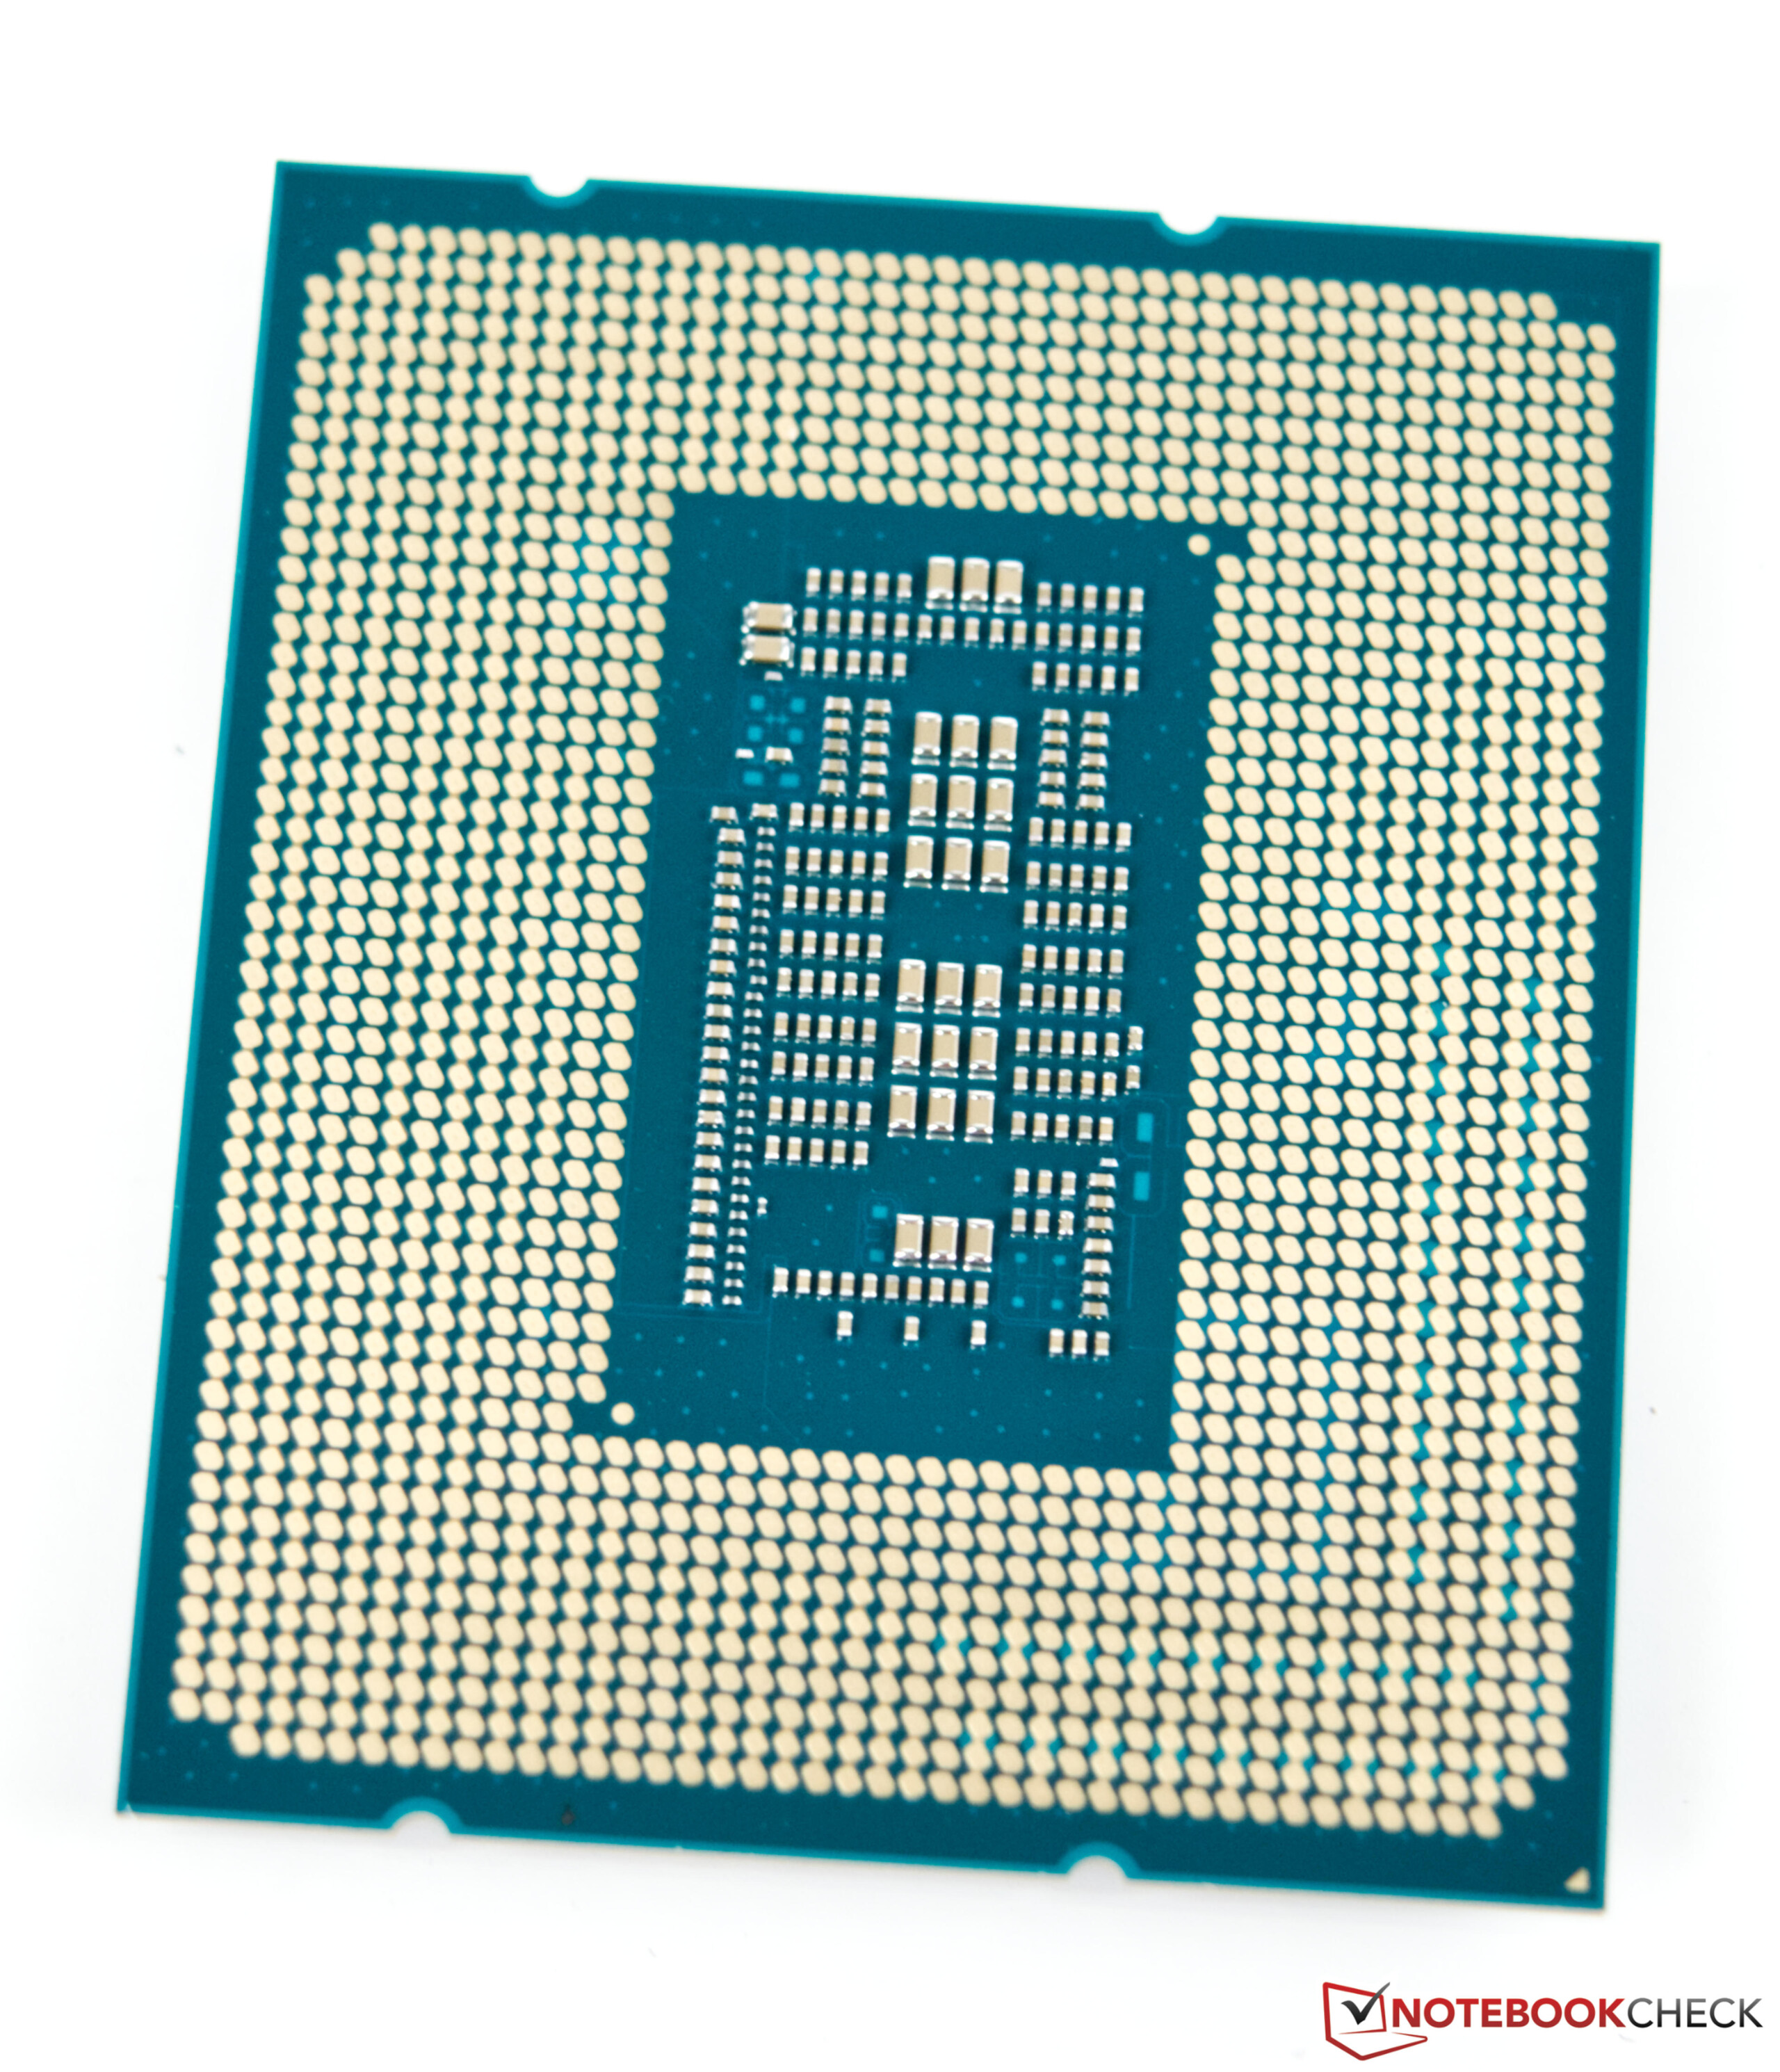
With the newest processors for the desktop segment and the 12th generation of the Core series, Intel again introduces a change of the platform. After Comet Lake-S and Rocket Lack-S, LGA1200 is already history, and the larger LGA 1700 socket takes over. The most well-known improvements are the DDR5 and PCIe 5.0 support. However, at this point there still no products available that can use this full bandwidth. This makes the investment into the platform an investment that can only be used in the future. Things look a little better in the working memory. Those want to join the newest trend and get the best performance won't get around the new DDR5 working memory. But the Intel Alder Lake-S processors also support DDR4 RAM. You can find the corresponding boards for sale also with the new high-end Z690 chipset.
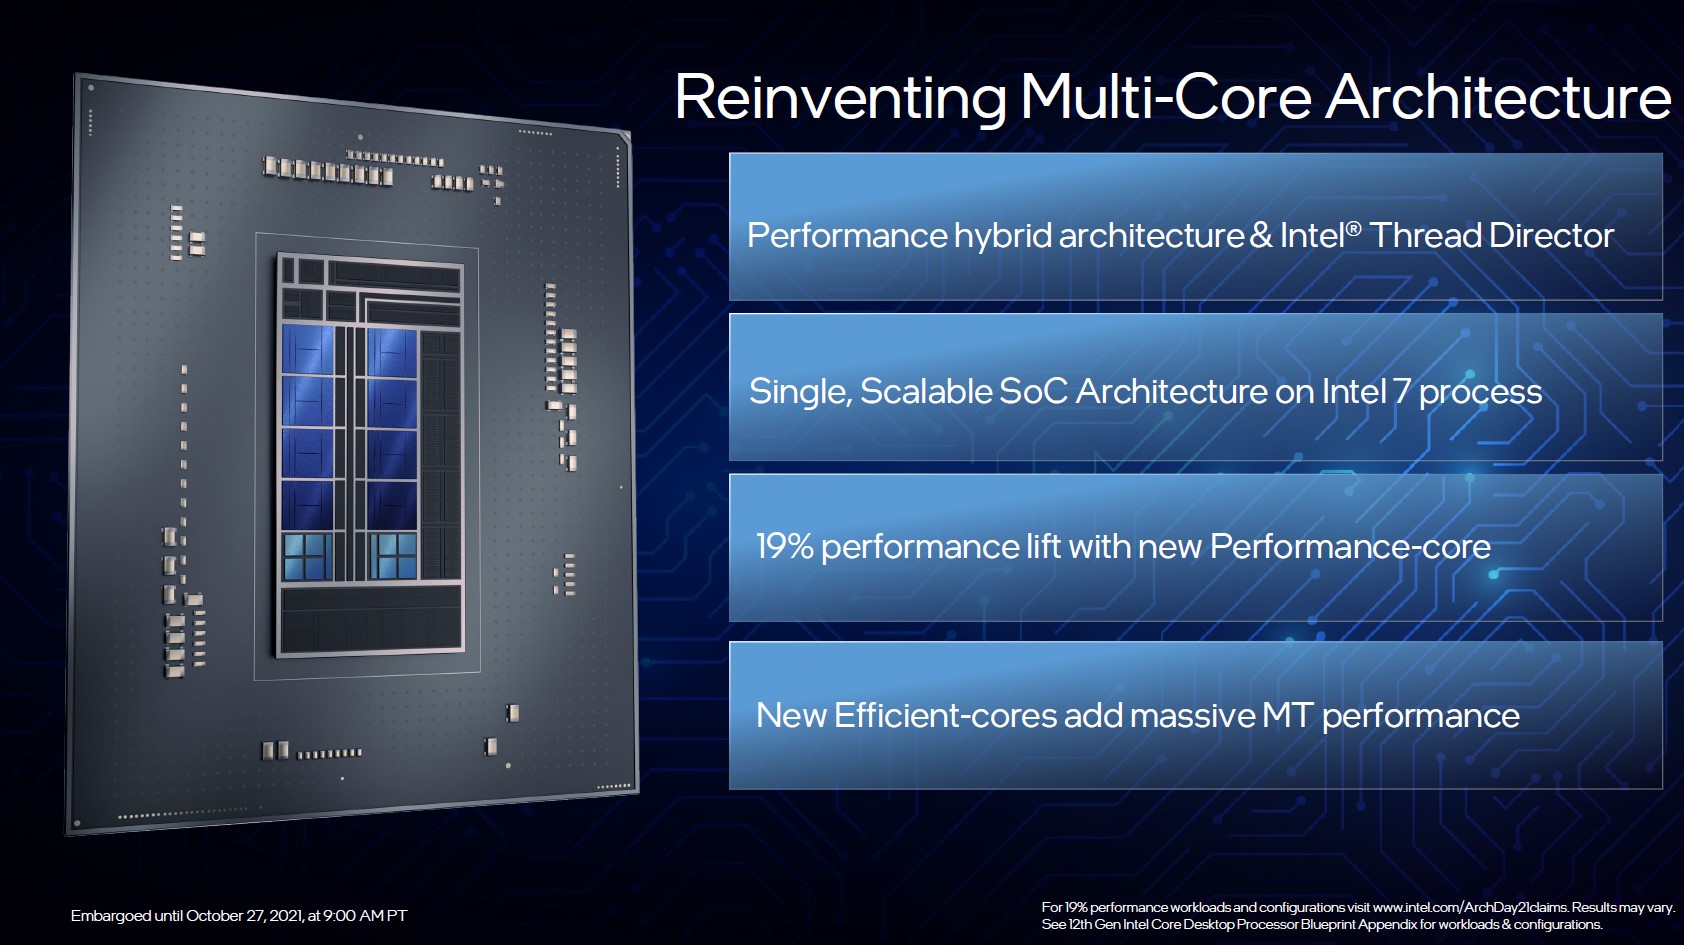
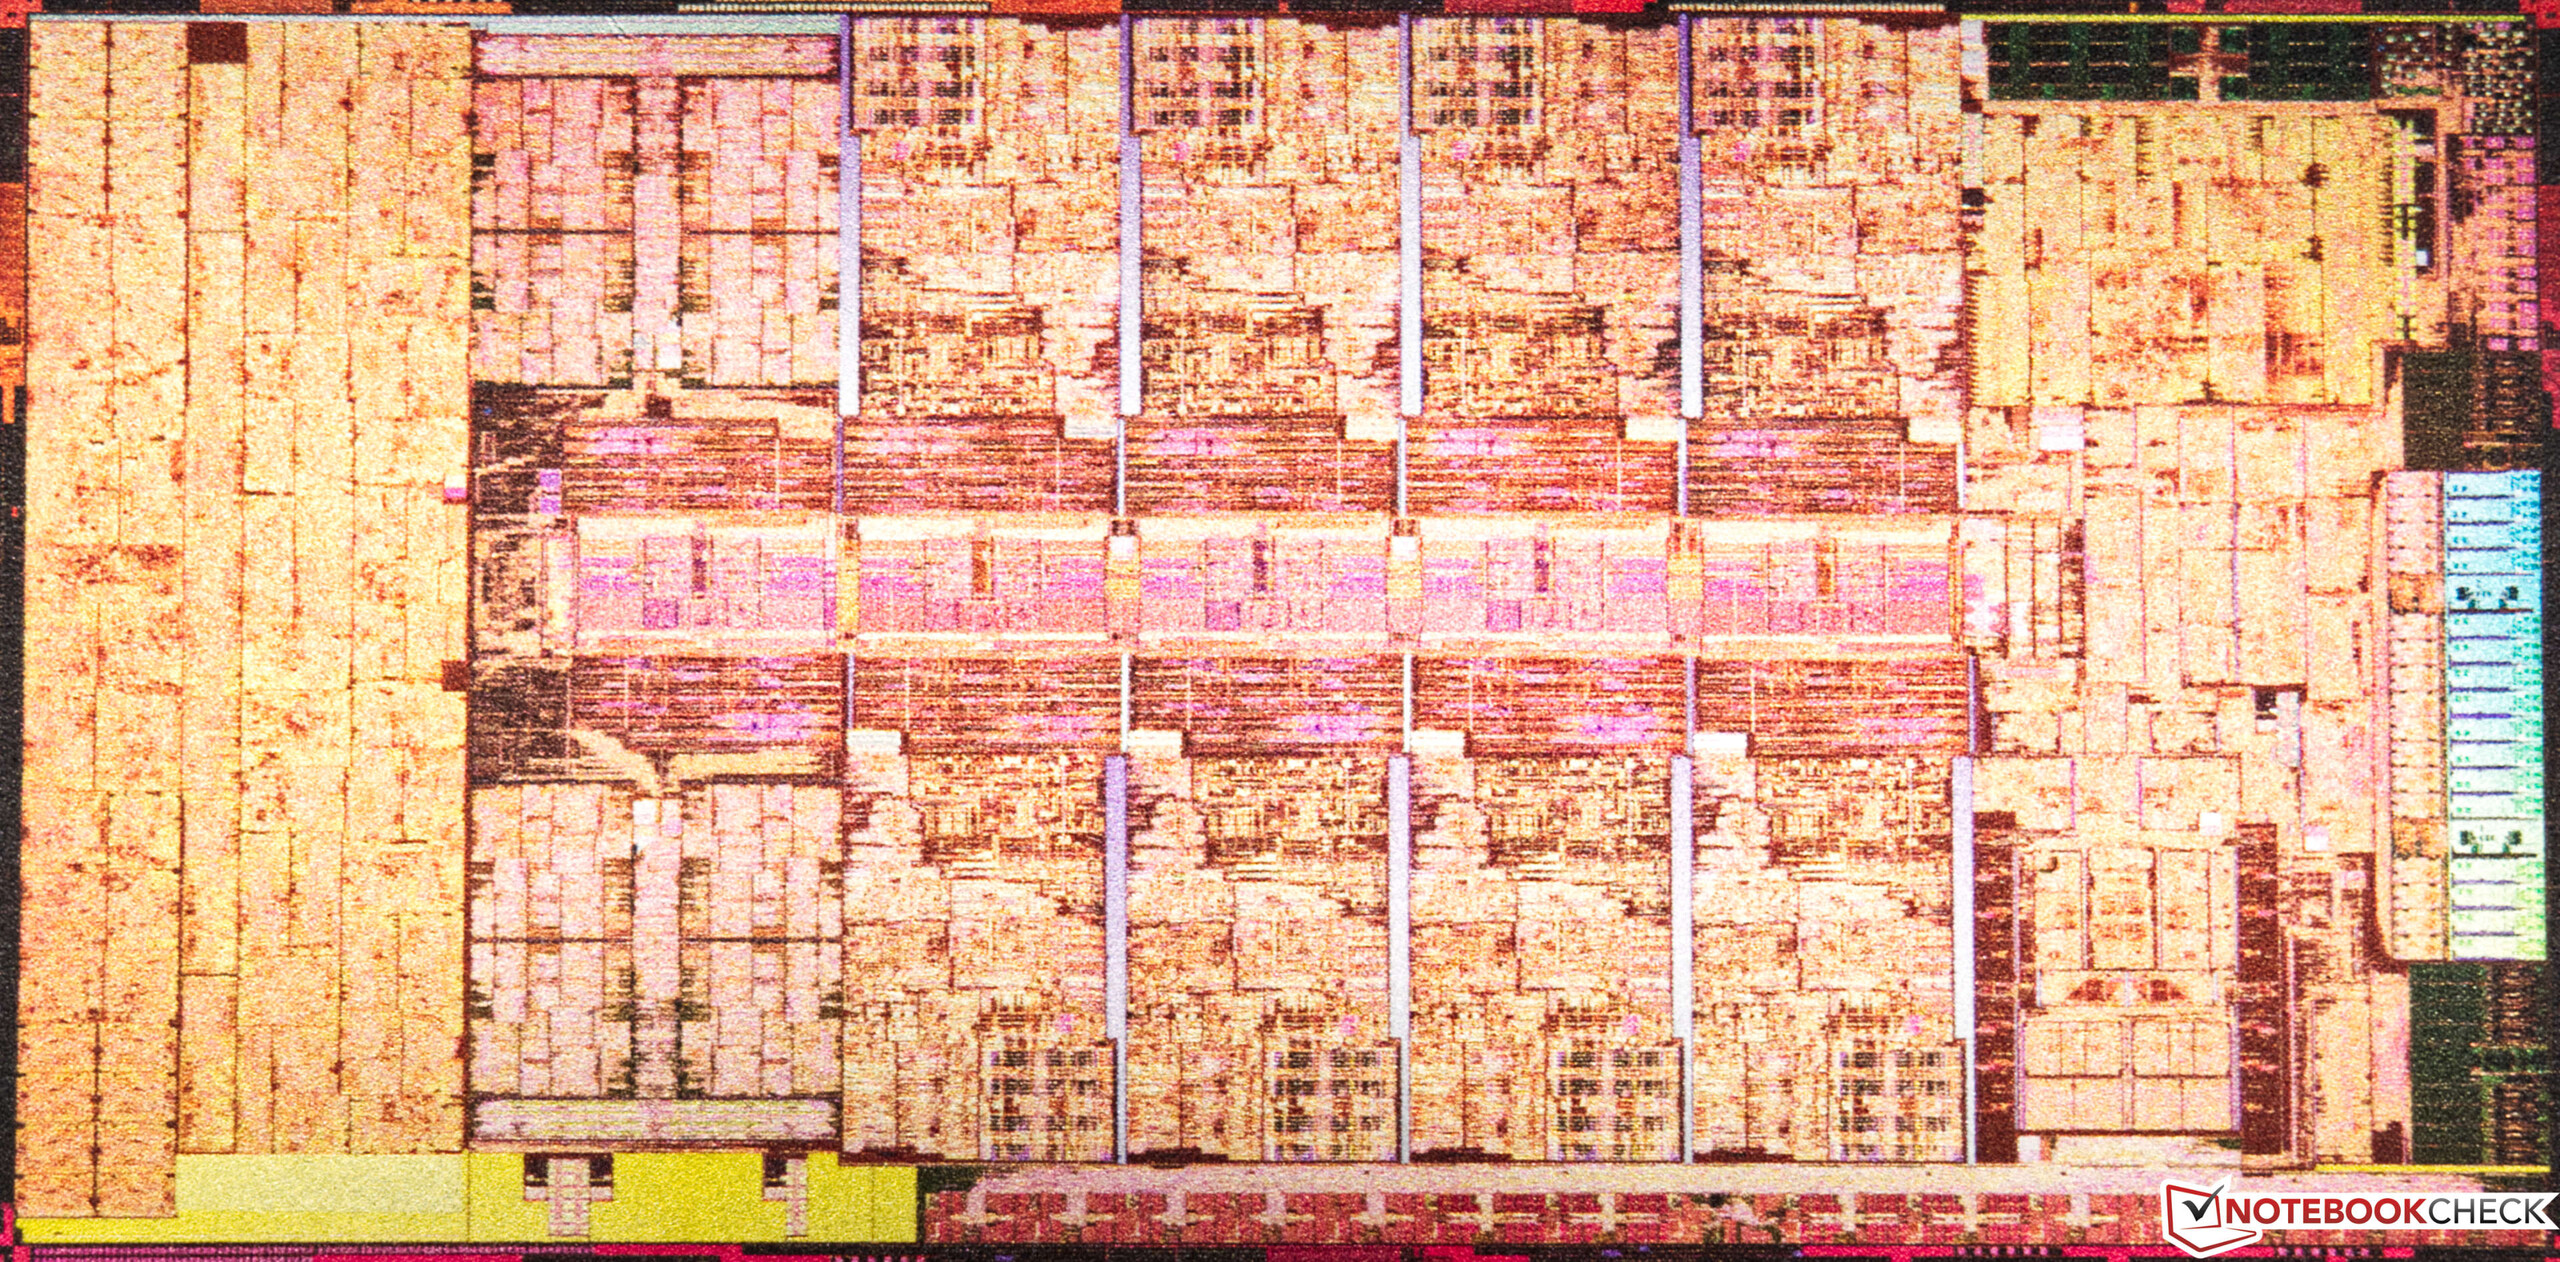
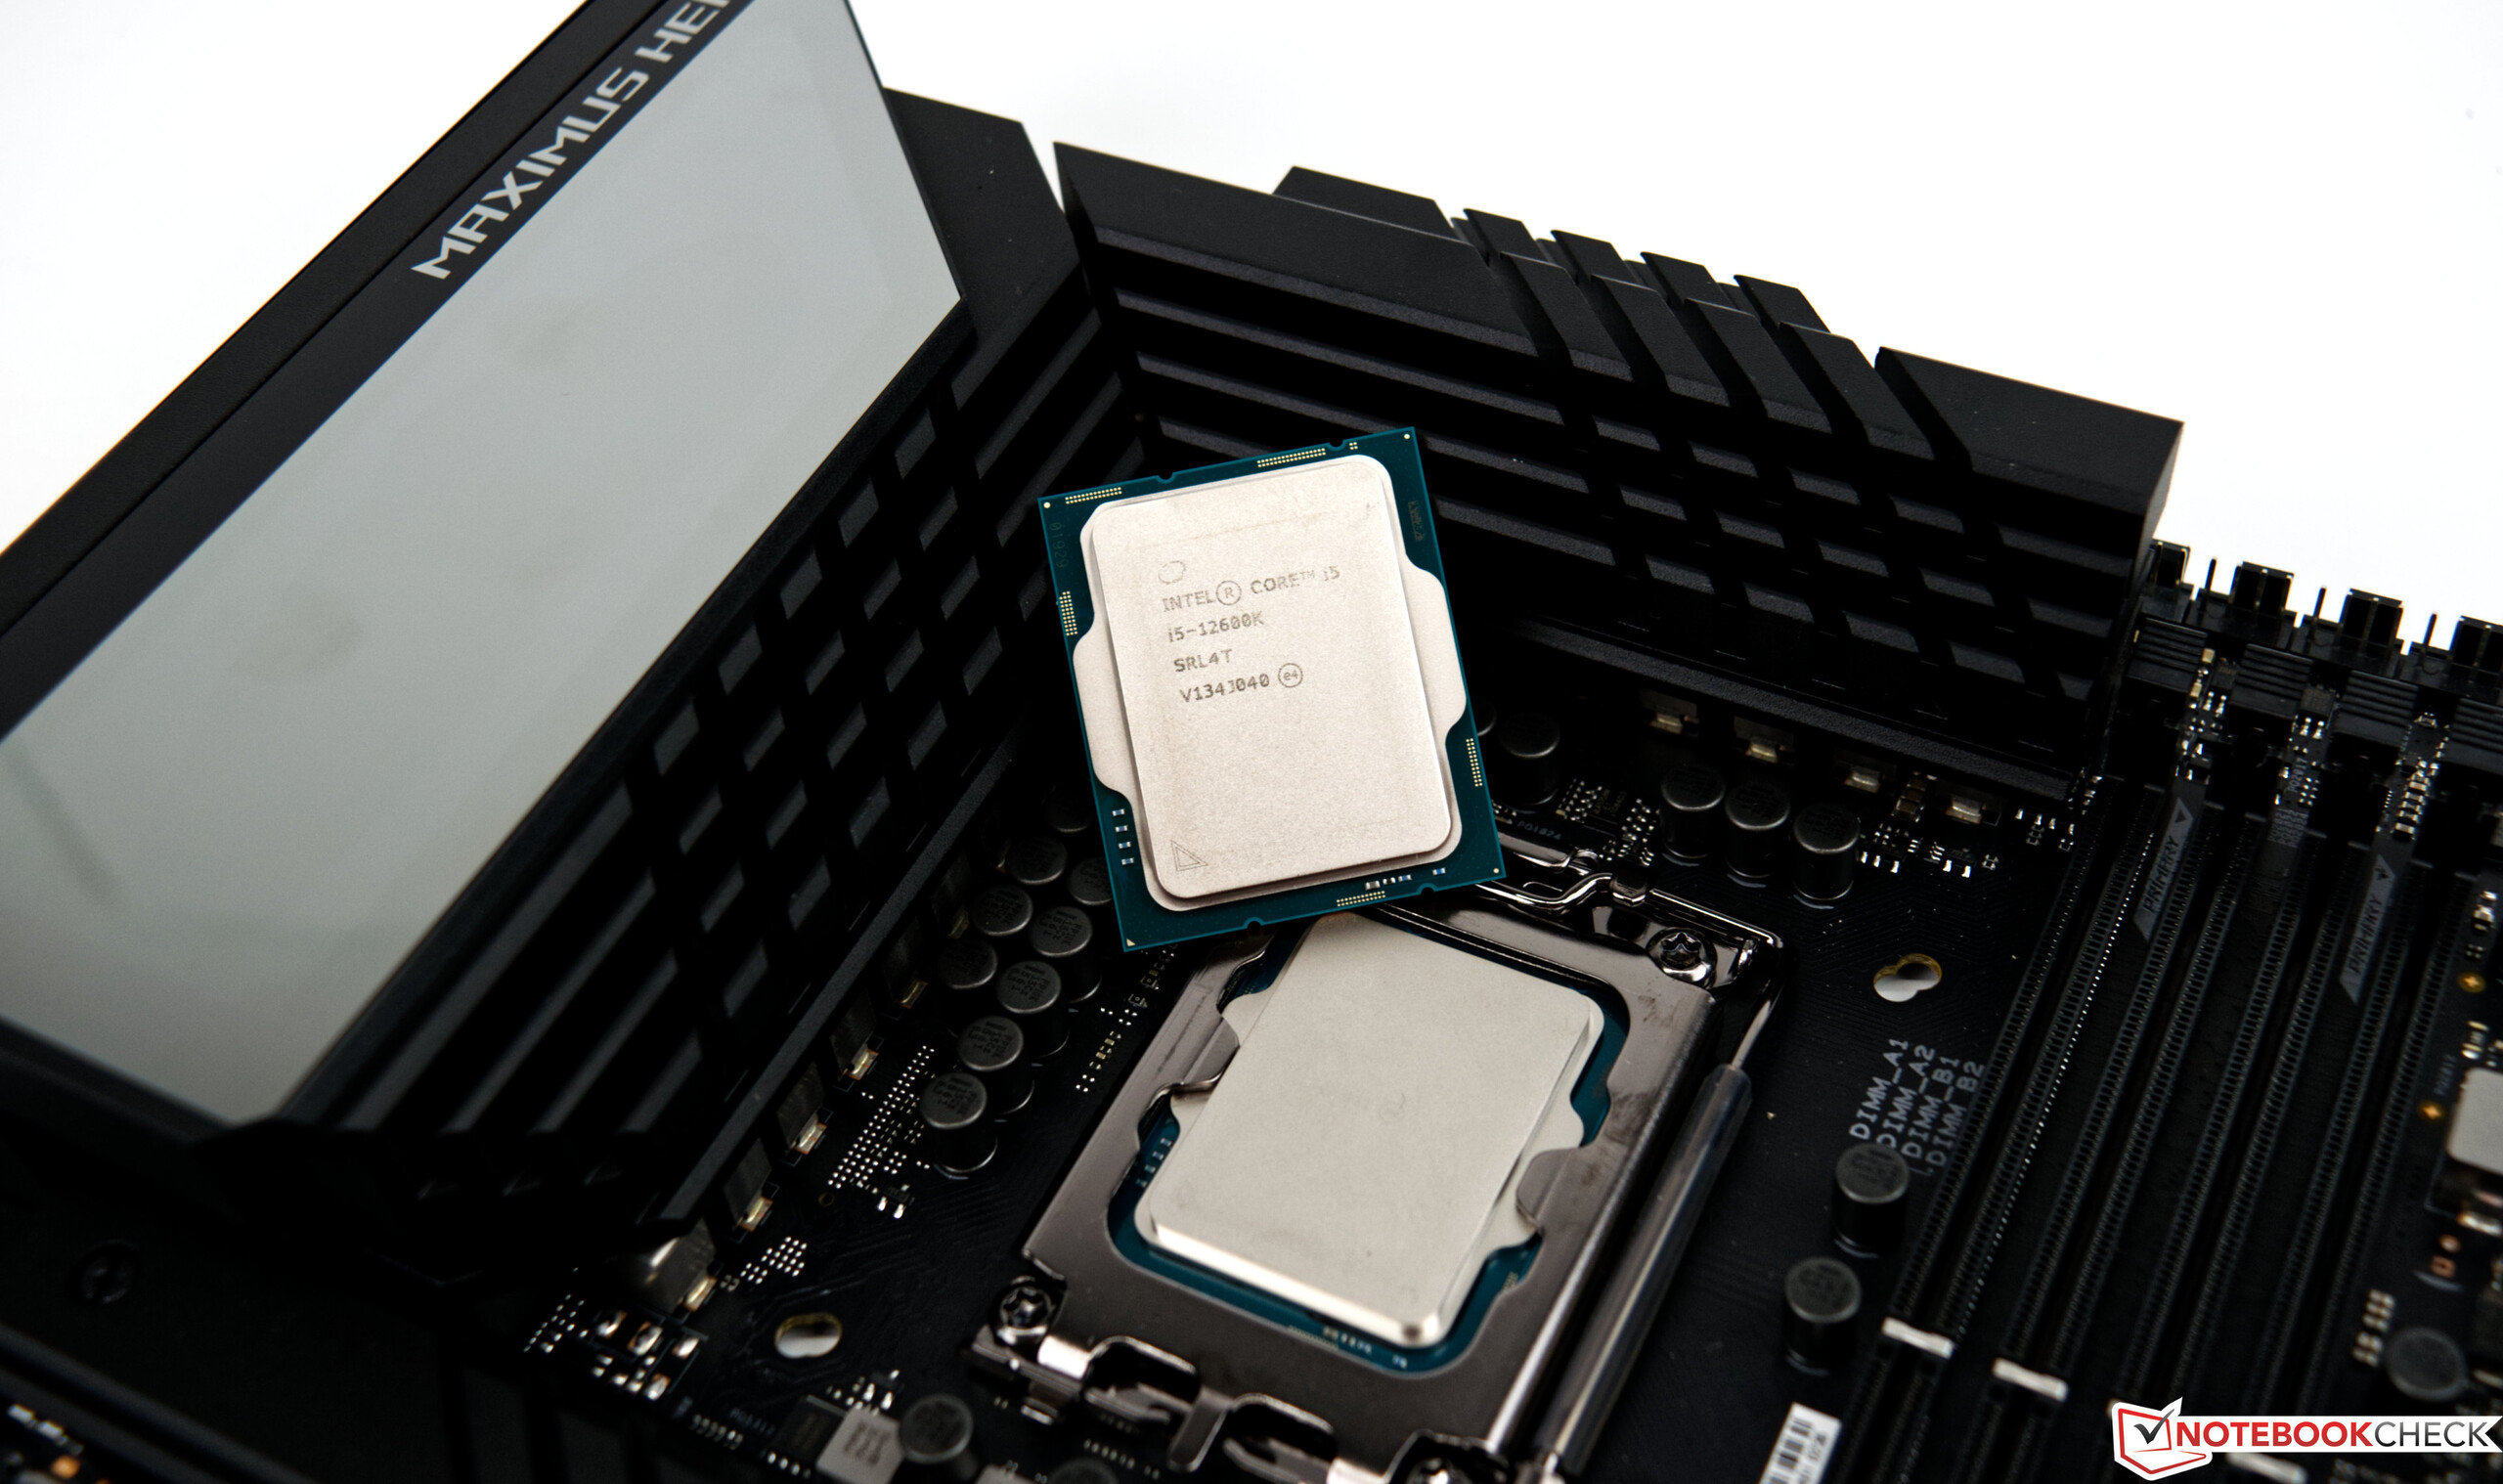
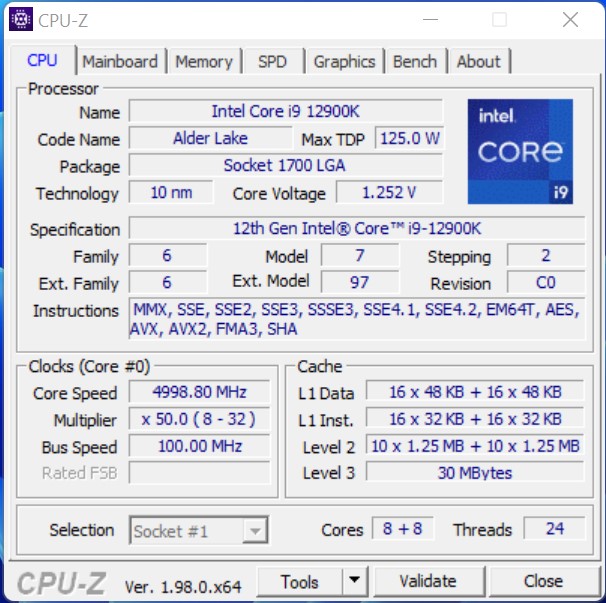
With Alder Lake-S, Intel takes a large step ahead that is not just a small Rocket Lake-S refresh. The new design is divided into performance cores, the so-called P- cores, and energy efficient cores, the E-cores. This allows the top model to handle 24 threads, resulting from 8 P-cores including hyperthreading (HT) and 8 E-cores without HT. In the smaller Intel Core i5-12600K, which we are also examining in this review, it is 6 P-cores and 4 E-cores, resulting in 16 threads. The new E-cores are supposed to take some load off the P-cores, freeing them to offer sufficient computing performance for demanding applications while the E-cores handle the background processes. But the E-cores are by no means slow computing units, and their performance is at the Skylake level. The optimal management of the cores is handled by the Intel Thread Director. Windows 11 as the operating system is a requirement for optimal usage.
We collected the most important representatives of the new Alder Lake-S family for you in the list below.
The Core processors of the Alder Lake-S series at a glance
| Model | Cores / Threads |
Clock Speed P-Core / Turbo | Turbo 3.0 | Clock Speed E-Core / Turbo | Cache L2 + L3 | Graphics | PBP | MTB | Price (SRP) |
| Core i9-12900K | 16 (8P + 8E) /24 | 3.2 GHz / 5.1 GHz | 5.2 GHz | 2.4 GHz / 3.9 GHz | 14 + 30 MB | UHD 770 | 125 Watt | 241 Watt | $ 589 |
| Core i9-12900KF | 16 (8P + 8E) /24 | 3.2 GHz / 5.1 GHz | 5.2 GHz | 2.4 GHz / 3.9 GHz | 14 + 30 MB | - | 125 Watt | 241 Watt | $ 564 |
| Core i7-12700K | 12 (8P + 4E) /20 | 3.6 GHz / 4.9 GHz | 5.0 GHz | 2.7 GHz / 3.8 GHz | 12 + 25 MB | UHD 770 | 125 Watt | 190 Watt | $ 409 |
| Core i7-12700KF | 12 (8P + 4E) /20 | 3.6 GHz / 4.9 GHz | 5.0 GHz | 2.7 GHz / 3.8 GHz | 12 + 25 MB | - | 125 Watt | 190 Watt | $ 384 |
| Core i5-12600K | 10 (6P + 4E) /16 | 3.7 GHz / 4.9 GHz | - | 2.8 GHz / 3.6 GHz | 9.5 + 20 MB | UHD 770 | 125 Watt | 150 Watt | $ 289 |
| Core i5-12600KF | 10 (6P + 4E) /16 | 3,7 GHz / 4,9 GHz | - | 2,8 GHz / 3,6 GHz | 9,5 + 20 MB | - | 125 Watt | 150 Watt | $ 264 |
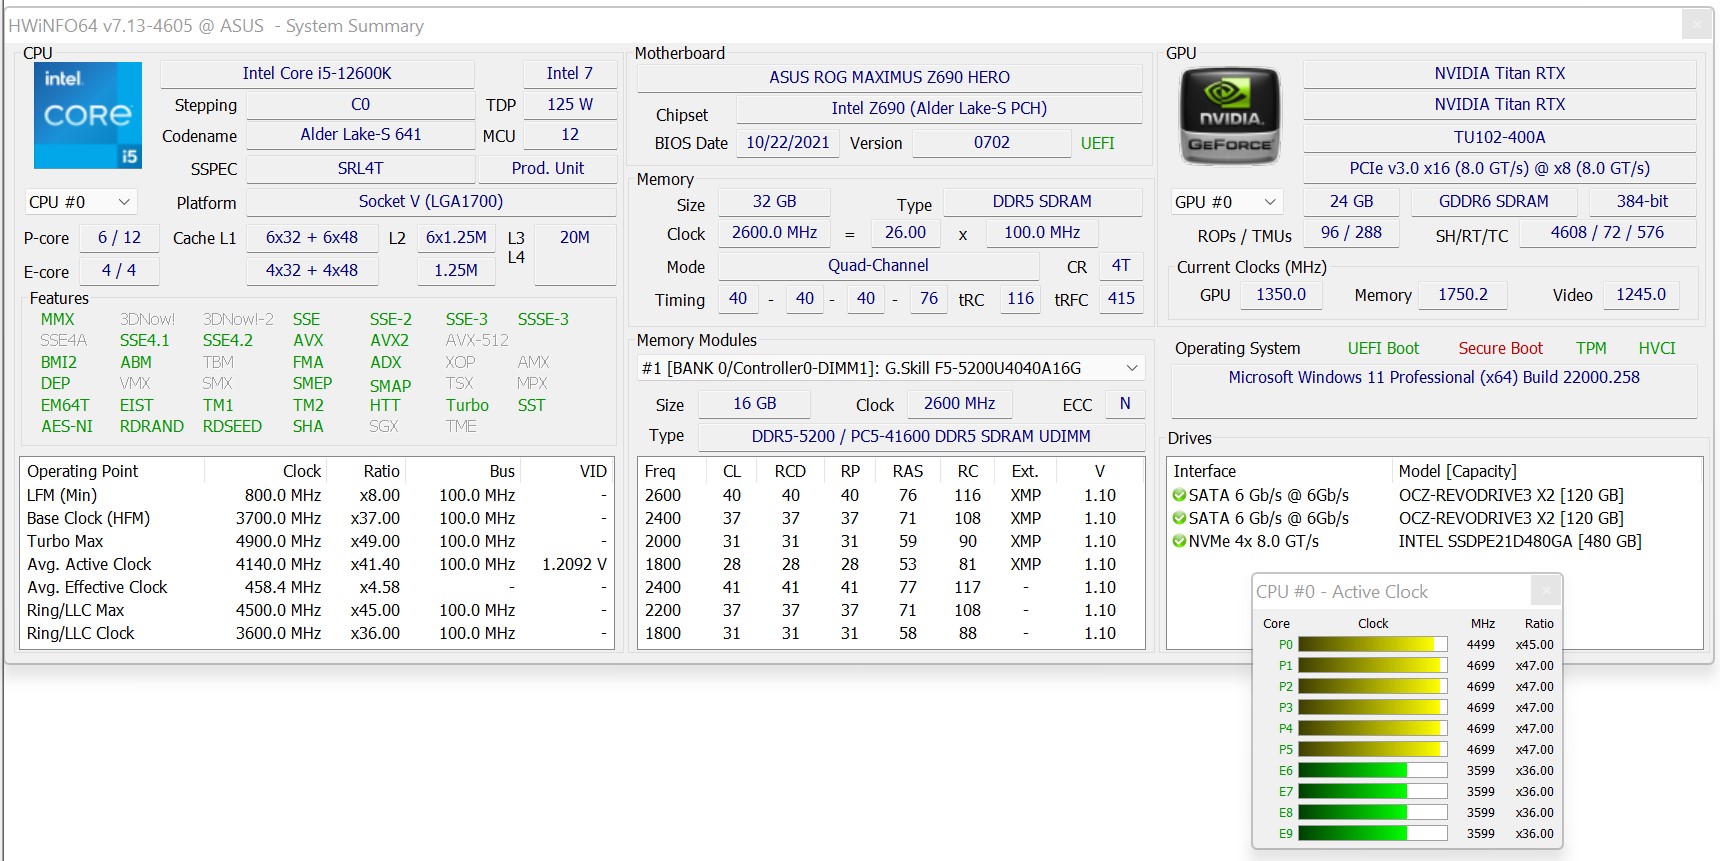
Details of our Test System
We use the following system for our benchmarks and tests below:
- Raijintek Pean Benchtable
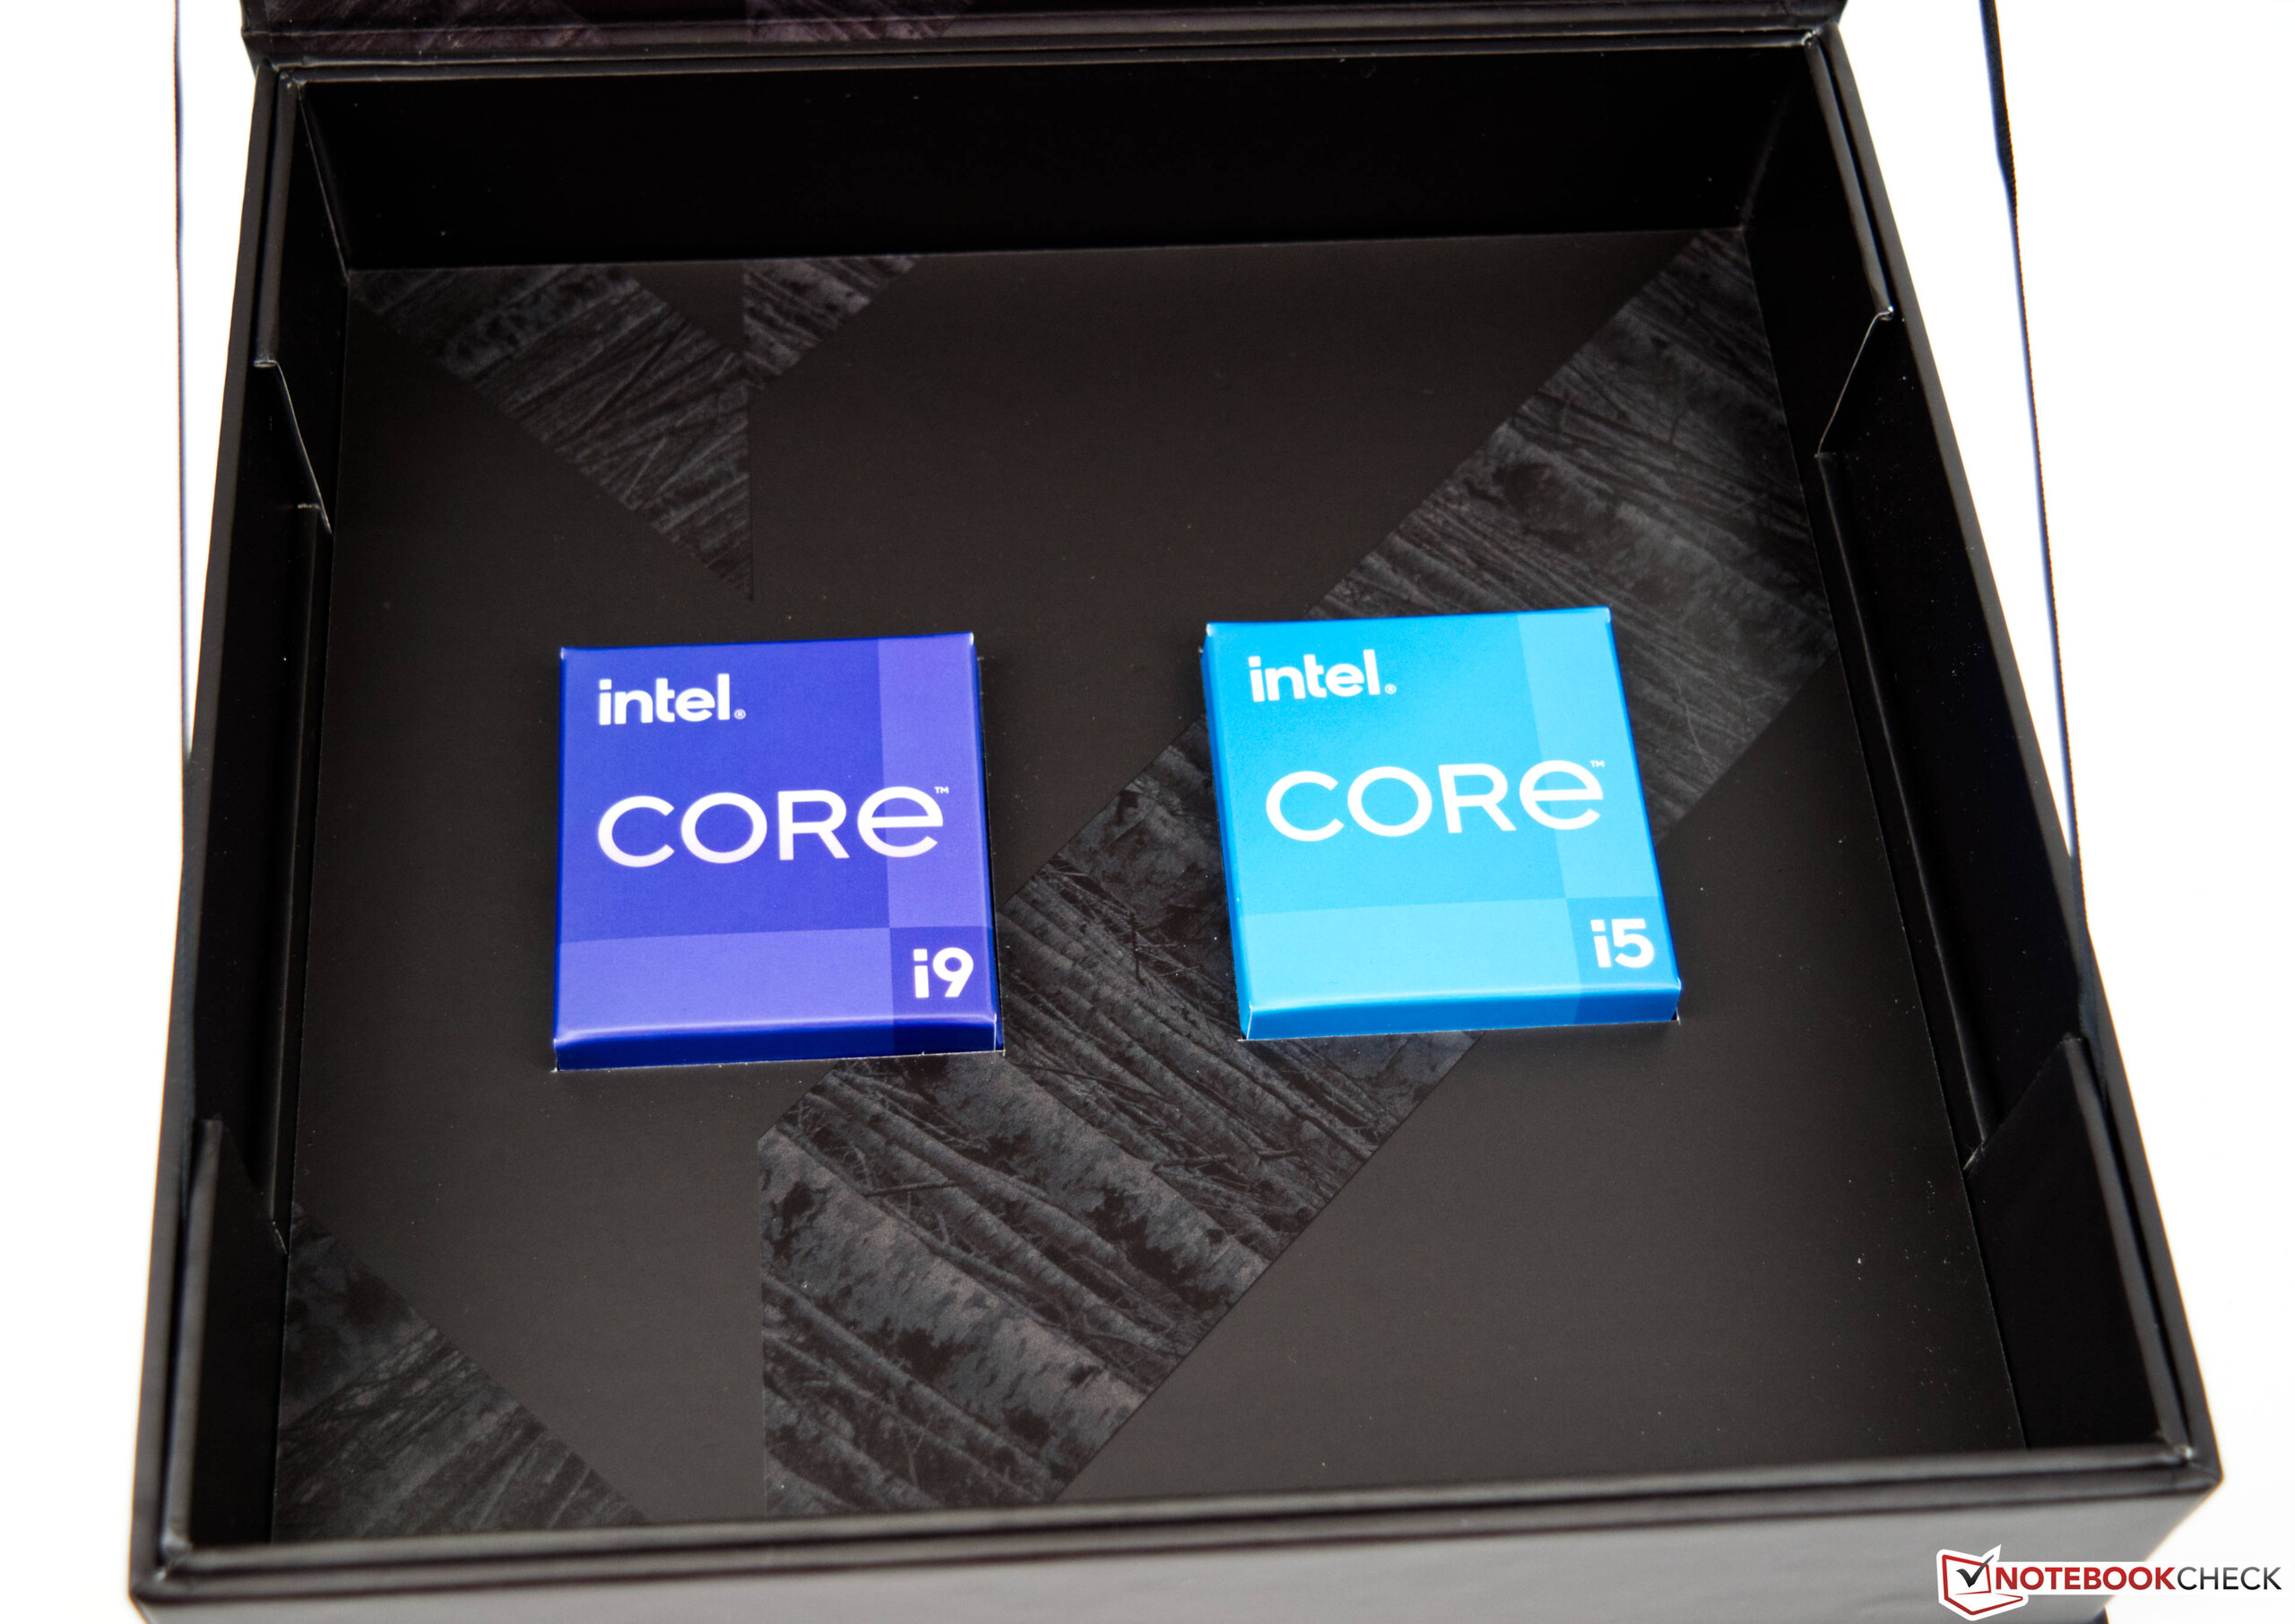
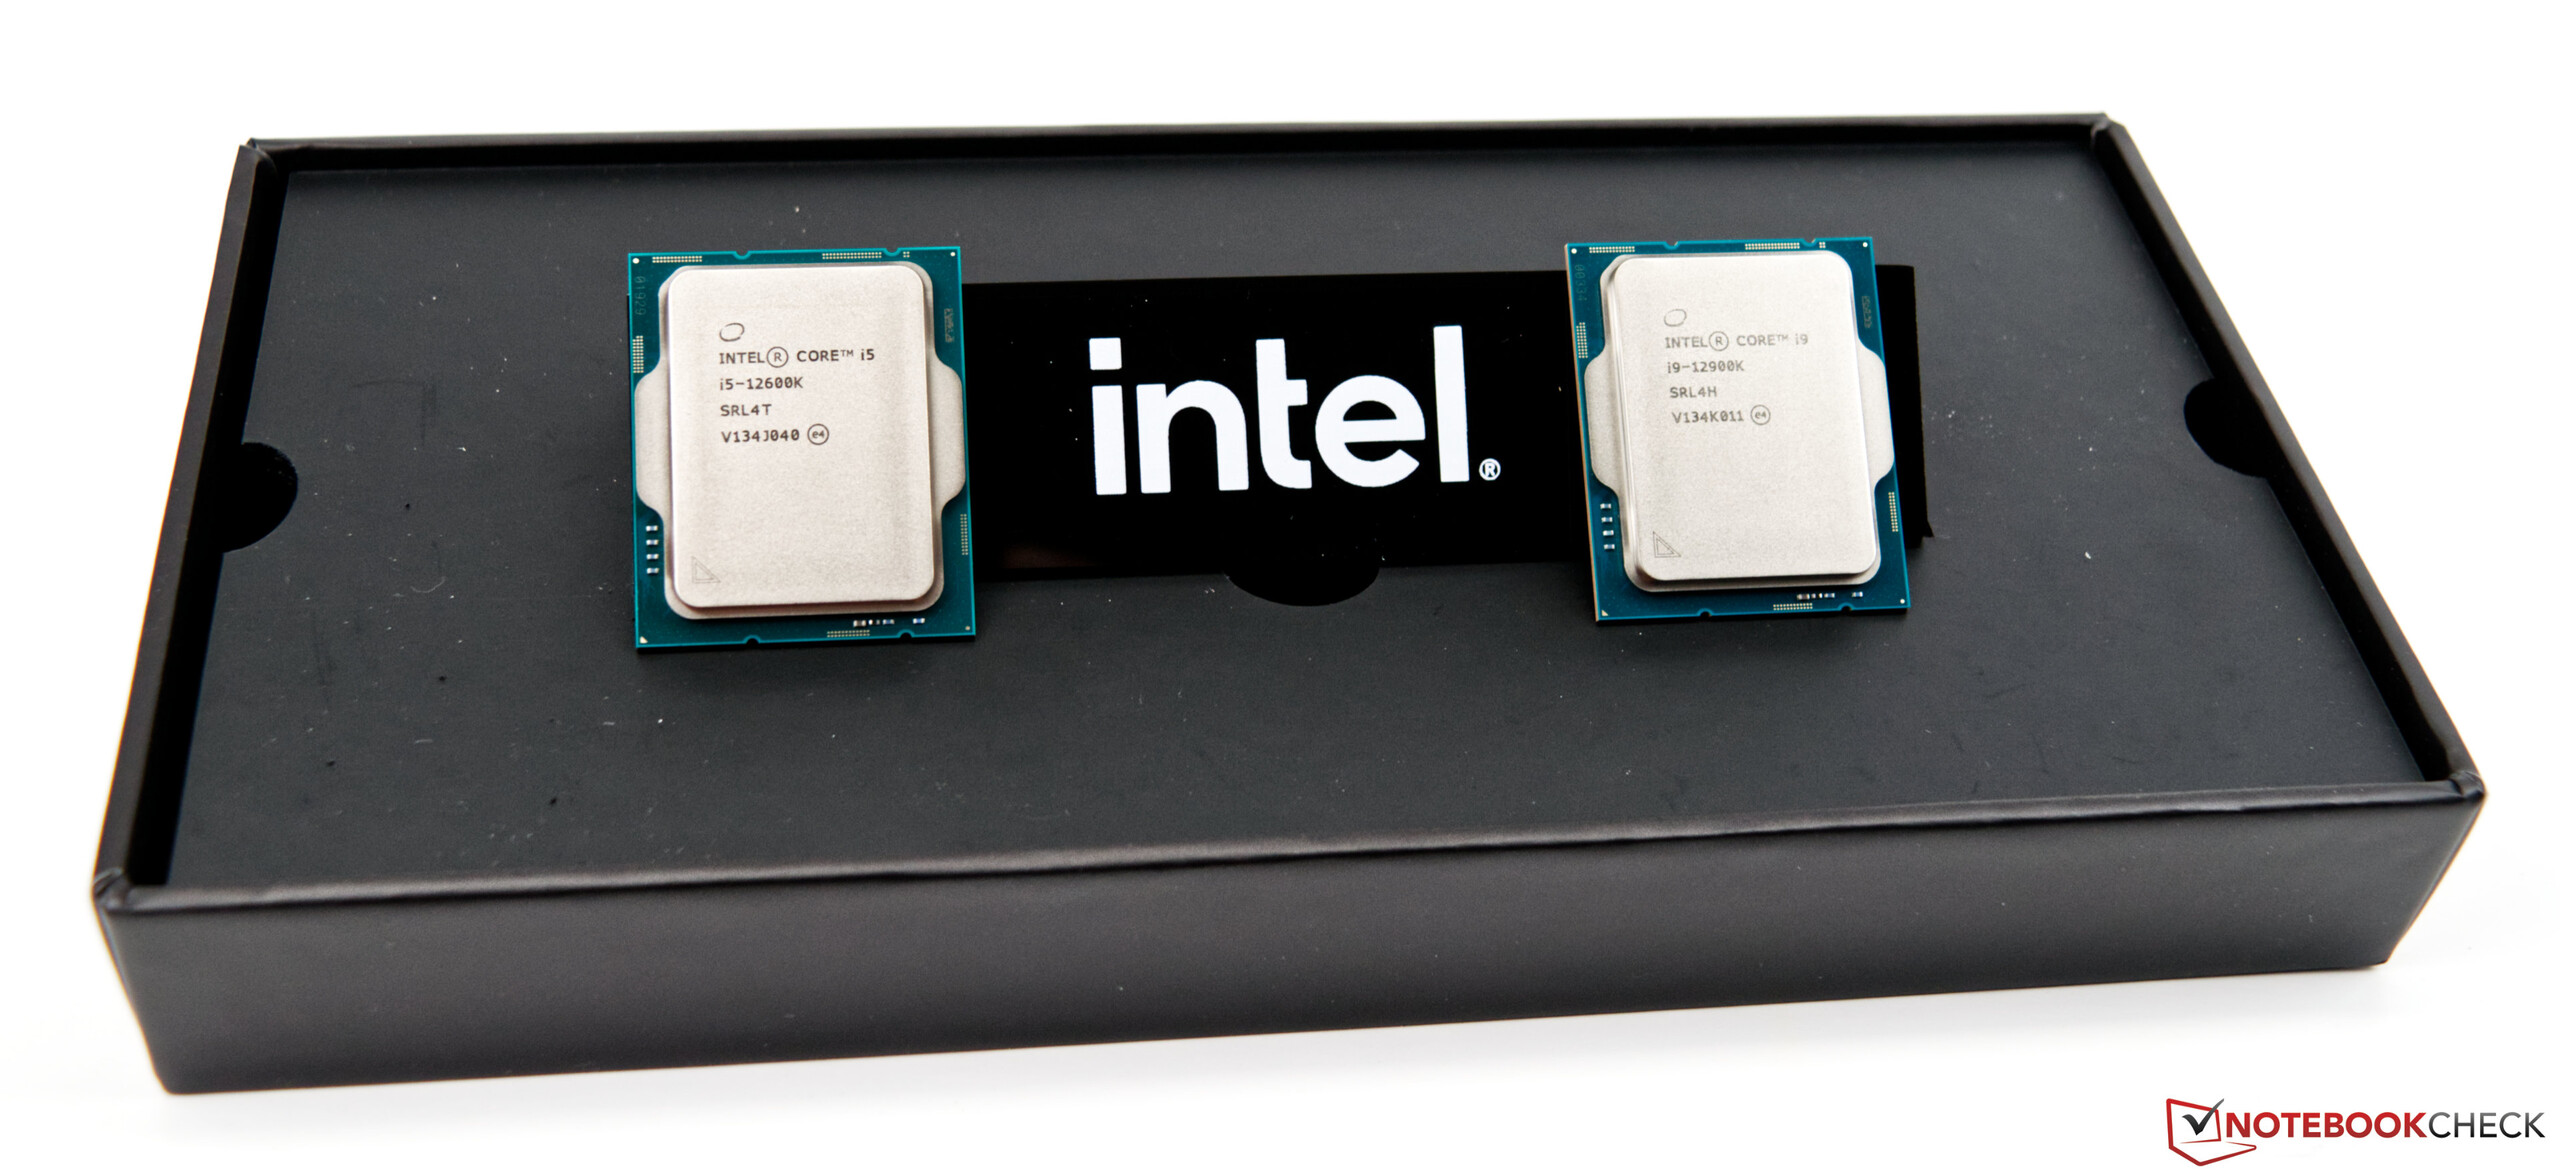
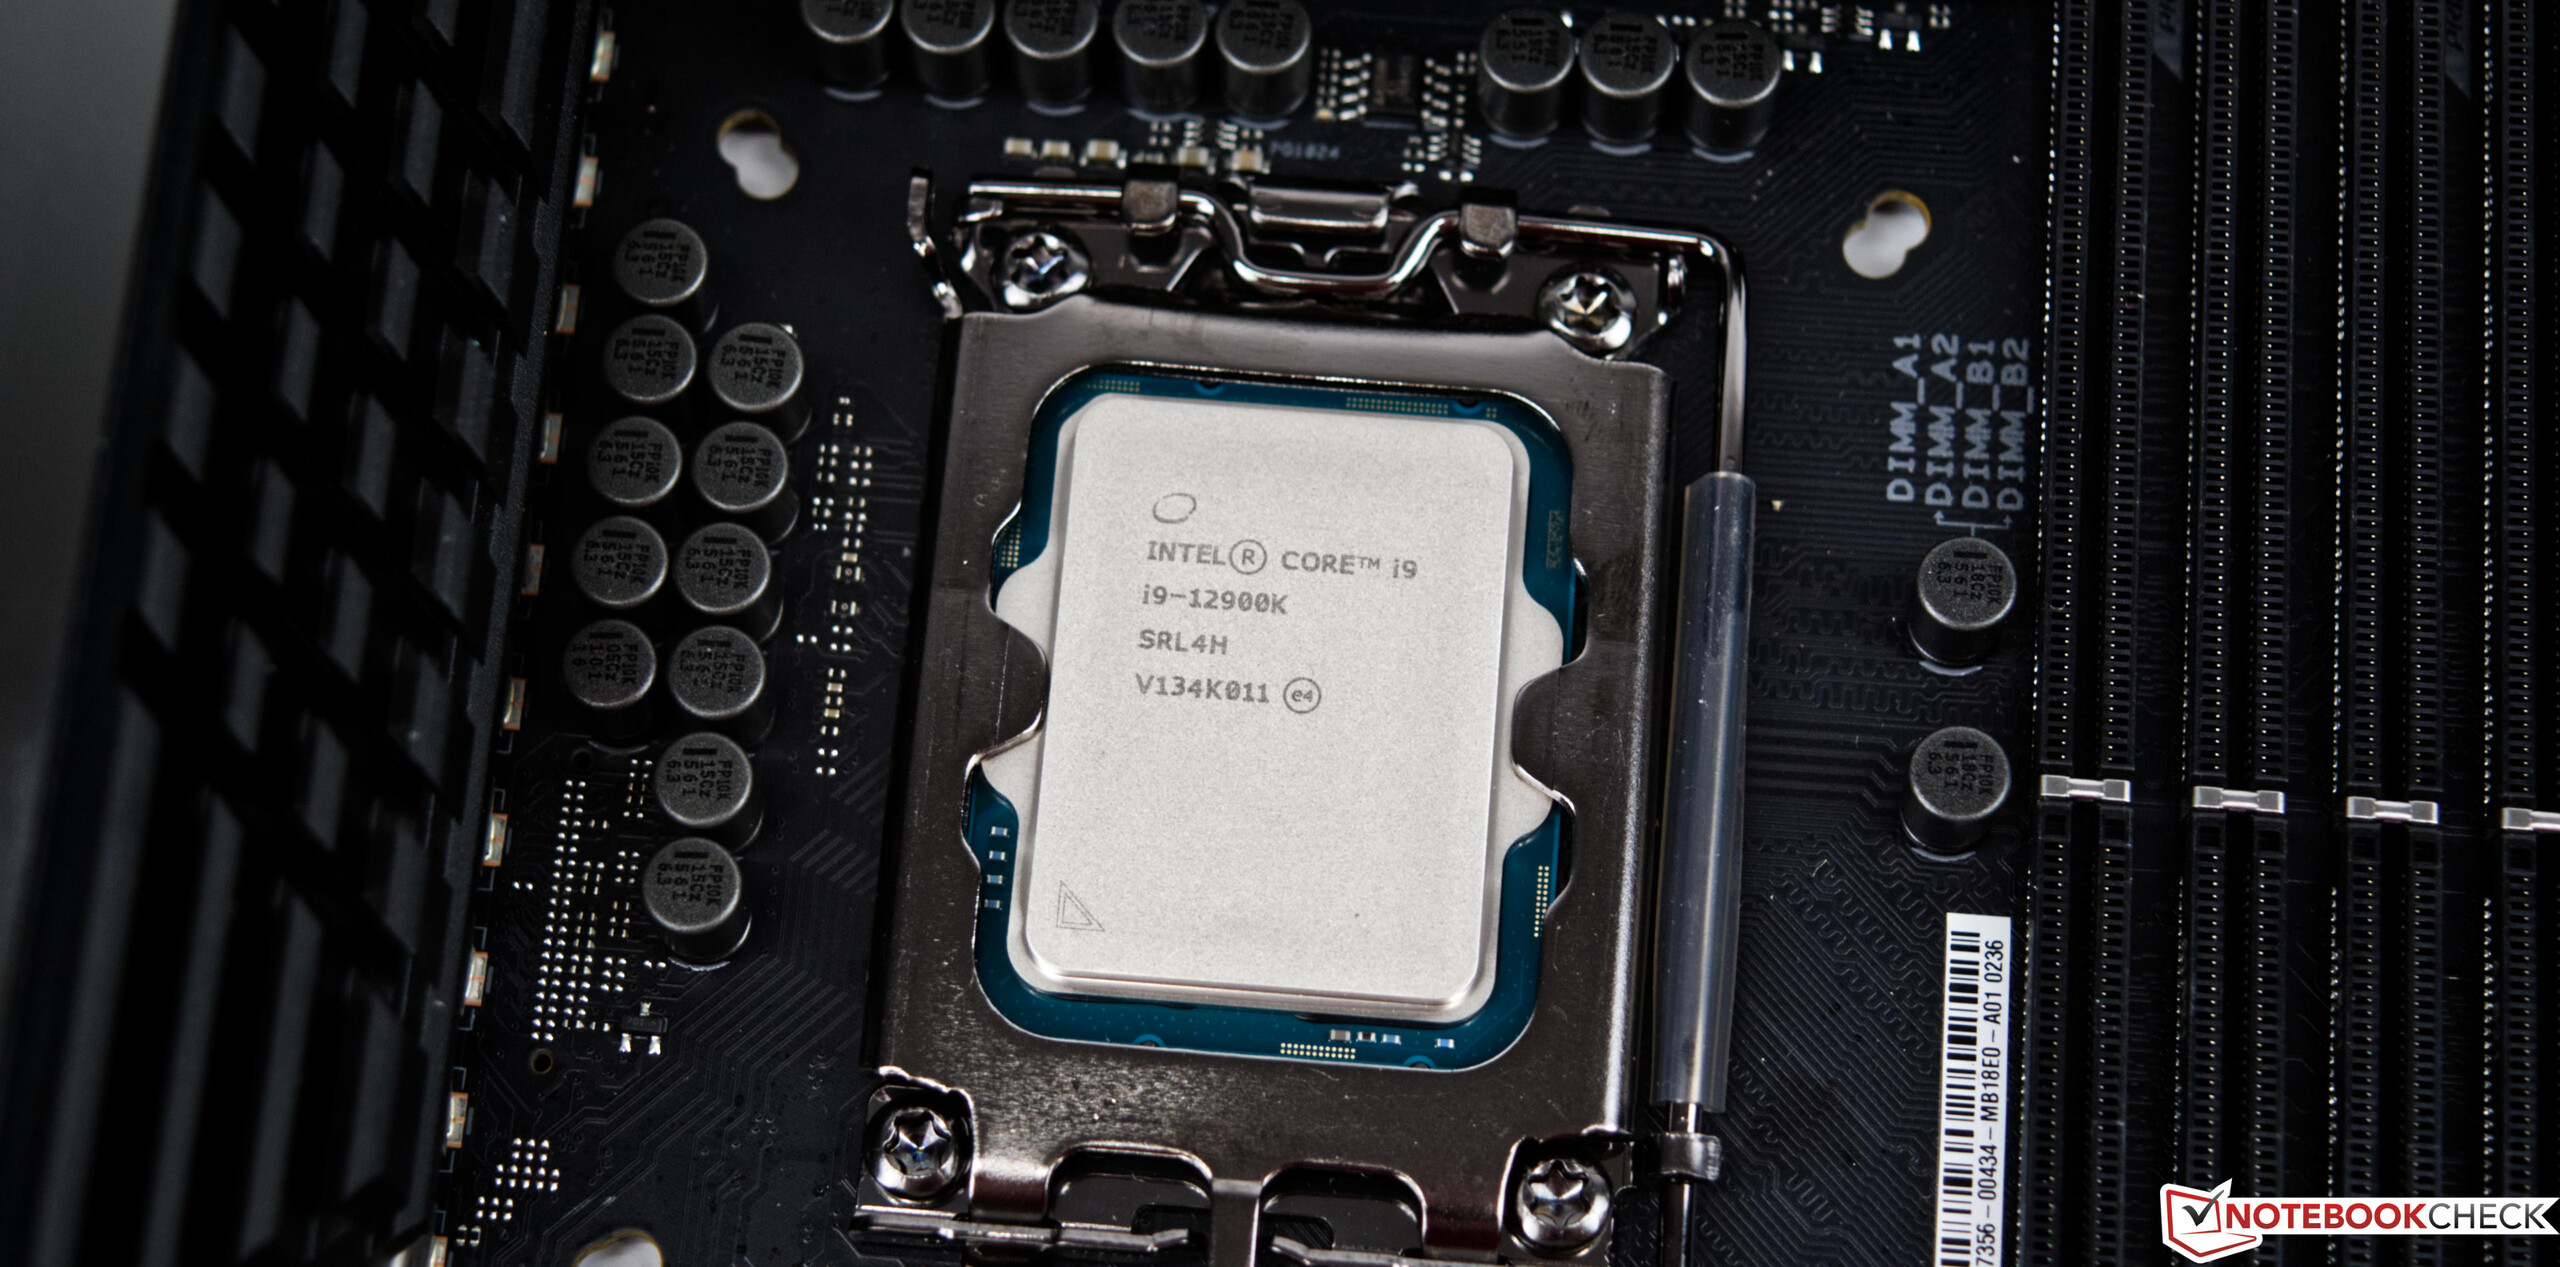
- Intel Core i9-12900K, Intel Core i5-12600K
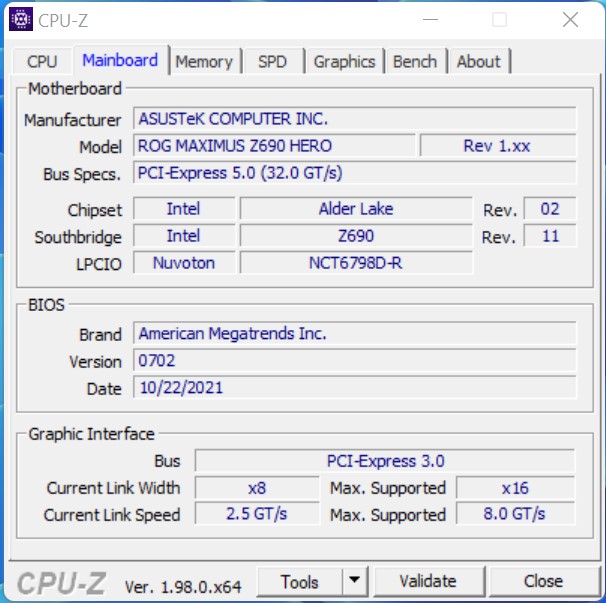
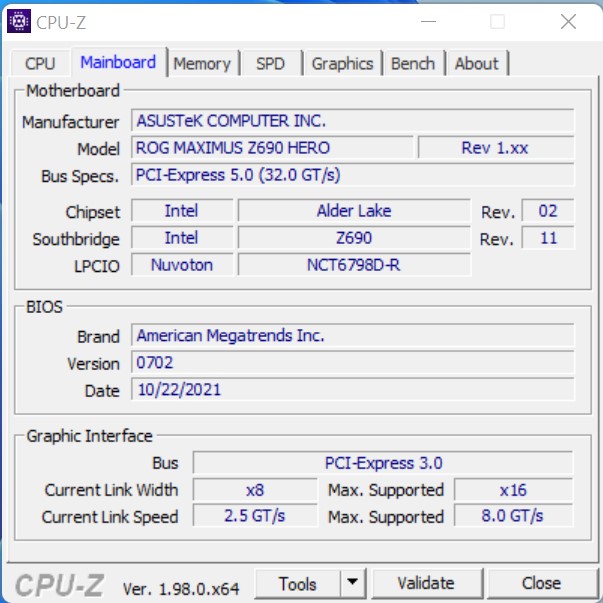
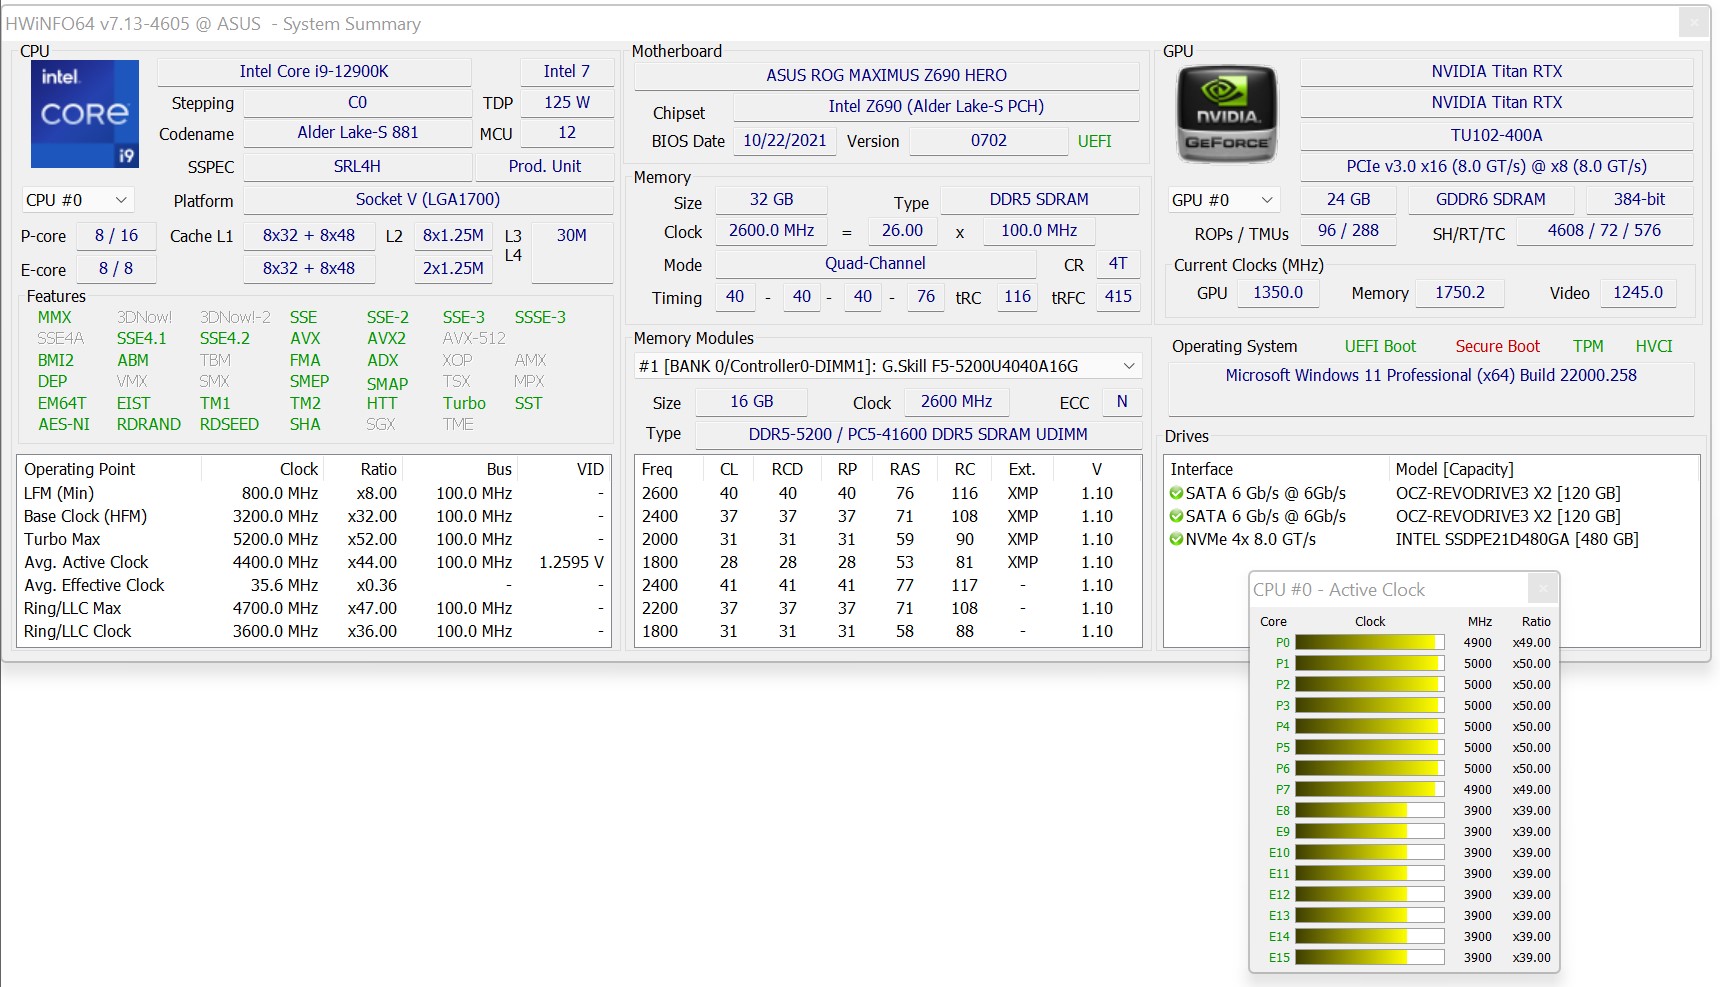
- Asus ROG Maximus Z690 Hero
- Alphacool Eisbear Aurora 280 AiO
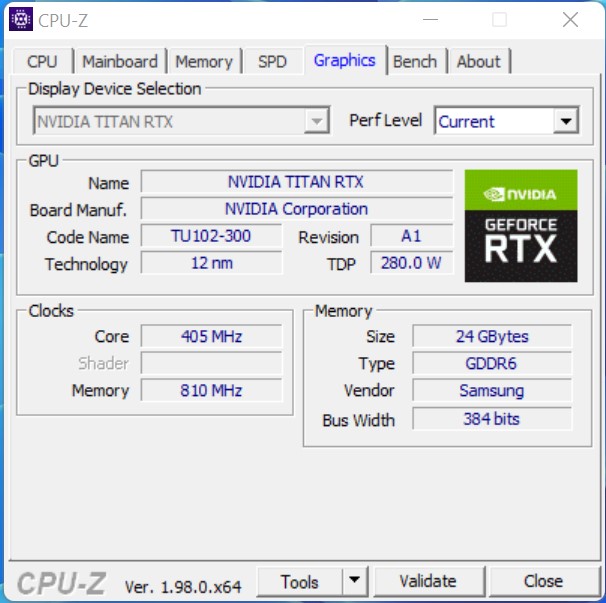
- Nvidia Titan RTX
- Corsair HX 1200X power supply
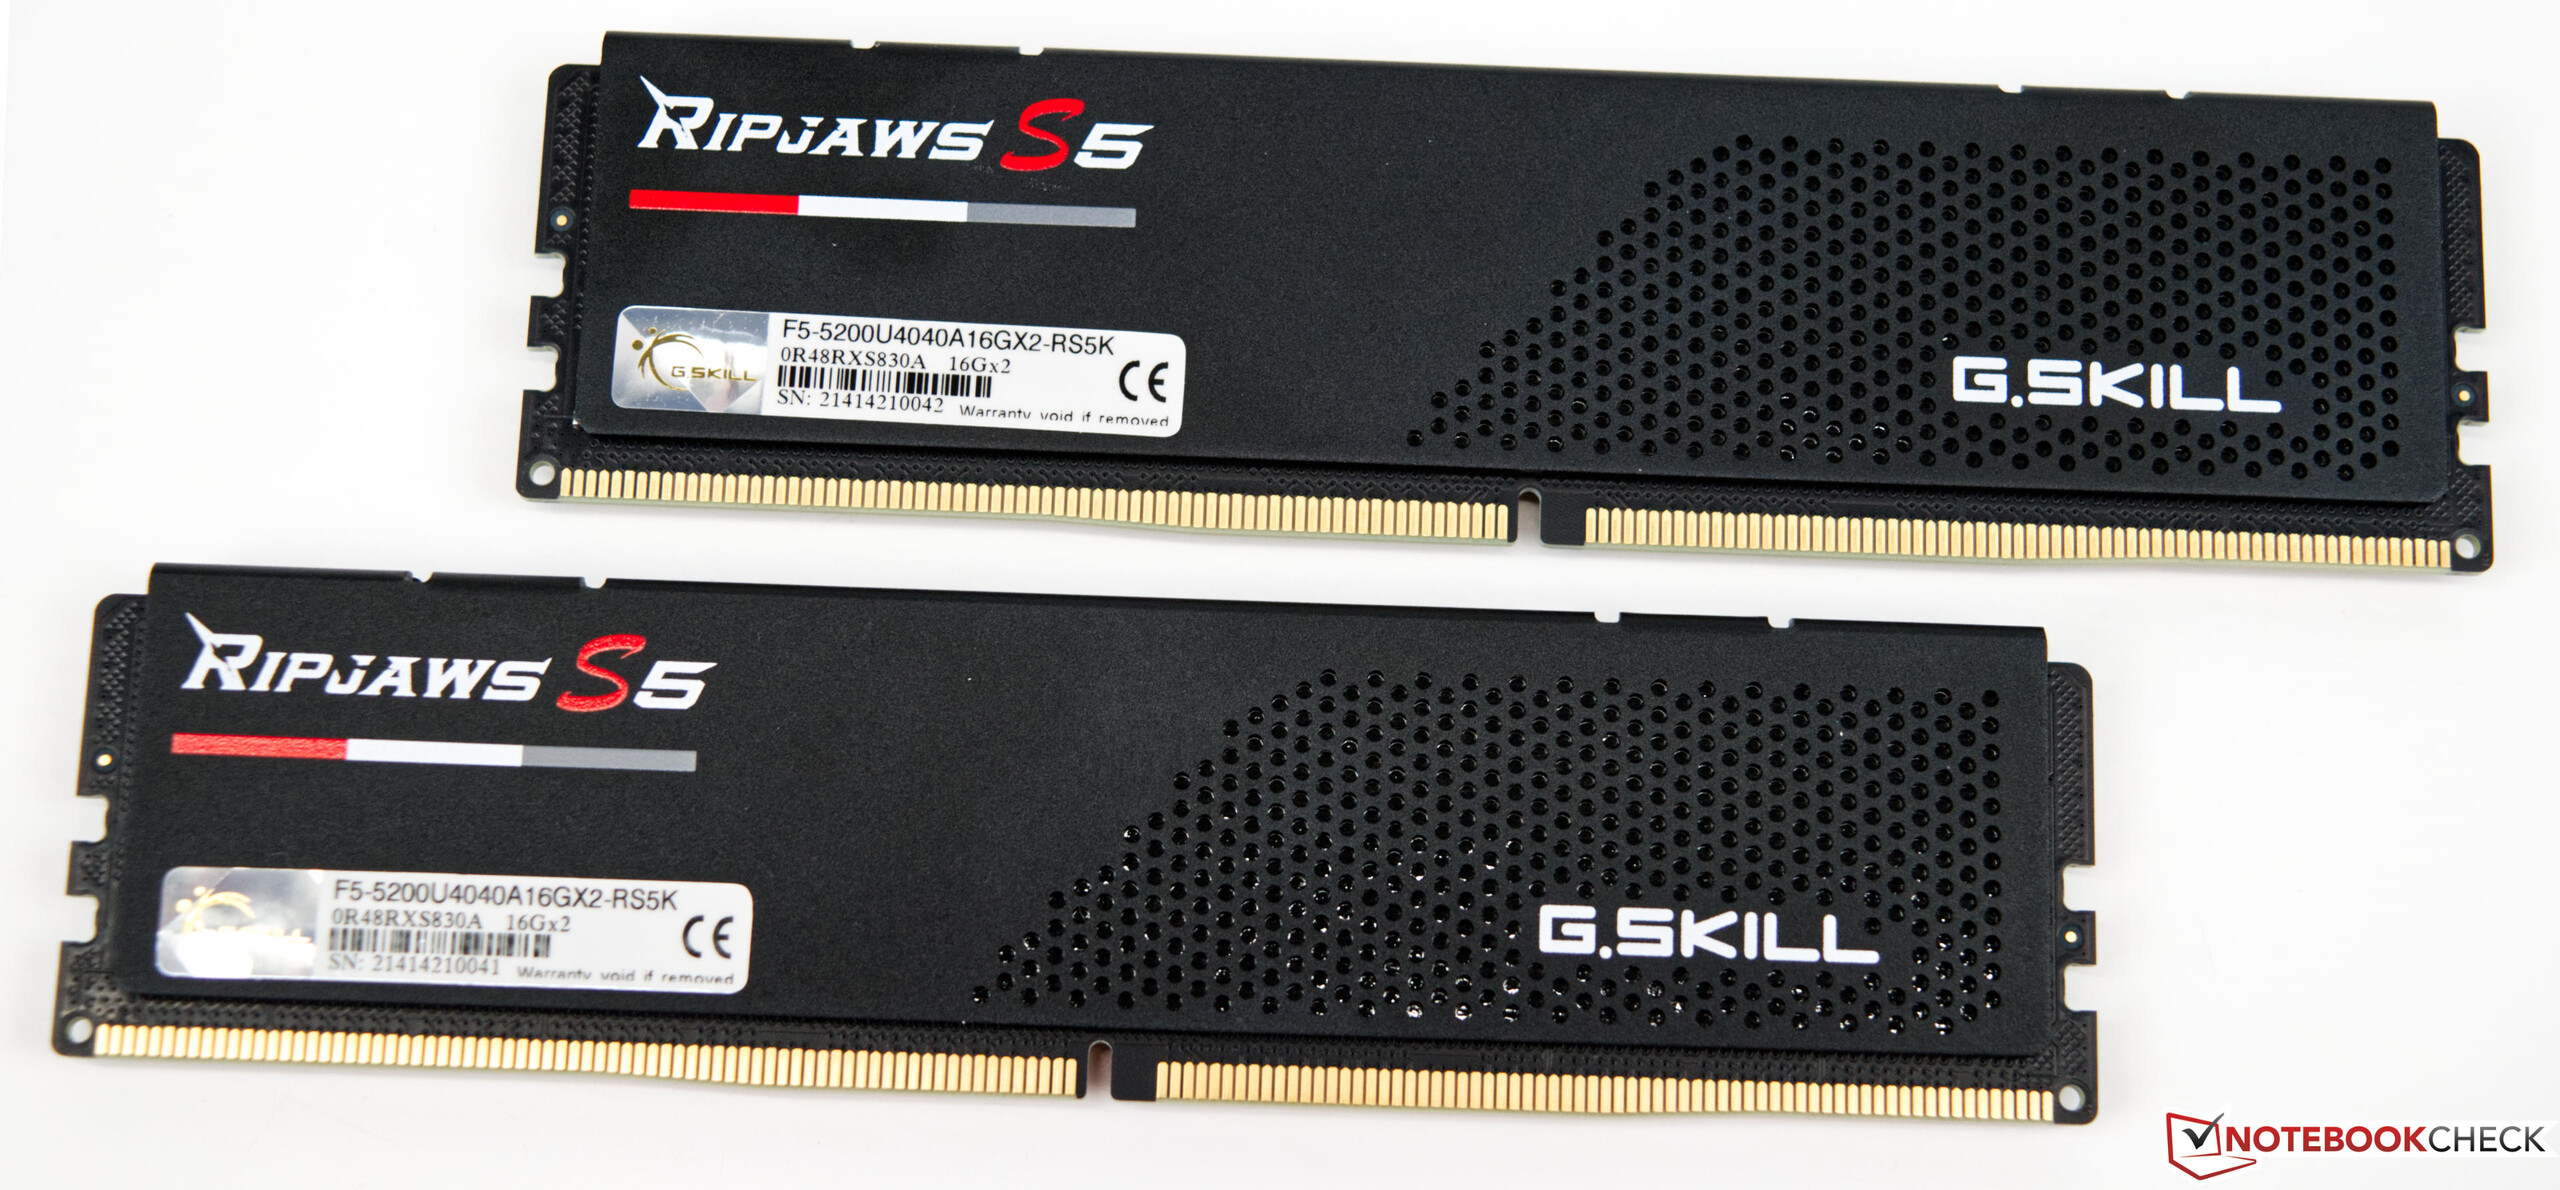
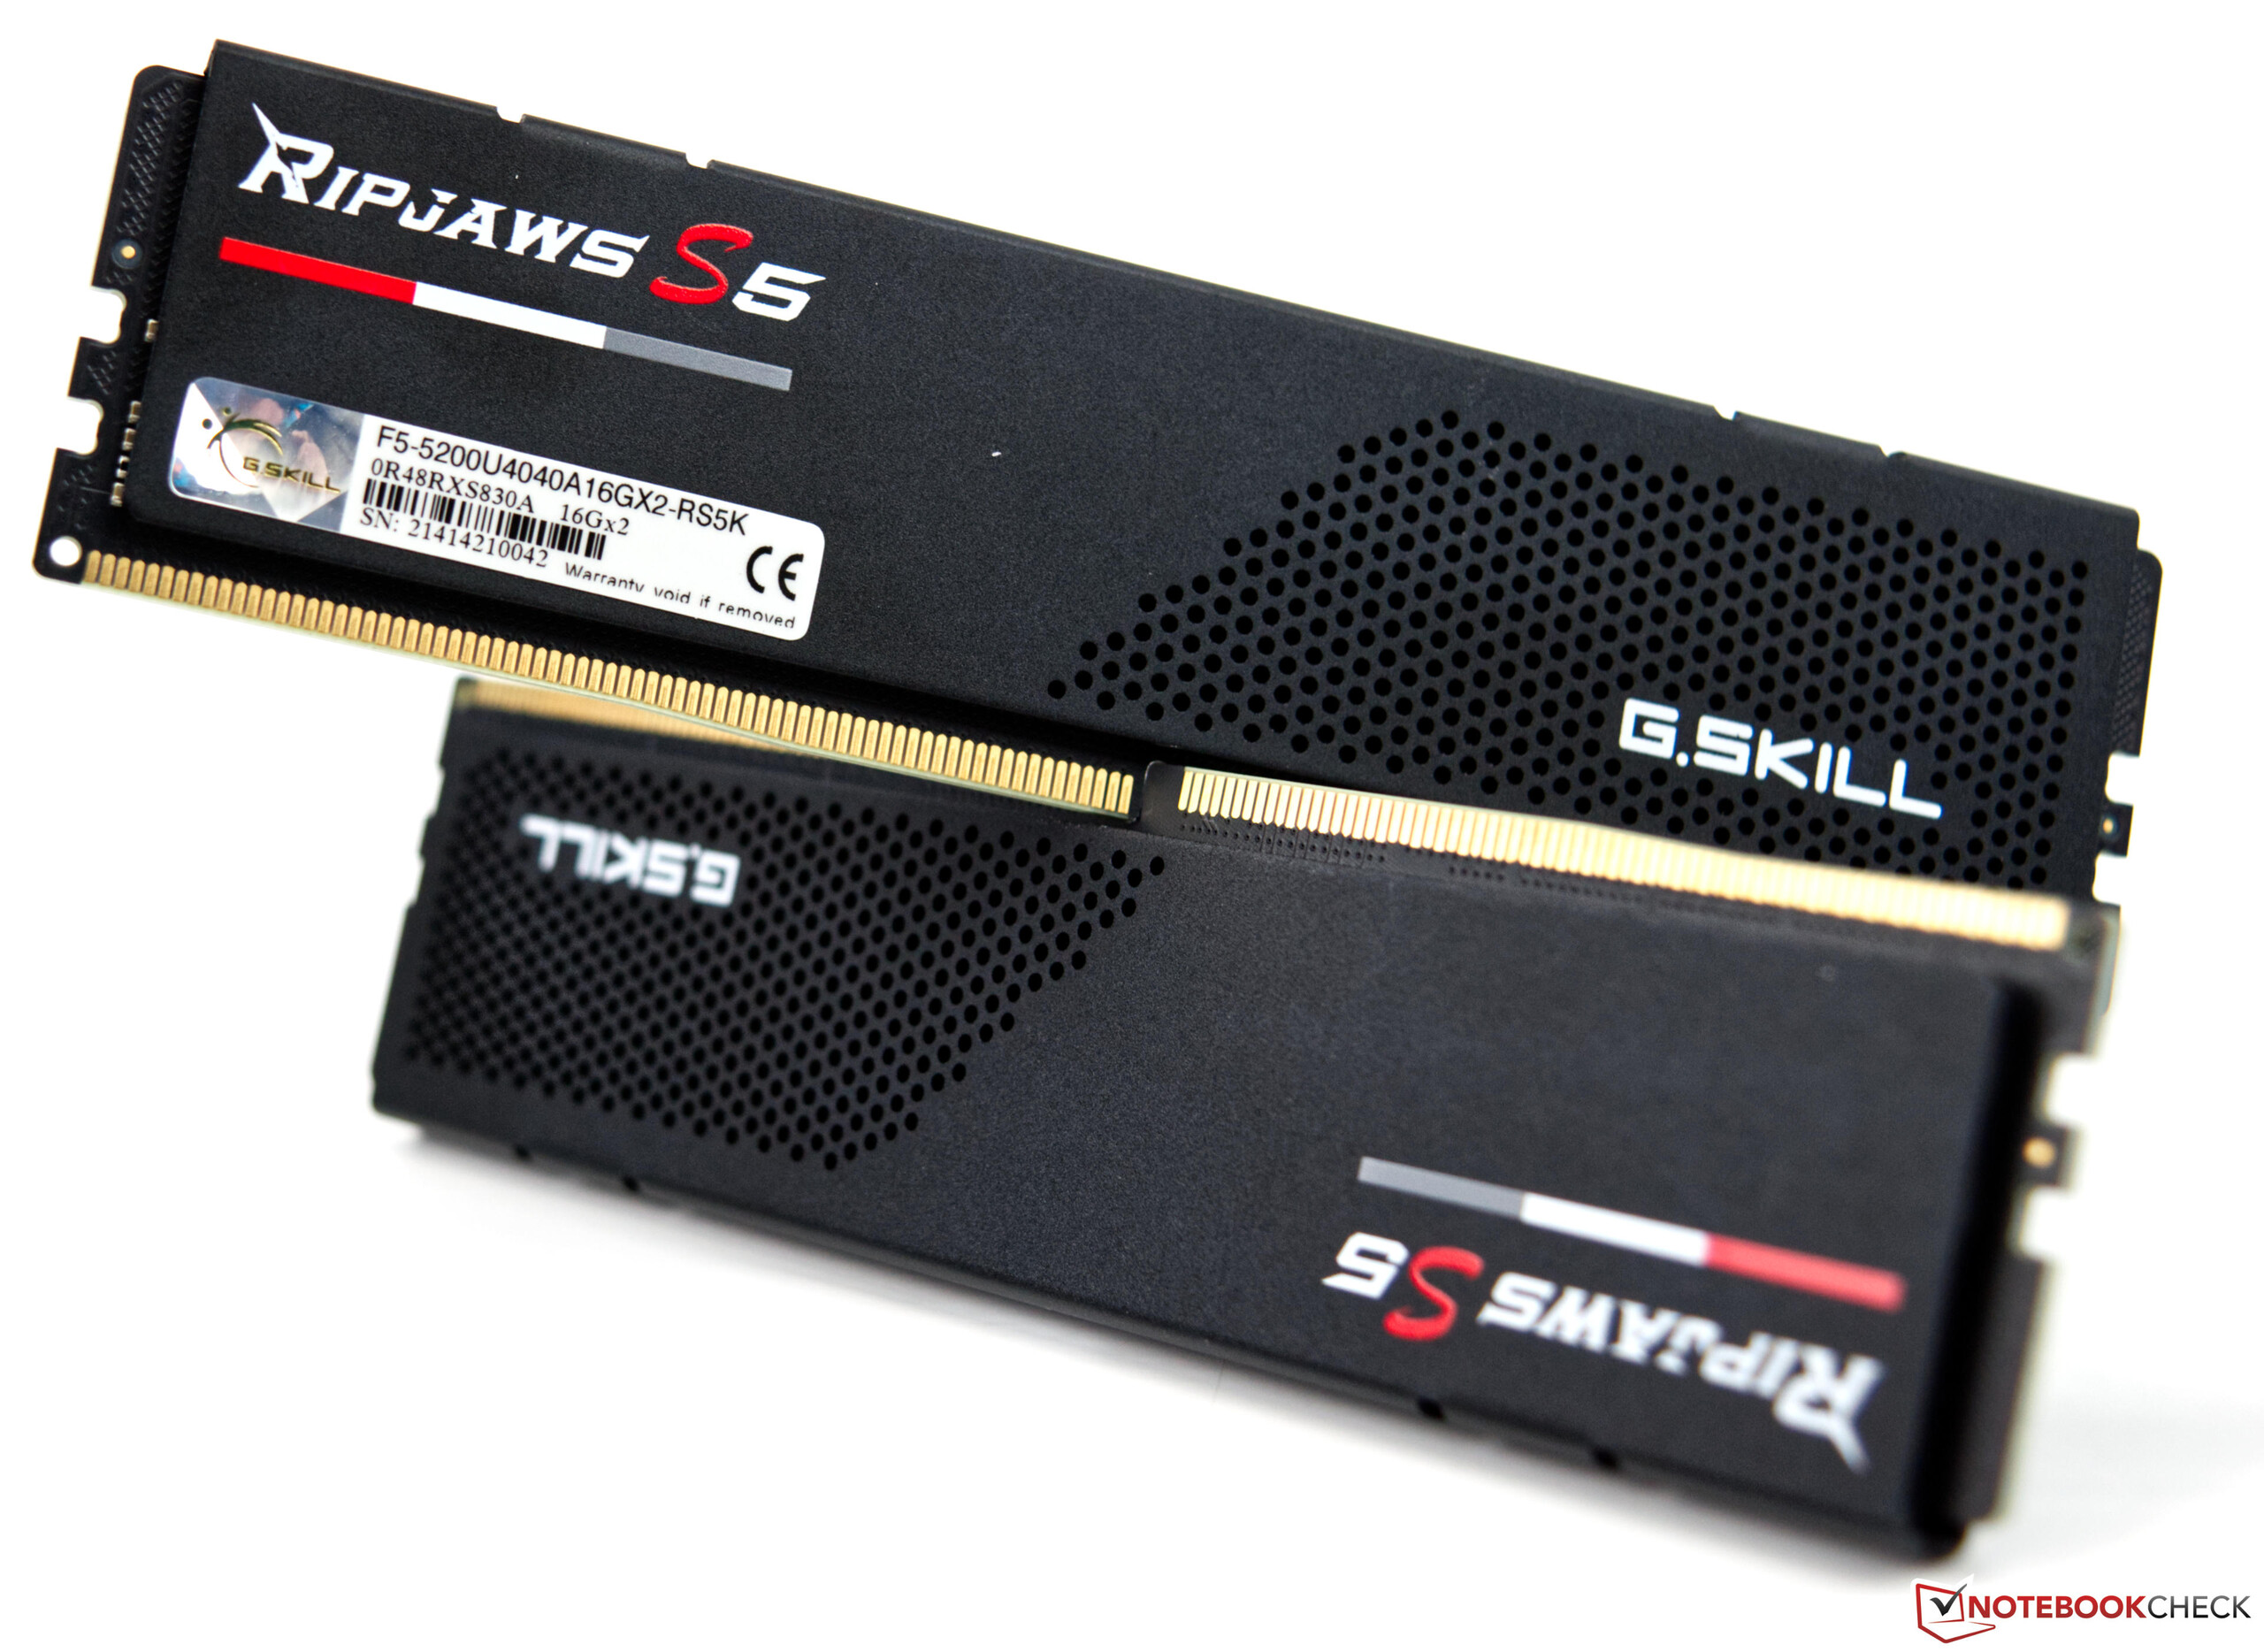
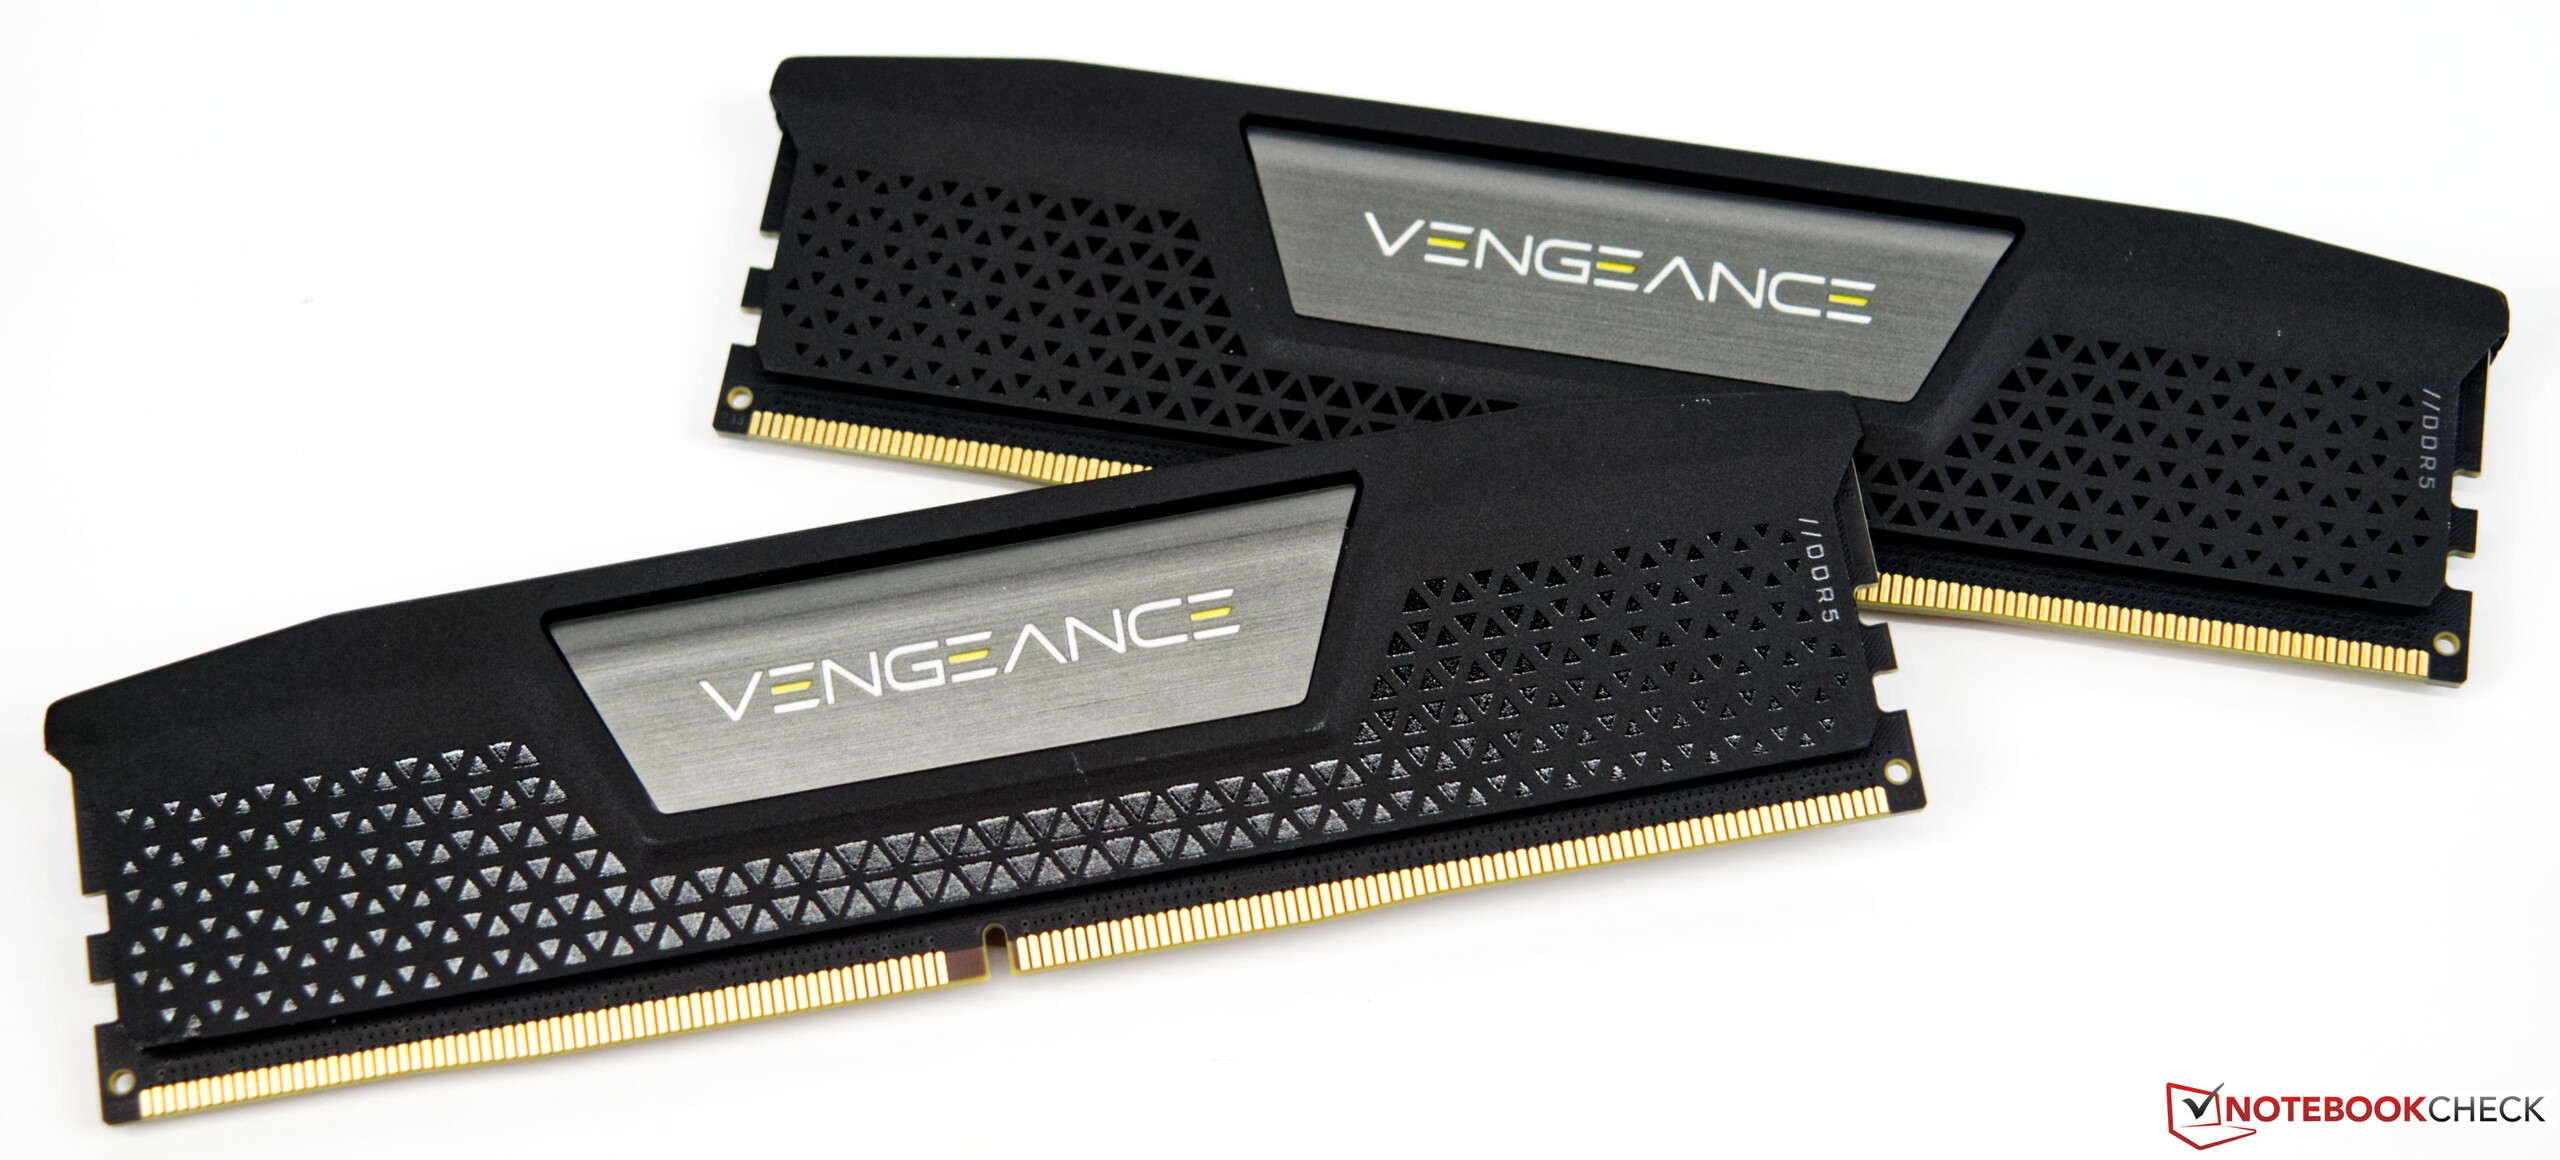
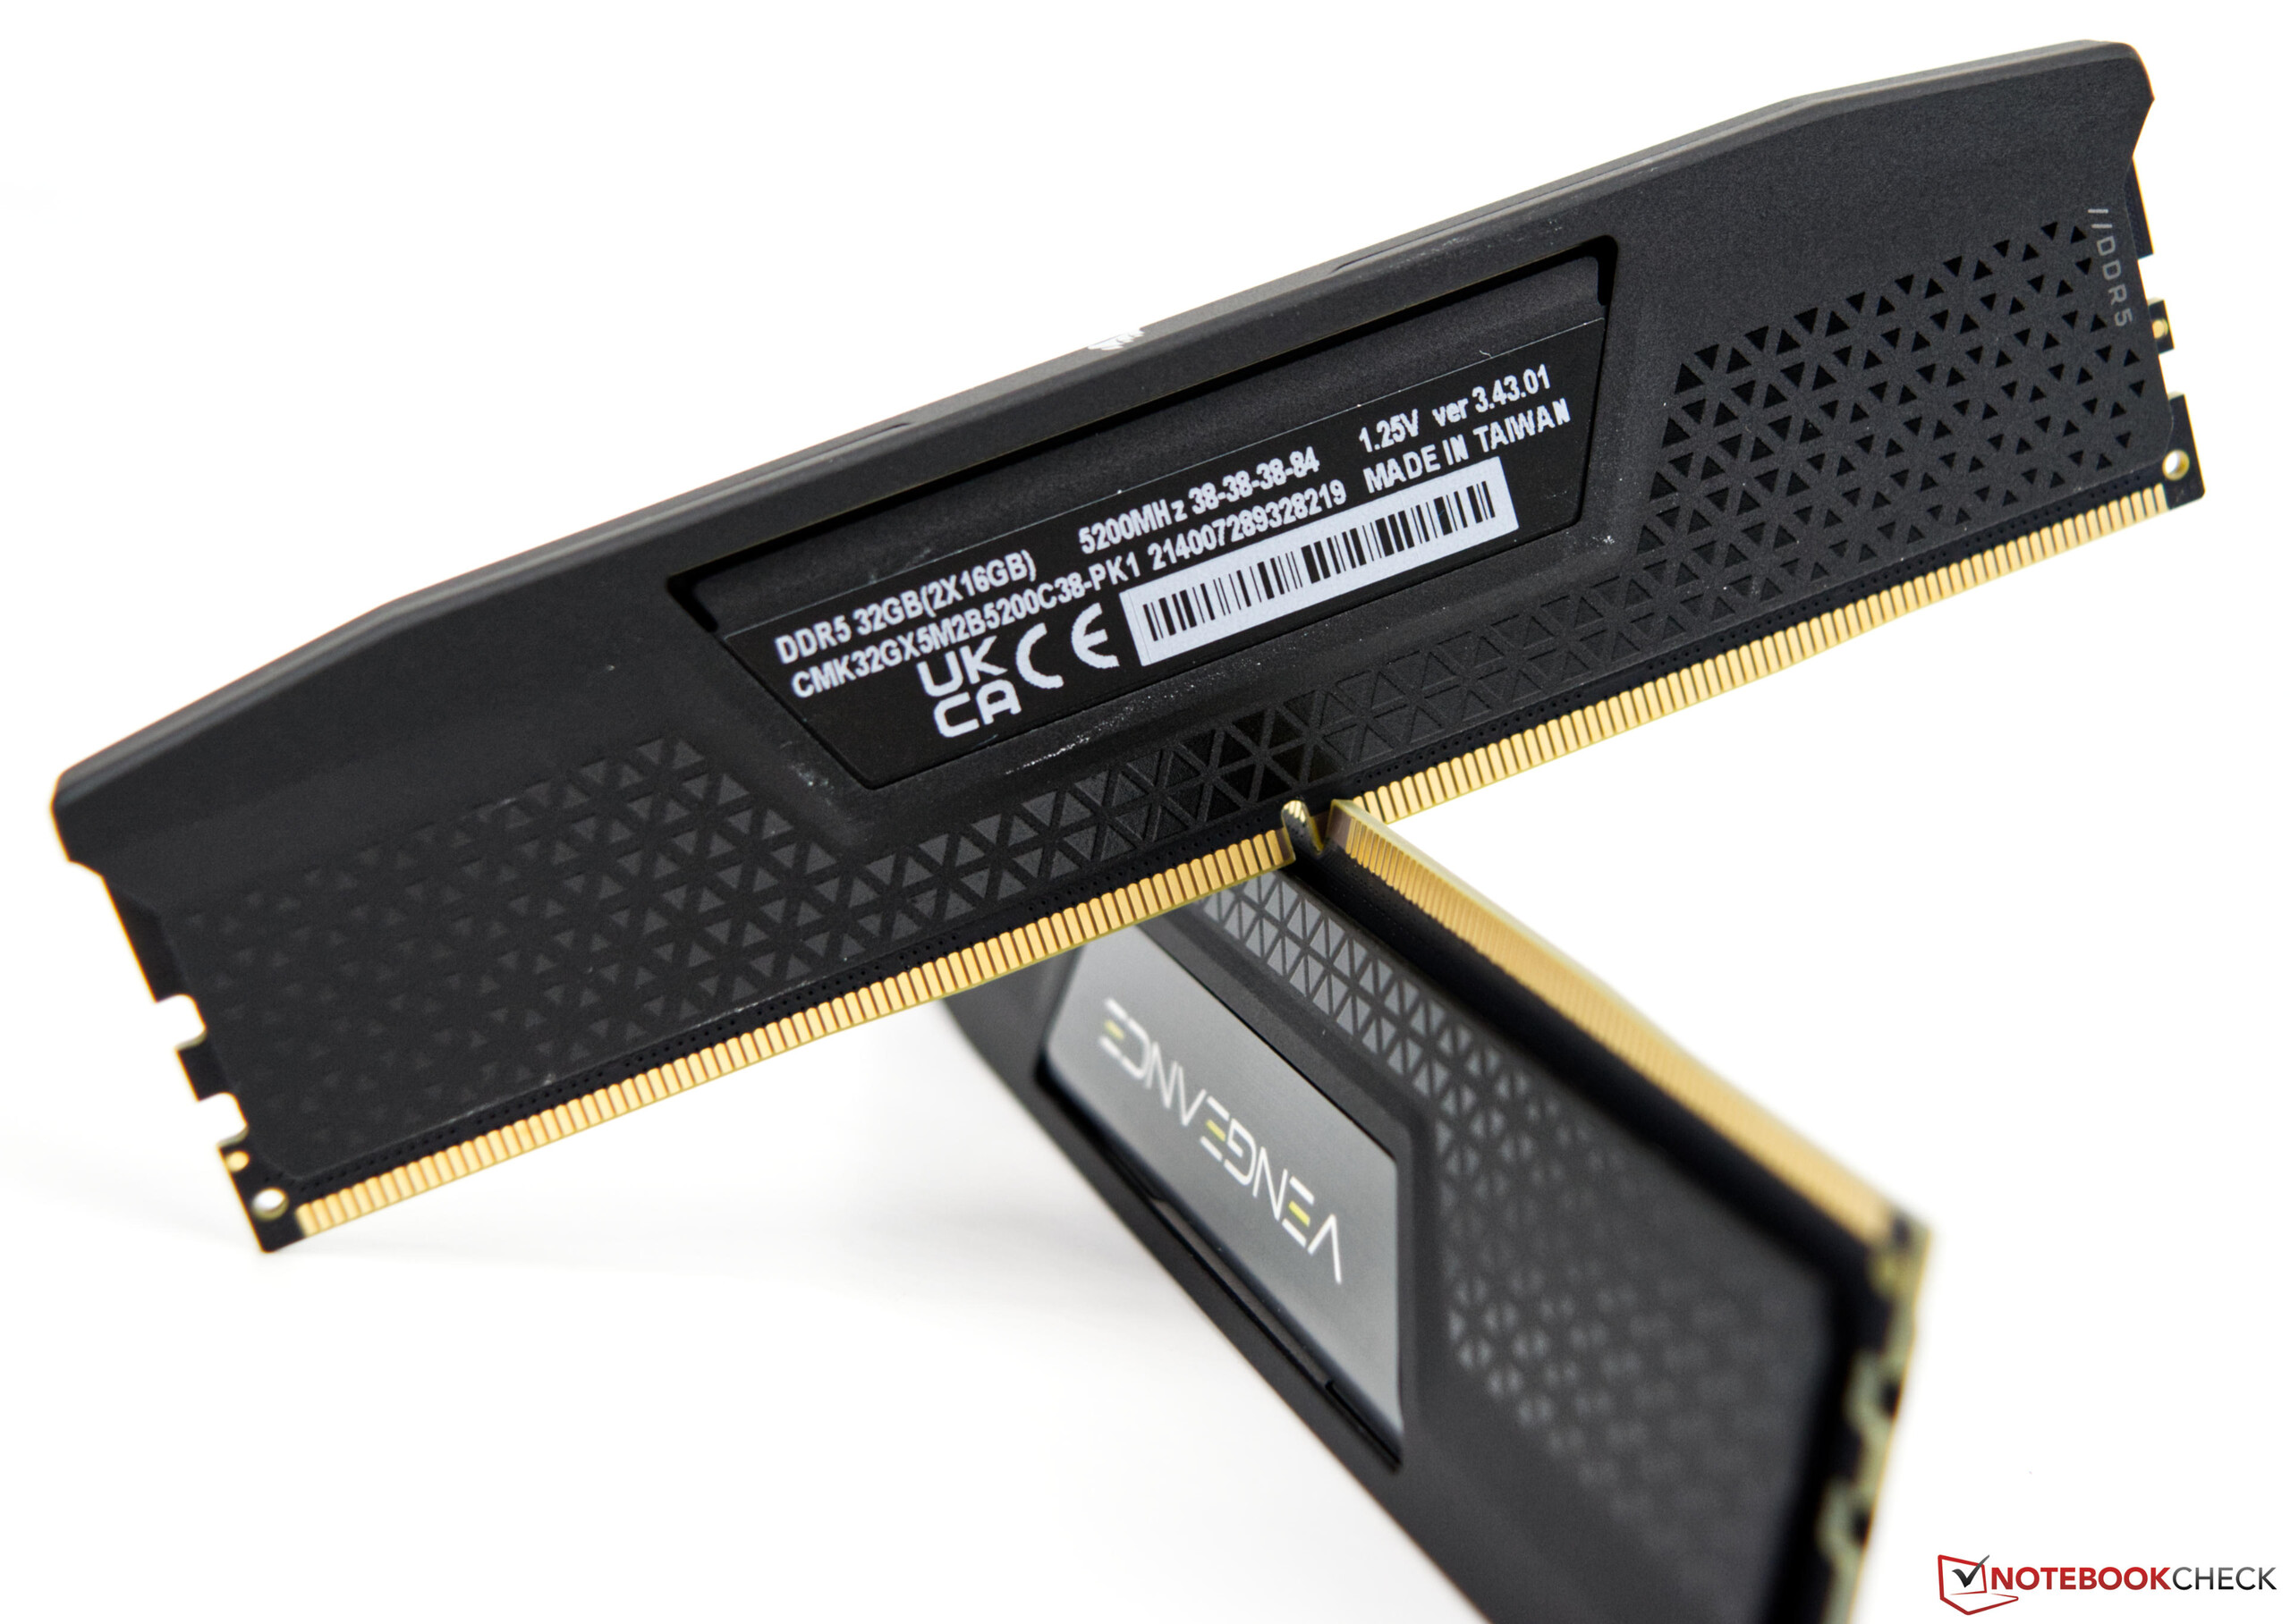
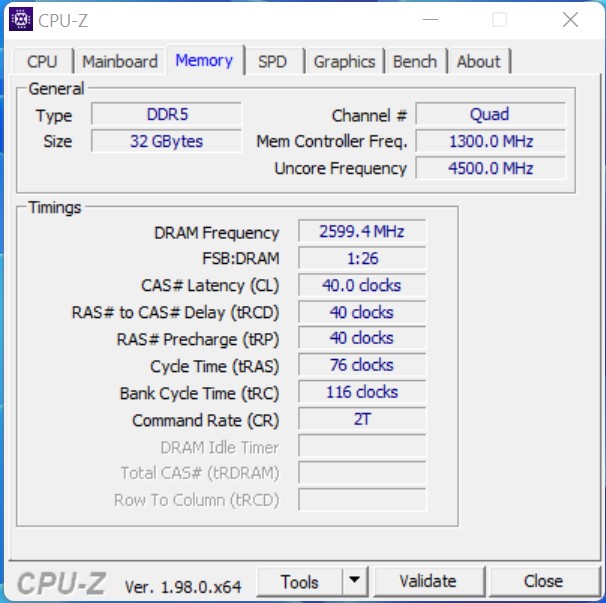
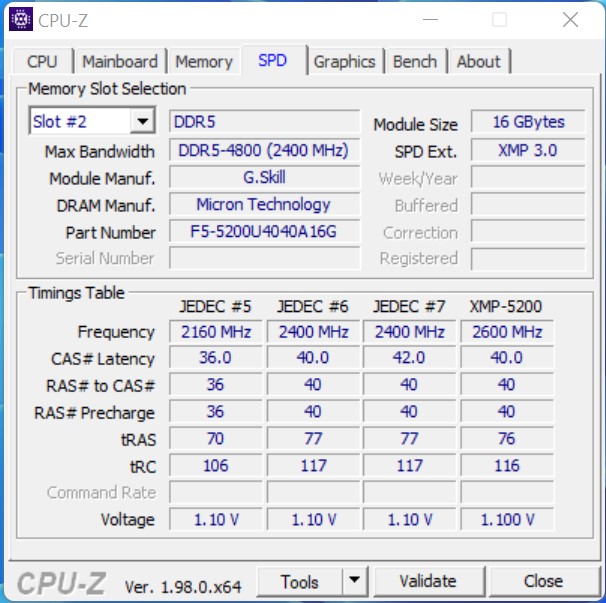
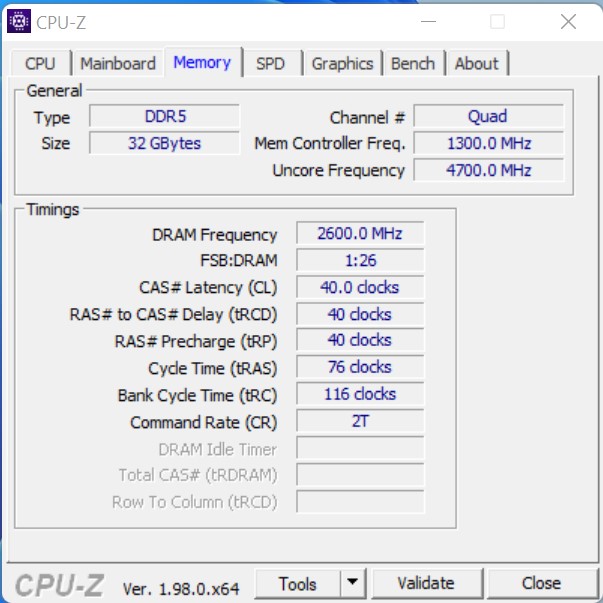
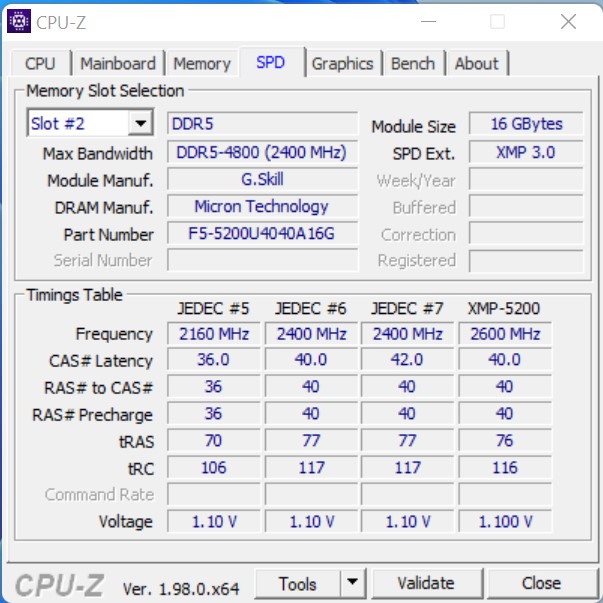
- G.Skill Ripjaws S5 (2x 16GB - DDR5-5200) / Corsair Vengeance (2x 16GB - DDR5-5200)
- Intel Optane 905p (480 GB system + benchmarks)
- OCZ Revodrive (480 GB for games)
- Microsoft Windows 11 Professional 64-Bit (version 21H2)
The two processors come from Intel directly. G.Skill and also Corsair provided the brand-new DDR5 working memory for us, and the new Z690 mainboard comes directly from Asus. Caseking supports us with the Raijintek Pean Showcase, and as cooling we use the Alphacool Eisbear Aurora 280 AiO that was made available to us by Alphacool.
Important Note:
All the benchmarks were run on a freshly installed Windows 11 system. The most current Bios version was provided to us by Asus. What is important to know is that with the standard settings PL1 and PL2 are equal, which means that the CPU can always take up the maximum performance without any limitations. We used the standard settings for this review.
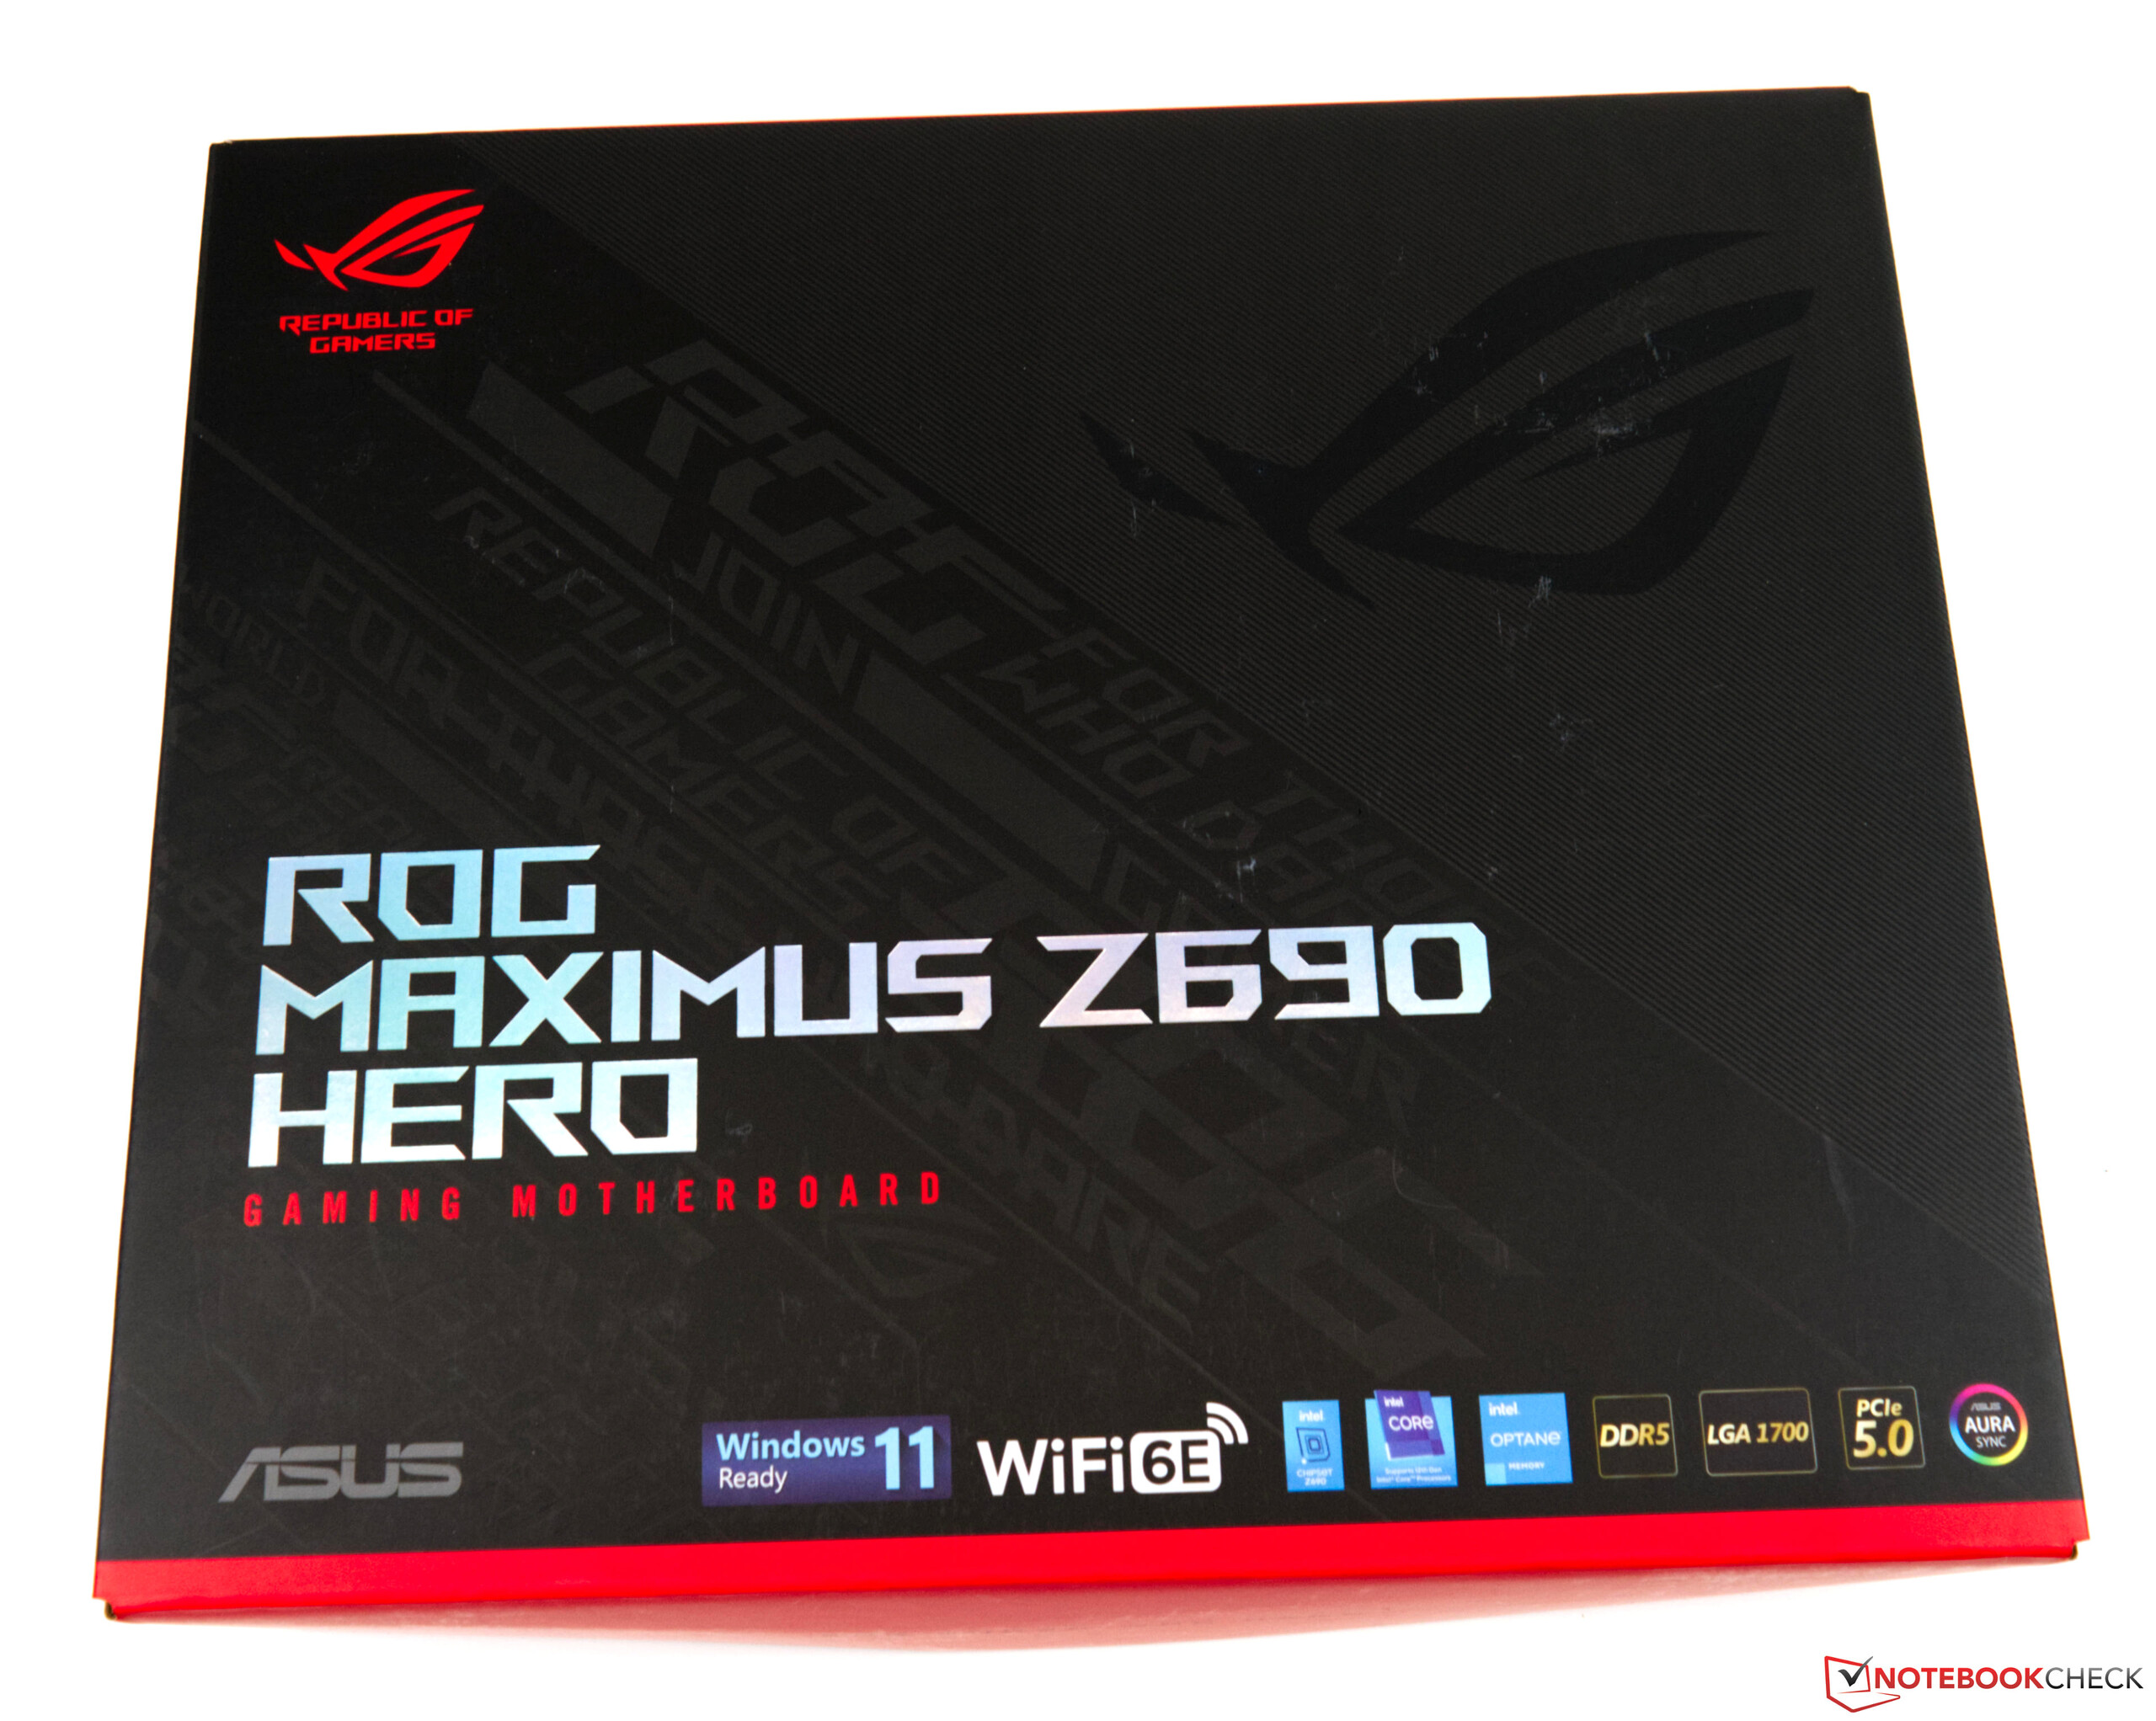
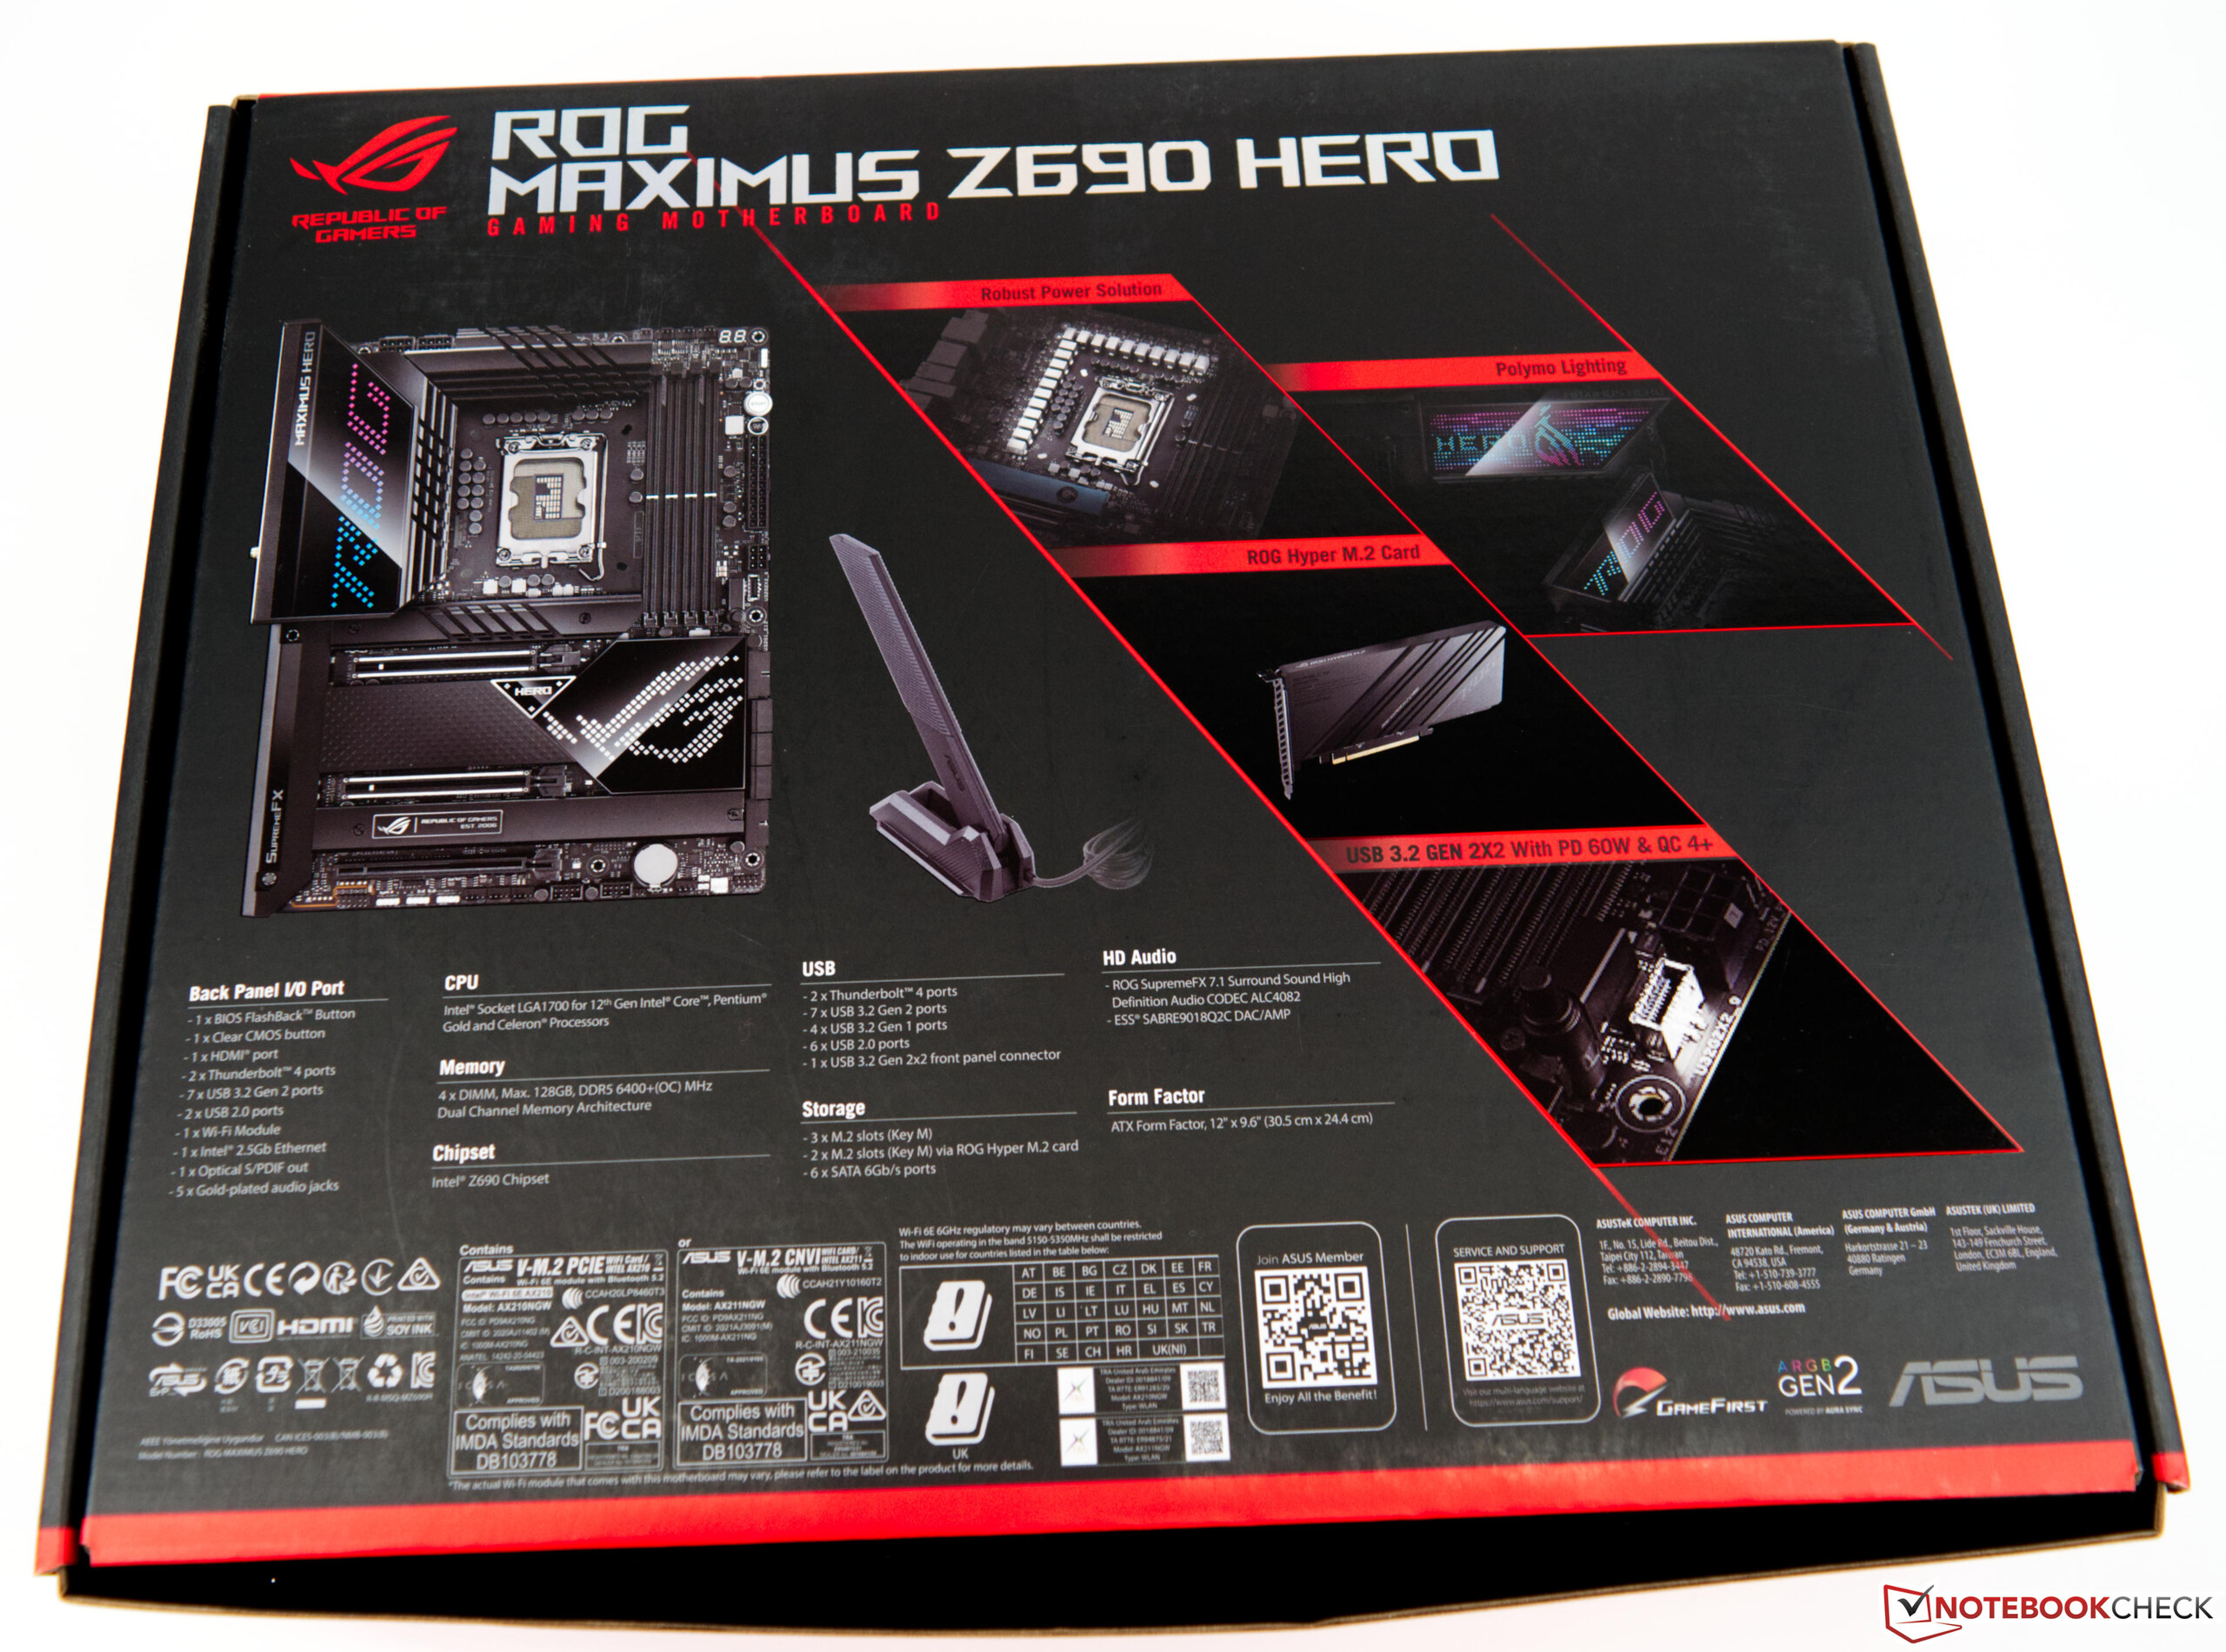
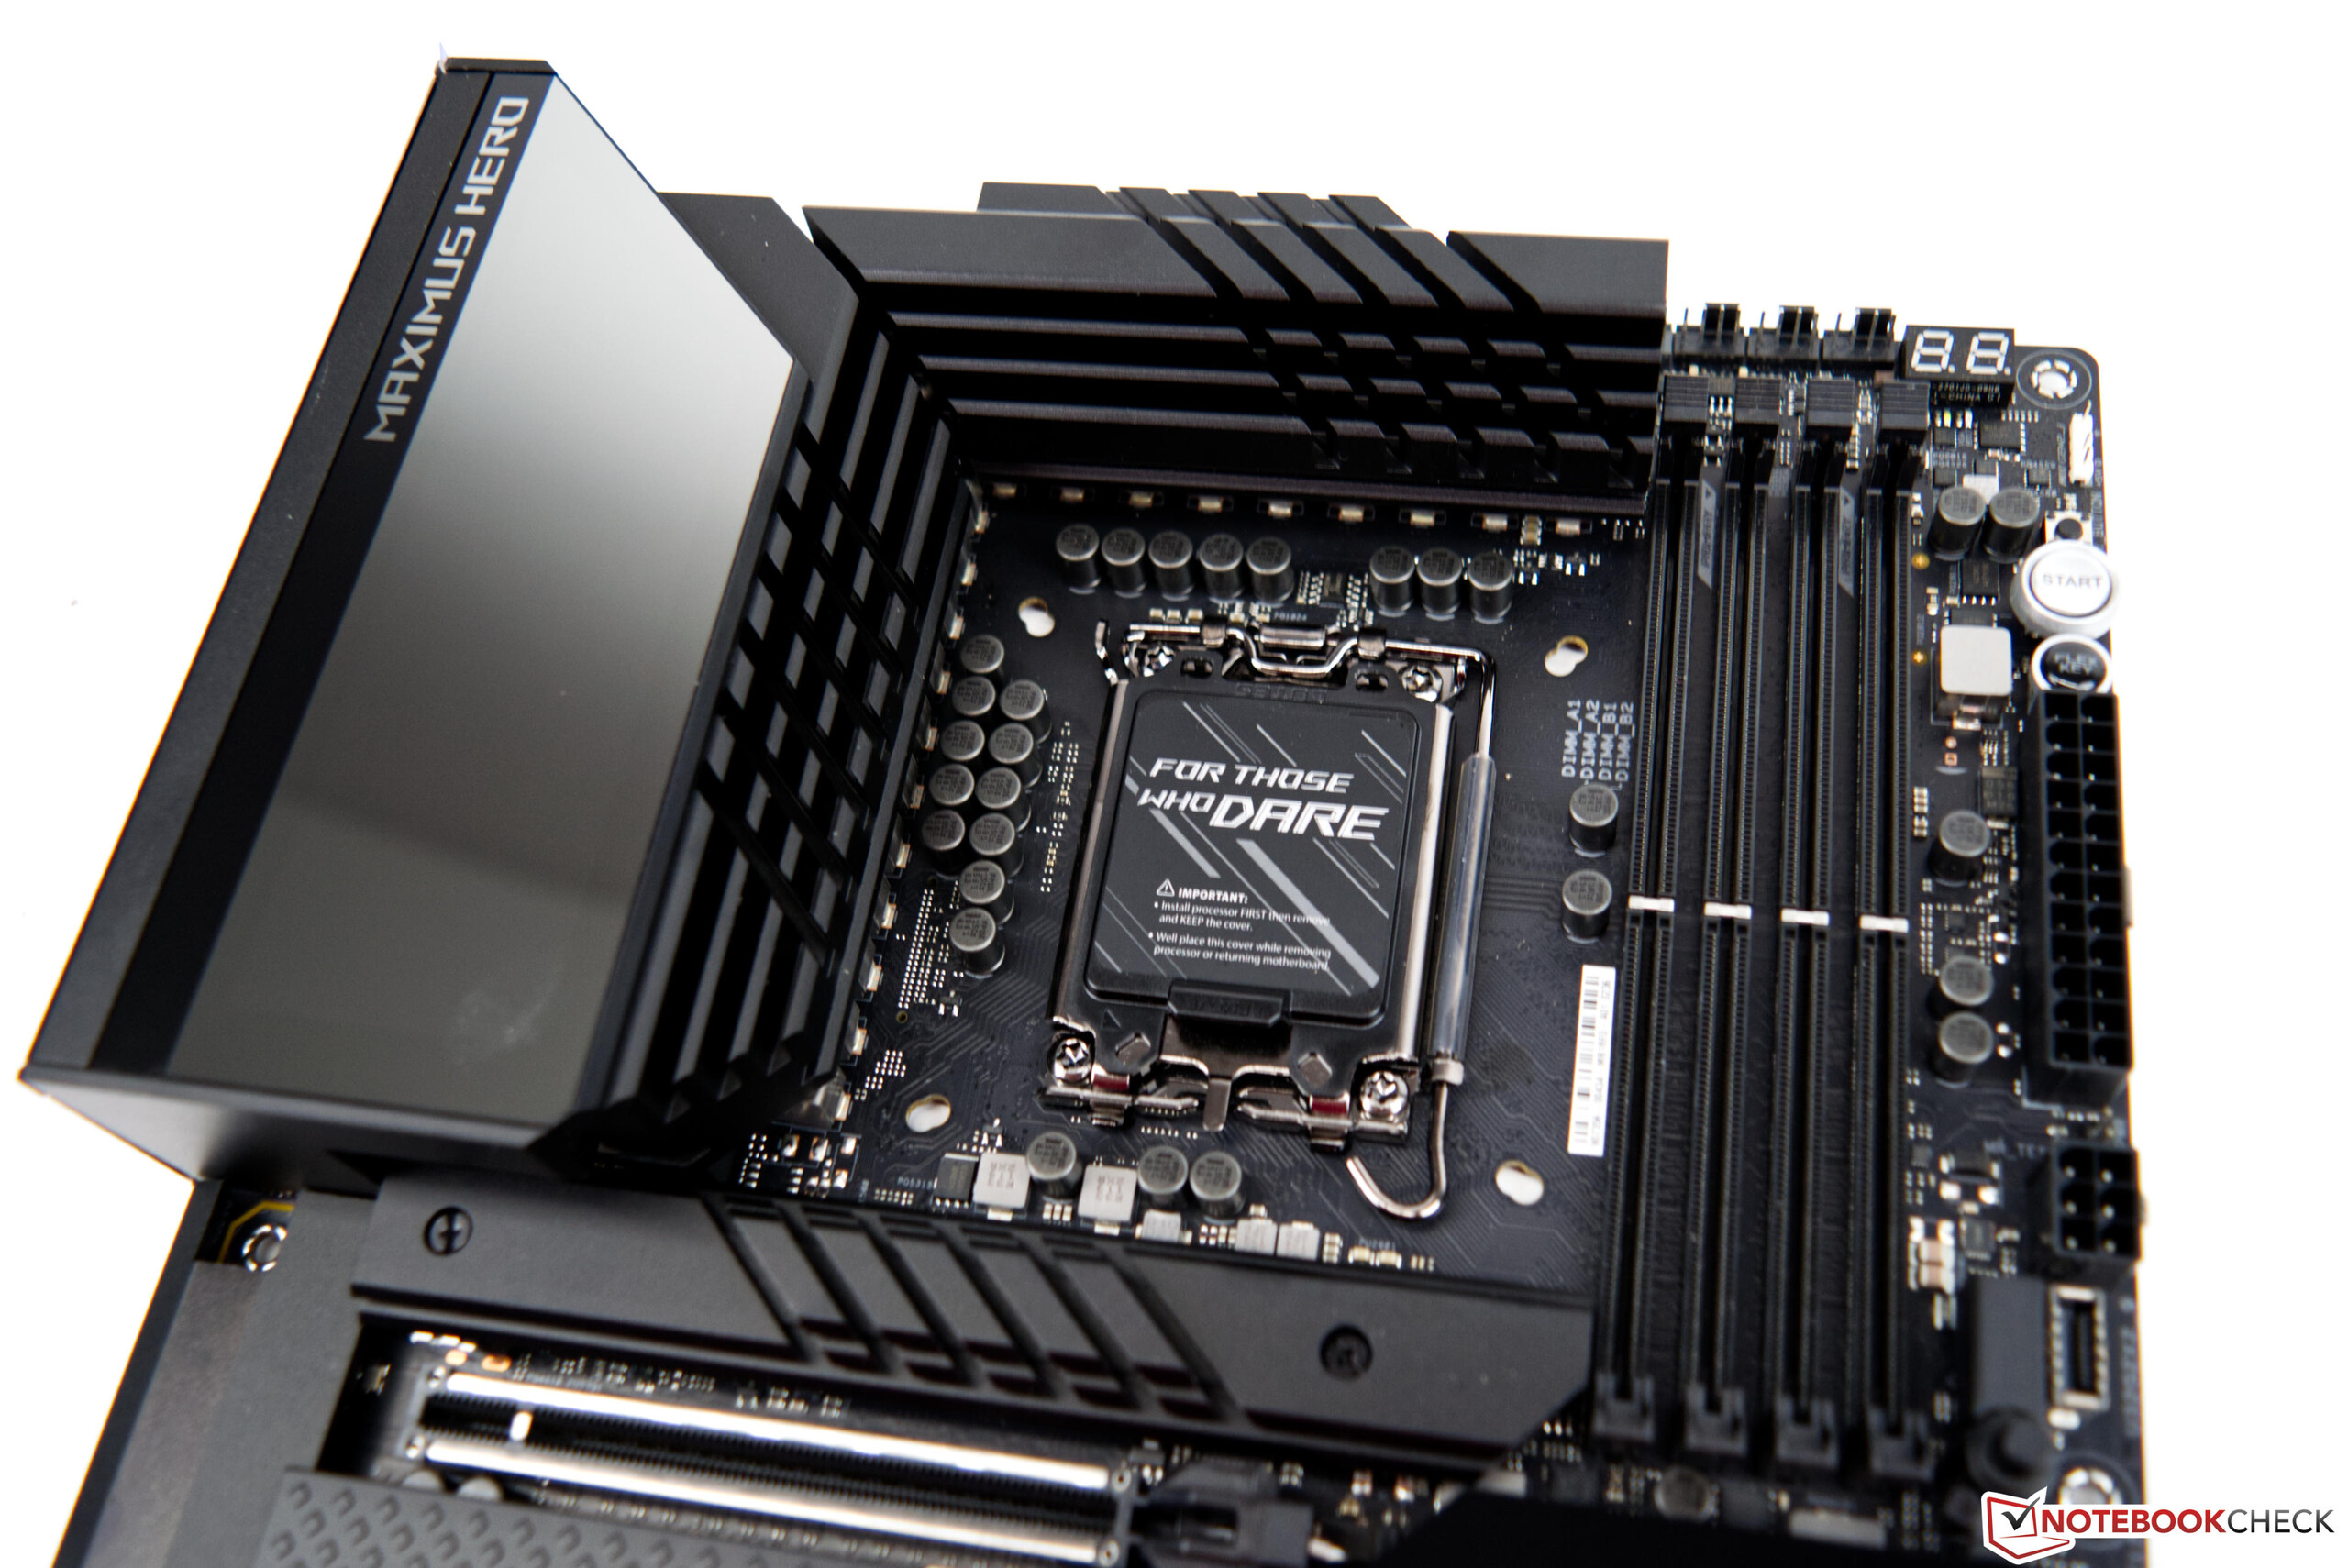
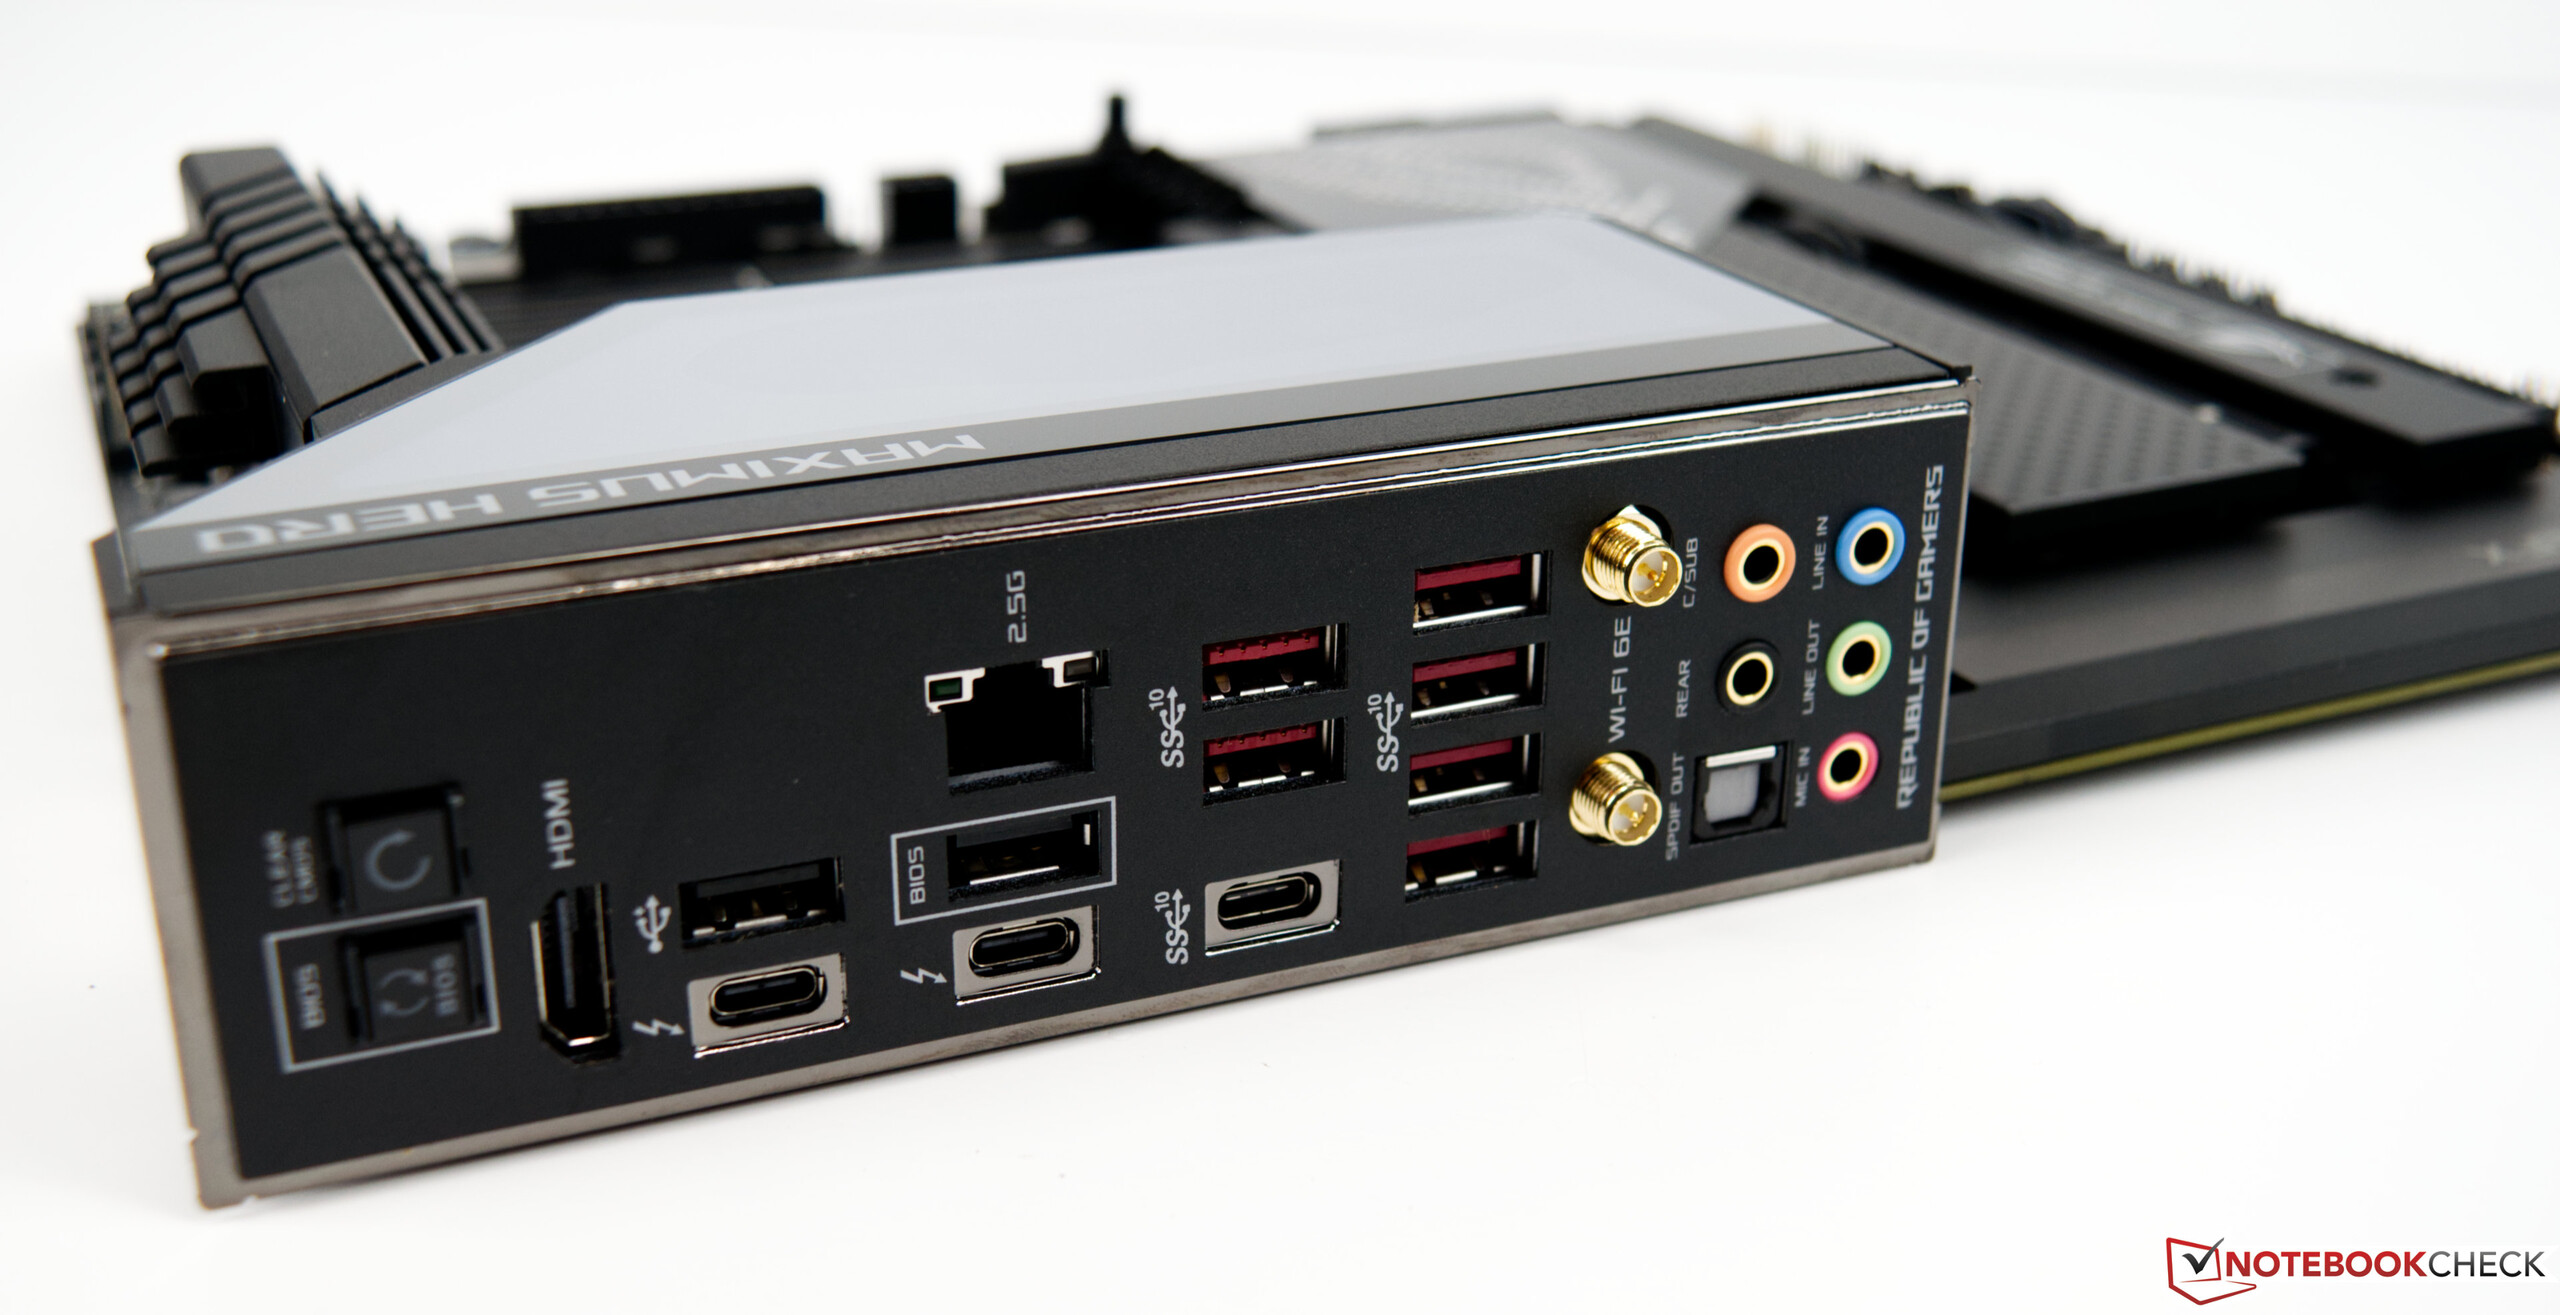
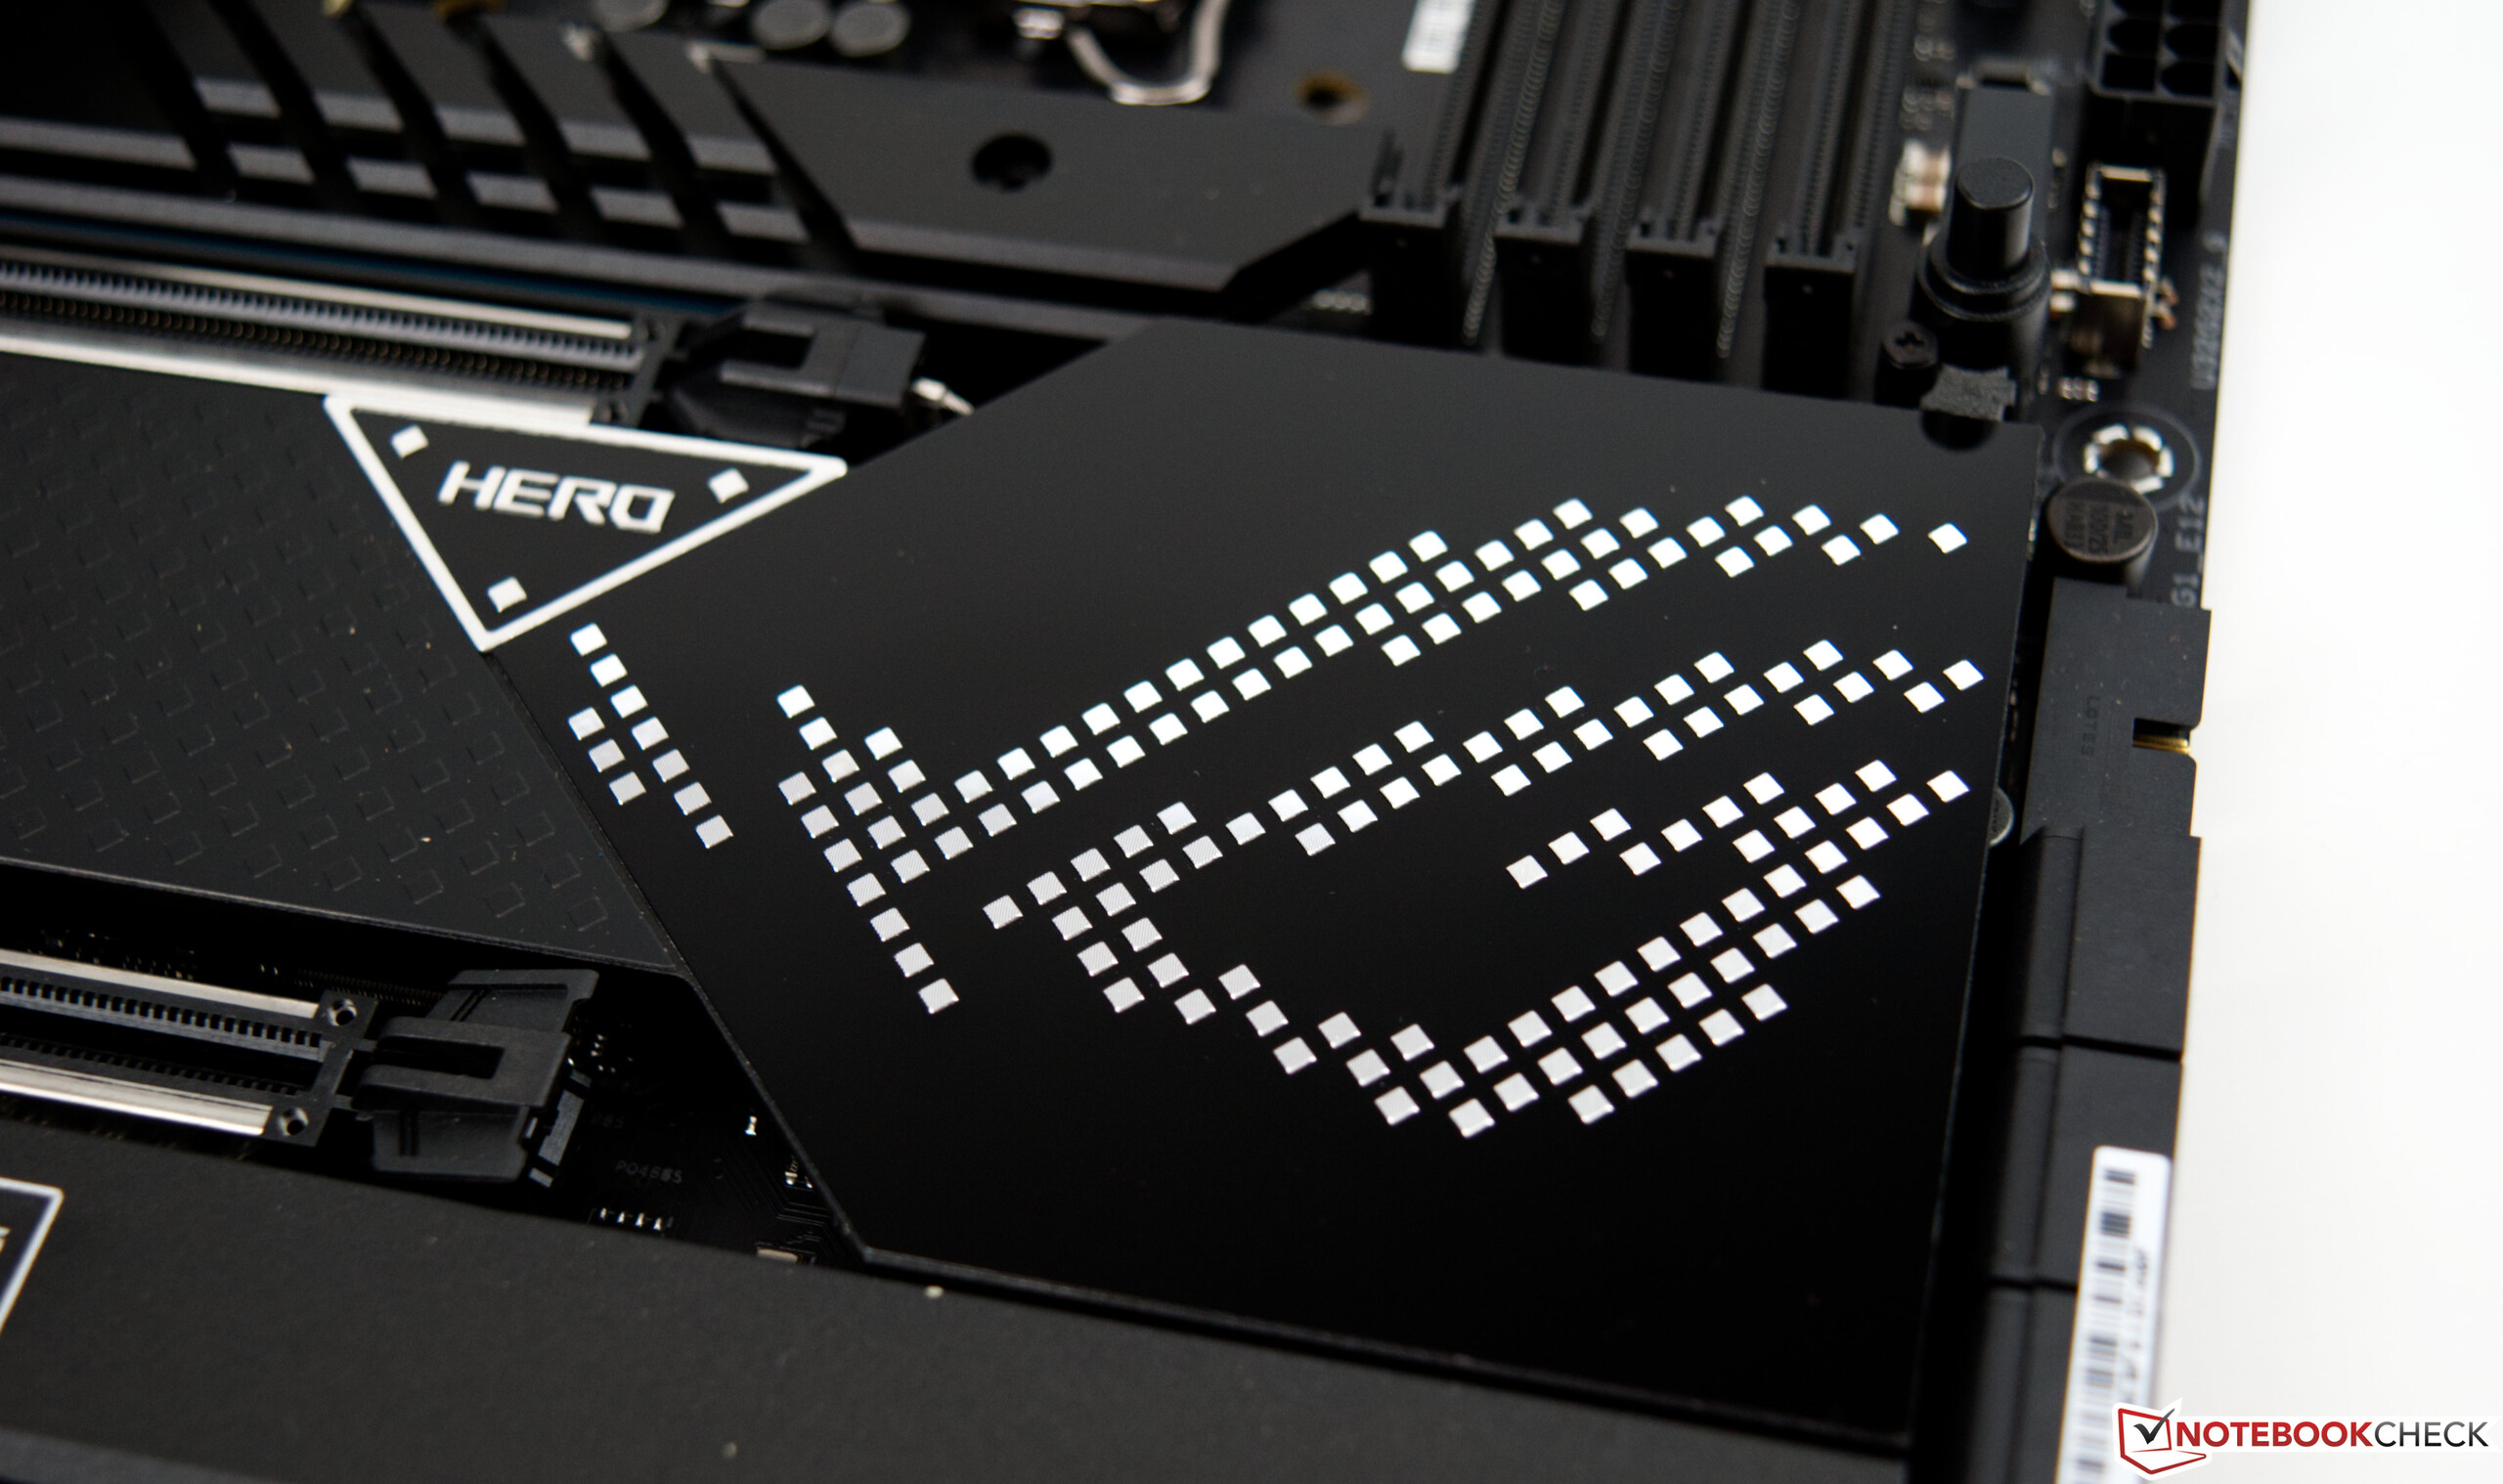
The Asus ROG Maximus Z690 Hero in Detail
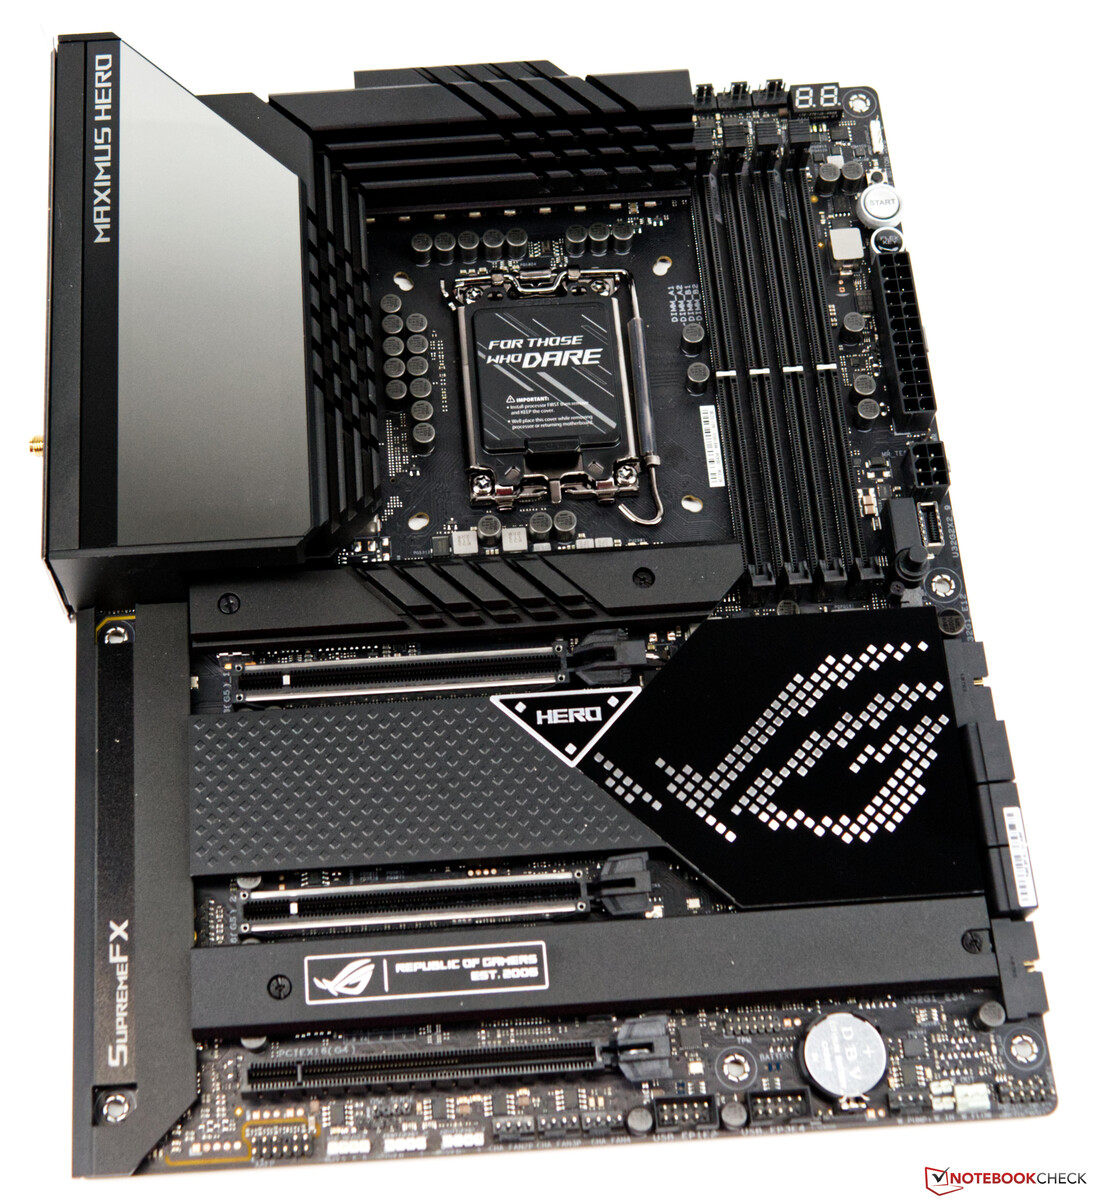
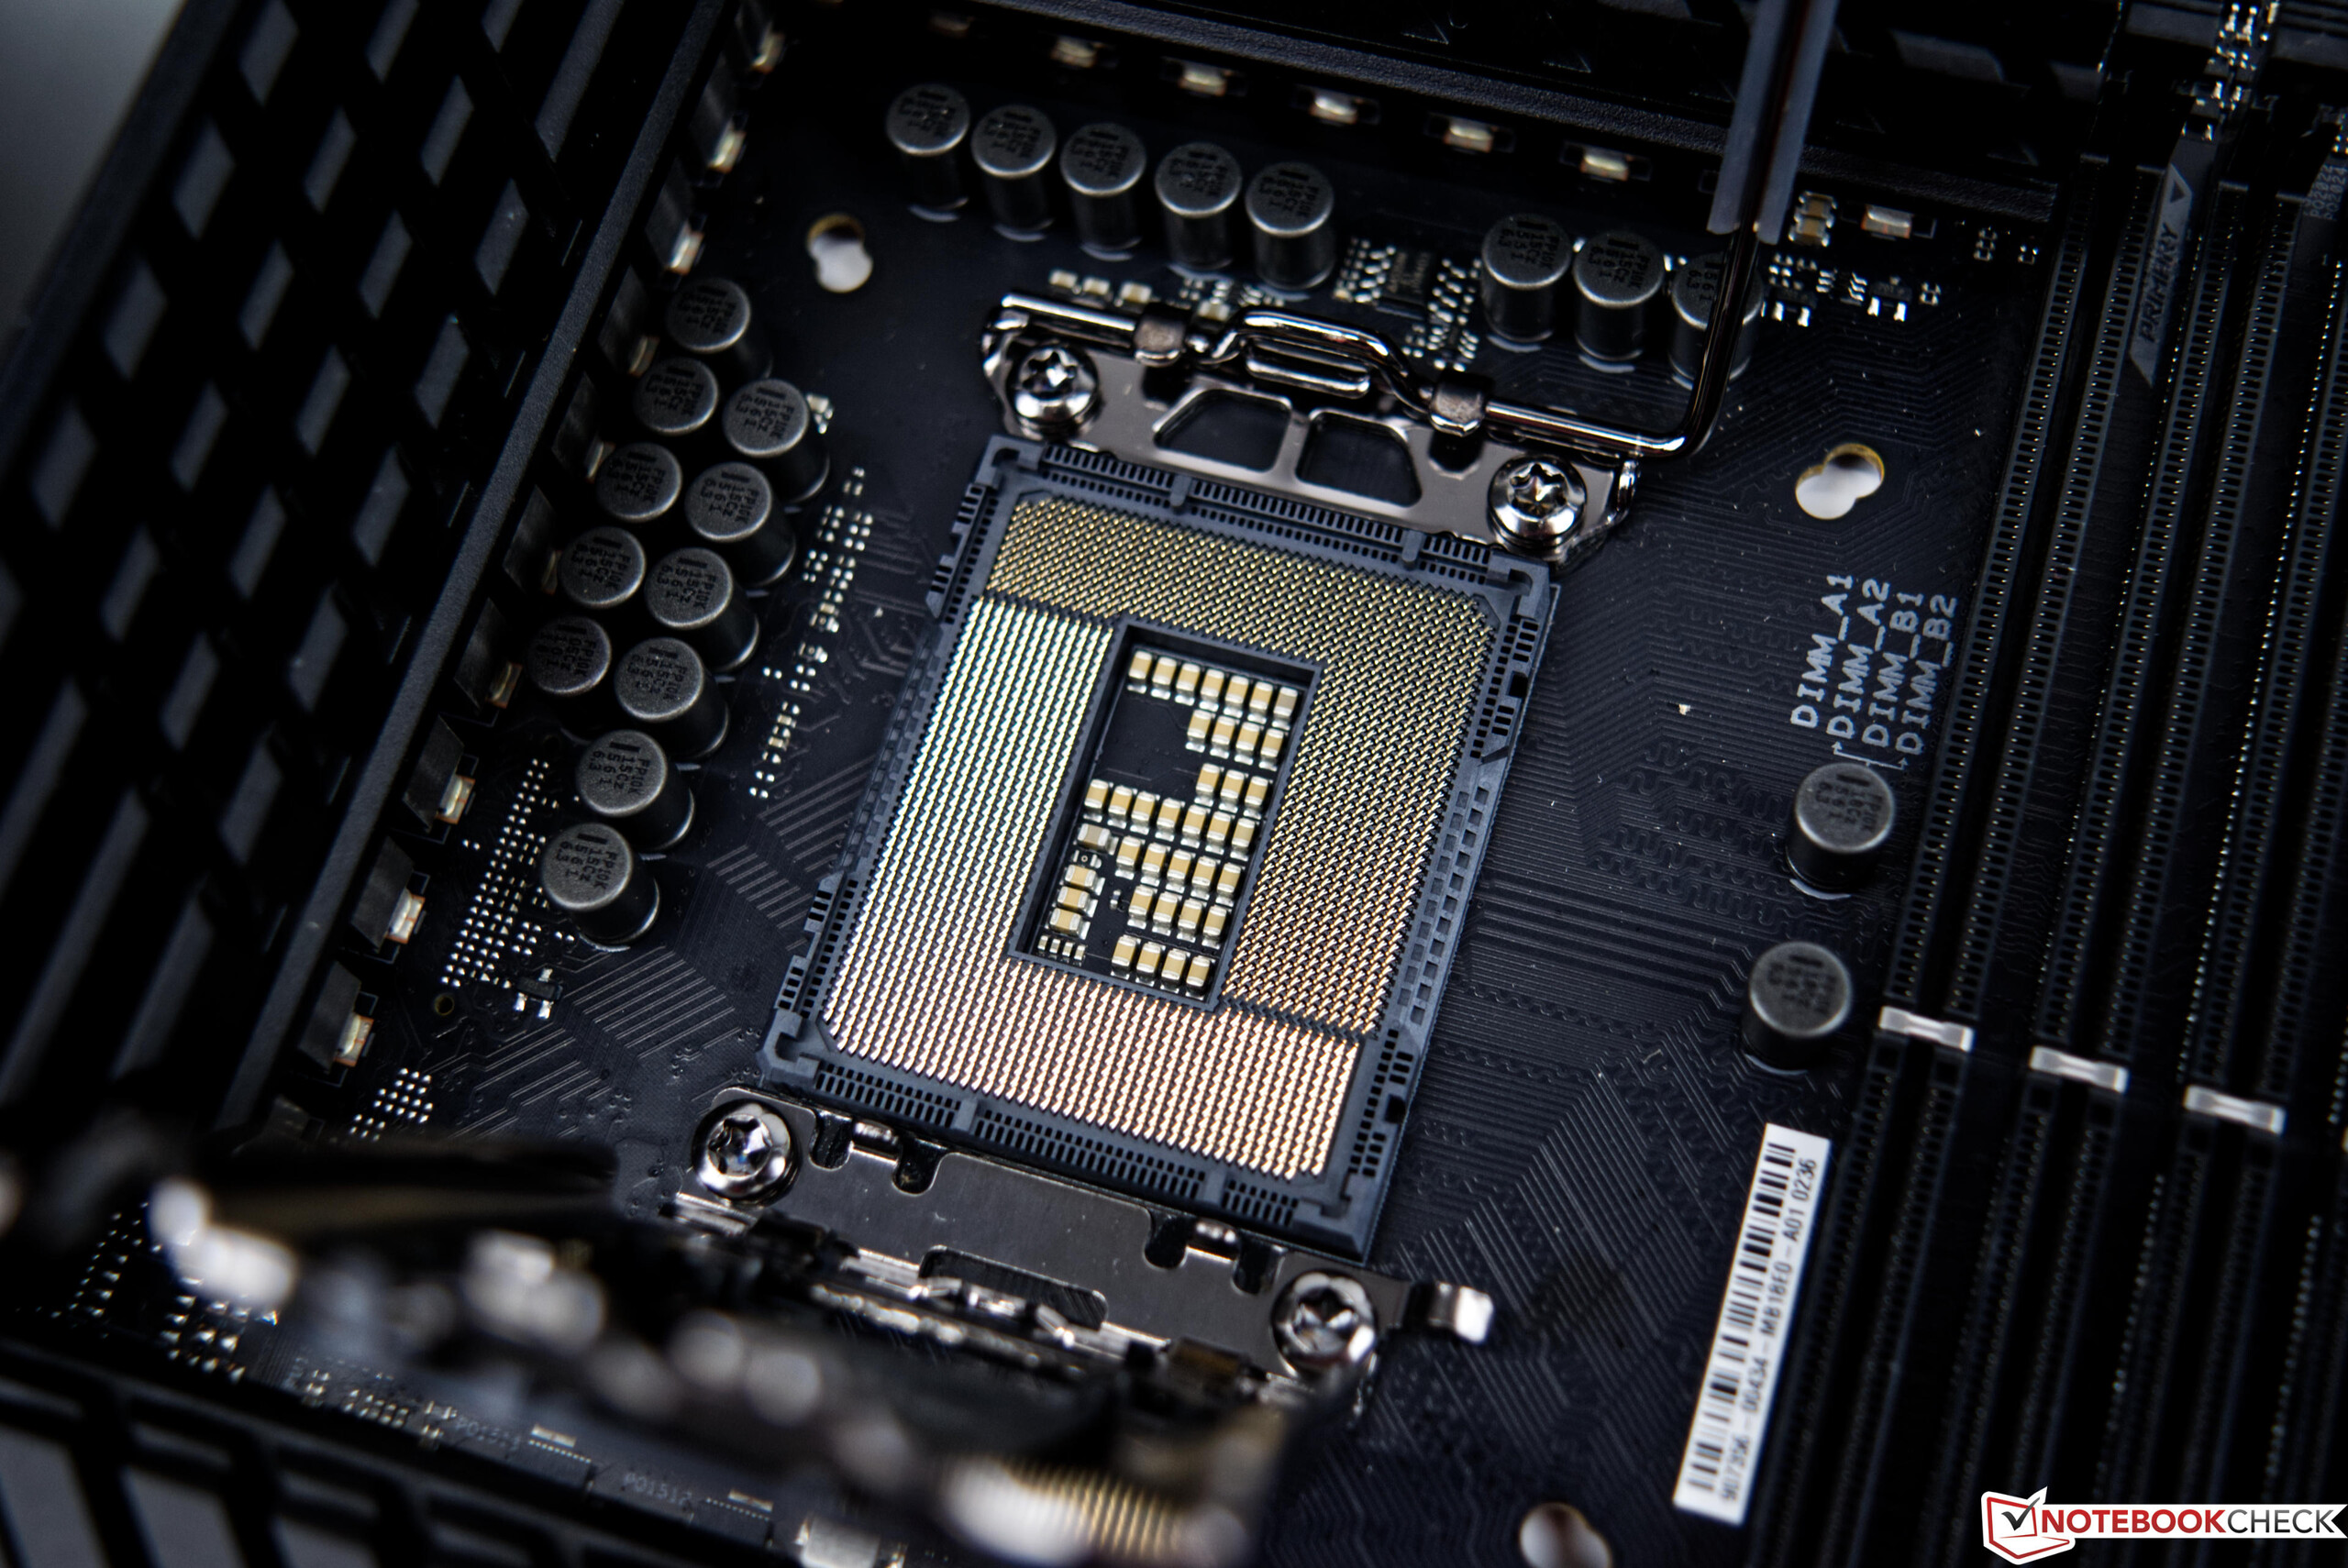
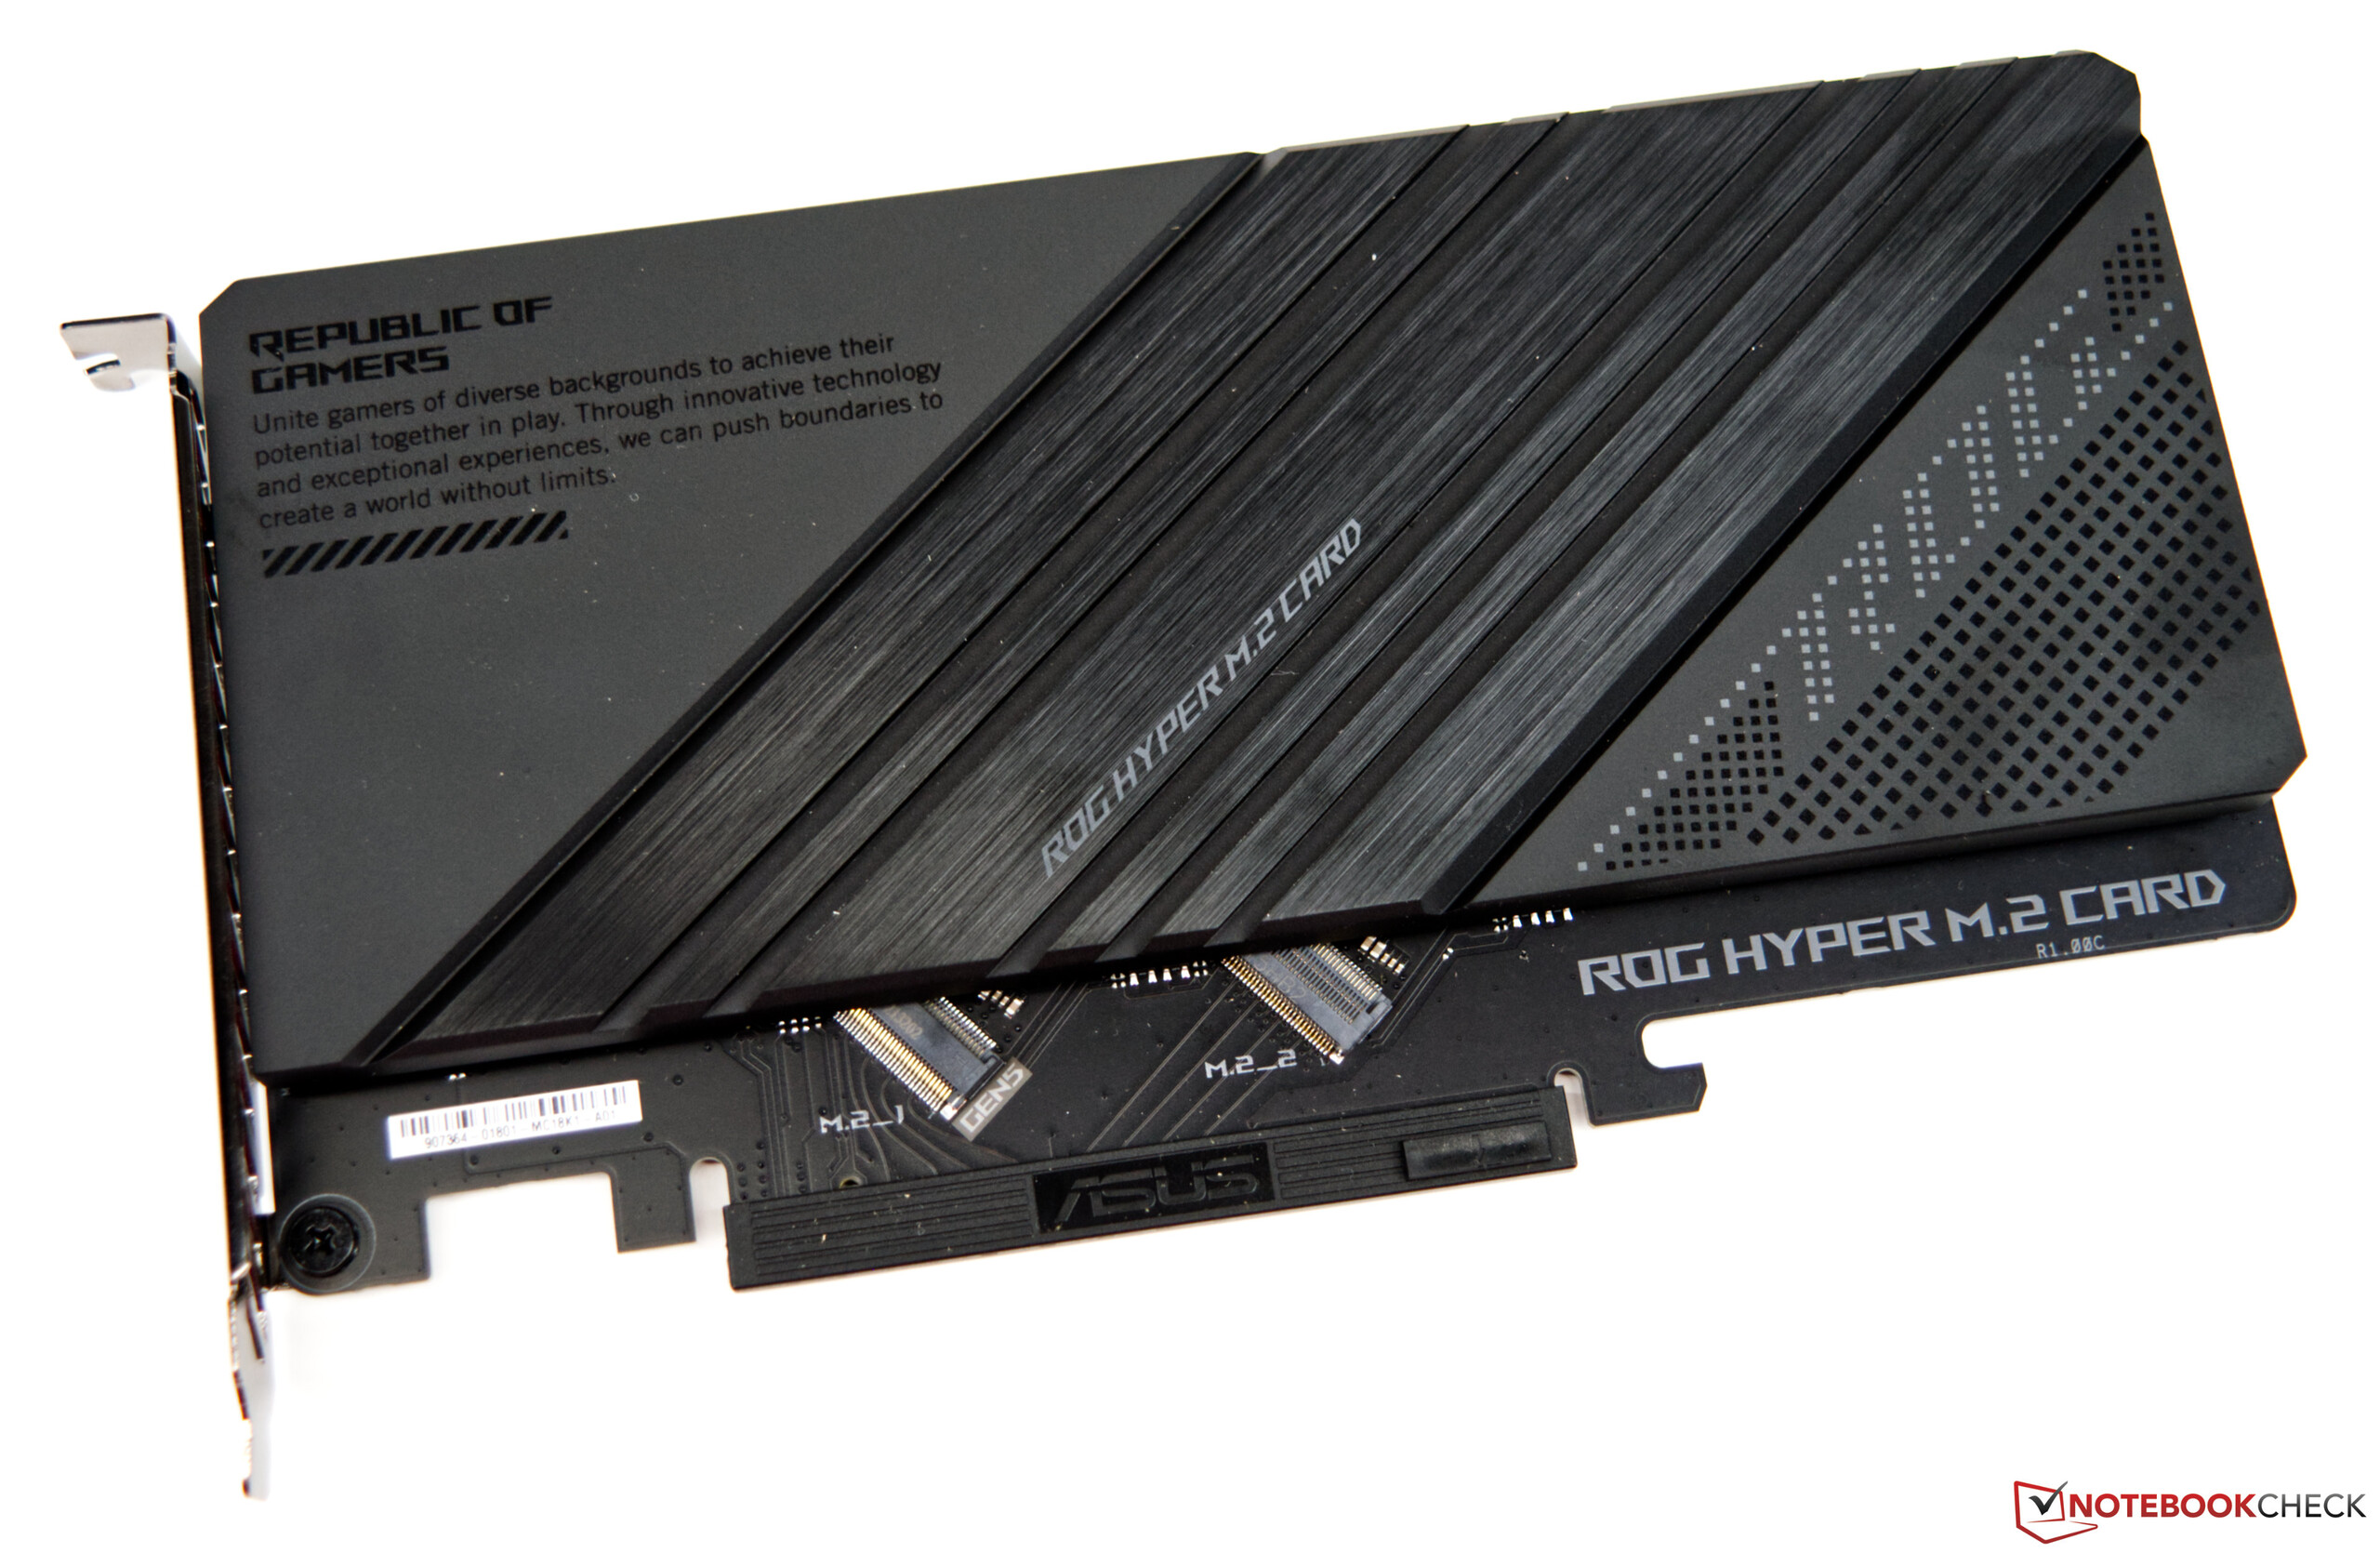
Asus has provided us in time with the ROG Maximus Z690 Hero, which serves the basis for this review. We thank Asus Germany for this loaner. The Asus ROG Maximus Z690 Hero looks very massive, which can be traced back to the large cooling system. In total, you can fit up to five M.2 SSDs on the mainboard, but then you have to install two of the five SSDs on a separate Hyper M.2 card. This will be able to use the full bandwidth of the Gen 5 support and is included as an accessory in the box. The new LGA 1700 socket stands out with the slightly elongated design. Many LGA 1200 cooling systems are also compatible with the new LGA 1700 socket, but you should make sure to ask the manufacturer directly. Sometimes other mounting brackets are offered for the LGA 1700 in order to ensure optimal contact pressure on the CPU.
You can install up to 128 GB of the new DDR5 working memory. WiFi, 2.5 Gbit LAN, and a total of 20 USB ports ensure that you have sufficient connectivity.
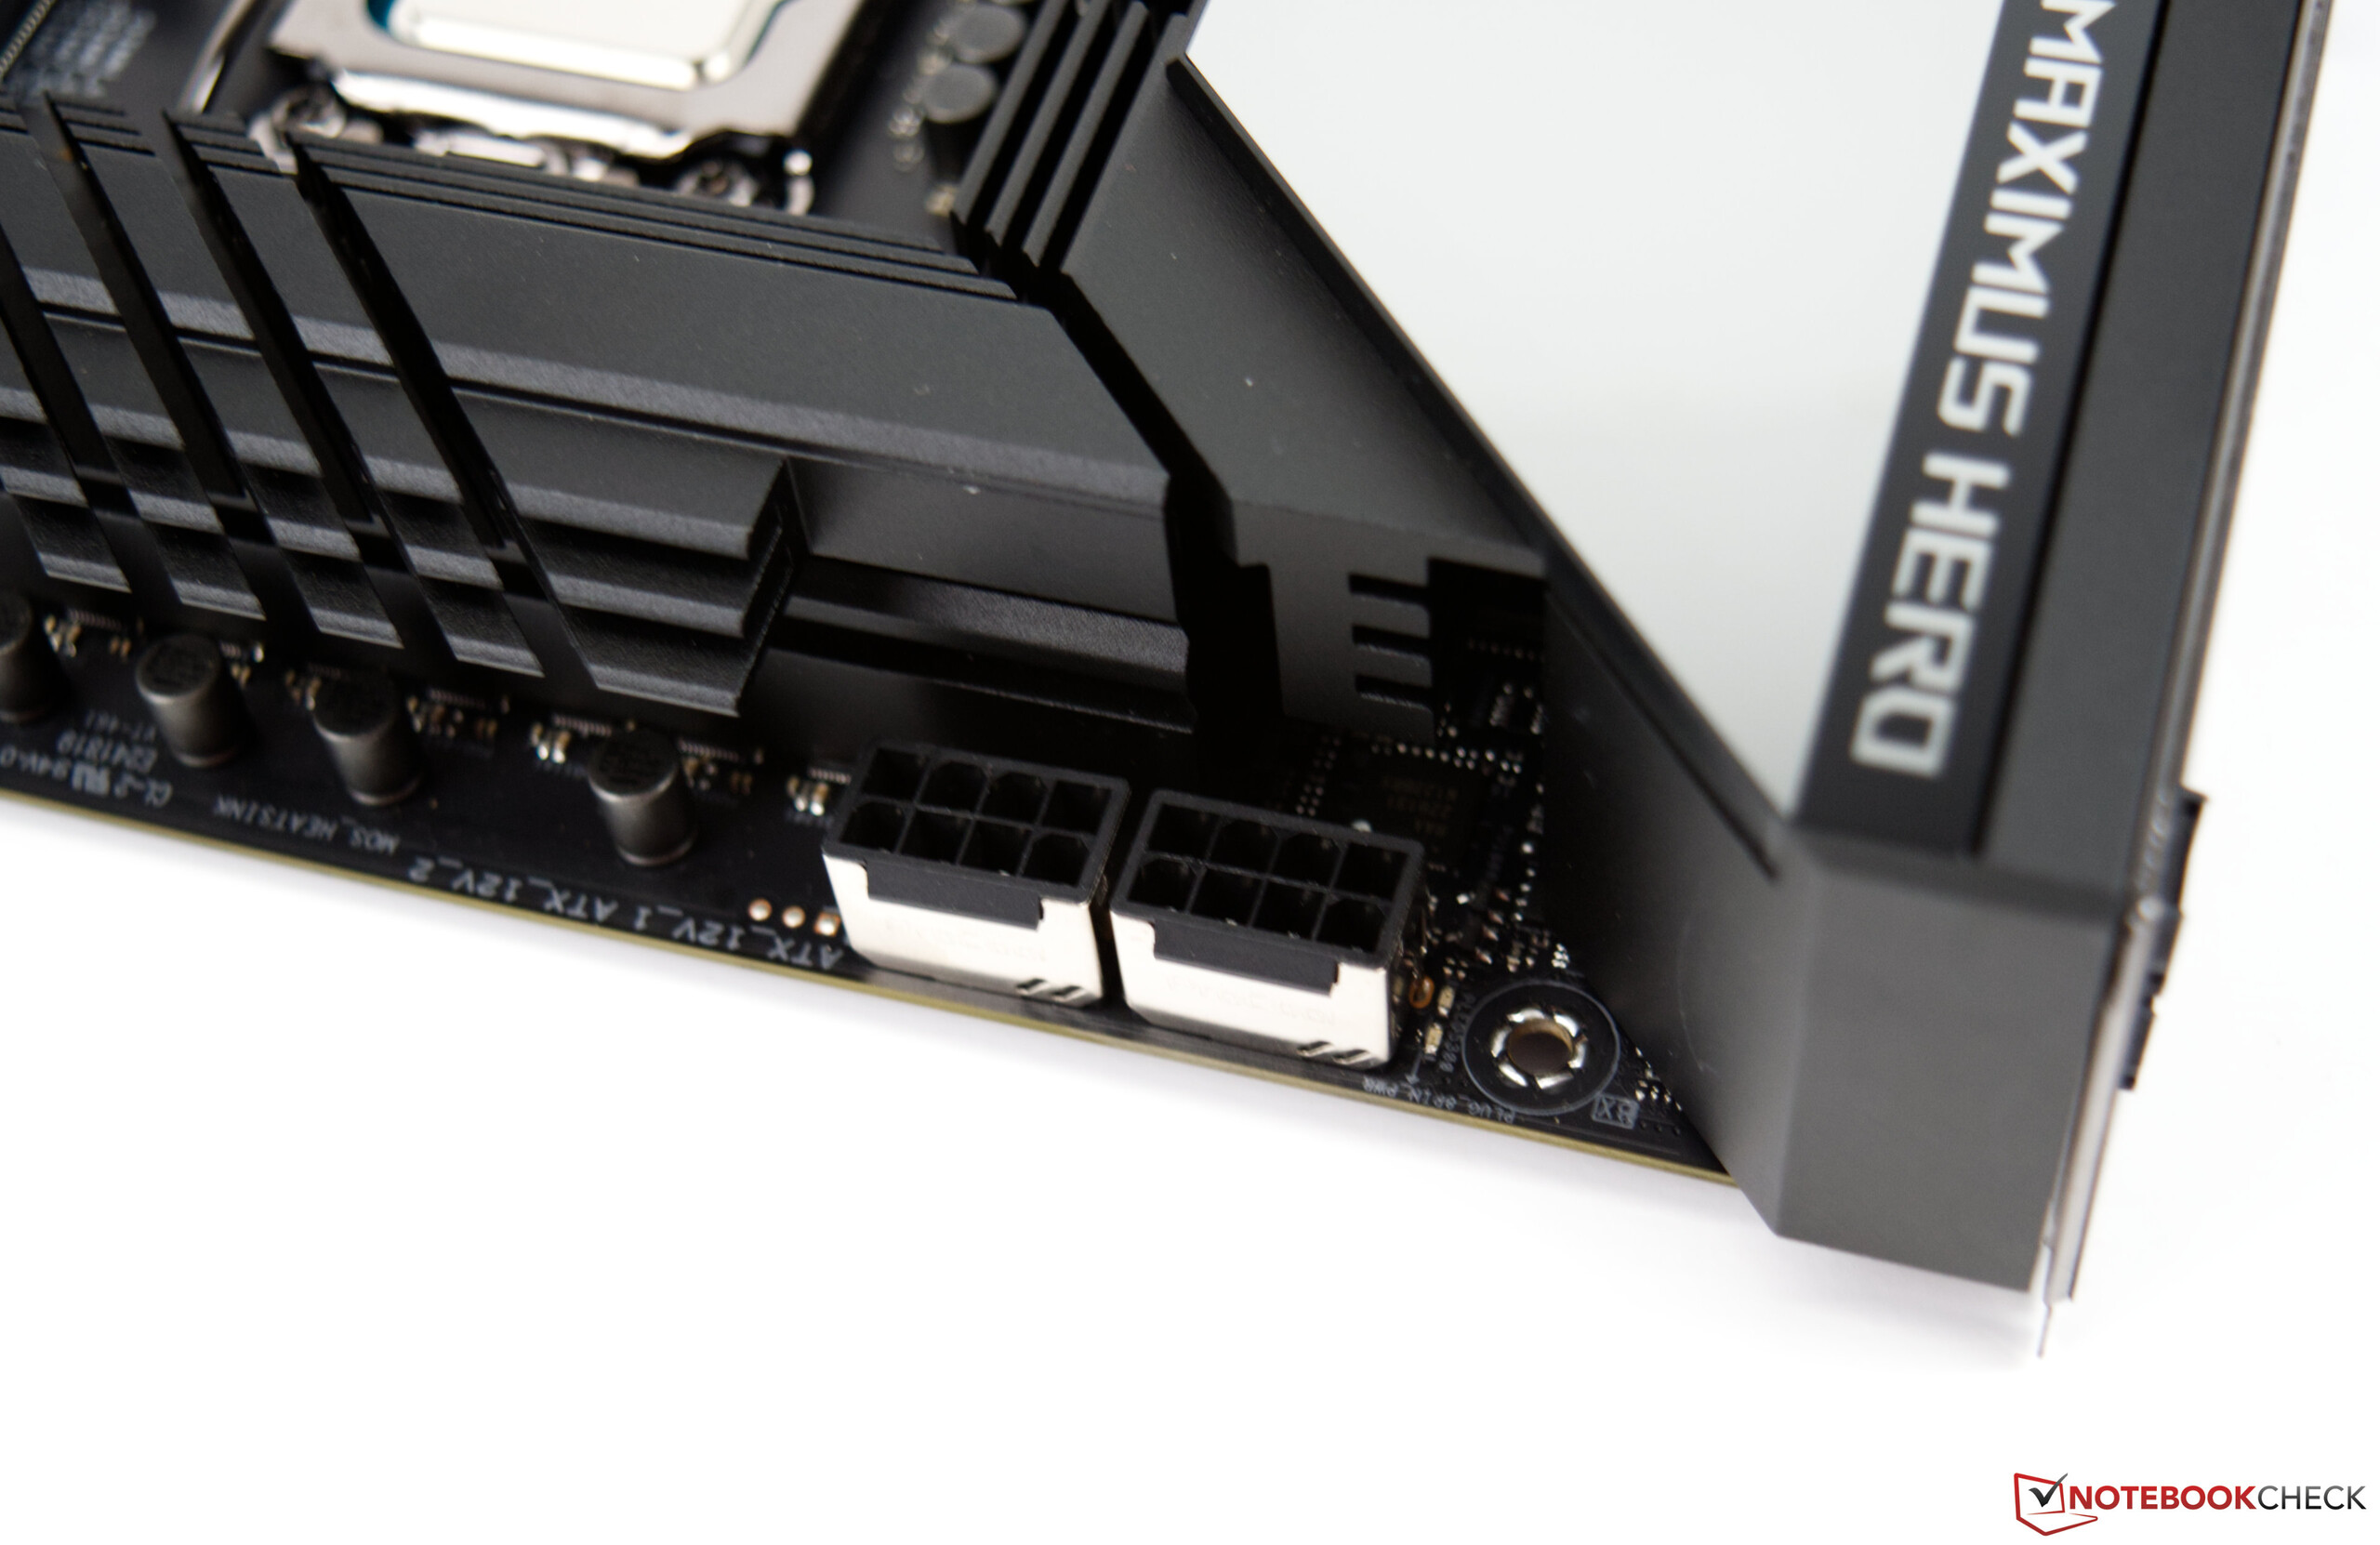
Two 8-pin power connectors not far from the socket provide power to the CPU. The voltage transformers are covered by a very massive cooling block including a heat pipe. In addition there is an attractive Polymo lightning panel above the I/O Shield, which is quite a looker.
Processor Benchmarks
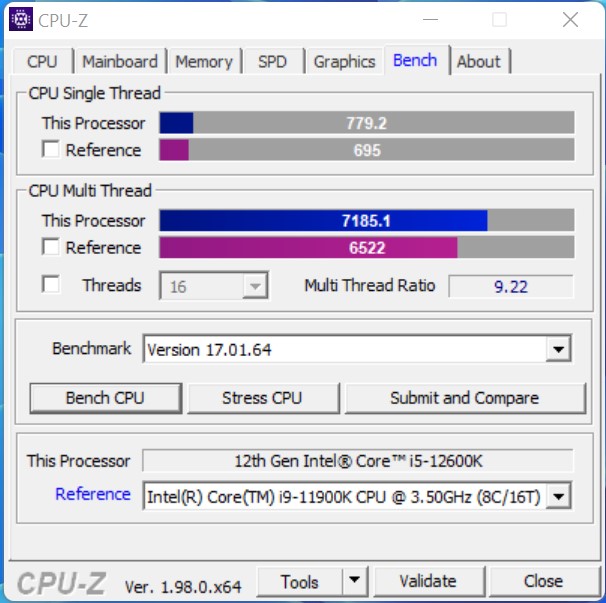
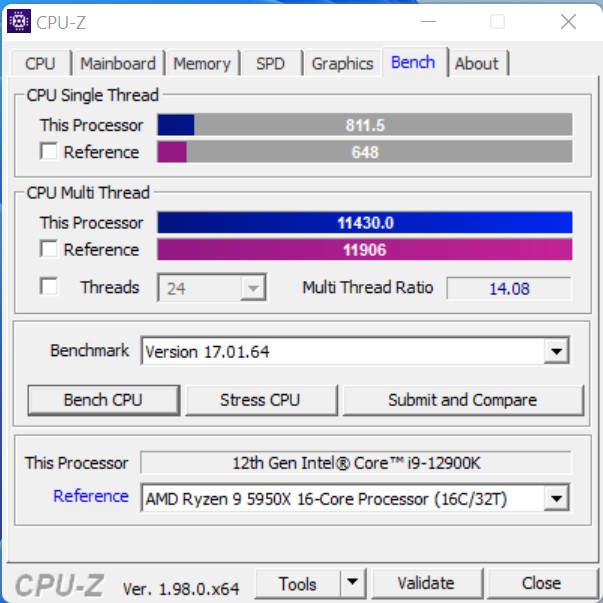
Intel is able to keep the promise of a significant performance increase compared to the Rocket Lake-S processors. In the performance rating, which reflects the performance difference across all the listed benchmarks, the Intel Core i9-12900K is able to clearly place at the top. Compared to the AMD Ryzen 9 5900X, which also offers 24 threads in total, the new flag ship from Intel is ahead by 13 percentage points. If we take the Intel Core i9-11900K as the reference, the Core i9-12900K runs 23% faster. While the differences vary slightly in the separate benchmarks, this is due to the corresponding CPU architecture.
We see a similar picture with the smaller Intel Core i5-12600K. If we use the AMD Ryzen 7 5800X as competitor since it has the same amounts of threads, both competitors perform at eye level in the cumulative benchmark results. On the other hand, the Zen3 processor has a tough time competing with the powerful single-core performance of the Intel. But you shouldn't write off AMD yet, since the Zen3 CPUs have already been on the market for a year and according to some rumors, the successor is already in the starting blocks. When that is available, the dies will be cast anew and Rocket Lake-S has to prove itself again.
Due to the PL1 = PL2 discussion, we took Cinebench R23 and performed another run with a PL1 value limited to 125 watts. There were no changes in the result worth mention. The differences were minimal and can be considered as being within the measurement tolerances.
It was clear that Intel would make a significant jump with the new design of the P and E-cores. With this, Intel is also able to close the gap to the 12 and 16 core processors from AMD, which was not possible with the Core i9-11900K.
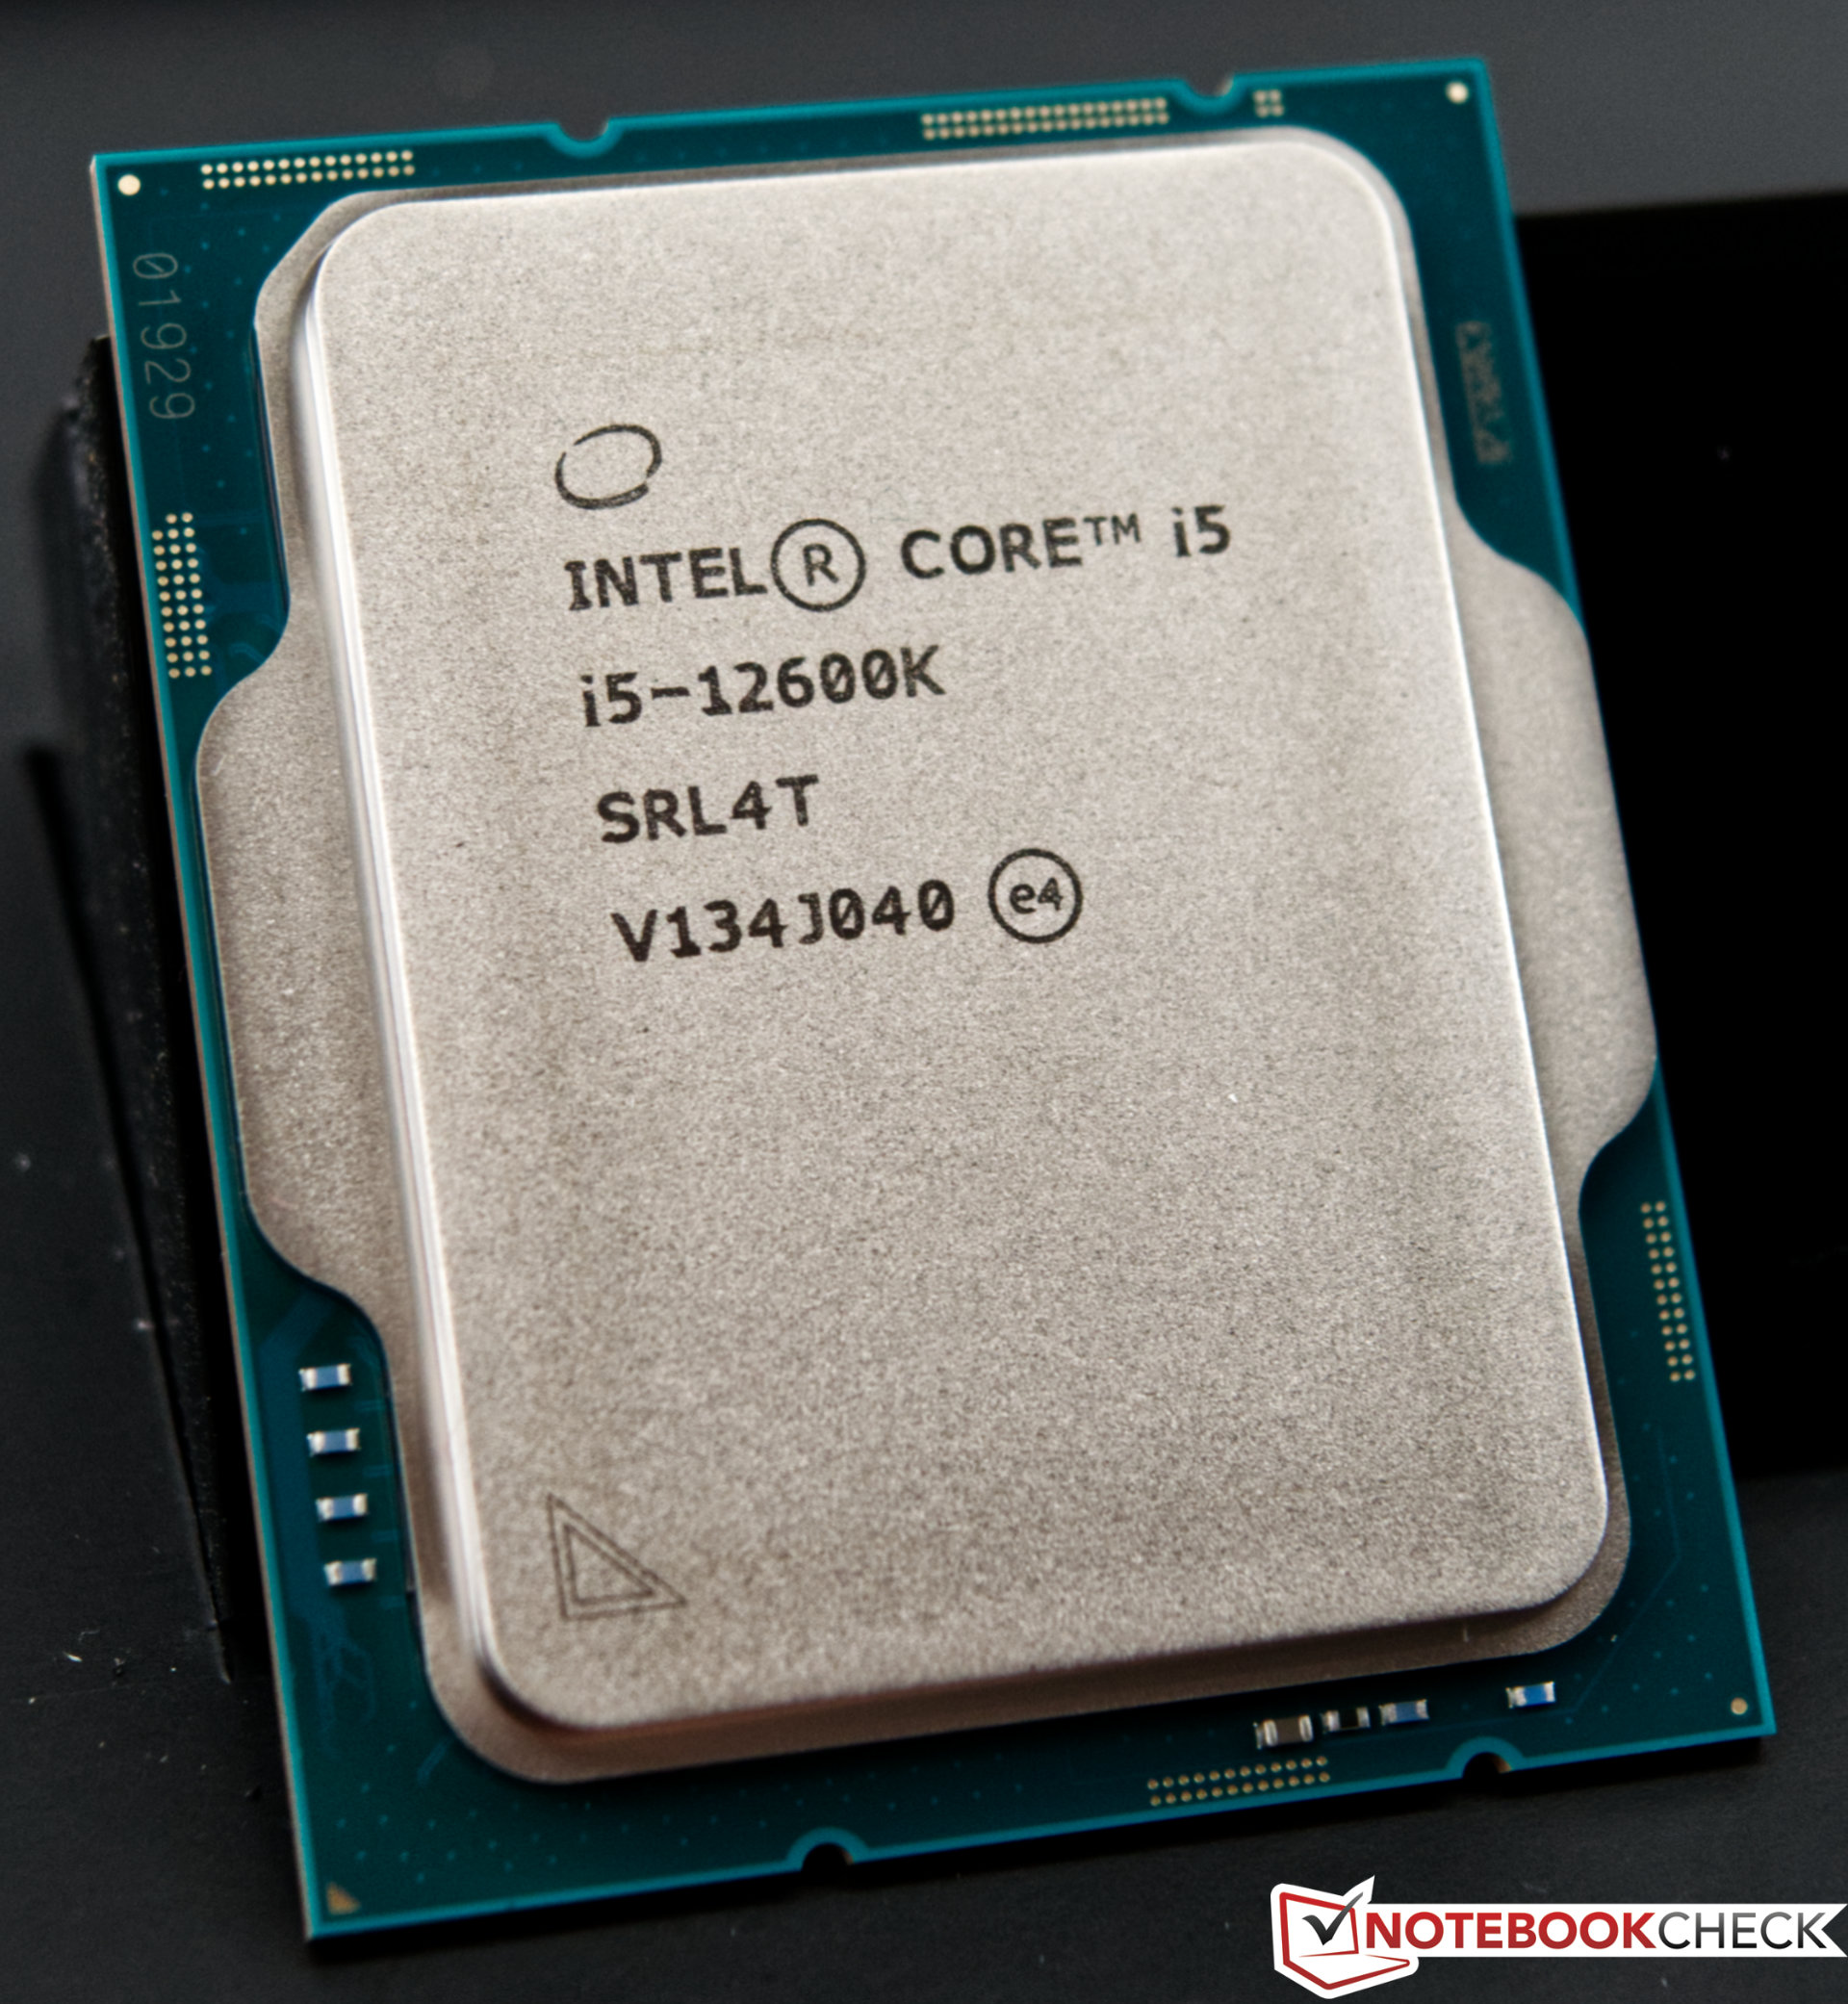
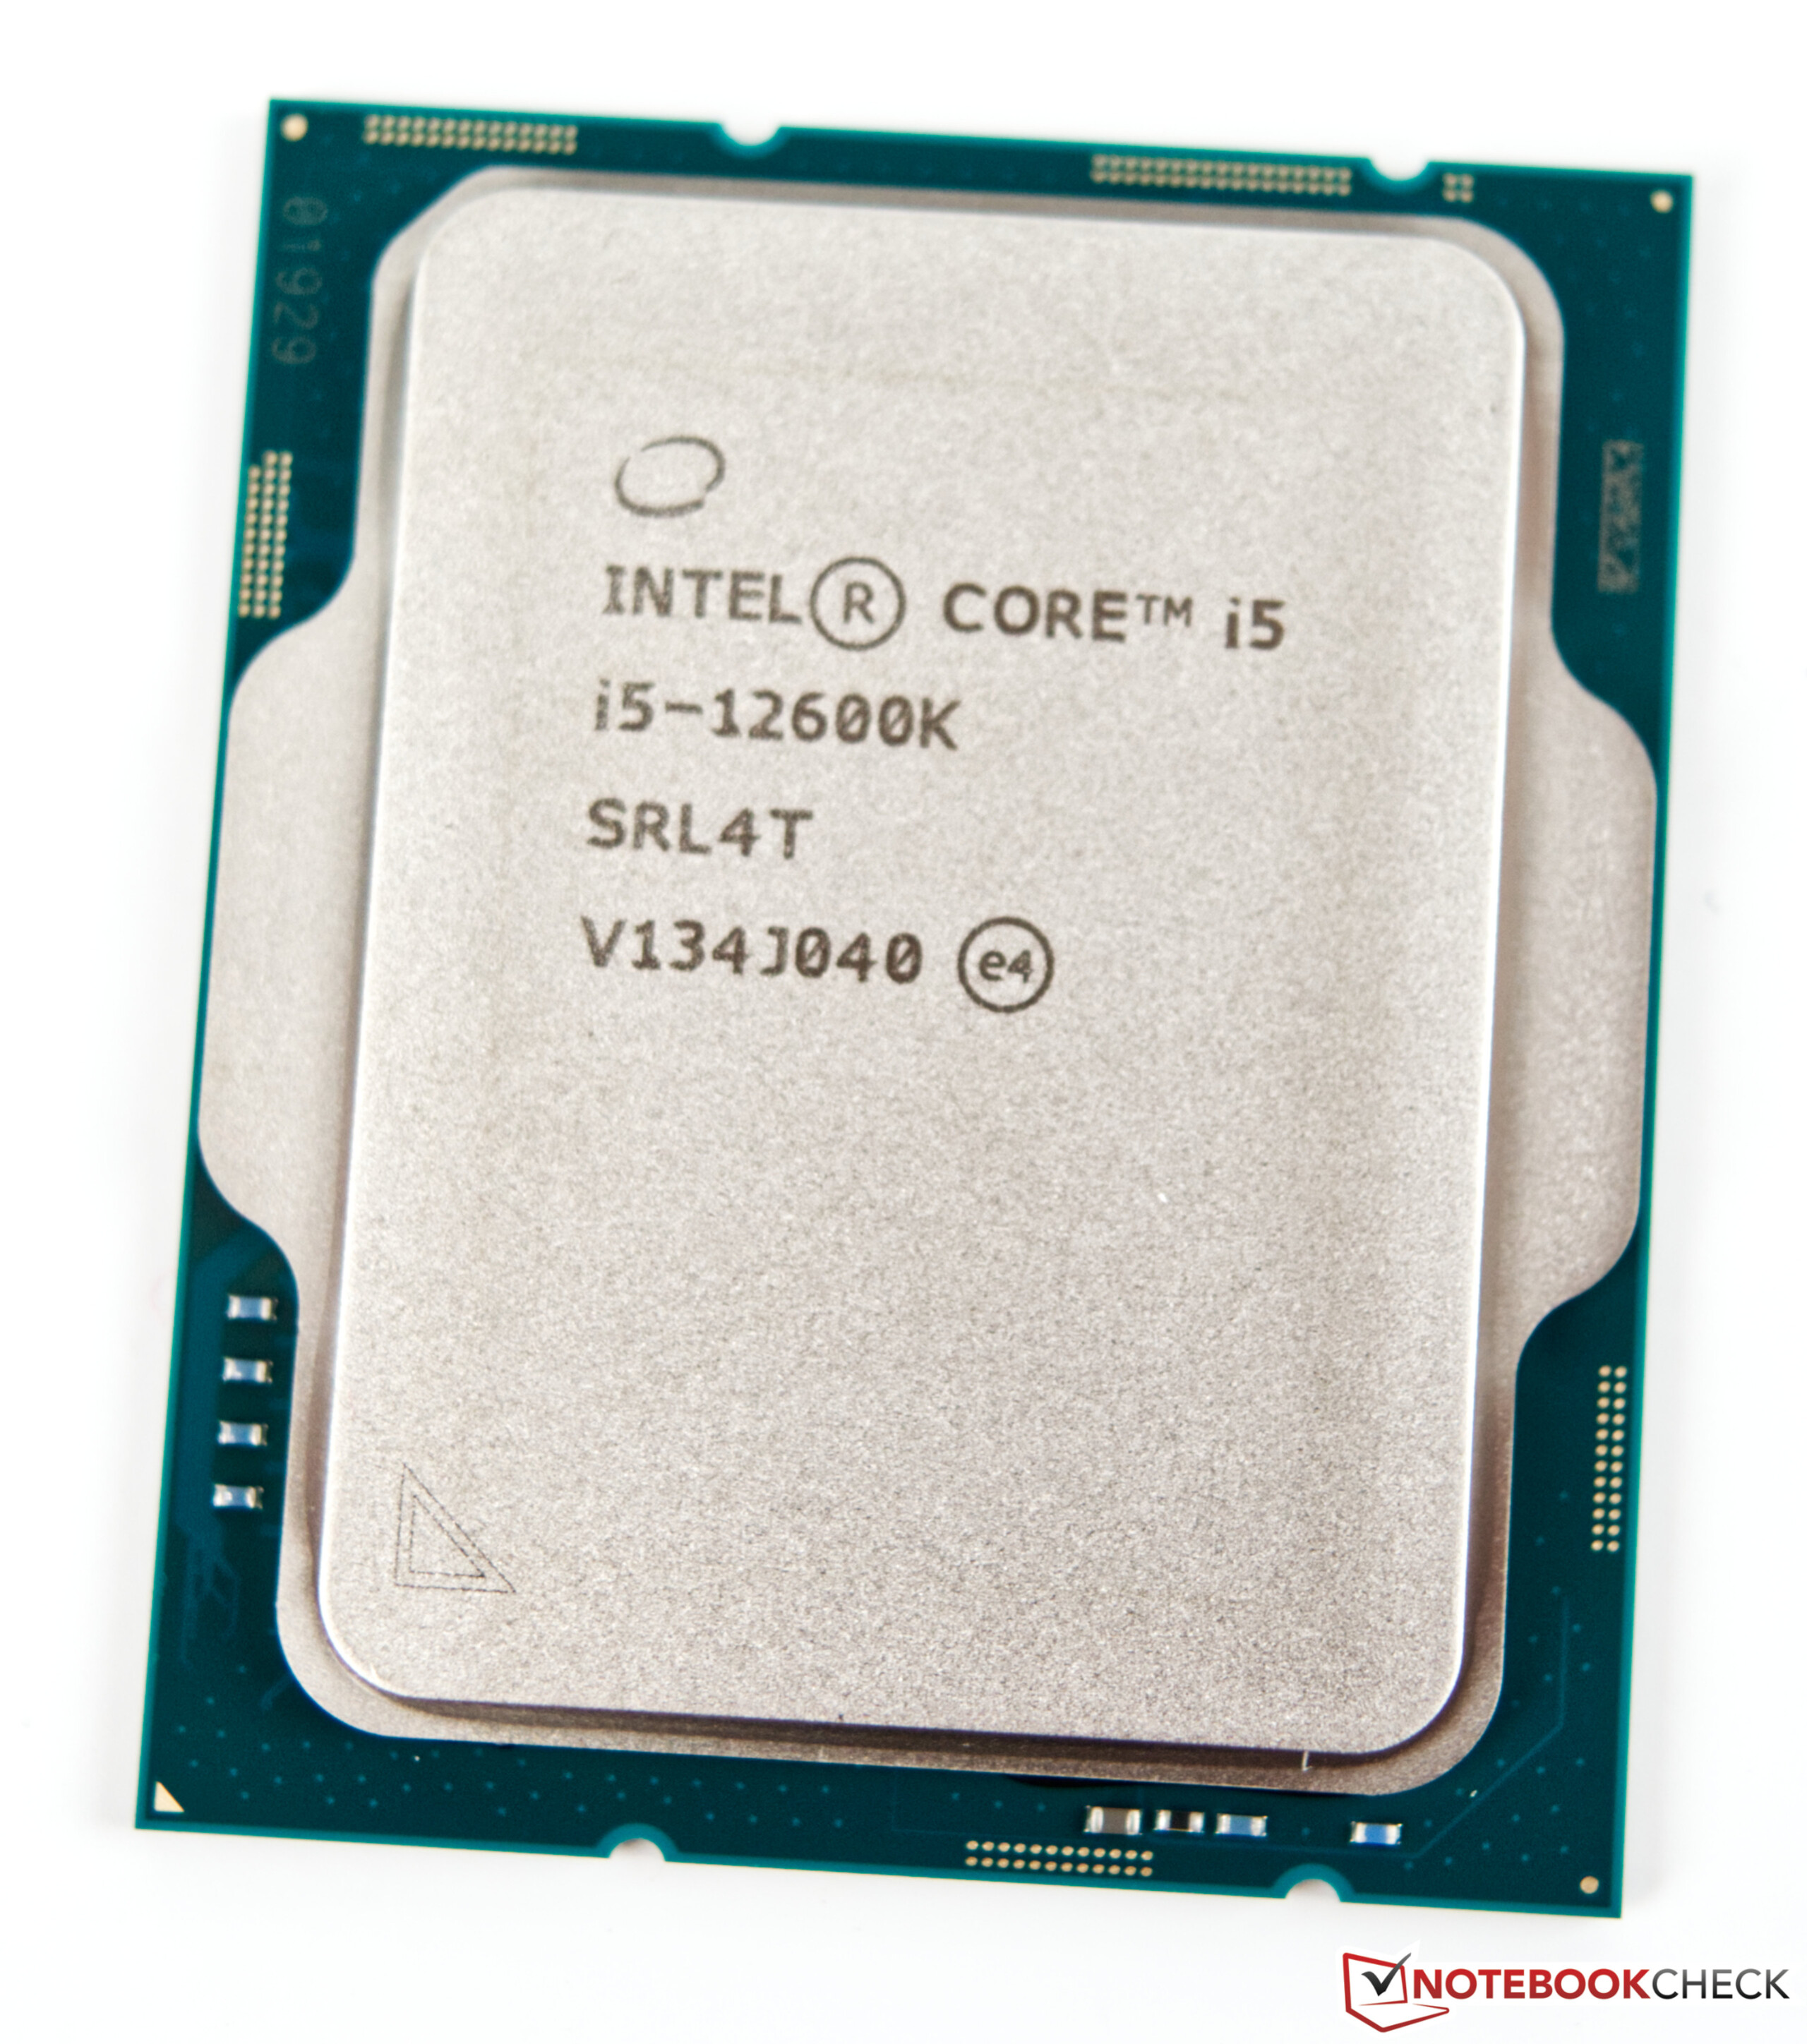
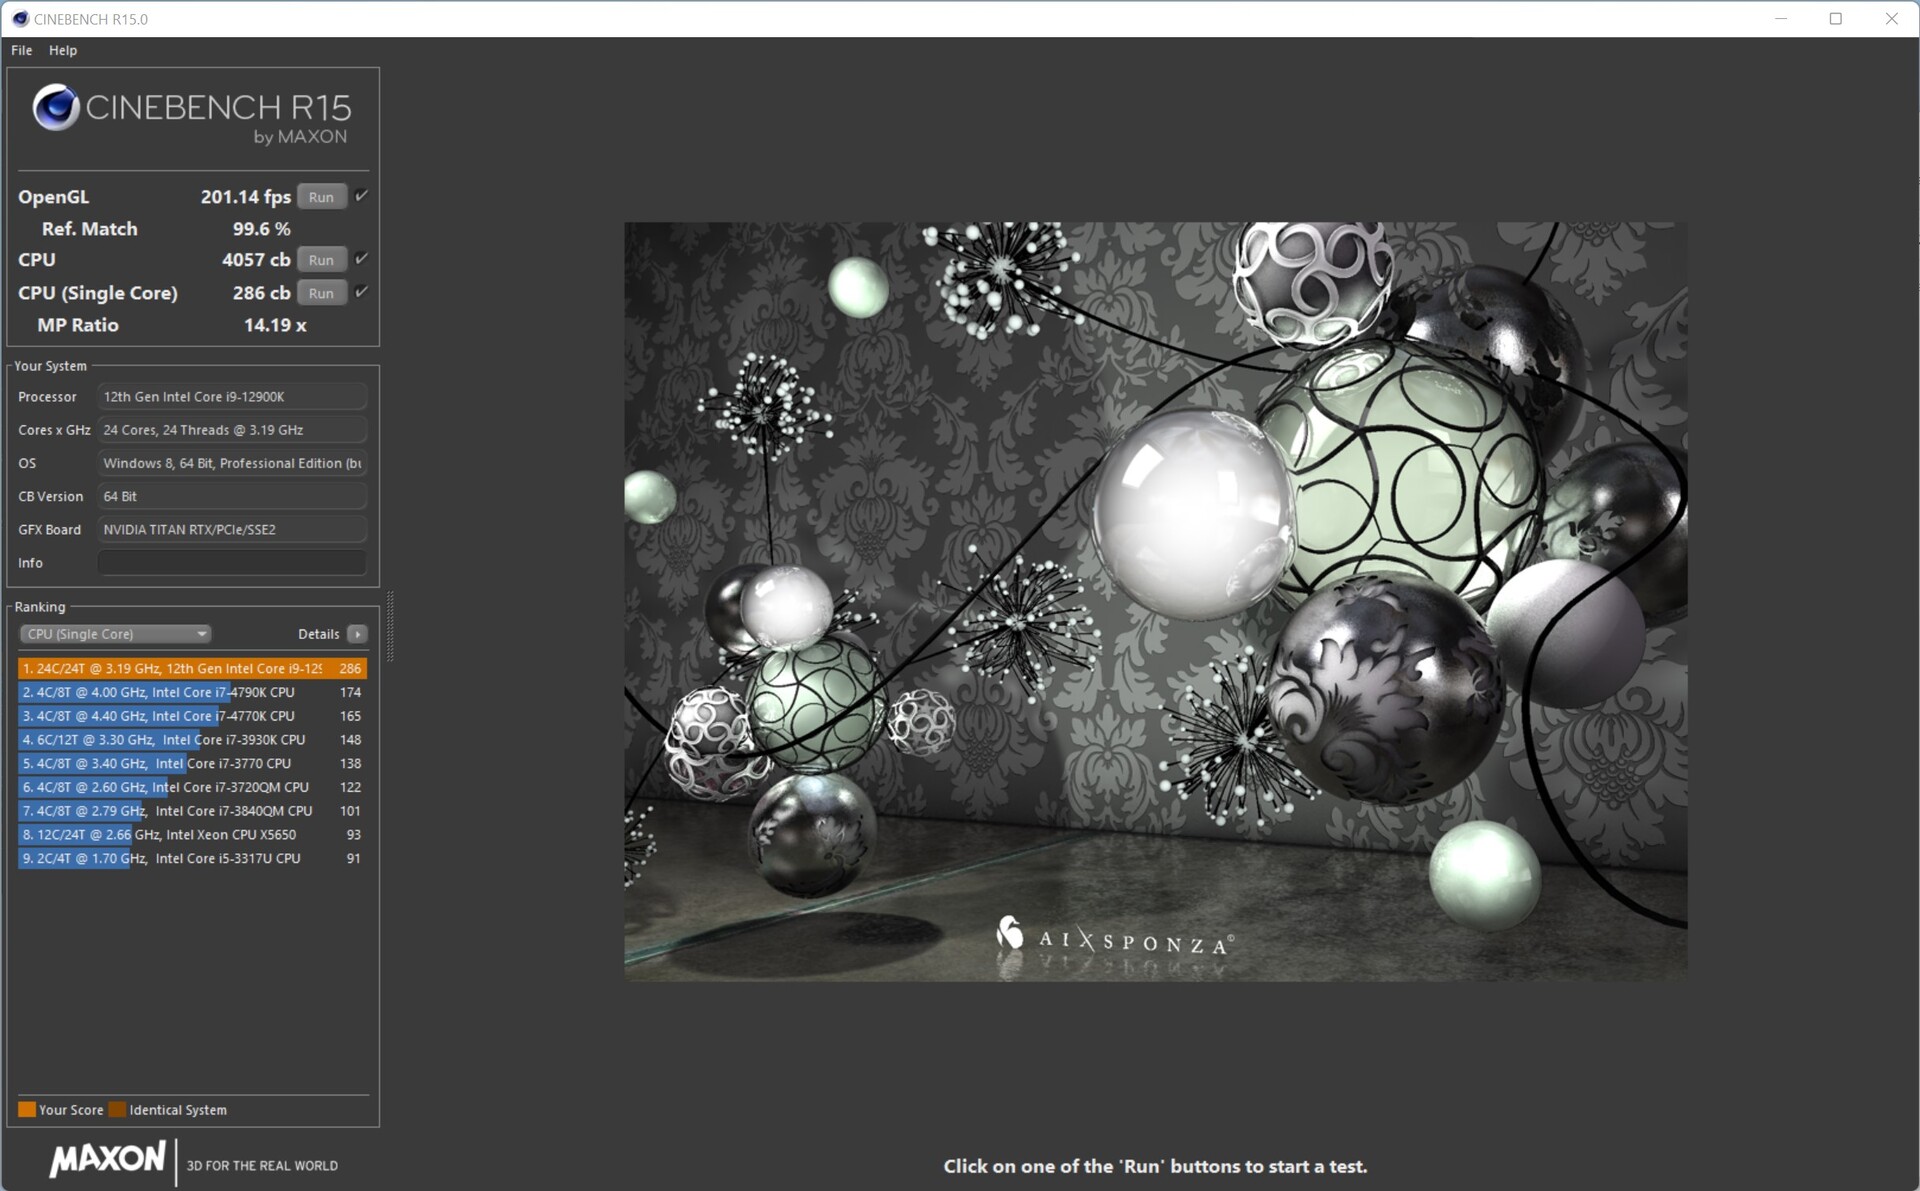
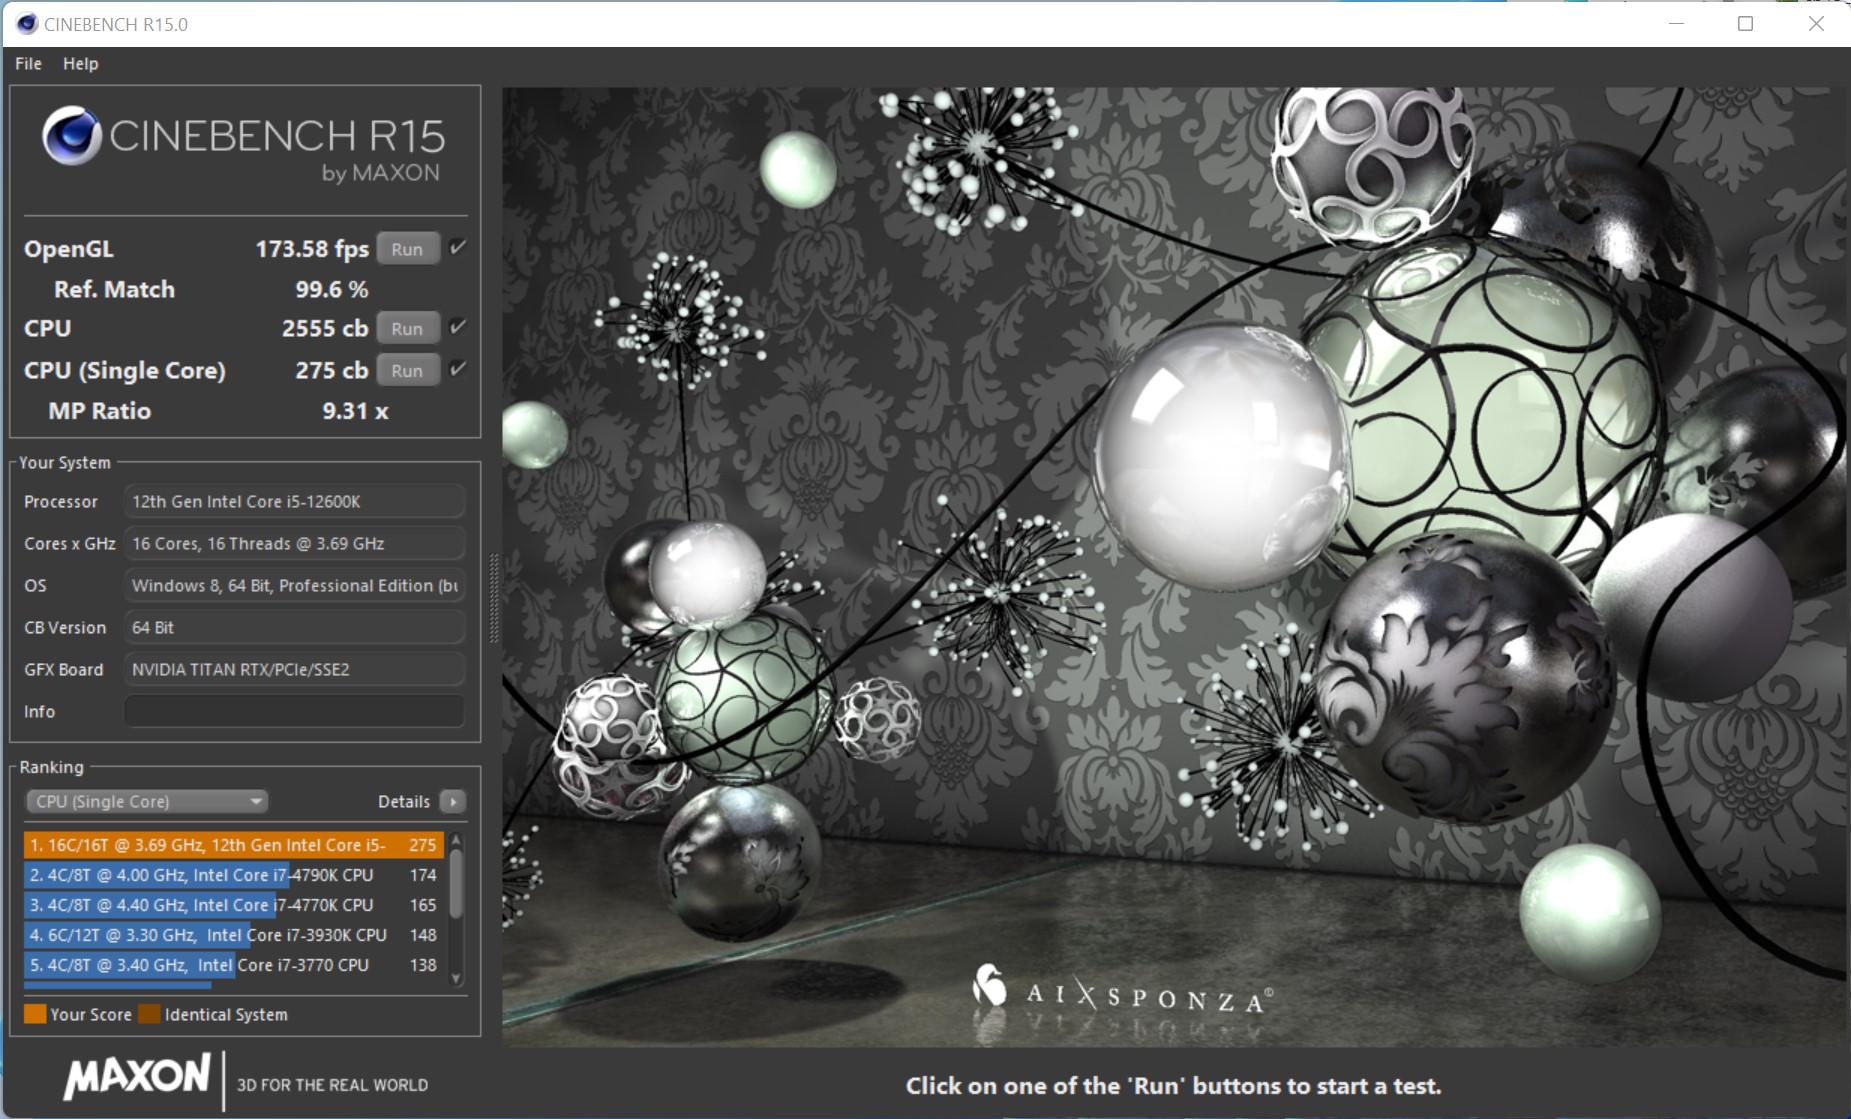
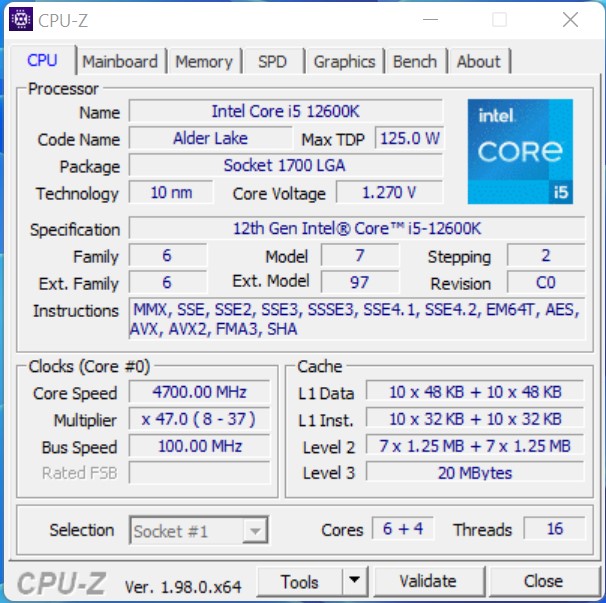
Intel Core i5-12600K
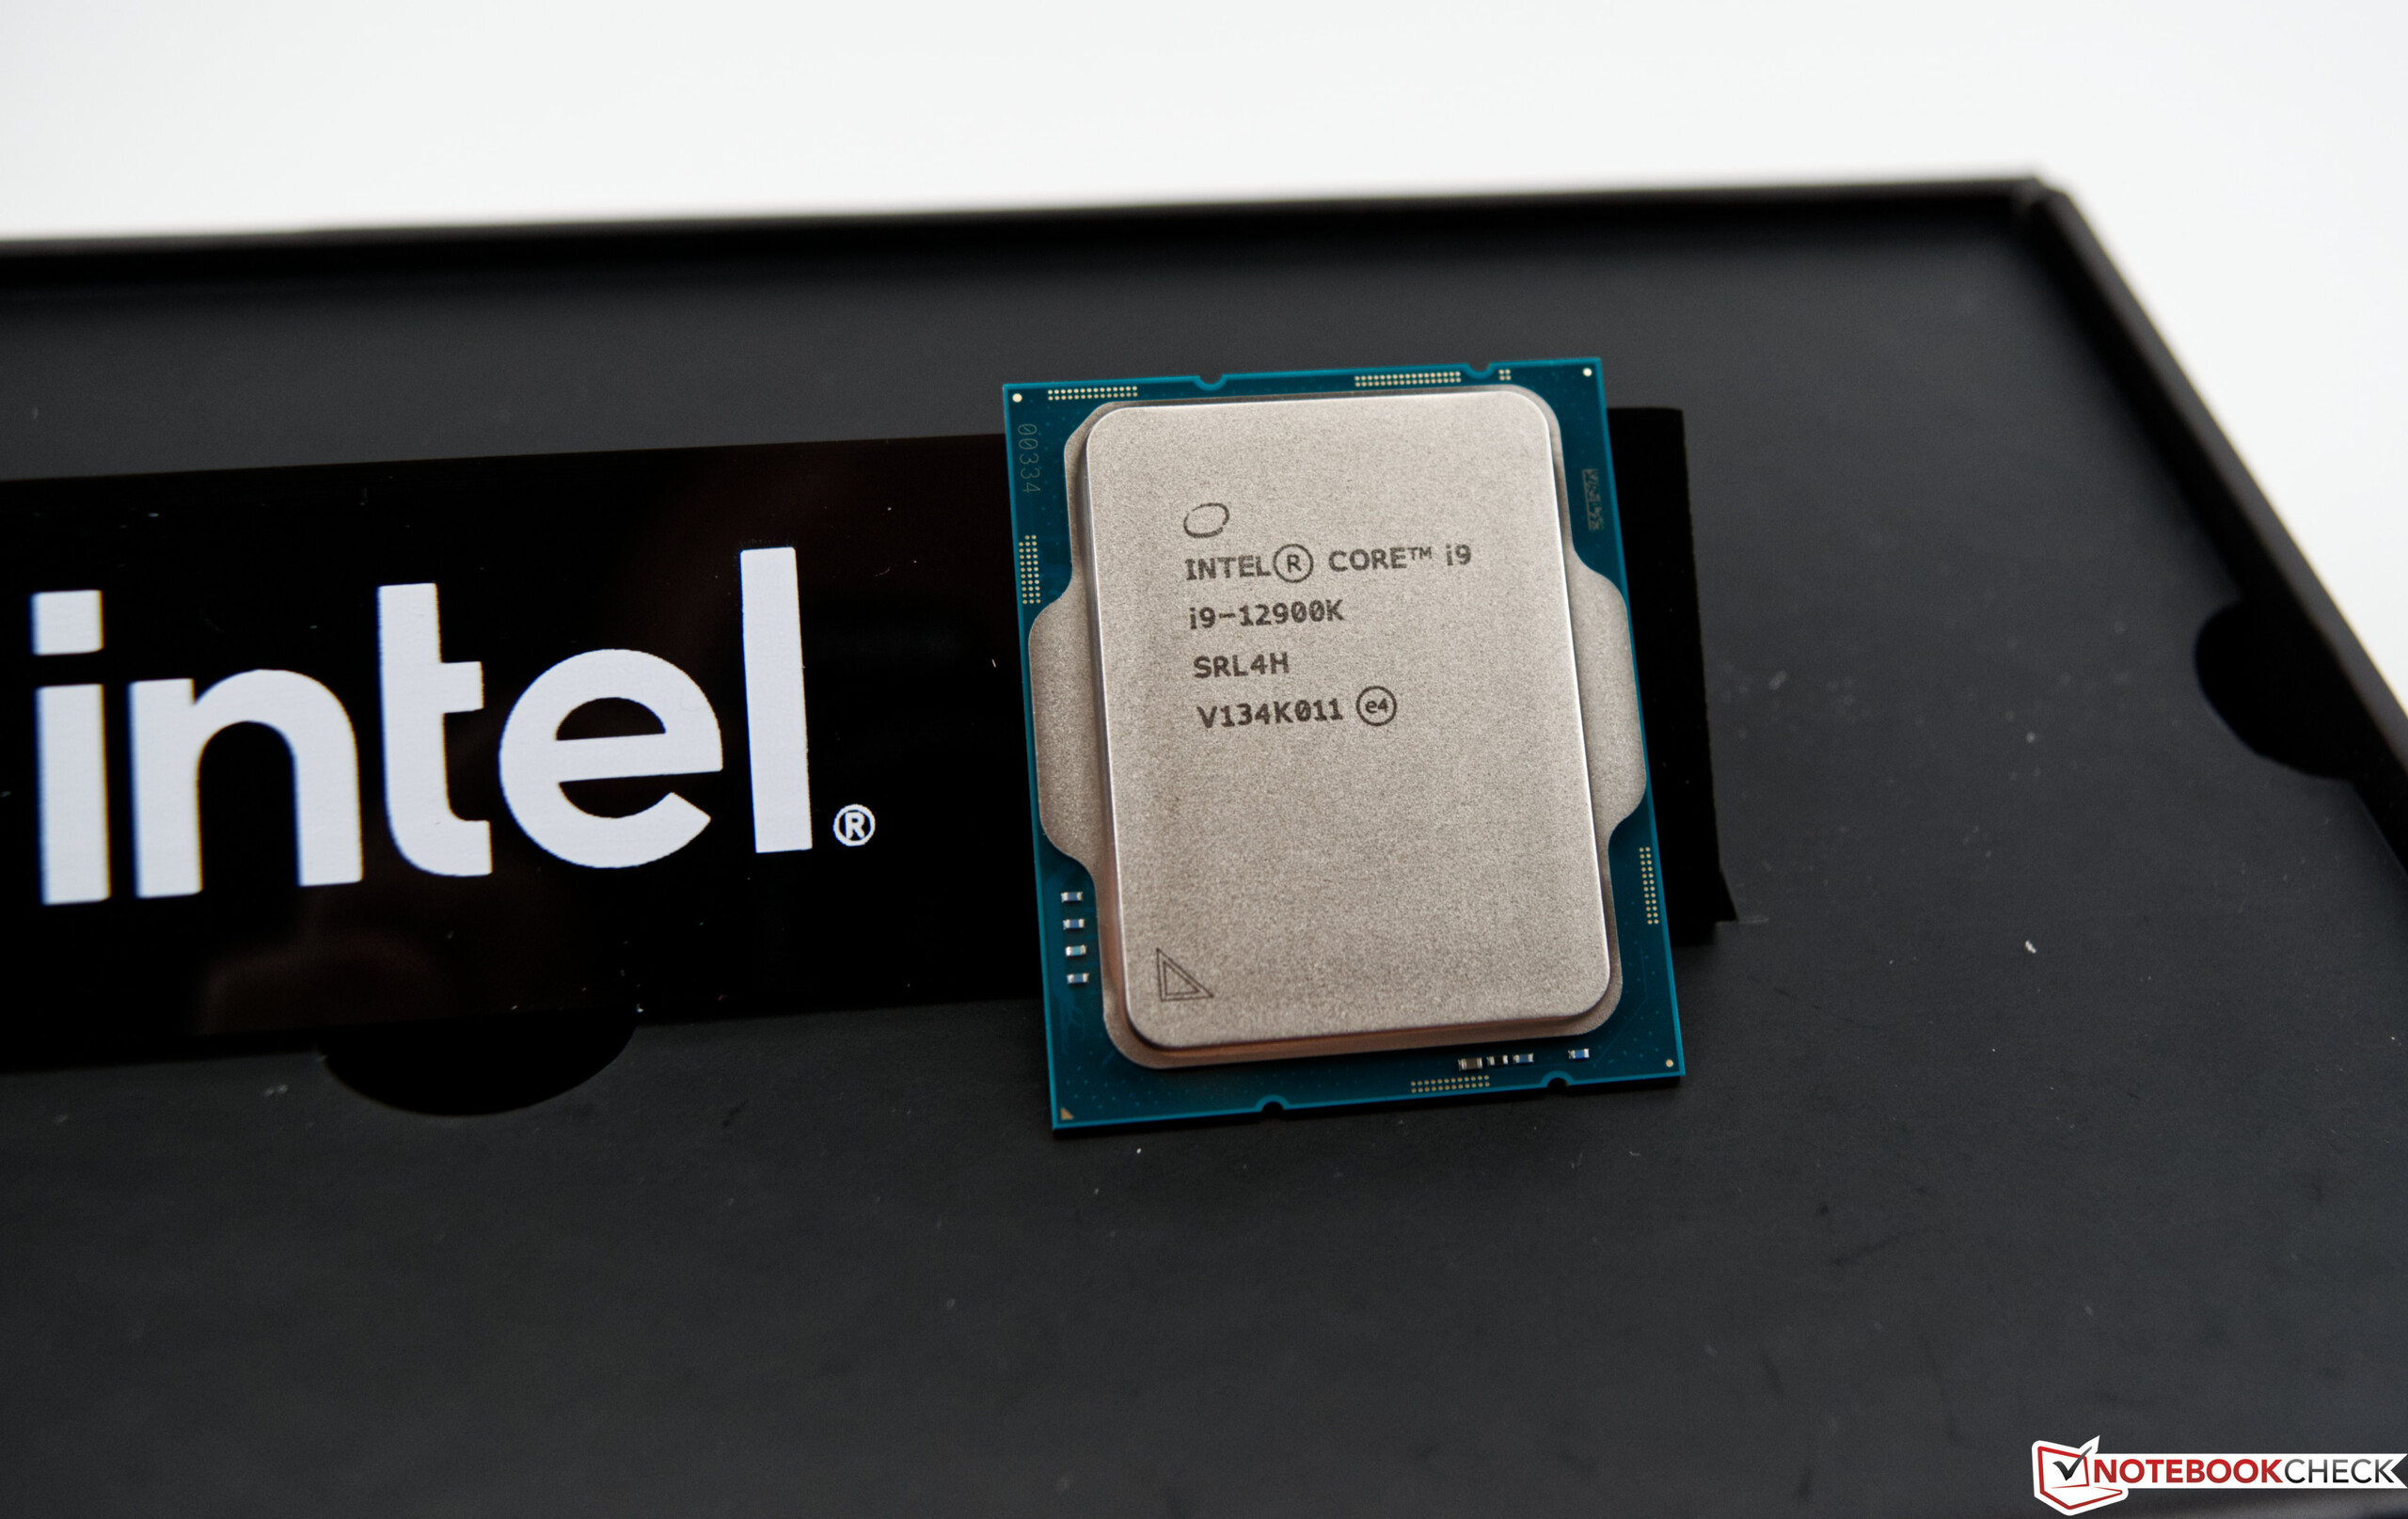
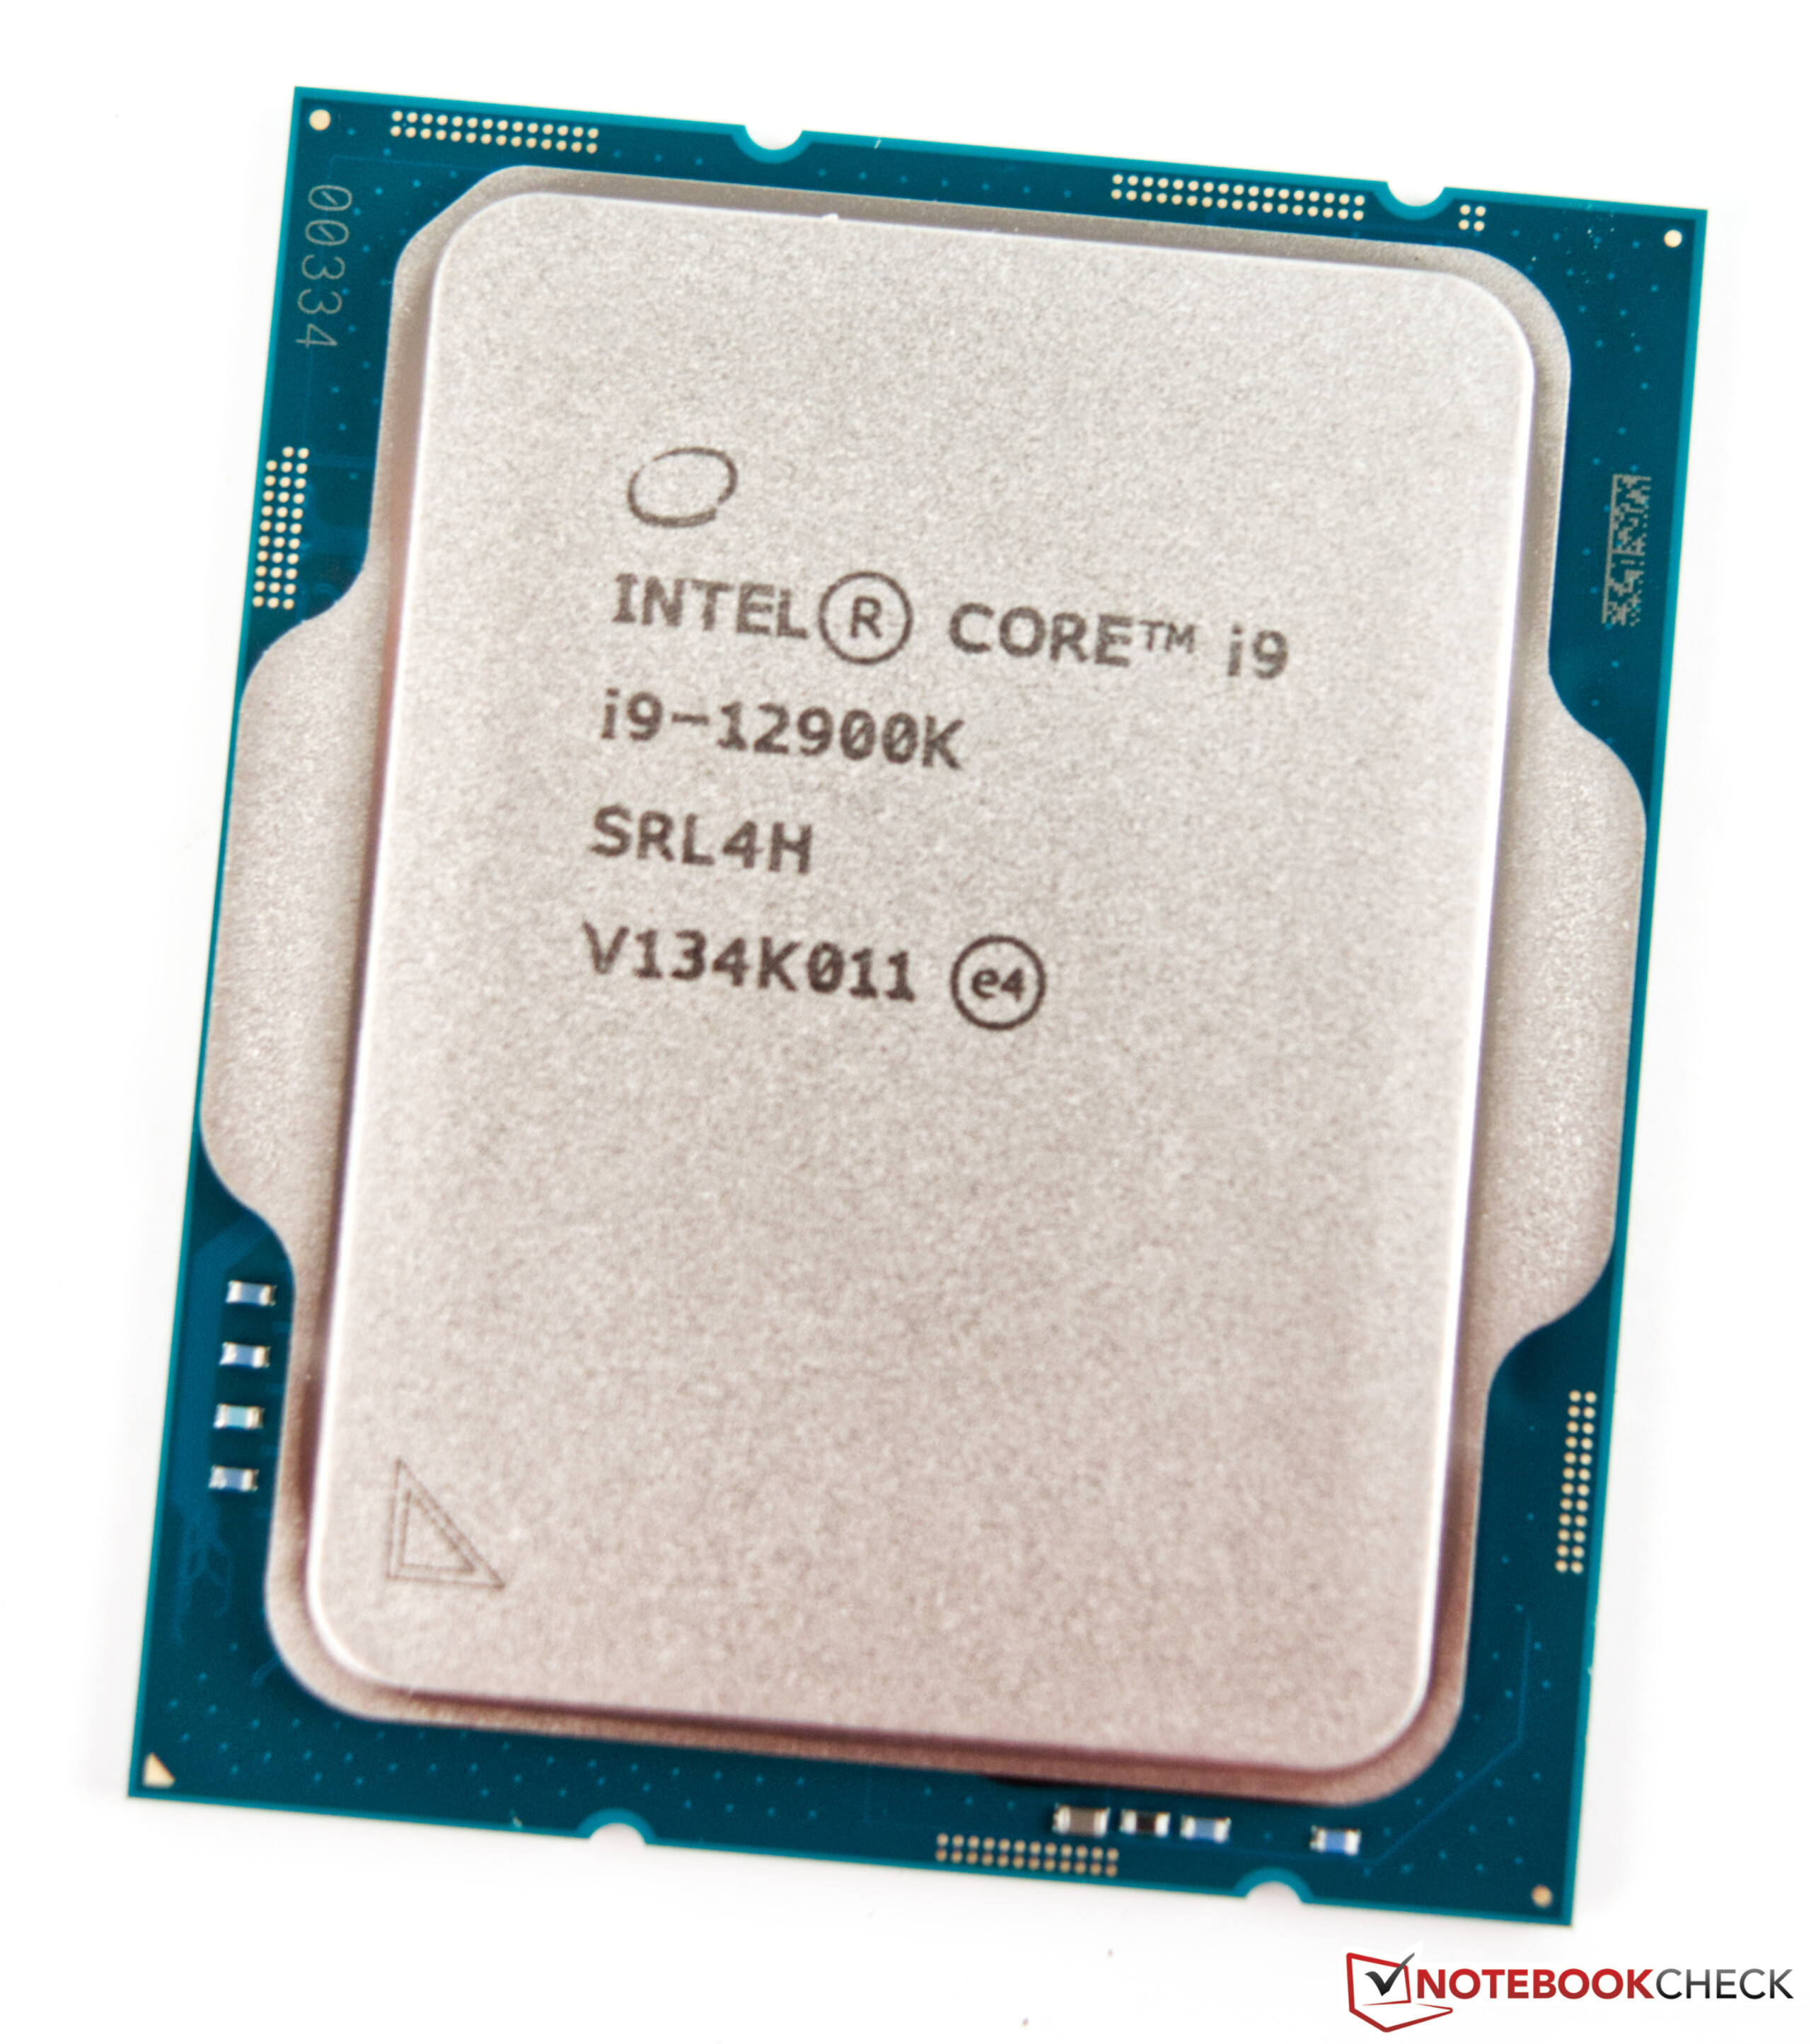
Intel Core i9-12900K

* ... smaller is better
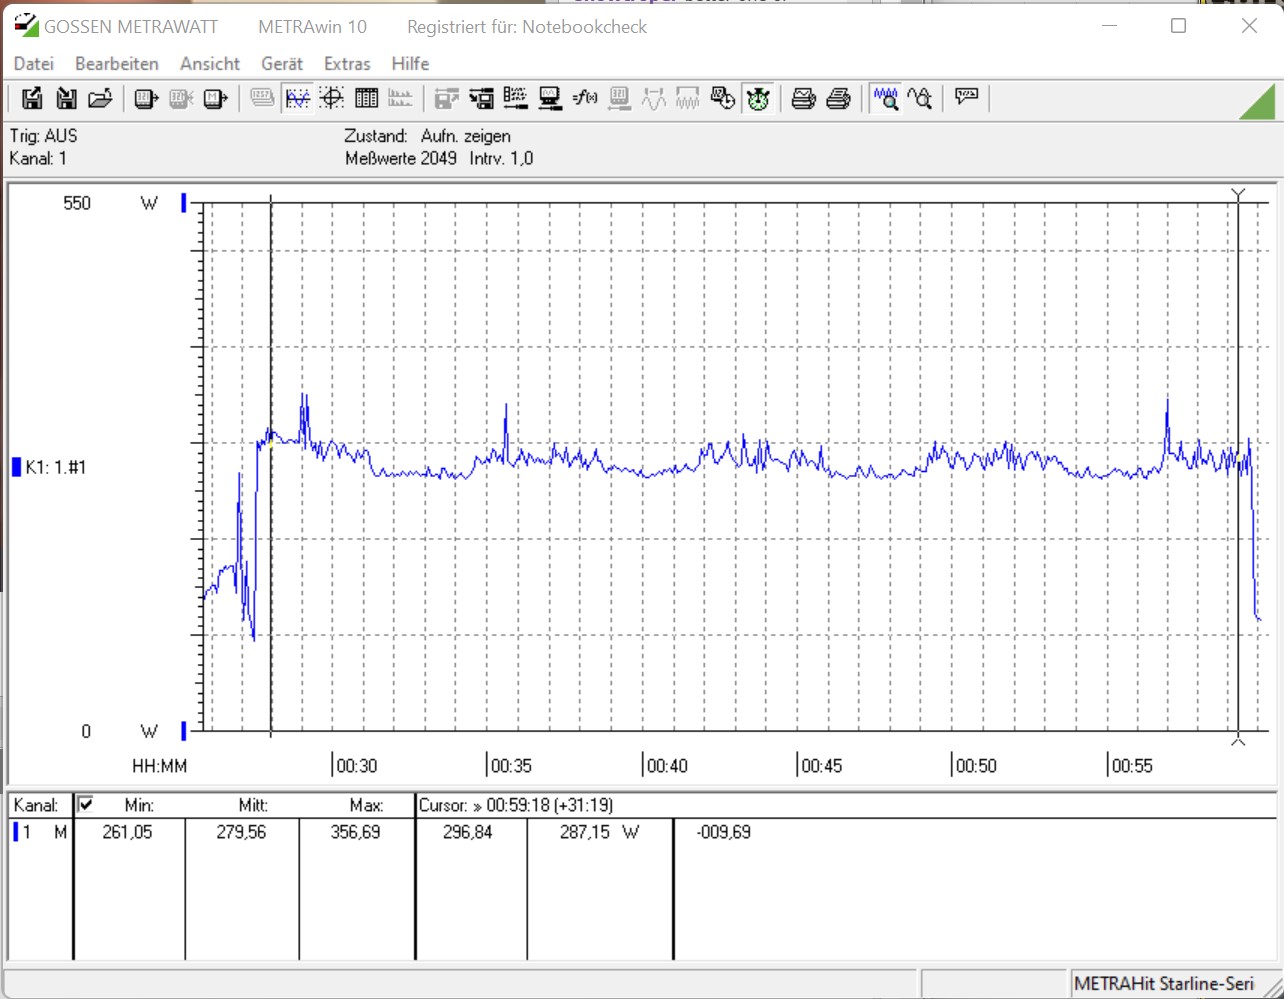
Alder Lake-S vs. Cinebench R15 Multi Loop
Both of our test units show a very stable performance in the load test. Compared to the Intel Core i9-11900K, the Intel Core i9-12900K is able to move into first place continuously and without any performance drops at an average of 3987 points. The Intel Core i5-12600K is also able to place stably ahead of the Intel Core i5-11600K Rocket Lake-S predecessor with a significant advantage. The higher amount of native computing cores ensures this performance difference overall.
Synthetic Benchmarks and Application Performance
In the synthetic benchmarks, the new Alder Lake-S processors are ahead. Aside from few exceptions where AMD is supposed to offer the better platform, the Intel Core i9-12900K is able to achieve a solid advantage. It is not astonishing then that the two Alder Lake-S CPUs share the two top places in the two cumulative benchmark results. However, we were still a bit surprised, since we didn't expect second place for the Intel Core i5-12600K in the overall ranking.
Gaming Benchmarks
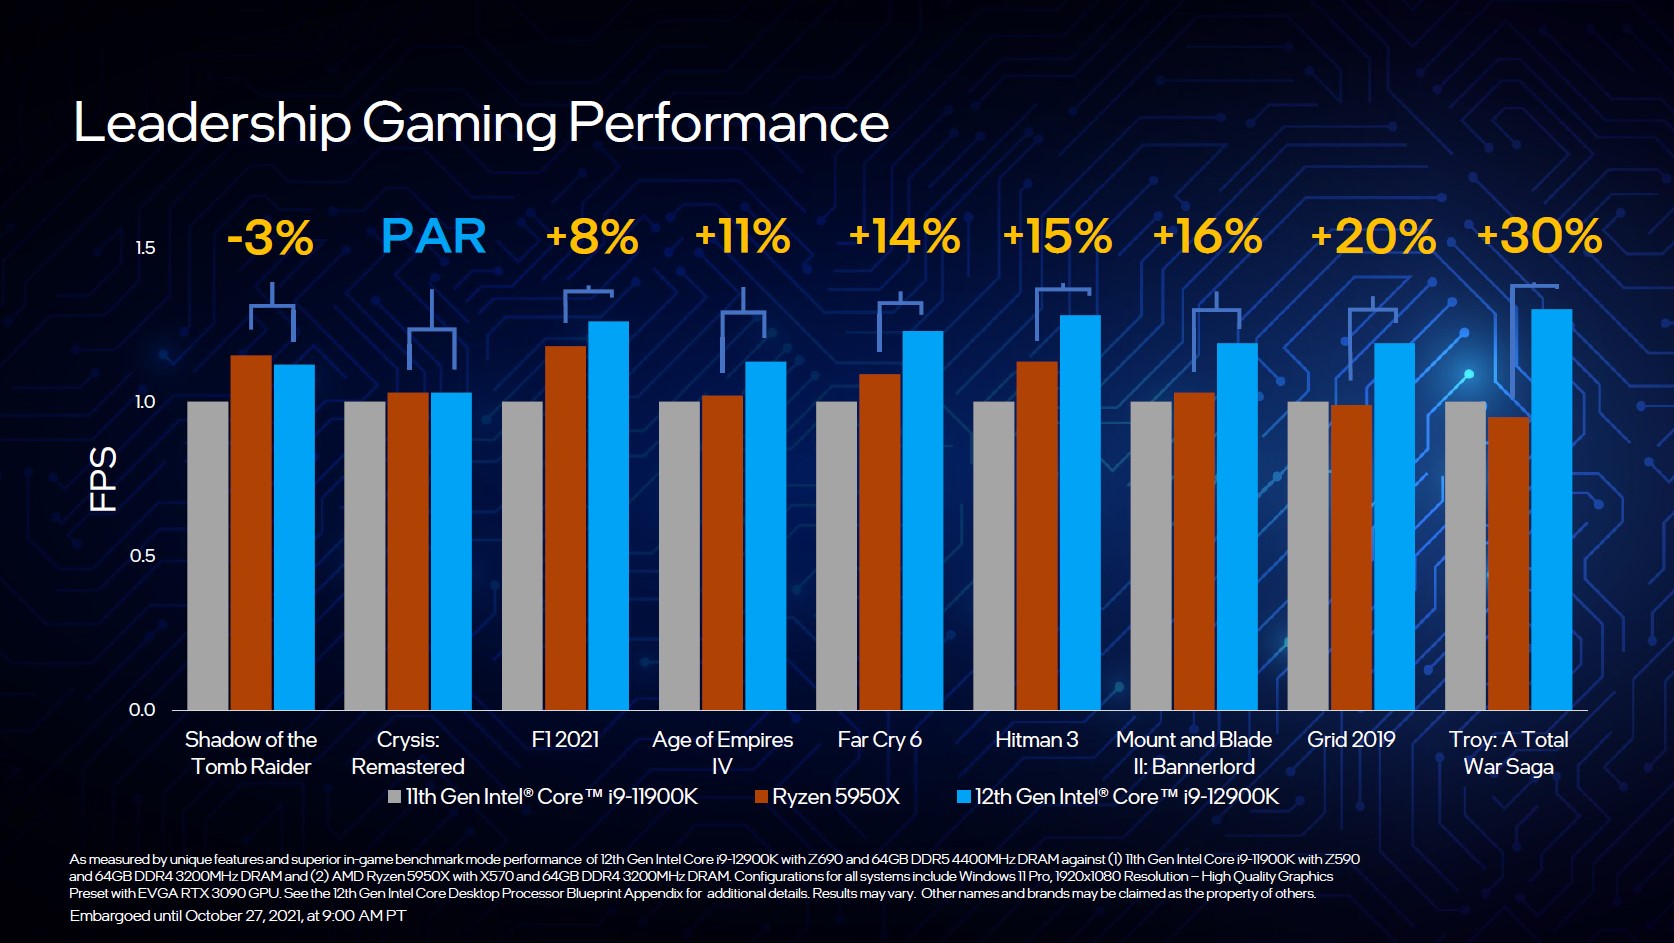
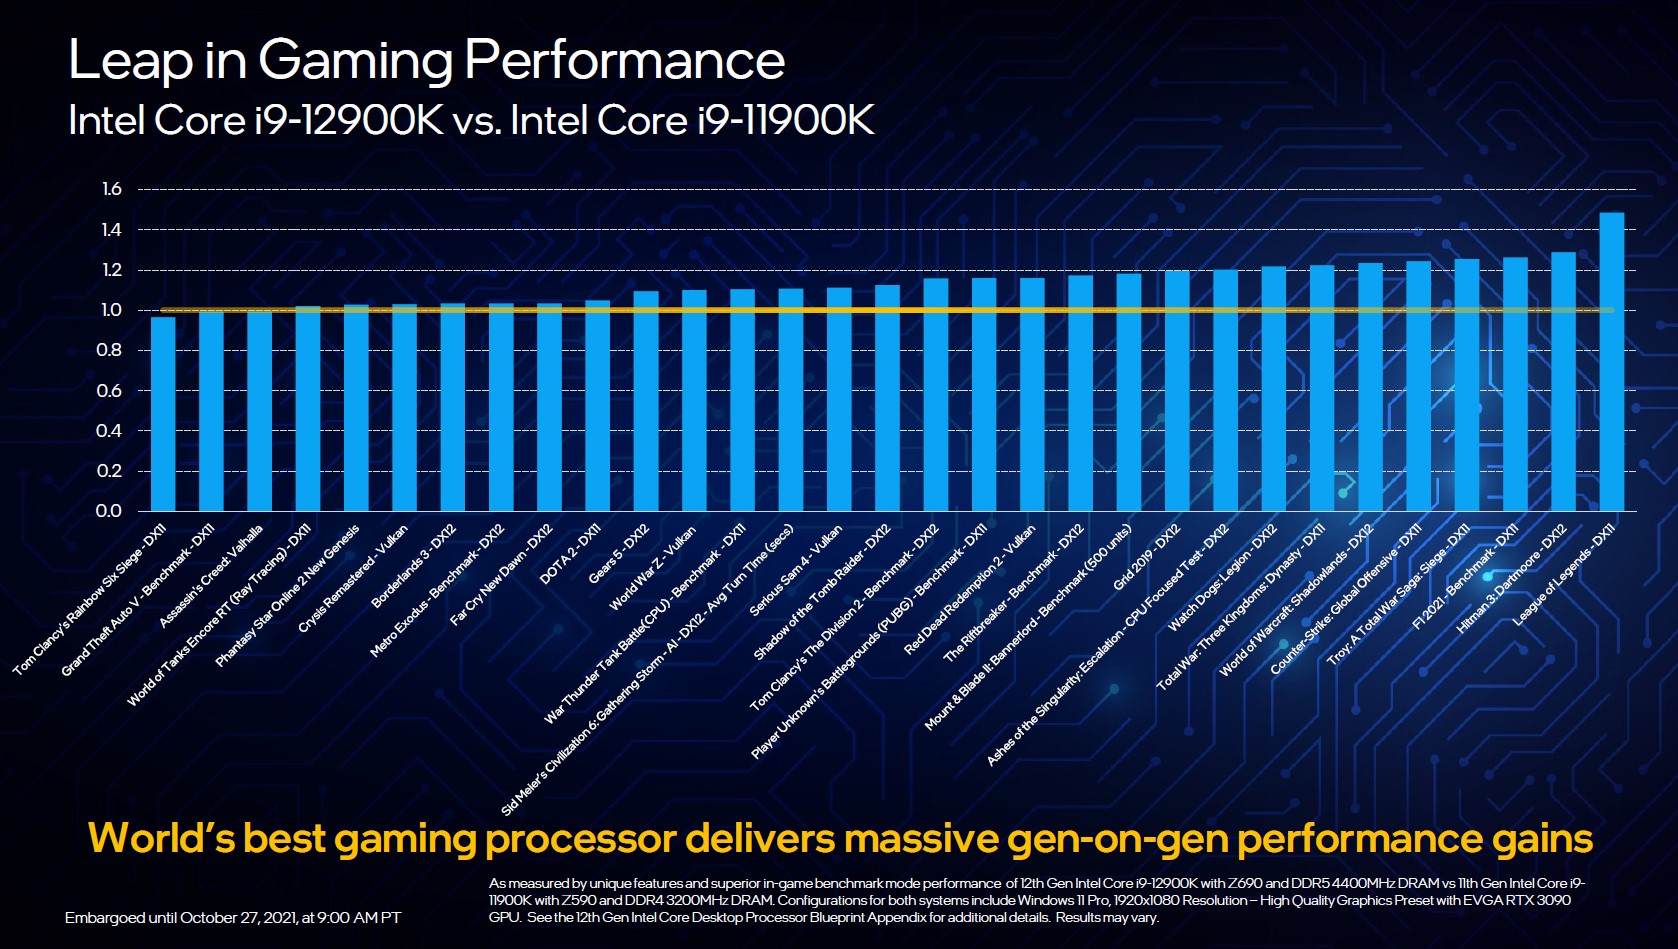
Now we are getting to the most interesting benchmarks and the discipline where the new Intel Alder Lake-S processors can really show their capabilities. Compared to Rocket Lake-S, the new processors are able to increase their performance significantly, as you can see in the gaming benchmarks. In the cumulative comparison of the nine games, the Intel Core i9-12900K is able to just move ahead of the AMD Ryzen 9 5900X. You have to also know here that there are some games that harmonize better with Intel processors and others that offer the better performance with AMD processors. In the in-house competition of the two Alder Lake-S processors, the Intel Core i5-12600K loses by 8 percentage points against the flagship, ending up just barely ahead of the Intel Core i5-11600K with this.
Nonetheless, both processors deliver a very good gaming performance. Due to the many changes in the platform and operating system, we might also be able to expect some more performance improvements in the form of updates in the future. But there is no guarantee for that. The performance in the pure CPU limit is very high and depending on the game also significantly ahead of the competitors. However, we still have to note that although Intel has the fastest gaming CPU in its portfolio here, the distance to the Zen3 processor cannot be called outstanding. In addition, all the competitors move closer together with increasing resolution, so that the CPU only plays the second fiddle behind the GPU as determining factor for FPS boosting. Those who also stream content in addition to the actual gaming will profit from the higher amount of threads, which will also make the new models very interesting for content creators.
| Performance rating - Percent | |
| Intel Core i9-12900K | |
| AMD Ryzen 9 5900X -2! | |
| AMD Ryzen 7 5800X -2! | |
| AMD Ryzen 9 5950X -2! | |
| AMD Ryzen 5 5600X -2! | |
| Intel Core i9-11900K | |
| Intel Core i5-12600K | |
| Intel Core i5-11600K | |
| Intel Core i9-10900K | |
| Intel Core i7-10700K -4! | |
| Intel Core i5-10600K | |
| Forza Horizon 4 | |
| 1280x720 Very Low Preset | |
| Intel Core i9-12900K | |
| Intel Core i5-12600K | |
| Intel Core i9-11900K | |
| Intel Core i9-10900K | |
| Intel Core i5-11600K | |
| Intel Core i5-10600K | |
| 1920x1080 Ultra Preset AA:2xMS | |
| Intel Core i9-10900K | |
| Intel Core i9-11900K | |
| Intel Core i5-11600K | |
| Intel Core i5-10600K | |
| Intel Core i9-12900K | |
| Intel Core i5-12600K | |
Intel Core i9-12900K + Nvidia Titan RTX
| low | med. | high | ultra | QHD | 4K | |
|---|---|---|---|---|---|---|
| GTA V (2015) | 187 | 187 | 185 | 135 | 123 | 138 |
| The Witcher 3 (2015) | 589 | 422 | 271 | 139 | 103 | |
| Dota 2 Reborn (2015) | 203.5 | 208.7 | 201.7 | 189.7 | 178.9 | |
| Final Fantasy XV Benchmark (2018) | 227 | 195 | 144 | 108 | 64.1 | |
| X-Plane 11.11 (2018) | 200 | 176 | 137 | 117 | ||
| Far Cry 5 (2018) | 220 | 191 | 178 | 167 | 145 | 83 |
| Strange Brigade (2018) | 593 | 371 | 308 | 266 | 197 | 115 |
| Shadow of the Tomb Raider (2018) | 221 | 192 | 183 | 169 | 124 | 69.3 |
| Forza Horizon 4 (2018) | 293 | 227 | 216 | 178 | 153 | 111 |
| Far Cry New Dawn (2019) | 188 | 162 | 154 | 140 | 129 | 84 |
| Borderlands 3 (2019) | 202 | 172 | 147 | 124 | 89.9 | 49.2 |
| F1 2020 (2020) | 432 | 343 | 303 | 213 | 167 | 101 |
| F1 2021 (2021) | 491 | 383 | 307 | 160 | 121 | 71.9 |
| Far Cry 6 (2021) | 185 | 157 | 142 | 134 | 109 | 64 |
Intel Core i5-12600K + Nvidia Titan RTX
| low | med. | high | ultra | QHD | 4K | |
|---|---|---|---|---|---|---|
| GTA V (2015) | 186 | 185 | 181 | 124 | 115 | 136 |
| The Witcher 3 (2015) | 500 | 406 | 277 | 144 | 107 | |
| Dota 2 Reborn (2015) | 183.7 | 188 | 181.1 | 174.9 | 165.8 | |
| Final Fantasy XV Benchmark (2018) | 218 | 192 | 141 | 107 | 63.6 | |
| X-Plane 11.11 (2018) | 172 | 153 | 119 | 104 | ||
| Far Cry 5 (2018) | 200 | 174 | 165 | 154 | 140 | 81 |
| Strange Brigade (2018) | 489 | 352 | 301 | 262 | 196 | 114 |
| Shadow of the Tomb Raider (2018) | 195 | 176 | 172 | 163 | 124 | 70.1 |
| Forza Horizon 4 (2018) | 263 | 218 | 212 | 178 | 154 | 112 |
| Far Cry New Dawn (2019) | 171 | 147 | 141 | 126 | 121 | 84 |
| Metro Exodus (2019) | 227 | 174 | 135 | 108 | 87.7 | 56.6 |
| Borderlands 3 (2019) | 175 | 155 | 138 | 119 | 90.4 | 49.8 |
| F1 2020 (2020) | 340 | 291 | 288 | 216 | 168 | 103 |
| F1 2021 (2021) | 407 | 367 | 302 | 160 | 122 | 72.6 |
| Far Cry 6 (2021) | 164 | 136 | 129 | 124 | 105 | 64 |
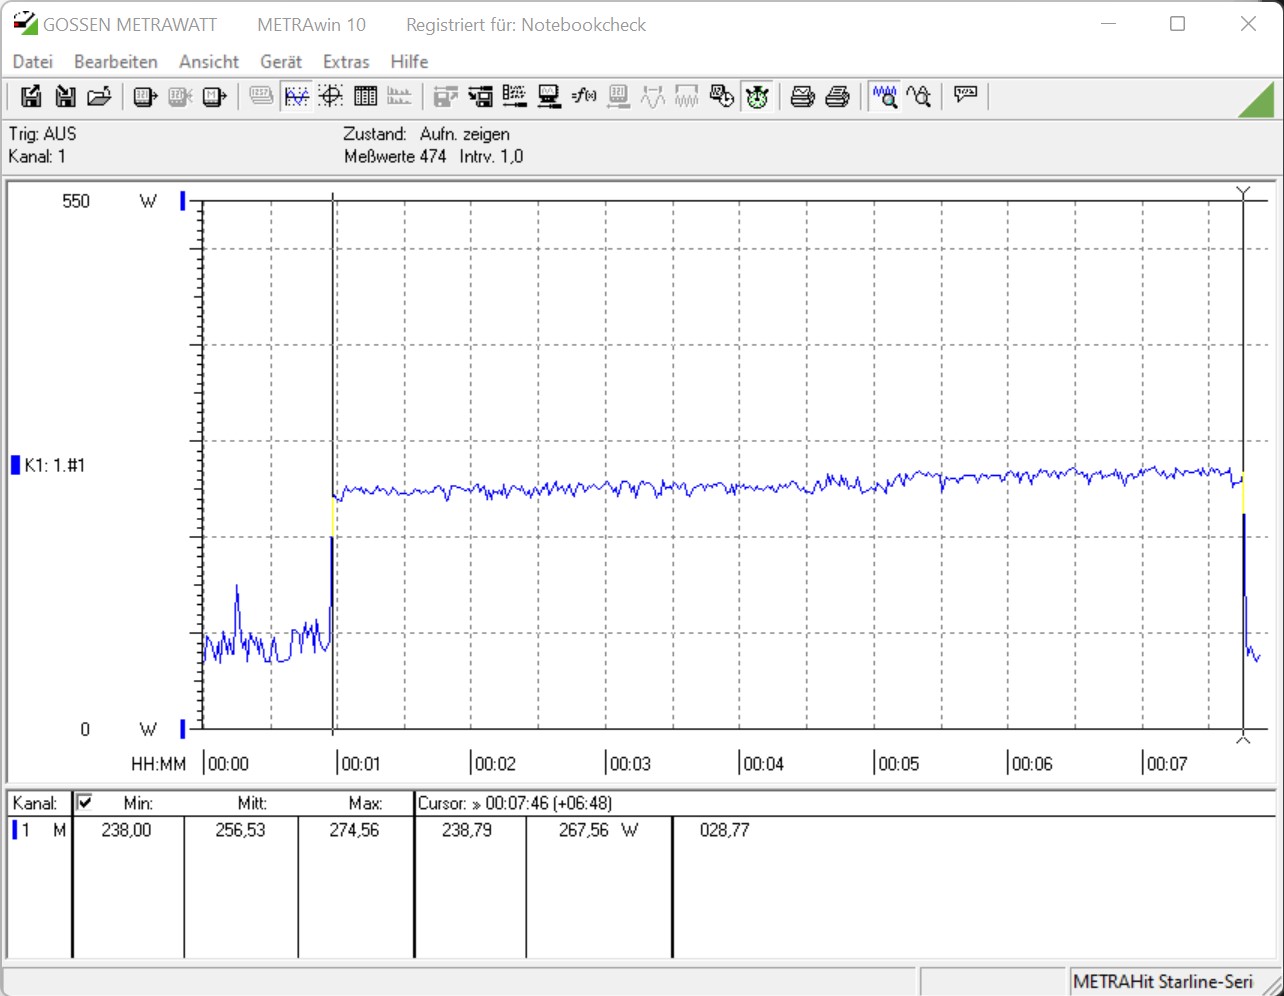
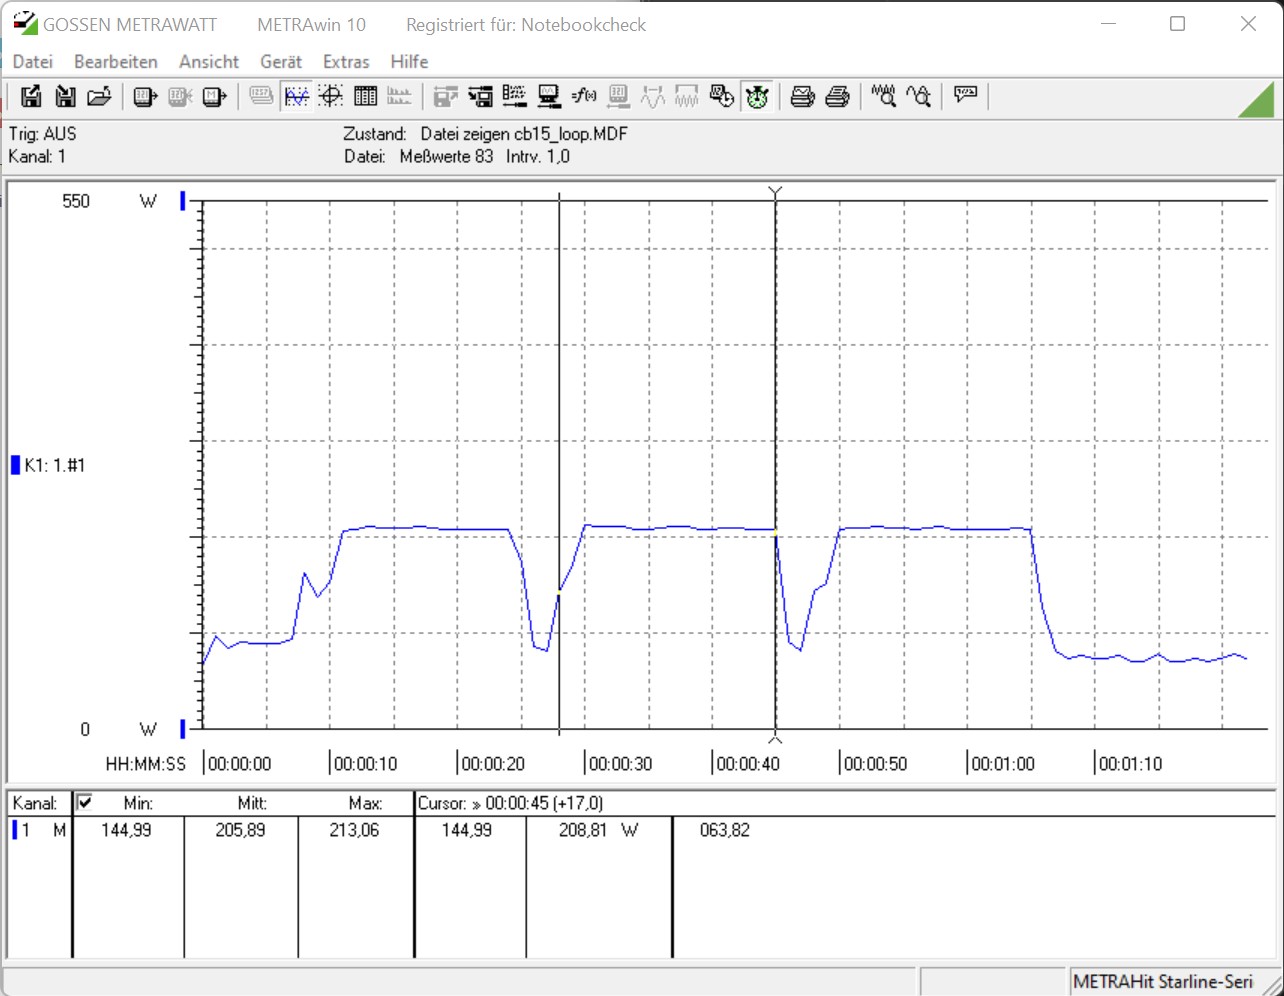
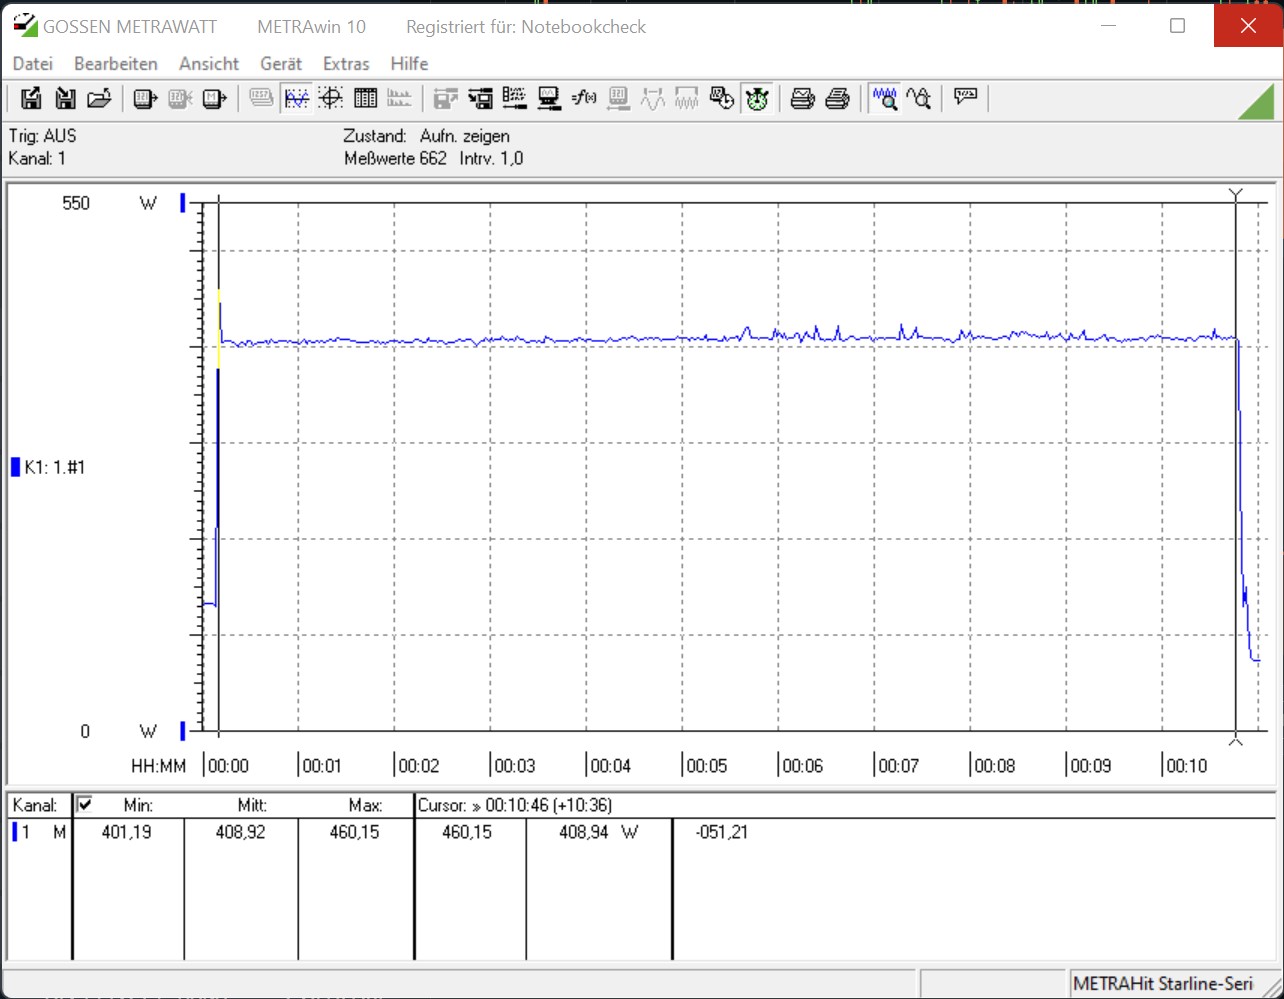
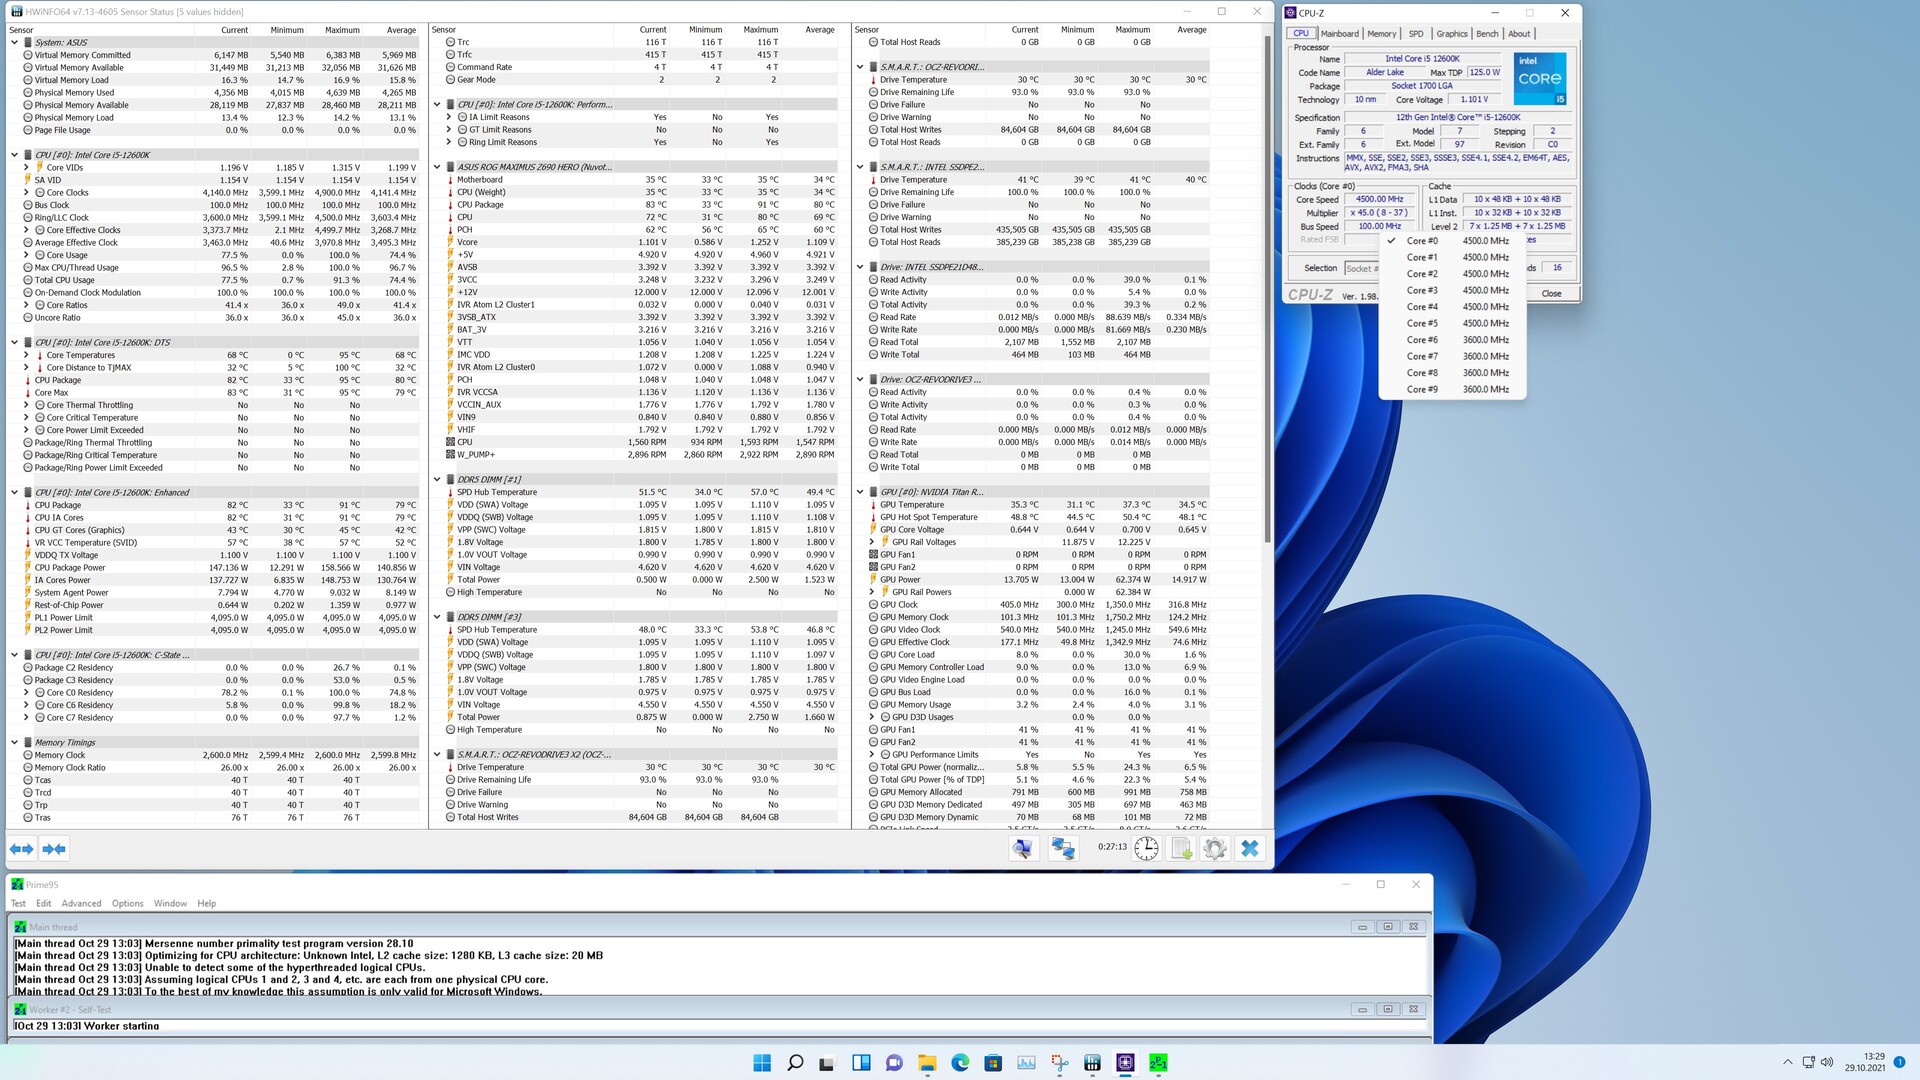
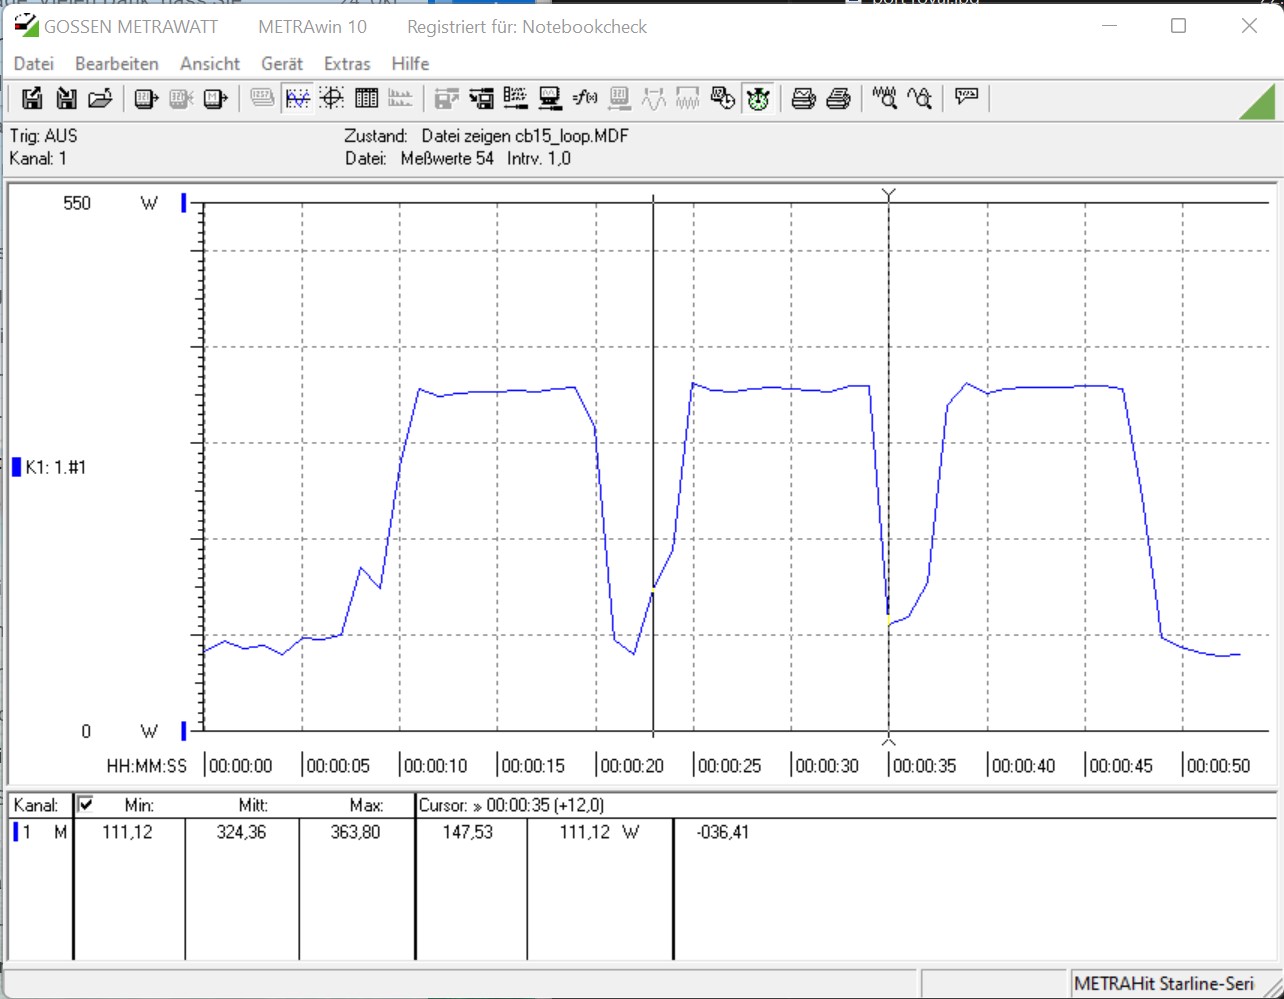
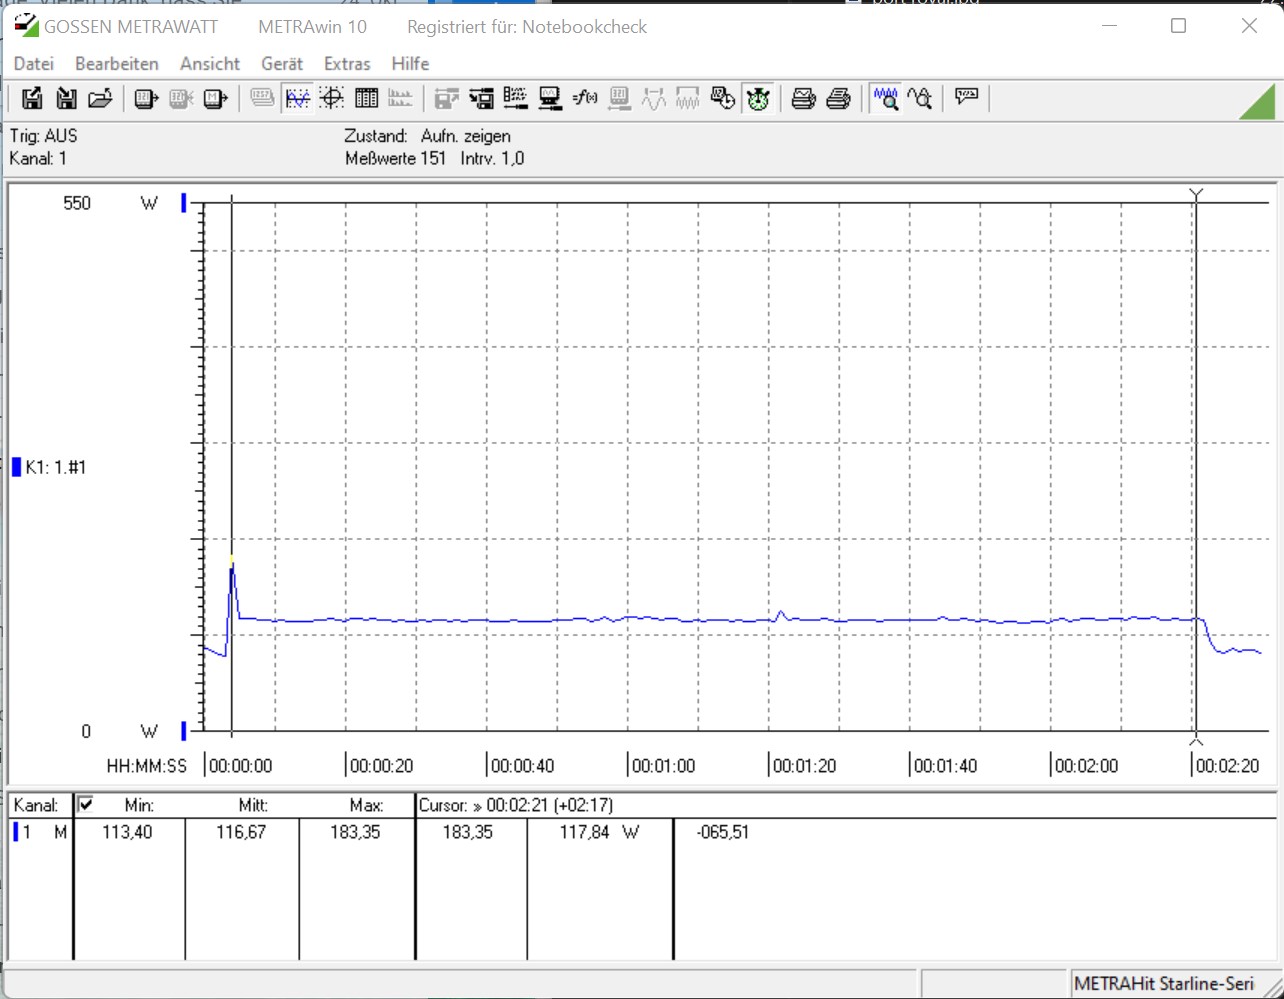
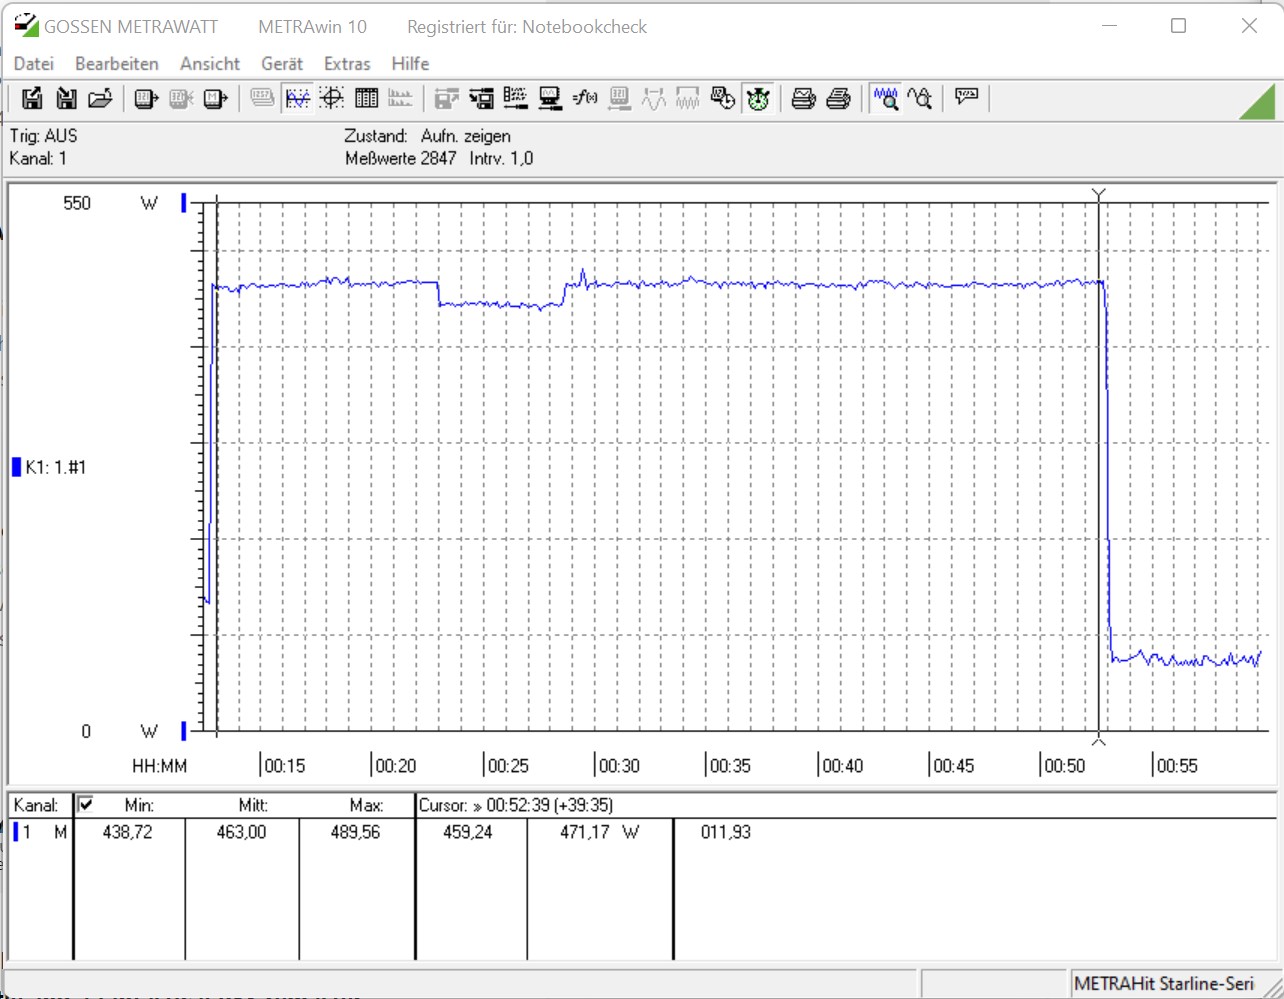
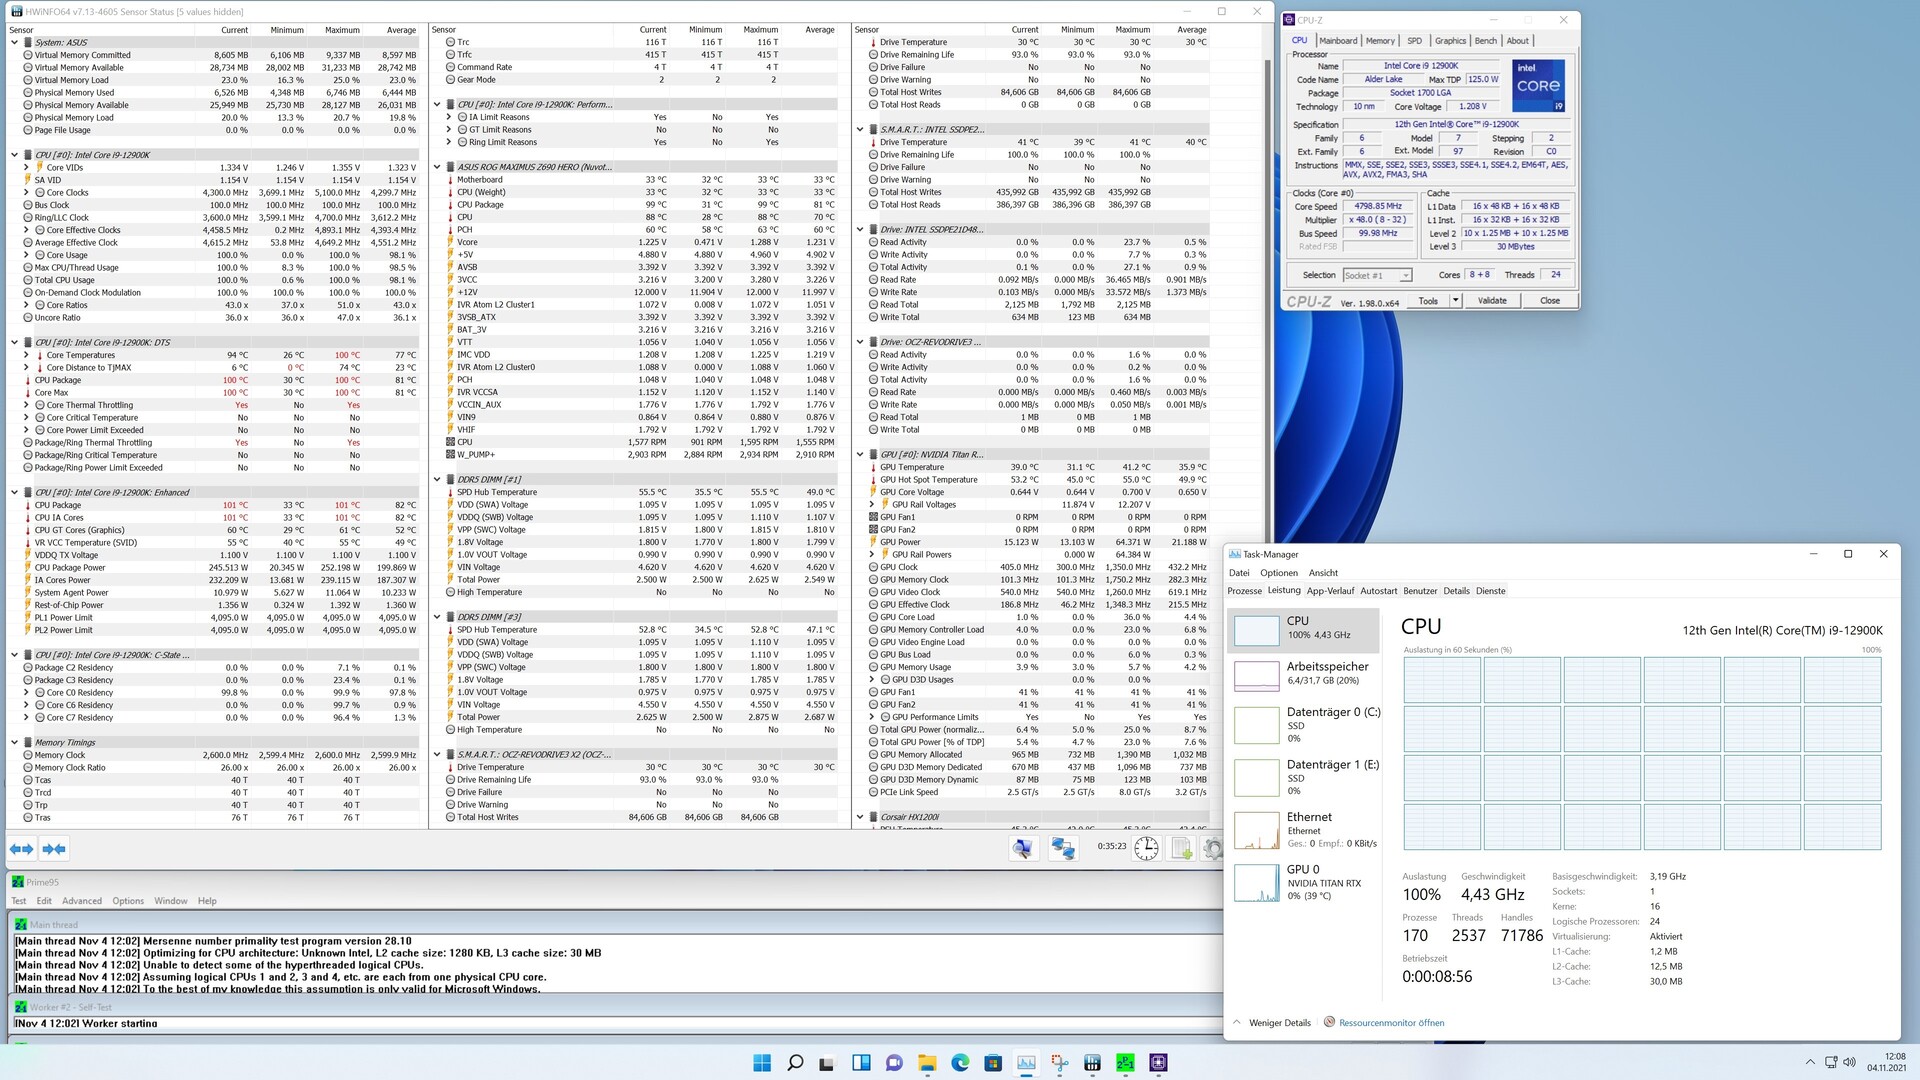
Power Consumption and Temperatures
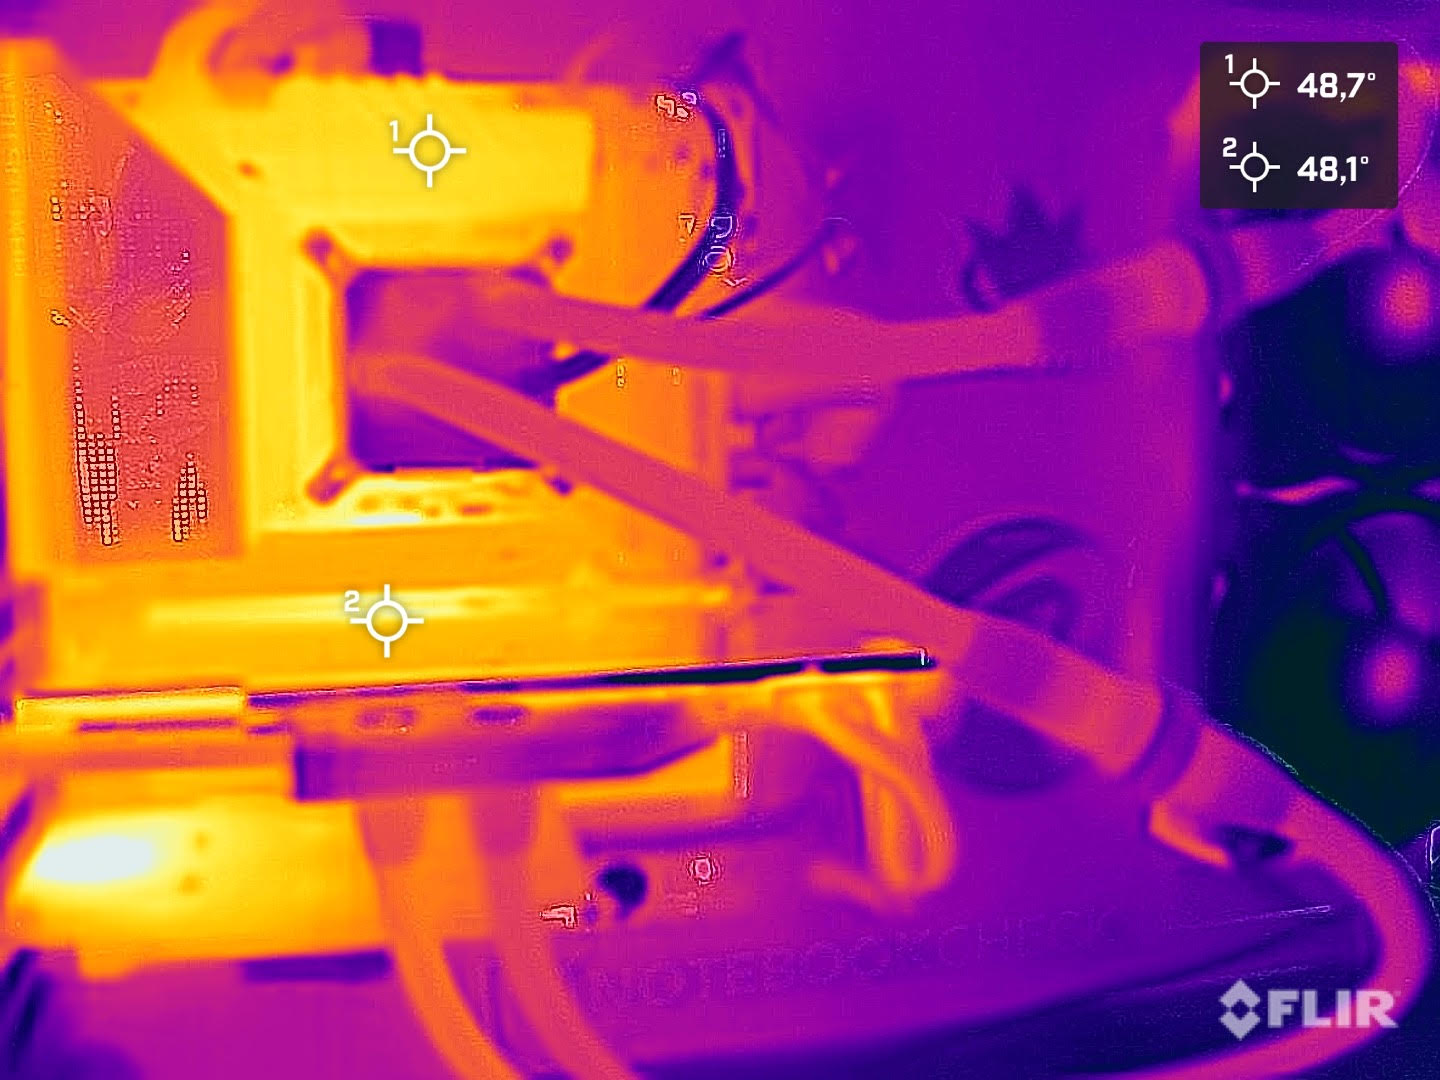
According to the technical specifications, the processors offer a TDP of 125 watts. This refers to the PL1 value. The PL2 value specifies the amount of watts available to the processor under full load if all requirements are fulfilled. At a maximum of 241 watts, the Intel Core i9-12900K is slightly more efficient than the Intel Core i9-11900K. In our test, the Alder Lake-S flagship was indeed only more efficient than the predecessor in the Prime95 stress test. However, our measurements still showed just below 280 watts for the whole system. In the Cinebench R15 Multi test, our test system consumed almost 25% more power. This is an increase that cannot just be discarded. In the Intel Core i5-12600K, the PL2 value is limited at 150 watts, which is also reflected in our measurement results. Compared to the Intel Core i5-11600K, the Intel Core i5-12600K is 7% more efficient. However, the image changes in the stress test, and the Core i5-12600K draws 13% more power from the outlet. The measured values during gaming are of course increased by the Nvidia Titan RTX. However, we can also see here that the Alder Lake-S platform does not invite saving energy.
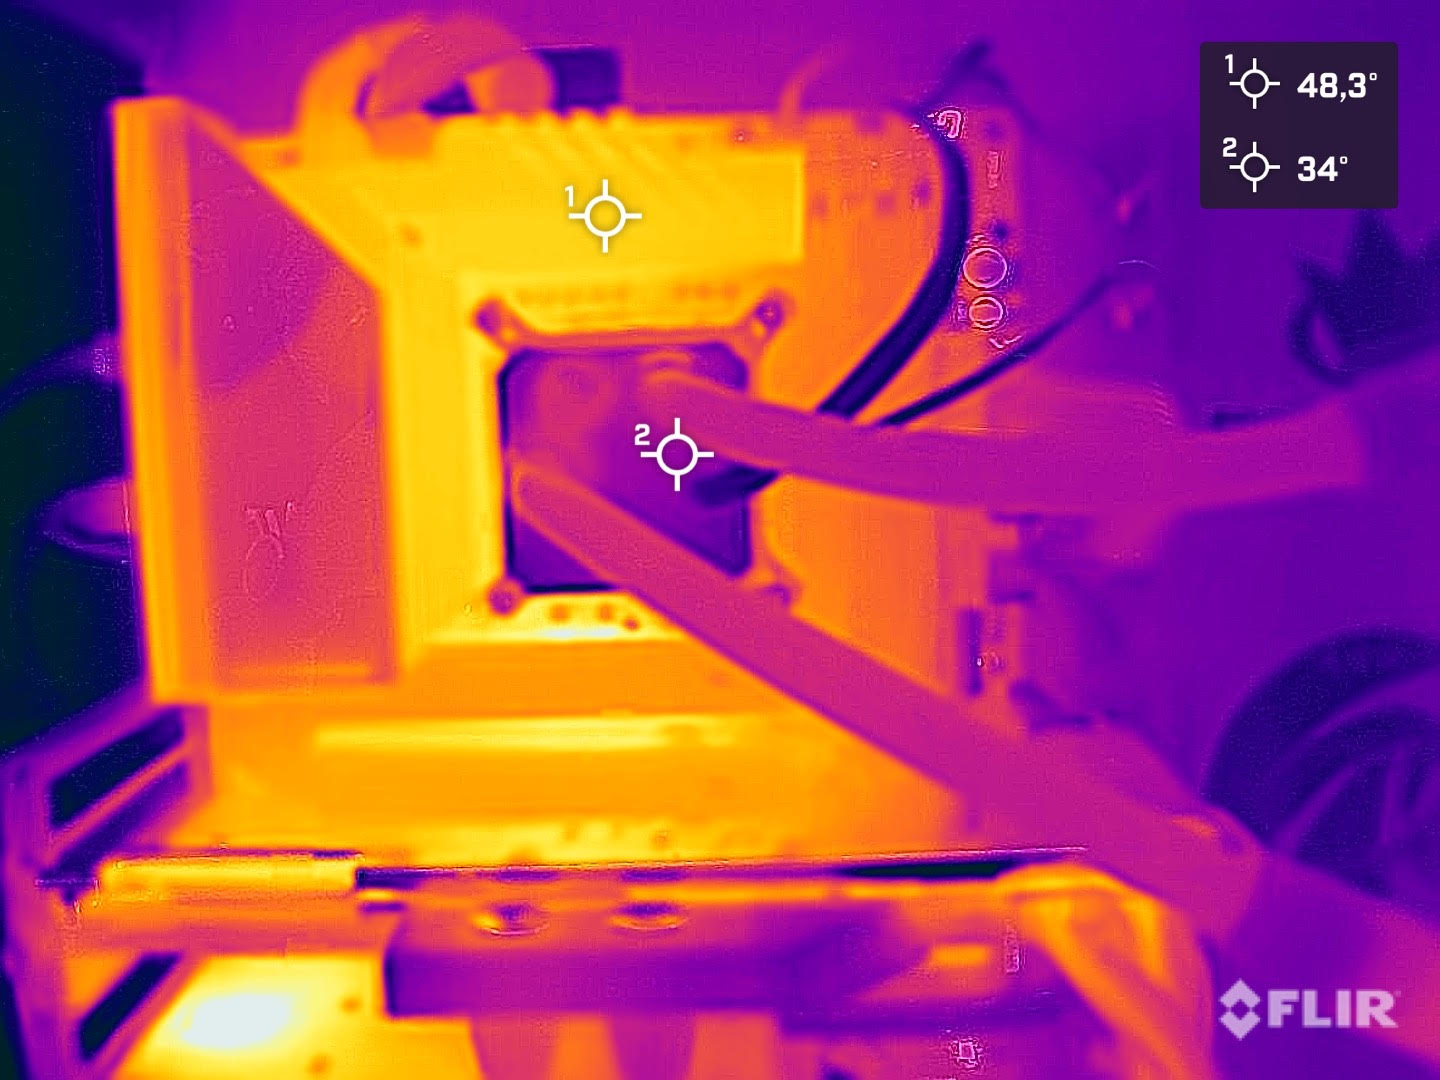
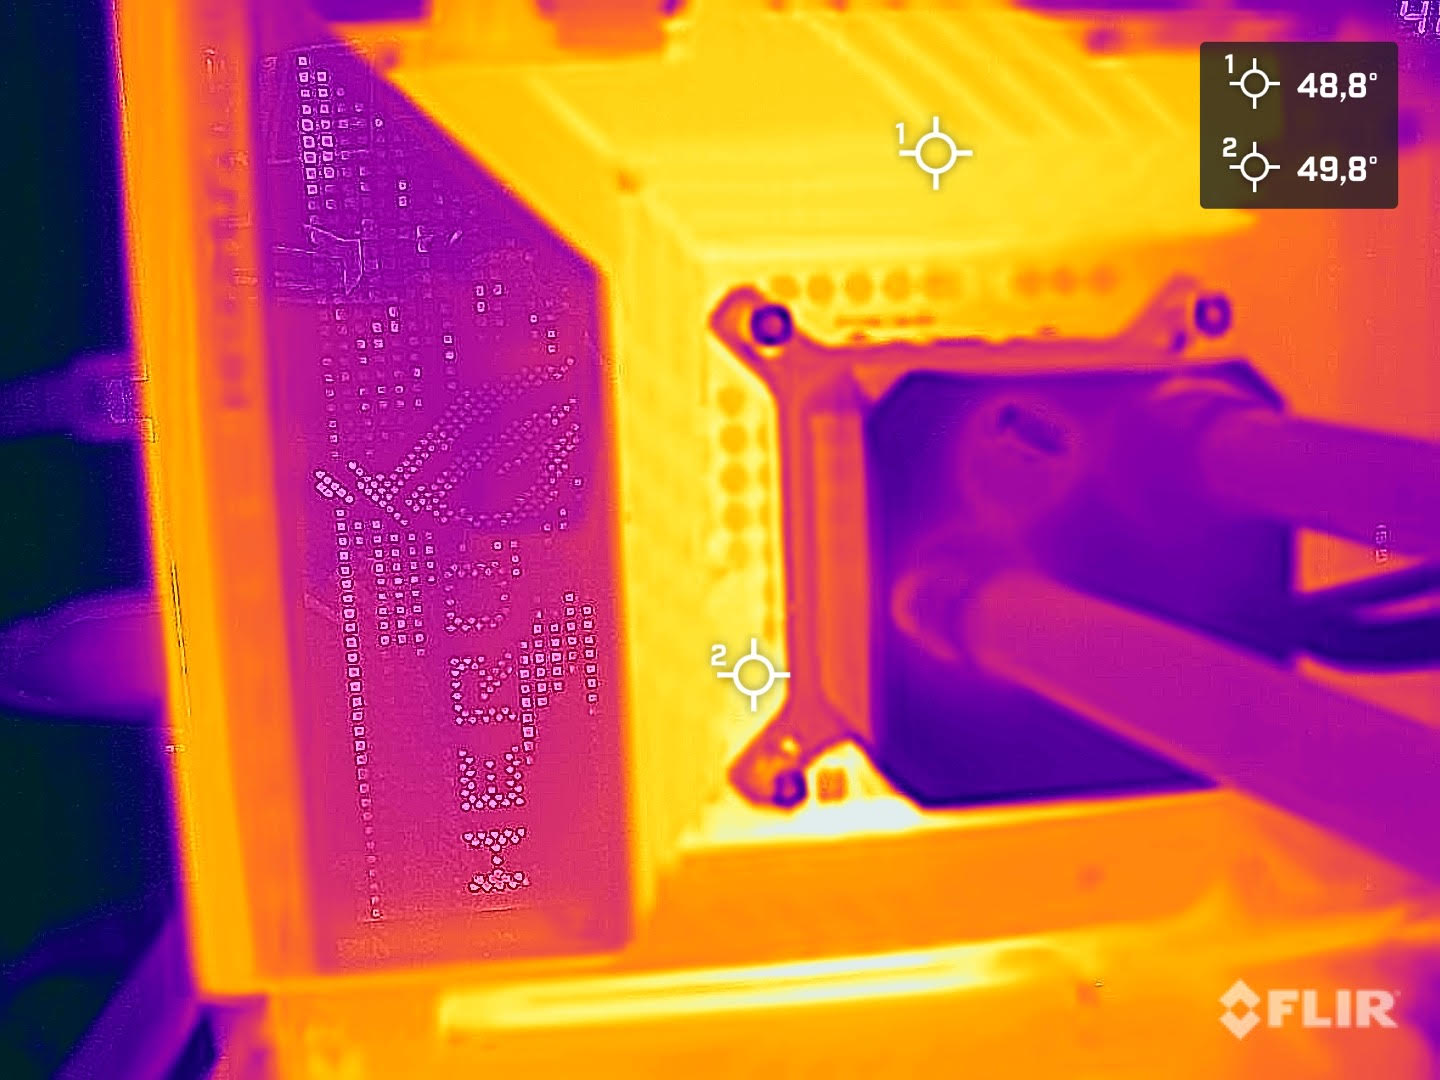
Our measured temperatures showed that the Intel Core i9-12900K already reached 100 °C (212 °F) several minutes after starting the Prime95 benchmark. Continuing the stress test, the CPU then had to be throttled to avoid harming it. This is the disadvantage of the PL1 = PL2 setting in the Bios. However, we did not notice any throttling under load in the Cinebench R15 Multi loop. In order to exclude a bad installation of the cooling system, we also removed and then reinstalled it at one point, but the result afterwards was the same. We also contacted Alphacool to make sure that there is no incompatibility of the cooler we used. According to the manufacturer, the Alphacool Eisbear Aurora 280 AiO that we used is compatible with the LGA 1700 socket. The Intel Core i5-12600K was slightly easier to cool under load, but we still noted a maximum temperature of 95 °C (203 °F).
So those who want to use an Intel Core i9-12900K should also get a very powerful cooling system to get the most out of the processor.
| Power Consumption | |
| 1920x1080 The Witcher 3 ultra (external Monitor) | |
| Intel Core i9-12900K (Idle: 70.5 W) | |
| AMD Ryzen 9 5950X (Idle: 78 W) | |
| AMD Ryzen 9 5900X (Idle: 78.1 W) | |
| Intel Core i5-11600K (Idle: 69.49 W) | |
| AMD Ryzen 7 5800X (Idle: 77.5 W) | |
| AMD Ryzen 5 5600X (Idle: 79.23 W) | |
| Intel Core i5-12600K (Idle: 70.45 W) | |
| Intel Core i7-10700K (Idle: 67.7 W) | |
| Intel Core i9-10900K (Idle: 52.3 W) | |
| Intel Core i9-11900K (Idle: 57.3 W) | |
| Intel Core i5-10600K (Idle: 52.2 W) | |
| Prime95 V2810 Stress (external Monitor) | |
| Intel Core i9-11900K (Idle: 57.3 W) | |
| Intel Core i9-12900K (Idle: 70.5 W) | |
| Intel Core i9-10900K (Idle: 52.3 W) | |
| Intel Core i5-12600K (Idle: 70.45 W) | |
| AMD Ryzen 9 5950X (Idle: 78 W) | |
| AMD Ryzen 7 5800X (Idle: 77.5 W) | |
| AMD Ryzen 9 5900X (Idle: 78.1 W) | |
| Intel Core i5-11600K (Idle: 69.49 W) | |
| Intel Core i7-10700K (Idle: 67.7 W) | |
| Intel Core i5-10600K (Idle: 52.2 W) | |
| AMD Ryzen 5 5600X (Idle: 79.23 W) | |
| Cinebench R15 Multi (external Monitor) | |
| Intel Core i9-12900K (Idle: 70.5 W) | |
| Intel Core i9-10900K (Idle: 52.3 W) | |
| Intel Core i9-11900K (Idle: 57.3 W) | |
| AMD Ryzen 9 5900X (Idle: 78.1 W) | |
| AMD Ryzen 9 5950X (Idle: 78 W) | |
| AMD Ryzen 7 5800X (Idle: 77.5 W) | |
| Intel Core i5-11600K (Idle: 69.49 W) | |
| Intel Core i7-10700K (Idle: 67.7 W) | |
| Intel Core i5-12600K (Idle: 70.45 W) | |
| Intel Core i5-10600K (Idle: 52.2 W) | |
| AMD Ryzen 5 5600X (Idle: 79.23 W) | |
| Temperatures - CPU Temperature Prime95 | |
| Intel Core i9-11900K | |
| AMD Ryzen 7 5800X | |
| Intel Core i9-10900K | |
| Intel Core i5-11600K | |
| AMD Ryzen 9 5900X | |
| Intel Core i5-10600K | |
| AMD Ryzen 9 5950X | |
* ... smaller is better

Pros
Cons
Verdict - Back to the top with a total of 24 Threads

With Alder Lake-S, Intel indeed succeeds in having the fastest Gaming CPU, at least for now. But this isn't all. Alder Lake-S isn't only a souped-up last-gen processor as we have often seen before. This isn't the case here, since the new architecture includes many improvements. Many of these we already know from the mobile area, since smartphones and tablets have already contained processors with performance and energy efficient cores for years. Intel also makes use of this design in its current desktop lineup, increasing the multi-core performance dramatically. In this way, the Intel Core i9-12900K able to operate on a total of 24 threads in parallel. In addition, the IPC was also improved significantly, which benefits gaming enormously.
The underlying base has also changed completely and a simple upgrade from Rocket Lake-S is impossible without replacing the mainboard. You definitely have to include this in your cost calculation. Apropos costs, the recommended purchase price is $589 and it is currently available starting from 659 Euros (~$762) in some places. Depending on the availability, there might be some price increases here, like in the graphics cards. The slightly weaker but still very fast Intel Core i5-12600K starts at a recommended price of $289 according to Intel. According to our initial research, the model is already available from 319 Euros (~$369) in some places. This is an attractive price that even AMD currently can't beat. The corresponding AMD Ryzen 7 5800X costs 379 Euros (~$438) at this point. Things look a little different here with the top model, where the AMD Ryzen 9 5900X is significantly more affordable at 519 Euros (~$600).
The Intel Core i9-12900K is a very good gaming CPU with some reserves for the future. With the fastest gaming CPU on the market, Intel can give itself a pat on the back for now.
However, in order to make the Intel Core i9-12900K more competitive, the price should drop, since as we already mentioned, you definitely also have to invest in a new mainboard and in some circumstances also in new working memory if it has to be DDR5. But we like the fact that you also have the option to continue to use DDR4. The mainboard manufacturers offer some specific models with DDR4 RAM for this. However, whether these will then also support Raptor Lake-S is unfortunately not currently known yet.
We were a bit disappointed about the power consumption. Of course the performance was drastically improved and the corresponding slightly higher power consumption remains within limits. But it would have been great, if this performance increase could be combined with a noticeably lower power consumption. This would also help in getting a better handle on the cooling issues.
Those who already want to grab it now can get the Intel Core i5-12600K from Amazon for ~$323 and the Intel Core i9-12900K also from Amazon for ~$1400. While Newegg lists it for $649, it is currently sold out there.

