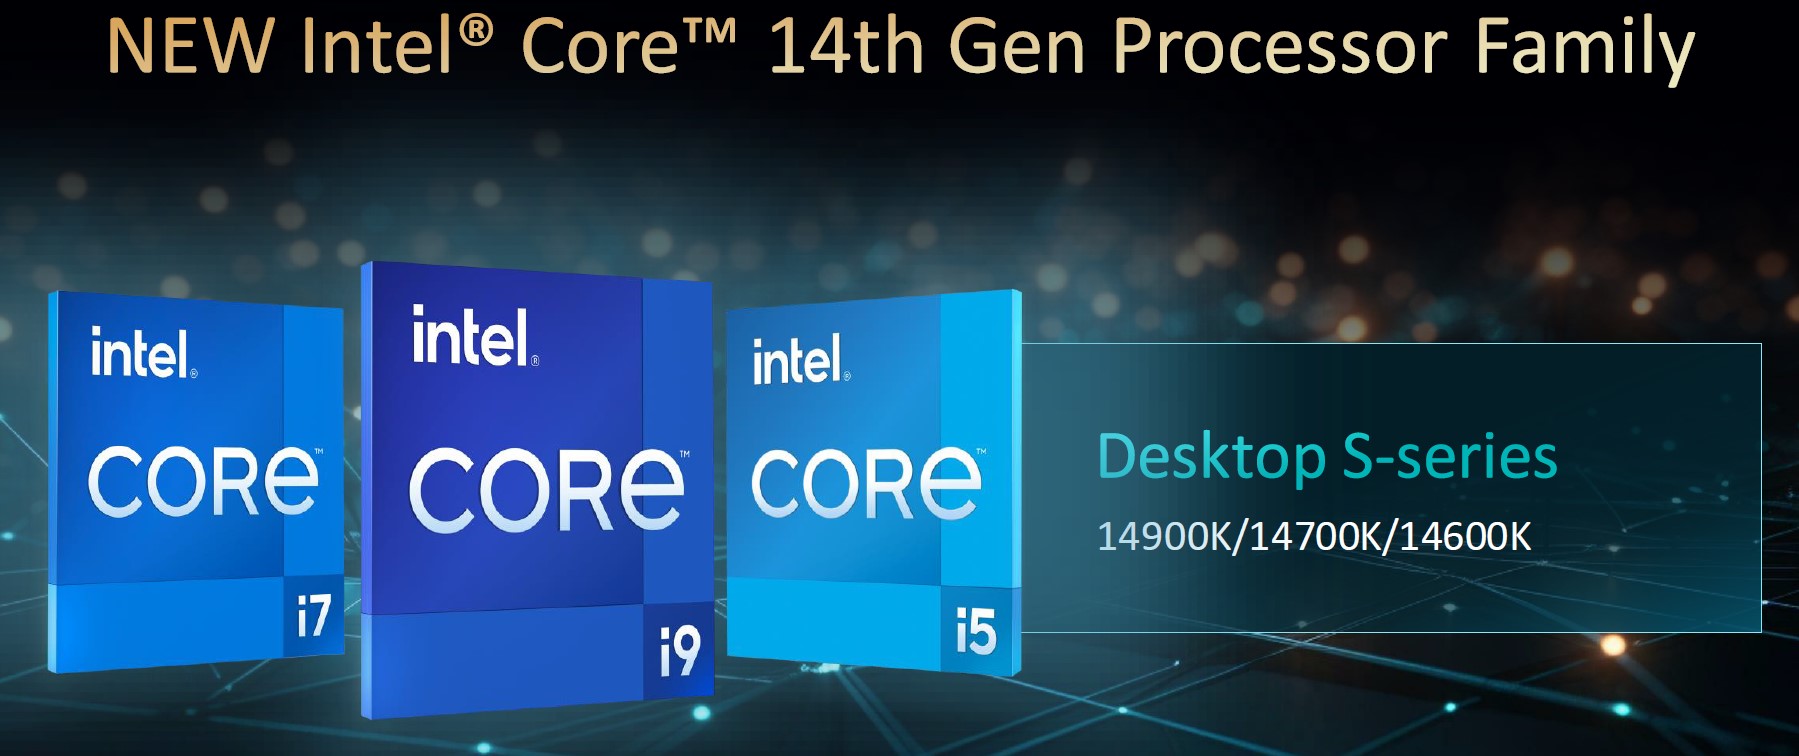
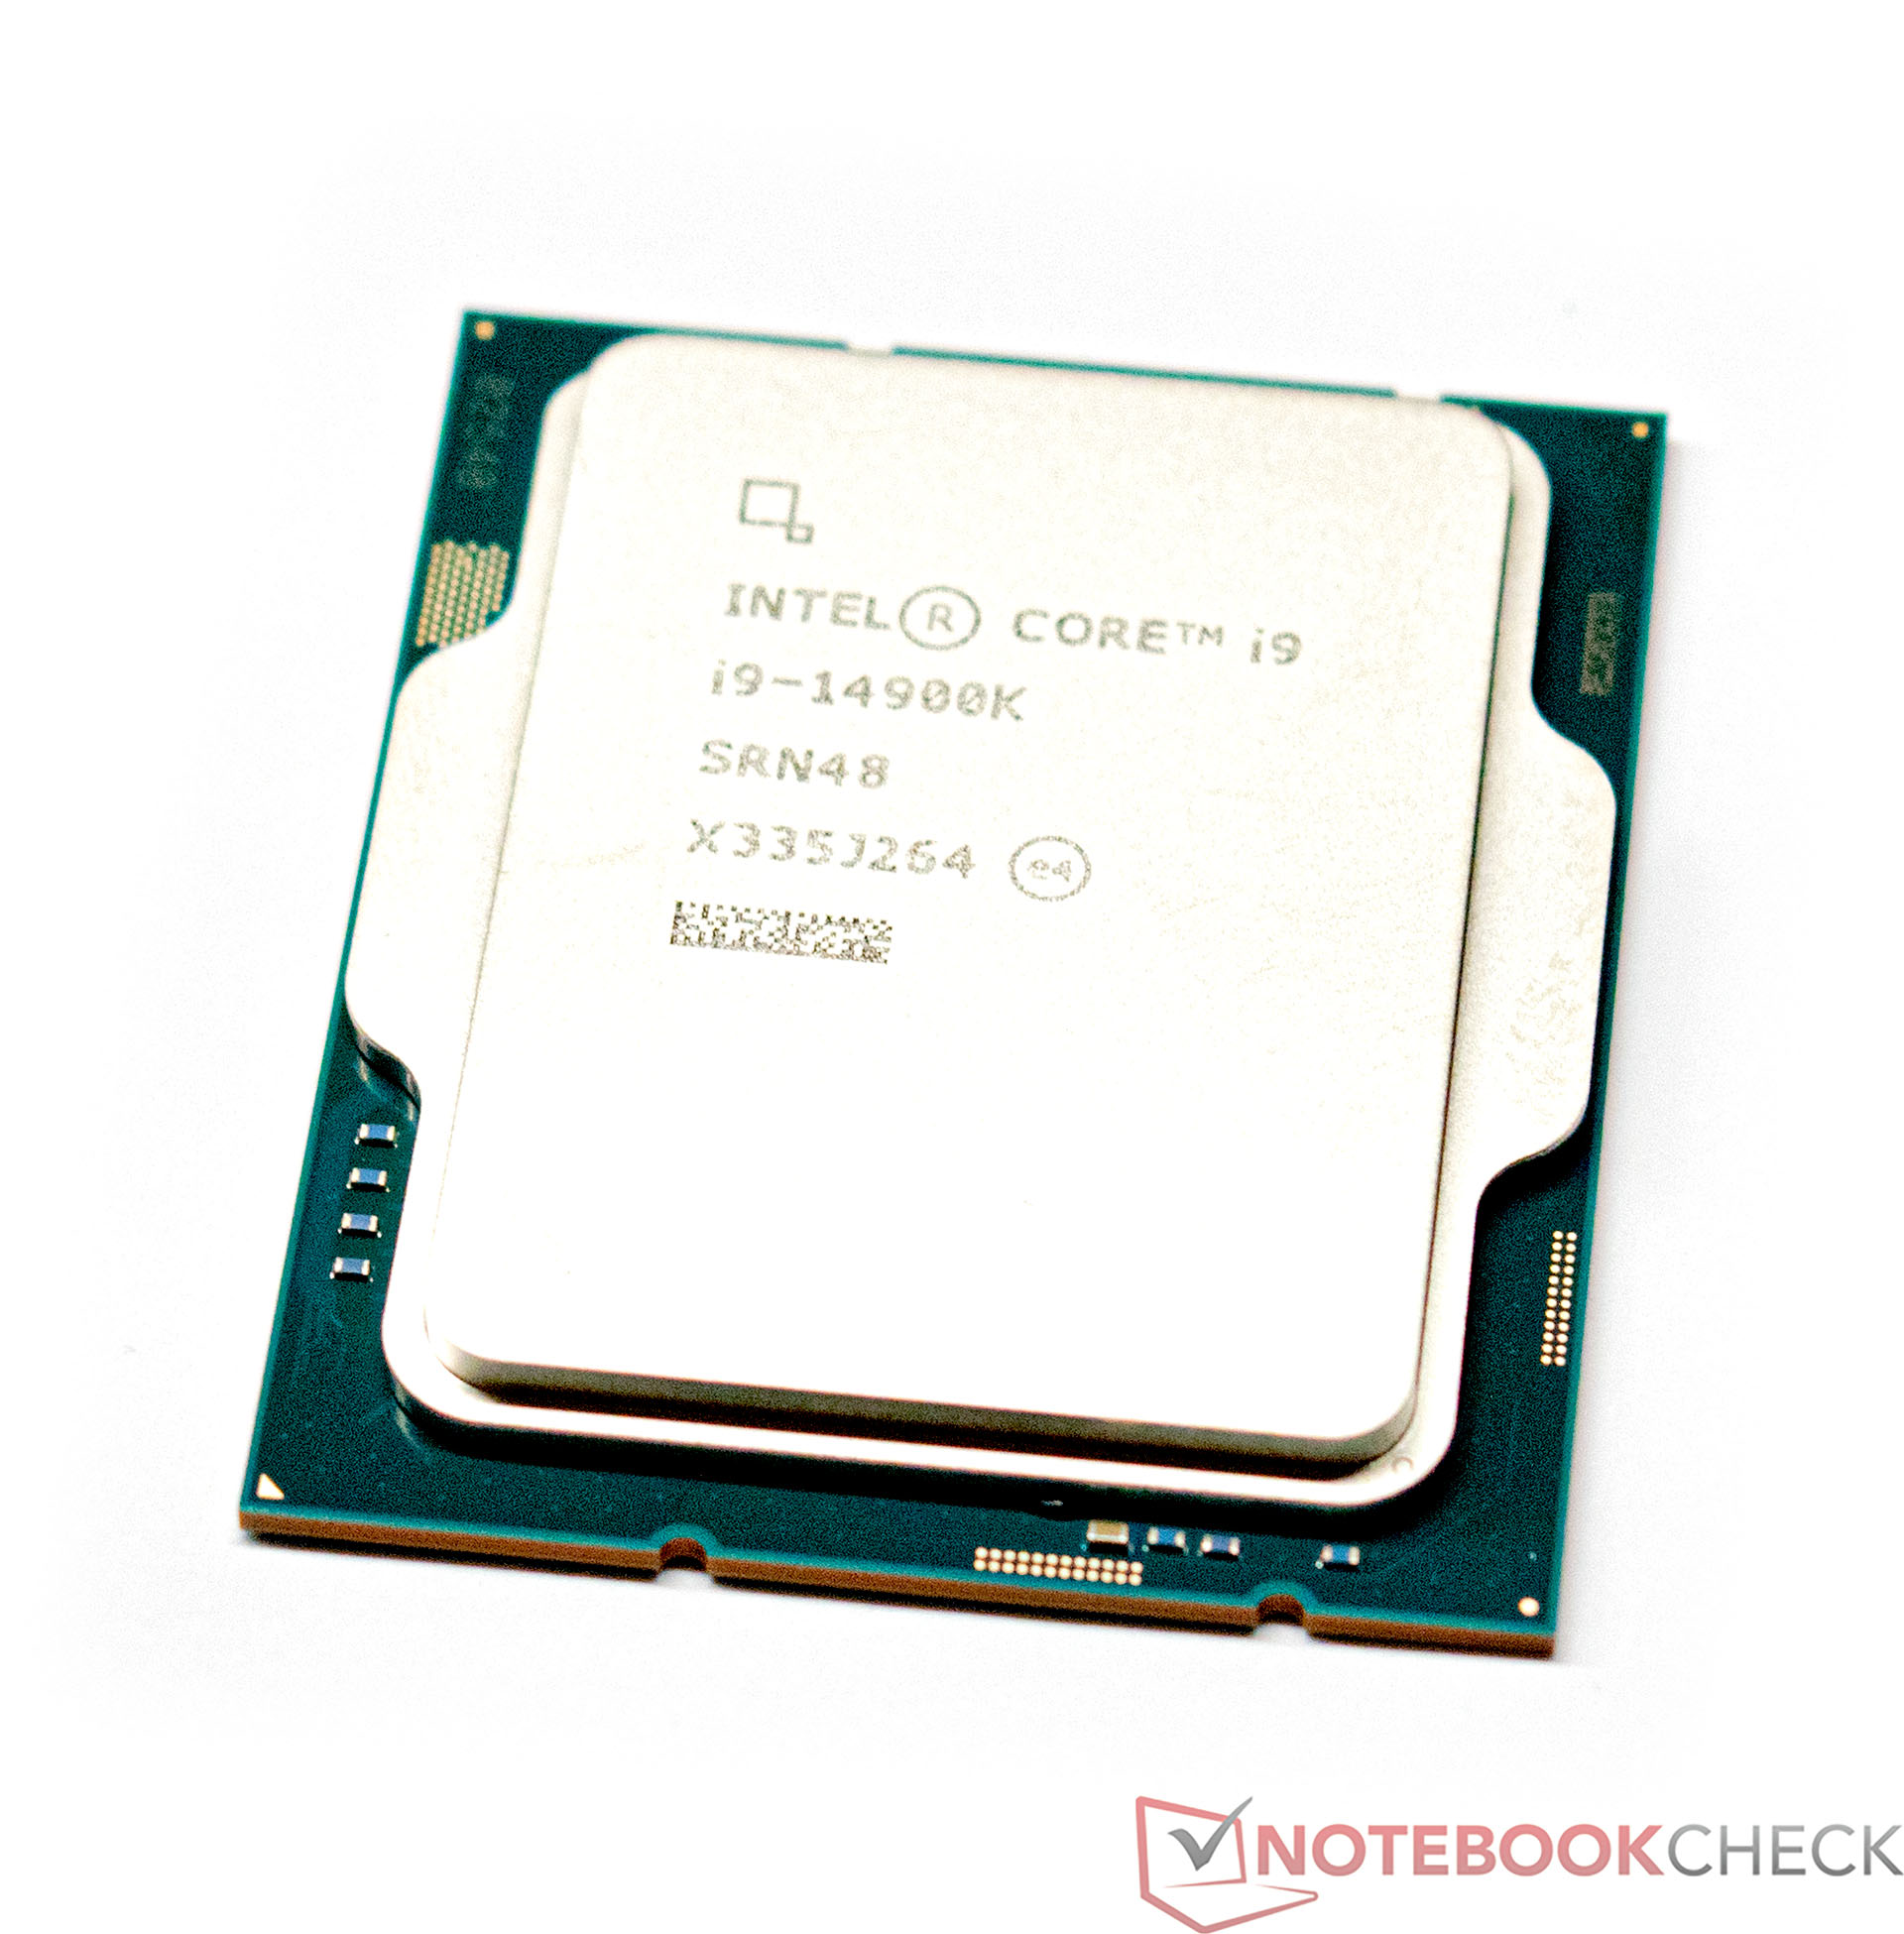
Intel Core i9-14900K and Intel Core i5-14600K review - With 6 GHz out of the box against AMD's X3D processors
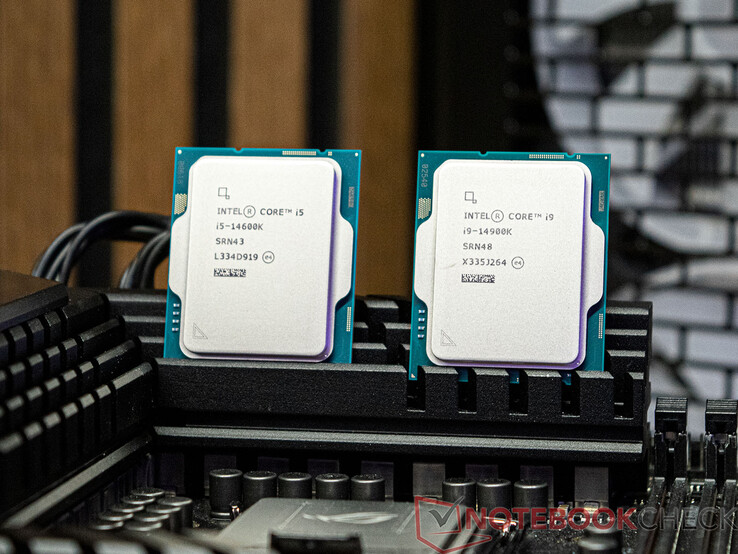
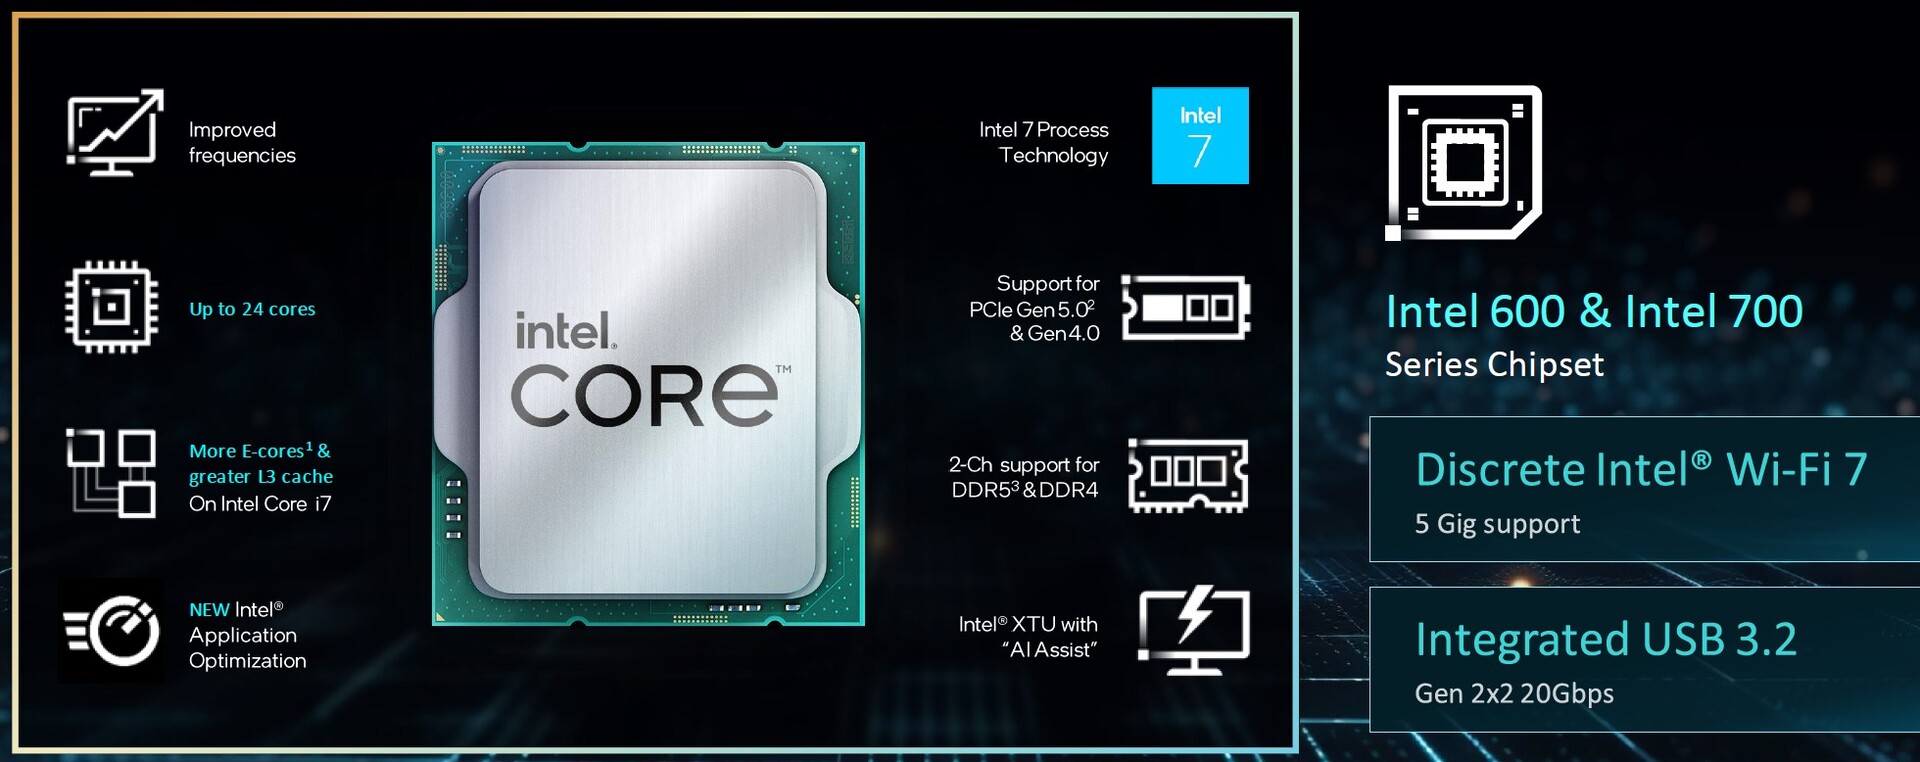
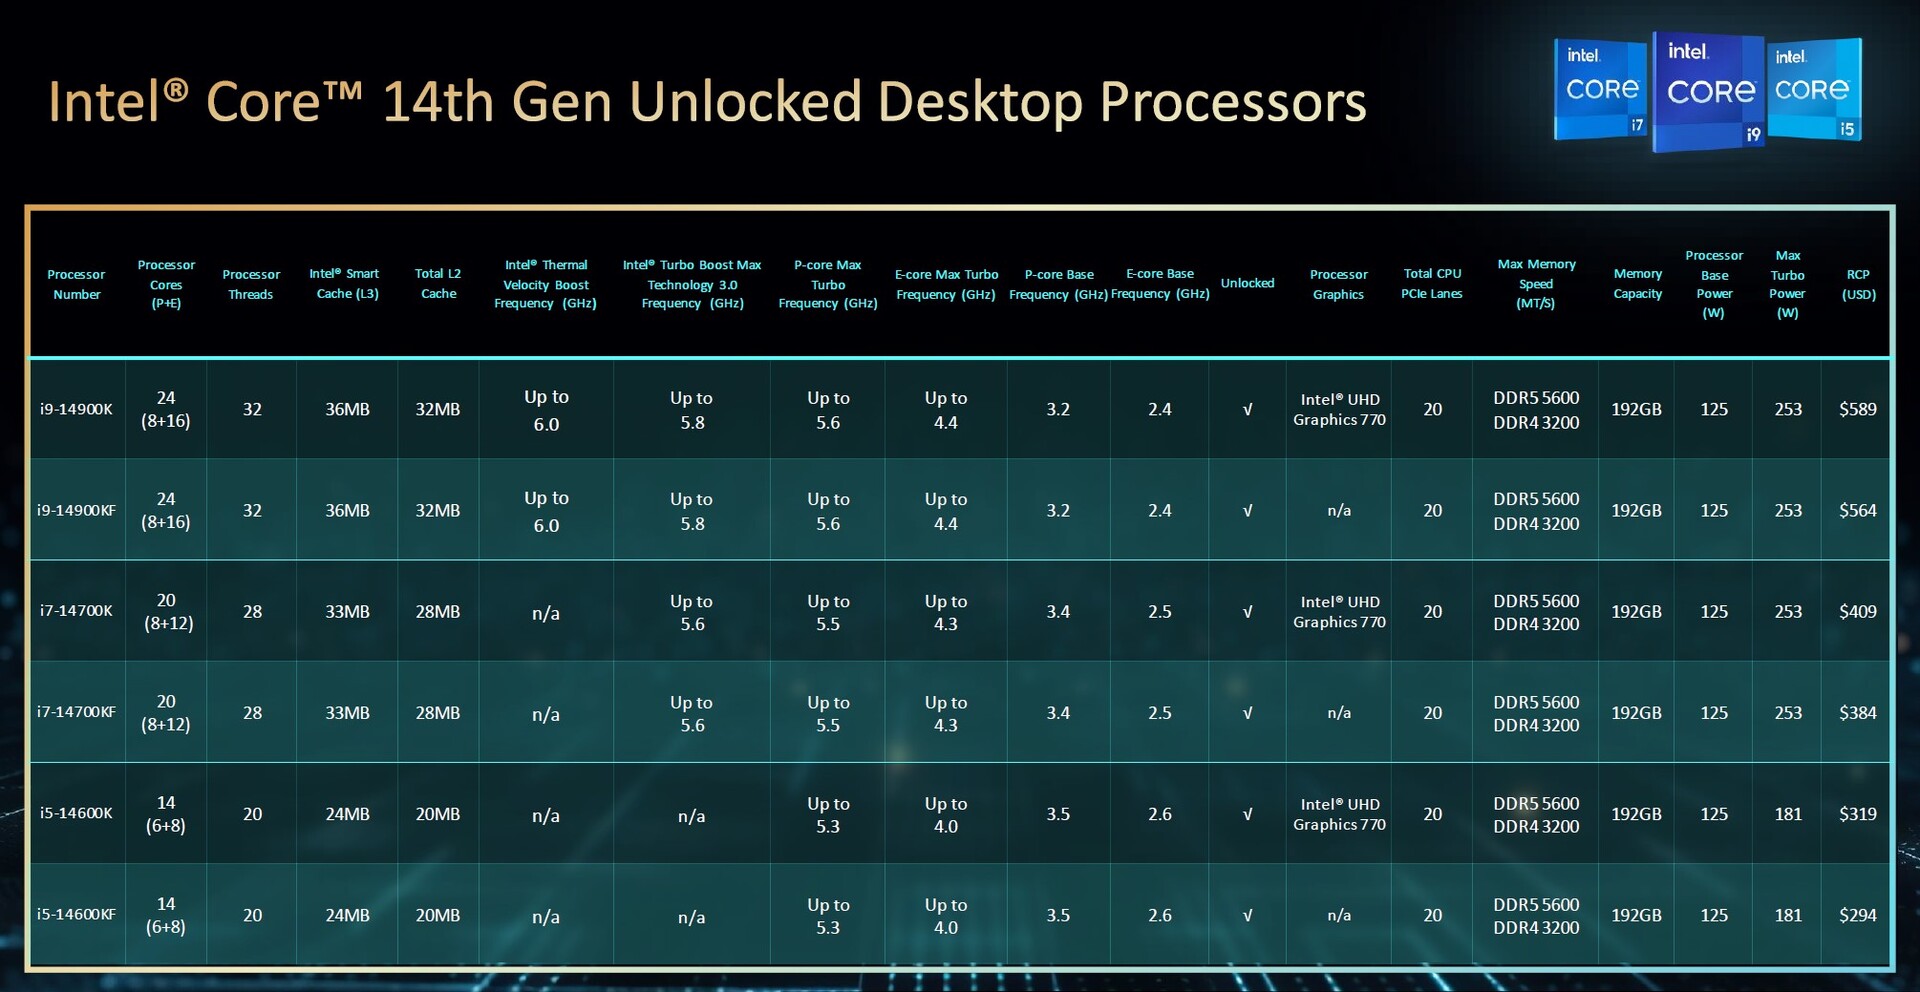
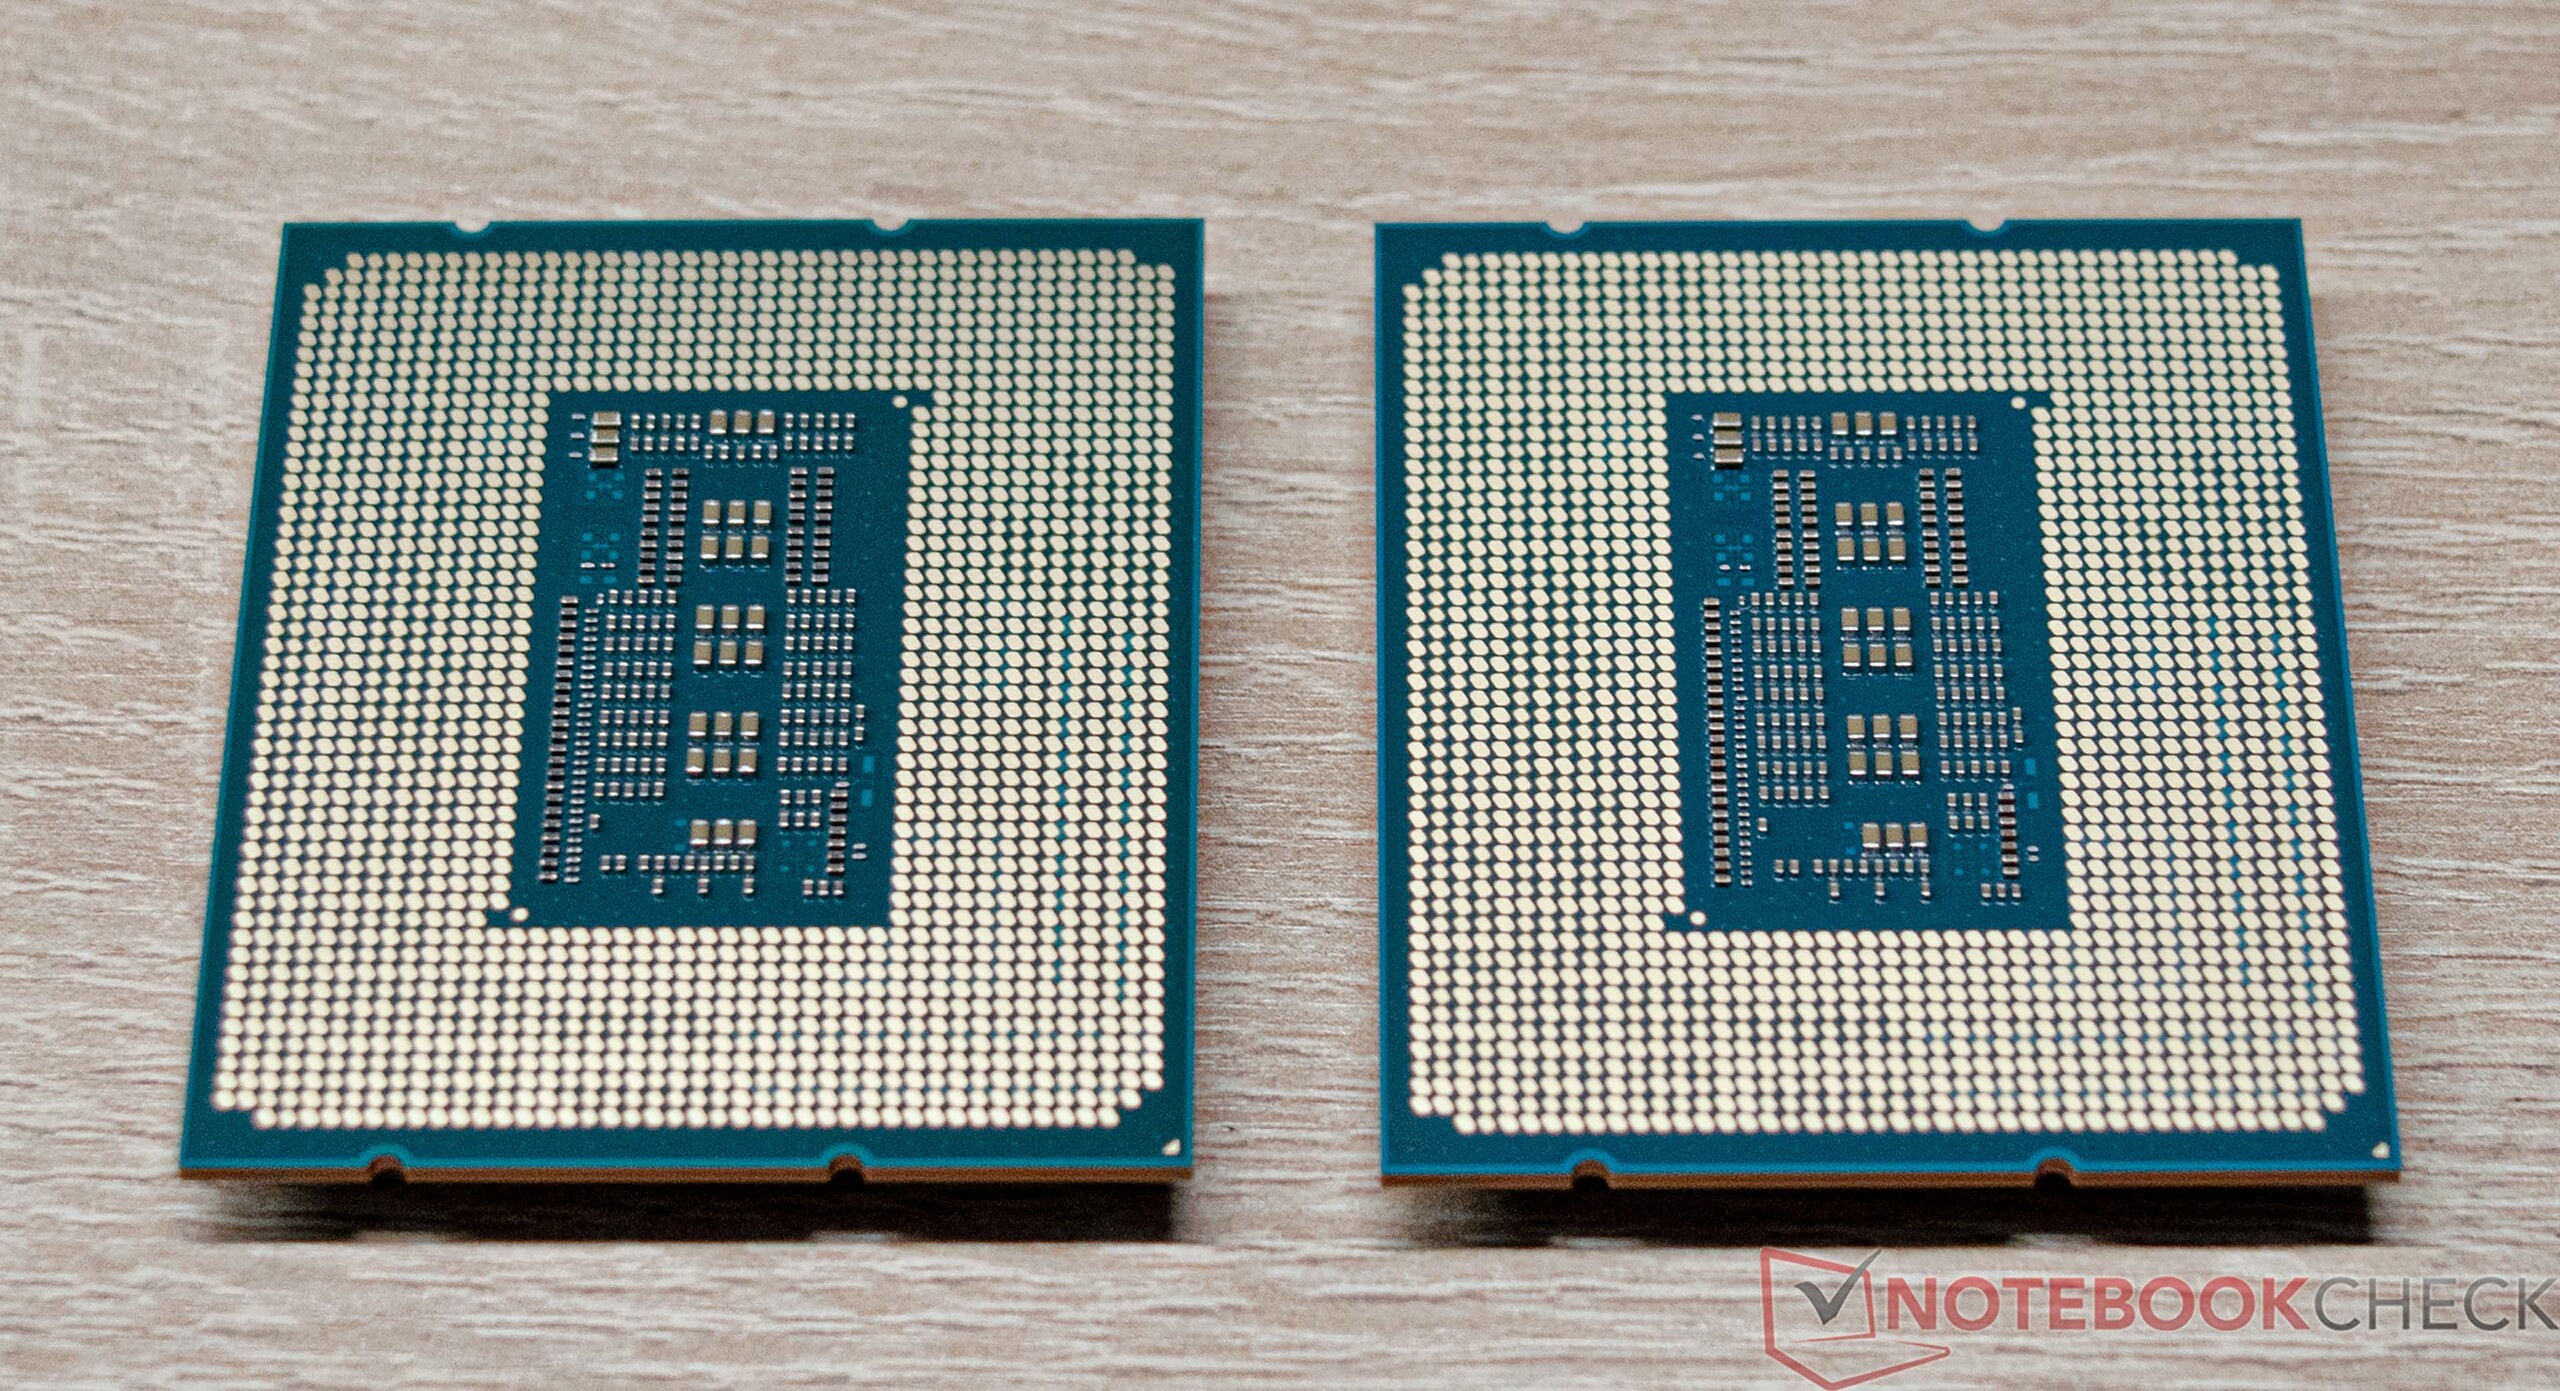
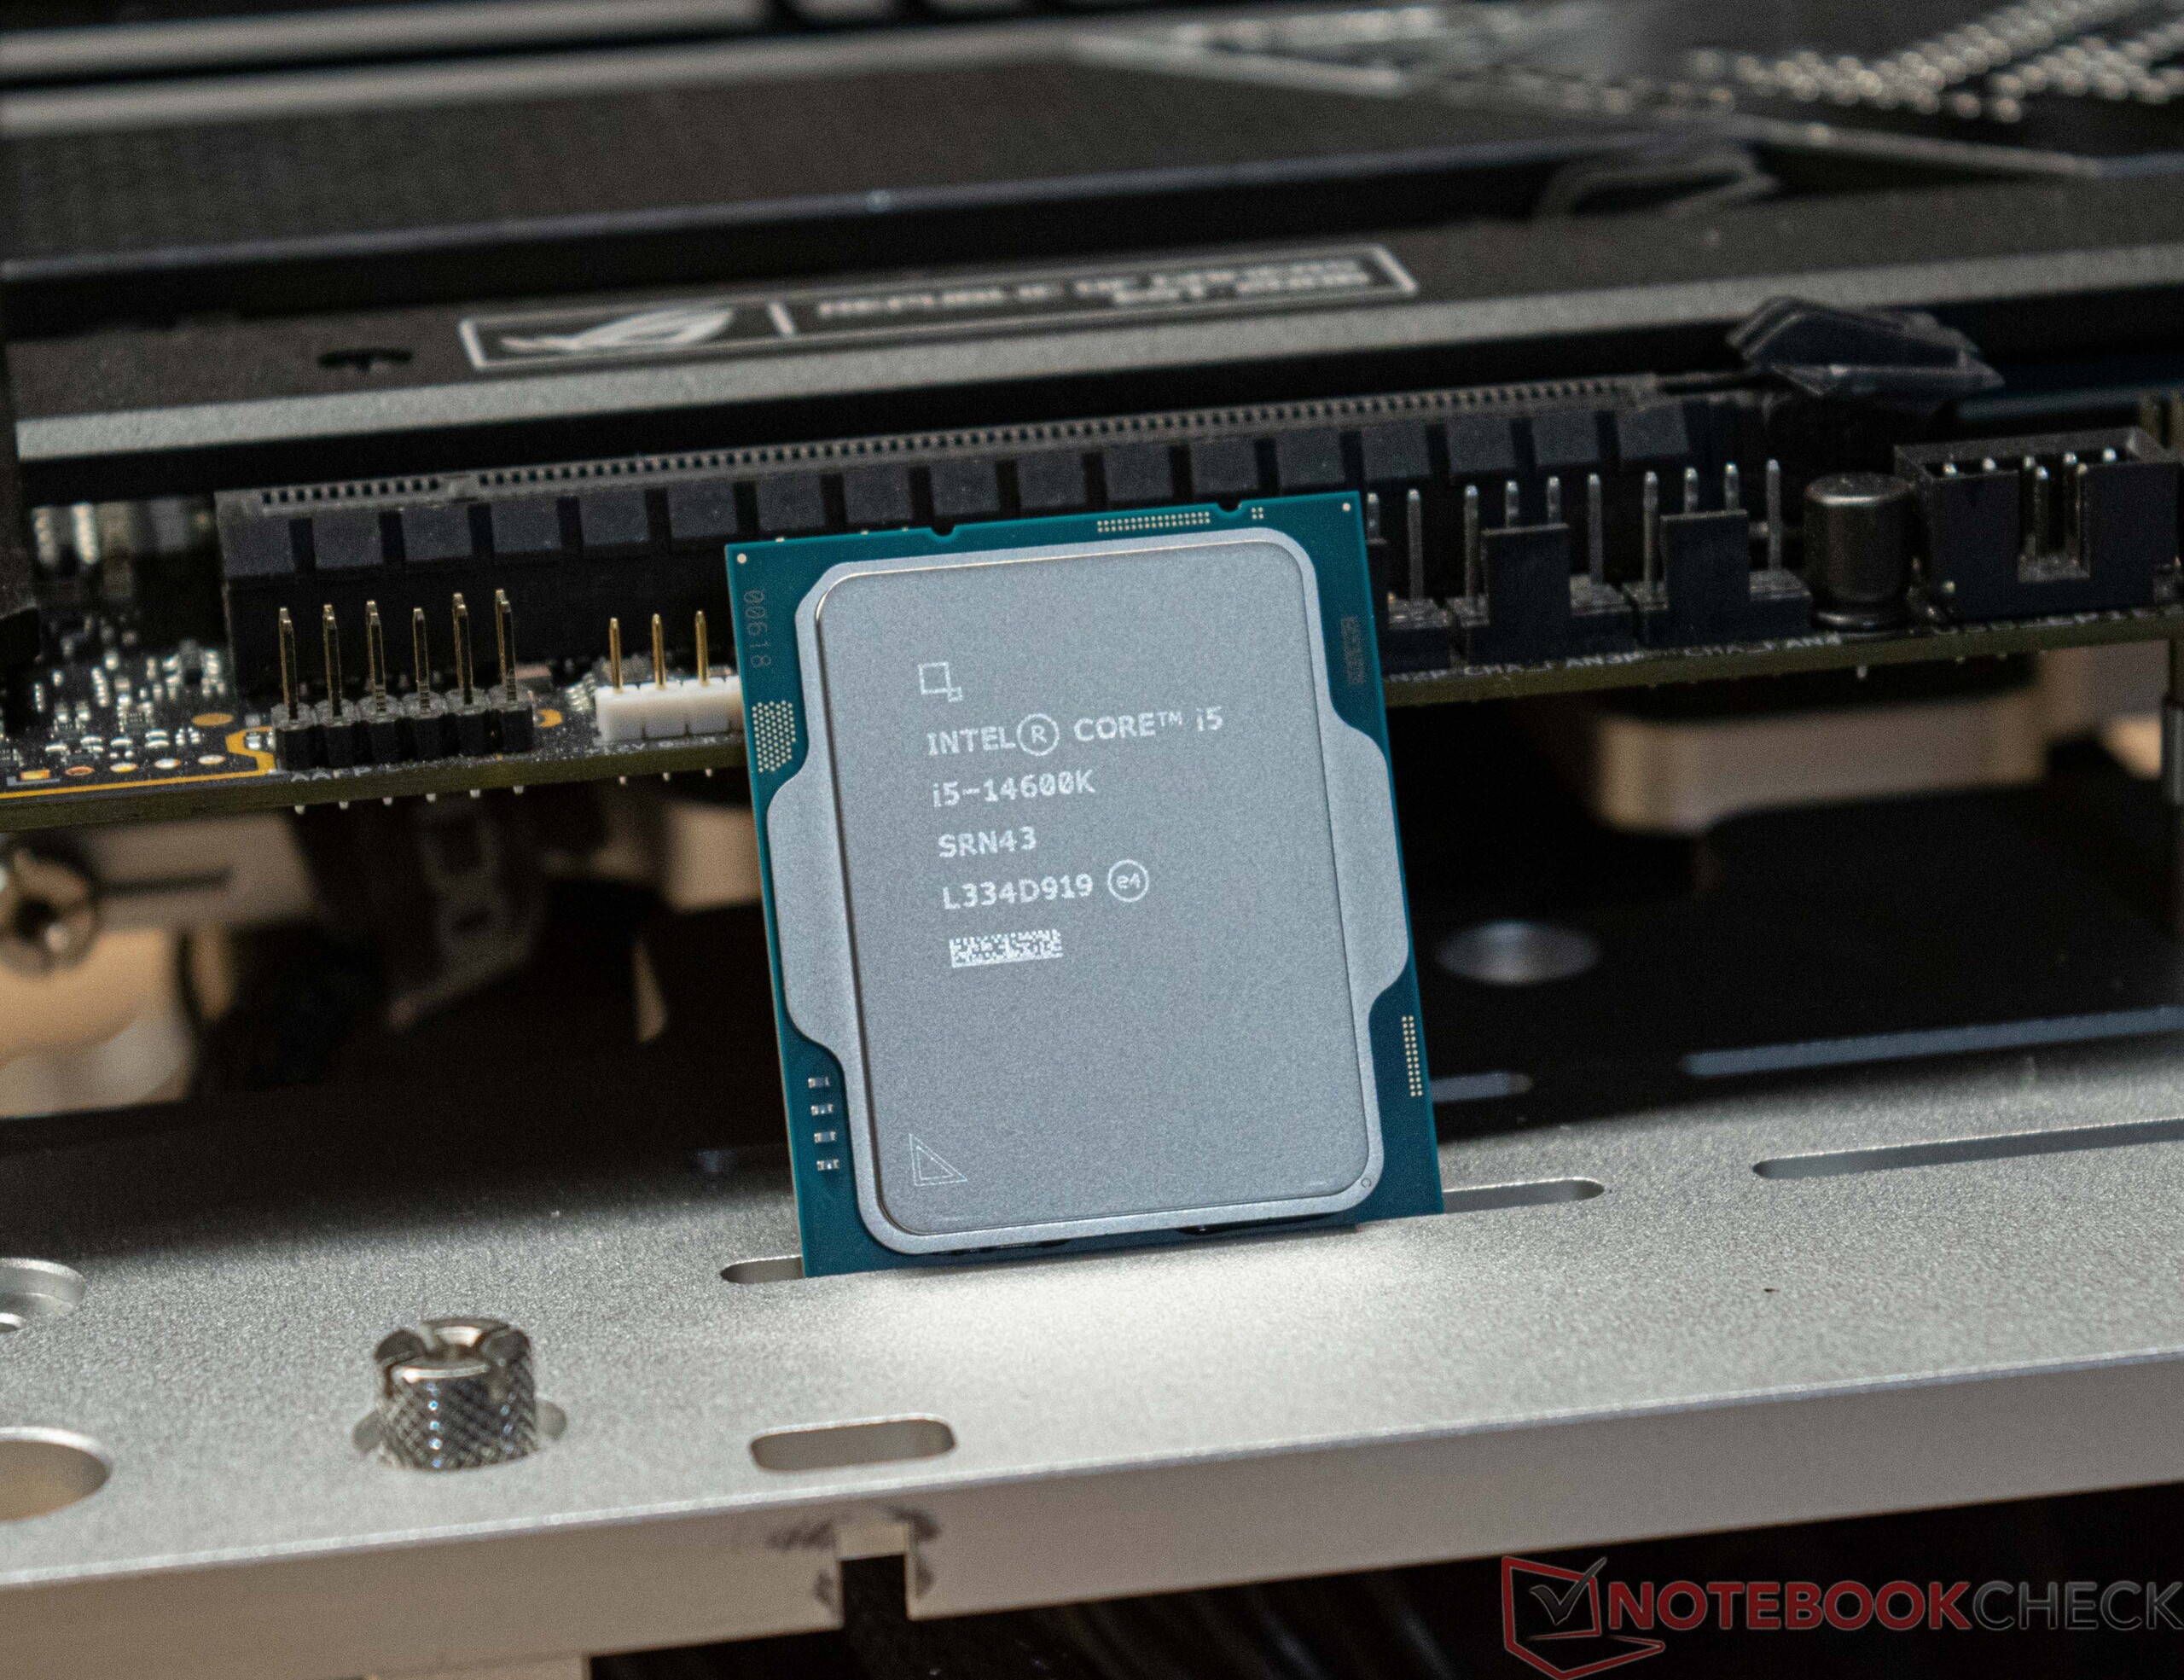
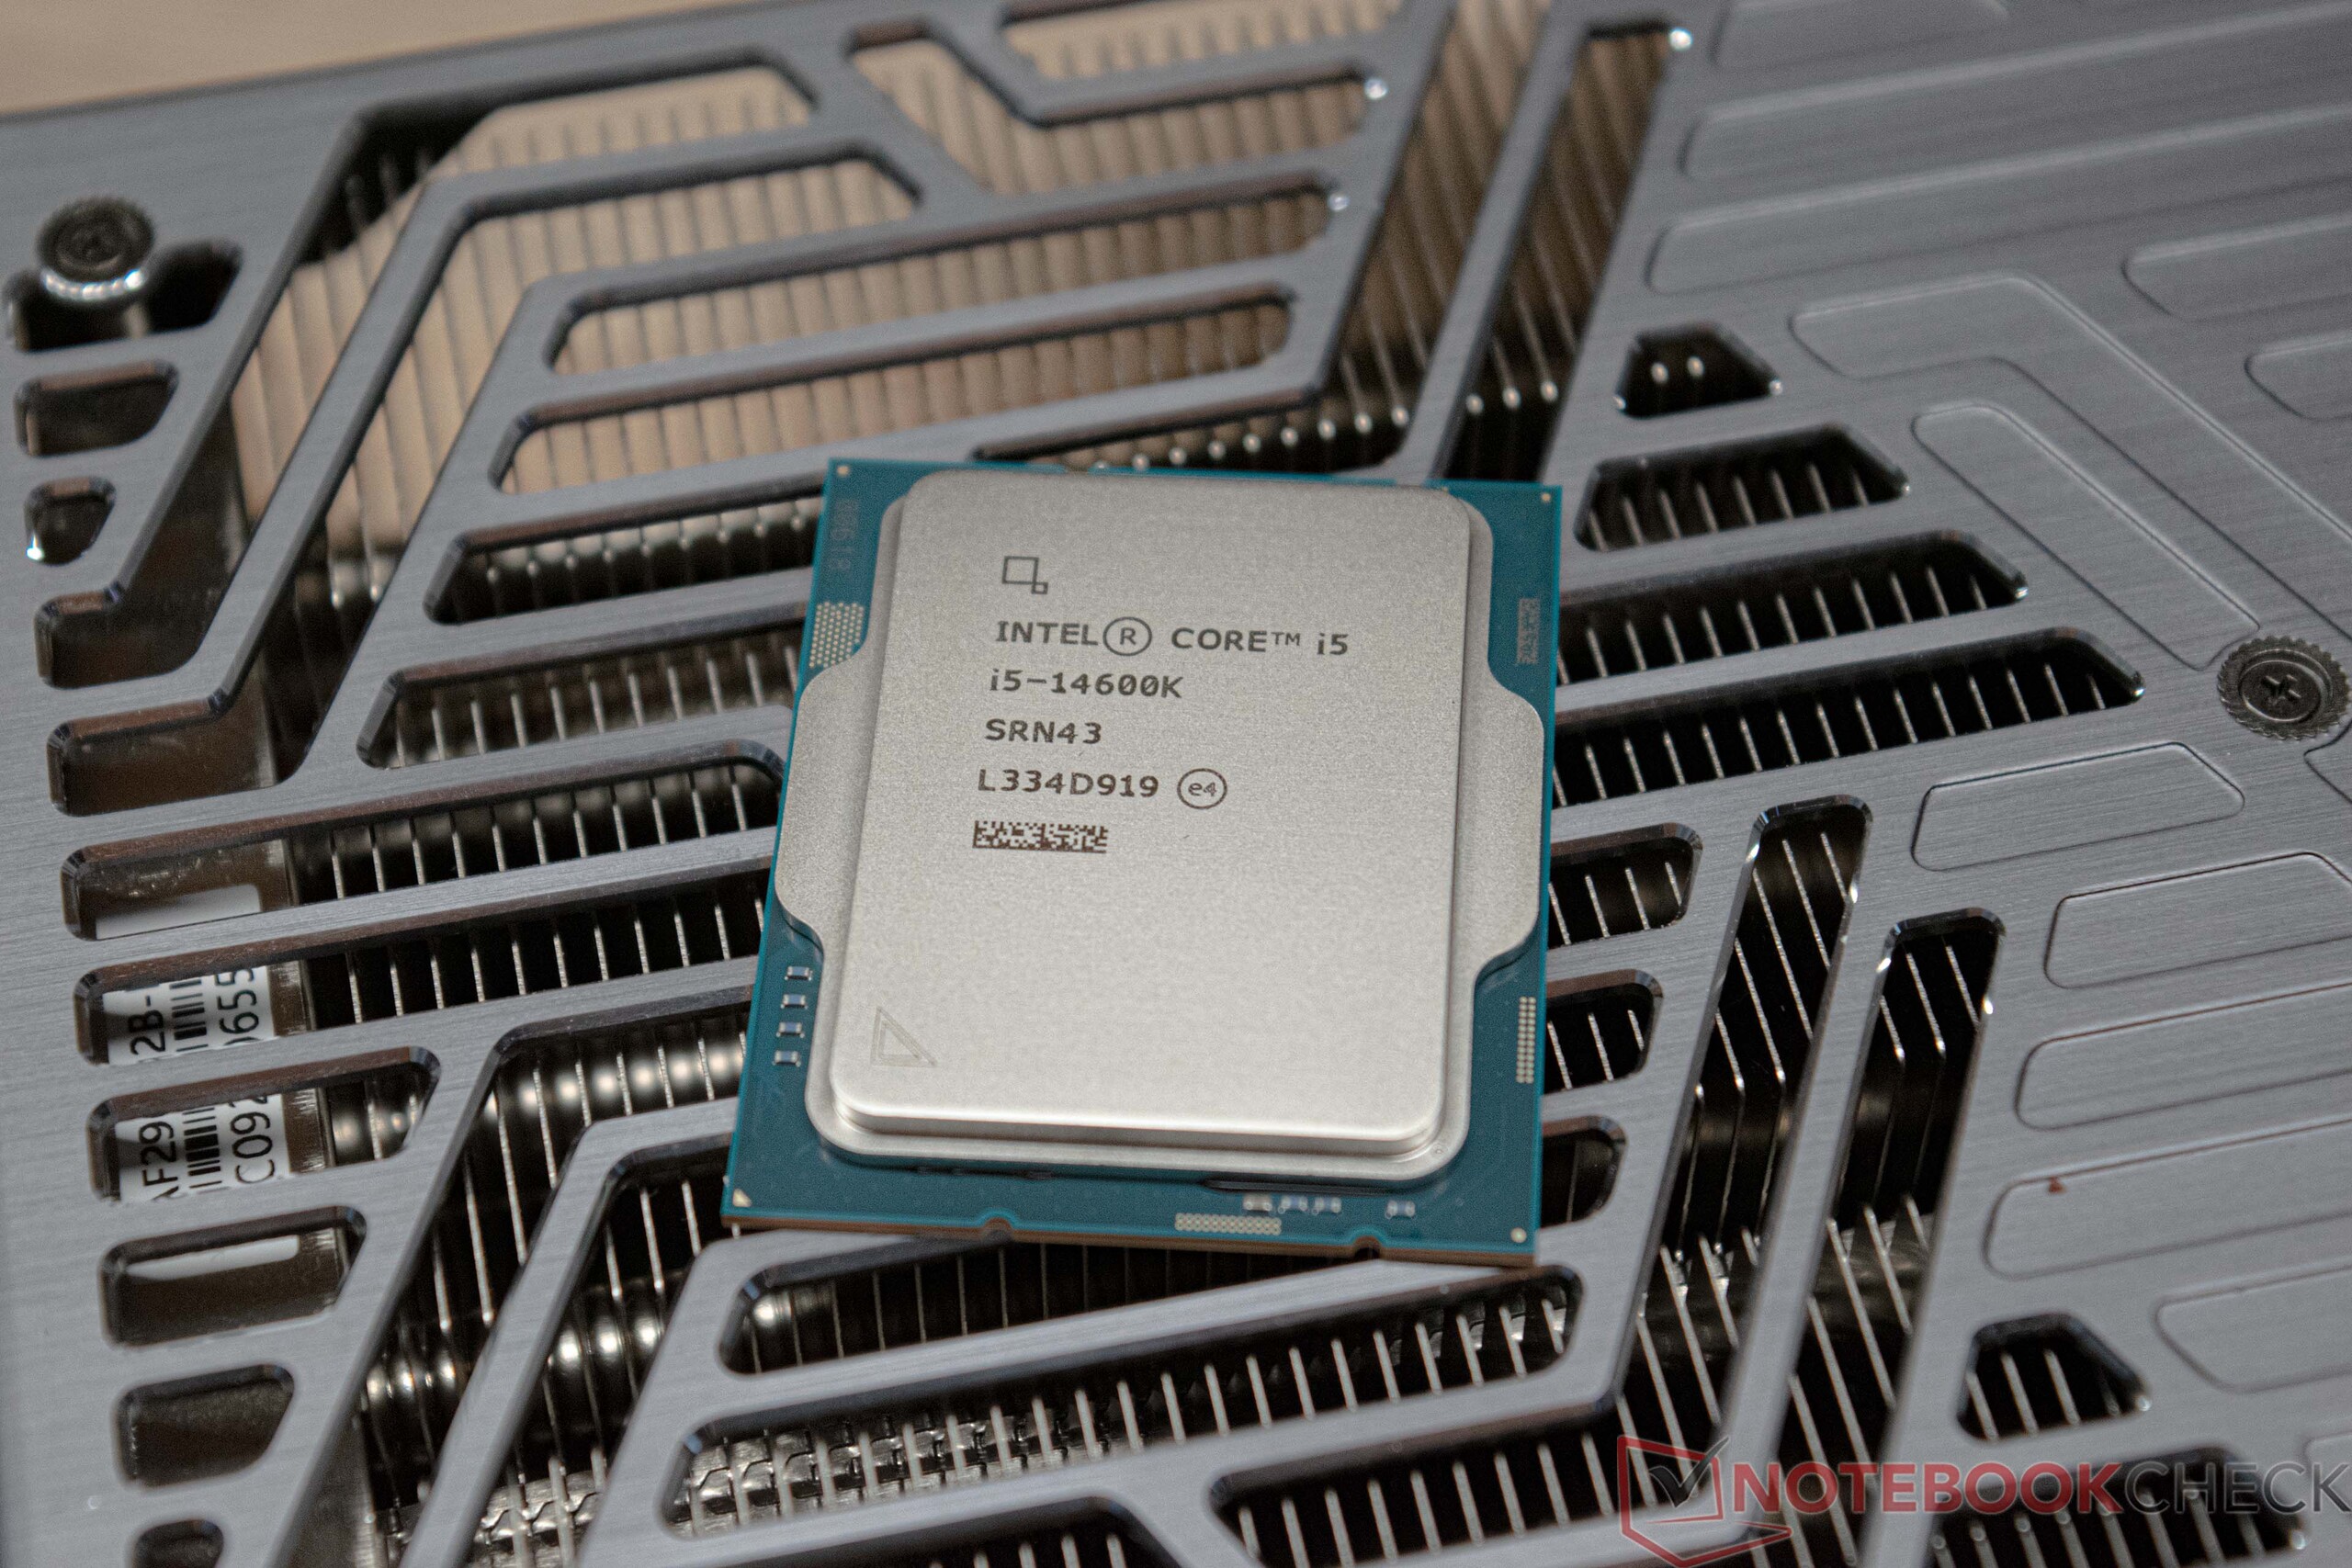
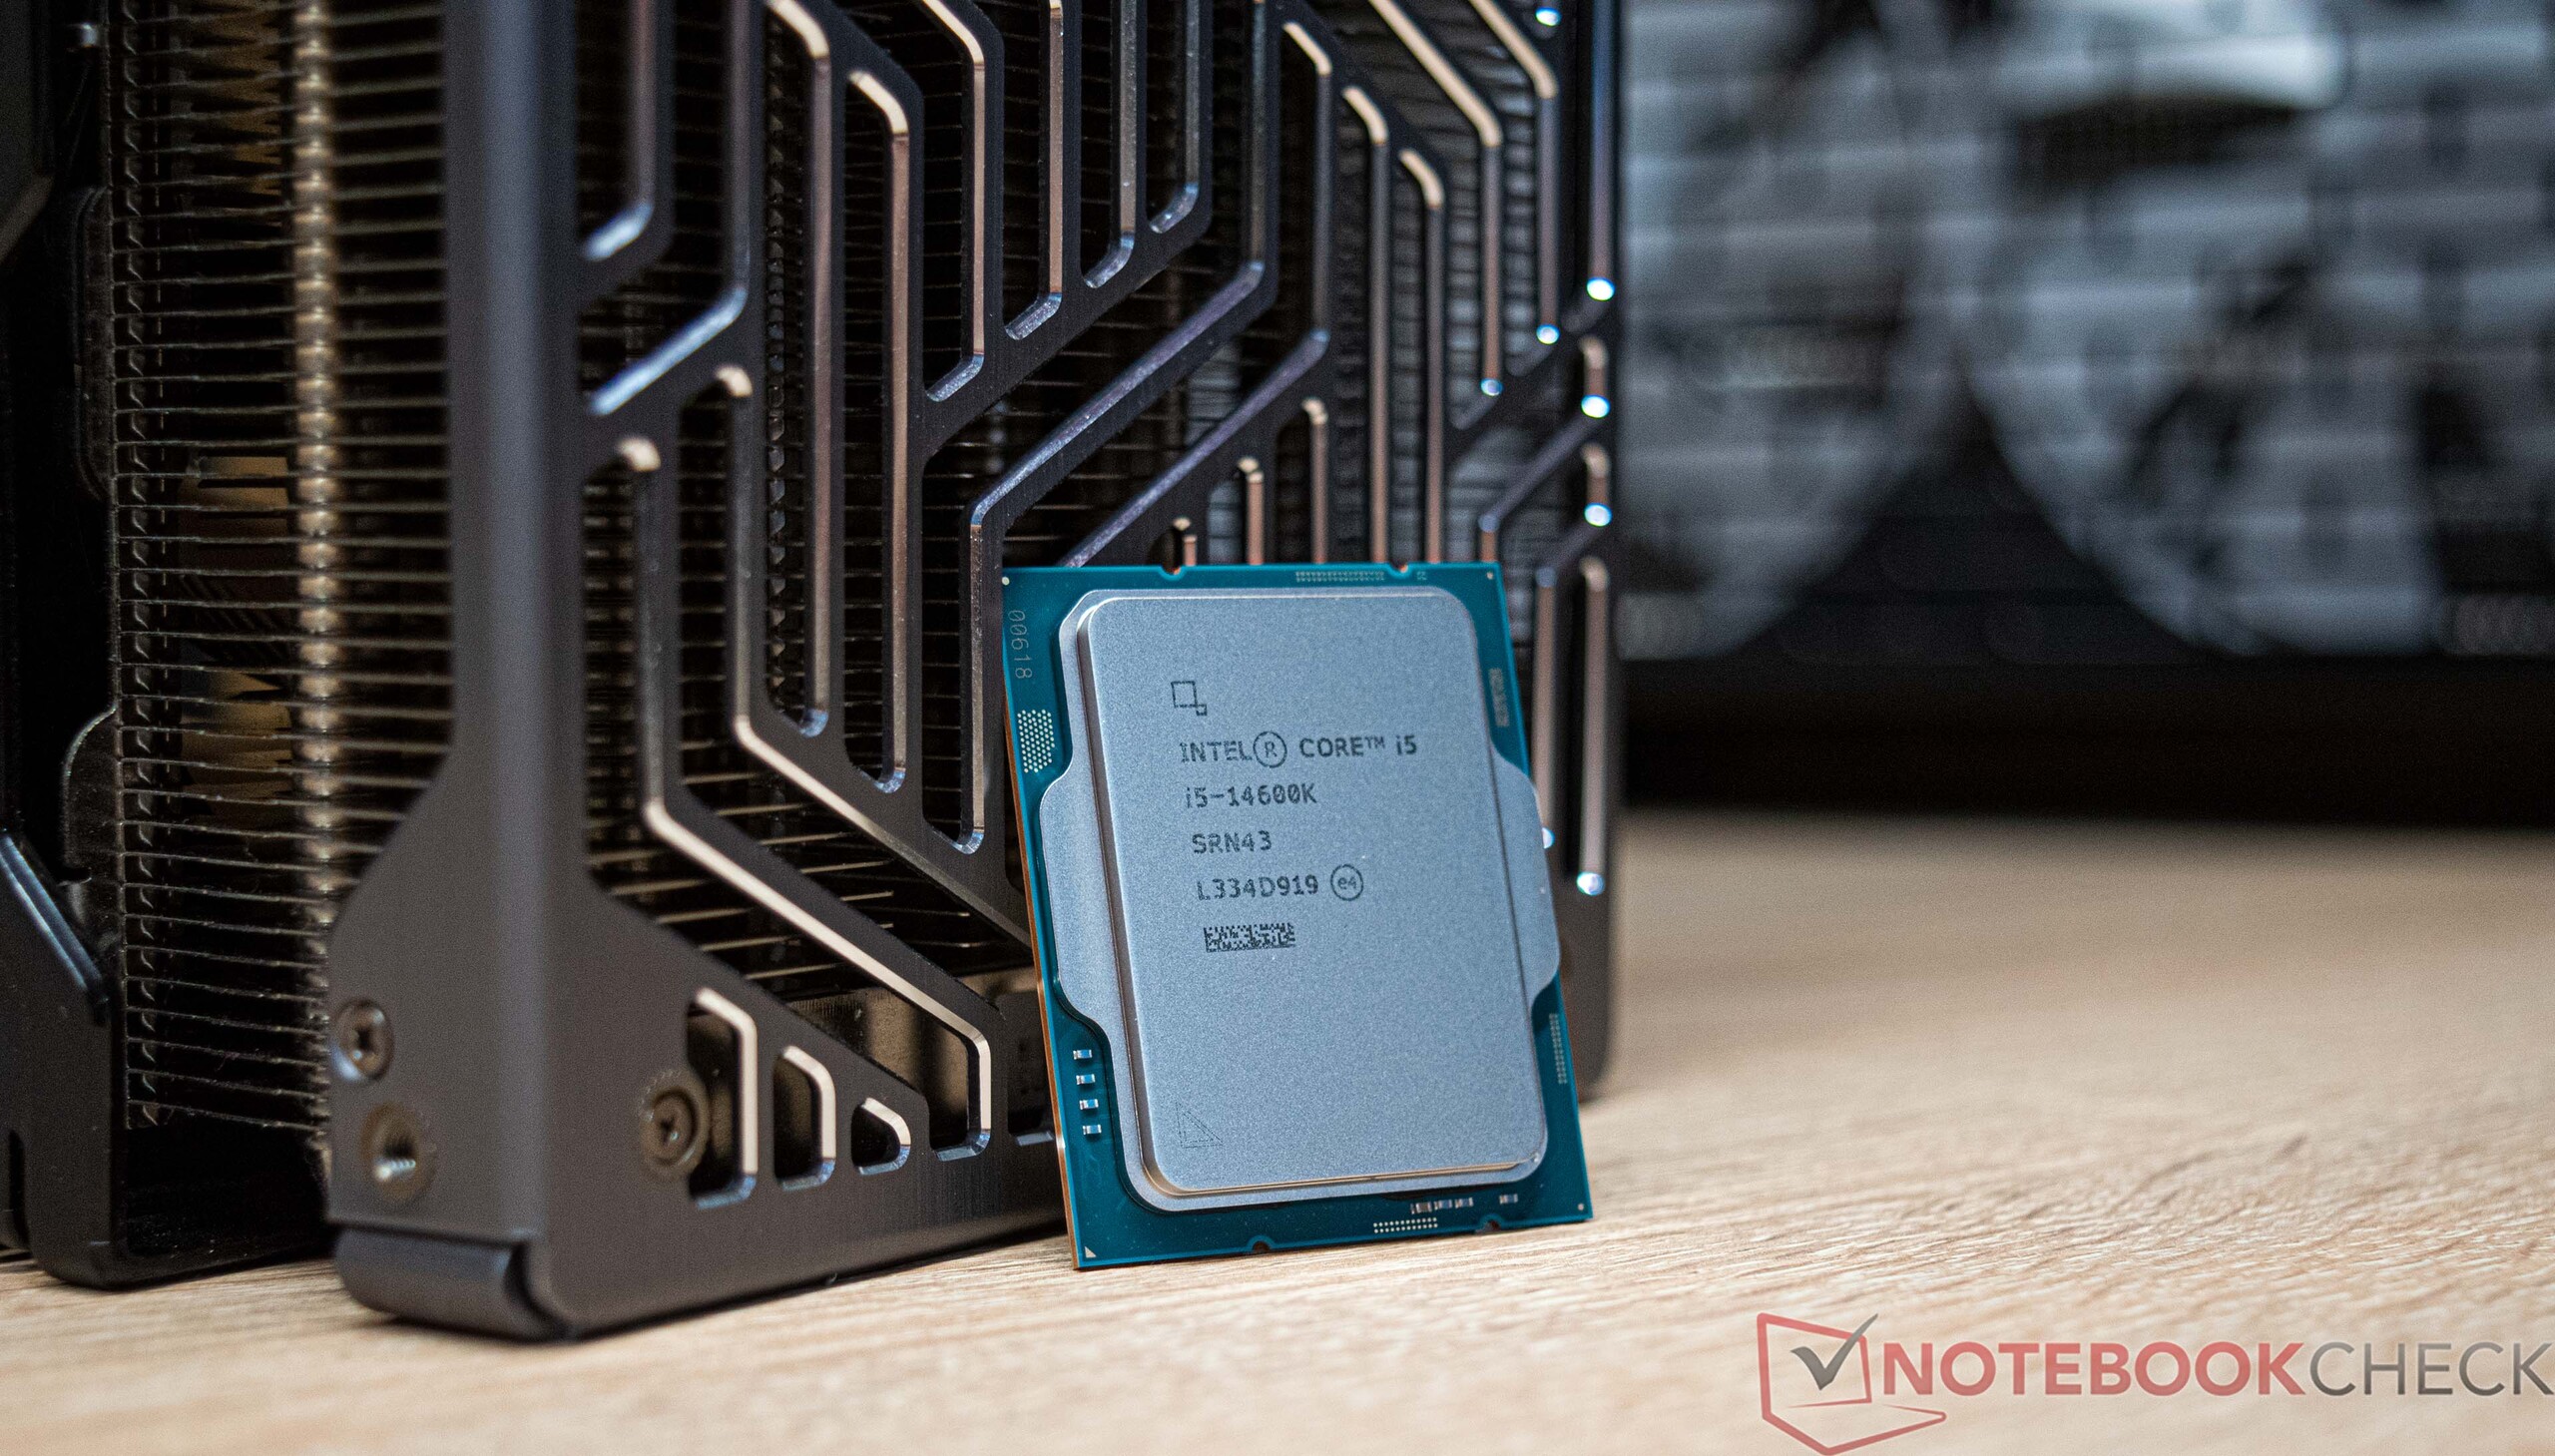
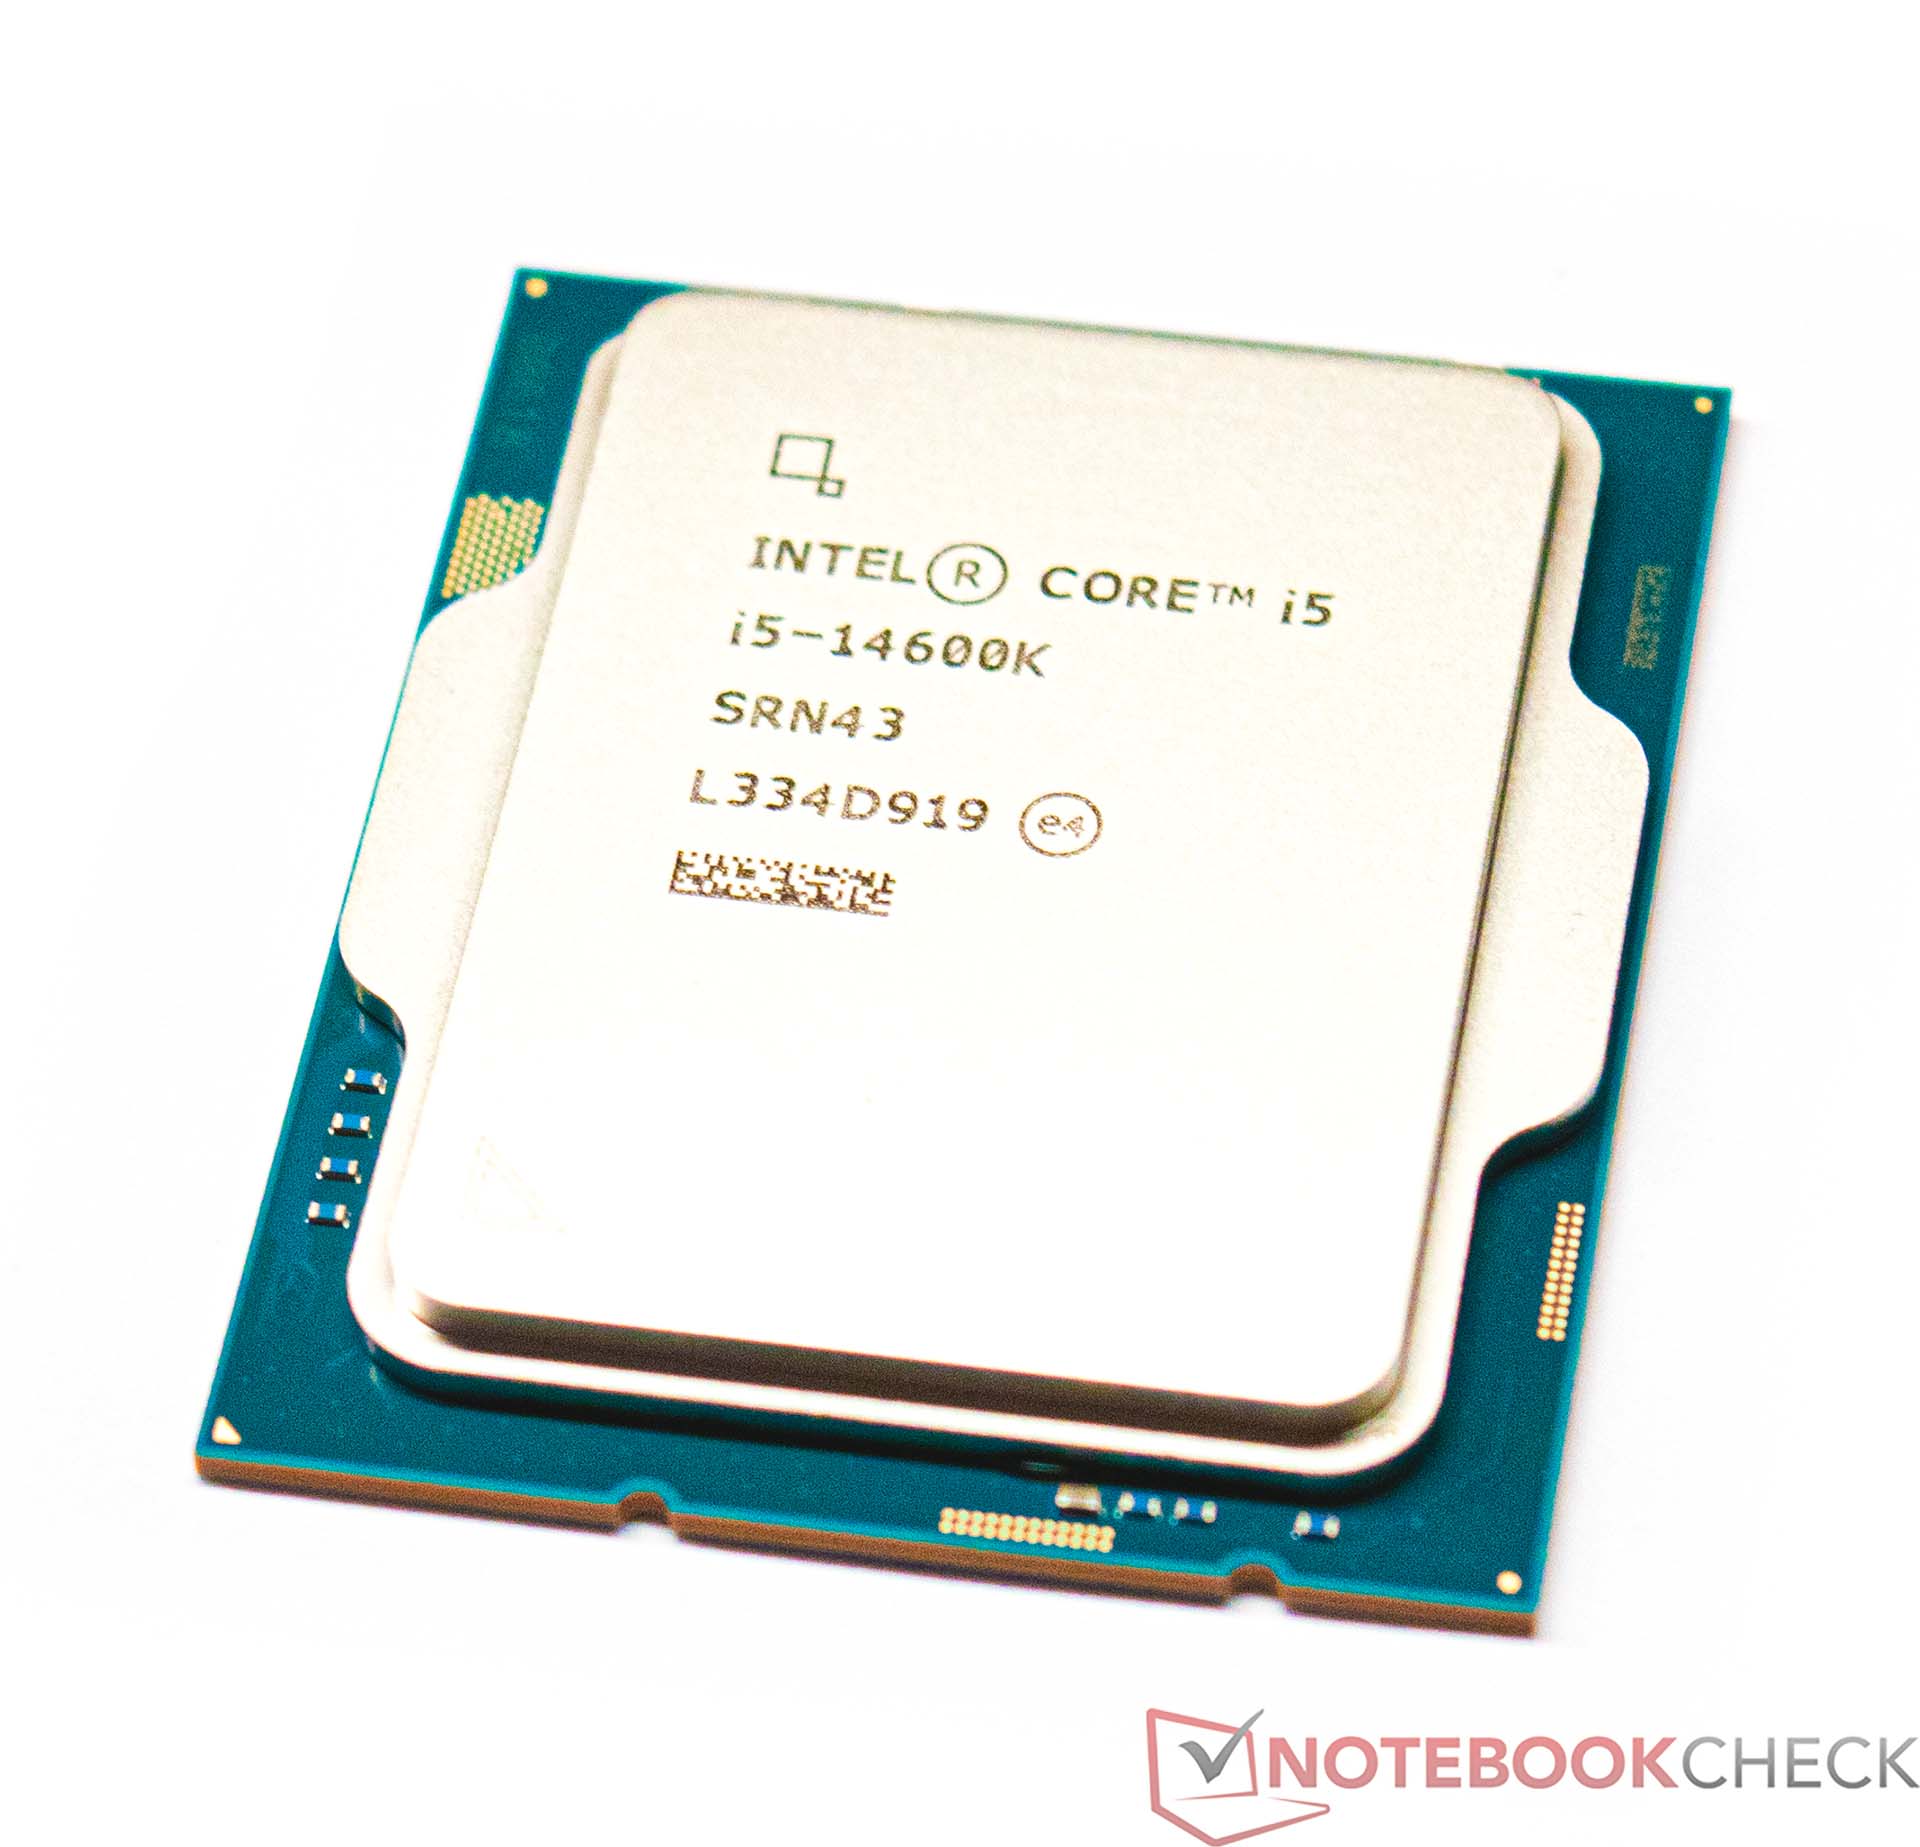
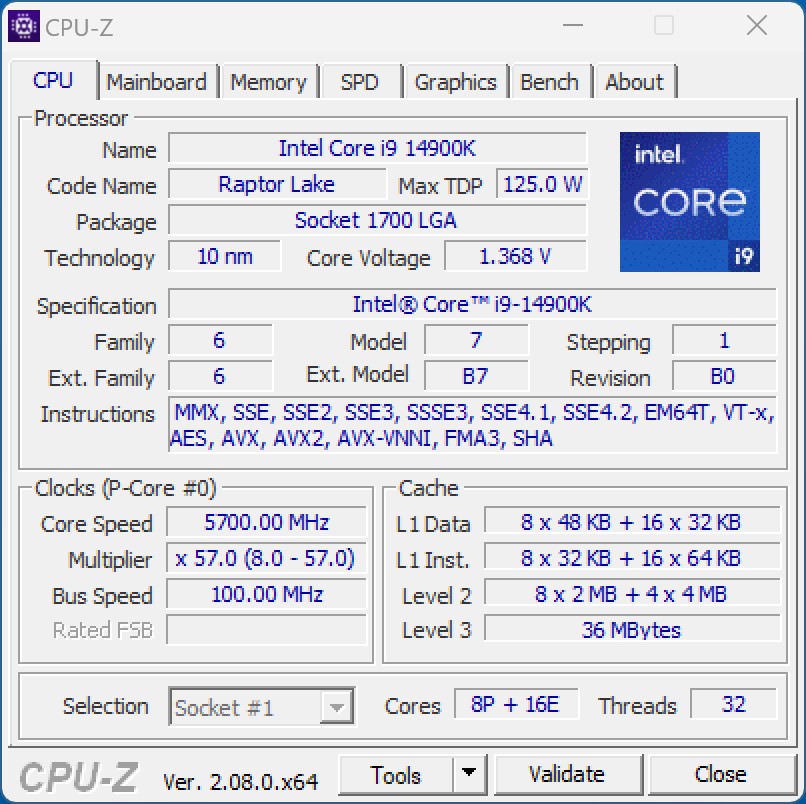
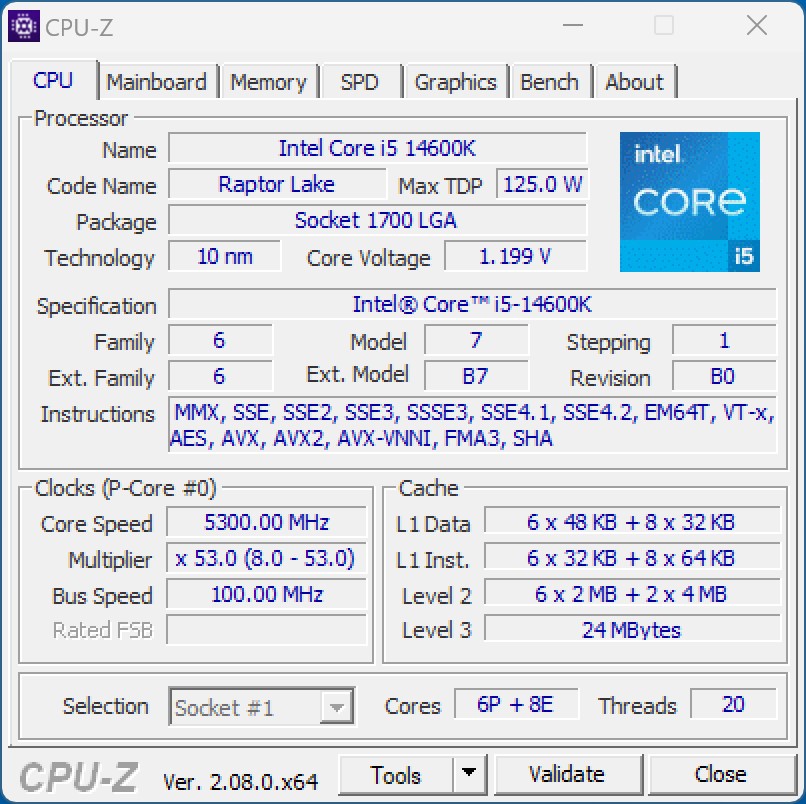
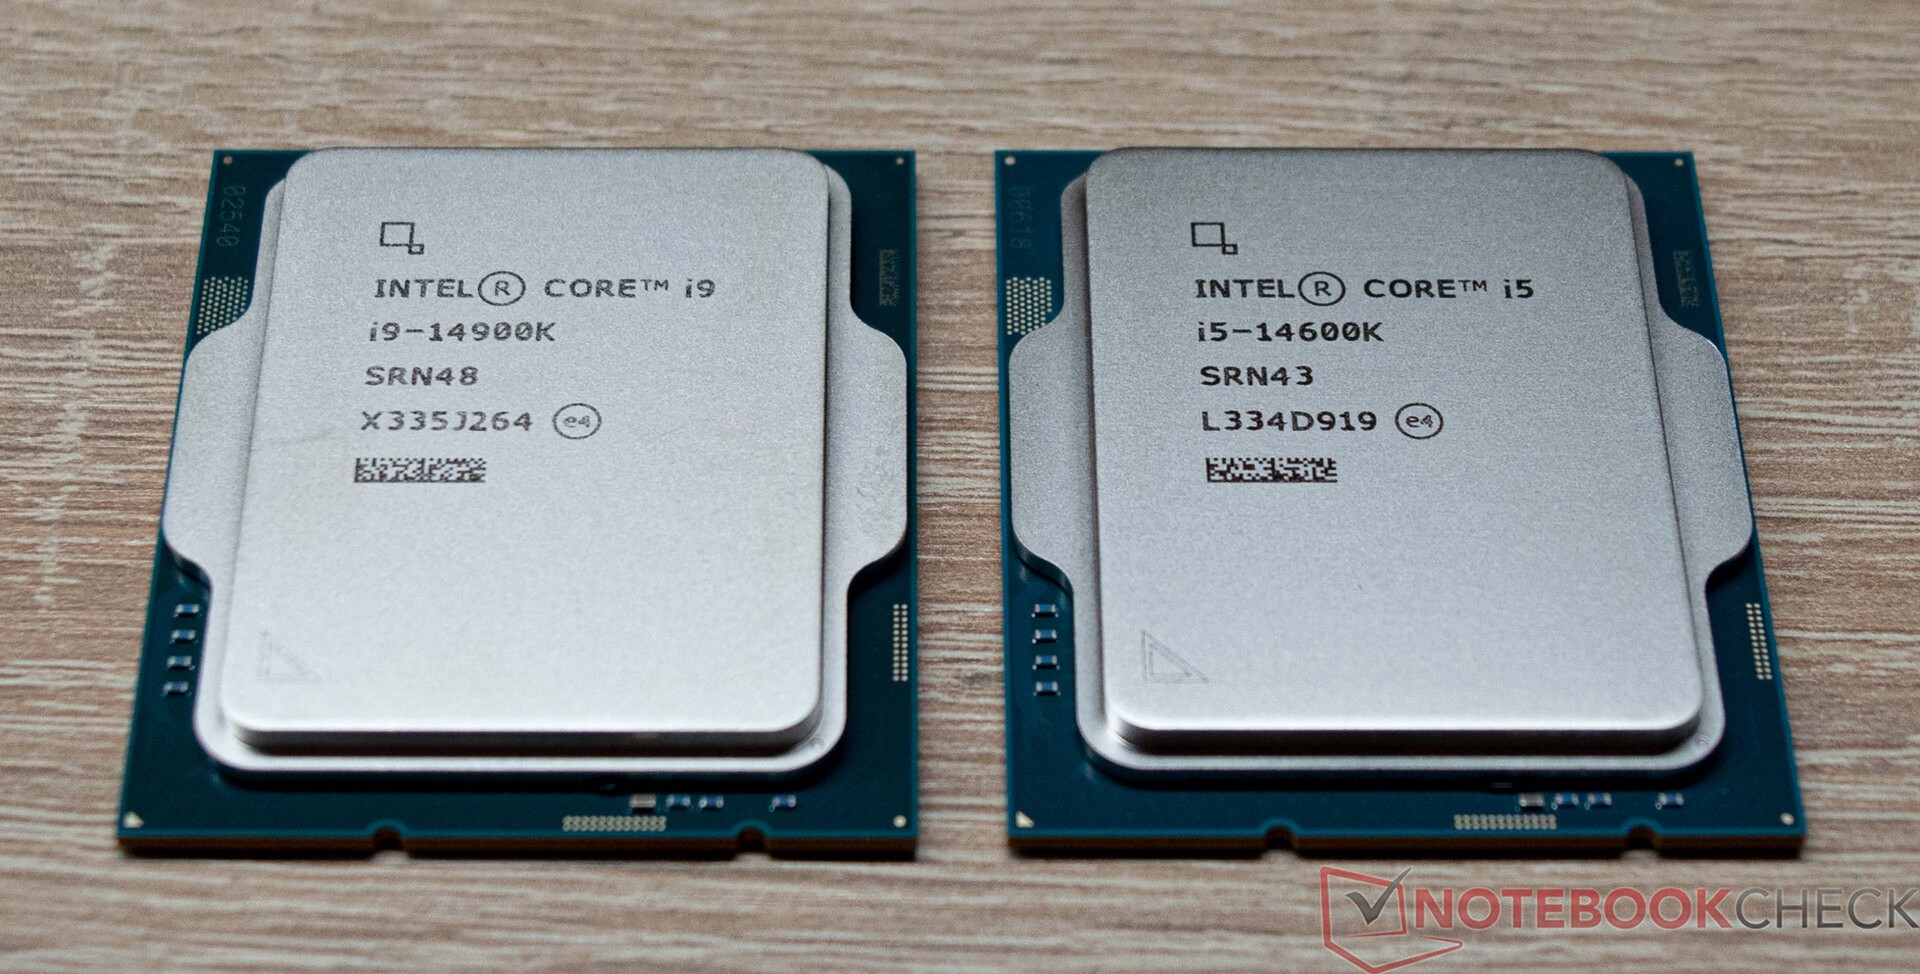
Against the expectations that it would introduce a new socket after two years, Intel continues to use the 1700 socket going into its 14th generation of the Core processors. The top model, the Intel Core i9-14900K, features a total of 24 native computing cores and 32 threads, which is the same as was already available in the Intel Core i9-13900K. But Intel has introduced some improvements in clock speeds that now reach the 6.0-GHz limit directly. We were also able to document this in our test, so these aren't only empty promises made by the manufacturer. Unfortunately, Intel hasn't made many changes to its power consumption, so at up to 253 watts, the new flagship is given the same PL2 value that we already know. If you additionally deactivate all the restrictions in the BIOS, its power consumption continues to significantly increase further, as we will see later in our test. In addition to the top model, we will also be taking a closer look at the Intel Core i5-14600K in this test. With 14 cores and 20 threads, it reaches the same numbers as the Intel Core i5-13600K. But Intel has also increased the clock speed on this model, in order to get slightly more performance from its P and E cores.
With that, we don't expect any greater jumps in performance, and Intel also hasn't changed anything about the basic CPU construction. At this point, Intel doesn't offer any counterpart to AMD's 3D V Cache technology, which allowed AMD to score significantly better in the recent past and put some pressure on its competitors.
The prices from Intel also show that we are on the same level here as during the launch of the Raptor Lake S models from last year. Due to the demand, which usually increases in the fourth quarter, it remains to be seen where the new models will actually end up. What also plays a role here (in Europe) is the Euro-to-Dollar exchange rate.
Small Improvements in Intel's 14th Gen Processors
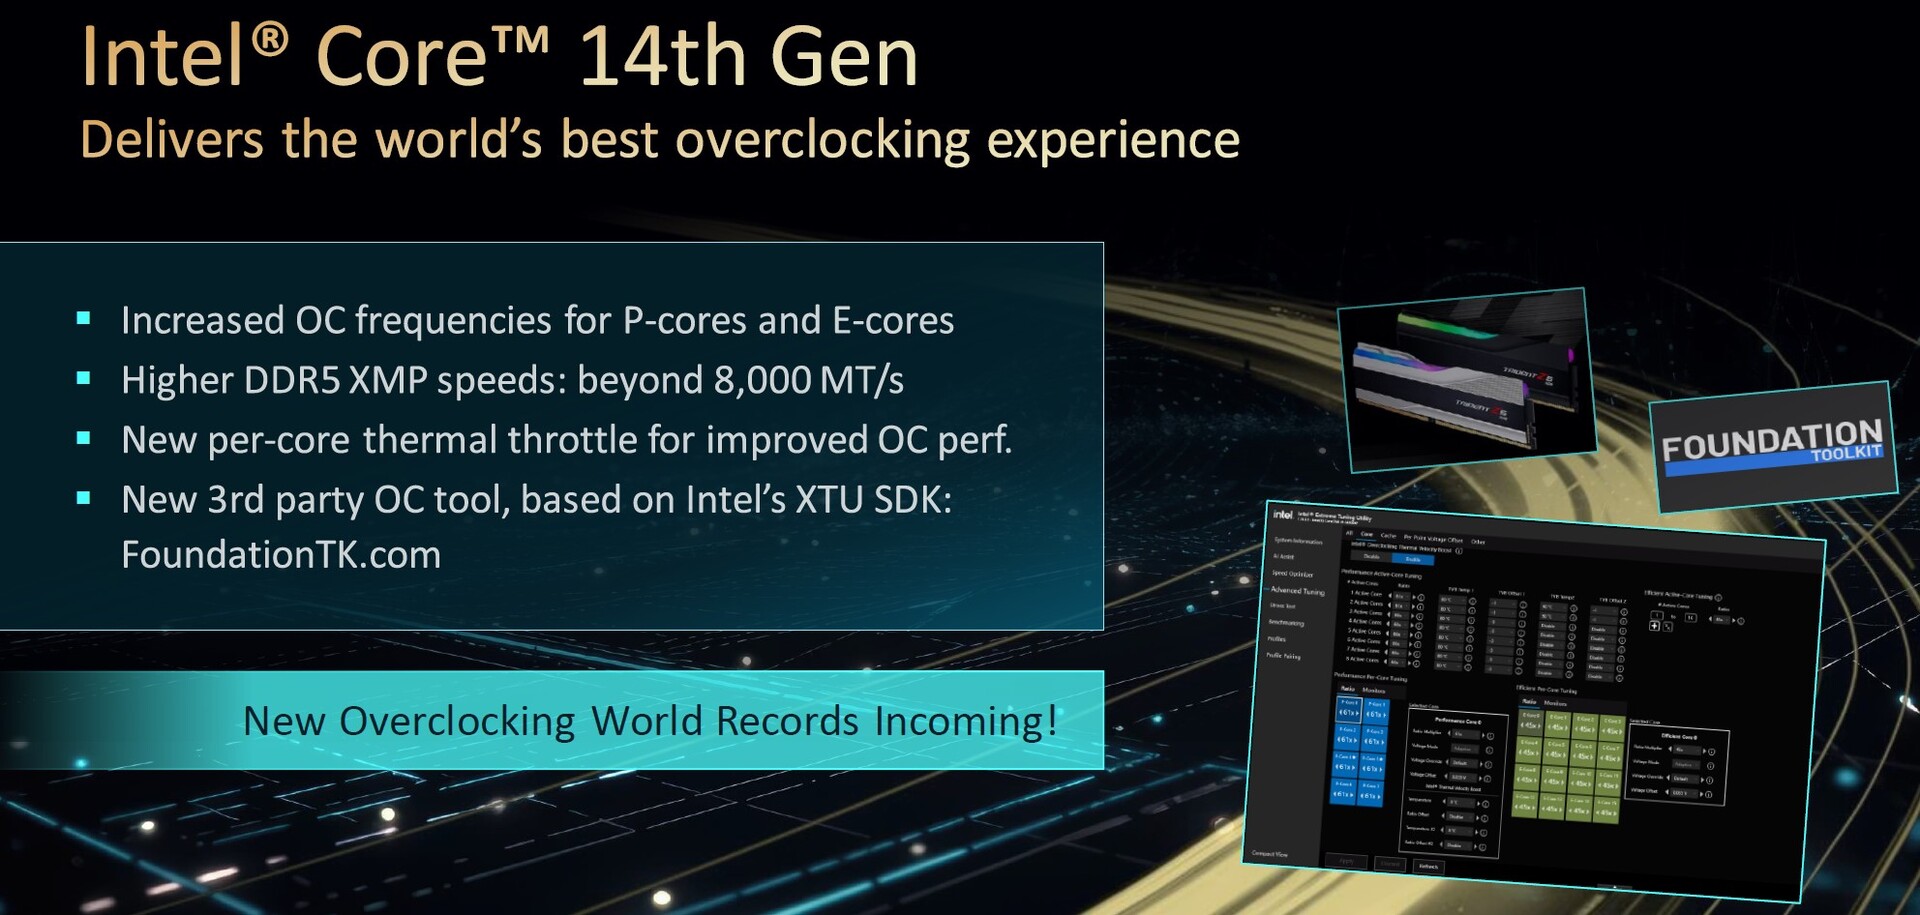
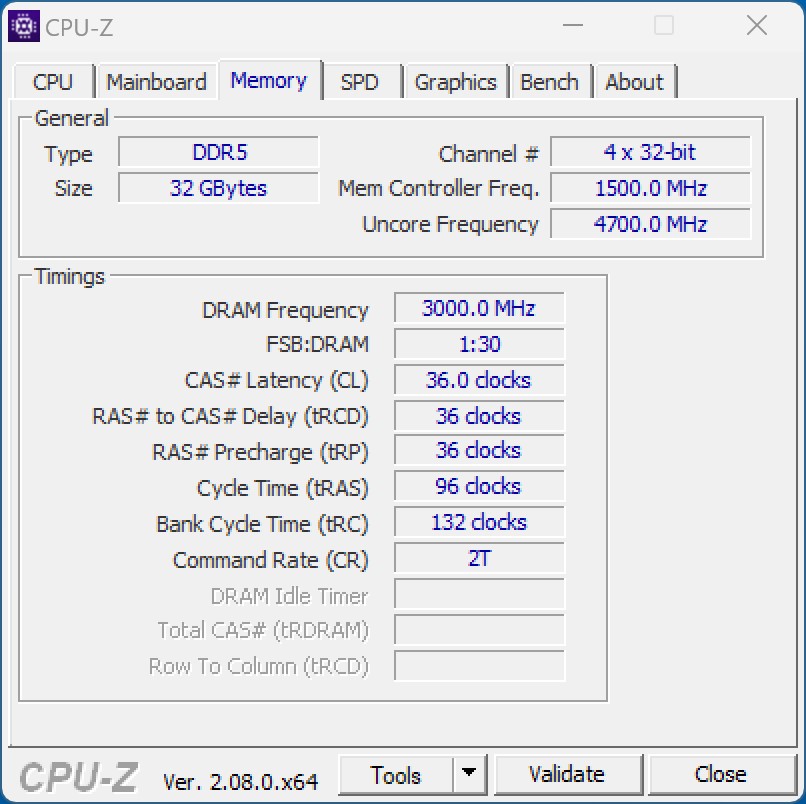
In addition to the increased clock speeds, Intel also emphasizes the RAM speeds that are advertised, with XMP and up to 8,000 MT/s. However, in the past, these high clock speeds often led to problems with the working memory. This is probably also the reason for the main boards being redesigned, whose improvements are supposed to make it possible to reach these clock speeds. Intel itself clears the Intel Core i9-14900K for DDR5 5,600 MT/s. But in practice, using working memory with higher clock speeds creates no problems, even though the stability might suffer. A look at the QVL lists of the mainboard manufacturers shows which RAM modules are supported.
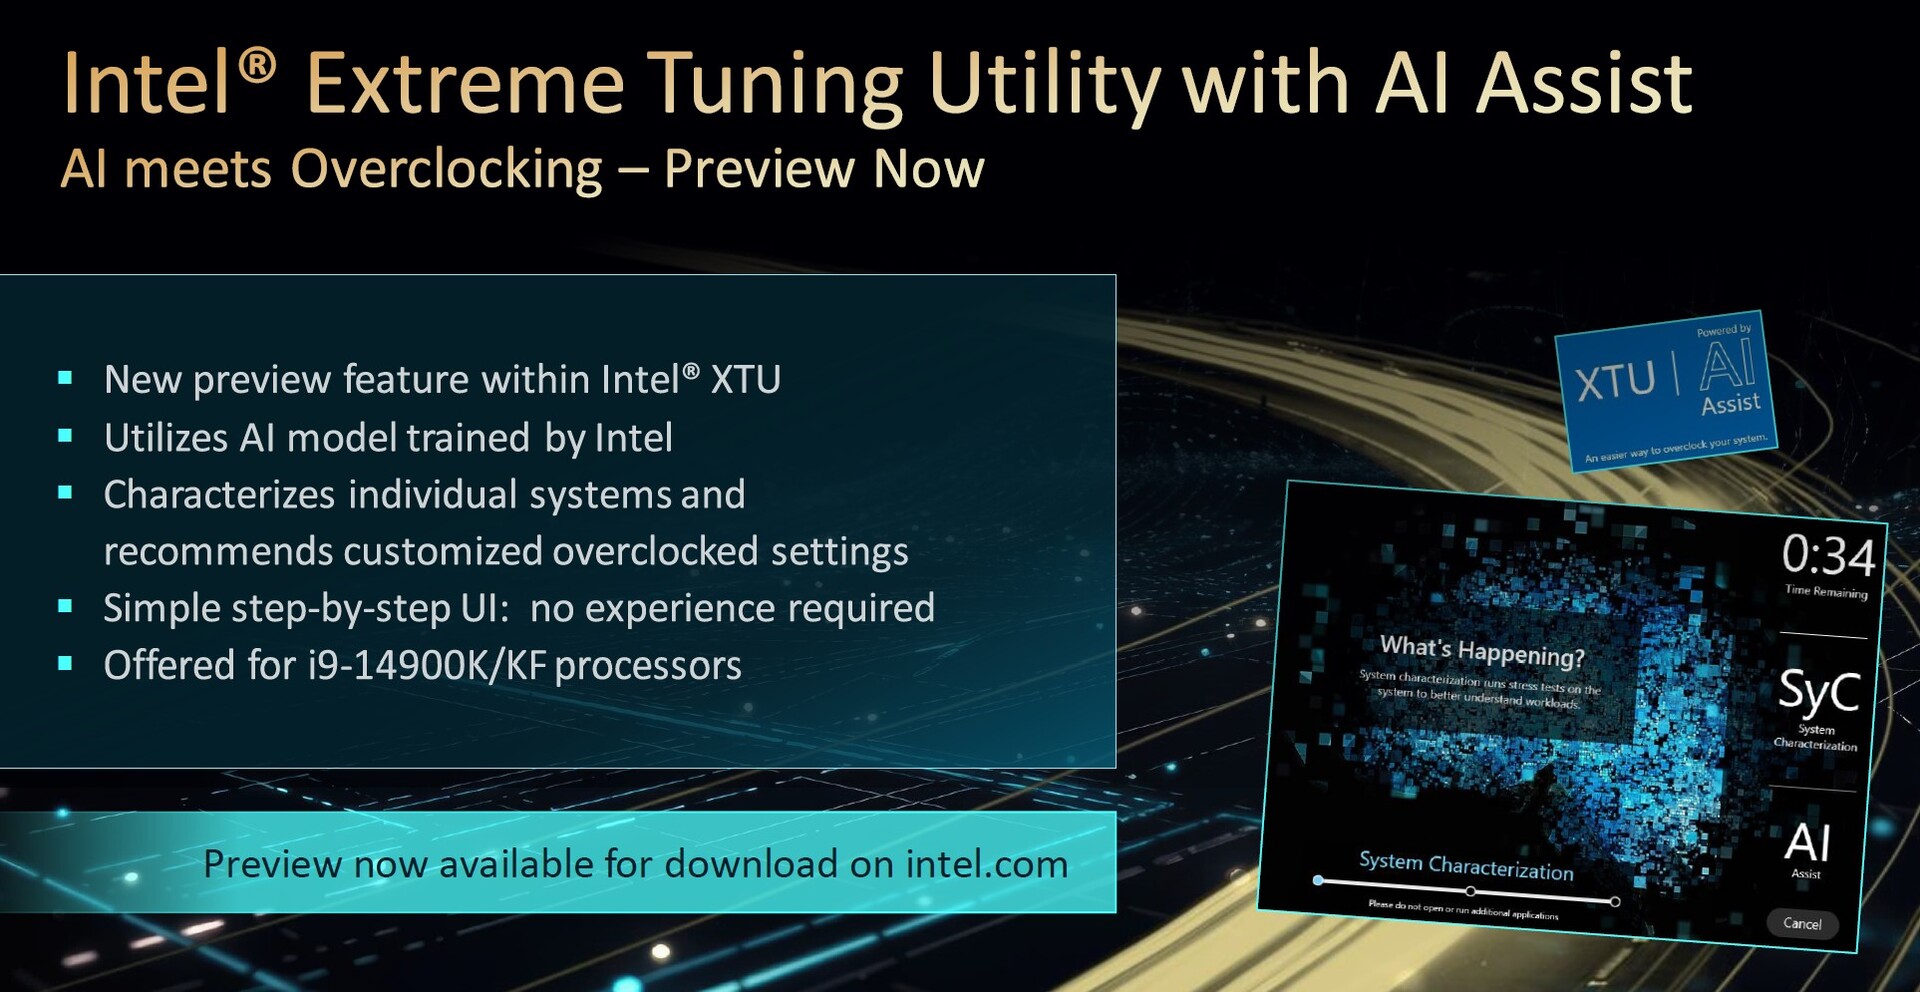
In addition, Intel increasingly banks on using AI, which is supposed to make overclocking easier in particular. The current version of the Intel Extreme Utility (XTU) supports this. With a single click, the whole system is analyzed to find the best settings in terms of voltage, multiplicator, and power target.
For this test, Intel has provided us with the Intel Core i9-14900K and the Intel Core i5-14600K. However, a glance at the table of the new processors will quickly show that the Intel Core i7-14700K is clearly the more interesting product of the series. The Core i7 is the only model to receive more cores, so its performance increase over the Intel Core i7-13700K should be significantly more extensive in direct comparison. We will try to also get a sample of that CPU to put through our tests.
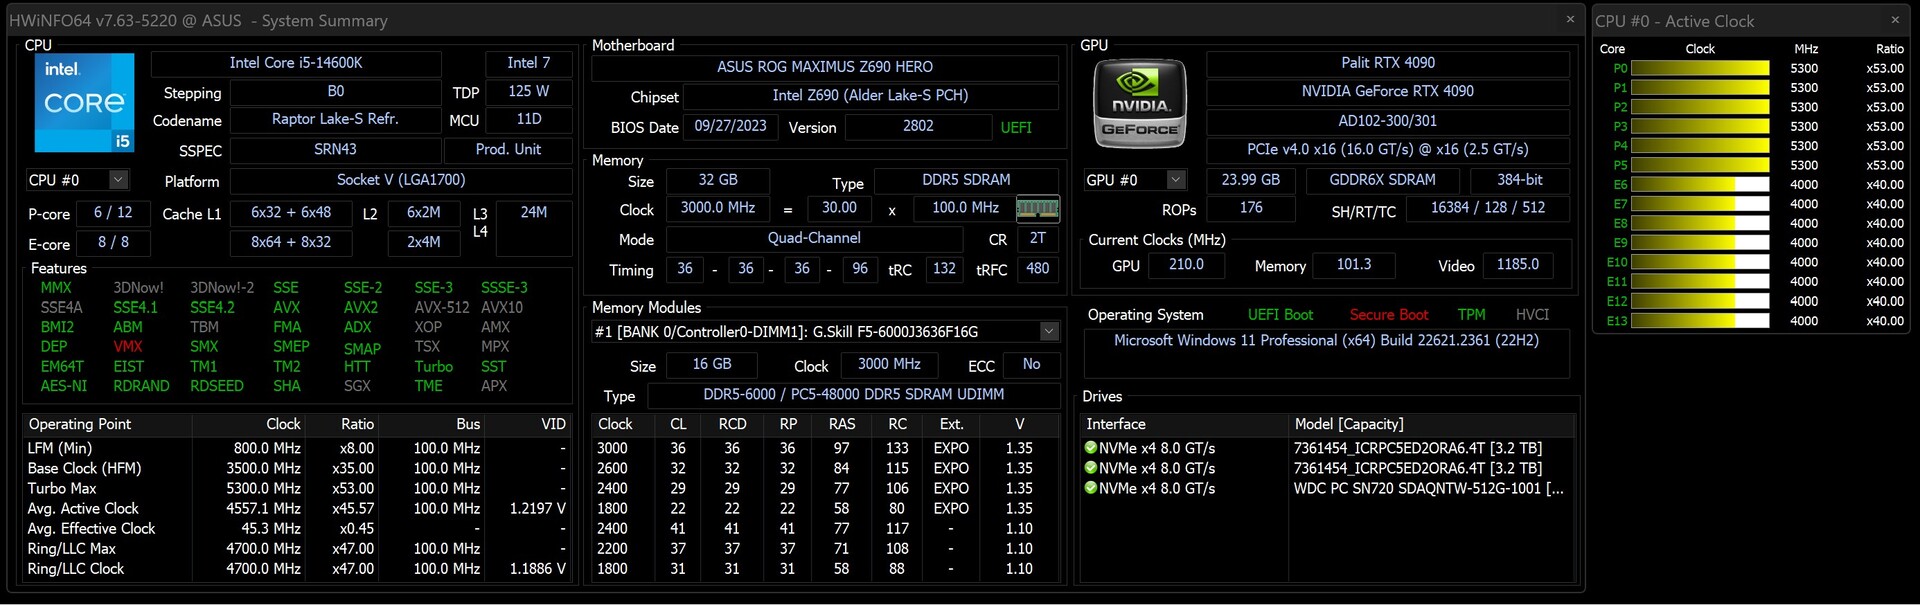
Details on our Test System
We use the following system for our tests and benchmarks:
- Streacom BC1 V2 Open Benchtable
- Intel Core i9-14900K, Intel Core i5-14600K
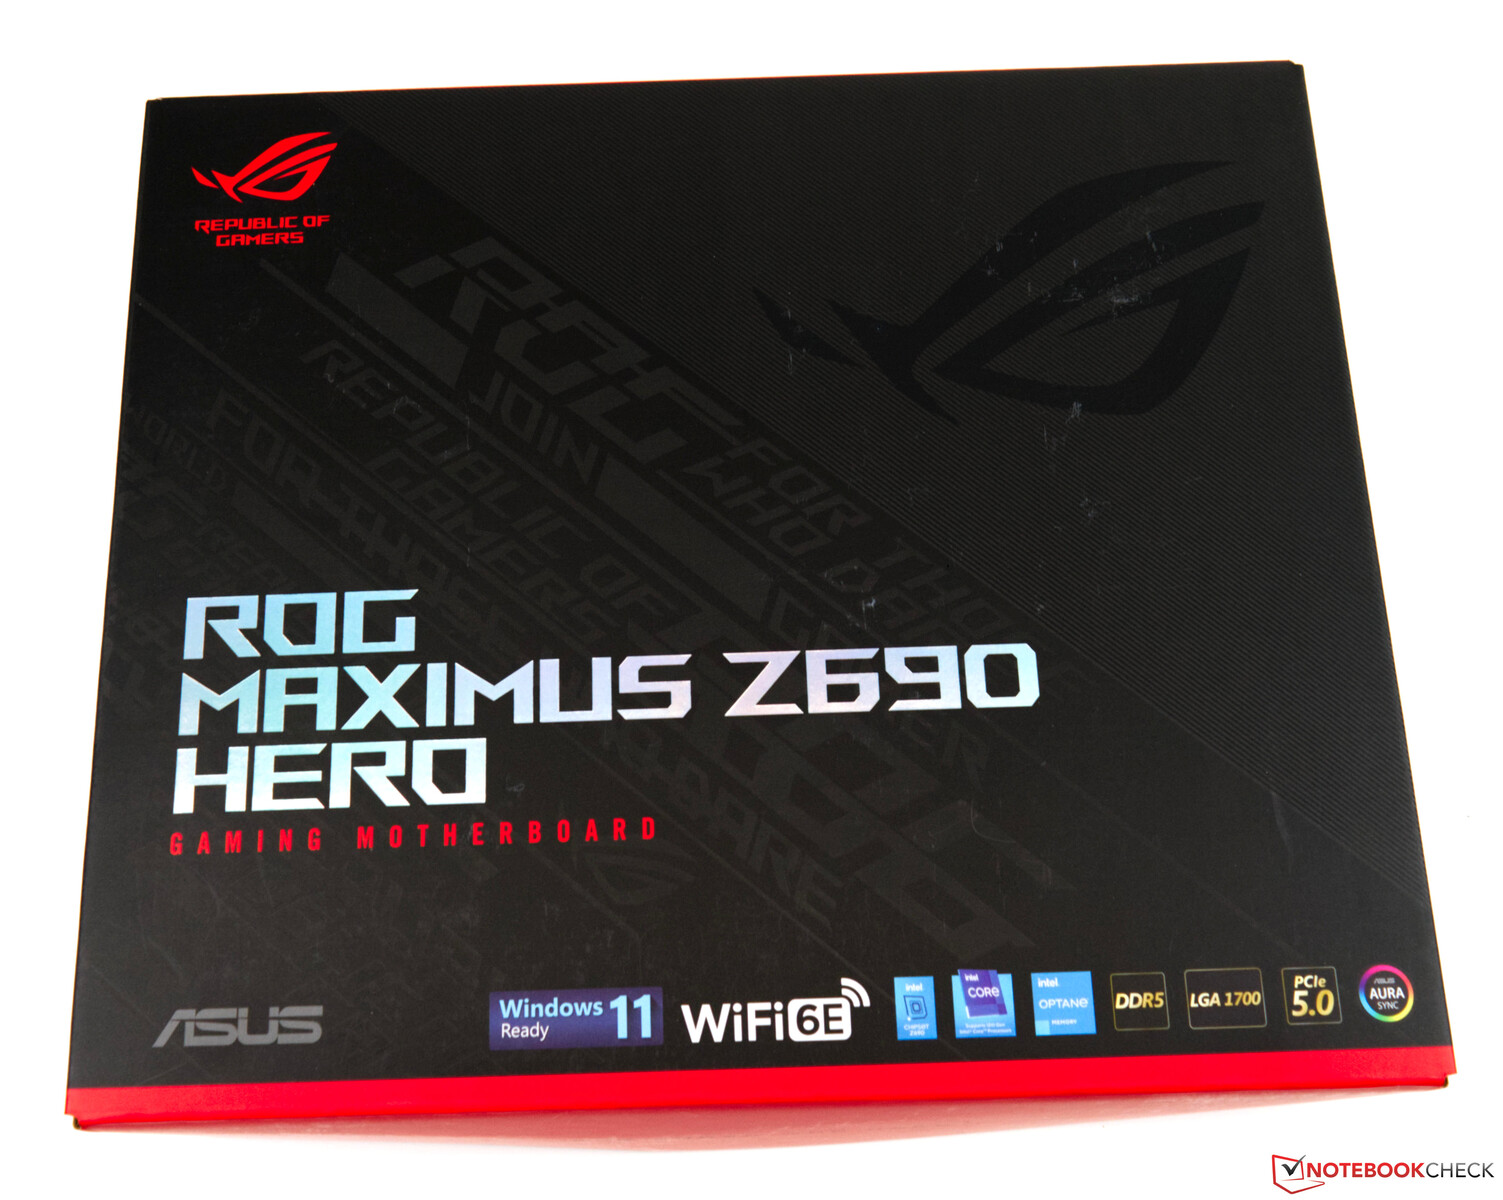
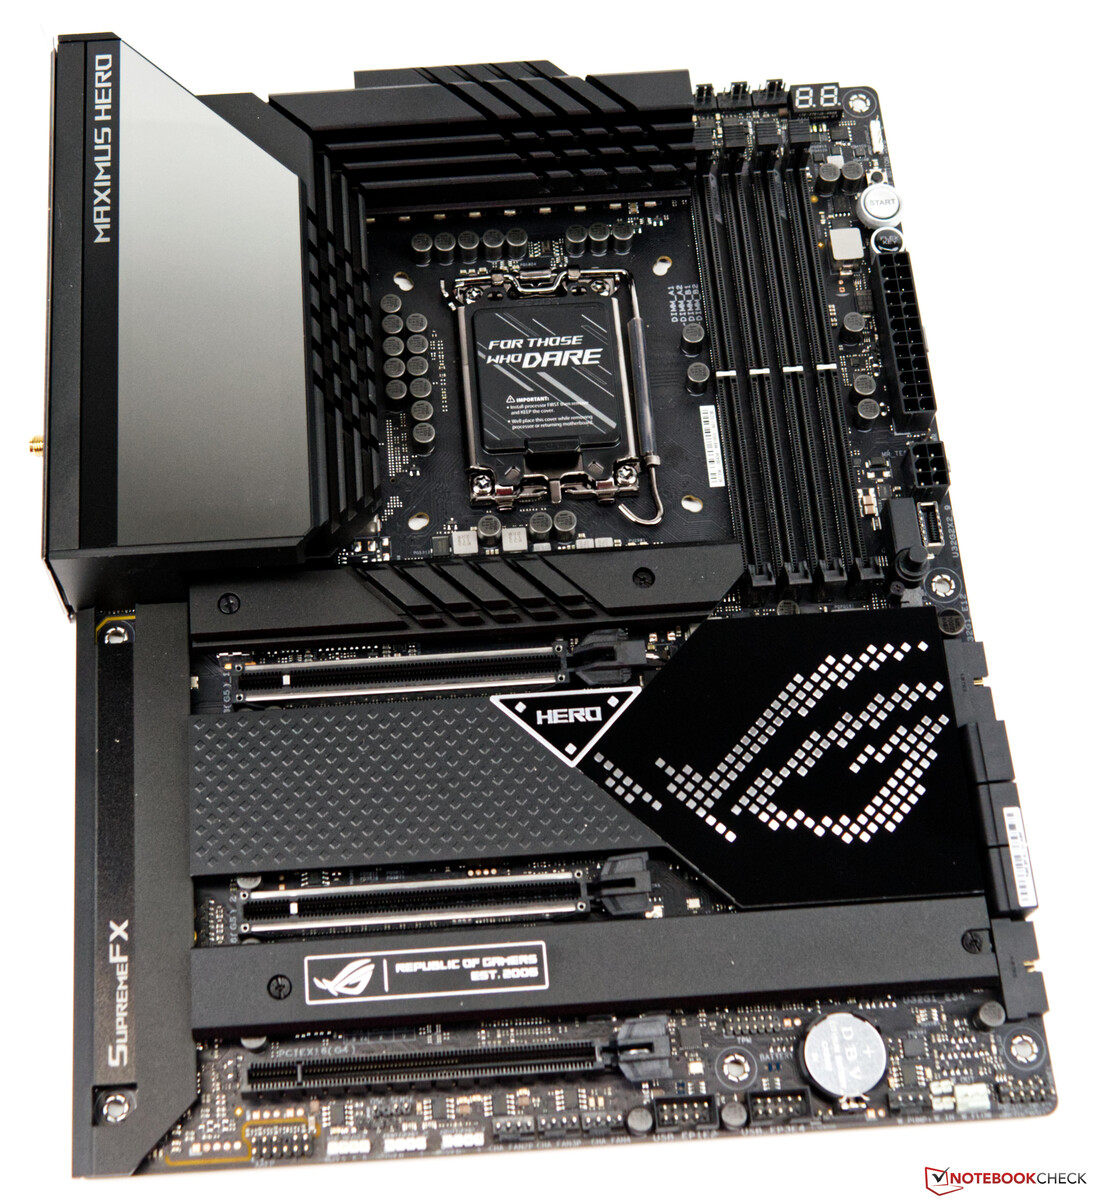
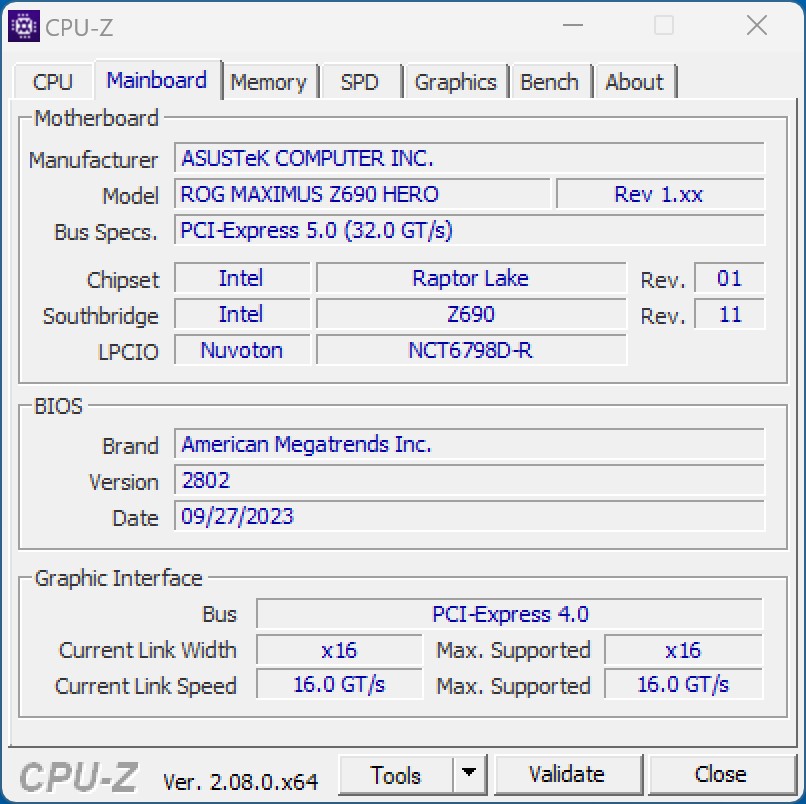
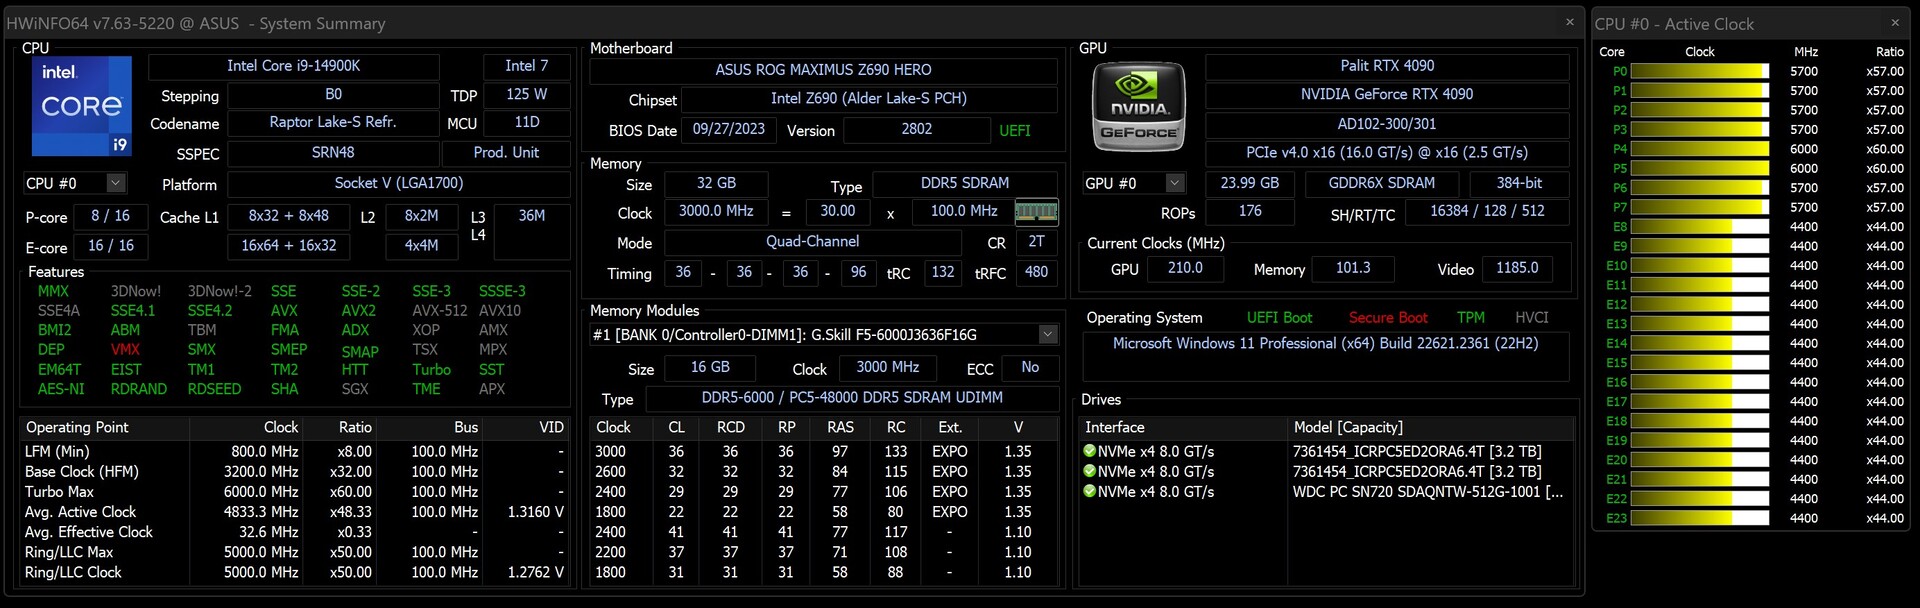
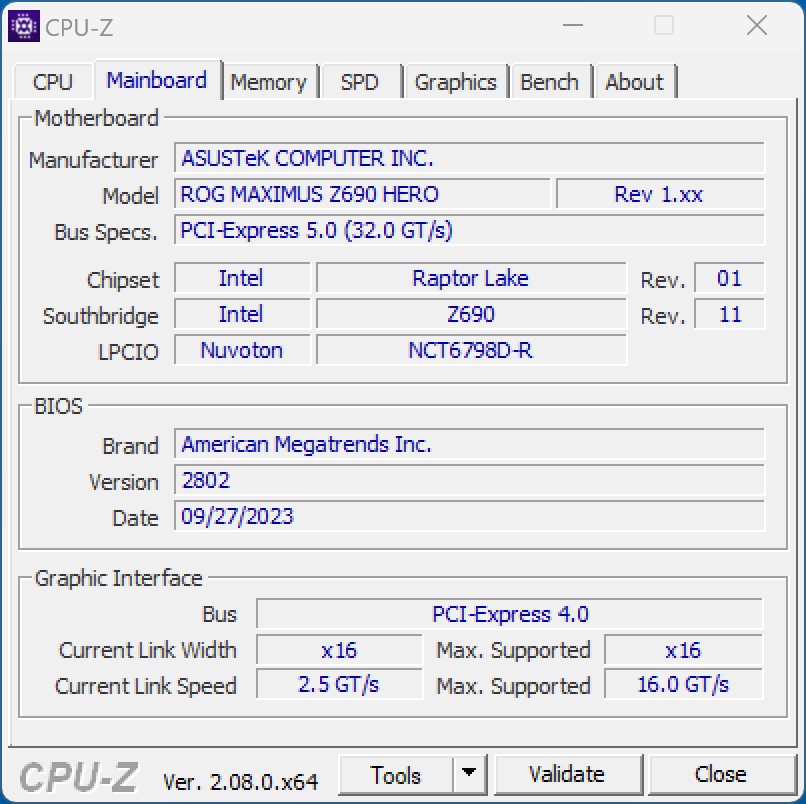
- Asus ROG Maximus Z690 Hero (BIOS v2802)
- Custom loop water cooling (Pump: Watercool WCP D5, Radiator: EK MO-RA3 420 Pro)
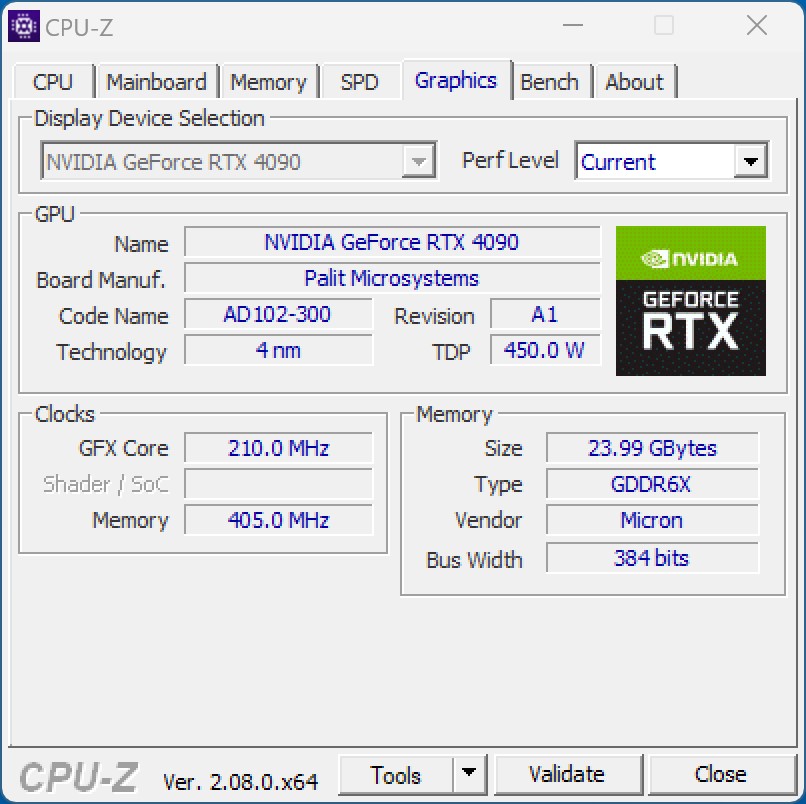
- Nvidia GeForce RTX 4090 Founder's Edition (Driver: 537.42)
- EVGA SuperNOVA P+ 1,600 W
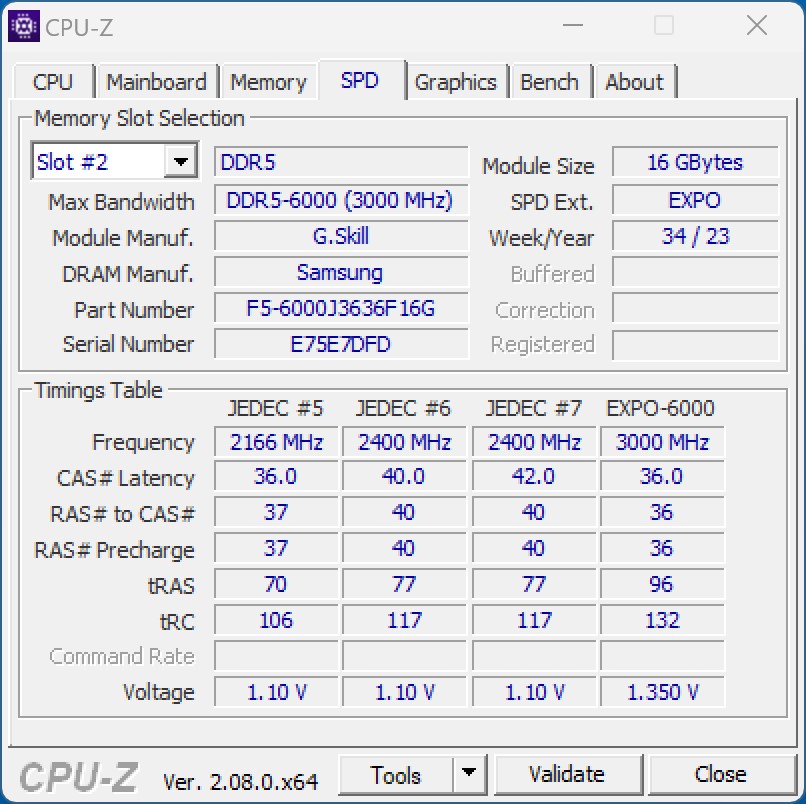
- G.Skill Ripjaws S5 (2x 16 GB - DDR5 6000 XMP)
- Western Digital SN720 - 512 GB (system)
- Intel SSD DC P4618 - 6,4 TB (benchmarks)
- Microsoft Windows 11 Professional 64 bit (version 22H2)
Intel Processors in Comparison
| Model | Cores / Threads |
P Core Clock Speed / Turbo | E Core Clock Speed / Turbo | Cache L2 + L3 | Graphics | PBP | MTB | Price (MSRP) |
| Core i9-14900K | 24 (8P + 16E) /32 | 3.4 GHz / 6.0 GHz | 2.4 GHz / 4.4 GHz | 32 + 36 MB | UHD 770 | 125 Watt | 253 Watt | 589 US Dollar |
| Core i9-13900K | 24 (8P + 16E) /32 | 3.0 GHz / 5.8 GHz | 2.2 GHz / 4.3 GHz | 32 + 36 MB | UHD 770 | 125 Watt | 253 Watt | 589 US Dollar |
| Core i9-12900K | 16 (8P + 8E) /24 | 3.2 GHz / 5.1 GHz | 2.4 GHz / 3.9 GHz | 14 + 30 MB | UHD 770 | 125 Watt | 241 Watt | 589 US Dollar |
| Core i7-14700K | 20 (8P + 12E) /28 | 3.4 GHz / 5.6 GHz | 2.5 GHz / 4.3 GHz | 24 + 30 MB | UHD 770 | 125 Watt | 253 Watt | 409 US Dollar |
| Core i7-13700K | 16 (8P + 8E) /24 | 3.4 GHz / 5.4 GHz | 2.5 GHz / 4.2 GHz | 24 + 30 MB | UHD 770 | 125 Watt | 253 Watt | 409 US Dollar |
| Core i7-12700K | 12 (8P + 4E) /20 | 3.6 GHz / 4.9 GHz | 2.7 GHz / 3.8 GHz | 12 + 25 MB | UHD 770 | 125 Watt | 190 Watt | 409 US Dollar |
| Core i5-14600K | 14 (6P + 8E) /20 | 3.5 GHz / 5.3 GHz | 2.6 GHz / 4.0 GHz | 20 + 24 MB | UHD 770 | 125 Watt | 181 Watt | 319 US Dollar |
| Core i5-13600K | 14 (6P + 8E) /20 | 3.5 GHz / 5.1 GHz | 2.6 GHz / 3.9 GHz | 20 + 24 MB | UHD 770 | 125 Watt | 181 Watt | 319 US Dollar |
| Core i5-12600K | 10 (6P + 4E) /16 | 3,7 GHz / 4,9 GHz | 2,8 GHz / 3,6 GHz | 9,5 + 20 MB | UHD 770 | 125 Watt | 150 Watt | 289 US-Dollar |

Test Conditions - Z690 still usable after BIOS update
With the Asus ROG Maximus Z690 Hero, we are using the same basis for this test that we already used for the Alder Lake S and Raptor Lake S processors. However, based on the Z790 chipset, there are also redesigned mainboards that are supposed to squeeze an even higher performance from the processor with better overclocking features. But those who are not chasing records can also run the new 14th gen processors with a 600 series chipset. Before doing this, you should first download the corresponding BIOS from the mainboard manufacturer and update it. We first received a new BIOS version for the Asus ROG Maximus Z690 Hero from the manufacturer. We did not encounter any problems in terms of stability and RAM compatibility in our case.
All tests were run with the newest BIOS version (2802) and activated XMP profile. In addition, all the power limitations were deactivated to be able to get the full performance from the processors.
Processor Benchmarks
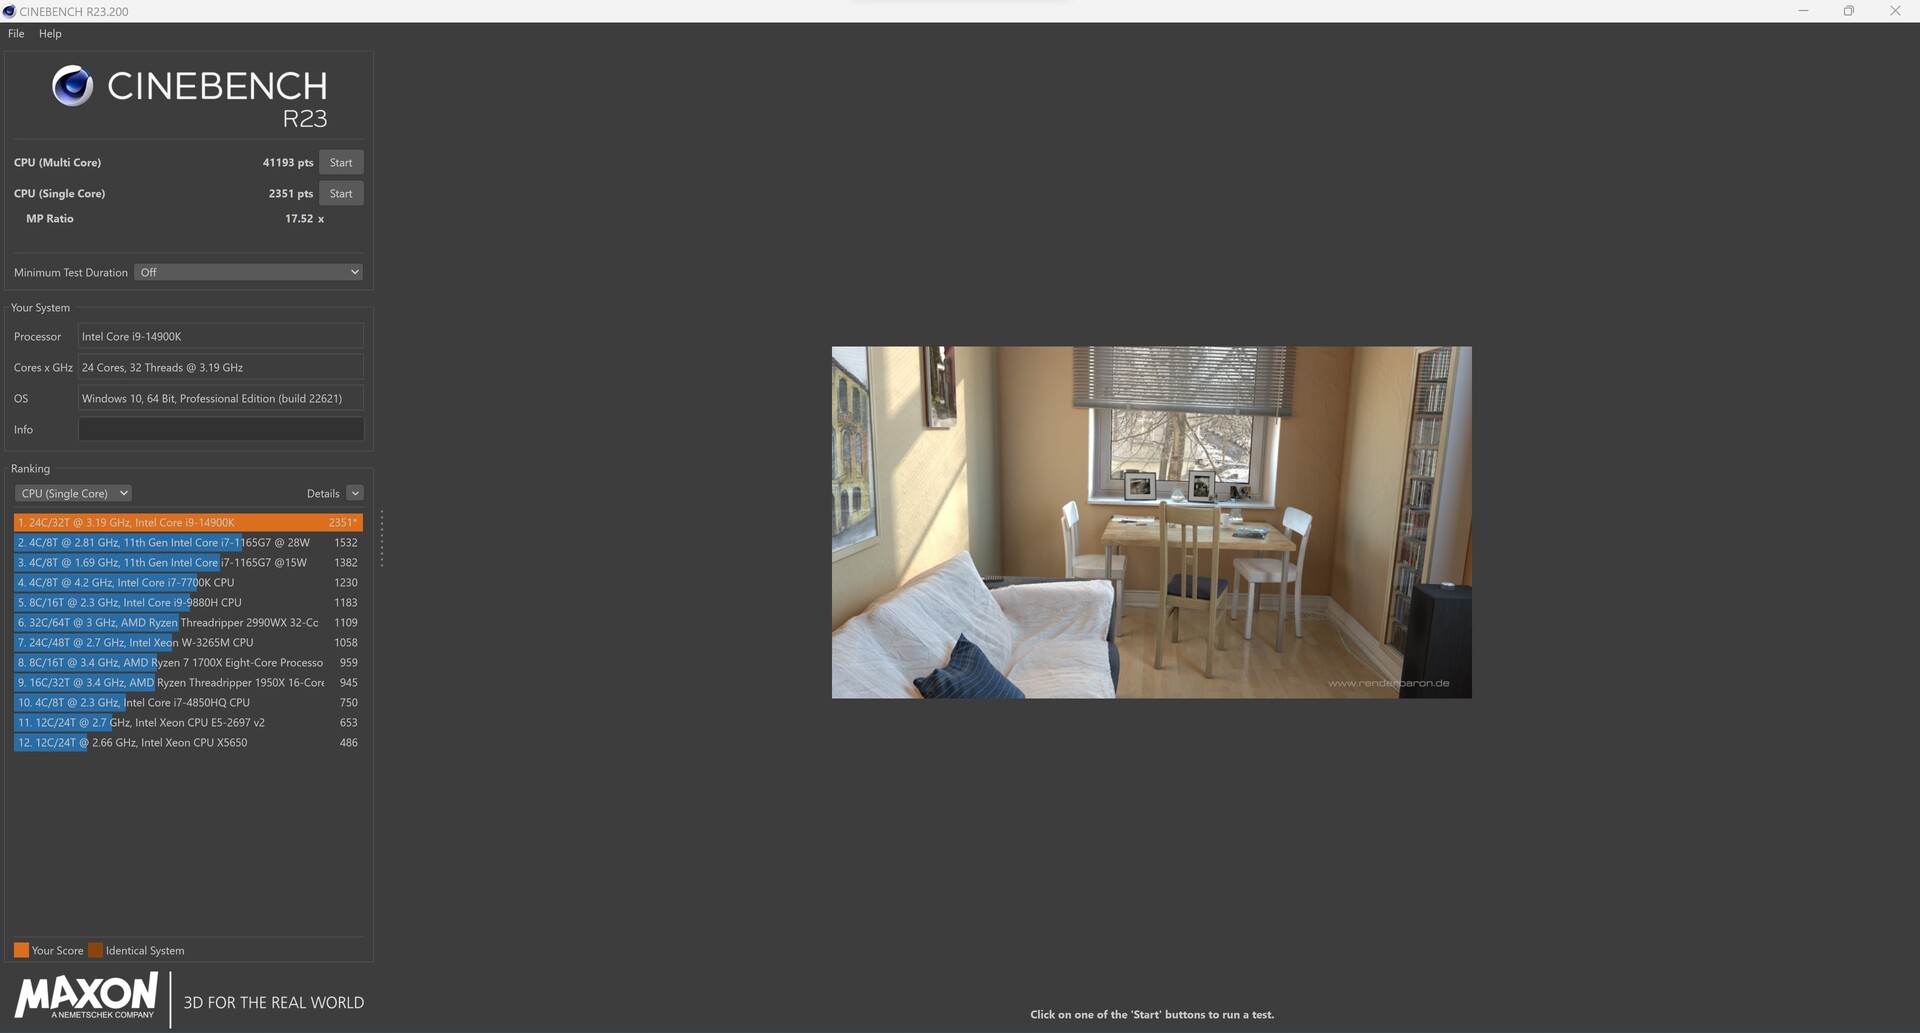
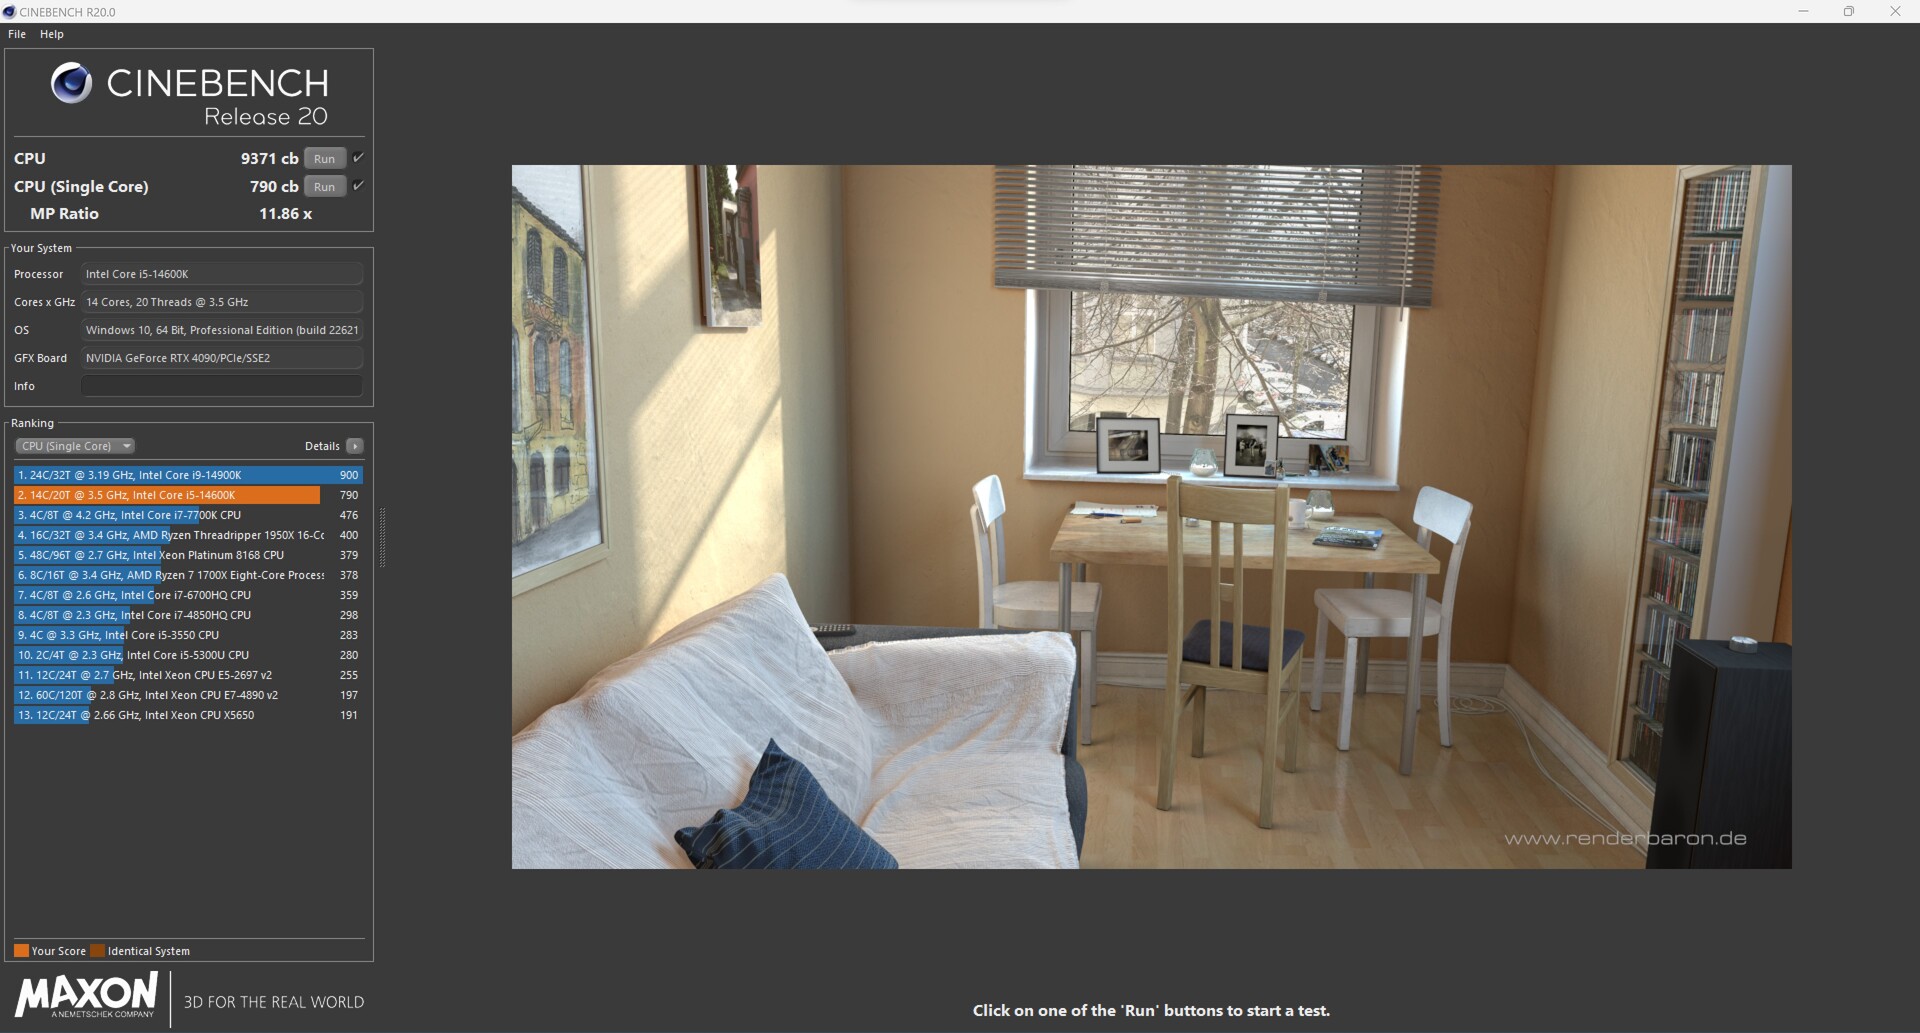
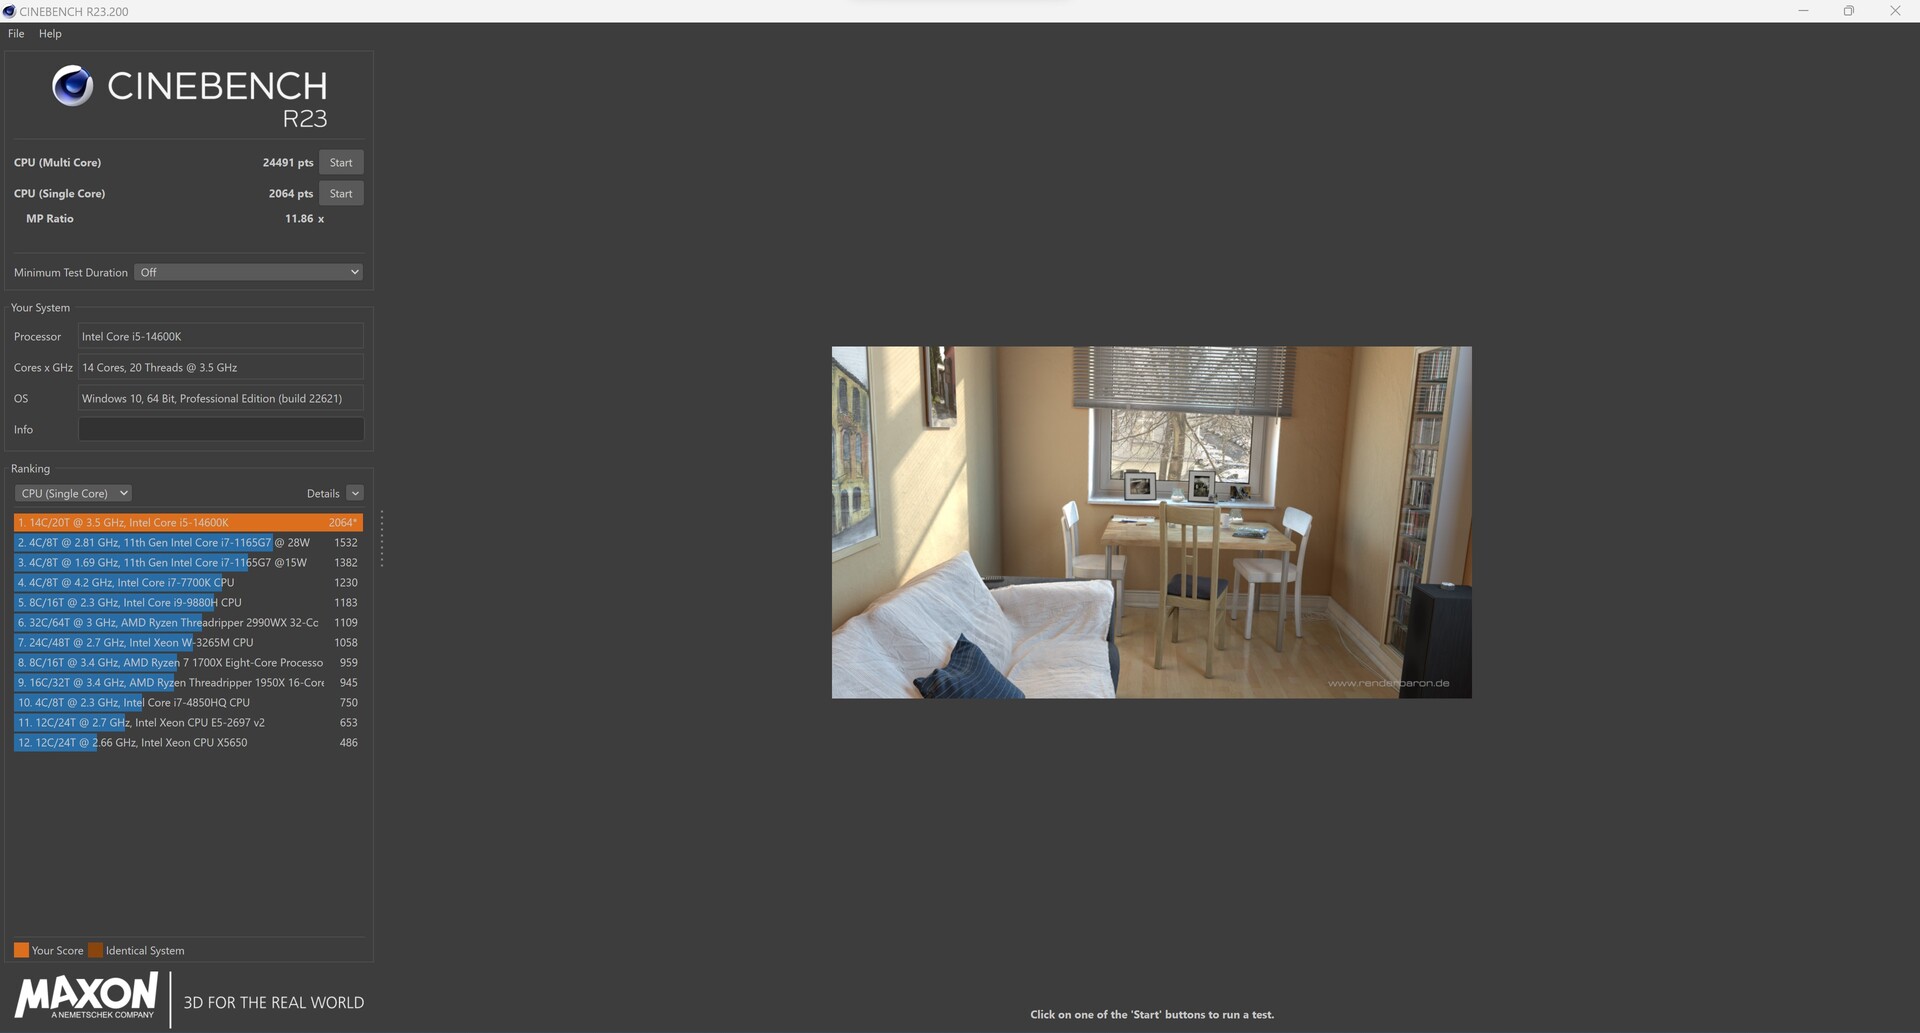
In our CPU tests, Intel was actually able to surpass the performance of the Intel Core i9-13900K - but at only 3 percentage points more in the averaged performance rating, the advantage of the Intel Core i9-14900K turns out to be very small. The Intel Core i5-14600K also placed ahead of the older Intel Core i5-13600K by a small distance. Compared to Alder Lake, the new Core-i5 model is able to compete with an Intel Core i9-12900K.
In comparison with AMD, the performance of the Ryzen 9 7950X was surpassed again, although the difference is also very small here and you wouldn't be able to call it a noticeable advantage. The smaller Intel Core i5-14600K was almost able to keep up with the AMD Ryzen 9 7900X, and those two competitors were only separated by 6 % in our performance rating.
However, the performance differences turn out significantly higher depending on the test. All-in-all, we noted a clear single-core performance increase in the Intel Core i9-14900K, which can't be beaten with its 6 GHz.
You can find additional benchmarks on the processors here.
Intel Core i9-14900K

Intel Core i5-14600K


| Performance rating - Percent | |
| Intel Core i9-14900K | |
| Intel Core i9-13900K | |
| AMD Ryzen 9 7950X | |
| AMD Ryzen 9 7950X3D | |
| AMD Ryzen 9 7900X | |
| Intel Core i5-14600K | |
| Intel Core i9-12900K | |
| AMD Ryzen 9 5950X | |
| Intel Core i5-13600K | |
| AMD Ryzen 7 7800X3D | |
| AMD Ryzen 5 7600X | |
| Intel Core i5-12600K | |
| Intel Core i5-13400 | |
| Intel Core i5-12400F | |
| Cinebench R15 | |
| CPU Single 64Bit | |
| Intel Core i9-14900K | |
| AMD Ryzen 9 7950X | |
| Intel Core i9-13900K | |
| AMD Ryzen 9 7950X3D | |
| AMD Ryzen 9 7900X | |
| AMD Ryzen 5 7600X | |
| Intel Core i5-14600K | |
| AMD Ryzen 7 7800X3D | |
| Intel Core i5-13600K | |
| Intel Core i9-12900K | |
| Intel Core i5-12600K | |
| AMD Ryzen 9 5950X | |
| Intel Core i5-13400 | |
| Intel Core i5-12400F | |
| CPU Multi 64Bit | |
| Intel Core i9-14900K | |
| AMD Ryzen 9 7950X | |
| Intel Core i9-13900K | |
| AMD Ryzen 9 7950X3D | |
| AMD Ryzen 9 7900X | |
| AMD Ryzen 9 5950X | |
| Intel Core i9-12900K | |
| Intel Core i5-13600K | |
| Intel Core i5-14600K | |
| AMD Ryzen 7 7800X3D | |
| Intel Core i5-12600K | |
| AMD Ryzen 5 7600X | |
| Intel Core i5-13400 | |
| Intel Core i5-12400F | |
| Cinebench R20 | |
| CPU (Single Core) | |
| Intel Core i9-14900K | |
| Intel Core i9-13900K | |
| AMD Ryzen 9 7950X | |
| AMD Ryzen 9 7950X3D | |
| Intel Core i5-14600K | |
| AMD Ryzen 9 7900X | |
| Intel Core i5-13600K | |
| Intel Core i9-12900K | |
| AMD Ryzen 5 7600X | |
| Intel Core i5-12600K | |
| AMD Ryzen 7 7800X3D | |
| Intel Core i5-13400 | |
| Intel Core i5-12400F | |
| AMD Ryzen 9 5950X | |
| CPU (Multi Core) | |
| Intel Core i9-14900K | |
| Intel Core i9-13900K | |
| AMD Ryzen 9 7950X | |
| AMD Ryzen 9 7950X3D | |
| AMD Ryzen 9 7900X | |
| AMD Ryzen 9 5950X | |
| Intel Core i9-12900K | |
| Intel Core i5-14600K | |
| Intel Core i5-13600K | |
| AMD Ryzen 7 7800X3D | |
| Intel Core i5-12600K | |
| Intel Core i5-13400 | |
| AMD Ryzen 5 7600X | |
| Intel Core i5-12400F | |
| Cinebench R23 | |
| Single Core | |
| Intel Core i9-14900K | |
| Intel Core i9-13900K | |
| Intel Core i5-14600K | |
| AMD Ryzen 9 7950X3D | |
| AMD Ryzen 9 7950X | |
| AMD Ryzen 9 7900X | |
| Intel Core i5-13600K | |
| Intel Core i9-12900K | |
| AMD Ryzen 5 7600X | |
| Intel Core i5-12600K | |
| AMD Ryzen 7 7800X3D | |
| Intel Core i5-13400 | |
| Intel Core i5-12400F | |
| AMD Ryzen 9 5950X | |
| Multi Core | |
| Intel Core i9-14900K | |
| Intel Core i9-13900K | |
| AMD Ryzen 9 7950X | |
| AMD Ryzen 9 7950X3D | |
| AMD Ryzen 9 7900X | |
| AMD Ryzen 9 5950X | |
| Intel Core i9-12900K | |
| Intel Core i5-14600K | |
| Intel Core i5-13600K | |
| AMD Ryzen 7 7800X3D | |
| Intel Core i5-12600K | |
| Intel Core i5-13400 | |
| AMD Ryzen 5 7600X | |
| Intel Core i5-12400F | |
| Cinebench R11.5 | |
| CPU Single 64Bit | |
| Intel Core i9-14900K | |
| Intel Core i9-13900K | |
| AMD Ryzen 9 7950X | |
| AMD Ryzen 9 7950X3D | |
| AMD Ryzen 9 7900X | |
| AMD Ryzen 5 7600X | |
| Intel Core i5-14600K | |
| Intel Core i9-12900K | |
| Intel Core i5-13600K | |
| AMD Ryzen 7 7800X3D | |
| Intel Core i5-12600K | |
| AMD Ryzen 9 5950X | |
| Intel Core i5-13400 | |
| Intel Core i5-12400F | |
| CPU Multi 64Bit | |
| Intel Core i9-14900K | |
| Intel Core i9-13900K | |
| AMD Ryzen 9 7950X | |
| AMD Ryzen 9 7950X3D | |
| AMD Ryzen 9 7900X | |
| AMD Ryzen 9 5950X | |
| Intel Core i9-12900K | |
| Intel Core i5-13600K | |
| Intel Core i5-14600K | |
| AMD Ryzen 7 7800X3D | |
| Intel Core i5-12600K | |
| AMD Ryzen 5 7600X | |
| Intel Core i5-13400 | |
| Intel Core i5-12400F | |
| Cinebench R10 | |
| Rendering Single CPUs 64Bit | |
| Intel Core i9-14900K | |
| Intel Core i9-13900K | |
| Intel Core i5-14600K | |
| AMD Ryzen 9 7900X | |
| AMD Ryzen 9 7950X | |
| Intel Core i5-13600K | |
| Intel Core i9-12900K | |
| AMD Ryzen 5 7600X | |
| Intel Core i5-12600K | |
| AMD Ryzen 7 7800X3D | |
| Intel Core i5-13400 | |
| Intel Core i5-12400F | |
| AMD Ryzen 9 5950X | |
| AMD Ryzen 9 7950X3D | |
| Rendering Multiple CPUs 64Bit | |
| Intel Core i9-14900K | |
| Intel Core i9-13900K | |
| AMD Ryzen 9 7950X | |
| AMD Ryzen 9 7900X | |
| Intel Core i5-14600K | |
| Intel Core i9-12900K | |
| Intel Core i5-13600K | |
| AMD Ryzen 9 5950X | |
| AMD Ryzen 7 7800X3D | |
| AMD Ryzen 5 7600X | |
| Intel Core i5-12600K | |
| Intel Core i5-13400 | |
| AMD Ryzen 9 7950X3D | |
| Intel Core i5-12400F | |
| Blender - v2.79 BMW27 CPU | |
| Intel Core i5-12400F | |
| Intel Core i5-13400 | |
| AMD Ryzen 5 7600X | |
| Intel Core i5-12600K | |
| AMD Ryzen 7 7800X3D | |
| Intel Core i5-13600K | |
| Intel Core i5-14600K | |
| Intel Core i9-12900K | |
| AMD Ryzen 9 5950X | |
| AMD Ryzen 9 7900X | |
| AMD Ryzen 9 7950X3D | |
| AMD Ryzen 9 7950X | |
| Intel Core i9-13900K | |
| Intel Core i9-14900K | |
| wPrime 2.10 | |
| 32m | |
| Intel Core i9-12900K | |
| Intel Core i5-12600K | |
| Intel Core i5-12400F | |
| Intel Core i5-13400 | |
| AMD Ryzen 5 7600X | |
| AMD Ryzen 9 5950X | |
| Intel Core i5-13600K | |
| AMD Ryzen 7 7800X3D | |
| Intel Core i5-14600K | |
| Intel Core i9-14900K | |
| AMD Ryzen 9 7950X3D | |
| Intel Core i9-13900K | |
| AMD Ryzen 9 7900X | |
| AMD Ryzen 9 7950X | |
| 1024m | |
| Intel Core i5-13400 | |
| Intel Core i5-12600K | |
| Intel Core i9-12900K | |
| Intel Core i5-13600K | |
| Intel Core i5-14600K | |
| Intel Core i5-12400F | |
| Intel Core i9-13900K | |
| AMD Ryzen 5 7600X | |
| Intel Core i9-14900K | |
| AMD Ryzen 9 5950X | |
| AMD Ryzen 7 7800X3D | |
| AMD Ryzen 9 7900X | |
| AMD Ryzen 9 7950X3D | |
| AMD Ryzen 9 7950X | |
| X264 HD Benchmark 4.0 | |
| Pass 1 | |
| Intel Core i9-14900K | |
| Intel Core i9-13900K | |
| Intel Core i5-14600K | |
| AMD Ryzen 9 7950X3D | |
| Intel Core i5-13600K | |
| AMD Ryzen 9 7950X | |
| AMD Ryzen 9 7900X | |
| Intel Core i9-12900K | |
| AMD Ryzen 5 7600X | |
| AMD Ryzen 7 7800X3D | |
| AMD Ryzen 9 5950X | |
| Intel Core i5-12600K | |
| Intel Core i5-13400 | |
| Intel Core i5-12400F | |
| Pass 2 | |
| Intel Core i9-14900K | |
| Intel Core i9-13900K | |
| AMD Ryzen 9 7950X | |
| AMD Ryzen 9 7950X3D | |
| AMD Ryzen 9 7900X | |
| AMD Ryzen 9 5950X | |
| Intel Core i5-14600K | |
| Intel Core i9-12900K | |
| Intel Core i5-13600K | |
| AMD Ryzen 7 7800X3D | |
| Intel Core i5-12600K | |
| AMD Ryzen 5 7600X | |
| Intel Core i5-13400 | |
| Intel Core i5-12400F | |
| WinRAR - Result | |
| AMD Ryzen 9 7900X | |
| AMD Ryzen 7 7800X3D | |
| AMD Ryzen 9 7950X | |
| AMD Ryzen 5 7600X | |
| Intel Core i9-14900K | |
| AMD Ryzen 9 7950X3D | |
| Intel Core i9-13900K | |
| AMD Ryzen 9 5950X | |
| Intel Core i5-14600K | |
| Intel Core i5-13600K | |
| Intel Core i9-12900K | |
| Intel Core i5-13400 | |
| Intel Core i5-12400F | |
| Intel Core i5-12600K | |
| TrueCrypt | |
| AES Mean 100MB | |
| AMD Ryzen 9 7950X | |
| Intel Core i9-13900K | |
| AMD Ryzen 9 5950X | |
| AMD Ryzen 9 7950X3D | |
| Intel Core i9-14900K | |
| Intel Core i5-14600K | |
| Intel Core i5-13600K | |
| Intel Core i9-12900K | |
| AMD Ryzen 7 7800X3D | |
| AMD Ryzen 9 7900X | |
| AMD Ryzen 5 7600X | |
| Intel Core i5-12600K | |
| Intel Core i5-13400 | |
| Intel Core i5-12400F | |
| Twofish Mean 100MB | |
| Intel Core i9-14900K | |
| Intel Core i9-13900K | |
| AMD Ryzen 9 7950X | |
| AMD Ryzen 9 7950X3D | |
| AMD Ryzen 9 5950X | |
| Intel Core i9-12900K | |
| Intel Core i5-14600K | |
| Intel Core i5-13600K | |
| AMD Ryzen 9 7900X | |
| Intel Core i5-12600K | |
| AMD Ryzen 7 7800X3D | |
| Intel Core i5-13400 | |
| AMD Ryzen 5 7600X | |
| Intel Core i5-12400F | |
| Serpent Mean 100MB | |
| Intel Core i9-13900K | |
| AMD Ryzen 9 7950X | |
| AMD Ryzen 9 7950X3D | |
| Intel Core i9-14900K | |
| AMD Ryzen 9 5950X | |
| Intel Core i9-12900K | |
| Intel Core i5-14600K | |
| Intel Core i5-13600K | |
| AMD Ryzen 9 7900X | |
| Intel Core i5-12600K | |
| AMD Ryzen 7 7800X3D | |
| Intel Core i5-13400 | |
| AMD Ryzen 5 7600X | |
| Intel Core i5-12400F | |
| Geekbench 5.5 | |
| Multi-Core | |
| Intel Core i9-14900K | |
| AMD Ryzen 9 7950X | |
| AMD Ryzen 9 7950X3D | |
| Intel Core i9-13900K | |
| AMD Ryzen 9 7900X | |
| Intel Core i9-12900K | |
| Intel Core i5-14600K | |
| AMD Ryzen 9 5950X | |
| Intel Core i5-13600K | |
| AMD Ryzen 7 7800X3D | |
| Intel Core i5-12600K | |
| Intel Core i5-13400 | |
| AMD Ryzen 5 7600X | |
| Intel Core i5-12400F | |
| Single-Core | |
| AMD Ryzen 9 7950X | |
| AMD Ryzen 9 7950X3D | |
| Intel Core i9-13900K | |
| AMD Ryzen 9 7900X | |
| Intel Core i9-14900K | |
| AMD Ryzen 5 7600X | |
| Intel Core i9-12900K | |
| AMD Ryzen 7 7800X3D | |
| Intel Core i5-14600K | |
| Intel Core i5-13600K | |
| Intel Core i5-12600K | |
| Intel Core i5-13400 | |
| Intel Core i5-12400F | |
| AMD Ryzen 9 5950X | |
| Geekbench 5.0 | |
| 5.0 Multi-Core | |
| Intel Core i9-14900K | |
| AMD Ryzen 9 7950X | |
| Intel Core i9-13900K | |
| AMD Ryzen 9 7950X3D | |
| AMD Ryzen 9 7900X | |
| Intel Core i9-12900K | |
| Intel Core i5-14600K | |
| Intel Core i5-13600K | |
| AMD Ryzen 9 5950X | |
| AMD Ryzen 7 7800X3D | |
| Intel Core i5-12600K | |
| AMD Ryzen 5 7600X | |
| Intel Core i5-13400 | |
| Intel Core i5-12400F | |
| 5.0 Single-Core | |
| Intel Core i9-14900K | |
| AMD Ryzen 9 7950X | |
| Intel Core i9-13900K | |
| AMD Ryzen 9 7900X | |
| AMD Ryzen 9 7950X3D | |
| AMD Ryzen 5 7600X | |
| Intel Core i5-14600K | |
| Intel Core i9-12900K | |
| AMD Ryzen 7 7800X3D | |
| Intel Core i5-13600K | |
| Intel Core i5-12600K | |
| Intel Core i5-13400 | |
| AMD Ryzen 9 5950X | |
| Intel Core i5-12400F | |
| Geekbench 4.4 | |
| 64 Bit Single-Core Score | |
| Intel Core i9-14900K | |
| Intel Core i9-13900K | |
| AMD Ryzen 9 7950X | |
| AMD Ryzen 9 7950X3D | |
| AMD Ryzen 9 7900X | |
| AMD Ryzen 7 7800X3D | |
| AMD Ryzen 5 7600X | |
| Intel Core i5-14600K | |
| Intel Core i9-12900K | |
| Intel Core i5-13600K | |
| Intel Core i5-12600K | |
| Intel Core i5-13400 | |
| Intel Core i5-12400F | |
| AMD Ryzen 9 5950X | |
| 64 Bit Multi-Core Score | |
| AMD Ryzen 9 7950X | |
| Intel Core i9-14900K | |
| AMD Ryzen 9 7950X3D | |
| Intel Core i9-13900K | |
| AMD Ryzen 9 7900X | |
| Intel Core i5-14600K | |
| Intel Core i9-12900K | |
| AMD Ryzen 9 5950X | |
| Intel Core i5-13600K | |
| AMD Ryzen 7 7800X3D | |
| AMD Ryzen 5 7600X | |
| Intel Core i5-12600K | |
| Intel Core i5-13400 | |
| Intel Core i5-12400F | |
| 3DMark 11 - 1280x720 Performance Physics | |
| AMD Ryzen 9 7950X3D | |
| AMD Ryzen 7 7800X3D | |
| Intel Core i9-13900K | |
| Intel Core i9-14900K | |
| Intel Core i5-14600K | |
| Intel Core i5-13600K | |
| AMD Ryzen 9 7900X | |
| AMD Ryzen 9 7950X | |
| Intel Core i9-12900K | |
| AMD Ryzen 5 7600X | |
| AMD Ryzen 9 5950X | |
| Intel Core i5-12600K | |
| Intel Core i5-13400 | |
| Intel Core i5-12400F | |
| 7-Zip 18.03 | |
| 7z b 4 | |
| AMD Ryzen 9 7950X | |
| AMD Ryzen 9 7950X3D | |
| Intel Core i9-14900K | |
| Intel Core i9-13900K | |
| AMD Ryzen 9 5950X | |
| AMD Ryzen 9 7900X | |
| Intel Core i9-12900K | |
| Intel Core i5-14600K | |
| Intel Core i5-13600K | |
| AMD Ryzen 7 7800X3D | |
| AMD Ryzen 5 7600X | |
| Intel Core i5-12600K | |
| Intel Core i5-13400 | |
| Intel Core i5-12400F | |
| 7z b 4 -mmt1 | |
| AMD Ryzen 9 7950X | |
| AMD Ryzen 9 7950X3D | |
| AMD Ryzen 9 7900X | |
| AMD Ryzen 7 7800X3D | |
| AMD Ryzen 5 7600X | |
| Intel Core i9-14900K | |
| Intel Core i9-13900K | |
| AMD Ryzen 9 5950X | |
| Intel Core i5-14600K | |
| Intel Core i9-12900K | |
| Intel Core i5-13600K | |
| Intel Core i5-12600K | |
| Intel Core i5-13400 | |
| Intel Core i5-12400F | |
| HWBOT x265 Benchmark v2.2 - 4k Preset | |
| AMD Ryzen 9 7950X | |
| Intel Core i9-14900K | |
| Intel Core i9-13900K | |
| AMD Ryzen 9 7950X3D | |
| AMD Ryzen 9 7900X | |
| AMD Ryzen 9 5950X | |
| Intel Core i5-12600K | |
| Intel Core i9-12900K | |
| Intel Core i5-14600K | |
| Intel Core i5-13600K | |
| AMD Ryzen 7 7800X3D | |
| AMD Ryzen 5 7600X | |
| Intel Core i5-13400 | |
| Intel Core i5-12400F | |
| R Benchmark 2.5 - Overall mean | |
| Intel Core i5-12400F | |
| Intel Core i5-13400 | |
| AMD Ryzen 9 5950X | |
| Intel Core i5-12600K | |
| Intel Core i9-12900K | |
| AMD Ryzen 7 7800X3D | |
| Intel Core i5-13600K | |
| Intel Core i5-14600K | |
| AMD Ryzen 5 7600X | |
| AMD Ryzen 9 7900X | |
| AMD Ryzen 9 7950X3D | |
| AMD Ryzen 9 7950X | |
| Intel Core i9-13900K | |
| Intel Core i9-14900K | |
| LibreOffice - 20 Documents To PDF | |
| Intel Core i5-12600K | |
| Intel Core i5-12400F | |
| AMD Ryzen 9 5950X | |
| AMD Ryzen 7 7800X3D | |
| Intel Core i9-12900K | |
| Intel Core i5-13400 | |
| AMD Ryzen 9 7950X3D | |
| AMD Ryzen 5 7600X | |
| Intel Core i9-13900K | |
| AMD Ryzen 9 7950X | |
| Intel Core i5-13600K | |
| AMD Ryzen 9 7900X | |
| Intel Core i9-14900K | |
| Intel Core i5-14600K | |
| WebXPRT 3 - Overall | |
| AMD Ryzen 9 7950X3D | |
| Intel Core i9-14900K | |
| AMD Ryzen 9 7900X | |
| AMD Ryzen 9 7950X | |
| AMD Ryzen 5 7600X | |
| Intel Core i9-13900K | |
| Intel Core i5-14600K | |
| AMD Ryzen 7 7800X3D | |
| Intel Core i5-13600K | |
| Intel Core i9-12900K | |
| Intel Core i5-13400 | |
| Intel Core i5-12600K | |
| AMD Ryzen 9 5950X | |
| Intel Core i5-12400F | |
| Mozilla Kraken 1.1 - Total | |
| Intel Core i5-12400F | |
| AMD Ryzen 9 5950X | |
| Intel Core i5-13400 | |
| Intel Core i5-12600K | |
| AMD Ryzen 7 7800X3D | |
| Intel Core i9-12900K | |
| Intel Core i5-13600K | |
| Intel Core i5-14600K | |
| AMD Ryzen 5 7600X | |
| AMD Ryzen 9 7950X3D | |
| AMD Ryzen 9 7950X | |
| Intel Core i9-13900K | |
| AMD Ryzen 9 7900X | |
| Intel Core i9-14900K | |
| 3DMark | |
| 3840x2160 Fire Strike Ultra Physics | |
| Intel Core i9-14900K | |
| Intel Core i9-13900K | |
| AMD Ryzen 9 7950X3D | |
| AMD Ryzen 9 7900X | |
| AMD Ryzen 9 7950X | |
| Intel Core i5-14600K | |
| Intel Core i9-12900K | |
| AMD Ryzen 9 5950X | |
| Intel Core i5-13600K | |
| AMD Ryzen 7 7800X3D | |
| AMD Ryzen 5 7600X | |
| Intel Core i5-12600K | |
| Intel Core i5-13400 | |
| Intel Core i5-12400F | |
| 1920x1080 Fire Strike Physics | |
| Intel Core i9-14900K | |
| Intel Core i9-13900K | |
| AMD Ryzen 9 7950X3D | |
| AMD Ryzen 9 7900X | |
| AMD Ryzen 9 7950X | |
| Intel Core i5-14600K | |
| AMD Ryzen 9 5950X | |
| Intel Core i9-12900K | |
| Intel Core i5-13600K | |
| AMD Ryzen 7 7800X3D | |
| AMD Ryzen 5 7600X | |
| Intel Core i5-12600K | |
| Intel Core i5-13400 | |
| Intel Core i5-12400F | |
| 2560x1440 Time Spy CPU | |
| Intel Core i9-14900K | |
| Intel Core i9-13900K | |
| Intel Core i5-14600K | |
| Intel Core i9-12900K | |
| AMD Ryzen 9 7950X3D | |
| Intel Core i5-13600K | |
| AMD Ryzen 9 7900X | |
| AMD Ryzen 9 7950X | |
| AMD Ryzen 7 7800X3D | |
| Intel Core i5-12600K | |
| AMD Ryzen 9 5950X | |
| Intel Core i5-13400 | |
| AMD Ryzen 5 7600X | |
| Intel Core i5-12400F | |
* ... smaller is better
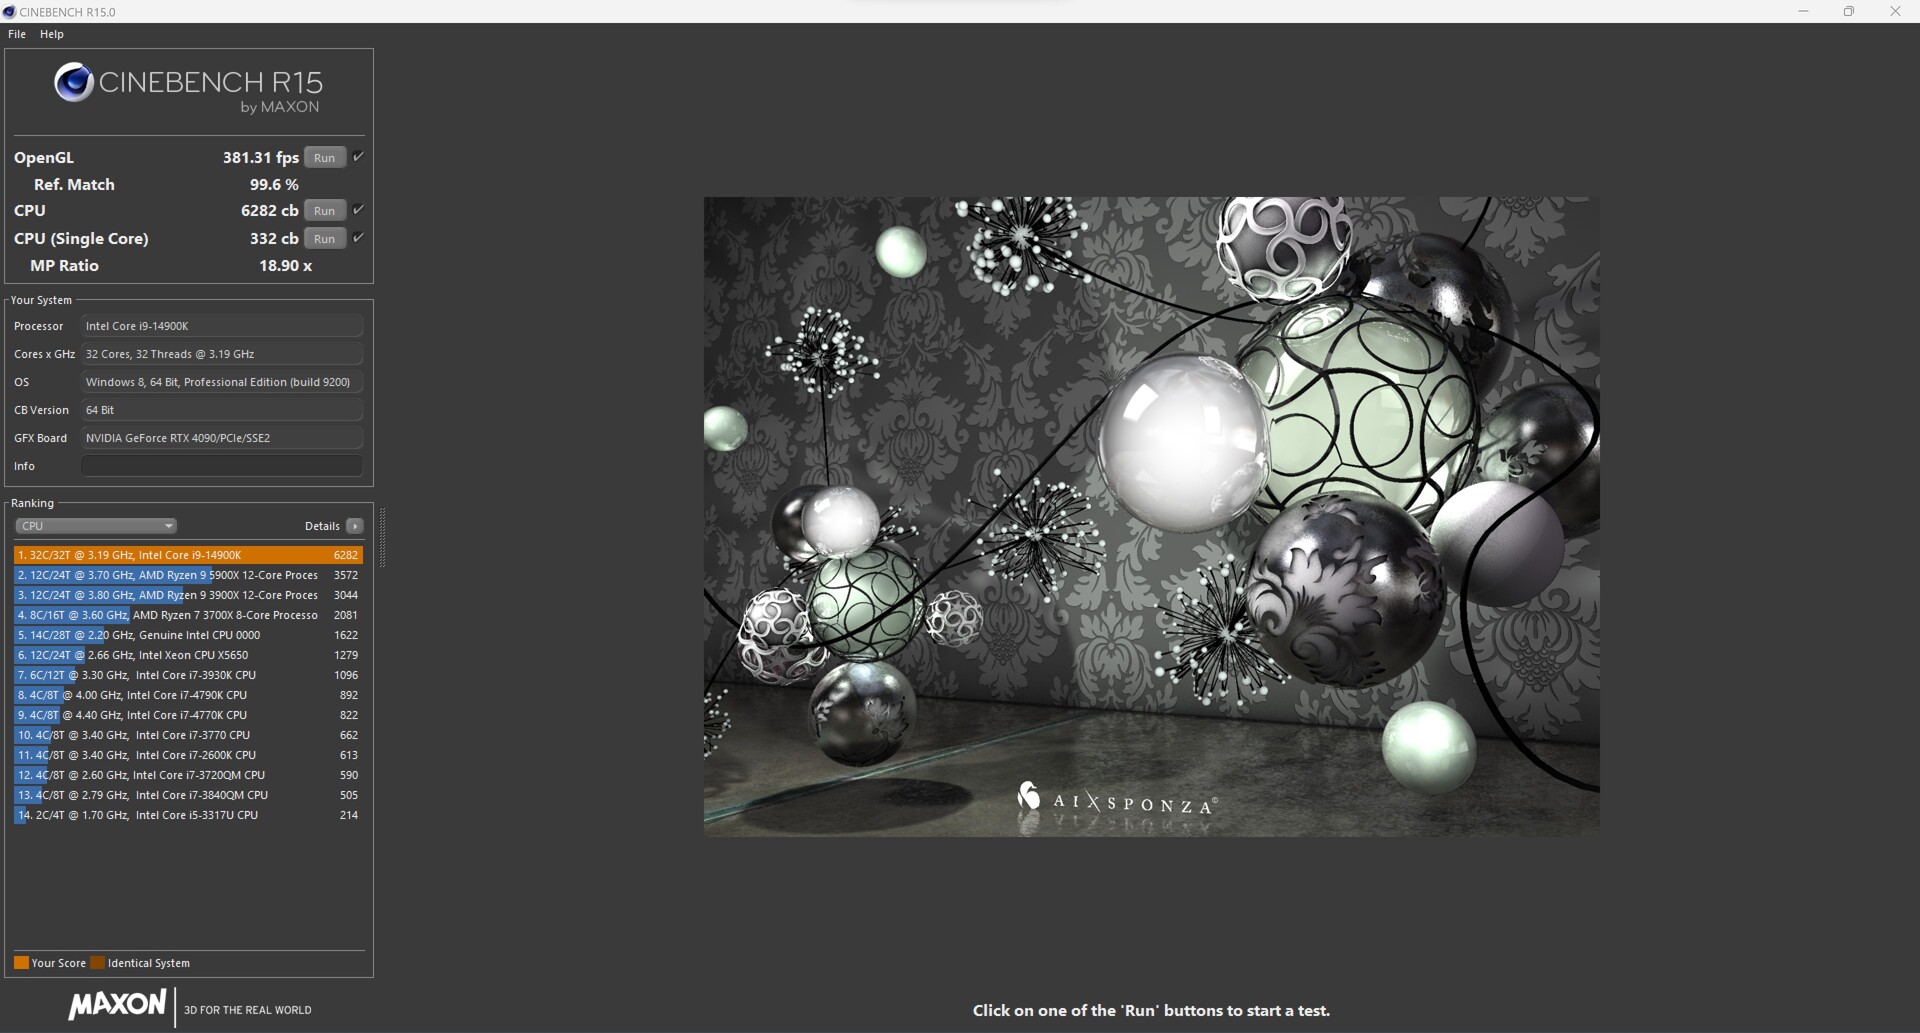
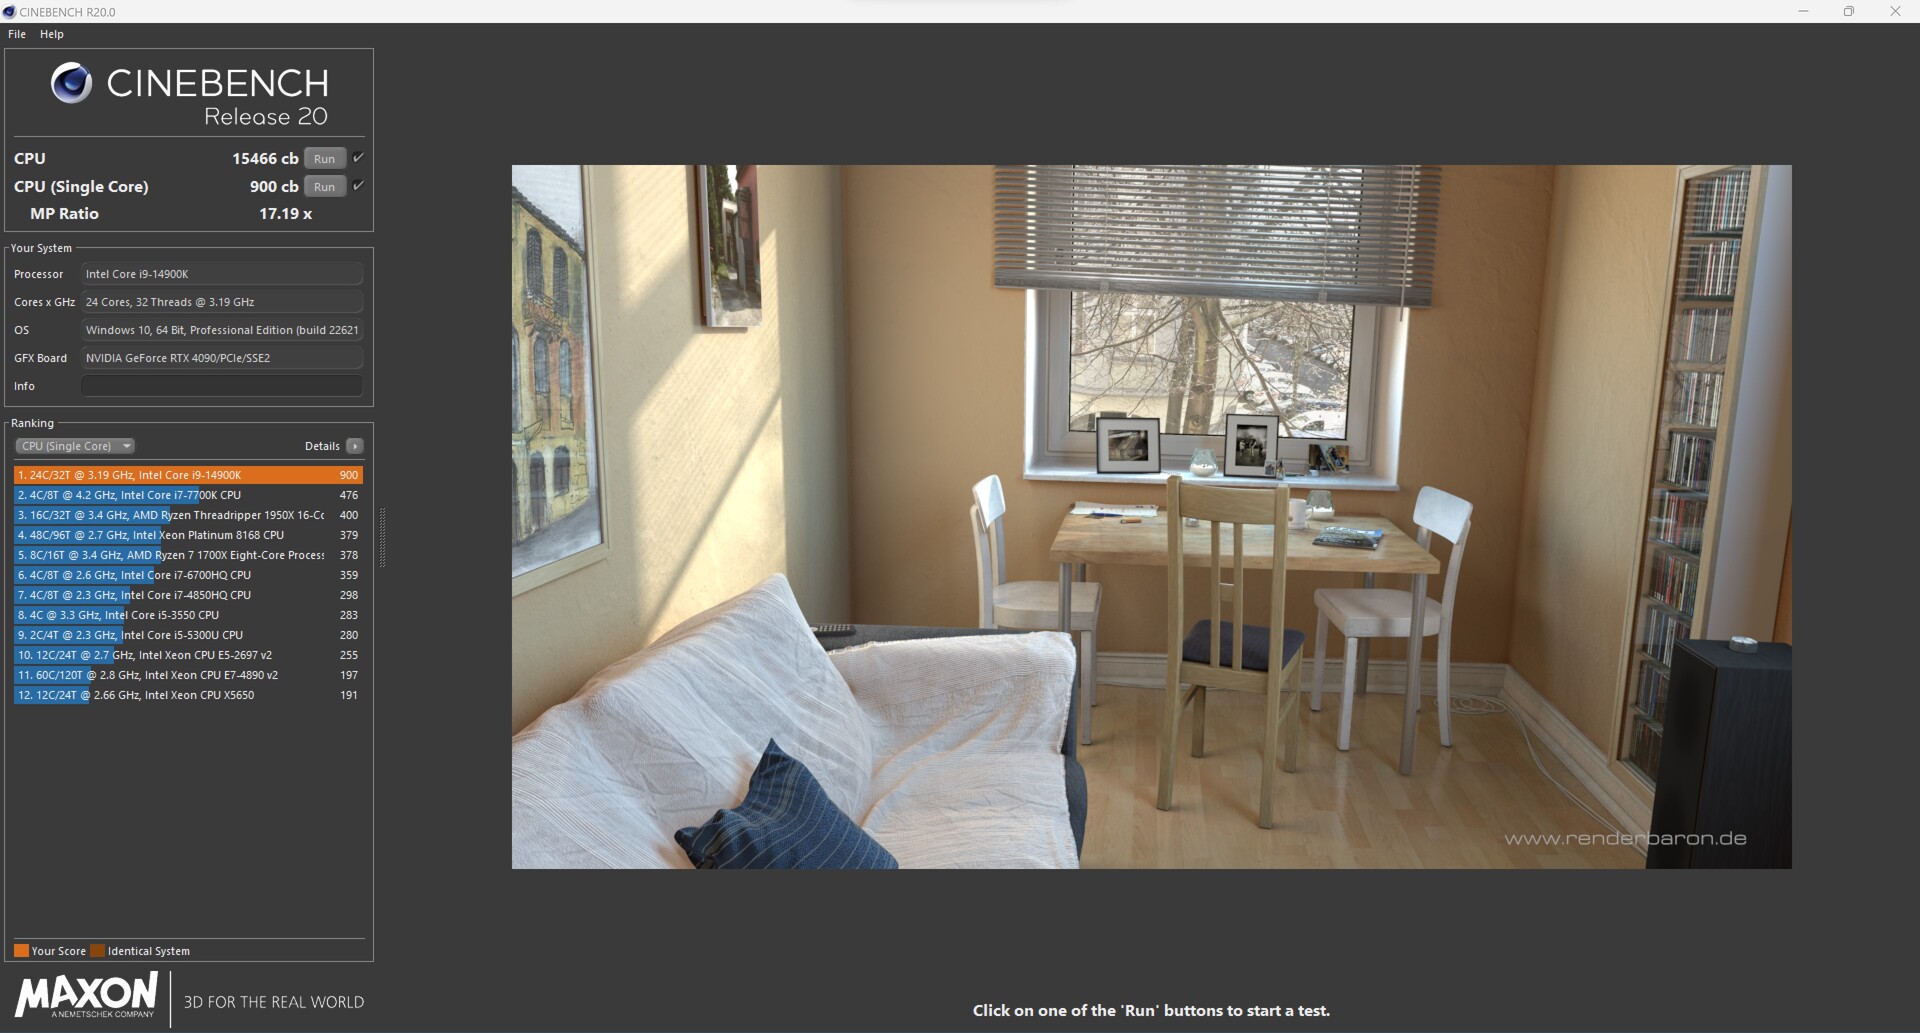
Cinebench Results of the Intel Core i9-14900K

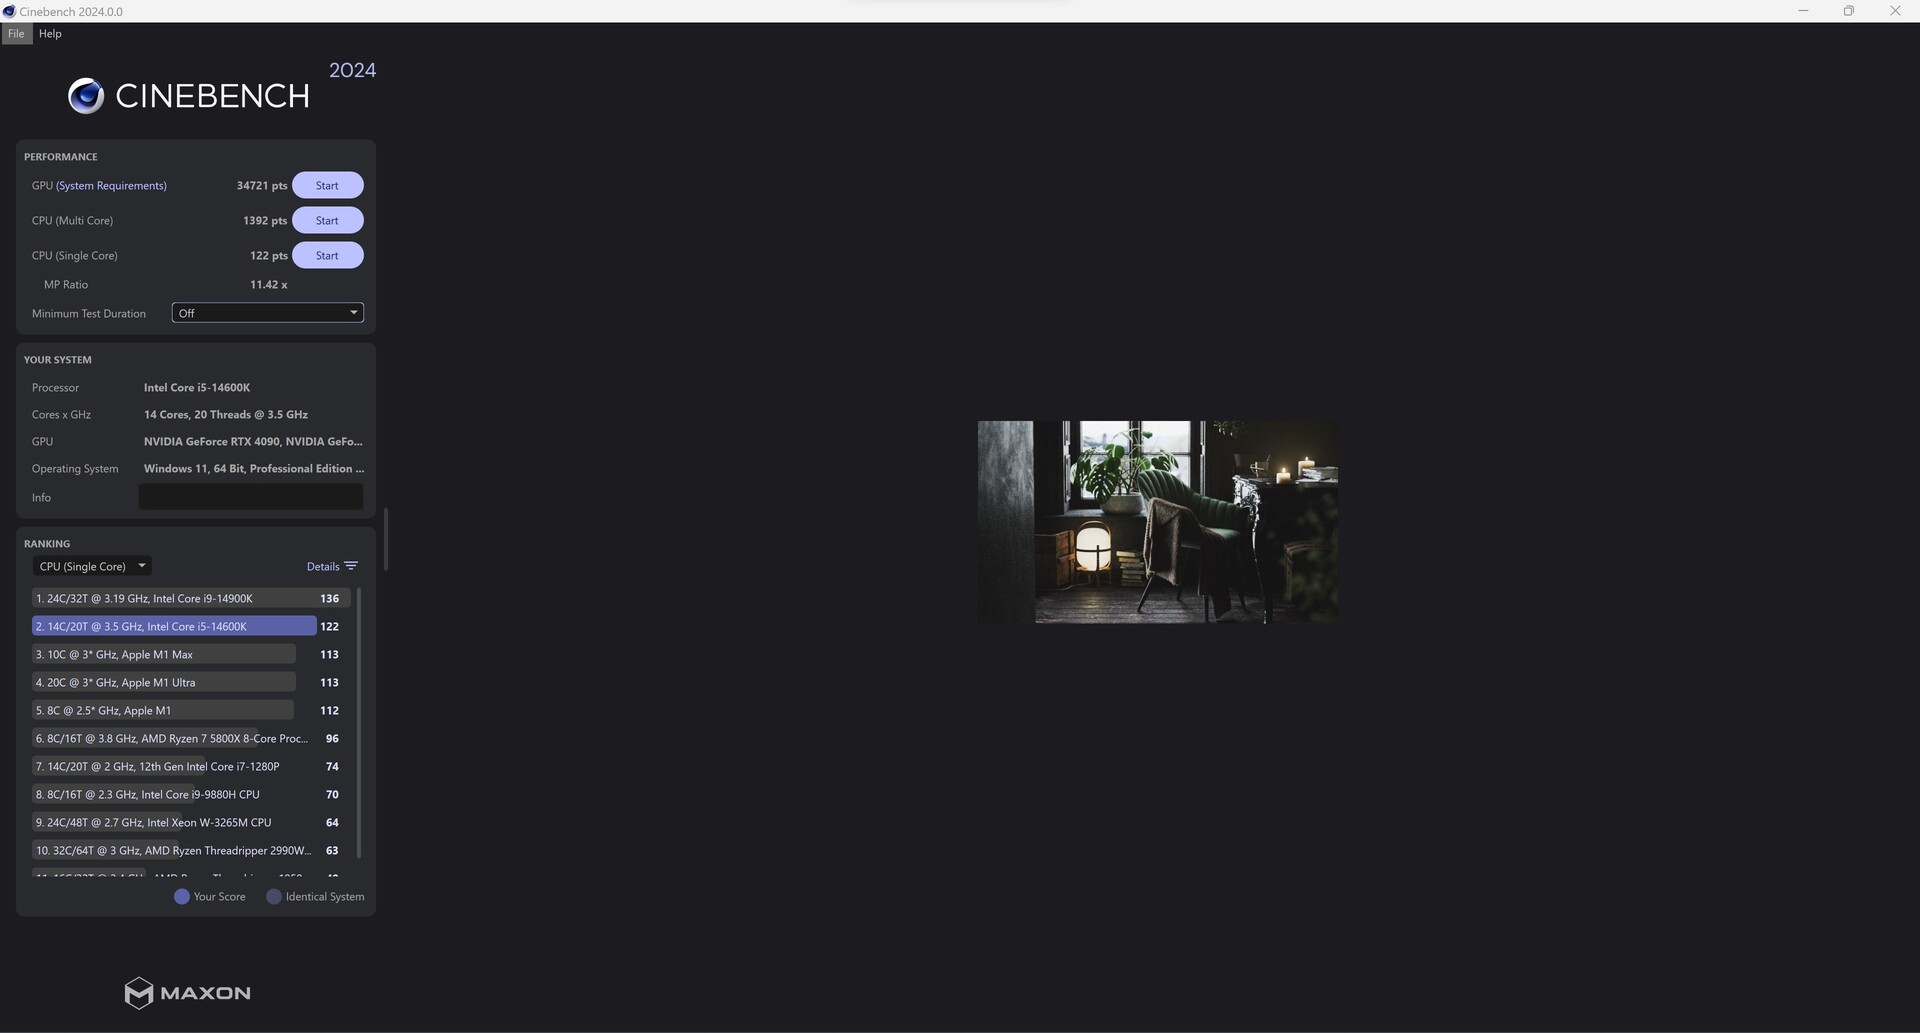
Cinebench Results of the Intel Core i5-14600K

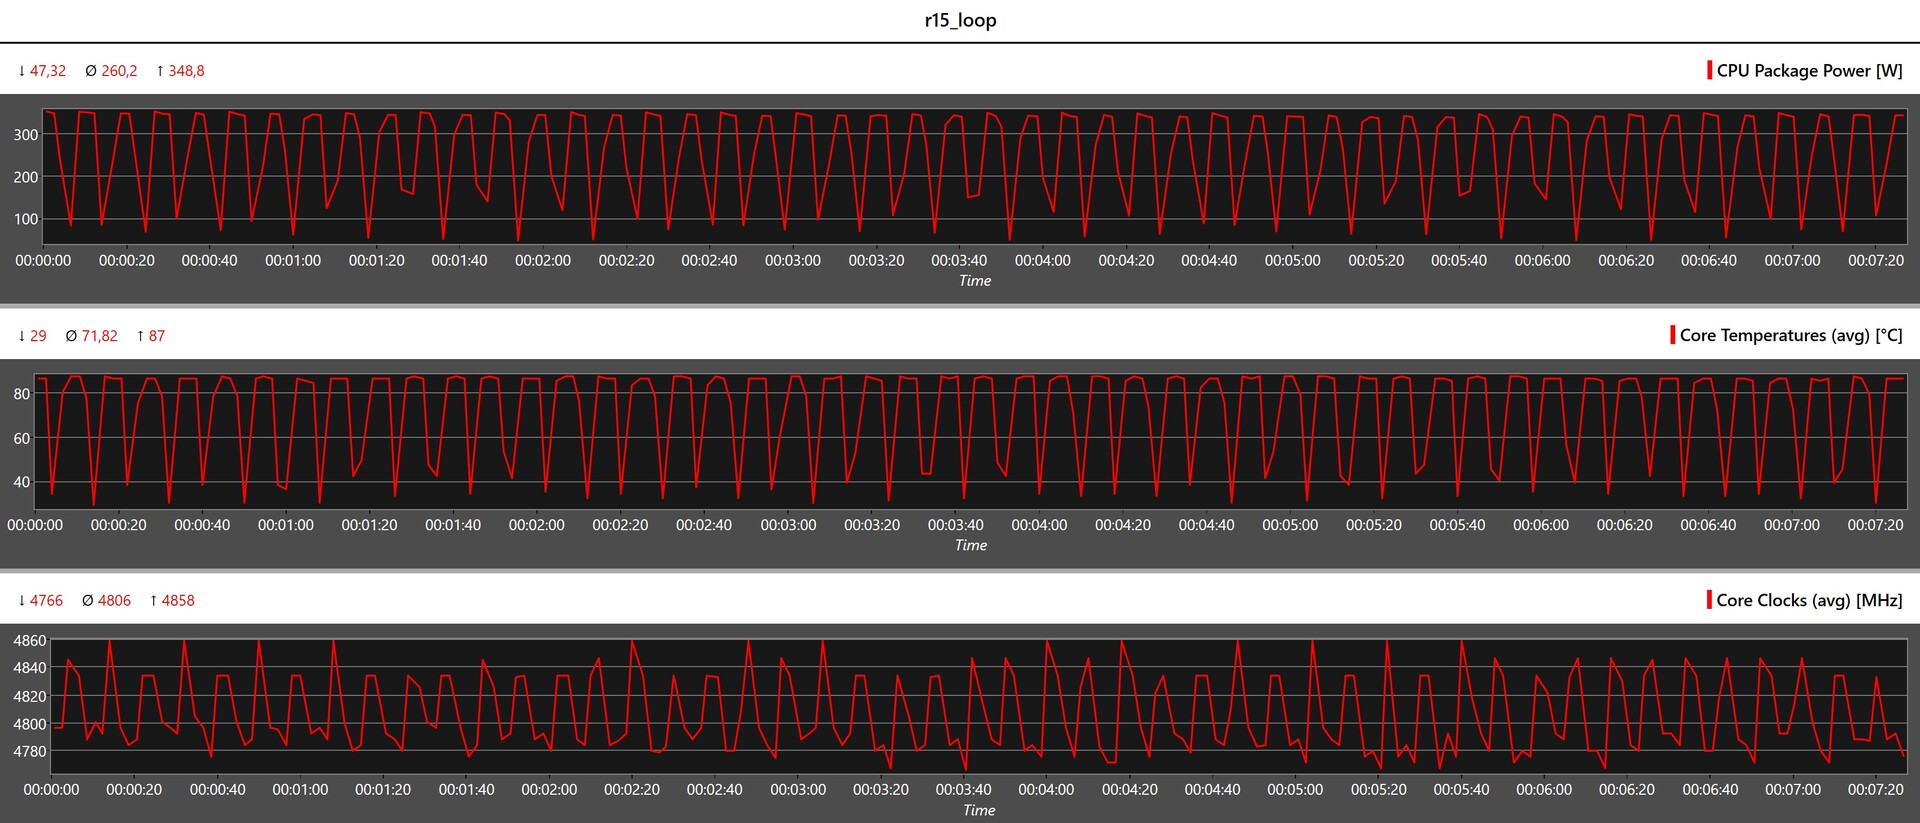
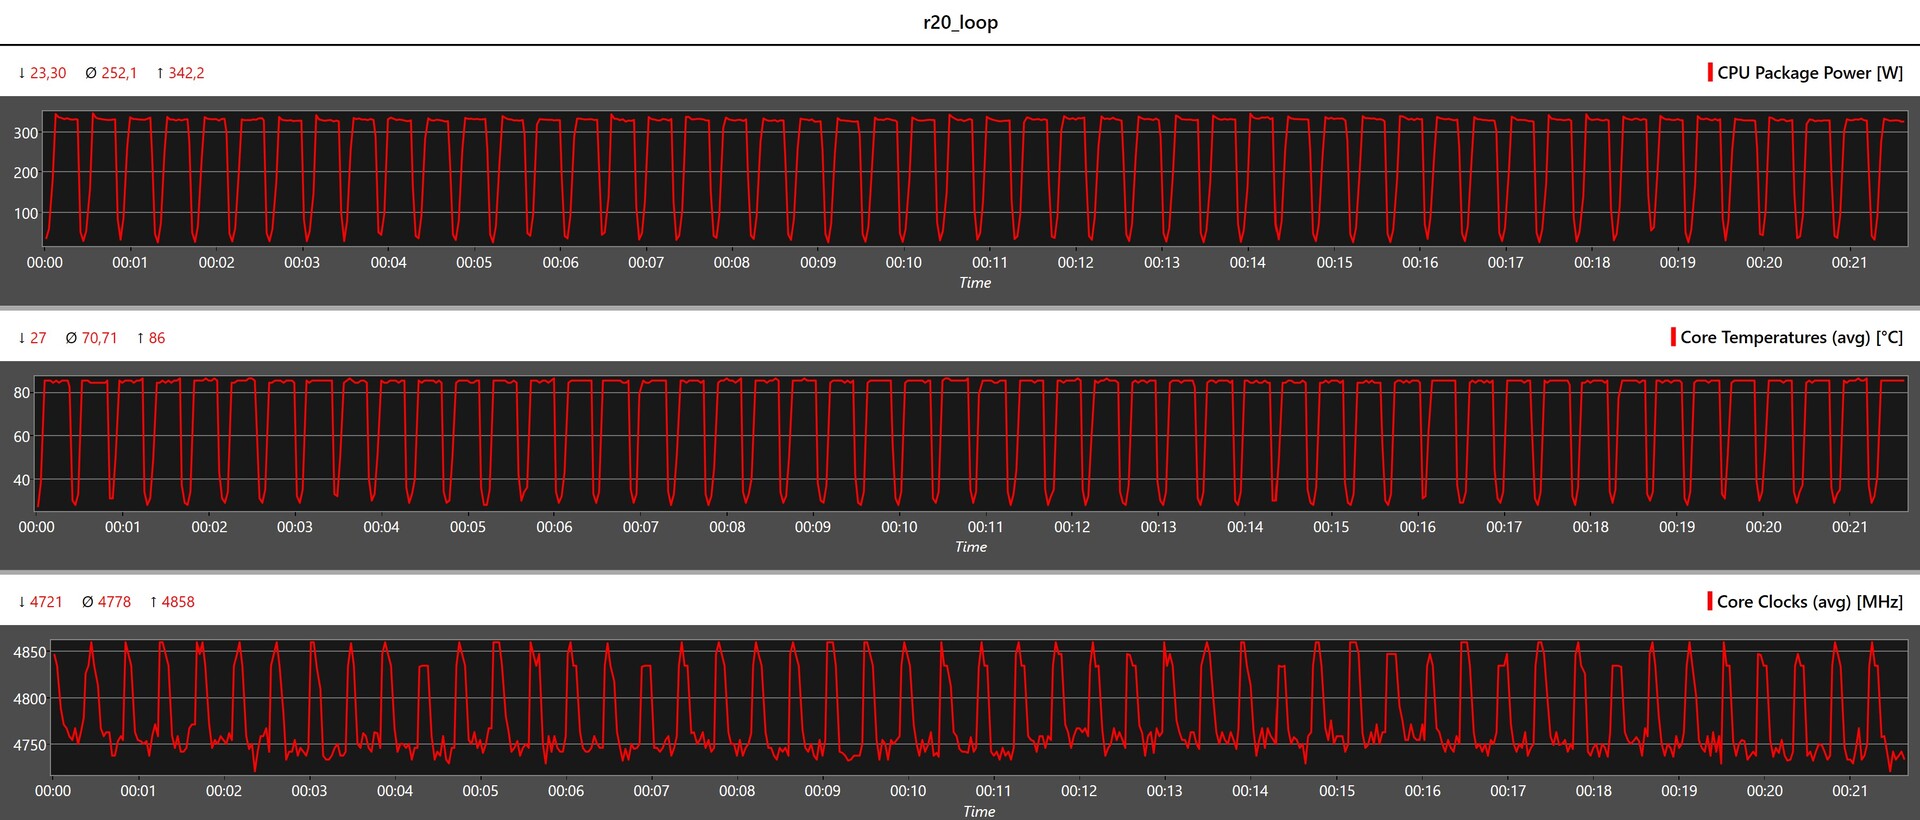
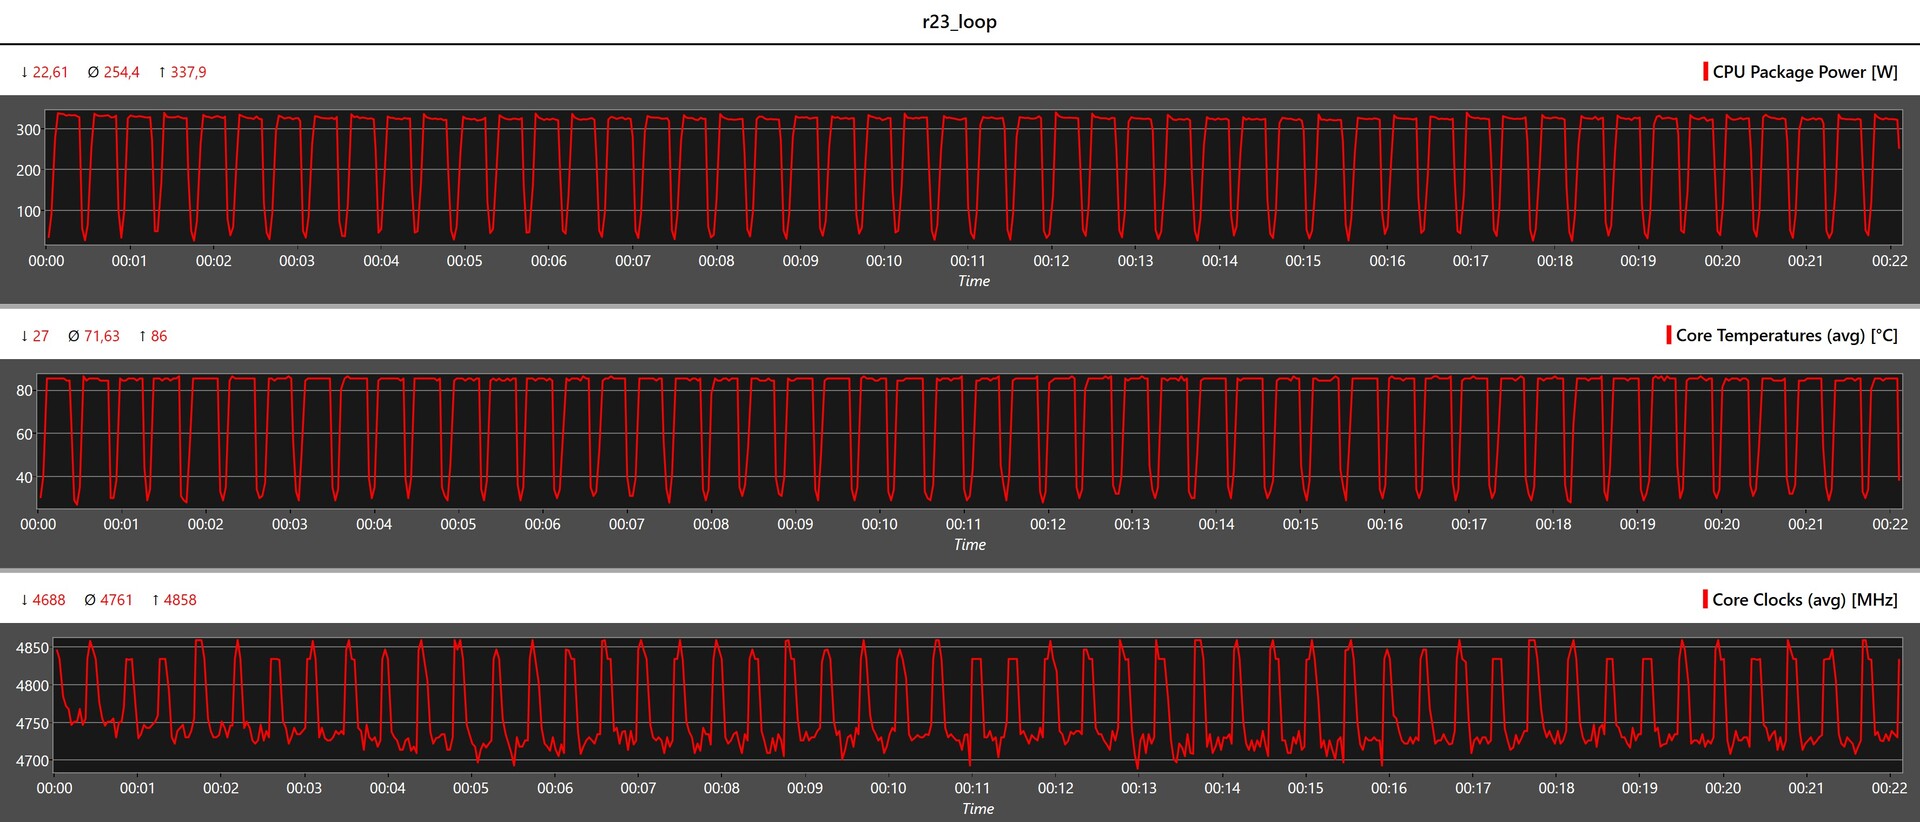
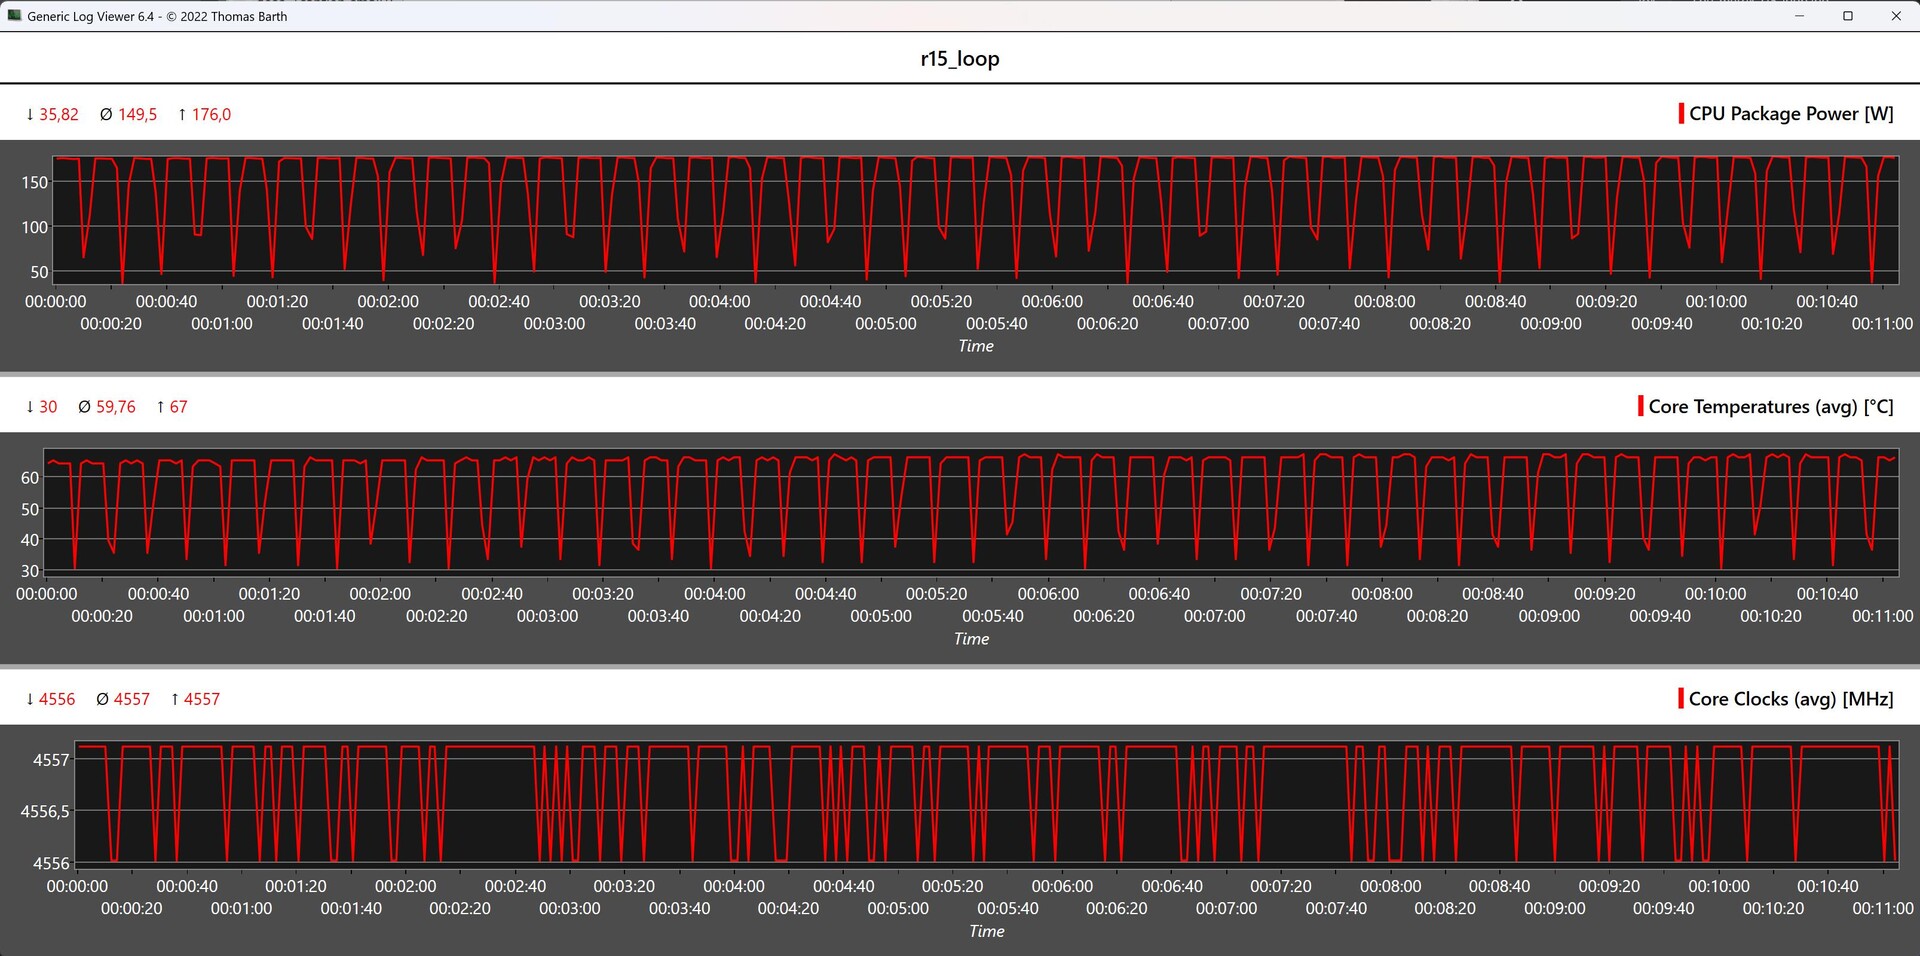
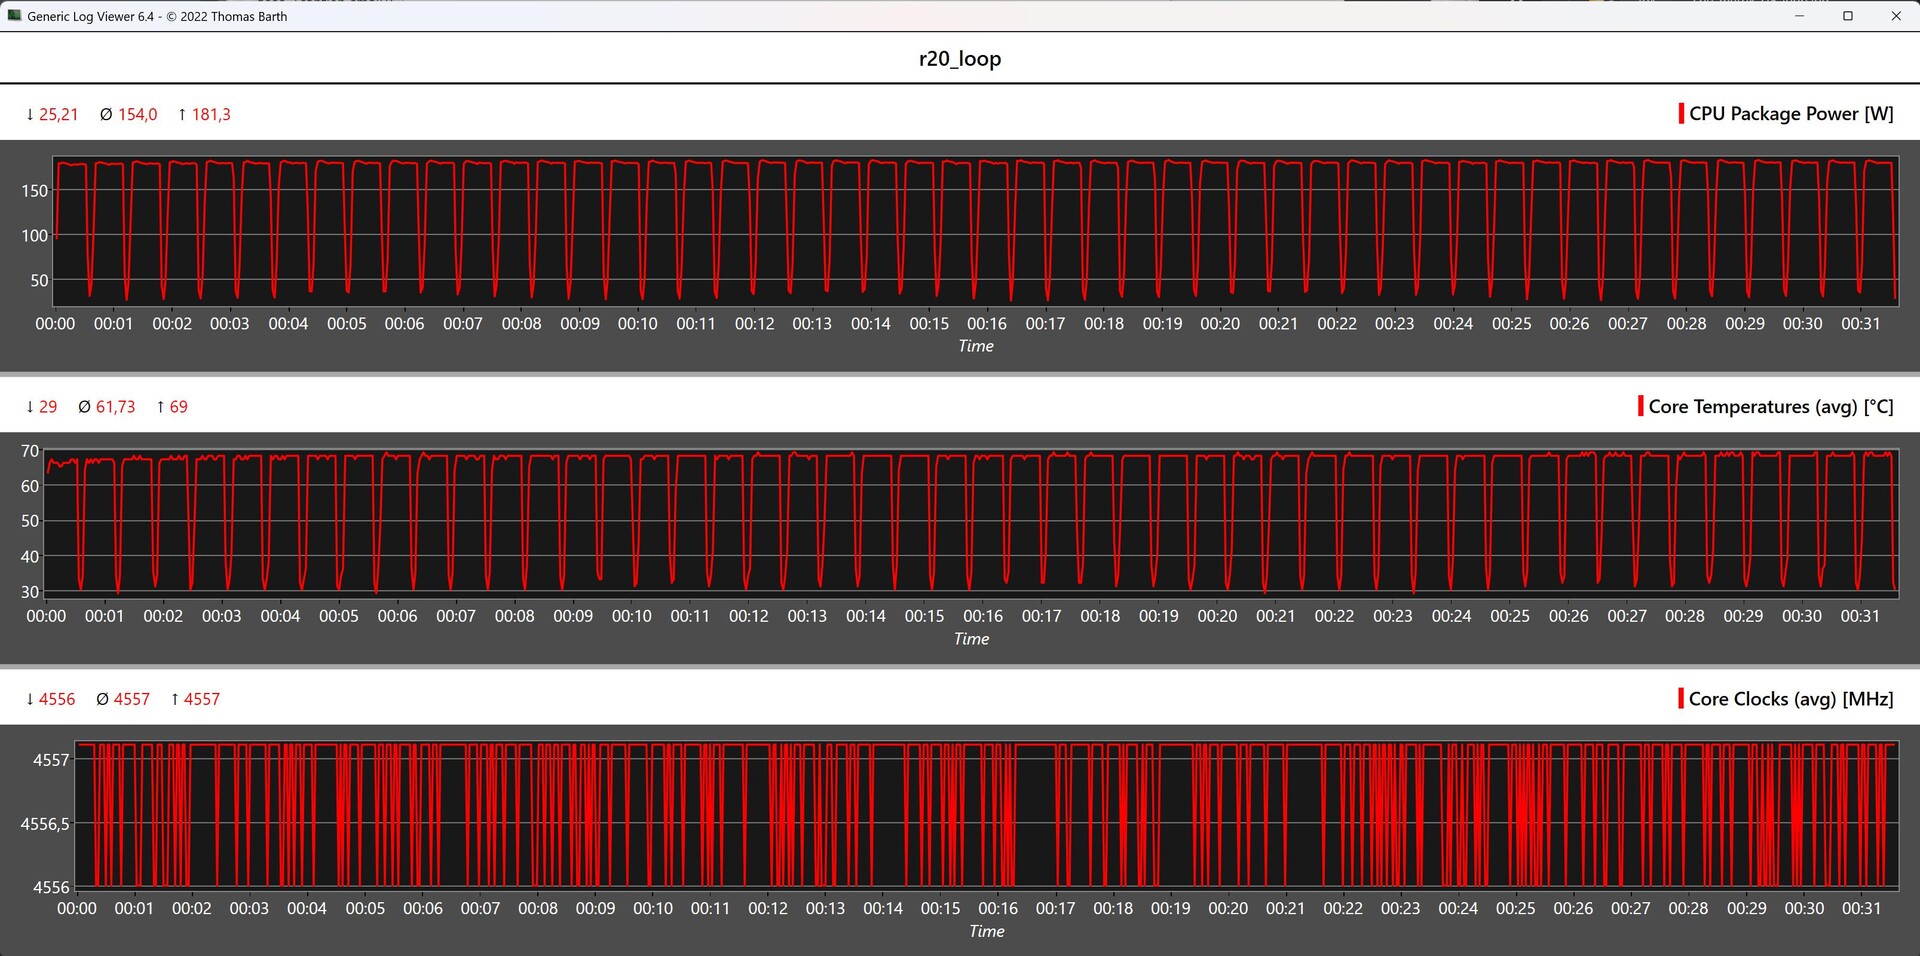
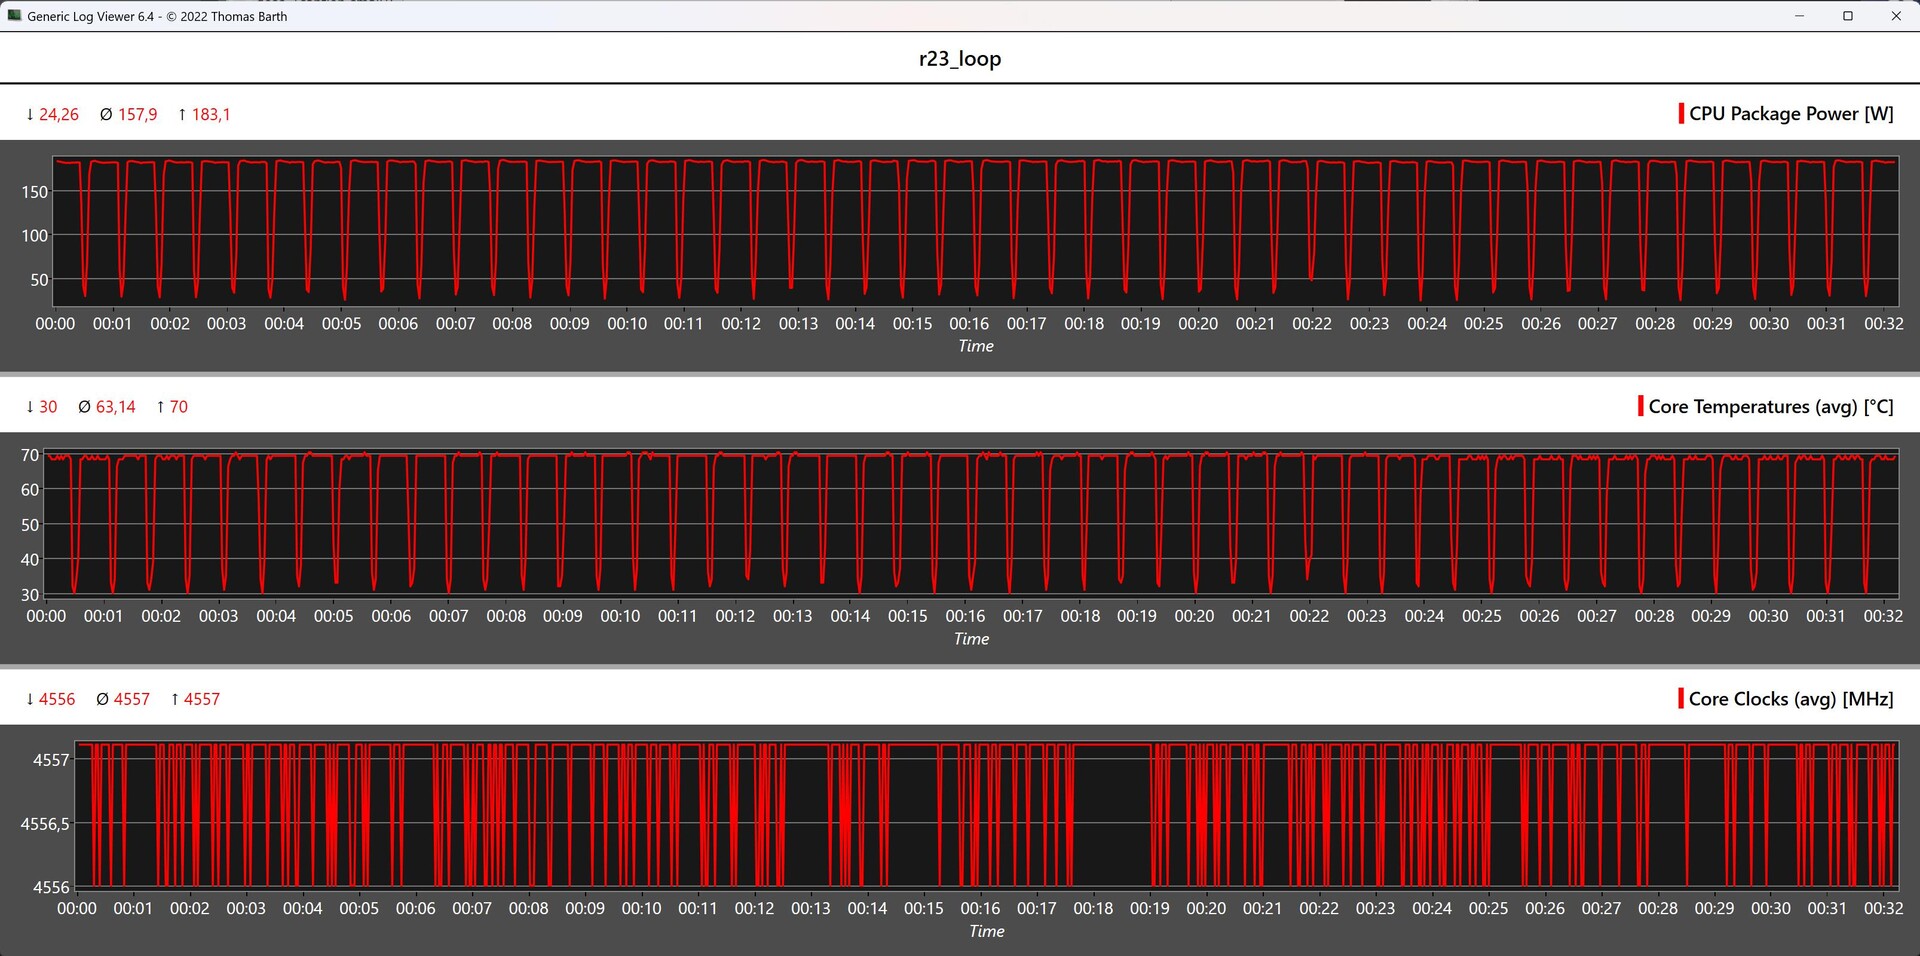
Core i9-14900K and Core i5-14600K vs. Cinebench R15 Multi Loop
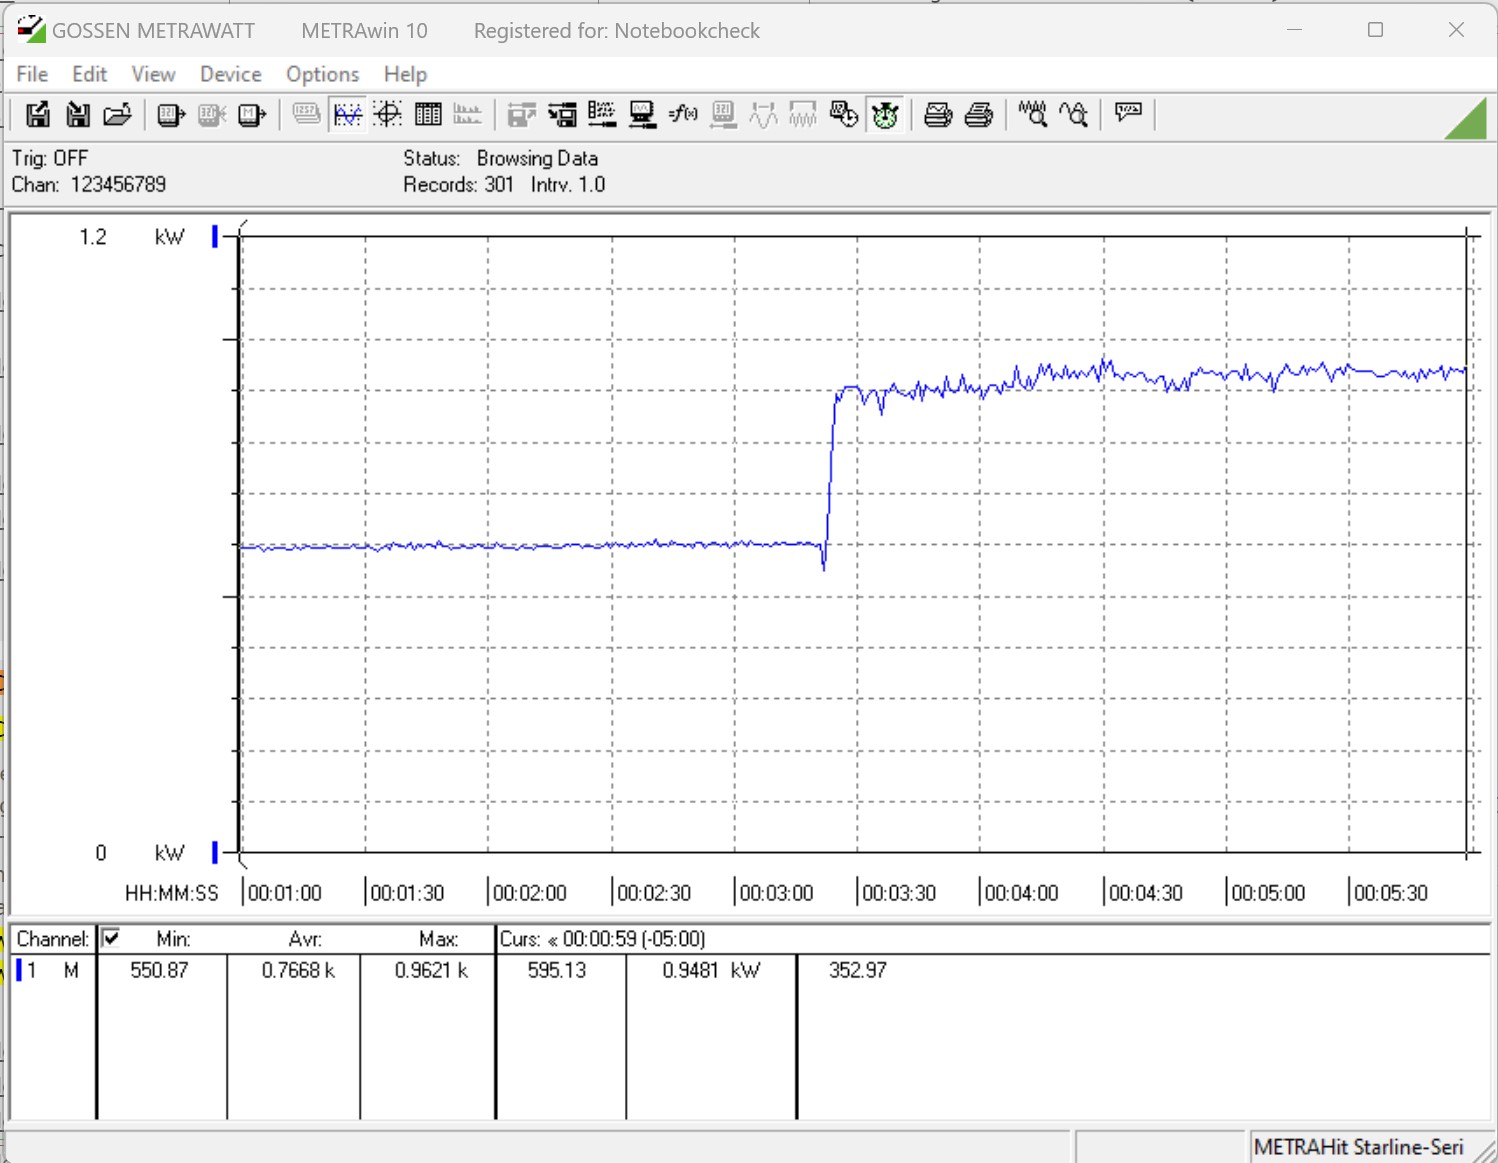
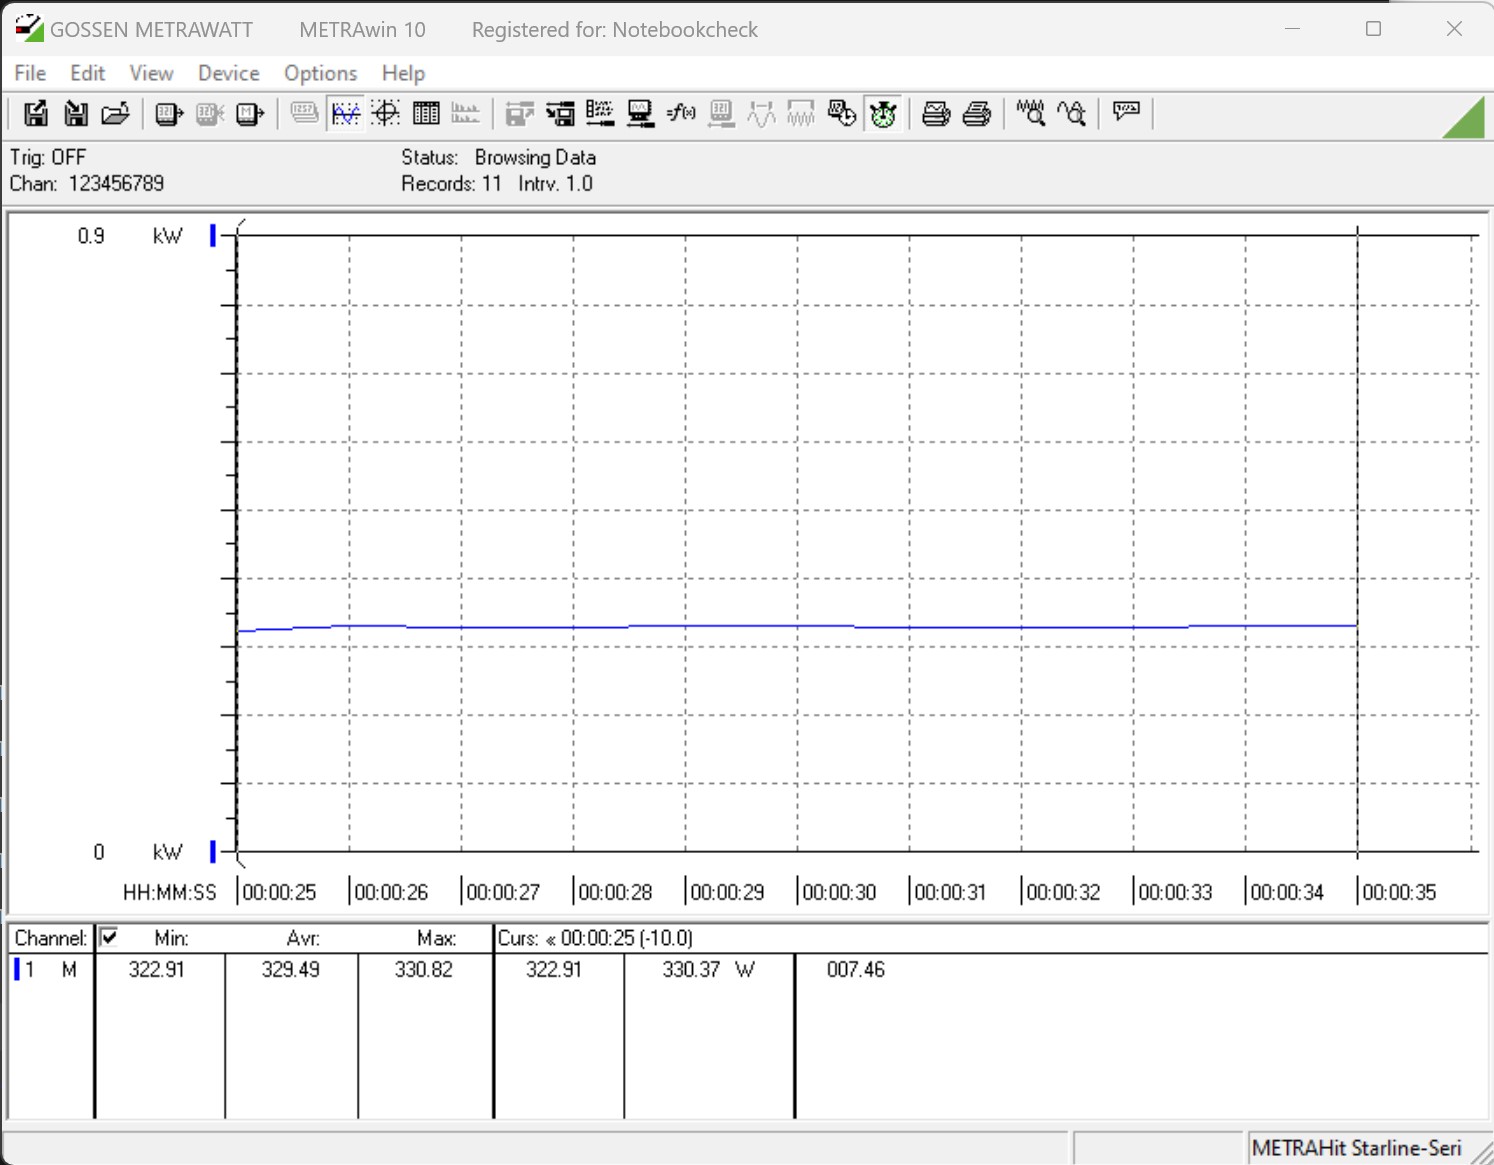
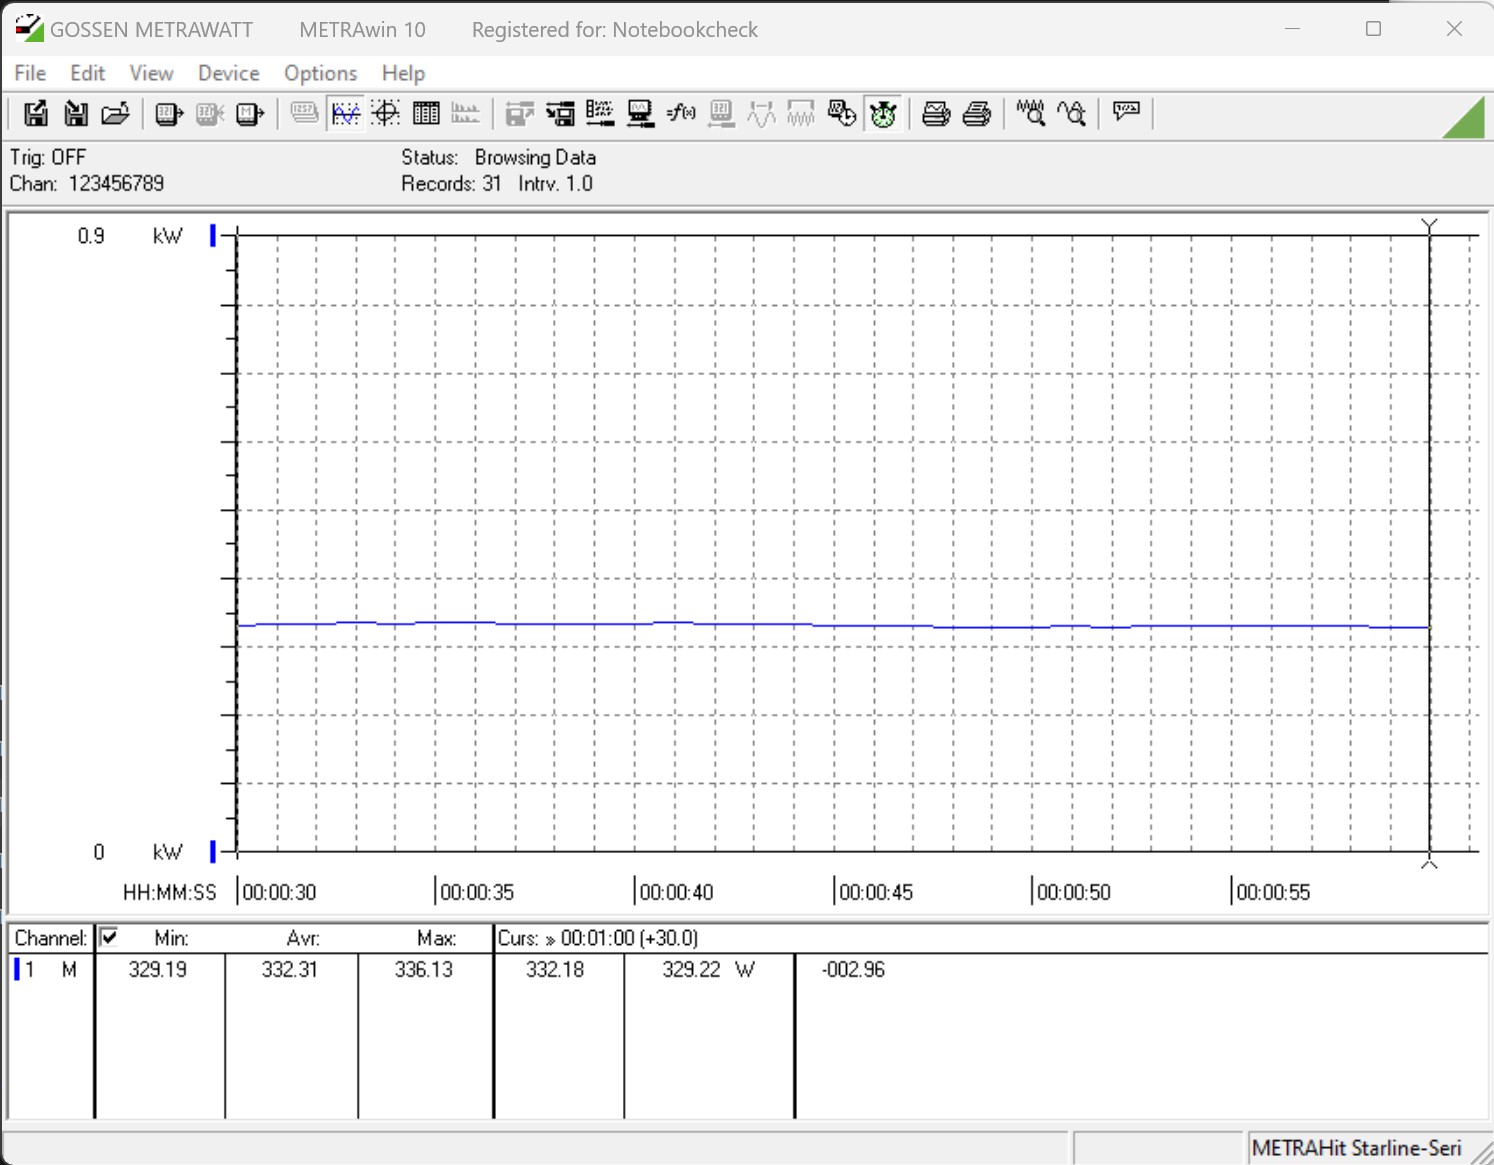
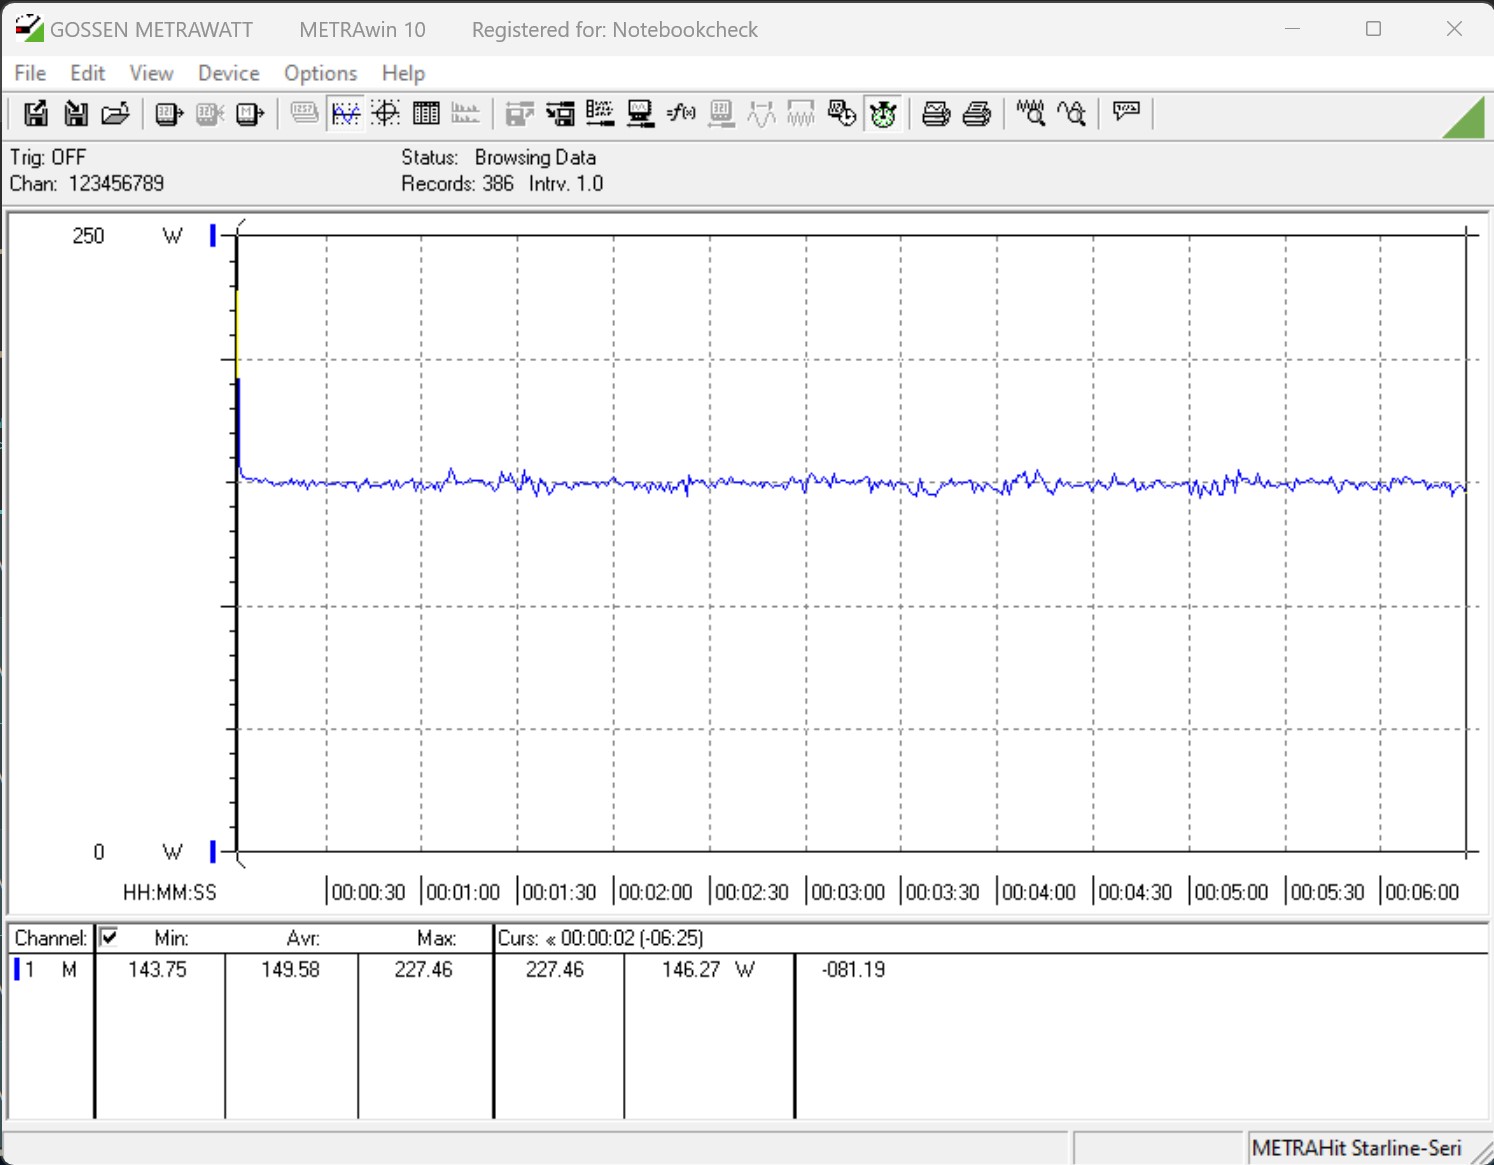
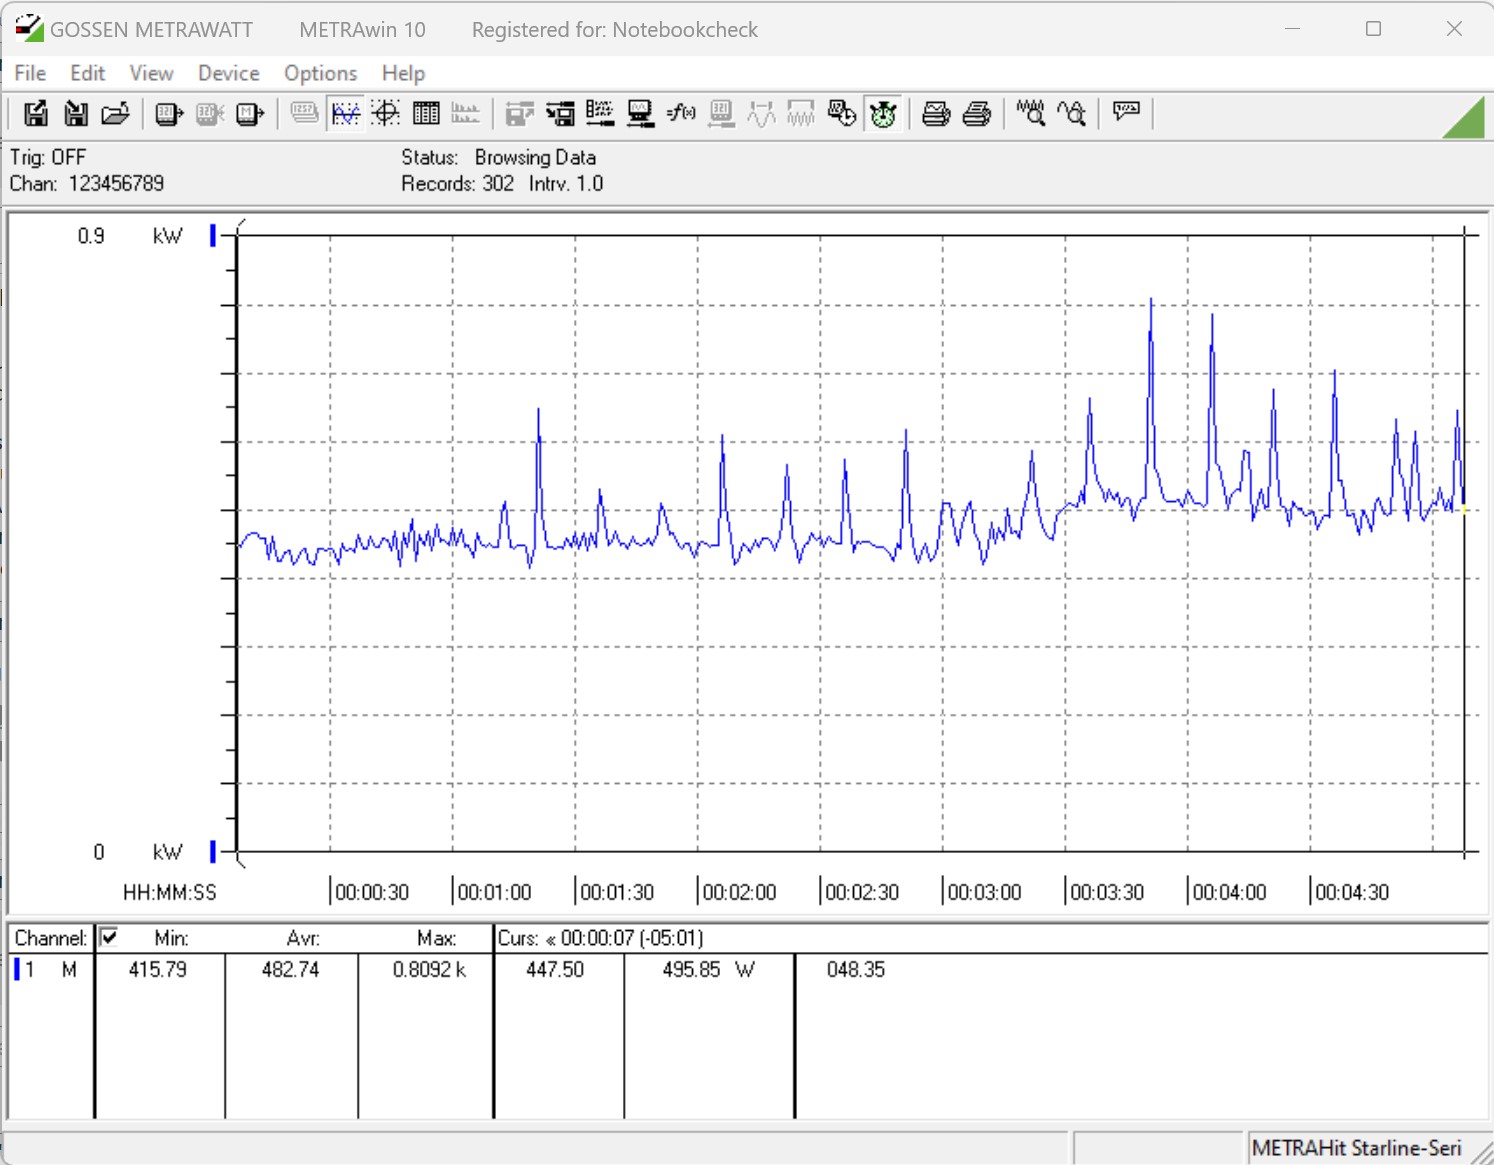
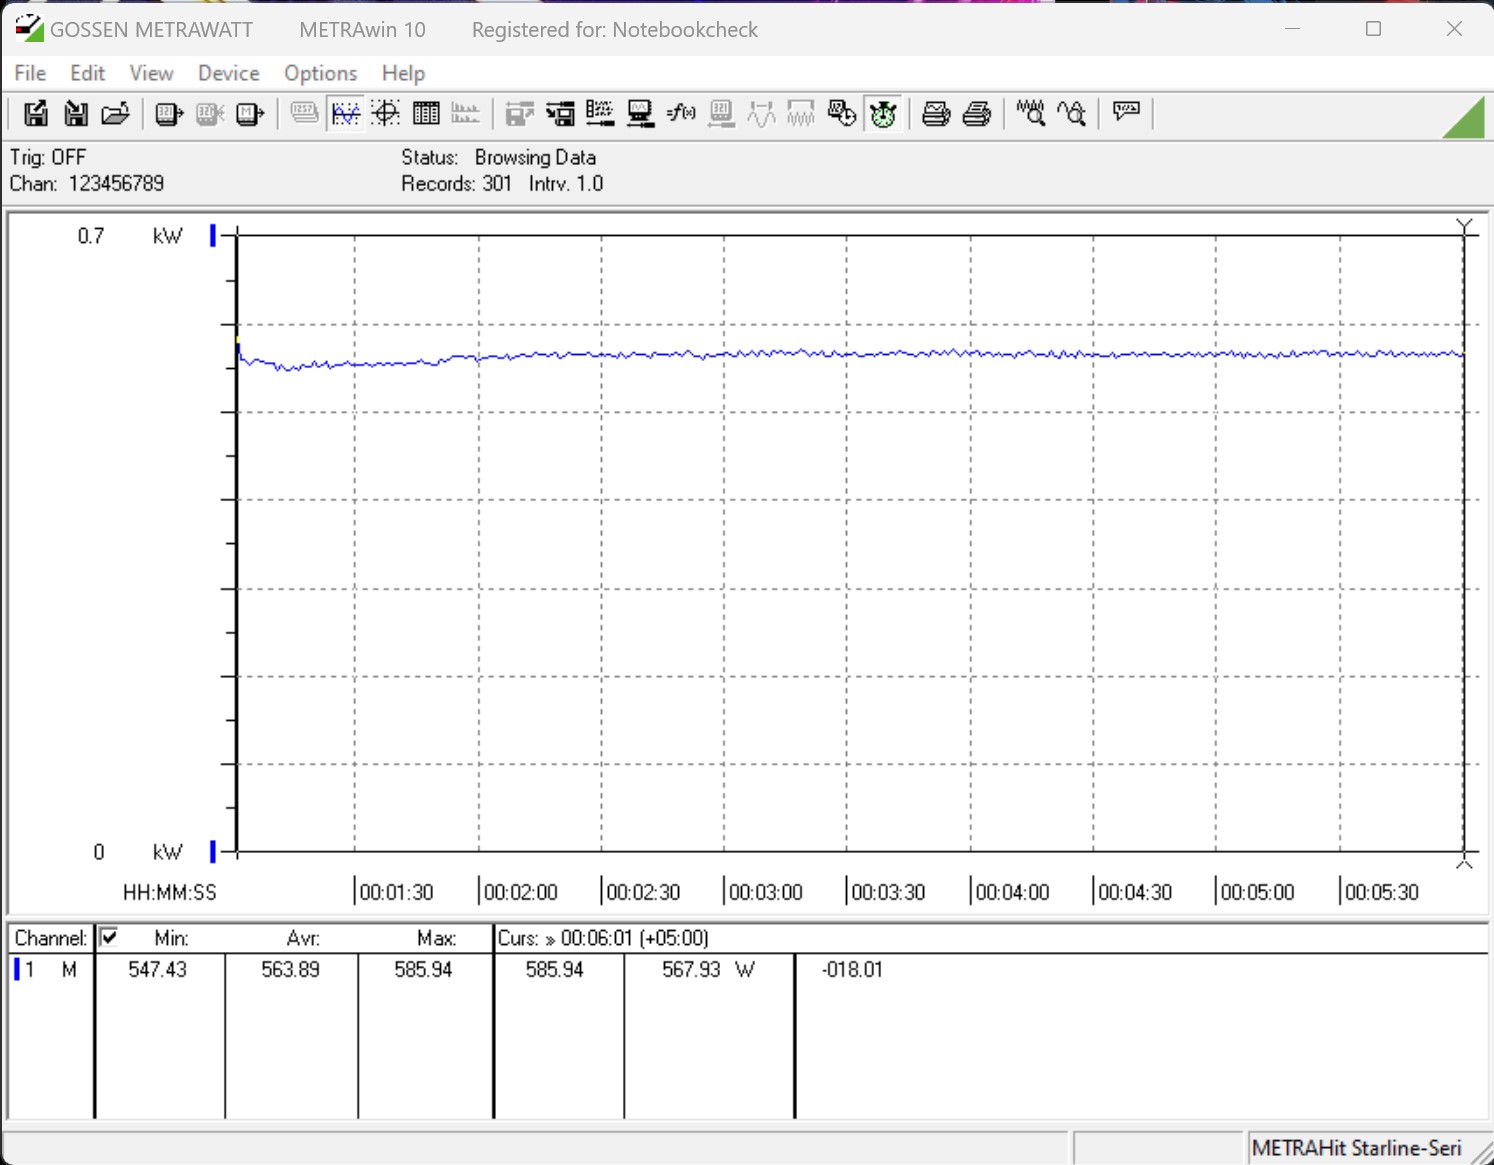
For our first longer load test, we took a look at the processor's behavior during the Cinebench R15 constant loop. We initially saw a stable performance of all the models in our test. However, the Intel Core i9-14900K was unable to stay in first place. It takes a lot of effort to cool the CPU since the Intel Core i9-14900K is quite power-hungry, consuming up to 348 watts. As a result, the CPU repeatedly reached its thermal limit of 100 °C (212 °F), which also means that it only achieved the third-best result in our comparison.
With the Intel Core i5-14600K, we noted a minimally better result compared to the Intel Core i5-13600K, but the advantage was so small that we could credit it to measurement tolerances. Consuming slightly more than 180 watts, it is significantly easier to cool the Intel Core i5-13600K.
All the CPU tests were run under the same conditions, which also means that no power limits were defined in the BIOS.
CPU Metrics During the Cinebench Loops (R15, R20, R23)
Intel Core i9-14900K
Intel Core i5-14600K
Synthetic Benchmarks and Application Performance
After AMD was able to surpass the Intel Core i9-13900K with the Ryzen 9 7950X, now the tables are turned again, giving the advantage to Intel. But this advantage is also razor thin if we take a closer look at the results of the PCMark 10 benchmark.
Both Raptor Lake Refresh models passed the RAM tests with flying colors. With its installed DDR5-6000 RAM, the Intel Core i9-14900K was able to secure first place. AMD was surpassed significantly here, even though the clock speeds are the same.
| PCMark 10 - Score | |
| Intel Core i9-14900K | |
| AMD Ryzen 9 7950X | |
| Intel Core i9-13900K | |
| Intel Core i5-14600K | |
| AMD Ryzen 7 7800X3D | |
| AMD Ryzen 5 7600X | |
| Intel Core i5-13600K | |
| Intel Core i9-12900K | |
| Intel Core i5-12600K | |
| 3DMark | |
| 1920x1080 Fire Strike Physics | |
| Intel Core i9-14900K | |
| Intel Core i9-13900K | |
| AMD Ryzen 9 7950X | |
| Intel Core i5-14600K | |
| Intel Core i9-12900K | |
| Intel Core i5-13600K | |
| AMD Ryzen 7 7800X3D | |
| AMD Ryzen 5 7600X | |
| Intel Core i5-12600K | |
| 2560x1440 Time Spy CPU | |
| Intel Core i9-14900K | |
| Intel Core i9-13900K | |
| Intel Core i5-14600K | |
| Intel Core i9-12900K | |
| Intel Core i5-13600K | |
| AMD Ryzen 9 7950X | |
| AMD Ryzen 7 7800X3D | |
| Intel Core i5-12600K | |
| AMD Ryzen 5 7600X | |
| 3DMark 11 - 1280x720 Performance Physics | |
| AMD Ryzen 7 7800X3D | |
| Intel Core i9-13900K | |
| Intel Core i9-14900K | |
| Intel Core i5-14600K | |
| Intel Core i5-13600K | |
| AMD Ryzen 9 7950X | |
| Intel Core i9-12900K | |
| AMD Ryzen 5 7600X | |
| Intel Core i5-12600K | |
| CrossMark - Overall | |
| Intel Core i9-14900K | |
| Intel Core i9-13900K | |
| AMD Ryzen 9 7950X | |
| Intel Core i5-14600K | |
| Intel Core i5-13600K | |
| AMD Ryzen 5 7600X | |
| AMD Ryzen 7 7800X3D | |
| AIDA64 / Memory Copy | |
| Intel Core i9-14900K | |
| Intel Core i9-14900K | |
| Intel Core i5-14600K | |
| Intel Core i9-13900K | |
| AMD Ryzen 9 7950X3D | |
| Intel Core i9-12900K | |
| AMD Ryzen 9 7950X | |
| Intel Core i5-13600K | |
| Intel Core i5-12600K | |
| AMD Ryzen 7 7800X3D | |
| AMD Ryzen 5 7600X | |
| Average of class (4514 - 234662, n=2198) | |
| AIDA64 / Memory Read | |
| Intel Core i9-14900K | |
| Intel Core i9-14900K | |
| Intel Core i5-14600K | |
| Intel Core i9-13900K | |
| Intel Core i9-12900K | |
| AMD Ryzen 9 7950X3D | |
| AMD Ryzen 9 7950X | |
| Intel Core i5-12600K | |
| Intel Core i5-13600K | |
| AMD Ryzen 7 7800X3D | |
| AMD Ryzen 5 7600X | |
| Average of class (4031 - 271066, n=2160) | |
| AIDA64 / Memory Write | |
| AMD Ryzen 7 7800X3D | |
| AMD Ryzen 9 7950X3D | |
| Intel Core i5-14600K | |
| Intel Core i9-14900K | |
| Intel Core i9-14900K | |
| AMD Ryzen 5 7600X | |
| AMD Ryzen 9 7950X | |
| Intel Core i9-13900K | |
| Intel Core i5-12600K | |
| Intel Core i9-12900K | |
| Intel Core i5-13600K | |
| Average of class (3506 - 242868, n=2165) | |
| AIDA64 / Memory Latency | |
| Average of class (6.1 - 536, n=2227) | |
| Intel Core i5-13600K | |
| Intel Core i9-13900K | |
| Intel Core i9-14900K | |
| Intel Core i9-14900K | |
| Intel Core i5-14600K | |
| AMD Ryzen 7 7800X3D | |
| AMD Ryzen 9 7950X3D | |
| AMD Ryzen 5 7600X | |
| AMD Ryzen 9 7950X | |
* ... smaller is better
| Performance rating - Percent | |
| Intel Core i9-14900K | |
| Intel Core i5-14600K | |
| AMD Ryzen 7 7800X3D | |
| AMD Ryzen 9 7950X3D | |
| AMD Ryzen 9 7950X | |
| Intel Core i9-13900K | |
| 3DMark | |
| 2560x1440 Time Spy Graphics | |
| Intel Core i5-14600K | |
| Intel Core i9-14900K | |
| AMD Ryzen 7 7800X3D | |
| AMD Ryzen 9 7950X | |
| AMD Ryzen 9 7950X3D | |
| Intel Core i9-13900K | |
| Fire Strike Extreme Graphics | |
| AMD Ryzen 7 7800X3D | |
| Intel Core i5-14600K | |
| Intel Core i9-14900K | |
| AMD Ryzen 9 7950X | |
| AMD Ryzen 9 7950X3D | |
| Intel Core i9-13900K | |
| 3840x2160 Fire Strike Ultra Graphics | |
| AMD Ryzen 7 7800X3D | |
| Intel Core i5-14600K | |
| Intel Core i9-14900K | |
| AMD Ryzen 9 7950X | |
| AMD Ryzen 9 7950X3D | |
| Intel Core i9-13900K | |
| 1920x1080 Fire Strike Graphics | |
| Intel Core i5-14600K | |
| AMD Ryzen 7 7800X3D | |
| AMD Ryzen 9 7950X3D | |
| AMD Ryzen 9 7950X | |
| Intel Core i9-14900K | |
| Intel Core i9-13900K | |
| Unigine Heaven 4.0 | |
| Extreme Preset DX11 | |
| AMD Ryzen 9 7950X3D | |
| AMD Ryzen 9 7950X | |
| Intel Core i9-14900K | |
| Intel Core i5-14600K | |
| Intel Core i9-13900K | |
| AMD Ryzen 7 7800X3D | |
| Extreme Preset OpenGL | |
| Intel Core i9-14900K | |
| AMD Ryzen 9 7950X3D | |
| Intel Core i5-14600K | |
| AMD Ryzen 9 7950X | |
| Intel Core i9-13900K | |
| AMD Ryzen 7 7800X3D | |
| Unigine Valley 1.0 | |
| 1920x1080 Extreme HD DirectX AA:x8 | |
| Intel Core i9-14900K | |
| Intel Core i5-14600K | |
| Intel Core i9-13900K | |
| AMD Ryzen 9 7950X3D | |
| AMD Ryzen 9 7950X | |
| AMD Ryzen 7 7800X3D | |
| 1920x1080 Extreme HD Preset OpenGL AA:x8 | |
| Intel Core i9-14900K | |
| Intel Core i9-13900K | |
| Intel Core i5-14600K | |
| AMD Ryzen 9 7950X3D | |
| AMD Ryzen 9 7950X | |
| AMD Ryzen 7 7800X3D | |
| Intel Core i9-14900K, NVIDIA GeForce RTX 4090 GeForce RTX 4090, i9-14900K, WDC PC SN720 SDAQNTW-512G | Intel Core i5-14600K, NVIDIA GeForce RTX 4090 GeForce RTX 4090, i5-14600K, WDC PC SN720 SDAQNTW-512G | Intel Core i9-13900K, NVIDIA GeForce RTX 4090 GeForce RTX 4090, i9-13900K | Intel Core i7-13700K, NVIDIA GeForce RTX 4090 GeForce RTX 4090, i7-13700K, Intel Optane 905P 480GB 2.5 | AMD Ryzen 9 7950X, NVIDIA GeForce RTX 4090 GeForce RTX 4090, R9 7950X, Corsair MP600 GS | AMD Ryzen 9 7950X3D, NVIDIA GeForce RTX 4090 GeForce RTX 4090, R9 7950X3D | AMD Ryzen 7 7800X3D, NVIDIA GeForce RTX 4090 GeForce RTX 4090, R7 7800X3D, Corsair MP600 | |
|---|---|---|---|---|---|---|---|
| SPECviewperf 12 | -2% | -14% | -4% | -15% | -7% | -7% | |
| 1900x1060 3ds Max (3dsmax-05) (fps) | 565 | 563 0% | 543 -4% | 543 -4% | 571 1% | 560 -1% | 564 0% |
| 1900x1060 Catia (catia-04) (fps) | 291 | 277 -5% | 263 -10% | 273 -6% | 257 -12% | 274 -6% | 263 -10% |
| 1900x1060 Creo (creo-01) (fps) | 127 | 122 -4% | 123 -3% | 124 -2% | 115 -9% | 118 -7% | 114 -10% |
| 1900x1060 Energy (energy-01) (fps) | 84.7 | 84.5 0% | 56.7 -33% | 83.8 -1% | 54.7 -35% | 80.1 -5% | 83.1 -2% |
| 1900x1060 Maya (maya-04) (fps) | 340 | 314 -8% | 290 -15% | 304 -11% | 317 -7% | 329 -3% | 306 -10% |
| 1900x1060 Medical (medical-01) (fps) | 303 | 299 -1% | 131 -57% | 284 -6% | 119 -61% | 212 -30% | 238 -21% |
| 1900x1060 Showcase (showcase-01) (fps) | 398 | 440 11% | 432 9% | 434 9% | 457 15% | 427 7% | 442 11% |
| 1900x1060 Siemens NX (snx-02) (fps) | 31.4 | 30 -4% | 28.7 -9% | 28.3 -10% | 27.1 -14% | 27.4 -13% | 28.8 -8% |
| 1900x1060 Solidworks (sw-03) (fps) | 139 | 133 -4% | 132 -5% | 132 -5% | 126 -9% | 130 -6% | 127 -9% |
| SPECviewperf 13 | -2% | -4% | -3% | -5% | -2% | -4% | |
| 3ds Max (3dsmax-06) (fps) | 567 | 563 -1% | 542 -4% | 529 -7% | 563 -1% | 573 1% | 575 1% |
| Catia (catia-05) (fps) | 428 | 406 -5% | 398 -7% | 408 -5% | 402 -6% | 427 0% | 412 -4% |
| Creo (creo-02) (fps) | 618 | 584 -6% | 570 -8% | 599 -3% | 552 -11% | 577 -7% | 562 -9% |
| Energy (energy-02) (fps) | 127 | 127 0% | 126 -1% | 127 0% | 126 -1% | 127 0% | 127 0% |
| Maya (maya-05) (fps) | 881 | 829 -6% | 736 -16% | 807 -8% | 715 -19% | 748 -15% | 679 -23% |
| Medical (medical-02) (fps) | 180 | 179 -1% | 190 6% | 190 6% | 186 3% | 189 5% | 186 3% |
| Showcase (showcase-02) (fps) | 400 | 440 10% | 436 9% | 430 8% | 455 14% | 456 14% | 438 10% |
| Siemens NX (snx-03) (fps) | 56.3 | 53.8 -4% | 51.9 -8% | 51.4 -9% | 49.1 -13% | 49.3 -12% | 51.6 -8% |
| Solidworks (sw-04) (fps) | 199 | 189 -5% | 189 -5% | 188 -6% | 186 -7% | 191 -4% | 182 -9% |
| SPECviewperf 2020 | -2% | -7% | -2% | -9% | -7% | -8% | |
| 3840x2160 Siemens NX (snx-04) (fps) | 47.2 | 46.3 -2% | 44.7 -5% | 43.4 -8% | 41.3 -13% | 42.5 -10% | 44.3 -6% |
| 3840x2160 Medical (medical-03) (fps) | 40.3 | 40.2 0% | 42 4% | 43.7 8% | 45.9 14% | 46.2 15% | 46.2 15% |
| 3840x2160 Energy (energy-03) (fps) | 230 | 229 0% | 141 -39% | 228 -1% | 141 -39% | 140 -39% | 140 -39% |
| 3840x2160 Creo (creo-03) (fps) | 148 | 139 -6% | 146 -1% | 139 -6% | 133 -10% | 140 -5% | 129 -13% |
| 3840x2160 CATIA (catia-06) (fps) | 97.1 | 94.3 -3% | 99.8 3% | 97.9 1% | 95.3 -2% | 95.9 -1% | 93.3 -4% |
| 3840x2160 3ds Max (3dsmax-07) (fps) | 236 | 235 0% | 231 -2% | 229 -3% | 228 -3% | 236 0% | 237 0% |
| Total Average (Program / Settings) | -2% /
-2% | -8% /
-8% | -3% /
-3% | -10% /
-9% | -5% /
-5% | -6% /
-6% |
Gaming Benchmarks
In earlier years, the performance throne was always occupied by Intel's processors when it came to gaming benchmarks. But with the introduction of the AM5 platform and 7000 series Ryzen CPUs, which are now also equipped with 3D V cache, the tables have turned. With its Core i9-14900K, Intel closes the gap a little to AMD, but it was still only sufficient for third place in our comparison. In terms of pure gaming performance, you are currently optimally equipped with the Ryzen 7 7800X3D. The new flagship from Intel came a small distance of about 10 percentage points behind. On the other hand, the Intel Core i9-14900K won the duel against the AMD Ryzen 9 7950X.
With the Intel Core i5-14600K, you currently also get a very powerful CPU that is able to surpass the Intel Core i7-13700K.
All the systems listed in this comparison were tested with the same graphics card. The card used here is a Pait GeForce RTX 4090 Gamerock OC.
| Performance rating - Percent | |
| AMD Ryzen 7 7800X3D | |
| AMD Ryzen 9 7950X3D | |
| Intel Core i9-14900K | |
| AMD Ryzen 9 7950X | |
| Intel Core i9-13900K | |
| AMD Ryzen 5 7600X | |
| Intel Core i5-14600K | |
| Intel Core i7-13700K | |
| Intel Core i7-13700 | |
| Intel Core i7-12700 | |
| Intel Core i5-13400 | |
| Intel Core i5-12400F | |
| F1 22 | |
| 1920x1080 Low Preset AA:T AF:16x | |
| AMD Ryzen 7 7800X3D | |
| AMD Ryzen 9 7950X3D | |
| Intel Core i9-14900K | |
| AMD Ryzen 9 7950X | |
| AMD Ryzen 5 7600X | |
| Intel Core i9-13900K | |
| Intel Core i7-13700K | |
| Intel Core i5-14600K | |
| Intel Core i7-13700 | |
| Intel Core i7-12700 | |
| Intel Core i5-12400F | |
| Intel Core i5-13400 | |
| 1920x1080 Ultra High Preset AA:T AF:16x | |
| AMD Ryzen 7 7800X3D | |
| Intel Core i9-14900K | |
| Intel Core i5-14600K | |
| AMD Ryzen 5 7600X | |
| AMD Ryzen 9 7950X3D | |
| AMD Ryzen 9 7950X | |
| Intel Core i9-13900K | |
| Intel Core i7-13700K | |
| Intel Core i7-13700 | |
| Intel Core i7-12700 | |
| Intel Core i5-12400F | |
| Intel Core i5-13400 | |
| Far Cry 5 | |
| 1920x1080 Ultra Preset AA:T | |
| AMD Ryzen 7 7800X3D | |
| AMD Ryzen 9 7950X3D | |
| Intel Core i9-14900K | |
| Intel Core i9-13900K | |
| Intel Core i5-14600K | |
| AMD Ryzen 9 7950X | |
| AMD Ryzen 5 7600X | |
| Intel Core i7-13700 | |
| Intel Core i7-13700K | |
| Intel Core i7-12700 | |
| Intel Core i5-13400 | |
| Intel Core i5-12400F | |
| 1280x720 Low Preset AA:T | |
| AMD Ryzen 7 7800X3D | |
| AMD Ryzen 9 7950X3D | |
| Intel Core i9-14900K | |
| Intel Core i9-13900K | |
| Intel Core i5-14600K | |
| Intel Core i7-13700K | |
| AMD Ryzen 5 7600X | |
| AMD Ryzen 9 7950X | |
| Intel Core i7-13700 | |
| Intel Core i7-12700 | |
| Intel Core i5-13400 | |
| Intel Core i5-12400F | |
| X-Plane 11.11 | |
| 1920x1080 high (fps_test=3) | |
| AMD Ryzen 7 7800X3D | |
| AMD Ryzen 9 7950X3D | |
| Intel Core i9-14900K | |
| Intel Core i9-13900K | |
| AMD Ryzen 9 7950X | |
| AMD Ryzen 5 7600X | |
| Intel Core i5-14600K | |
| Intel Core i7-13700K | |
| Intel Core i7-13700 | |
| Intel Core i7-12700 | |
| Intel Core i5-13400 | |
| Intel Core i5-12400F | |
| 1280x720 low (fps_test=1) | |
| Intel Core i9-13900K | |
| Intel Core i9-14900K | |
| Intel Core i5-14600K | |
| AMD Ryzen 9 7950X3D | |
| Intel Core i7-13700K | |
| AMD Ryzen 9 7950X | |
| AMD Ryzen 7 7800X3D | |
| Intel Core i7-13700 | |
| AMD Ryzen 5 7600X | |
| Intel Core i7-12700 | |
| Intel Core i5-13400 | |
| Intel Core i5-12400F | |
| Final Fantasy XV Benchmark | |
| 1920x1080 High Quality | |
| Intel Core i9-14900K | |
| AMD Ryzen 9 7950X | |
| AMD Ryzen 7 7800X3D | |
| Intel Core i5-14600K | |
| Intel Core i9-13900K | |
| AMD Ryzen 9 7950X3D | |
| Intel Core i7-13700K | |
| AMD Ryzen 5 7600X | |
| Intel Core i7-13700 | |
| Intel Core i7-12700 | |
| Intel Core i5-13400 | |
| Intel Core i5-12400F | |
| 1280x720 Lite Quality | |
| Intel Core i9-13900K | |
| AMD Ryzen 9 7950X | |
| AMD Ryzen 5 7600X | |
| Intel Core i7-13700 | |
| Intel Core i7-13700K | |
| AMD Ryzen 7 7800X3D | |
| Intel Core i5-14600K | |
| Intel Core i9-14900K | |
| AMD Ryzen 9 7950X3D | |
| Intel Core i7-12700 | |
| Intel Core i5-12400F | |
| Intel Core i5-13400 | |
| Dota 2 Reborn | |
| 1920x1080 ultra (3/3) best looking | |
| AMD Ryzen 7 7800X3D | |
| AMD Ryzen 9 7950X3D | |
| AMD Ryzen 9 7950X | |
| Intel Core i9-13900K | |
| Intel Core i9-14900K | |
| AMD Ryzen 5 7600X | |
| Intel Core i5-14600K | |
| Intel Core i7-13700K | |
| Intel Core i7-13700 | |
| Intel Core i7-12700 | |
| Intel Core i5-13400 | |
| Intel Core i5-12400F | |
| 1280x720 min (0/3) fastest | |
| AMD Ryzen 7 7800X3D | |
| AMD Ryzen 9 7950X3D | |
| AMD Ryzen 9 7950X | |
| Intel Core i9-14900K | |
| Intel Core i9-13900K | |
| AMD Ryzen 5 7600X | |
| Intel Core i5-14600K | |
| Intel Core i7-13700K | |
| Intel Core i7-13700 | |
| Intel Core i7-12700 | |
| Intel Core i5-12400F | |
| Intel Core i5-13400 | |
| The Witcher 3 | |
| 1920x1080 Ultra Graphics & Postprocessing (HBAO+) | |
| Intel Core i9-13900K | |
| AMD Ryzen 9 7950X | |
| Intel Core i5-14600K | |
| AMD Ryzen 7 7800X3D | |
| Intel Core i9-14900K | |
| AMD Ryzen 5 7600X | |
| Intel Core i7-13700K | |
| Intel Core i7-13700 | |
| AMD Ryzen 9 7950X3D | |
| Intel Core i7-12700 | |
| Intel Core i5-13400 | |
| Intel Core i5-12400F | |
| 1024x768 Low Graphics & Postprocessing | |
| AMD Ryzen 9 7950X3D | |
| AMD Ryzen 7 7800X3D | |
| Intel Core i9-14900K | |
| AMD Ryzen 9 7950X | |
| Intel Core i9-13900K | |
| AMD Ryzen 5 7600X | |
| Intel Core i7-13700K | |
| Intel Core i7-13700 | |
| Intel Core i5-14600K | |
| Intel Core i7-12700 | |
| Intel Core i5-13400 | |
| Intel Core i5-12400F | |
| GTA V | |
| 1920x1080 Highest AA:4xMSAA + FX AF:16x | |
| AMD Ryzen 7 7800X3D | |
| Intel Core i9-14900K | |
| Intel Core i9-13900K | |
| Intel Core i5-14600K | |
| AMD Ryzen 9 7950X | |
| AMD Ryzen 9 7950X3D | |
| Intel Core i7-13700K | |
| AMD Ryzen 5 7600X | |
| Intel Core i7-13700 | |
| Intel Core i7-12700 | |
| Intel Core i5-13400 | |
| Intel Core i5-12400F | |
| 1024x768 Lowest Settings possible | |
| AMD Ryzen 7 7800X3D | |
| AMD Ryzen 9 7950X | |
| AMD Ryzen 9 7950X3D | |
| AMD Ryzen 5 7600X | |
| Intel Core i9-14900K | |
| Intel Core i9-13900K | |
| Intel Core i7-13700 | |
| Intel Core i5-14600K | |
| Intel Core i7-13700K | |
| Intel Core i7-12700 | |
| Intel Core i5-13400 | |
| Intel Core i5-12400F | |
| Borderlands 3 | |
| 1280x720 Very Low Overall Quality (DX11) | |
| AMD Ryzen 7 7800X3D | |
| AMD Ryzen 9 7950X3D | |
| Intel Core i9-14900K | |
| Intel Core i9-13900K | |
| AMD Ryzen 9 7950X | |
| Intel Core i5-14600K | |
| AMD Ryzen 5 7600X | |
| Intel Core i7-13700 | |
| Intel Core i7-13700K | |
| Intel Core i7-12700 | |
| Intel Core i5-13400 | |
| Intel Core i5-12400F | |
| 1920x1080 Badass Overall Quality (DX11) | |
| AMD Ryzen 9 7950X3D | |
| AMD Ryzen 7 7800X3D | |
| Intel Core i9-14900K | |
| AMD Ryzen 9 7950X | |
| Intel Core i9-13900K | |
| Intel Core i5-14600K | |
| AMD Ryzen 5 7600X | |
| Intel Core i7-13700K | |
| Intel Core i7-13700 | |
| Intel Core i7-12700 | |
| Intel Core i5-13400 | |
| Intel Core i5-12400F | |
| Far Cry New Dawn | |
| 1280x720 Low Preset | |
| AMD Ryzen 7 7800X3D | |
| AMD Ryzen 9 7950X3D | |
| Intel Core i9-14900K | |
| Intel Core i9-13900K | |
| Intel Core i5-14600K | |
| Intel Core i7-13700 | |
| Intel Core i7-13700K | |
| AMD Ryzen 9 7950X | |
| AMD Ryzen 5 7600X | |
| Intel Core i7-12700 | |
| Intel Core i5-13400 | |
| Intel Core i5-12400F | |
| 1920x1080 Ultra Preset | |
| AMD Ryzen 7 7800X3D | |
| AMD Ryzen 9 7950X3D | |
| Intel Core i9-14900K | |
| Intel Core i9-13900K | |
| Intel Core i5-14600K | |
| AMD Ryzen 9 7950X | |
| Intel Core i7-13700K | |
| AMD Ryzen 5 7600X | |
| Intel Core i7-13700 | |
| Intel Core i7-12700 | |
| Intel Core i5-13400 | |
| Intel Core i5-12400F | |
| Shadow of the Tomb Raider | |
| 1280x720 Lowest Preset | |
| AMD Ryzen 7 7800X3D | |
| AMD Ryzen 9 7950X3D | |
| AMD Ryzen 9 7950X | |
| Intel Core i9-14900K | |
| AMD Ryzen 5 7600X | |
| Intel Core i9-13900K | |
| Intel Core i5-14600K | |
| Intel Core i7-13700 | |
| Intel Core i7-13700K | |
| Intel Core i7-12700 | |
| Intel Core i5-13400 | |
| Intel Core i5-12400F | |
| 1920x1080 Highest Preset AA:T | |
| AMD Ryzen 7 7800X3D | |
| AMD Ryzen 9 7950X3D | |
| Intel Core i9-14900K | |
| AMD Ryzen 9 7950X | |
| Intel Core i9-13900K | |
| AMD Ryzen 5 7600X | |
| Intel Core i5-14600K | |
| Intel Core i7-13700K | |
| Intel Core i7-13700 | |
| Intel Core i7-12700 | |
| Intel Core i5-13400 | |
| Intel Core i5-12400F | |
| Tiny Tina's Wonderlands | |
| 1920x1080 Low Preset (DX12) | |
| AMD Ryzen 7 7800X3D | |
| Intel Core i9-14900K | |
| AMD Ryzen 9 7950X3D | |
| Intel Core i5-14600K | |
| AMD Ryzen 9 7950X | |
| AMD Ryzen 5 7600X | |
| Intel Core i9-13900K | |
| Intel Core i7-13700 | |
| Intel Core i7-13700K | |
| Intel Core i7-12700 | |
| Intel Core i5-13400 | |
| Intel Core i5-12400F | |
| 1920x1080 Badass Preset (DX12) | |
| AMD Ryzen 7 7800X3D | |
| Intel Core i9-14900K | |
| AMD Ryzen 9 7950X3D | |
| Intel Core i5-14600K | |
| AMD Ryzen 9 7950X | |
| AMD Ryzen 5 7600X | |
| Intel Core i9-13900K | |
| Intel Core i7-13700 | |
| Intel Core i7-13700K | |
| Intel Core i7-12700 | |
| Intel Core i5-13400 | |
| Intel Core i5-12400F | |
| Strange Brigade | |
| 1280x720 lowest AF:1 | |
| AMD Ryzen 5 7600X | |
| Intel Core i9-14900K | |
| AMD Ryzen 7 7800X3D | |
| Intel Core i5-14600K | |
| AMD Ryzen 9 7950X | |
| Intel Core i9-13900K | |
| AMD Ryzen 9 7950X3D | |
| Intel Core i7-13700K | |
| Intel Core i7-13700 | |
| Intel Core i7-12700 | |
| Intel Core i5-12400F | |
| Intel Core i5-13400 | |
| 1920x1080 ultra AA:ultra AF:16 | |
| Intel Core i9-14900K | |
| AMD Ryzen 5 7600X | |
| AMD Ryzen 7 7800X3D | |
| AMD Ryzen 9 7950X | |
| Intel Core i9-13900K | |
| Intel Core i5-14600K | |
| AMD Ryzen 9 7950X3D | |
| Intel Core i7-13700K | |
| Intel Core i7-13700 | |
| Intel Core i7-12700 | |
| Intel Core i5-12400F | |
| Intel Core i5-13400 | |
| Metro Exodus | |
| 1280x720 Low Quality AF:4x | |
| AMD Ryzen 7 7800X3D | |
| Intel Core i9-14900K | |
| AMD Ryzen 5 7600X | |
| AMD Ryzen 9 7950X | |
| Intel Core i5-14600K | |
| AMD Ryzen 9 7950X3D | |
| Intel Core i7-13700 | |
| Intel Core i9-13900K | |
| Intel Core i7-13700K | |
| Intel Core i7-12700 | |
| Intel Core i5-12400F | |
| Intel Core i5-13400 | |
| 1920x1080 Ultra Quality AF:16x | |
| AMD Ryzen 7 7800X3D | |
| Intel Core i9-14900K | |
| Intel Core i5-14600K | |
| AMD Ryzen 9 7950X | |
| AMD Ryzen 5 7600X | |
| AMD Ryzen 9 7950X3D | |
| Intel Core i9-13900K | |
| Intel Core i7-13700 | |
| Intel Core i7-13700K | |
| Intel Core i7-12700 | |
| Intel Core i5-13400 | |
| Intel Core i5-12400F | |
| F1 2020 | |
| 1280x720 Ultra Low Preset | |
| AMD Ryzen 7 7800X3D | |
| Intel Core i9-14900K | |
| AMD Ryzen 9 7950X3D | |
| AMD Ryzen 9 7950X | |
| AMD Ryzen 5 7600X | |
| Intel Core i9-13900K | |
| Intel Core i7-13700K | |
| Intel Core i7-13700 | |
| Intel Core i5-14600K | |
| Intel Core i7-12700 | |
| Intel Core i5-12400F | |
| Intel Core i5-13400 | |
| 1920x1080 Ultra High Preset AA:T AF:16x | |
| AMD Ryzen 7 7800X3D | |
| AMD Ryzen 9 7950X3D | |
| Intel Core i9-14900K | |
| AMD Ryzen 5 7600X | |
| AMD Ryzen 9 7950X | |
| Intel Core i9-13900K | |
| Intel Core i5-14600K | |
| Intel Core i7-13700K | |
| Intel Core i7-13700 | |
| Intel Core i7-12700 | |
| Intel Core i5-12400F | |
| Intel Core i5-13400 | |
| F1 2021 | |
| 1280x720 Ultra Low Preset | |
| AMD Ryzen 7 7800X3D | |
| Intel Core i9-14900K | |
| AMD Ryzen 5 7600X | |
| AMD Ryzen 9 7950X3D | |
| AMD Ryzen 9 7950X | |
| Intel Core i9-13900K | |
| Intel Core i7-13700K | |
| Intel Core i7-13700 | |
| Intel Core i5-14600K | |
| Intel Core i7-12700 | |
| Intel Core i5-12400F | |
| Intel Core i5-13400 | |
| 1920x1080 Ultra High Preset + Raytracing AA:T AF:16x | |
| AMD Ryzen 7 7800X3D | |
| Intel Core i9-14900K | |
| Intel Core i5-14600K | |
| AMD Ryzen 5 7600X | |
| Intel Core i9-13900K | |
| AMD Ryzen 9 7950X | |
| AMD Ryzen 9 7950X3D | |
| Intel Core i7-13700K | |
| Intel Core i7-13700 | |
| Intel Core i7-12700 | |
| Intel Core i5-12400F | |
| Intel Core i5-13400 | |
Intel Core i9-14900K with Nvidia GeForce RTX 4090
| low | med. | high | ultra | QHD | 4K DLSS | 4K | |
|---|---|---|---|---|---|---|---|
| GTA V (2015) | 187.9 | 187.8 | 187.6 | 170.9 | 171.9 | 187.6 | |
| The Witcher 3 (2015) | 829 | 750 | 661 | 314 | 273 | 293 | |
| Dota 2 Reborn (2015) | 299.9 | 258.2 | 248.2 | 231.4 | 227.8 | ||
| Final Fantasy XV Benchmark (2018) | 235 | 233 | 234 | 229 | 161.9 | ||
| X-Plane 11.11 (2018) | 244 | 212 | 161 | 136.3 | |||
| Far Cry 5 (2018) | 280 | 246 | 234 | 217 | 216 | 187 | |
| Strange Brigade (2018) | 762 | 619 | 612 | 602 | 542 | 291 | |
| Shadow of the Tomb Raider (2018) | 332 | 326 | 318 | 313 | 293 | 189.7 | |
| Far Cry New Dawn (2019) | 235 | 202 | 194 | 175 | 174 | 161 | |
| Metro Exodus (2019) | 319 | 288 | 250 | 214 | 194.6 | 143.4 | |
| Borderlands 3 (2019) | 263 | 232 | 215 | 204 | 198.4 | 137.9 | |
| F1 2020 (2020) | 598 | 503 | 497 | 450 | 426 | 289 | |
| F1 2021 (2021) | 733 | 683 | 586 | 307 | 291 | 203 | |
| Far Cry 6 (2021) | 264 | 228 | 202 | 204 | 195.6 | 141.9 | |
| Forza Horizon 5 (2021) | 416 | 337 | 317 | 224 | 207 | 162 | |
| God of War (2022) | 283 | 283 | 274 | 215 | 183.3 | 134 | |
| GRID Legends (2022) | 290 | 257 | 238 | 230 | 225 | 191.2 | |
| Tiny Tina's Wonderlands (2022) | 502 | 427 | 359 | 305 | 234 | 131.7 | |
| F1 22 (2022) | 462 | 483 | 429 | 217 | 161.1 | 83.4 | |
| The Quarry (2022) | 432 | 343 | 297 | 261 | 198.7 | 81.8 | |
| The Witcher 3 v4 (2023) | 378 | 325 | 289 | 270 | 266 | 170.7 | |
| F1 23 (2023) | 454 | 472 | 453 | 213 | 155.5 | 134.4 | 80.1 |
| Cyberpunk 2077 (2023) | 198.8 | 199.9 | 188.4 | 179.5 | 161.7 | 78.9 | |
| F1 24 (2024) | 377 | 408 | 389 | 217 | 177.5 | 93.9 | |
| F1 25 (2025) | 299 | 290 | 277 | 95.9 | 60.4 | 29.4 |
Intel Core i5-14600K with Nvidia GeForce RTX 4090
| low | med. | high | ultra | QHD | 4K DLSS | 4K | |
|---|---|---|---|---|---|---|---|
| GTA V (2015) | 187.7 | 187.6 | 186.9 | 162.3 | 163.5 | 187.4 | |
| The Witcher 3 (2015) | 632 | 585 | 550 | 316 | 275 | 288 | |
| Dota 2 Reborn (2015) | 261.5 | 239.2 | 229.9 | 217 | 211.5 | ||
| Final Fantasy XV Benchmark (2018) | 236 | 237 | 233 | 226 | 161.5 | ||
| X-Plane 11.11 (2018) | 228 | 196.9 | 147.8 | 124.6 | |||
| Far Cry 5 (2018) | 255 | 219 | 211 | 196 | 195 | 181 | |
| Strange Brigade (2018) | 717 | 542 | 548 | 546 | 514 | 289 | |
| Shadow of the Tomb Raider (2018) | 281 | 272 | 279 | 272 | 266 | 188.8 | |
| Far Cry New Dawn (2019) | 216 | 189 | 180 | 163 | 162 | 153 | |
| Metro Exodus (2019) | 296 | 271 | 238 | 202 | 188.8 | 142.1 | |
| Borderlands 3 (2019) | 237 | 209 | 192.9 | 182 | 179.3 | 136.1 | |
| F1 2020 (2020) | 403 | 402 | 406 | 373 | 368 | 288 | |
| F1 2021 (2021) | 562 | 541 | 468 | 278 | 268 | 201 | |
| Far Cry 6 (2021) | 230 | 199.8 | 178.3 | 182.4 | 175.5 | 139.4 | |
| Forza Horizon 5 (2021) | 364 | 300 | 292 | 214 | 199 | 162 | |
| God of War (2022) | 244 | 245 | 244 | 214 | 180 | 130.9 | |
| GRID Legends (2022) | 248 | 220 | 208 | 201 | 201 | 181.6 | |
| Tiny Tina's Wonderlands (2022) | 429 | 372 | 319 | 291 | 232 | 130.4 | |
| F1 22 (2022) | 379 | 390 | 380 | 210 | 160.3 | 83.5 | |
| The Quarry (2022) | 359 | 312 | 277 | 252 | 197.1 | 82.9 | |
| The Witcher 3 v4 (2023) | 317 | 285 | 313 | 226 | 225 | 169 | |
| F1 23 (2023) | 376 | 393 | 374 | 199.7 | 154.5 | 134 | 79.9 |
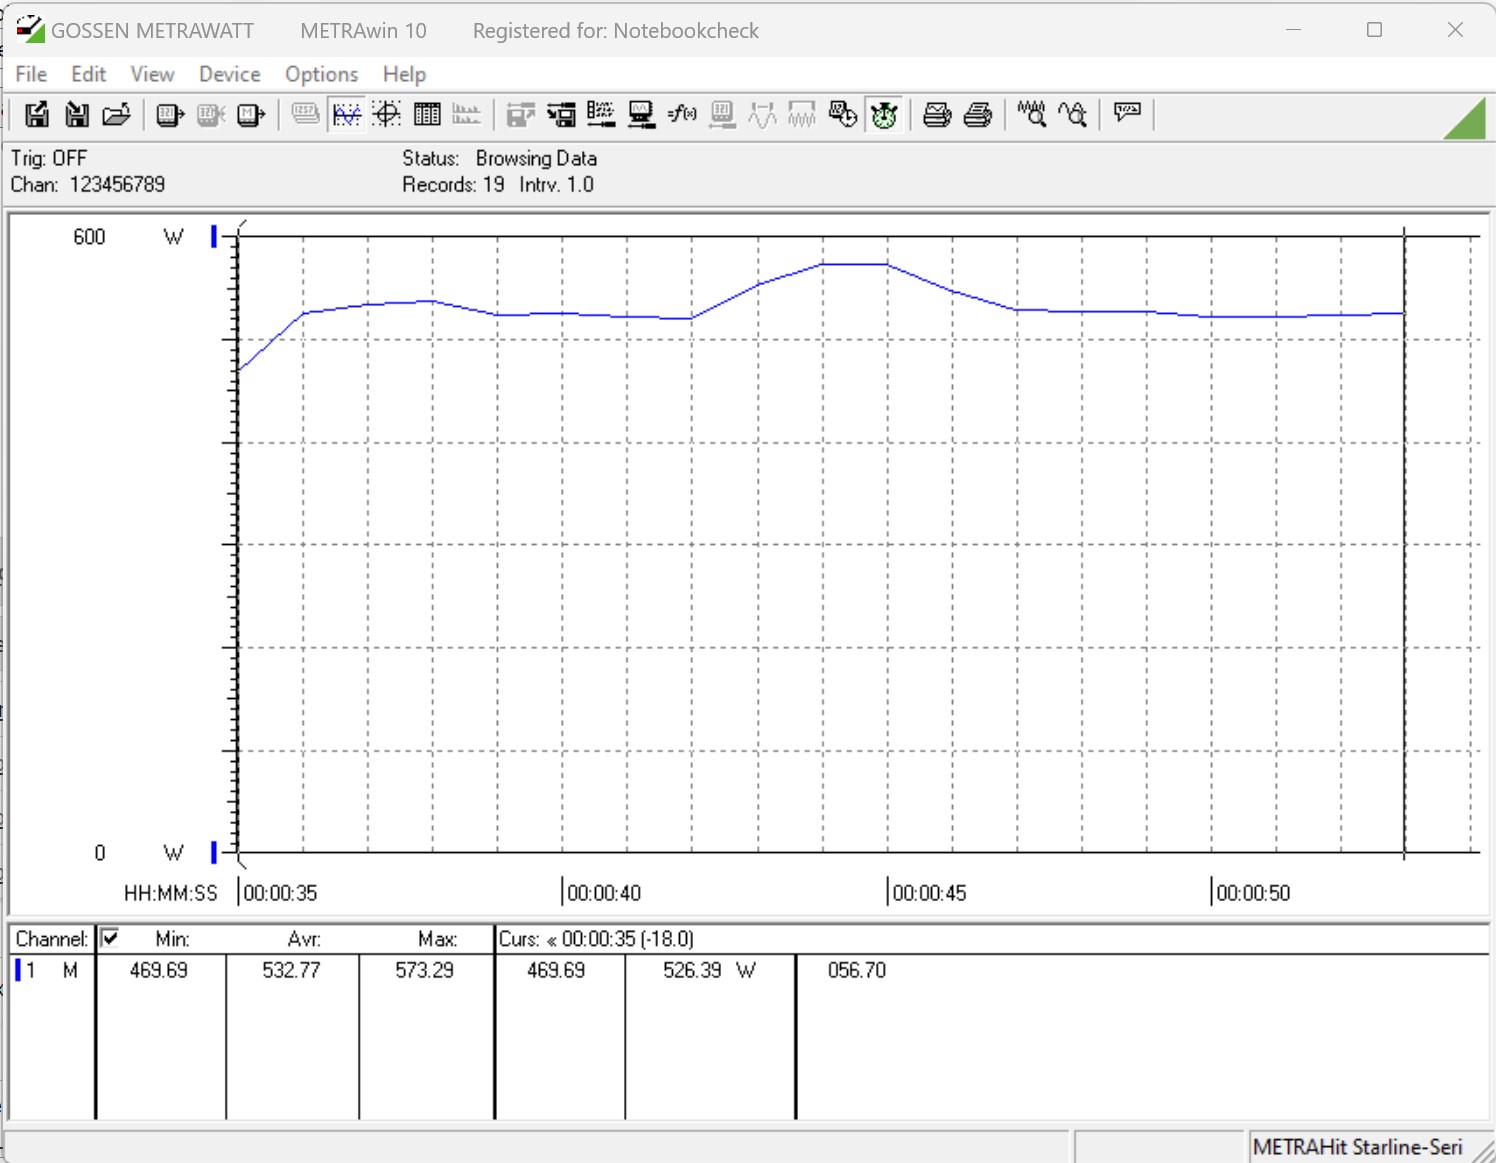
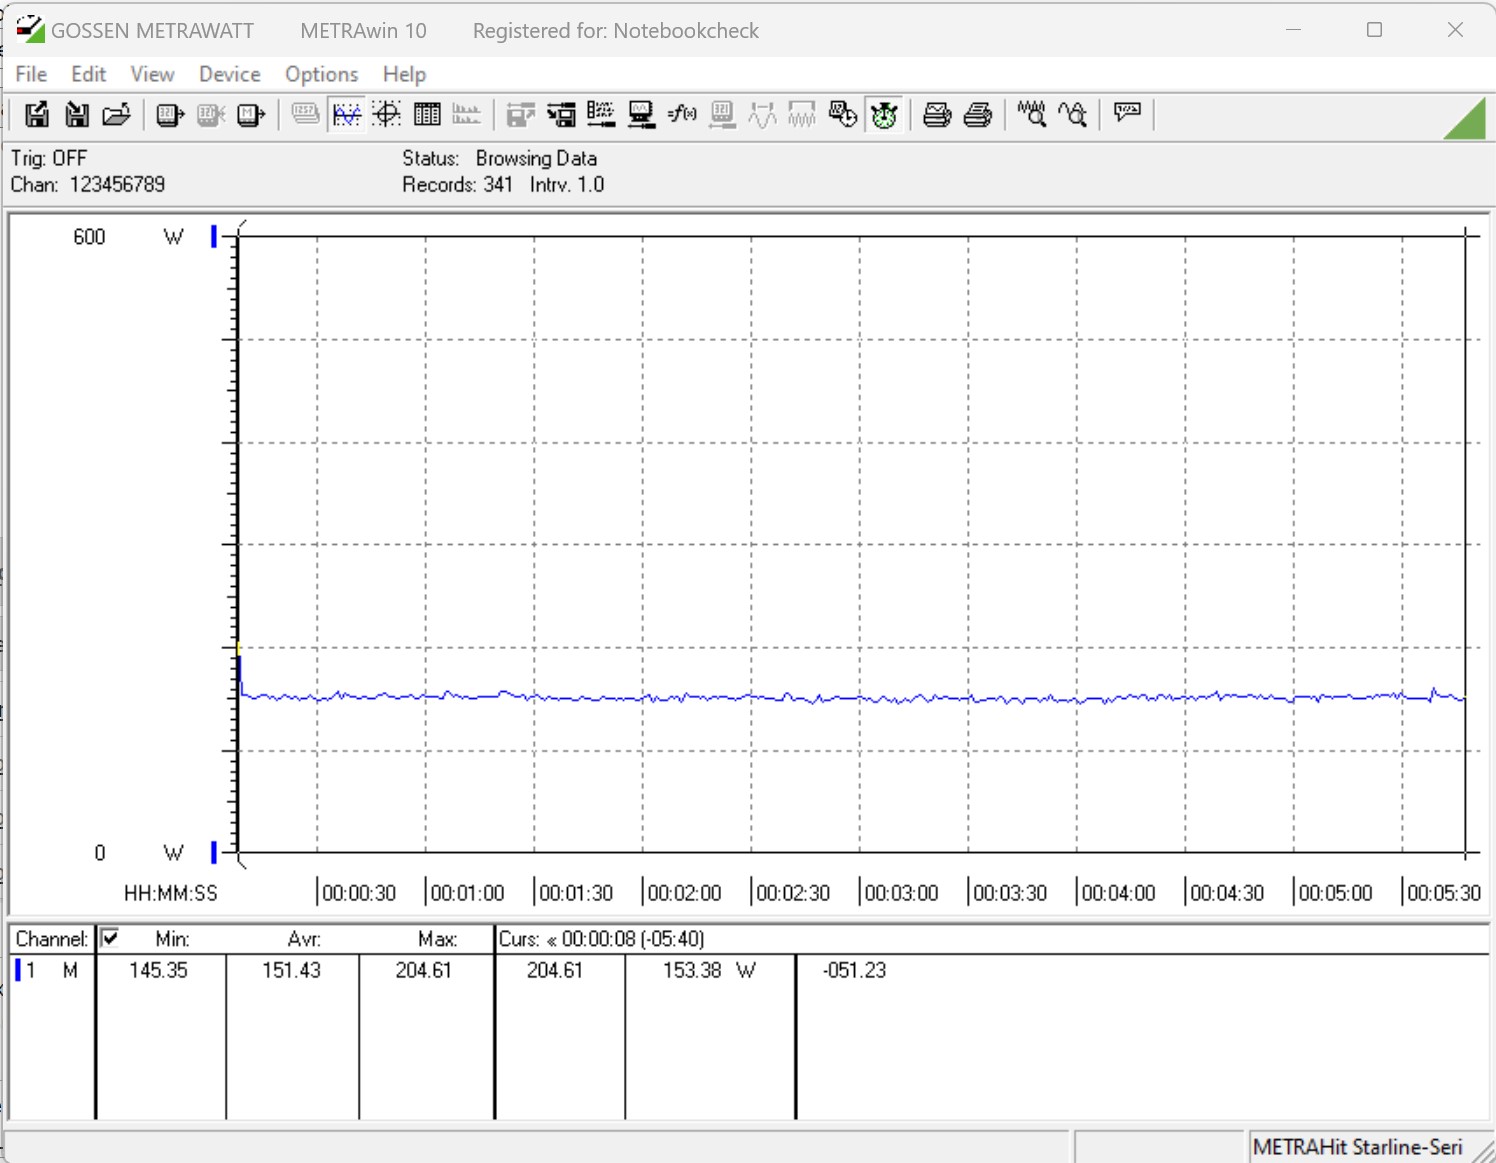
Power Consumption
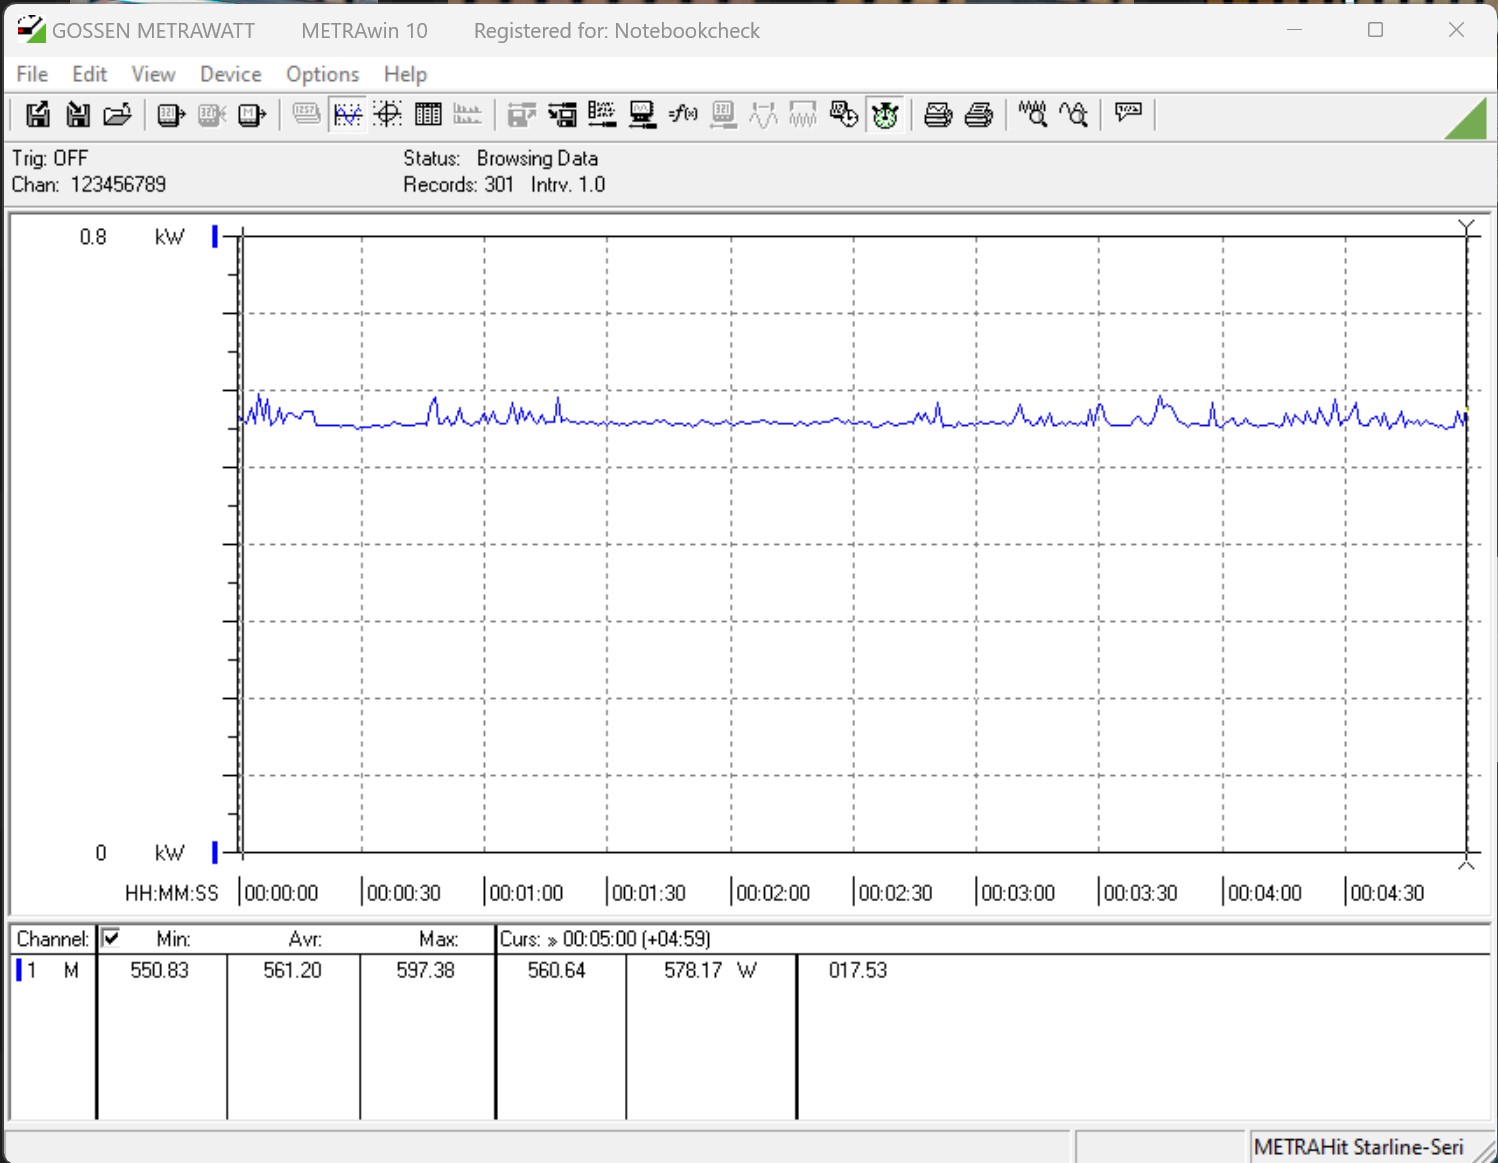
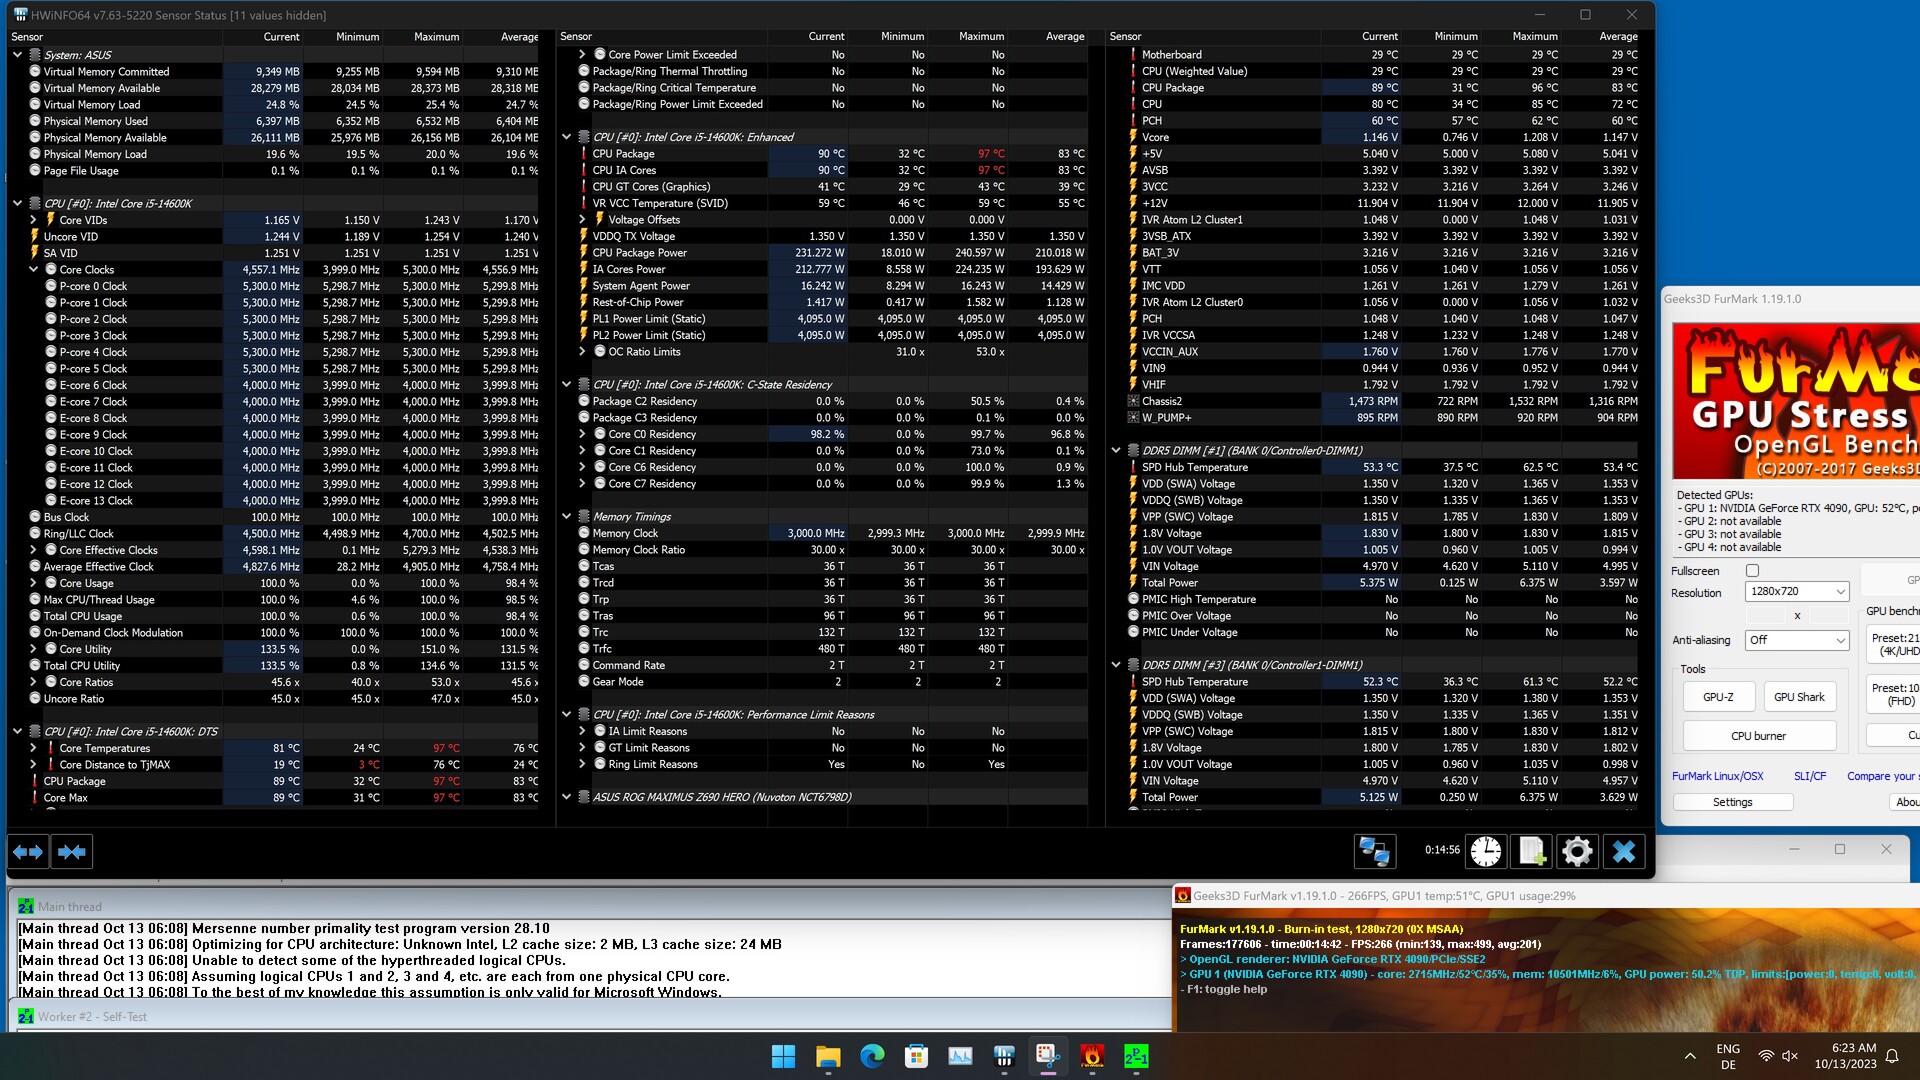
According to the technical data of the manufacturer, there are no changes in the specifications of the power consumption: While its PL1 limit remains at 125 watts, the Core i9-14900K's PL2 value is 253 watts. For the Intel Core i5-14600K, the manufacturer continues to specify 181 watts as the PL2 limit. As mentioned above, we ran all the tests with open power limits. This also means that only the temperature limit is able to throttle the CPU. So it is not surprising that we repeatedly reached the 100 °C (212 °F) mark during our stress test. We already saw this earlier in the Cinebench loop. In terms of power consumption, we noted a maximum CPU consumption of 360 watts for the Core i9-14900K and 240 watts for the Core i5-14600K. Due to the powerful water-cooling system, the power consumption increases drastically.
If we compare these values with the AMD systems, Intel still has a lot of catching up to do here. The equally power-hungry AMD Ryzen 9 7950X is still significantly more efficient resulting in a system consumption of 364 watts, and if we also take the X3D counterpart into account, the outlook becomes even darker for Intel.
It is therefore our recommendation to set the power limit to a maximum of 253 watts under constant load following the manufacturer's specifications. At the same time, you should still use a powerful AiO cooling solution with a 360-millimeter radiator. Those who are considering getting the Intel Core i5-14600K should be able to keep it under control fairly easily due to its lower power consumption. But if you also remove all the limits here, you should also use a 360-mm AiO cooling system.
Intel Core i9-14900K


Intel Core i5-14600K
| Power Consumption / Cinebench R15 Multi (external Monitor) | |
| Intel Core i9-14900K | |
| Intel Core i9-13900K | |
| AMD Ryzen 9 7950X (Idle: 95.2 W) | |
| Intel Core i7-13700K | |
| Intel Core i5-14600K | |
| Intel Core i5-13600K | |
| Intel Core i7-12700 | |
| AMD Ryzen 9 7950X3D | |
| AMD Ryzen 7 7800X3D | |
| Intel Core i5-13400 | |
| Intel Core i5-12400F | |
| Power Consumption / Prime95 V2810 Stress (external Monitor) | |
| Intel Core i9-14900K | |
| Intel Core i9-13900K | |
| Intel Core i5-14600K | |
| Intel Core i7-13700K | |
| Intel Core i5-13600K | |
| AMD Ryzen 9 7950X (Idle: 95.2 W) | |
| Intel Core i7-12700 | |
| AMD Ryzen 9 7950X3D | |
| Intel Core i5-12400F | |
| Intel Core i5-13400 | |
| AMD Ryzen 7 7800X3D | |
| Power Consumption / Cinebench R23 Multi (external Monitor) | |
| Intel Core i9-14900K | |
| AMD Ryzen 9 7950X (95.2) | |
| Intel Core i5-14600K | |
| AMD Ryzen 9 7950X3D | |
| AMD Ryzen 7 7800X3D | |
| Power Consumption / Cinebench R23 Single (external Monitor) | |
| AMD Ryzen 7 7800X3D | |
| AMD Ryzen 9 7950X (95.2) | |
| Intel Core i9-14900K | |
| Intel Core i5-14600K | |
* ... smaller is better
| Power Consumption / The Witcher 3 ultra (external Monitor) | |
| Intel Core i5-14600K | |
| Intel Core i9-14900K | |
| Intel Core i7-13700 | |
| Intel Core i7-13700K | |
| AMD Ryzen 9 7950X | |
| AMD Ryzen 9 7950X3D | |
| Intel Core i9-13900K | |
| Intel Core i7-12700 | |
| Intel Core i5-13400 | |
| AMD Ryzen 7 7800X3D | |
| Intel Core i5-12400F | |
* ... smaller is better
Power Consumption With External Monitor
Pros
Cons
Verdict - With higher performance comes higher power consumption
Intel's new rendition of the Raptor Lake series has slightly increased in performance again. However, the performance jumps compared to the 13th generation have turned out to be relatively small. Overall, with the Intel Core i9-14900K, you get a really fast processor that is able to score points in all areas. The new high-end model is able to master multi-thread tasks just as well as single-core tasks, and with 6 GHz in boost, games also benefit from this performance. On the other hand, we see its high power consumption as the largest disadvantage of this model. But its power consumption probably won't be constantly as high during everyday operation, and games in all likelihood also won't require the CPU's full performance. AMD clearly does a better job here, showing how things can be done with its X3D processors.
The new renditions of the Intel Raptor Lake processors are clearly good multi-talents. But the Intel Core i9-14900K definitely won't gain the crown in terms of efficiency.
With a higher clock speed and higher power consumption, Intel worked hard to get this position. At 253 watts, Intel fortunately didn't increase the power consumption limits any further. The smaller Intel Core i5-14600K still consumes 181 watts under full load. This additionally requires an optimal cooling system to be able to make use of the full performance. Together with that also come higher costs, and the 162 watts of the AMD Ryzen 9 7950X3D are significantly easier to control than the 253 watts of the Intel Core i9-14900K.
We applaud its compatibility to the 1700 socket mainboards that are already in use. But whether this was intentional or just born out of necessity, we don't know. In the past, Intel has changed the socket after two CPU generations. Only with the following CPU generation, Intel will start using the 1851 socket, introducing additional changes with Arrow Lake. So we can only hope that Intel will be inspired by AMD and will also use some sort of 3D cache and improve the efficiency significantly.
Transparency
The selection of devices to be reviewed is made by our editorial team. The test sample was given to the author by the manufacturer free of charge for the purposes of review. There was no third-party influence on this review, nor did the manufacturer receive a copy of this review before publication. There was no obligation to publish this review. As an independent media company, Notebookcheck is not subjected to the authority of manufacturers, retailers or publishers.
This is how Notebookcheck is testing
Every year, Notebookcheck independently reviews hundreds of laptops and smartphones using standardized procedures to ensure that all results are comparable. We have continuously developed our test methods for around 20 years and set industry standards in the process. In our test labs, high-quality measuring equipment is utilized by experienced technicians and editors. These tests involve a multi-stage validation process. Our complex rating system is based on hundreds of well-founded measurements and benchmarks, which maintains objectivity. Further information on our test methods can be found here.

