Intel Core Ultra 9 285K Arrow Lake-S Review: $589 CPU sacrifices gaming crown to match AMD Zen 5 Ryzen 9000 in power efficiency
Power-efficient but gaming deficient.
Intel's new Arrow Lake-S Core Ultra 9 285 introduces a new compute tile layout that sacrifices hyperthreading and aims to win over enthusiasts with significant efficiency improvements. While the Core Ultra 9 285K does indeed deliver on raw CPU performance and efficiency, it loses badly to Intel Raptor Lake-S Refresh and AMD Zen 5 Ryzen 9000 offerings in gaming.Vaidyanathan Subramaniam Published 🇩🇪 🇫🇷 ...
Verdict: Intel's efficiency play hits a gaming snag
Intel's desktop chips aren't exactly known for their efficiency, but the company hopes to rewrite the narrative with today's Arrow Lake-S launch.
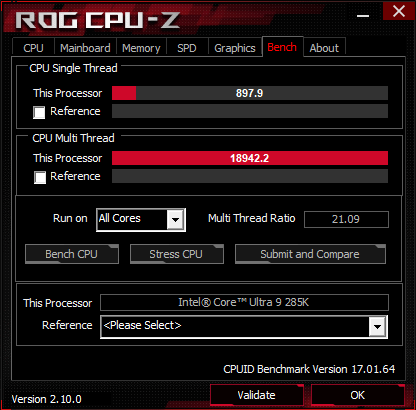
Intel's new Arrow Lake-S lineup, led by the Core Ultra 9 285K, marks a significant shift by removing hyperthreading across all models — a first since the Pentium 4 era. In cumulative CPU benchmarks, the Core Ultra 9 285K matches the Core i9-14900K and nearly reaches Ryzen 9 9950X performance levels.
That being said, we do see the Core Ultra 9 285K outshining both these CPUs in individual single and multi-core benchmarks.
What we liked in particular is Arrow Lake-S's ability to perform on par with or even slightly better than Raptor Lake-S Refresh while achieving power efficiency comparable to AMD's Zen 5 processors.
However, despite these advances, the Core Ultra 9 285K struggles in gaming performance, falling behind both the Core i9-14900K and Zen 5 CPUs across all tested resolutions.
The Core Ultra 9 285K is limited to competing only with the Core i7-14700K in gaming. This is surprising given Arrow Lake-S's built-in APO optimizations and the lack of hyperthreading, which should have theoretically helped the CPU achieve better gaming scores.
The new platform also requires additional investments in new 800 Series motherboards and DDR5 memory, and this is something that you should factor in before upgrading.
Pros
Cons
Price and availability
The Intel Core Ultra 9 285K will be available from today at retailers worldwide at an MSRP of $589. The now-discounted Core i9-14900K still remains viable if you prioritize both compute and gaming, despite slight performance penalties from newer BIOSs.
The AMD Ryzen 9 9950X (currently $709 on Amazon) and Ryzen 9 9900X ($429 on Amazon) continue to be excellent alternatives without any of the Core Ultra 9 285K's gaming hiccups.
Price comparison
Table of Contents
- Verdict: Intel's efficiency play hits a gaming snag
- The test bench: GeForce RTX 4090 is a great match for the Core Ultra 9 285K
- CPU performance: On par with Core i9-14900K overall with small gains over Ryzen 9 9950X
- System performance: In the same league as Core i9-14900K and AMD Zen 5
- 3D and gaming performance: Arrow Lake-S disappoints big time
- Power consumption: Intel finally gets power efficiency right
- Notebookcheck's overall impression of the Core Ultra 9 285K
Intel's flagship 13th and 14th gen desktop processors were in the news for all the wrong reasons not so long ago, but all that hopefully changes for the better today. After getting off to a good start with Lunar Lake for laptops, Intel is now turning its focus towards Arrow Lake-S for the desktop.
Arrow Lake-S, or the Core Ultra 200S Series as marketing would have it for some reason, marks a paradigm shift in Intel's desktop CPU strategy.
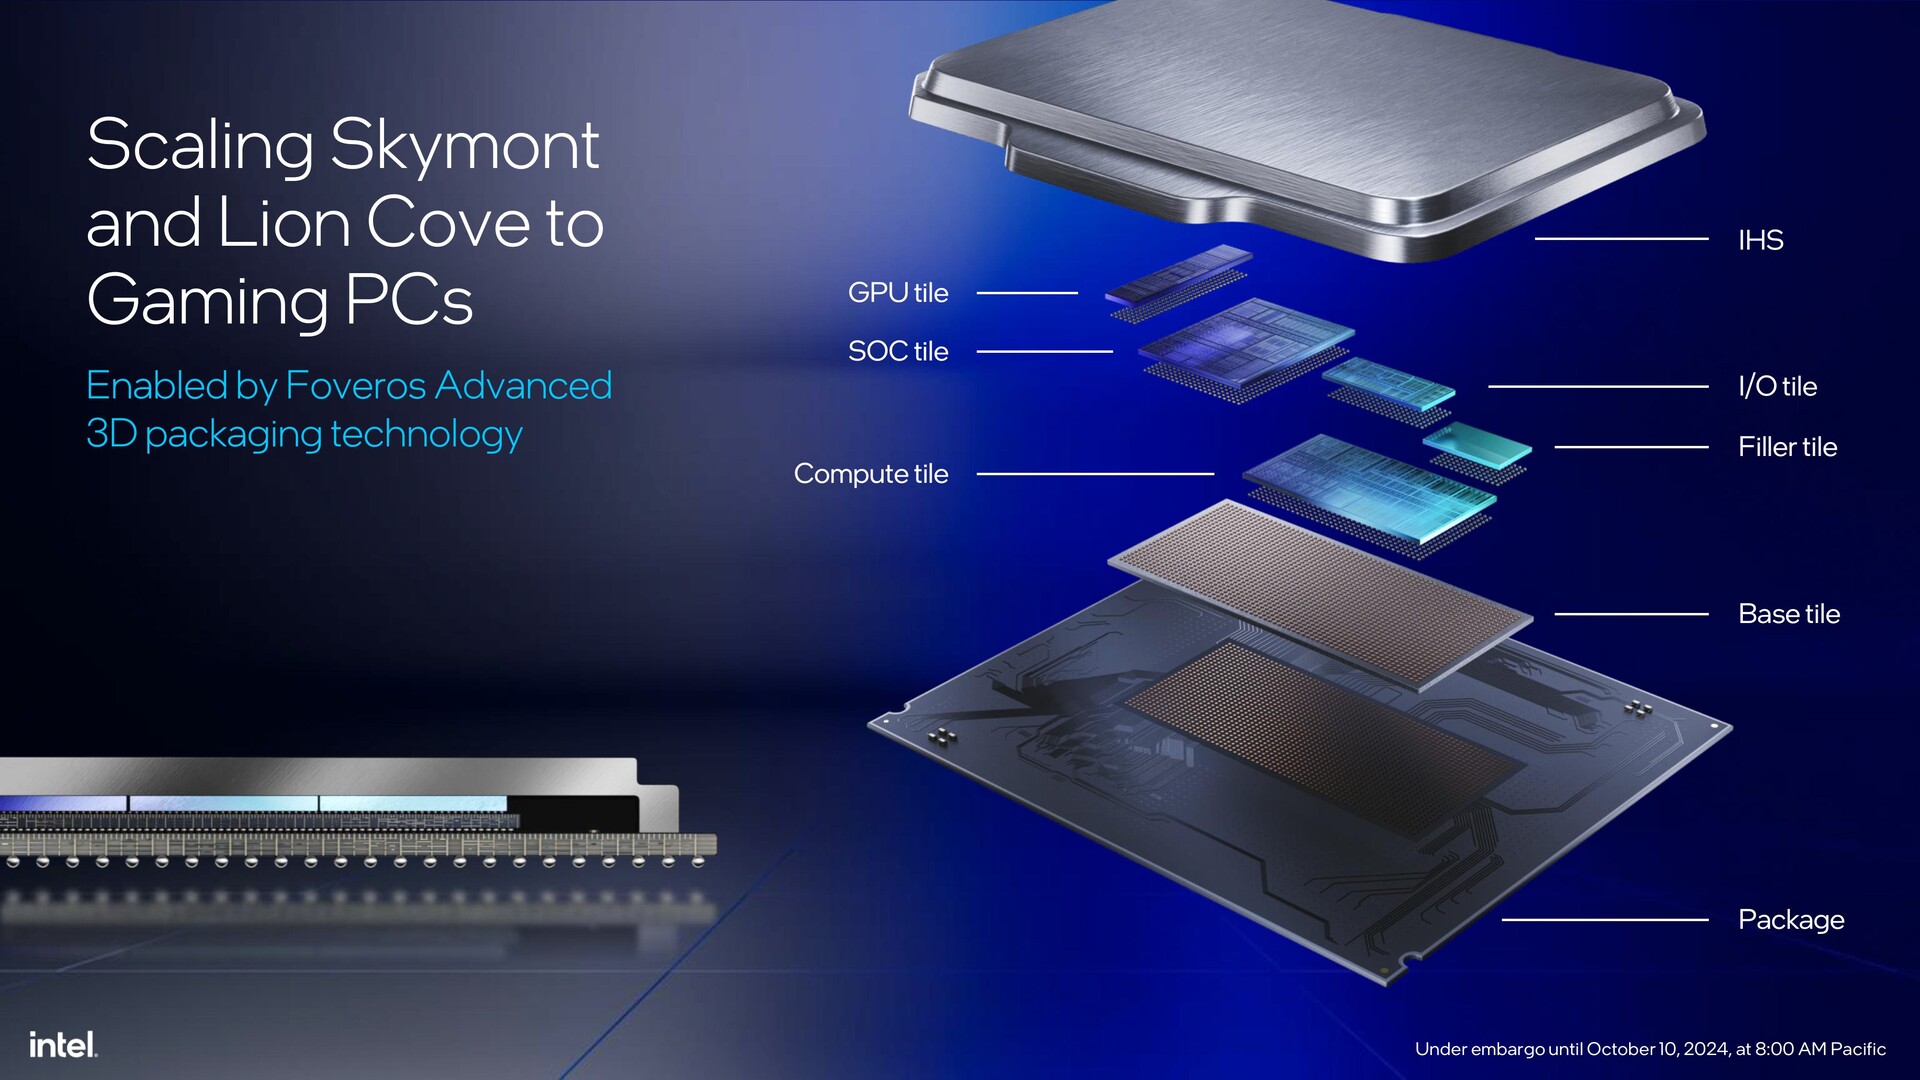
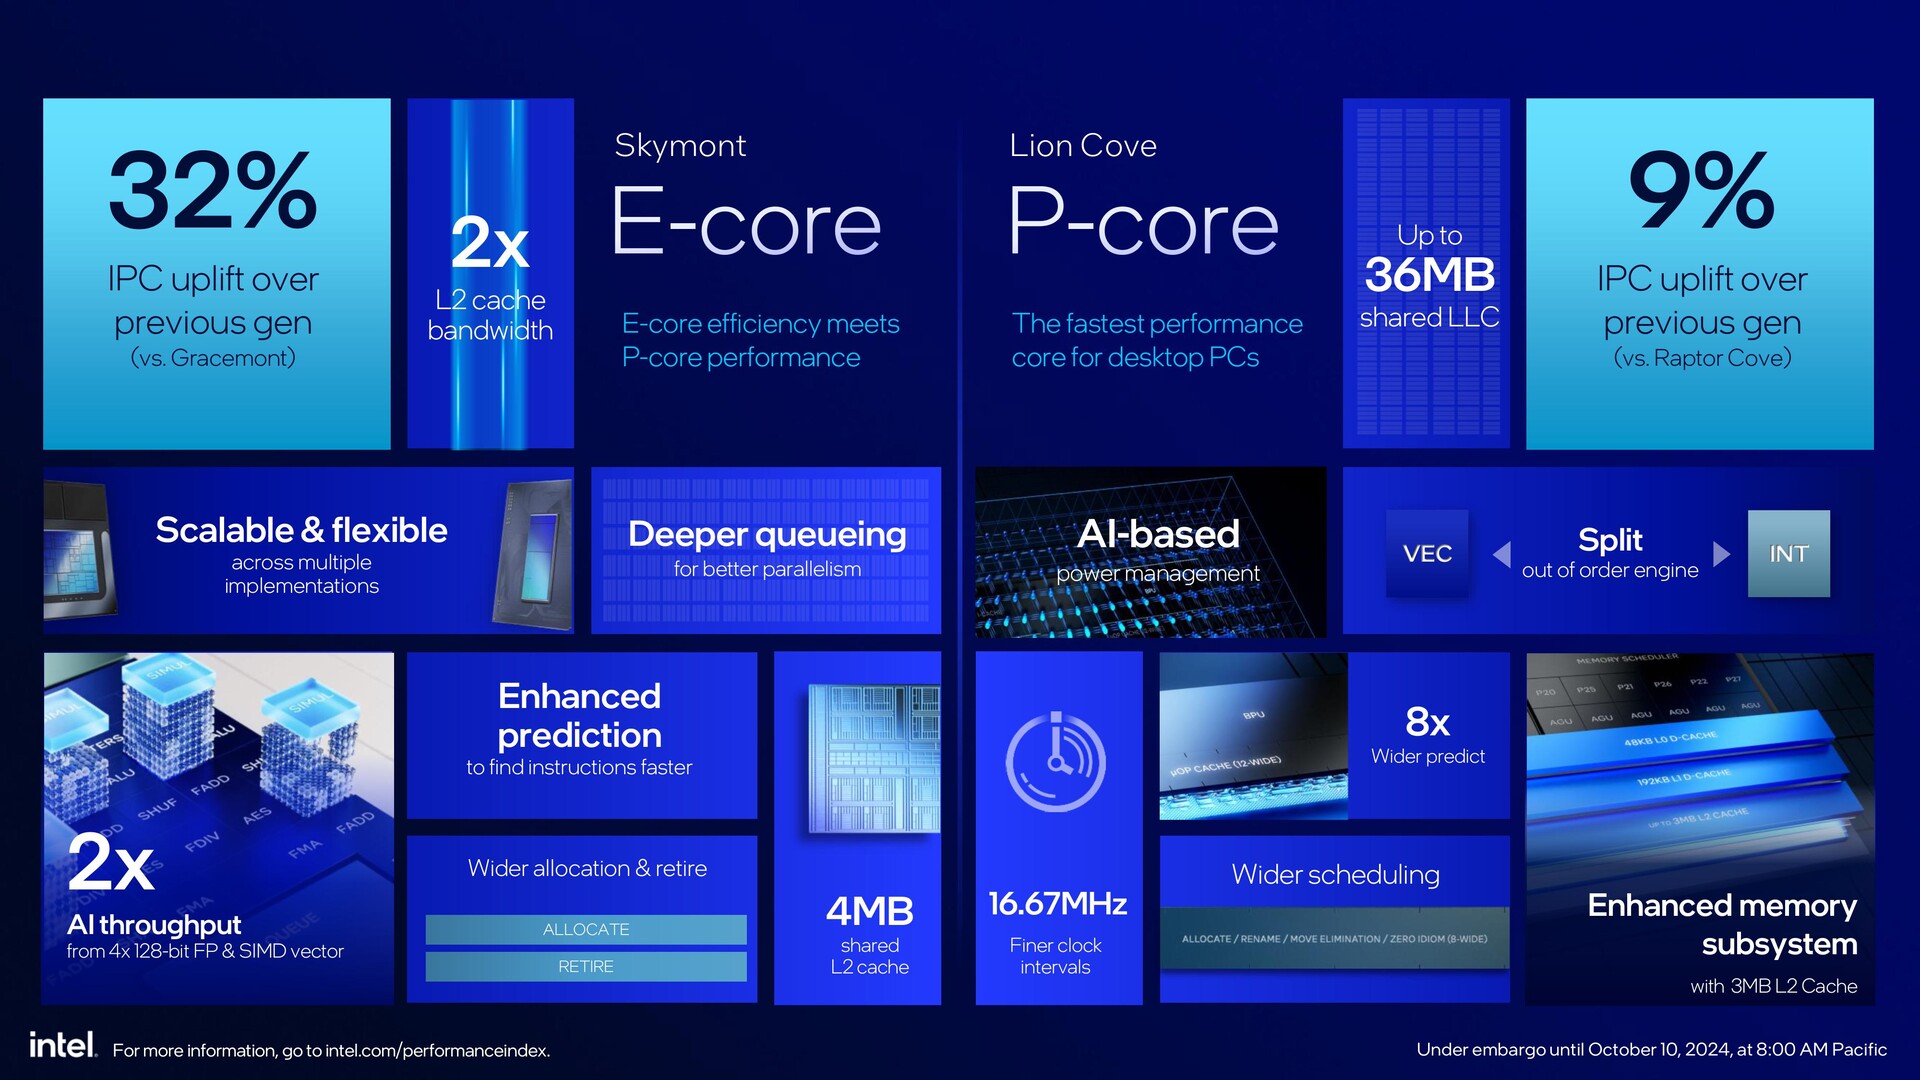
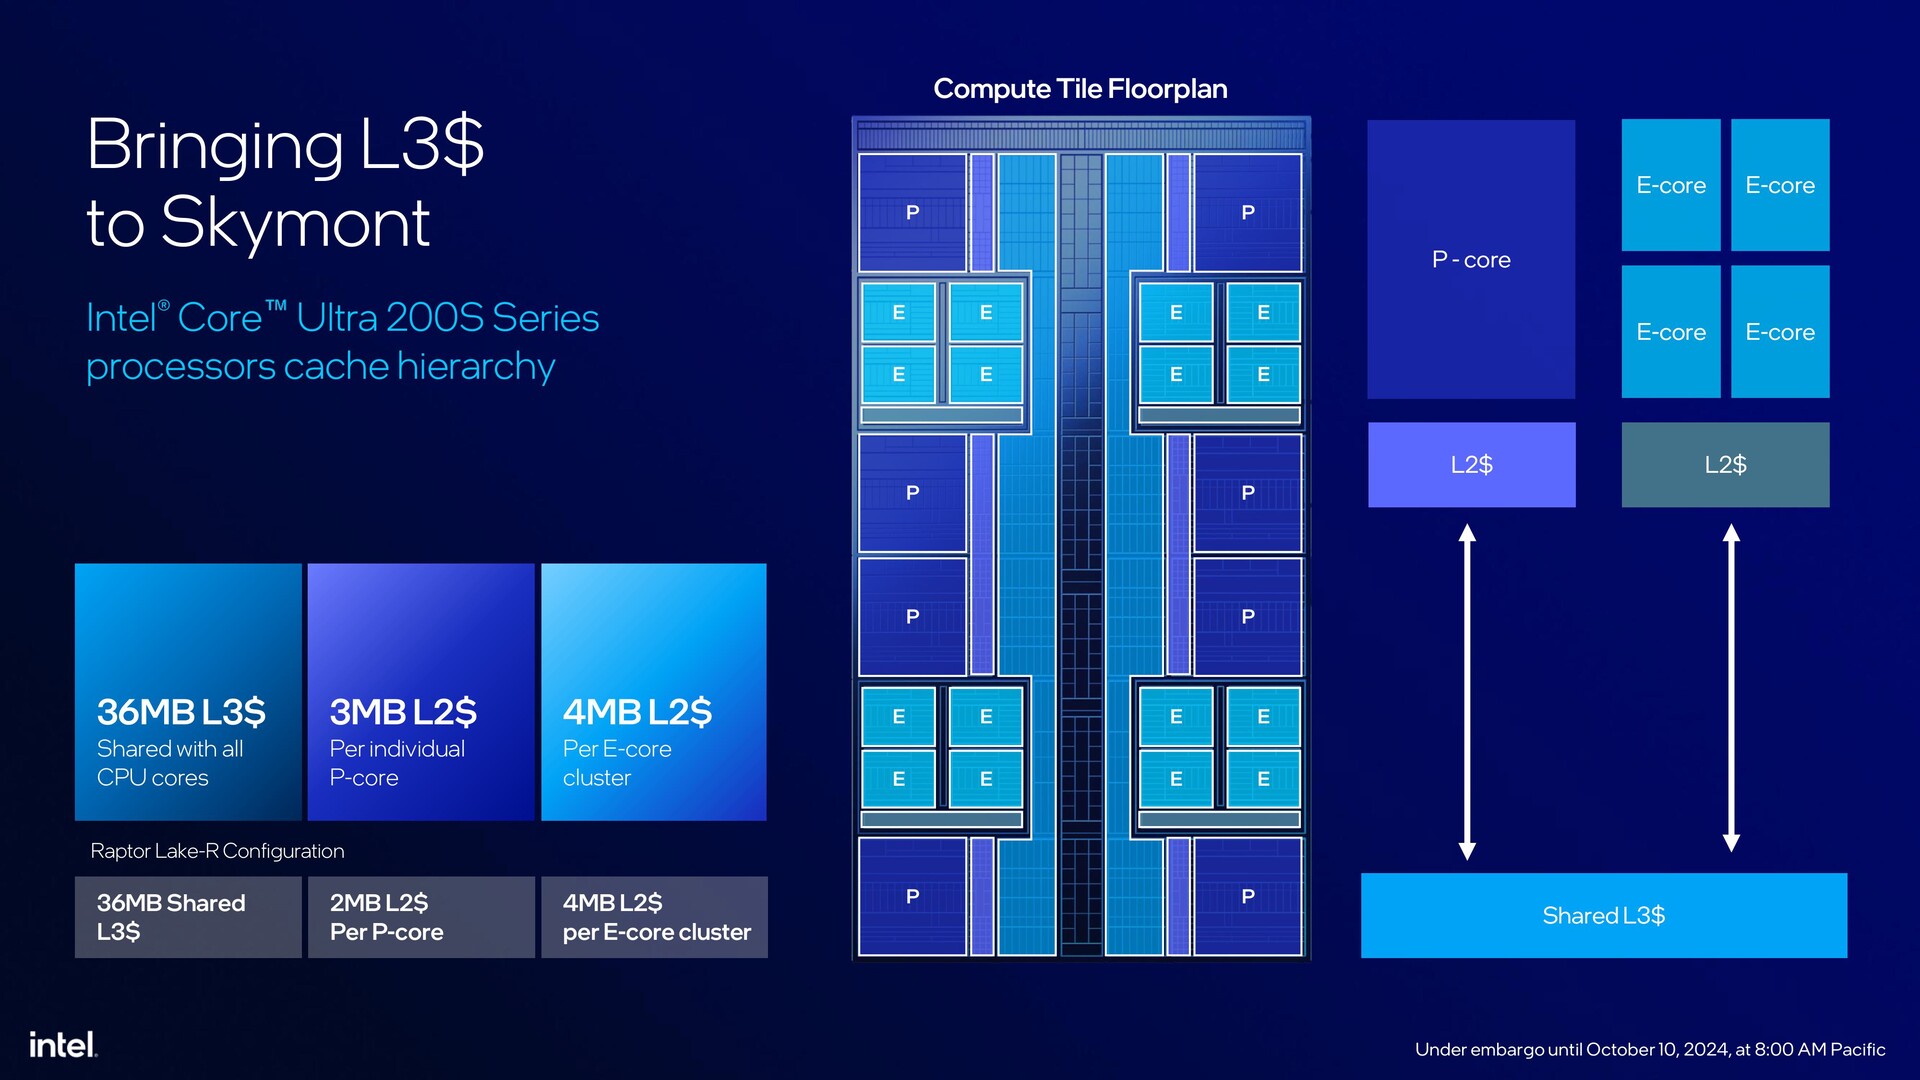
This generation sees Intel's Foveros 3D packaging coming to desktops for the first time, the use of TSMC's 3 nm production lines instead of Intel's, a new Compute tile with rearranged Lion Cove P-cores and Skymont E-cores sans hyperthreading, larger L2 cache on the P-cores, and the arrival of the Alchemist Xe iGPU and NPU — both of which are reused from Meteor Lake.
Arrow Lake-S's Foveros packaging includes a total of six tiles, four of which are based on TSMC nodes. These include Compute (N3B), Xe-LPG Alchemist iGPU (N5P), SoC (N6), I/O (N6), a filler tile for stability, and the Base tile (Intel 1227.1 22 nm FinFET).
Having all these components on-package inevitably necessitates new power requirements and therefore, a new socket. Arrow Lake-S processors require new 800 Series motherboards featuring the new LGA 1851 socket. Unfortunately, Intel is still mum on whether upcoming CPU generations will use this new pin layout.
Along with this also comes the need to fully transition over to DDR5 memory, as these CPUs lack the hybrid memory controller present in Raptor Lake-S and Alder Lake-S.
In this review, we take a look at the new Intel Core Ultra 9 285K and see whether Intel's decisions on desktop can provide enough challenge to AMD's latest Ryzen 9000 offerings and Intel's own 14th gen chips.
An overview of Intel Core Ultra 200S Series Arrow Lake-S desktop processors
| SKU | Cores / Threads | P-Core Clock / Turbo | E-Core Clock / Turbo | Turbo Boost Max 3.0 | Total L2 Cache | L3 Cache | Integrated Graphics | NPU Peak TOPS | PBP (PL1) | MTP (PL2) | MSRP |
|---|---|---|---|---|---|---|---|---|---|---|---|
| Intel Core Ultra 9 285K | 24 (8P + 16E) /24 | 3.7 GHz / 5.5 GHz | 3.2 GHz / 4.6 GHz | 5.6 GHz | 40 MB | 36 MB | 4 Xe Cores, 2.0 GHz | 13 TOPS | 125 W | 250 W | $589 |
| Intel Core Ultra 7 265K | 20 (8P + 12E) /20 | 3.9 GHz / 5.4 GHz | 3.3 GHz / 4.6 GHz | 5.6 GHz | 36 MB | 30 MB | 4 Xe Cores, 2.0 GHz | 13 TOPS | 125 W | 250 W | $394 |
| Intel Core Ultra 7 265KF | 20 (8P + 12E) /20 | 3.9 GHz / 5.4 GHz | 3.3 GHz / 4.6 GHz | 5.6 GHz | 36 MB | 30 MB | - | 13 TOPS | 125 W | 250 W | $379 |
| Intel Core Ultra 5 245K | 14 (6P + 8E) /14 | 3.9 GHz / 5.4 GHz | 4.2 GHz / 5.2 GHz | 5.2 GHz | 26 MB | 24 MB | 4 Xe Cores, 1.9 GHz | 13 TOPS | 125 W | 159 W | $309 |
| Intel Core Ultra 5 245KF | 14 (6P + 8E) /14 | 3.9 GHz / 5.4 GHz | 4.2 GHz / 5.2 GHz | 5.2 GHz | 26 MB | 24 MB | - | 13 TOPS | 125 W | 159 W | $294 |
The test bench: GeForce RTX 4090 is a great match for the Core Ultra 9 285K
We used the following components for testing the Core Ultra 9 285K:
- Cooler Master MasterFrame 700 open test bench
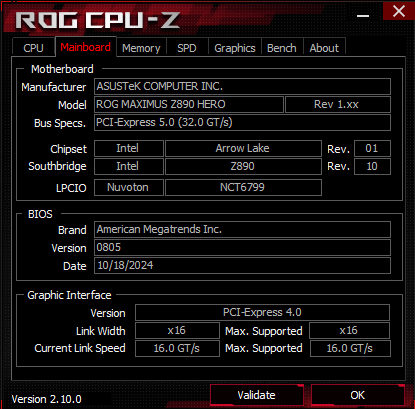
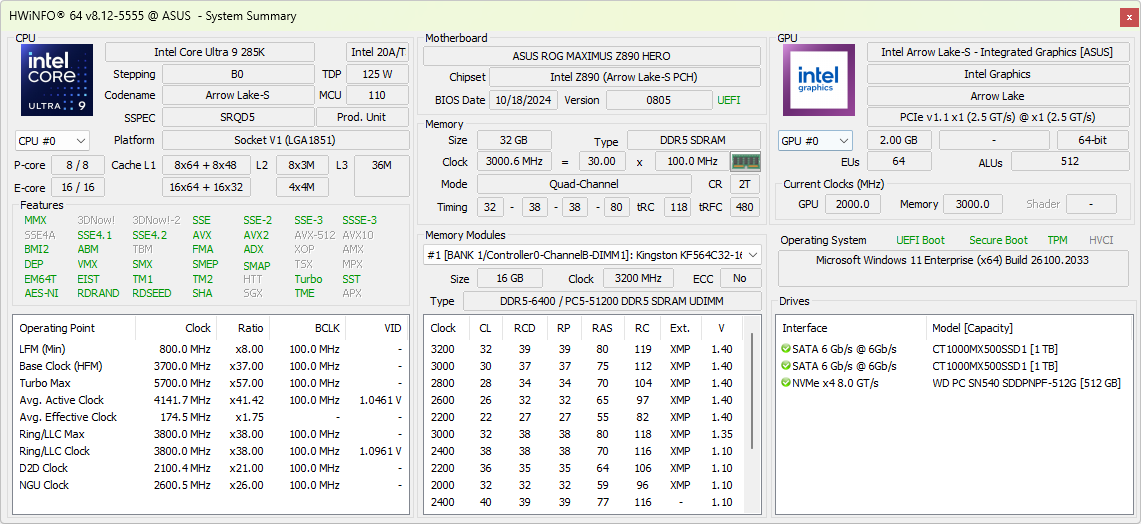
- Asus ROG Maximus Z890 Hero motherboard with BIOS version 0805
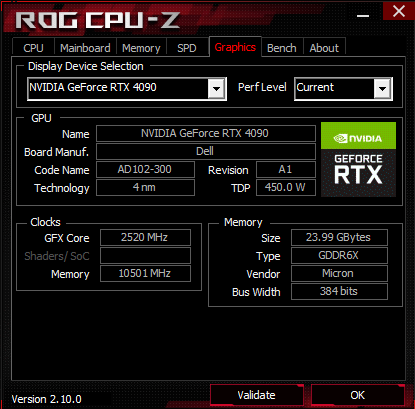
- Nvidia GeForce RTX 4090 Founders Edition GPU
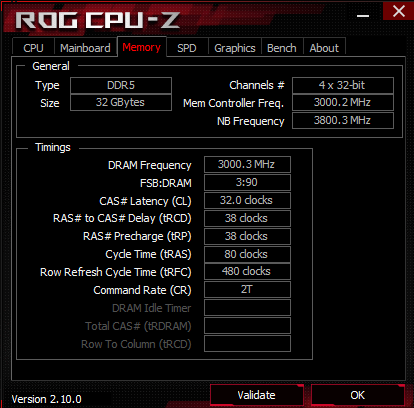
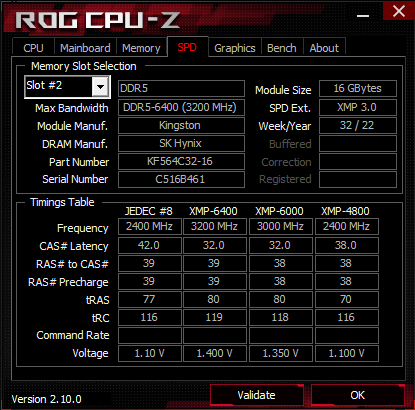
- 2x 16 GB Kingston Fury Beast DDR5-6400 RAM running at DDR5-6000 with timings 32-38-38-80 at 1.35 V
- Western Digital PC SN540 512 GB NVMe SSD and 2x Crucial MX500 1 TB SATA SSDs for OS, benchmarks, and games
- Alienware AW3225QF 4K 240 Hz QD-OLED monitor
- Thermaltake TH420 V2 Ultra EX ARGB AiO cooler
- Cooler Master MVE Gold V2 1250 ATX 3.0 fully modular PSU
We would like to thank Intel for providing the Core Ultra 9 285K test sample, Nvidia for the RTX 4090 Founders Edition GPU, Asus for the ROG Maximus Z890 Hero motherboard, Dell for the AW3225QF monitor, Kingston for the DDR5 memory kit, Thermaltake for the TH420 V2 Ultra EX AIO, and finally Cooler Master for the test bench and power supply.
All tests were performed on a fresh installation of Windows 11 24H2 (Build 26100.2033) together with the latest platform drivers and Nvidia Game Ready Driver 566.03.
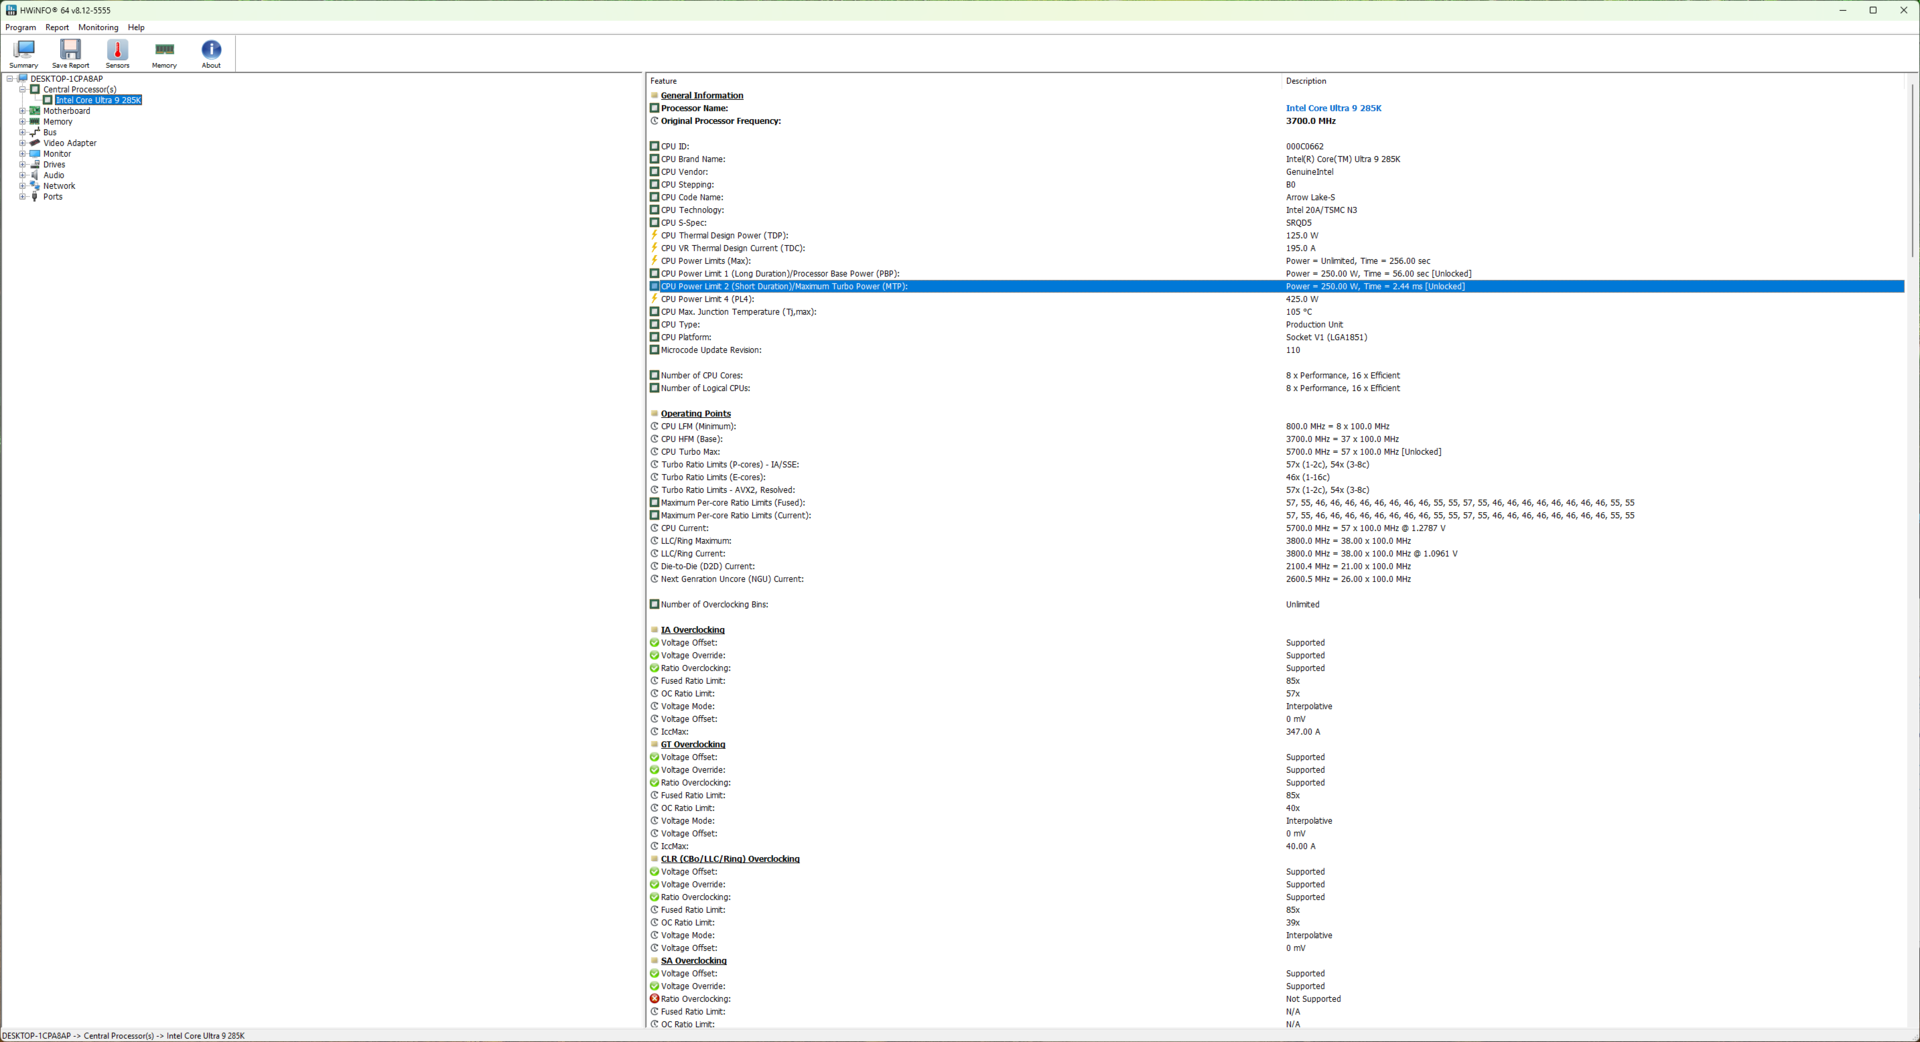
We used the default Intel performance settings in the BIOS and set the Windows power plan to Ultimate Performance, which sets PL1=PL2=250 W.
CPU performance: On par with Core i9-14900K overall with small gains over Ryzen 9 9950X
Cumulative CPU tests see the Core Ultra 9 285K being on par with the Core i9-14900K and only slightly lagging behind the AMD Ryzen 9 9950X. This is largely due to the Core Ultra 9 285K falling behind the Ryzen 9 9950X in specific tests such as Blender 2.79 BMW27 CPU, V-Ray tests, wPrime 2.1, and R benchmark, although the differences aren't that significant.
In Cinebench single-core tests, the Ultra 9 285K manages to slightly edge out the Core i9-14900K, with the Ryzen 9 9900X and the Ryzen 9 9950X gnawing at its heels. The situation is different in Geekbench, however, with Zen 5 chips managing miniscule gains against Arrow Lake-S.
Multi-core gains are more palpable, with the 24C/24T Core Ultra 9 285K showing 4-6% gains over the 16C/32T Ryzen 9 9950X in Cinebench multi-core tests, despite lack of hyperthreading. The Core Ultra 9 285K, Core i9-14900K, and the Ryzen 9 9950X all perform comparably in Geekbench 6.3 multi-core.
| CPU Performance rating - Percent | |
| AMD Ryzen 9 9950X | |
| Intel Core i9-14900K -1! | |
| Intel Core Ultra 9 285K | |
| AMD Ryzen 9 7950X -2! | |
| Intel Core i9-13900K | |
| AMD Ryzen 9 7950X3D | |
| AMD Ryzen 9 9900X -9! | |
| Intel Core i7-14700K | |
| AMD Ryzen 9 7900X -2! | |
| AMD Ryzen 7 9700X | |
| Intel Core i5-14600K | |
| Intel Core Ultra 5 245K | |
| Intel Core i9-12900K -1! | |
| Intel Core i5-13600K | |
| AMD Ryzen 5 9600X -2! | |
| AMD Ryzen 7 7800X3D -3! | |
| Intel Core i5-12600K -3! | |
* ... smaller is better
Cinebench R15 Multi Loop
Like its predecessors, the Core Ultra 9 285K does not come with a CPU cooler in the box. Intel says that coolers designed for LGA 1700 should be compatible with LGA 1851. We didn't have any hiccups in mounting our Thermaltake TH420 V2 Ultra EX ARGB all-in-one cooler using the same mounting brackets intended for the LGA 1700 socket.
That being said, expect to see new LGA 1851-specific coolers that account for the presence of the Compute tile in the southwest of the package. Coolers designed for Arrow Lake-S may offer slightly better cooling performance, but your existing LGA 1700 solution will work just fine.
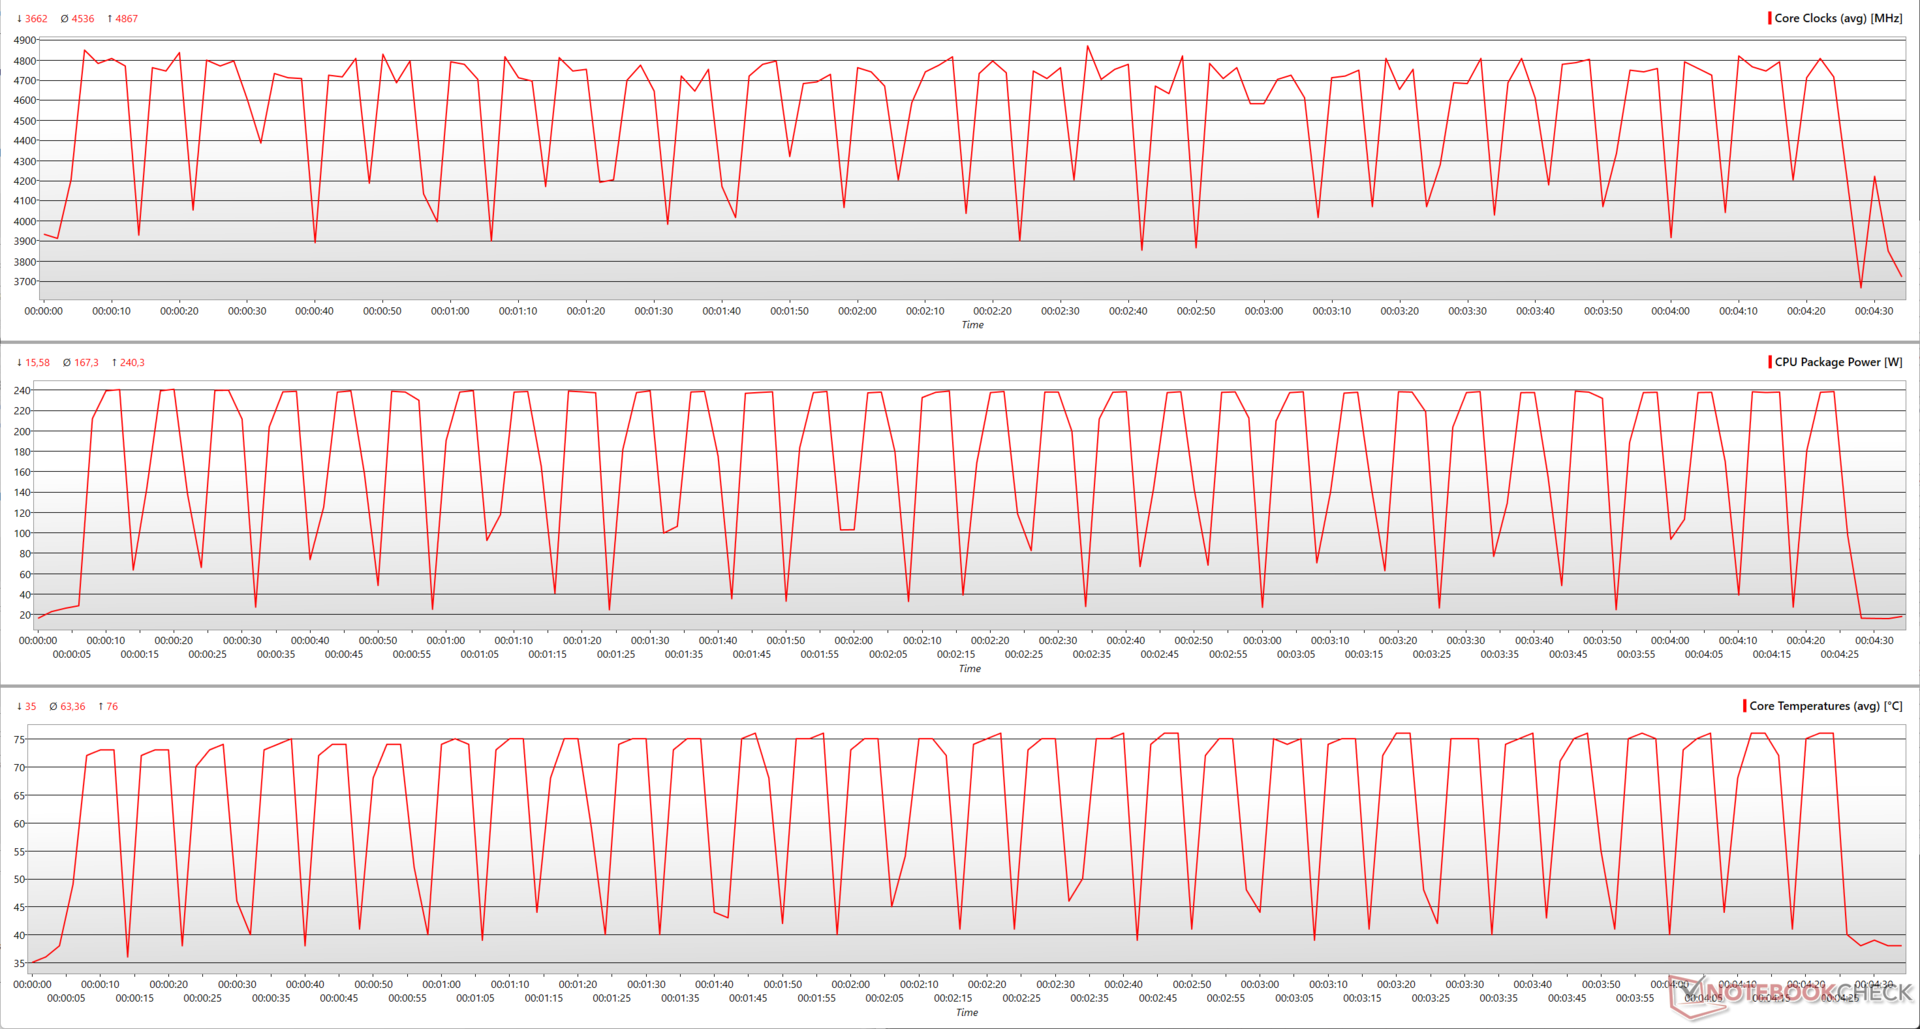
The TH420 V2 Ultra EX's ability to efficiently cool the Core Ultra 9 285K is evident from the consistent performance in the Cinebench R15 multi-core loop below.
We see that the Core Ultra 9 285K can boost up to 4.86 GHz during the Cinebench R15 multi-core loop, with average clocks coasting at 4.53 GHz.
This performance is attained with a package power consumption of 240 W and a 76 °C max core temperature, which are significantly lower than the Core i9-14900K's readings of 349 W and 87 °C. In fact, even the Core i7-14700K shows higher figures with 313 W package power and 92 °C core temperature.
On average, the Core Ultra 9 285K maintains a package power of 167 W and a core temperature of 63 °C, both of which are lower than the Core i7-14700K's respective values of 195 W and 76 °C.
System performance: In the same league as Core i9-14900K and AMD Zen 5
The Core Ultra 9 285K's overall system performance is comparable to that of the Core i9-14900K and the Ryzen 9 9950X and isn't too different from what we see with the Ryzen 9 7950X, Core i9-13900K, and the Ryzen 9 9900X.
Individual benchmarks, however, show slightly better gains with the Core i9-14900K in 3DMark Time Spy CPU, 3DMark 11 Performance Physics, and CrossMark. PCMark 10 overall puts the Core Ultra 9 285K a bit ahead of the Core i9-14900K but mostly on par with AMD Zen 5.
AMD CPUs have a particular advantage in AIDA64 CPU tests save for CPU PhotoWorxx, where the Core Ultra 9 285K manages a perceivable lead.
Nevertheless, regular productivity tasks face no hiccups in daily usage.
3DMark 11: 1280x720 Performance Physics
3DMark: 1920x1080 Fire Strike Physics | 2560x1440 Time Spy CPU
CrossMark: Overall | Responsiveness | Creativity | Productivity
PCMark 10: Score | Essentials | Productivity | Digital Content Creation
AIDA64: FP32 Ray-Trace | FPU Julia | CPU SHA3 | CPU Queen | FPU SinJulia | FPU Mandel | CPU AES | CPU ZLib | FP64 Ray-Trace | CPU PhotoWorxx
| System Performance rating | |
| AMD Ryzen 9 9950X | |
| Intel Core i9-14900K | |
| Intel Core Ultra 9 285K | |
| AMD Ryzen 9 7950X | |
| Intel Core i9-13900K | |
| AMD Ryzen 9 9900X | |
| AMD Ryzen 9 7950X3D -2! | |
| Intel Core i7-14700K | |
| AMD Ryzen 9 7900X | |
| AMD Ryzen 7 9700X | |
| Intel Core i5-14600K | |
| AMD Ryzen 7 7800X3D | |
| Intel Core i5-13600K | |
| AMD Ryzen 5 9600X | |
| Intel Core Ultra 5 245K | |
| Intel Core i9-12900K -4! | |
| Intel Core i5-12600K -4! | |
| PCMark 10 / Digital Content Creation | |
| Intel Core Ultra 9 285K | |
| AMD Ryzen 9 9950X | |
| AMD Ryzen 9 9900X | |
| AMD Ryzen 7 9700X | |
| Intel Core i9-14900K | |
| Intel Core Ultra 5 245K | |
| AMD Ryzen 5 9600X | |
| Intel Core i7-14700K | |
| AMD Ryzen 9 7900X | |
| AMD Ryzen 9 7950X | |
| Intel Core i9-13900K | |
| Intel Core i5-14600K | |
| AMD Ryzen 7 7800X3D | |
| Intel Core i5-13600K | |
| Intel Core i9-12900K | |
| Intel Core i5-12600K | |
3DMark 11: 1280x720 Performance Physics
3DMark: 1920x1080 Fire Strike Physics | 2560x1440 Time Spy CPU
CrossMark: Overall | Responsiveness | Creativity | Productivity
PCMark 10: Score | Essentials | Productivity | Digital Content Creation
AIDA64: FP32 Ray-Trace | FPU Julia | CPU SHA3 | CPU Queen | FPU SinJulia | FPU Mandel | CPU AES | CPU ZLib | FP64 Ray-Trace | CPU PhotoWorxx
| PCMark 10 Score | 10514 points | |
Help | ||
Intel has opted for a radically new Compute tile design with Arrow Lake-S. No longer are P-core and E-cores in their own contiguous blocks with their own caches. Instead, E-cores are distributed in clusters of four in between the P-cores at the corners of the tile.
All cores now share a unified L3 cache that runs through the center of the tile and a unified ring bus. This design should theoretically help in moving data faster among the cores and also in preventing heat from concentrating around one or group of cores.
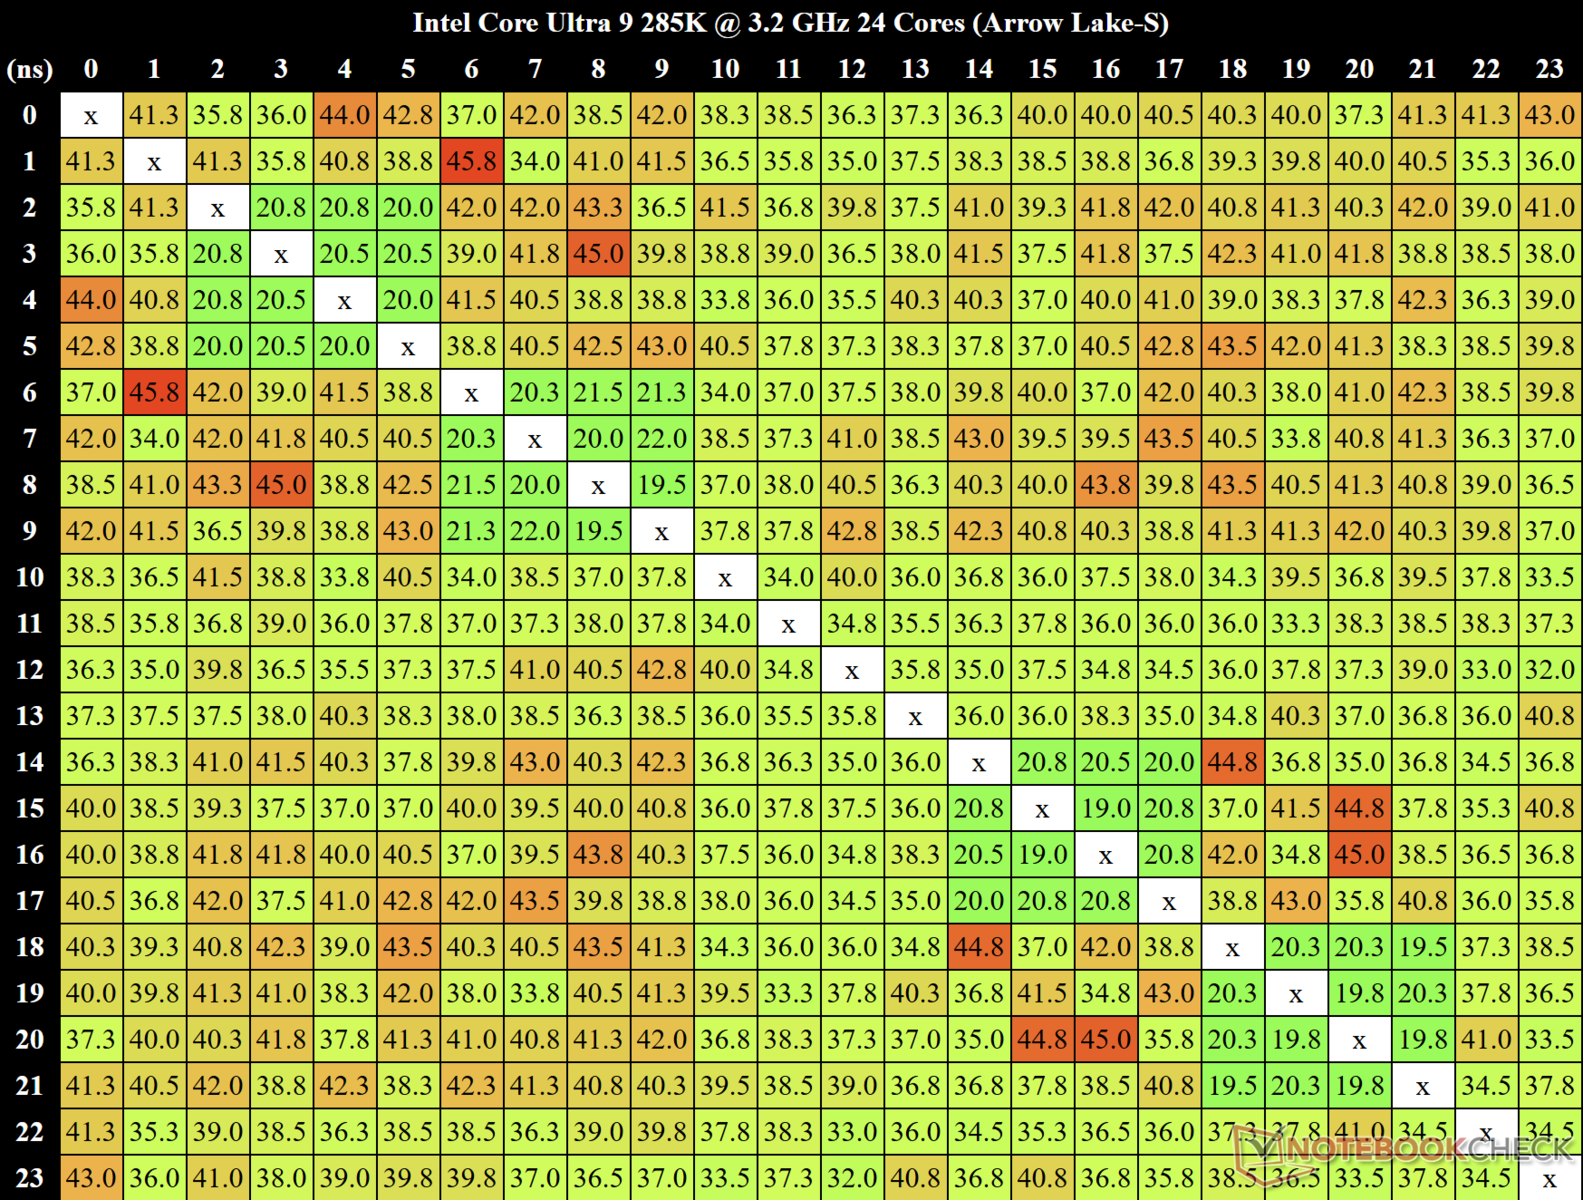
We used MicrobenchX to calculate inter-core latency. Core-to-core latencies go as high as 45.8 ns between Core 2 to Core 7, which is indicative of possible long latency while data moves from the E-core to the E-core.
However, the four E-core clusters seem to show minimal latency in the range of 19 ns to 21.3 ns for data transfer within those clusters.
We measured an overall median core-to-core latency of 38.25 ns.
| AIDA64 Memory Performance rating - Percent | |
| Intel Core i9-12900K -1! | |
| Intel Core i9-14900K | |
| Intel Core i7-14700K | |
| Intel Core i5-12600K -1! | |
| Intel Core i5-14600K | |
| Intel Core Ultra 9 285K | |
| AMD Ryzen 9 7950X3D | |
| AMD Ryzen 9 7950X | |
| AMD Ryzen 9 9950X | |
| Intel Core i9-13900K | |
| AMD Ryzen 9 9900X | |
| AMD Ryzen 9 7900X | |
| AMD Ryzen 7 7800X3D | |
| Intel Core i5-13600K | |
| AMD Ryzen 7 9700X | |
| AMD Ryzen 5 9600X | |
| Intel Core Ultra 5 245K | |
* ... smaller is better
3D and gaming performance: Arrow Lake-S disappoints big time
One would expect the benefits of lack of hyperthreading, Intel APO, and increased IPC, especially on the Skymont cores, to translate into good gaming gains. Be prepared to be disappointed.
While the Core Ultra 9 285K showed commendable CPU performance with relatively less power requirements, the tables turn lopsided when it comes to 3D and gaming tasks.
The Core Ultra 9 285K in combination with the Nvidia GeForce RTX 4090 GPU, manages to muster a 13% lead over the Ryzen 9 9900X in 3DMark 11 Performance GPU and a 6% gain over the Ryzen 9 9950X in 3DMark Time Spy Graphics.
The system loses significantly to other Raptor Lake-S Refresh and Zen 5 offerings in 3DMark Fire Strike Graphics, however, which puts it at an overall disadvantage.
| 3DMark Performance rating - Percent | |
| Intel Core i5-14600K | |
| AMD Ryzen 7 7800X3D | |
| AMD Ryzen 5 9600X | |
| Intel Core Ultra 5 245K | |
| AMD Ryzen 7 9700X | |
| AMD Ryzen 9 7950X3D | |
| Intel Core i9-14900K | |
| Intel Core i7-14700K | |
| AMD Ryzen 9 9950X | |
| AMD Ryzen 9 9900X | |
| Intel Core Ultra 9 285K | |
| 3DMark 11 - 1280x720 Performance GPU | |
| AMD Ryzen 7 7800X3D | |
| Intel Core i5-14600K | |
| AMD Ryzen 9 7950X3D | |
| Intel Core i9-14900K | |
| Intel Core Ultra 5 245K | |
| AMD Ryzen 5 9600X | |
| Intel Core i7-14700K | |
| AMD Ryzen 9 9950X | |
| AMD Ryzen 7 9700X | |
| Intel Core Ultra 9 285K | |
| AMD Ryzen 9 9900X | |
| 3DMark | |
| 2560x1440 Time Spy Graphics | |
| Intel Core i5-14600K | |
| Intel Core i9-14900K | |
| AMD Ryzen 7 7800X3D | |
| Intel Core i7-14700K | |
| AMD Ryzen 5 9600X | |
| Intel Core Ultra 5 245K | |
| AMD Ryzen 9 7950X3D | |
| AMD Ryzen 7 9700X | |
| AMD Ryzen 9 9900X | |
| Intel Core Ultra 9 285K | |
| AMD Ryzen 9 9950X | |
| 1920x1080 Fire Strike Graphics | |
| Intel Core i5-14600K | |
| AMD Ryzen 7 9700X | |
| AMD Ryzen 5 9600X | |
| Intel Core Ultra 5 245K | |
| AMD Ryzen 9 9950X | |
| AMD Ryzen 9 9900X | |
| AMD Ryzen 7 7800X3D | |
| AMD Ryzen 9 7950X3D | |
| Intel Core i9-14900K | |
| Intel Core i7-14700K | |
| Intel Core Ultra 9 285K | |
| 3DMark 11 Performance | 62846 points | |
| 3DMark Fire Strike Score | 44363 points | |
| 3DMark Time Spy Score | 30904 points | |
Help | ||
Similar trends are seen in gaming as well. Contrary to Intel's claims at launch, the Core Ultra 9 285K paired with the RTX 4090 ranks at the bottom of our gaming comparison chart, matching up only to the Core i7-14700K and trailing significantly behind Zen 5 offerings (up to 12%) in cumulative game tests at 720p Low and 1080p Ultra.
The Core Ultra 9 285K does seem to show petty gains over the Core i7-14700K in Far Cry 5, Dota 2 Reborn, and Metro Exodus (non Enhanced Edition), but the differences are miniscule and overall performance is still quite behind the Core i9-14700K and Core i9-14900K.
Even the Core i5-14600K looks to be a better gaming CPU comparatively with a decent 7% gain overall compared to the Core Ultra 9 285K
| Gaming Performance rating - Percent | |
| AMD Ryzen 7 7800X3D | |
| AMD Ryzen 9 7950X3D | |
| Intel Core i9-14900K | |
| AMD Ryzen 7 9700X | |
| AMD Ryzen 9 9900X | |
| AMD Ryzen 5 9600X | |
| AMD Ryzen 9 9950X | |
| Intel Core i5-14600K | |
| Intel Core i7-14700K | |
| Intel Core Ultra 9 285K | |
| Intel Core Ultra 5 245K | |
| F1 22 | |
| 1280x720 Ultra Low Preset AA:T AF:16x | |
| AMD Ryzen 7 7800X3D | |
| Intel Core i9-14900K | |
| AMD Ryzen 9 7950X3D | |
| AMD Ryzen 9 9950X | |
| AMD Ryzen 5 9600X | |
| AMD Ryzen 7 9700X | |
| AMD Ryzen 9 9900X | |
| Intel Core i5-14600K | |
| Intel Core i7-14700K | |
| Intel Core Ultra 9 285K | |
| Intel Core Ultra 5 245K | |
| 1920x1080 Low Preset AA:T AF:16x | |
| AMD Ryzen 7 7800X3D | |
| AMD Ryzen 9 7950X3D | |
| Intel Core i9-14900K | |
| AMD Ryzen 5 9600X | |
| AMD Ryzen 9 9950X | |
| AMD Ryzen 7 9700X | |
| AMD Ryzen 9 9900X | |
| Intel Core i5-14600K | |
| Intel Core i7-14700K | |
| Intel Core Ultra 9 285K | |
| Intel Core Ultra 5 245K | |
| 1920x1080 Ultra High Preset AA:T AF:16x | |
| AMD Ryzen 7 7800X3D | |
| Intel Core i9-14900K | |
| AMD Ryzen 7 9700X | |
| Intel Core i5-14600K | |
| AMD Ryzen 9 7950X3D | |
| AMD Ryzen 5 9600X | |
| AMD Ryzen 9 9900X | |
| AMD Ryzen 9 9950X | |
| Intel Core i7-14700K | |
| Intel Core Ultra 9 285K | |
| Intel Core Ultra 5 245K | |
| X-Plane 11.11 | |
| 1280x720 low (fps_test=1) | |
| AMD Ryzen 7 9700X | |
| AMD Ryzen 9 9900X | |
| AMD Ryzen 5 9600X | |
| Intel Core i9-14900K | |
| Intel Core i5-14600K | |
| Intel Core i7-14700K | |
| AMD Ryzen 9 7950X3D | |
| AMD Ryzen 7 7800X3D | |
| AMD Ryzen 9 9950X | |
| Intel Core Ultra 9 285K | |
| Intel Core Ultra 5 245K | |
| 1920x1080 high (fps_test=3) | |
| AMD Ryzen 7 7800X3D | |
| AMD Ryzen 9 7950X3D | |
| AMD Ryzen 7 9700X | |
| AMD Ryzen 9 9900X | |
| AMD Ryzen 5 9600X | |
| Intel Core i9-14900K | |
| AMD Ryzen 9 9950X | |
| Intel Core i7-14700K | |
| Intel Core i5-14600K | |
| Intel Core Ultra 9 285K | |
| Intel Core Ultra 5 245K | |
| Final Fantasy XV Benchmark | |
| 1280x720 Lite Quality | |
| AMD Ryzen 5 9600X | |
| AMD Ryzen 7 7800X3D | |
| Intel Core i5-14600K | |
| AMD Ryzen 9 9950X | |
| Intel Core i9-14900K | |
| Intel Core i7-14700K | |
| AMD Ryzen 7 9700X | |
| Intel Core Ultra 5 245K | |
| AMD Ryzen 9 9900X | |
| AMD Ryzen 9 7950X3D | |
| Intel Core Ultra 9 285K | |
| 1920x1080 High Quality | |
| Intel Core i9-14900K | |
| AMD Ryzen 7 7800X3D | |
| Intel Core i5-14600K | |
| AMD Ryzen 9 7950X3D | |
| AMD Ryzen 9 9900X | |
| AMD Ryzen 5 9600X | |
| Intel Core i7-14700K | |
| Intel Core Ultra 9 285K | |
| AMD Ryzen 7 9700X | |
| AMD Ryzen 9 9950X | |
| Intel Core Ultra 5 245K | |
| Dota 2 Reborn | |
| 1280x720 min (0/3) fastest | |
| AMD Ryzen 7 7800X3D | |
| AMD Ryzen 7 9700X | |
| AMD Ryzen 9 7950X3D | |
| AMD Ryzen 9 9900X | |
| AMD Ryzen 9 9950X | |
| Intel Core i9-14900K | |
| AMD Ryzen 5 9600X | |
| Intel Core i5-14600K | |
| Intel Core Ultra 9 285K | |
| Intel Core i7-14700K | |
| Intel Core Ultra 5 245K | |
| 1920x1080 ultra (3/3) best looking | |
| AMD Ryzen 7 7800X3D | |
| AMD Ryzen 9 7950X3D | |
| AMD Ryzen 9 9900X | |
| AMD Ryzen 9 9950X | |
| AMD Ryzen 7 9700X | |
| AMD Ryzen 5 9600X | |
| Intel Core i9-14900K | |
| Intel Core i5-14600K | |
| Intel Core Ultra 9 285K | |
| Intel Core i7-14700K | |
| Intel Core Ultra 5 245K | |
| The Witcher 3 | |
| 1024x768 Low Graphics & Postprocessing | |
| AMD Ryzen 9 7950X3D | |
| AMD Ryzen 7 7800X3D | |
| Intel Core i9-14900K | |
| AMD Ryzen 9 9950X | |
| AMD Ryzen 5 9600X | |
| AMD Ryzen 7 9700X | |
| AMD Ryzen 9 9900X | |
| Intel Core i7-14700K | |
| Intel Core i5-14600K | |
| Intel Core Ultra 9 285K | |
| Intel Core Ultra 5 245K | |
| 1920x1080 Ultra Graphics & Postprocessing (HBAO+) | |
| Intel Core i5-14600K | |
| AMD Ryzen 7 7800X3D | |
| Intel Core i9-14900K | |
| Intel Core Ultra 5 245K | |
| AMD Ryzen 9 7950X3D | |
| Intel Core Ultra 9 285K | |
| Intel Core i7-14700K | |
| AMD Ryzen 5 9600X | |
| AMD Ryzen 9 9950X | |
| AMD Ryzen 7 9700X | |
| AMD Ryzen 9 9900X | |
| GTA V | |
| 1024x768 Lowest Settings possible | |
| AMD Ryzen 7 7800X3D | |
| AMD Ryzen 5 9600X | |
| AMD Ryzen 9 7950X3D | |
| Intel Core i9-14900K | |
| AMD Ryzen 7 9700X | |
| AMD Ryzen 9 9900X | |
| Intel Core i5-14600K | |
| Intel Core Ultra 5 245K | |
| Intel Core i7-14700K | |
| AMD Ryzen 9 9950X | |
| Intel Core Ultra 9 285K | |
| 1920x1080 Highest AA:4xMSAA + FX AF:16x | |
| AMD Ryzen 7 7800X3D | |
| Intel Core i9-14900K | |
| AMD Ryzen 9 9900X | |
| AMD Ryzen 7 9700X | |
| AMD Ryzen 5 9600X | |
| AMD Ryzen 9 9950X | |
| Intel Core i5-14600K | |
| Intel Core Ultra 9 285K | |
| AMD Ryzen 9 7950X3D | |
| Intel Core i7-14700K | |
| Intel Core Ultra 5 245K | |
| Borderlands 3 | |
| 1280x720 Very Low Overall Quality (DX11) | |
| AMD Ryzen 7 7800X3D | |
| AMD Ryzen 9 7950X3D | |
| Intel Core i9-14900K | |
| AMD Ryzen 7 9700X | |
| AMD Ryzen 9 9900X | |
| AMD Ryzen 9 9950X | |
| Intel Core i5-14600K | |
| AMD Ryzen 5 9600X | |
| Intel Core i7-14700K | |
| Intel Core Ultra 9 285K | |
| Intel Core Ultra 5 245K | |
| 1920x1080 Very Low Overall Quality (DX11) | |
| AMD Ryzen 9 7950X3D | |
| AMD Ryzen 7 7800X3D | |
| Intel Core i9-14900K | |
| AMD Ryzen 9 9900X | |
| AMD Ryzen 7 9700X | |
| AMD Ryzen 9 9950X | |
| Intel Core i5-14600K | |
| AMD Ryzen 5 9600X | |
| Intel Core i7-14700K | |
| Intel Core Ultra 9 285K | |
| Intel Core Ultra 5 245K | |
| 1920x1080 Badass Overall Quality (DX11) | |
| AMD Ryzen 9 7950X3D | |
| AMD Ryzen 7 7800X3D | |
| Intel Core i9-14900K | |
| AMD Ryzen 7 9700X | |
| AMD Ryzen 9 9900X | |
| Intel Core i5-14600K | |
| AMD Ryzen 9 9950X | |
| AMD Ryzen 5 9600X | |
| Intel Core i7-14700K | |
| Intel Core Ultra 9 285K | |
| Intel Core Ultra 5 245K | |
| Shadow of the Tomb Raider | |
| 1280x720 Lowest Preset | |
| AMD Ryzen 7 7800X3D | |
| AMD Ryzen 9 7950X3D | |
| AMD Ryzen 7 9700X | |
| AMD Ryzen 9 9950X | |
| Intel Core i9-14900K | |
| AMD Ryzen 9 9900X | |
| AMD Ryzen 5 9600X | |
| Intel Core Ultra 9 285K | |
| Intel Core i5-14600K | |
| Intel Core i7-14700K | |
| Intel Core Ultra 5 245K | |
| 1920x1080 Highest Preset AA:T | |
| AMD Ryzen 7 7800X3D | |
| AMD Ryzen 9 7950X3D | |
| Intel Core i9-14900K | |
| AMD Ryzen 9 9900X | |
| AMD Ryzen 7 9700X | |
| AMD Ryzen 9 9950X | |
| AMD Ryzen 5 9600X | |
| Intel Core i5-14600K | |
| Intel Core Ultra 9 285K | |
| Intel Core i7-14700K | |
| Intel Core Ultra 5 245K | |
| Metro Exodus | |
| 1280x720 Low Quality AF:4x | |
| AMD Ryzen 7 7800X3D | |
| AMD Ryzen 7 9700X | |
| AMD Ryzen 5 9600X | |
| AMD Ryzen 9 9950X | |
| AMD Ryzen 9 9900X | |
| Intel Core i9-14900K | |
| Intel Core Ultra 9 285K | |
| Intel Core i5-14600K | |
| AMD Ryzen 9 7950X3D | |
| Intel Core i7-14700K | |
| Intel Core Ultra 5 245K | |
| 1920x1080 Ultra Quality AF:16x | |
| AMD Ryzen 7 7800X3D | |
| AMD Ryzen 5 9600X | |
| Intel Core i9-14900K | |
| AMD Ryzen 7 9700X | |
| AMD Ryzen 9 9900X | |
| AMD Ryzen 9 9950X | |
| Intel Core i5-14600K | |
| Intel Core i7-14700K | |
| Intel Core Ultra 9 285K | |
| AMD Ryzen 9 7950X3D | |
| Intel Core Ultra 5 245K | |
| F1 2021 | |
| 1280x720 Ultra Low Preset | |
| AMD Ryzen 7 7800X3D | |
| Intel Core i9-14900K | |
| AMD Ryzen 9 7950X3D | |
| AMD Ryzen 5 9600X | |
| AMD Ryzen 9 9950X | |
| AMD Ryzen 7 9700X | |
| AMD Ryzen 9 9900X | |
| Intel Core i5-14600K | |
| Intel Core i7-14700K | |
| Intel Core Ultra 9 285K | |
| Intel Core Ultra 5 245K | |
| 1920x1080 Ultra High Preset + Raytracing AA:T AF:16x | |
| AMD Ryzen 7 7800X3D | |
| Intel Core i9-14900K | |
| AMD Ryzen 7 9700X | |
| AMD Ryzen 5 9600X | |
| Intel Core i5-14600K | |
| AMD Ryzen 9 7950X3D | |
| AMD Ryzen 9 9900X | |
| AMD Ryzen 9 9950X | |
| Intel Core i7-14700K | |
| Intel Core Ultra 9 285K | |
| Intel Core Ultra 5 245K | |
Even GPU-bound settings like QHD Ultra and UHD Ultra seem to have lost love with the Core Ultra 9 285K. However, the cumulative performance delta vis-à-vis the Core i9-14900K is now at 10% at these settings, compared to 15% at more CPU-bound resolutions.
While it would be a bit far-fetched to say the Core Ultra 9 285K is bottlenecking the RTX 4090, you have better (and cheaper) options if gaming is your primary use case.
| Gaming Performance rating - Percent | |
| AMD Ryzen 7 7800X3D | |
| AMD Ryzen 9 7950X3D | |
| Intel Core i9-14900K | |
| AMD Ryzen 7 9700X | |
| AMD Ryzen 9 9900X | |
| Intel Core i5-14600K | |
| AMD Ryzen 5 9600X | |
| AMD Ryzen 9 9950X | |
| Intel Core i7-14700K | |
| Intel Core Ultra 9 285K | |
| Intel Core Ultra 5 245K | |
| F1 22 | |
| 2560x1440 Ultra High Preset AA:T AF:16x | |
| AMD Ryzen 7 7800X3D | |
| AMD Ryzen 5 9600X | |
| Intel Core i9-14900K | |
| AMD Ryzen 9 9900X | |
| Intel Core i5-14600K | |
| AMD Ryzen 7 9700X | |
| AMD Ryzen 9 7950X3D | |
| AMD Ryzen 9 9950X | |
| Intel Core Ultra 5 245K | |
| Intel Core i7-14700K | |
| Intel Core Ultra 9 285K | |
| 3840x2160 Ultra High Preset AA:T AF:16x | |
| AMD Ryzen 9 9900X | |
| Intel Core Ultra 5 245K | |
| AMD Ryzen 5 9600X | |
| AMD Ryzen 7 9700X | |
| AMD Ryzen 7 7800X3D | |
| AMD Ryzen 9 9950X | |
| Intel Core i5-14600K | |
| Intel Core i9-14900K | |
| Intel Core Ultra 9 285K | |
| AMD Ryzen 9 7950X3D | |
| Intel Core i7-14700K | |
| Far Cry 5 | |
| 2560x1440 Ultra Preset AA:T | |
| AMD Ryzen 7 7800X3D | |
| AMD Ryzen 9 7950X3D | |
| AMD Ryzen 9 9900X | |
| Intel Core i9-14900K | |
| AMD Ryzen 5 9600X | |
| AMD Ryzen 7 9700X | |
| Intel Core i5-14600K | |
| AMD Ryzen 9 9950X | |
| Intel Core Ultra 9 285K | |
| Intel Core i7-14700K | |
| Intel Core Ultra 5 245K | |
| 3840x2160 Ultra Preset AA:T | |
| AMD Ryzen 7 7800X3D | |
| Intel Core i9-14900K | |
| AMD Ryzen 9 7950X3D | |
| Intel Core i5-14600K | |
| AMD Ryzen 5 9600X | |
| AMD Ryzen 9 9900X | |
| AMD Ryzen 9 9950X | |
| AMD Ryzen 7 9700X | |
| Intel Core Ultra 9 285K | |
| Intel Core Ultra 5 245K | |
| Intel Core i7-14700K | |
| X-Plane 11.11 - 3840x2160 high (fps_test=3) | |
| AMD Ryzen 7 7800X3D | |
| AMD Ryzen 9 7950X3D | |
| AMD Ryzen 7 9700X | |
| AMD Ryzen 5 9600X | |
| Intel Core i9-14900K | |
| AMD Ryzen 9 9900X | |
| Intel Core i7-14700K | |
| Intel Core i5-14600K | |
| AMD Ryzen 9 9950X | |
| Intel Core Ultra 9 285K | |
| Intel Core Ultra 5 245K | |
| Final Fantasy XV Benchmark | |
| 2560x1440 High Quality | |
| AMD Ryzen 7 7800X3D | |
| Intel Core i9-14900K | |
| Intel Core i5-14600K | |
| AMD Ryzen 9 7950X3D | |
| AMD Ryzen 9 9950X | |
| Intel Core Ultra 9 285K | |
| Intel Core i7-14700K | |
| AMD Ryzen 5 9600X | |
| Intel Core Ultra 5 245K | |
| AMD Ryzen 7 9700X | |
| AMD Ryzen 9 9900X | |
| 3840x2160 High Quality | |
| Intel Core Ultra 5 245K | |
| Intel Core i9-14900K | |
| Intel Core i5-14600K | |
| Intel Core i7-14700K | |
| AMD Ryzen 7 7800X3D | |
| AMD Ryzen 9 7950X3D | |
| Intel Core Ultra 9 285K | |
| AMD Ryzen 9 9950X | |
| AMD Ryzen 9 9900X | |
| AMD Ryzen 5 9600X | |
| AMD Ryzen 7 9700X | |
| Dota 2 Reborn - 3840x2160 ultra (3/3) best looking | |
| AMD Ryzen 7 7800X3D | |
| AMD Ryzen 9 7950X3D | |
| AMD Ryzen 9 9950X | |
| AMD Ryzen 7 9700X | |
| AMD Ryzen 9 9900X | |
| Intel Core i9-14900K | |
| AMD Ryzen 5 9600X | |
| Intel Core i5-14600K | |
| Intel Core i7-14700K | |
| Intel Core Ultra 9 285K | |
| Intel Core Ultra 5 245K | |
| The Witcher 3 - 3840x2160 Ultra Graphics & Postprocessing (HBAO+) | |
| Intel Core i9-14900K | |
| Intel Core Ultra 5 245K | |
| AMD Ryzen 7 7800X3D | |
| Intel Core i5-14600K | |
| AMD Ryzen 9 7950X3D | |
| AMD Ryzen 5 9600X | |
| Intel Core i7-14700K | |
| Intel Core Ultra 9 285K | |
| AMD Ryzen 7 9700X | |
| AMD Ryzen 9 9900X | |
| AMD Ryzen 9 9950X | |
| GTA V | |
| 2560x1440 Highest AA:4xMSAA + FX AF:16x | |
| AMD Ryzen 7 7800X3D | |
| Intel Core i9-14900K | |
| AMD Ryzen 9 9900X | |
| AMD Ryzen 7 9700X | |
| AMD Ryzen 5 9600X | |
| AMD Ryzen 9 9950X | |
| Intel Core i5-14600K | |
| AMD Ryzen 9 7950X3D | |
| Intel Core Ultra 9 285K | |
| Intel Core Ultra 5 245K | |
| Intel Core i7-14700K | |
| 3840x2160 Highest AA:4xMSAA + FX AF:16x | |
| AMD Ryzen 7 7800X3D | |
| Intel Core i9-14900K | |
| Intel Core i5-14600K | |
| AMD Ryzen 9 9900X | |
| AMD Ryzen 5 9600X | |
| AMD Ryzen 7 9700X | |
| AMD Ryzen 9 7950X3D | |
| Intel Core Ultra 9 285K | |
| Intel Core Ultra 5 245K | |
| Intel Core i7-14700K | |
| AMD Ryzen 9 9950X | |
| Borderlands 3 | |
| 2560x1440 Badass Overall Quality (DX11) | |
| AMD Ryzen 7 7800X3D | |
| AMD Ryzen 9 7950X3D | |
| Intel Core i9-14900K | |
| AMD Ryzen 7 9700X | |
| AMD Ryzen 9 9900X | |
| Intel Core i5-14600K | |
| AMD Ryzen 9 9950X | |
| Intel Core i7-14700K | |
| AMD Ryzen 5 9600X | |
| Intel Core Ultra 9 285K | |
| Intel Core Ultra 5 245K | |
| 3840x2160 Badass Overall Quality (DX11) | |
| Intel Core i9-14900K | |
| AMD Ryzen 7 7800X3D | |
| AMD Ryzen 9 7950X3D | |
| Intel Core i5-14600K | |
| Intel Core i7-14700K | |
| AMD Ryzen 9 9900X | |
| AMD Ryzen 5 9600X | |
| AMD Ryzen 7 9700X | |
| AMD Ryzen 9 9950X | |
| Intel Core Ultra 9 285K | |
| Intel Core Ultra 5 245K | |
| Shadow of the Tomb Raider | |
| 2560x1440 Highest Preset AA:T | |
| AMD Ryzen 7 7800X3D | |
| AMD Ryzen 9 7950X3D | |
| Intel Core i9-14900K | |
| AMD Ryzen 9 9900X | |
| AMD Ryzen 9 9950X | |
| AMD Ryzen 7 9700X | |
| AMD Ryzen 5 9600X | |
| Intel Core i5-14600K | |
| Intel Core i7-14700K | |
| Intel Core Ultra 9 285K | |
| Intel Core Ultra 5 245K | |
| 3840x2160 Highest Preset AA:T | |
| Intel Core i9-14900K | |
| Intel Core i5-14600K | |
| AMD Ryzen 5 9600X | |
| AMD Ryzen 7 7800X3D | |
| AMD Ryzen 9 7950X3D | |
| Intel Core Ultra 5 245K | |
| AMD Ryzen 9 9900X | |
| AMD Ryzen 7 9700X | |
| Intel Core i7-14700K | |
| Intel Core Ultra 9 285K | |
| AMD Ryzen 9 9950X | |
| Metro Exodus | |
| 2560x1440 Ultra Quality AF:16x | |
| AMD Ryzen 7 7800X3D | |
| Intel Core i9-14900K | |
| AMD Ryzen 5 9600X | |
| AMD Ryzen 7 9700X | |
| Intel Core i5-14600K | |
| AMD Ryzen 9 9900X | |
| Intel Core i7-14700K | |
| AMD Ryzen 9 9950X | |
| AMD Ryzen 9 7950X3D | |
| Intel Core Ultra 9 285K | |
| Intel Core Ultra 5 245K | |
| 3840x2160 Ultra Quality AF:16x | |
| Intel Core i9-14900K | |
| Intel Core i5-14600K | |
| AMD Ryzen 7 7800X3D | |
| AMD Ryzen 9 7950X3D | |
| AMD Ryzen 7 9700X | |
| Intel Core i7-14700K | |
| AMD Ryzen 9 9900X | |
| AMD Ryzen 5 9600X | |
| Intel Core Ultra 5 245K | |
| Intel Core Ultra 9 285K | |
| AMD Ryzen 9 9950X | |
| F1 2021 | |
| 2560x1440 Ultra High Preset + Raytracing AA:T AF:16x | |
| AMD Ryzen 7 7800X3D | |
| AMD Ryzen 7 9700X | |
| Intel Core i9-14900K | |
| AMD Ryzen 5 9600X | |
| AMD Ryzen 9 7950X3D | |
| Intel Core i5-14600K | |
| AMD Ryzen 9 9950X | |
| Intel Core i7-14700K | |
| AMD Ryzen 9 9900X | |
| Intel Core Ultra 9 285K | |
| Intel Core Ultra 5 245K | |
| 3840x2160 Ultra High Preset + Raytracing AA:T AF:16x | |
| AMD Ryzen 7 7800X3D | |
| AMD Ryzen 9 9950X | |
| AMD Ryzen 5 9600X | |
| AMD Ryzen 9 7950X3D | |
| Intel Core i9-14900K | |
| AMD Ryzen 7 9700X | |
| AMD Ryzen 9 9900X | |
| Intel Core i5-14600K | |
| Intel Core Ultra 9 285K | |
| Intel Core Ultra 5 245K | |
| Intel Core i7-14700K | |
| low | med. | high | ultra | QHD DLSS | QHD FSR | QHD | 4K DLSS | 4K FSR | 4K | |
|---|---|---|---|---|---|---|---|---|---|---|
| GTA V (2015) | 186.9 | 185.6 | 183.2 | 161.3 | 154.2 | 182.4 | ||||
| The Witcher 3 (2015) | 626 | 584 | 545 | 294 | 251 | 276 | ||||
| Dota 2 Reborn (2015) | 256 | 230 | 218 | 204 | 196.3 | |||||
| Final Fantasy XV Benchmark (2018) | 234 | 237 | 228 | 221 | 154.3 | |||||
| X-Plane 11.11 (2018) | 189.1 | 172.5 | 140.5 | 117.3 | ||||||
| Far Cry 5 (2018) | 225 | 194 | 186 | 171 | 172 | 162 | ||||
| Strange Brigade (2018) | 705 | 557 | 552 | 547 | 501 | 276 | ||||
| Shadow of the Tomb Raider (2018) | 282 | 273 | 275 | 270 | 255 | 178.4 | ||||
| Metro Exodus (2019) | 299 | 271 | 230 | 193.8 | 177.7 | 131.3 | ||||
| Borderlands 3 (2019) | 209 | 183 | 166.8 | 159.1 | 158.2 | 127.3 | ||||
| F1 2021 (2021) | 530 | 510 | 486 | 232 | 229 | 198.2 | ||||
| F1 22 (2022) | 357 | 388 | 373 | 174.6 | 149.9 | 83 | ||||
| F1 23 (2023) | 376 | 394 | 393 | 182.9 | 145.7 | 127 | 78.5 | |||
| Baldur's Gate 3 (2023) | 304 | 293 | 271 | 269 | 225 | 193.2 | 131.7 | |||
| Cyberpunk 2077 (2023) | 212 | 214 | 195.1 | 180.3 | 145.2 | 73.2 | ||||
| Assassin's Creed Mirage (2023) | 287 | 268 | 255 | 198 | 178 | 156 | 125 | |||
| F1 24 (2024) | 373 | 394 | 365 | 184.8 | 186.3 | 192.8 | 139.9 | 121 | 137.2 | 77 |
| Black Myth: Wukong (2024) | 214 | 162 | 128 | 81 | 89 | 65 | 68 | 42 |
Power consumption: Intel finally gets power efficiency right
Intel is pitching power efficiency as Arrow Lake-S's main USP, and we could see that the Core Ultra 9 285K indeed lives up to expectations in this regard.
The Core Ultra 9 285K consumes 37% less power from the wall while running Cinebench R23 multi-core compared to the Core i9-14900K, with Cinebench R23 single-core power consumption being about 27% lower.
Power draws during a Prime95 in-place large FFTs run are also 29% lower than what we had observed with the Core i9-14900K, with the Core Ultra 9 285K coming closer to Core i5-14600K levels.
These gains are also seen in gaming with the Core Ultra 9 285K system drawing 18% lesser power compared to the Core i9-14900K in The Witcher 3 at 1080p Ultra and 22% lesser than the Ryzen 9 9950X in Cyberpunk 2077: Phantom Liberty at 1080p Ultra.
Power Consumption: External monitor
: Cyberpunk 2077 ultra external monitor
| Power Consumption / Cinebench R15 Multi (external Monitor) | |
| Intel Core i9-14900K, NVIDIA GeForce RTX 4090 | |
| Intel Core i9-13900K, NVIDIA GeForce RTX 3090 | |
| Intel Core i7-14700K, NVIDIA GeForce RTX 4090 | |
| Intel Core Ultra 9 285K, NVIDIA GeForce RTX 4090 (Idle: 76.2 W) | |
| Intel Core i5-14600K, NVIDIA GeForce RTX 4090 | |
| Intel Core i9-12900K, NVIDIA Titan RTX (Idle: 70.5 W) | |
| AMD Ryzen 9 7950X, NVIDIA GeForce RTX 3090 | |
| AMD Ryzen 9 7900X, NVIDIA GeForce RTX 3090 | |
| AMD Ryzen 9 9950X, NVIDIA GeForce RTX 4090 (Idle: 100 W) | |
| Intel Core i5-13600K, NVIDIA GeForce RTX 3090 | |
| AMD Ryzen 9 9900X, NVIDIA GeForce RTX 4090 (Idle: 85.1 W) | |
| AMD Ryzen 9 7950X3D, NVIDIA GeForce RTX 4090 | |
| Intel Core Ultra 5 245K, NVIDIA GeForce RTX 4090 | |
| AMD Ryzen 5 9600X, NVIDIA GeForce RTX 4090 | |
| AMD Ryzen 7 7800X3D, NVIDIA GeForce RTX 4090 | |
| Intel Core i5-12600K, NVIDIA Titan RTX (Idle: 70.45 W) | |
| AMD Ryzen 7 9700X, NVIDIA GeForce RTX 4090 (Idle: 83 W) | |
| Power Consumption / Cinebench R23 Single (external Monitor) | |
| AMD Ryzen 7 7800X3D, NVIDIA GeForce RTX 4090 | |
| Intel Core i7-14700K, NVIDIA GeForce RTX 4090 | |
| Intel Core i9-14900K, NVIDIA GeForce RTX 4090 | |
| Intel Core i5-14600K, NVIDIA GeForce RTX 4090 | |
| AMD Ryzen 5 9600X, NVIDIA GeForce RTX 4090 | |
| AMD Ryzen 9 9950X, NVIDIA GeForce RTX 4090 (100) | |
| AMD Ryzen 9 9900X, NVIDIA GeForce RTX 4090 (85.1) | |
| Intel Core Ultra 5 245K, NVIDIA GeForce RTX 4090 | |
| AMD Ryzen 7 9700X, NVIDIA GeForce RTX 4090 (83) | |
| Intel Core Ultra 9 285K, NVIDIA GeForce RTX 4090 (76.2) | |
| Power Consumption / Cinebench R23 Multi (external Monitor) | |
| Intel Core i9-14900K, NVIDIA GeForce RTX 4090 | |
| Intel Core i7-14700K, NVIDIA GeForce RTX 4090 | |
| Intel Core Ultra 9 285K, NVIDIA GeForce RTX 4090 (76.2) | |
| Intel Core i5-14600K, NVIDIA GeForce RTX 4090 | |
| AMD Ryzen 9 9950X, NVIDIA GeForce RTX 4090 (100) | |
| AMD Ryzen 9 7950X3D, NVIDIA GeForce RTX 4090 | |
| AMD Ryzen 9 9900X, NVIDIA GeForce RTX 4090 (85.1) | |
| Intel Core Ultra 5 245K, NVIDIA GeForce RTX 4090 | |
| AMD Ryzen 5 9600X, NVIDIA GeForce RTX 4090 | |
| AMD Ryzen 7 7800X3D, NVIDIA GeForce RTX 4090 | |
| AMD Ryzen 7 9700X, NVIDIA GeForce RTX 4090 (83) | |
| Power Consumption / Prime95 V2810 Stress (external Monitor) | |
| Intel Core i9-14900K, NVIDIA GeForce RTX 4090 | |
| Intel Core i9-13900K, NVIDIA GeForce RTX 3090 | |
| Intel Core i7-14700K, NVIDIA GeForce RTX 4090 | |
| Intel Core Ultra 9 285K, NVIDIA GeForce RTX 4090 (Idle: 76.2 W) | |
| Intel Core i5-14600K, NVIDIA GeForce RTX 4090 | |
| Intel Core i5-13600K, NVIDIA GeForce RTX 3090 | |
| AMD Ryzen 9 7950X, NVIDIA GeForce RTX 3090 | |
| AMD Ryzen 9 7900X, NVIDIA GeForce RTX 3090 | |
| AMD Ryzen 9 9950X, NVIDIA GeForce RTX 4090 (Idle: 100 W) | |
| Intel Core i9-12900K, NVIDIA Titan RTX (Idle: 70.5 W) | |
| AMD Ryzen 9 9900X, NVIDIA GeForce RTX 4090 (Idle: 85.1 W) | |
| AMD Ryzen 9 7950X3D, NVIDIA GeForce RTX 4090 | |
| Intel Core Ultra 5 245K, NVIDIA GeForce RTX 4090 | |
| Intel Core i5-12600K, NVIDIA Titan RTX (Idle: 70.45 W) | |
| AMD Ryzen 7 7800X3D, NVIDIA GeForce RTX 4090 | |
| AMD Ryzen 5 9600X, NVIDIA GeForce RTX 4090 | |
| AMD Ryzen 7 9700X, NVIDIA GeForce RTX 4090 (Idle: 83 W) | |
| Power Consumption / The Witcher 3 ultra (external Monitor) | |
| Intel Core i5-14600K, NVIDIA GeForce RTX 4090 | |
| Intel Core i9-14900K, NVIDIA GeForce RTX 4090 | |
| AMD Ryzen 9 7900X, NVIDIA GeForce RTX 3090 | |
| AMD Ryzen 9 7950X, NVIDIA GeForce RTX 3090 | |
| Intel Core i9-13900K, NVIDIA GeForce RTX 3090 | |
| Intel Core i7-14700K, NVIDIA GeForce RTX 4090 | |
| AMD Ryzen 9 7950X3D, NVIDIA GeForce RTX 4090 | |
| Intel Core i5-13600K, NVIDIA GeForce RTX 3090 | |
| AMD Ryzen 7 7800X3D, NVIDIA GeForce RTX 4090 | |
| Intel Core Ultra 5 245K, NVIDIA GeForce RTX 4090 | |
| AMD Ryzen 9 9950X, NVIDIA GeForce RTX 4090 (Idle: 100 W) | |
| AMD Ryzen 9 9900X, NVIDIA GeForce RTX 4090 (Idle: 85.1 W) | |
| Intel Core i9-12900K, NVIDIA Titan RTX (Idle: 70.5 W) | |
| Intel Core Ultra 9 285K, NVIDIA GeForce RTX 4090 (Idle: 76.2 W) | |
| AMD Ryzen 7 9700X, NVIDIA GeForce RTX 4090 (Idle: 83 W) | |
| Intel Core i5-12600K, NVIDIA Titan RTX (Idle: 70.45 W) | |
| Power Consumption | |
| Intel Core Ultra 9 285K, NVIDIA GeForce RTX 4090 | |
| AMD Ryzen 5 9600X, NVIDIA GeForce RTX 4090 | |
| AMD Ryzen 9 9900X, NVIDIA GeForce RTX 4090 | |
| AMD Ryzen 9 9950X, NVIDIA GeForce RTX 4090 | |
| AMD Ryzen 7 9700X, NVIDIA GeForce RTX 4090 | |
| Intel Core Ultra 5 245K, NVIDIA GeForce RTX 4090 | |
: Cyberpunk 2077 ultra external monitor
* ... smaller is better
These lower power draws naturally translate to high efficiency gains. Cinebench R15 multi-core sees the Core Ultra 9 285K being a whopping 61% more efficient than the Core i9-14900K while being 64% better in Cinebench R23 multi-core.
Cinebench R23 single-core sees the Core Ultra 9 285K being 37% more efficient with 21.2 points per W compared to the Core i9-14900K's 15.51 points per W.
Even against the Ryzen 9 9950X, the Core Ultra 9 285K maintains a good 32% to 34% lead in single-core power efficiency in Cinebench single-core tests.
The Arrow Lake-S CPU also shows a good 14% efficiency gain against the Core i9-14900K while playing The Witcher 3 at 1080p Ultra and is even marginally better than a Ryzen 7 7800X3D system.
| Power Consumption / Cinebench R15 Multi Efficiency (external Monitor) | |
| AMD Ryzen 9 7950X3D, NVIDIA GeForce RTX 4090 | |
| AMD Ryzen 9 9950X, NVIDIA GeForce RTX 4090 | |
| Intel Core Ultra 9 285K, NVIDIA GeForce RTX 4090 | |
| AMD Ryzen 9 9900X, NVIDIA GeForce RTX 4090 | |
| Intel Core Ultra 5 245K, NVIDIA GeForce RTX 4090 | |
| AMD Ryzen 7 7800X3D, NVIDIA GeForce RTX 4090 | |
| Intel Core i7-14700K, NVIDIA GeForce RTX 4090 | |
| AMD Ryzen 5 9600X, NVIDIA GeForce RTX 4090 | |
| Intel Core i9-14900K, NVIDIA GeForce RTX 4090 | |
| Intel Core i5-14600K, NVIDIA GeForce RTX 4090 | |
| Power Consumption / Cinebench R23 Single Power Efficiency - external Monitor | |
| Intel Core Ultra 9 285K, NVIDIA GeForce RTX 4090 | |
| Intel Core Ultra 5 245K, NVIDIA GeForce RTX 4090 | |
| AMD Ryzen 9 9900X, NVIDIA GeForce RTX 4090 | |
| AMD Ryzen 9 9950X, NVIDIA GeForce RTX 4090 | |
| Intel Core i9-14900K, NVIDIA GeForce RTX 4090 | |
| AMD Ryzen 5 9600X, NVIDIA GeForce RTX 4090 | |
| Intel Core i7-14700K, NVIDIA GeForce RTX 4090 | |
| Intel Core i5-14600K, NVIDIA GeForce RTX 4090 | |
| AMD Ryzen 7 7800X3D, NVIDIA GeForce RTX 4090 | |
| Power Consumption / Cinebench R23 Multi Power Efficiency - external Monitor | |
| AMD Ryzen 9 9950X, NVIDIA GeForce RTX 4090 | |
| Intel Core Ultra 9 285K, NVIDIA GeForce RTX 4090 | |
| AMD Ryzen 9 7950X3D, NVIDIA GeForce RTX 4090 | |
| AMD Ryzen 9 9900X, NVIDIA GeForce RTX 4090 | |
| Intel Core Ultra 5 245K, NVIDIA GeForce RTX 4090 | |
| AMD Ryzen 7 7800X3D, NVIDIA GeForce RTX 4090 | |
| Intel Core i7-14700K, NVIDIA GeForce RTX 4090 | |
| AMD Ryzen 5 9600X, NVIDIA GeForce RTX 4090 | |
| Intel Core i9-14900K, NVIDIA GeForce RTX 4090 | |
| Intel Core i5-14600K, NVIDIA GeForce RTX 4090 | |
| Power Consumption / Cinebench 2024 Single Power Efficiency - external Monitor | |
| Intel Core Ultra 9 285K, NVIDIA GeForce RTX 4090 | |
| AMD Ryzen 9 9900X, NVIDIA GeForce RTX 4090 | |
| AMD Ryzen 9 9950X, NVIDIA GeForce RTX 4090 | |
| Power Consumption / Cinebench 2024 Multi Power Efficiency - external Monitor | |
| Intel Core Ultra 9 285K, NVIDIA GeForce RTX 4090 | |
| AMD Ryzen 9 9950X, NVIDIA GeForce RTX 4090 | |
| AMD Ryzen 9 9900X, NVIDIA GeForce RTX 4090 | |
| Power Consumption / Witcher 3 ultra Efficiency (external Monitor) | |
| Intel Core Ultra 9 285K, NVIDIA GeForce RTX 4090 | |
| AMD Ryzen 7 7800X3D, NVIDIA GeForce RTX 4090 | |
| Intel Core i5-12400F, NVIDIA GeForce RTX 4090 | |
| Intel Core Ultra 5 245K, NVIDIA GeForce RTX 4090 | |
| AMD Ryzen 9 7950X3D, NVIDIA GeForce RTX 4090 | |
| AMD Ryzen 9 9900X, NVIDIA GeForce RTX 4090 | |
| AMD Ryzen 9 9950X, NVIDIA GeForce RTX 4090 | |
| AMD Ryzen 9 7950X, NVIDIA GeForce RTX 4090 | |
| Intel Core i9-14900K, NVIDIA GeForce RTX 4090 | |
| Intel Core i5-14600K, NVIDIA GeForce RTX 4090 | |
| Intel Core i5-13400, NVIDIA GeForce RTX 4090 | |
| Intel Core i7-14700K, NVIDIA GeForce RTX 4090 | |
| Intel Core i9-14900K, NVIDIA GeForce RTX 4090 | |
Notebookcheck's overall impression of the Core Ultra 9 285K
The Intel Core Ultra 9 285K succeeds in offering Core i9-14900K levels of raw CPU performance at lower power levels.
Gaming performance, however, is not up to the mark, which puts a big question over its $589 asking price.
Hardcore gamers may want to wait till Ryzen 9000X3D chips drop in early November before splurging their cash.
