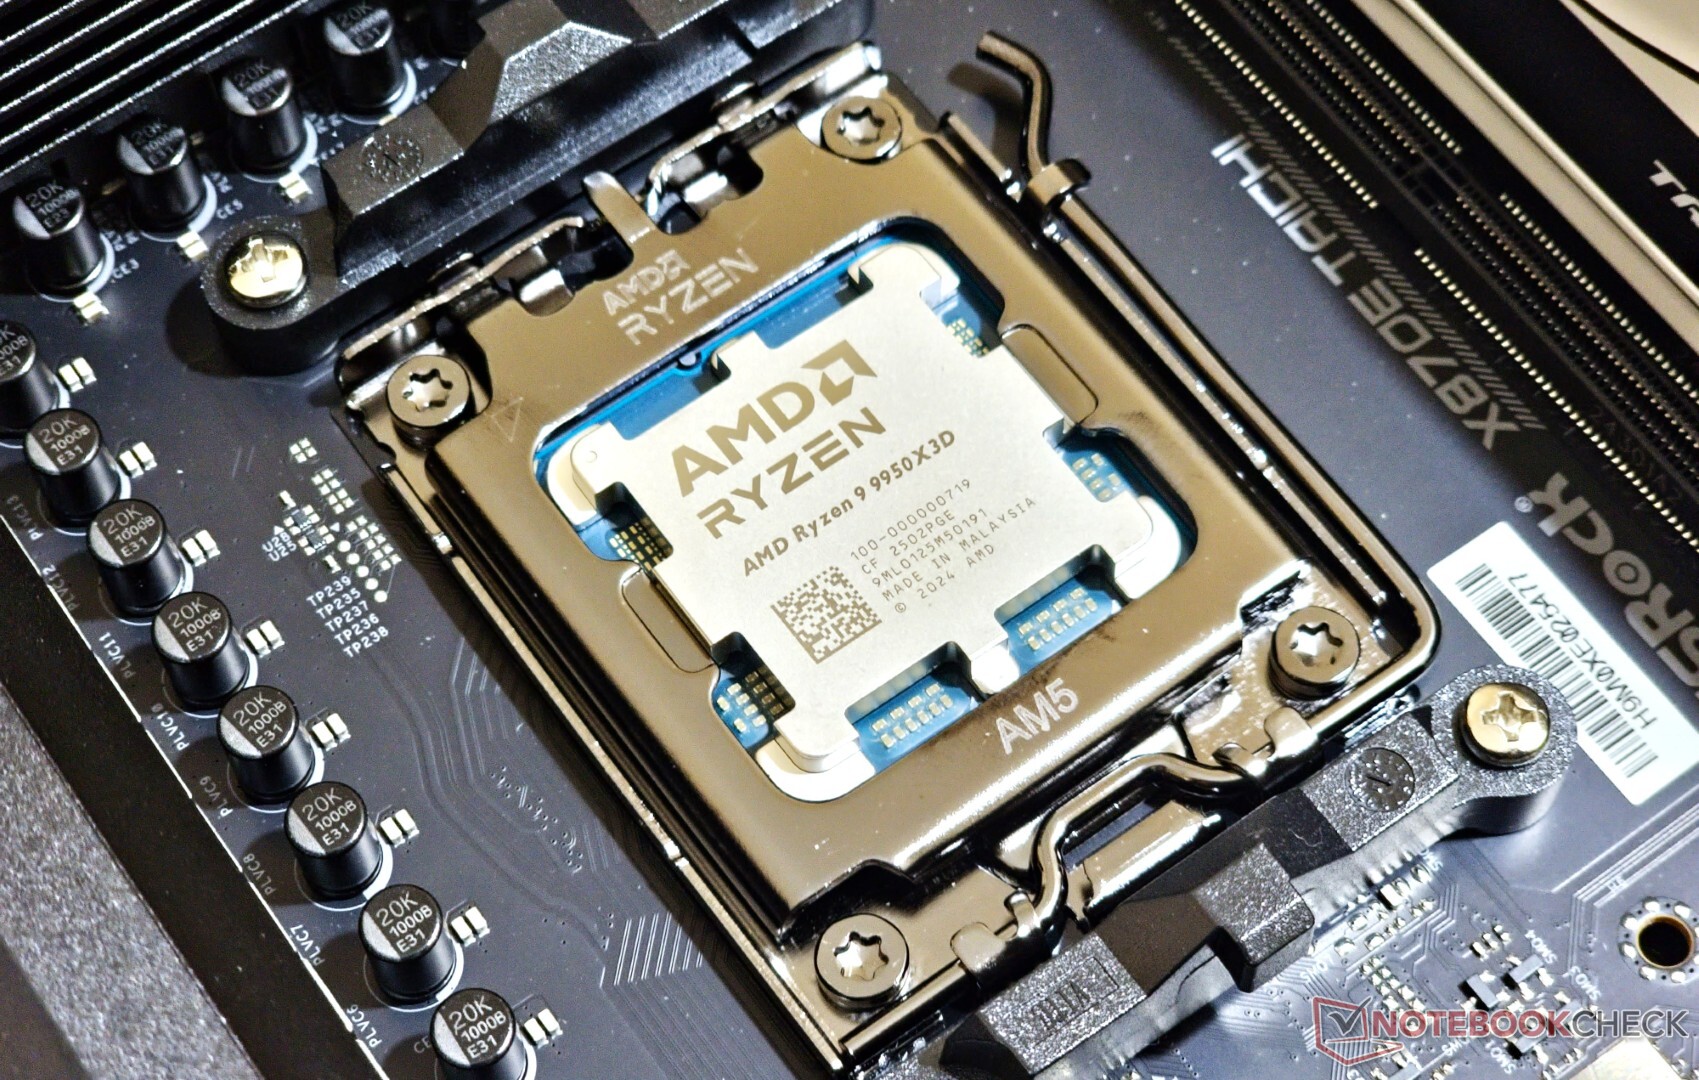
AMD Ryzen 9 9950X3D Review: Ryzen 7 9800X3D levels of gaming performance and power efficiency for $50 markup over the Ryzen 9 9950X
Cache worth the cash?
The AMD Ryzen 9 9950X3D offers the exact same performance as its conventional counterpart while reaping the benefits of added cache in CPU-limited games. While the gaming performance is now on Ryzen 7 9800X3D-level, the added $50 markup vis-à-vis the Ryzen 9 9950X for not-so-tangible gains may warrant a closer look.Vaidyanathan Subramaniam 👁 Published 🇫🇷 🇪🇸 ...
Verdict: Excellent gaming and efficiency boost with questionable value proposition
Today's launch of the AMD Ryzen 9 9950X3D further consolidates the fact that simply adding extra cache offers a more palpable performance benefit than any radical architecture change.
The AM5 platform has matured considerably since its advent three years ago, coupled with reasonably priced DDR5 kits. In fact, you can use the AMD Ryzen 9 9950X3D with just about any AM5 motherboard and reap more or less the same performance benefits.
Recent AGESA updates have introduced Memory Context Restore functionality that significantly improves memory training and boot times, which have been a pain point with the AM5 platform.
While the future of Intel's new LGA 1851 socket is still uncertain, AMD has actually promised AM5 support till 2027. If AM4's longevity is anything to go by, AM5 can be expected to outlive its purpose yet again.

The Ryzen 9 9950X3D is on par with the Intel Core Ultra 9 285K, the Core i9-14900K, and even the Ryzen 9 9950X in cumulative CPU benchmarks while offering good power efficiency gains. Productivity workloads see the Ryzen 9 9950X3D topping the charts with some tangible gains over Intel's offerings.
When it comes to gaming, particularly at CPU-intensive settings, the Ryzen 9 9950X3D's additional 64 MB V-cache proves beneficial, boosting its performance by 18% over its non-X3D counterpart and surpassing the Core i9-14900K by 10% in aggregated gaming tests.
Despite this, the Ryzen 9 9950X3D can only play second fiddle to the Ryzen 7 9800X3D in gaming, although the delta between them is practically negligible. Even the Ryzen 7 7800X3D is still a venerable option in 2025 if you're primarily eyeing a gaming CPU.
While the Core Ultra 9 285K brings with it good efficiency improvements, its current $620 selling price makes it a less appealing recommendation.
Want a CPU that excels in both gaming and content creation? The $699 Ryzen 9 9950X3D and the $500 Core i9-14900K are both good options.
Want the best gaming CPU overall? The $449 Ryzen 7 7800X3D or the $479 Ryzen 7 9800X3D are just what the doctor ordered.
Pros
Cons
Price and Availability
The AMD Ryzen 9 9950X3D will be available at retailers worldwide from tomorrow for $699 SEP.
Table of Contents
- Verdict: Excellent gaming and efficiency boost with questionable value proposition
- The test bench: Ryzen 9 9950X3D and GeForce RTX 4090 make a good pair
- CPU performance: In the same ballpark as the Ryzen 9 9950X and Core Ultra 9 285K
- System performance: Tangible gains over the Ryzen 9 7950X3D
- 3D and gaming performance: Gnaws right at the Ryzen 7 9800X3D's heels
- Power consumption: Trumps the Core Ultra 9 285K in multi-core efficiency
- Notebookcheck's impressions of the AMD Ryzen 9 9950X3D
AMD started toying with the idea of bringing its 3D V-cache technology − first seen with the Ryzen 7 5800X3D − to flagship Ryzen CPUs starting from the Ryzen 7000 series.
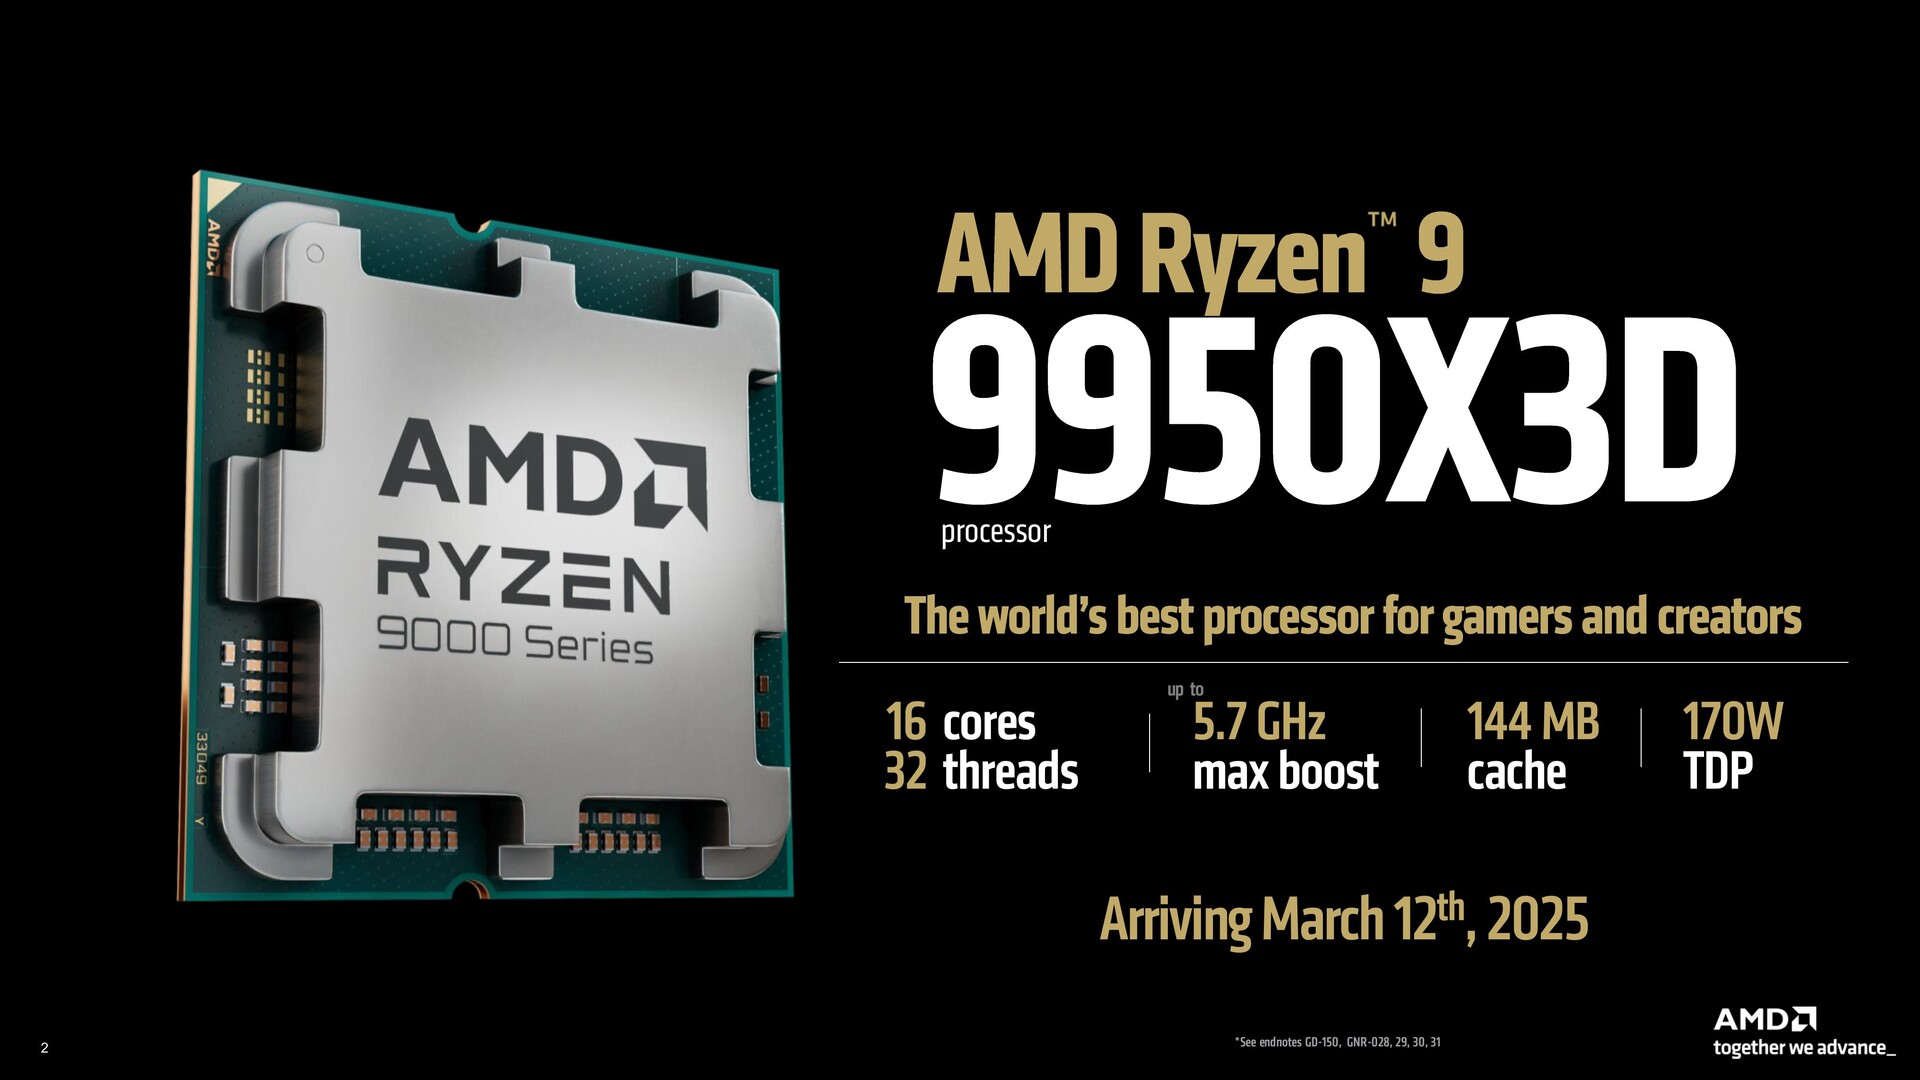
The Ryzen 7 9800X3D has been a runaway hit in the Zen 5 generation, and now it is the turn of the top-end 16-core behemoth to get a taste of 3D V-cache goodness.
Today, AMD is making available the Ryzen 9 9900X3D and the Ryzen 9 9950X3D processors with the sales embargo lifting tomorrow.
We have with us the Ryzen 9 9950X3D for review. AMD is yet to seed the Ryzen 9 9900X3D to the press in India, but we hope to have it in our labs pretty soon.
Overview of AMD Zen 5 "Granite Ridge" Ryzen 9000 desktop processors
| SKU | Cores / Threads | Base Clock | Turbo Clock | L2 Cache | L3 Cache | TDP | Default Socket Power (PPT) | Launch Price (SEP) |
|---|---|---|---|---|---|---|---|---|
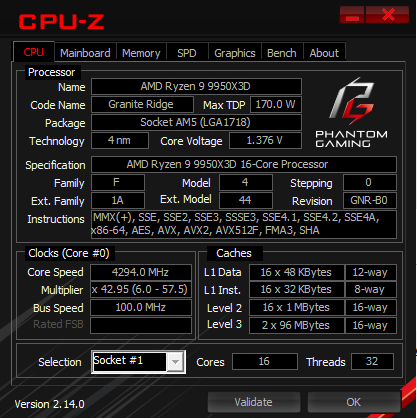
| Ryzen 9 9950X3D | 16 / 32 | 4.3 GHz | 5.7 GHz | 16x 1 MB | 128 MB | 170 W | 200 W | US$699 |
| Ryzen 9 9950X | 16 / 32 | 4.3 GHz | 5.7 GHz | 16x 1 MB | 64 MB | 170 W | 200 W | US$649 |
| Ryzen 9 9900X3D | 12 / 24 | 4.4 GHz | 5.5 GHz | 12x 1 MB | 128 MB | 120 W | 162 W | US$599 |
| Ryzen 9 9900X | 12 / 24 | 4.4 GHz | 5.6 GHz | 12x 1 MB | 64 MB | 120 W | 162 W | US$499 |
| Ryzen 7 9800X3D | 8 / 16 | 4.7 GHz | 5.2 GHz | 8x 1 MB | 96 MB | 120 W | 162 W | US$479 |
| Ryzen 7 9700X | 8 / 16 | 3.8 GHz | 5.5 GHz | 8x 1 MB | 32 MB | 65 W | 88 W | US$359 |
| Ryzen 5 9600X | 6 / 12 | 3.9 GHz | 5.4 GHz | 6x 1 MB | 32 MB | 65 W | 88 W | US$279 |
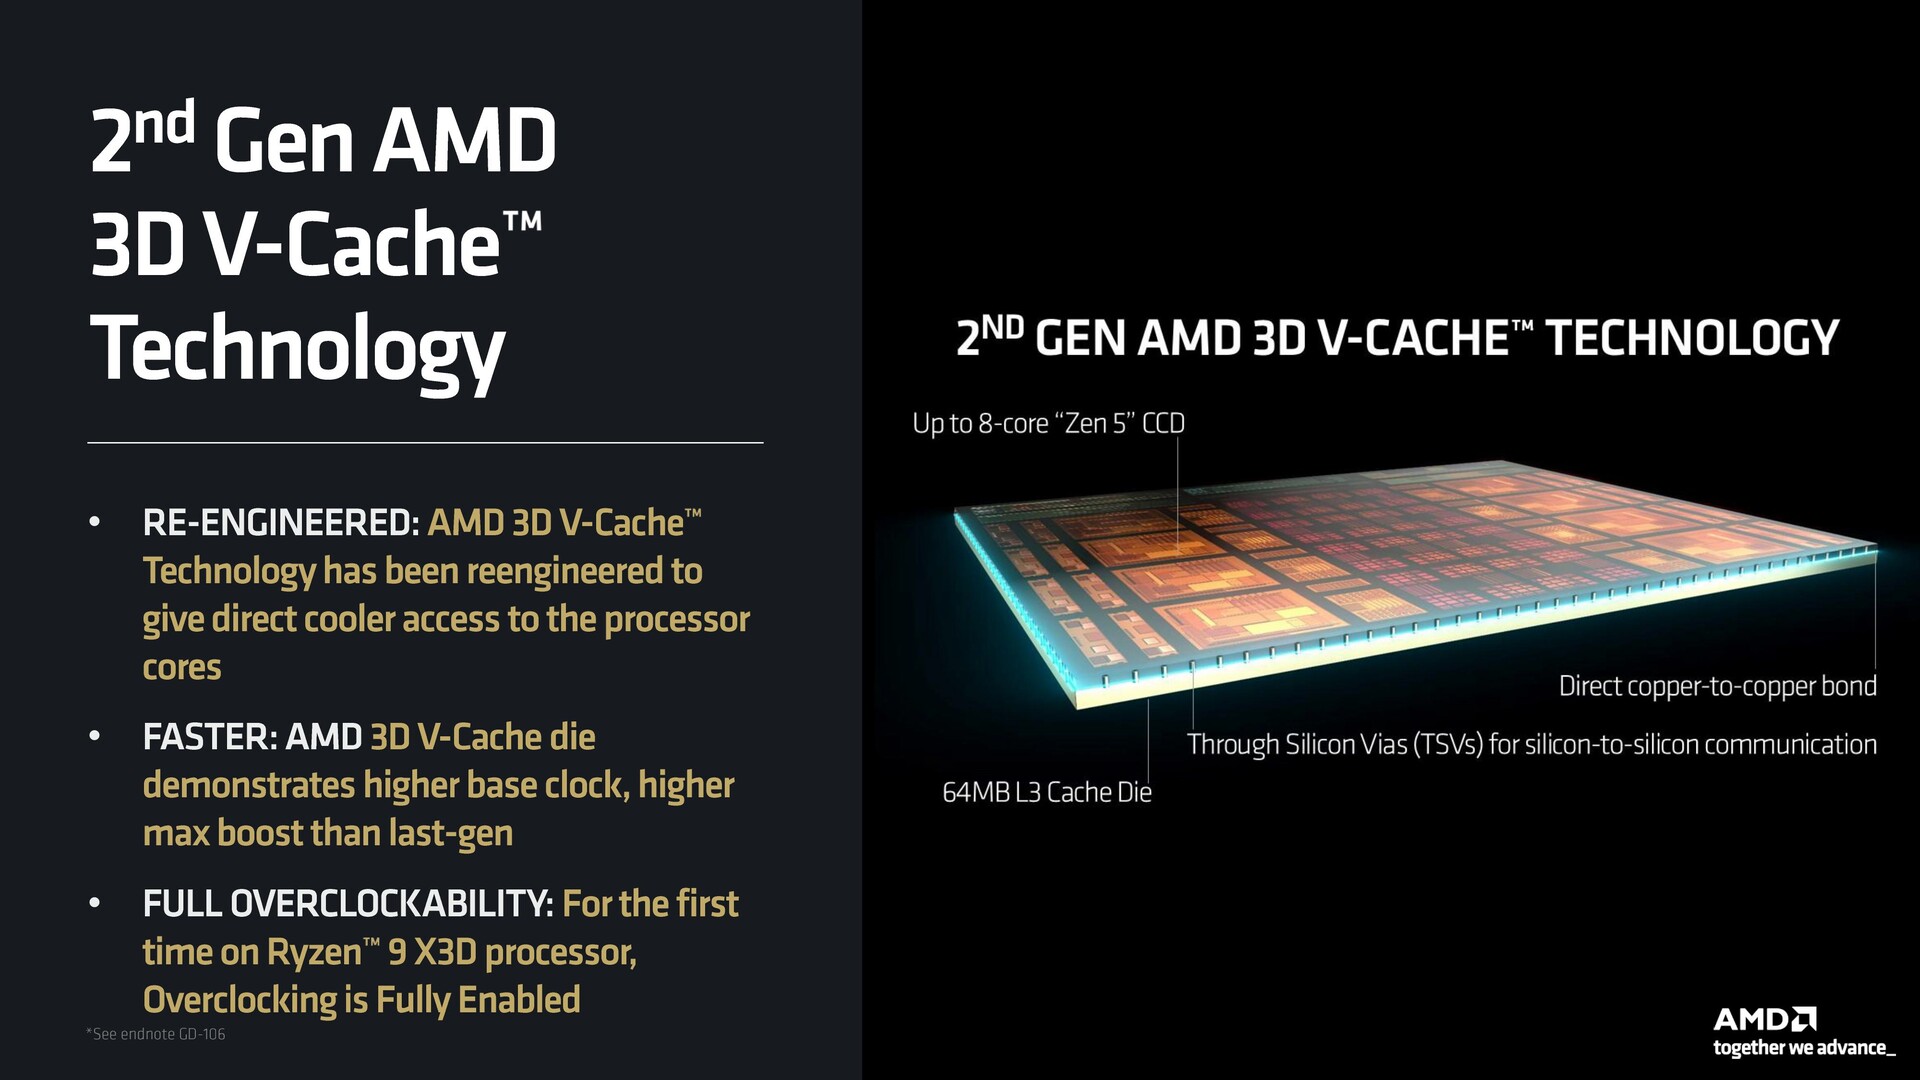
Unlike a single CCD implementation like the Ryzen 7 9800X3D, introducing an X3D variant of a 16-core 32-thread dual-CCD chip is a lot more complex.
The CPU (and the OS) should be able to park and utilize cores efficiently — send gaming workloads to the X3D CCD while using the higher clocks on the non-X3D CCD for productivity tasks.
This is easier said than done, so AMD is implementing a few technologies (or workarounds?) of its own to ensure a seamless user experience.
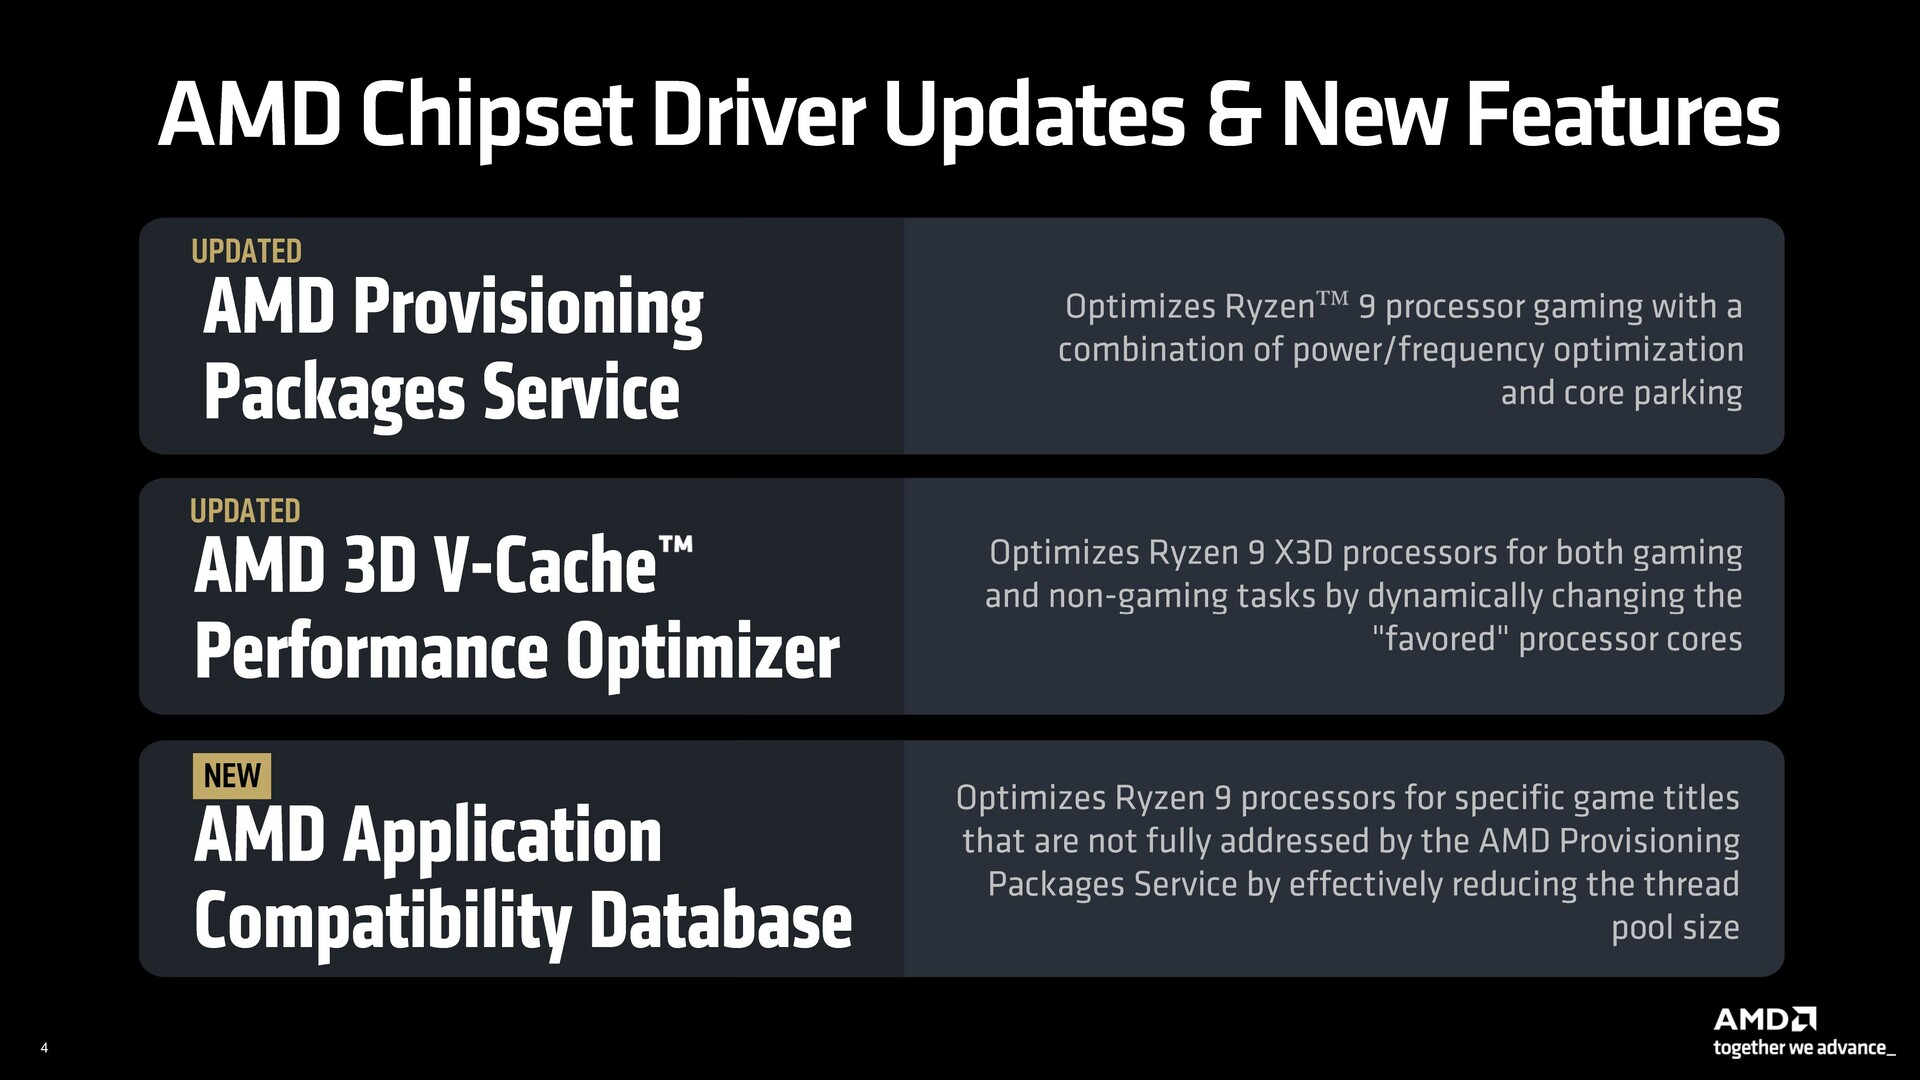
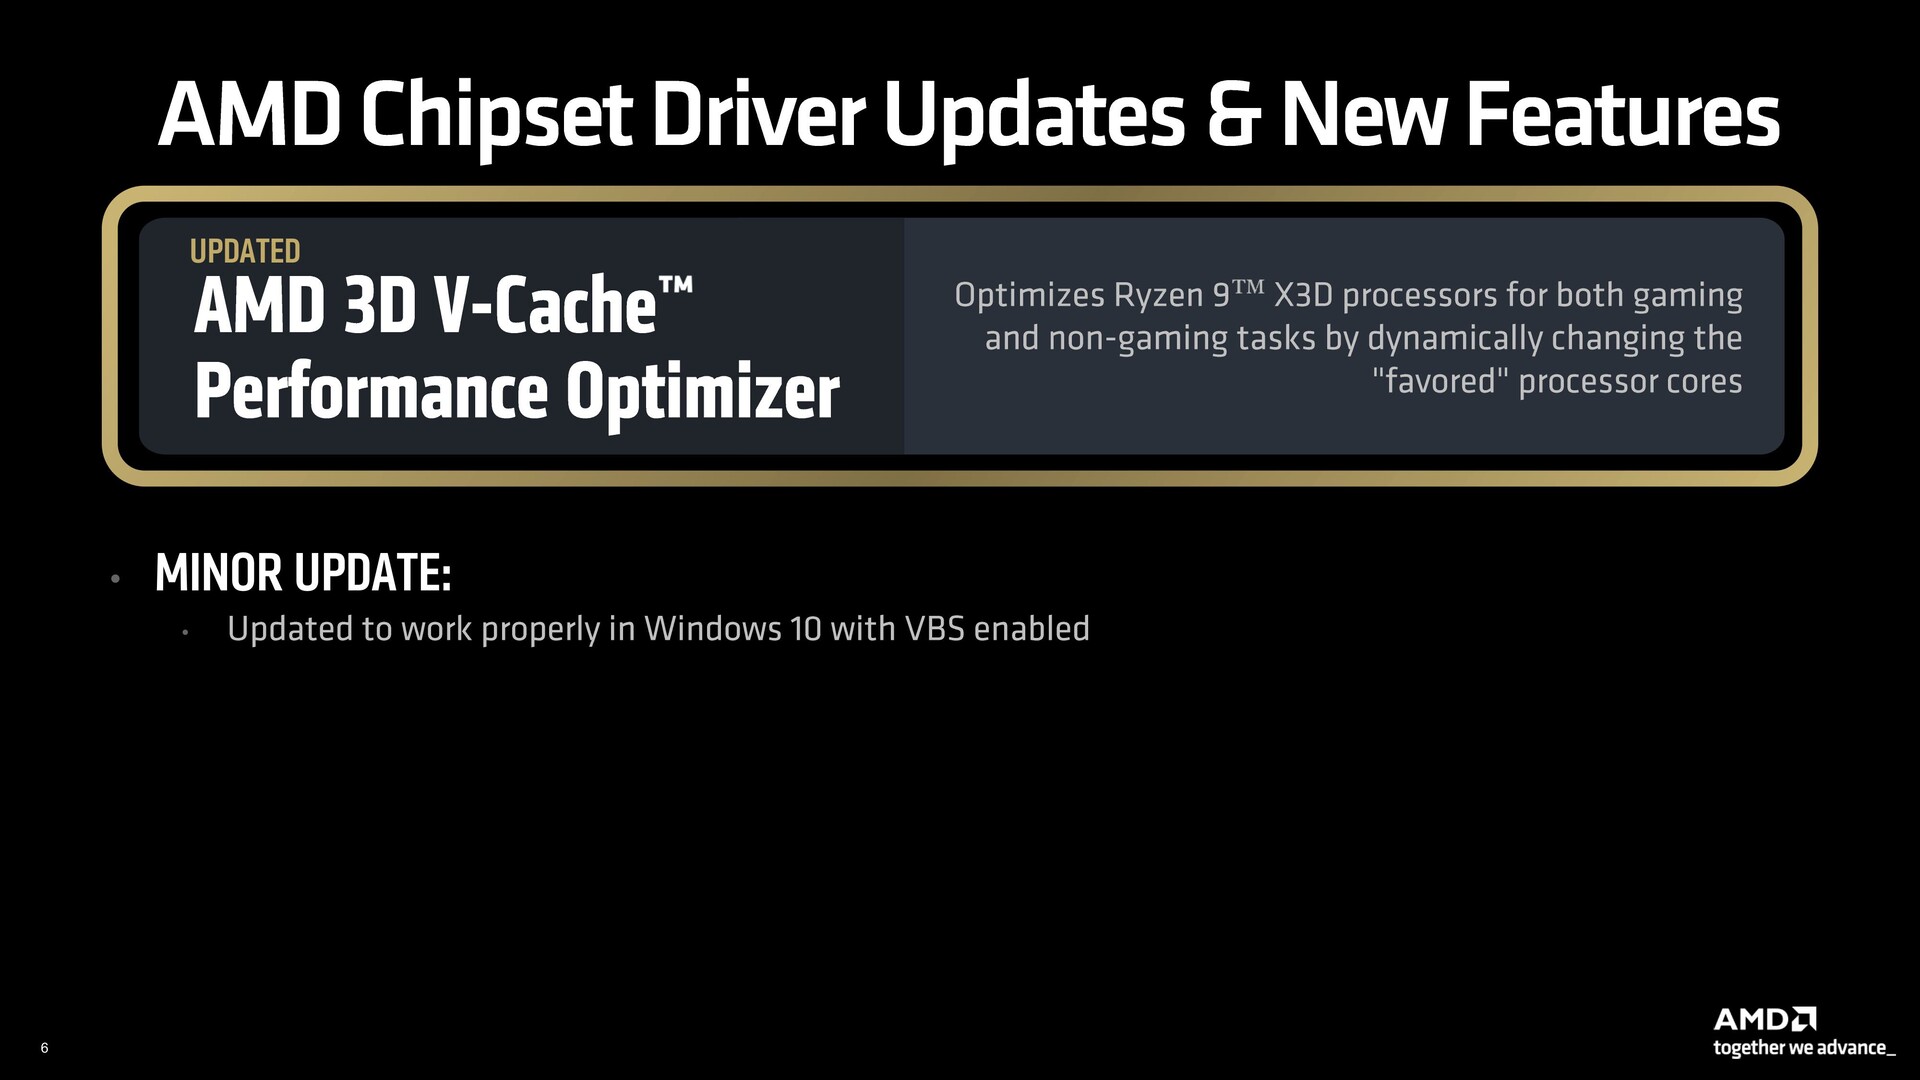
Installing the latest AMD chipset driver gets you the latest versions of provisioning packages and 3D V-cache Performance Optimizer exclusive to the Ryzen 9 series for effective core parking and CPU scheduling.
The latest provisioning packages alleviate the need to reinstall Windows should you wish to change to a non-X3D or a Ryzen 7 X3D CPU.
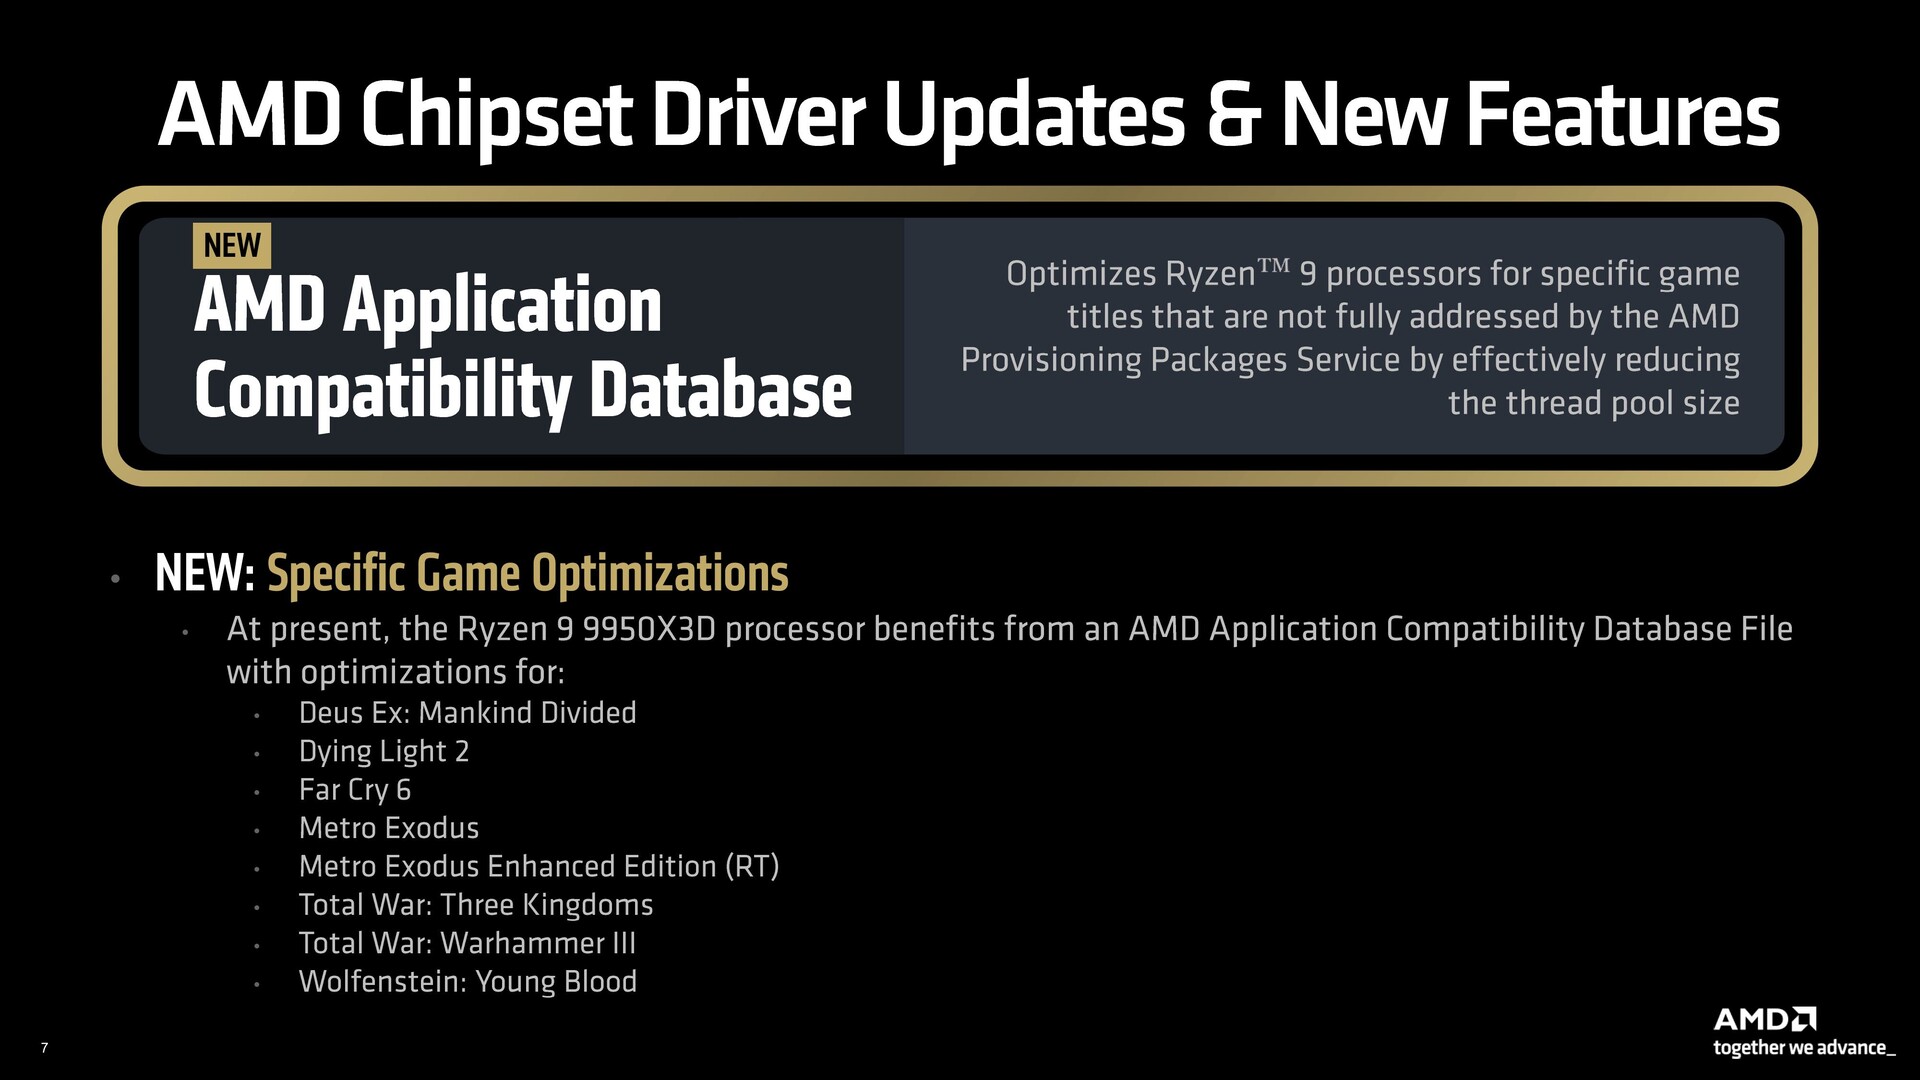
New to this generation is the AMD Application Compatibility Database, which optimizes Ryzen 9 X3D CPU performance with select titles that aren't yet capable of taking advantage of the updated provisioning packages.
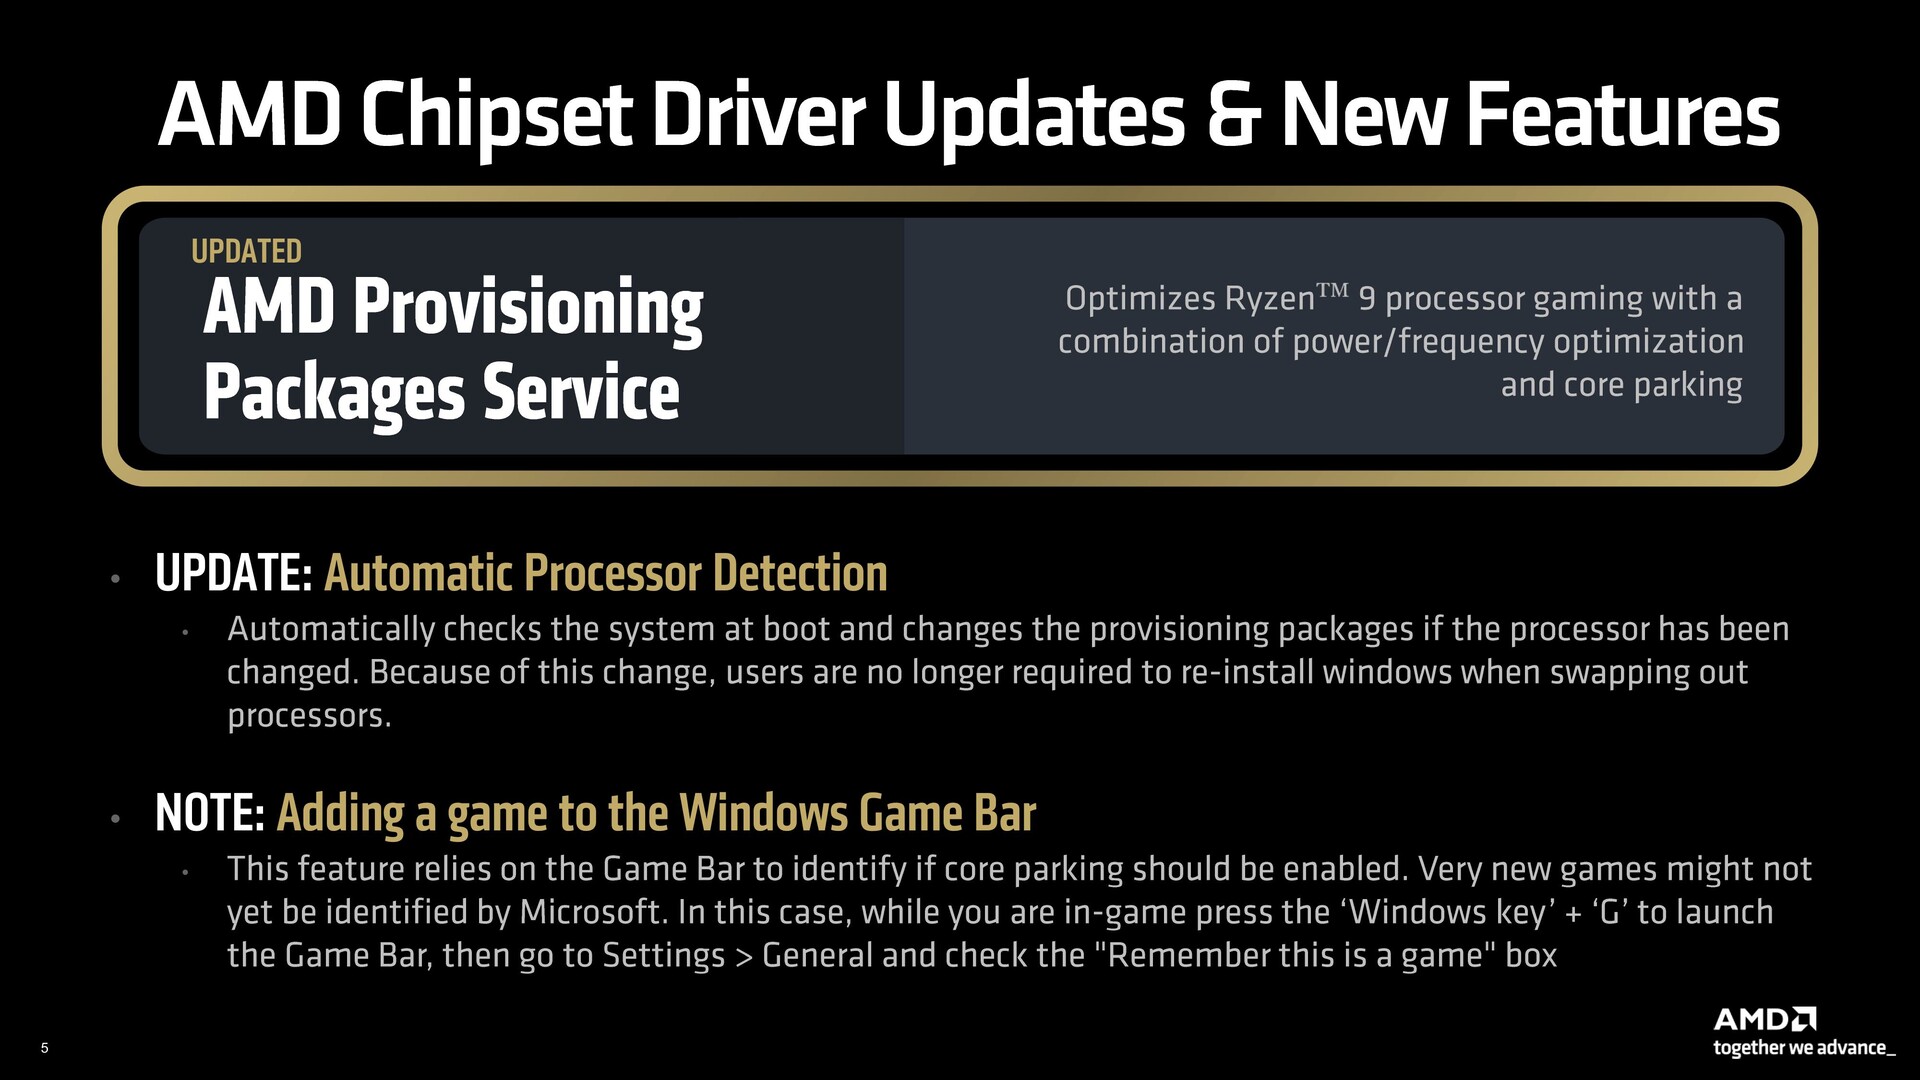
All said, the CPU lacks a direct method to identify whether a program should be classified as a game and, therefore, assigned to the X3D CCD.
Instead, AMD's drivers rely on Microsoft's logic of offering Game Bar functionality upon detecting a game, using this cue to appropriately park the cores.
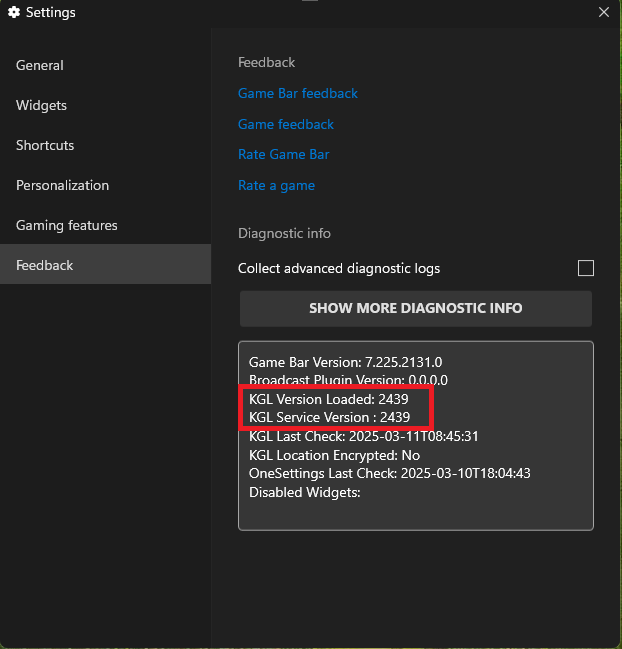
Therefore, it is imperative to have the latest version of Game Bar together with KGL version 2400 or later for optimal X3D functionality.
The test bench: Ryzen 9 9950X3D and GeForce RTX 4090 make a good pair
Our AMD Ryzen 9 9950X3D test bench is comprised of the following components:
- Cooler Master MasterFrame 700 open test bench
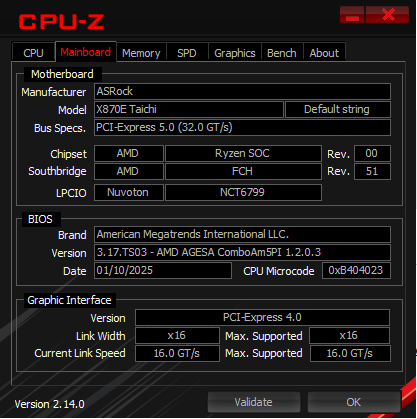
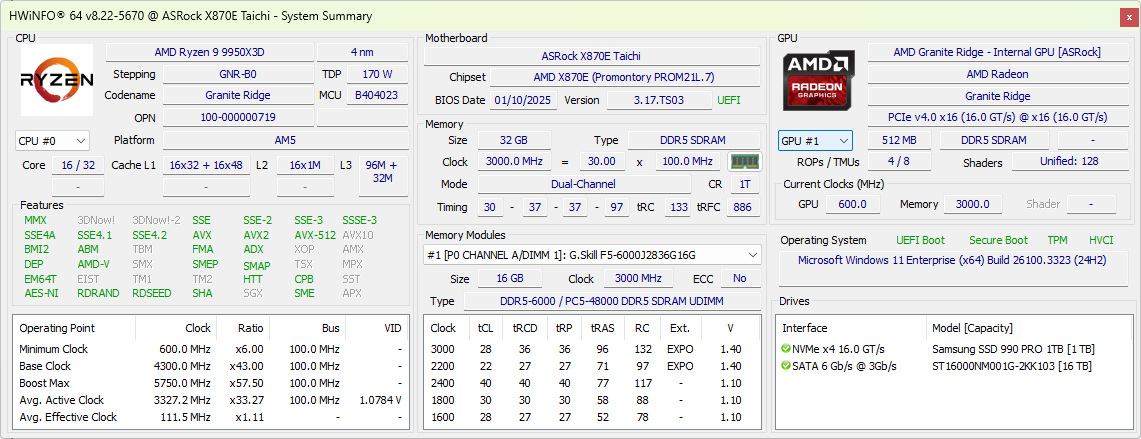
- ASRock X870E Taichi motherboard with BIOS 3.17.TS03 (AGESA ComboAM5PI 1.2.0.3) seeded to the press
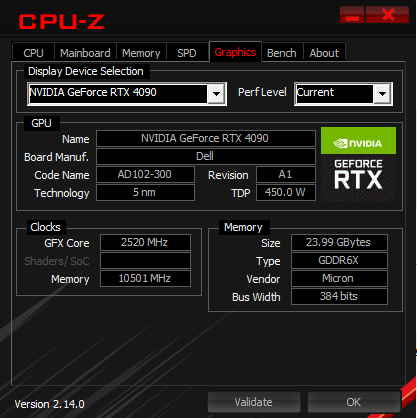
- Nvidia GeForce RTX 4090 Founders Edition GPU
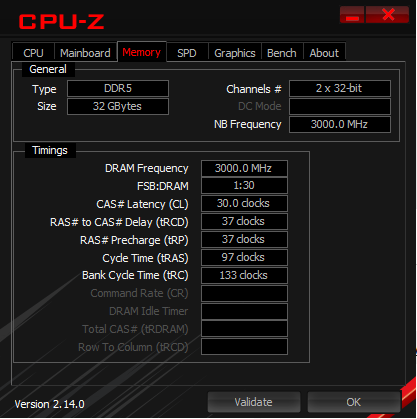
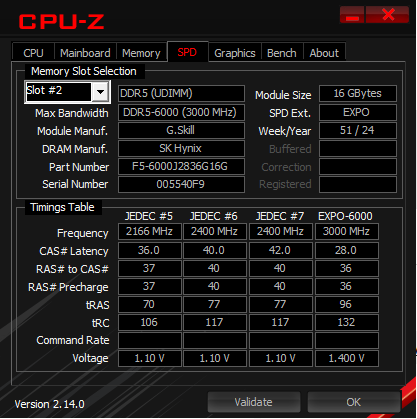
- 2x 16 GB G.Skill Trident Z5 Neo RGB DDR5-6000 RAM running in the EXPO-6000 profile with timings 30-37-37-97 at 1.40 V
- Samsung 990 Pro 1 TB PCIe Gen 4 NVMe SSD for OS, benchmarks, and games
- Alienware AW3225QF 4K 240 Hz QD-OLED monitor
- Thermaltake TH420 V2 Ultra EX ARGB AiO cooler
- Cooler Master MVE Gold V2 1250 ATX 3.0 fully modular PSU
We would like to thank AMD for providing the Ryzen 9 9950X3D test sample, motherboard, SSD, and DDR5 memory, Nvidia for the RTX 4090 Founders Edition GPU, Dell for the AW3225QF monitor, Thermaltake for the TH420 V2 Ultra EX AIO, and finally Cooler Master for the test bench and power supply.
All tests were performed on a fresh installation of Windows 11 24H2 (Build 26100.3323) together with the AMD chipset drivers 7.01.07.634 seeded to the press and Nvidia Game Ready Driver 572.70.
Given the potential for incorrect core parking with 3D V-cache on a dual-CCD chip, we went with AMD's recommendation of using the Balanced power profile in Windows. VBS was enabled and KGL version was confirmed to be 2439 in the Game Bar.
CPU performance: In the same ballpark as the Ryzen 9 9950X and Core Ultra 9 285K
The additional 3D V-cache does not confer the AMD Ryzen 9 9950X3D any perceivable advantage vis-à-vis the Ryzen 9 9950X or even the Core Ultra 9 285K in cumulative CPU benchmarks.
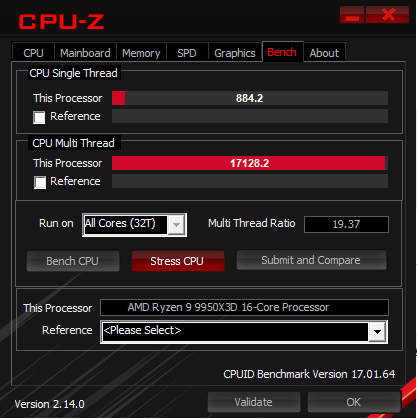
The Ryzen 9 9950X3D and the Core Ultra 9 285K are neck and neck in Cinebench single and multi-core tests. A similar pattern is seen in Geekbench scores as well.
The performance uplift coming from a Core i9-14900K or a Ryzen 9 7950X3D is also no greater than 5% overall. However, individual Cinebench results see the Ryzen 9 9950X3D leading the Ryzen 9 7950X3D by 10% and 16% in Cinebench R23 single and multi-core benchmarks, respectively.
| CPU Performance rating - Percent | |
| AMD Ryzen 9 7950X -4! | |
| AMD Ryzen 9 9950X3D | |
| AMD Ryzen 9 7950X3D -2! | |
| Intel Core i9-13900K -2! | |
| AMD Ryzen 9 9950X | |
| Intel Core Ultra 9 285K | |
| Intel Core i9-14900K -1! | |
| AMD Ryzen 9 9900X -1! | |
| AMD Ryzen 9 7900X -4! | |
| Intel Core i7-14700K | |
| AMD Ryzen 7 9800X3D | |
| Intel Core i9-12900K -3! | |
| AMD Ryzen 7 7800X3D -5! | |
| AMD Ryzen 7 9700X | |
| Intel Core i5-13600K -2! | |
| Intel Core Ultra 5 245K | |
| Intel Core i5-14600K | |
| AMD Ryzen 5 9600X -2! | |
| Intel Core i5-12600K -5! | |
* ... smaller is better
Cinebench R15 Multi Loop
The Ryzen 9 9950X3D does not come with a cooler in the box. Nevertheless, our Thermaltake TH420 V2 Ultra EX AiO cooler manages efficient heat transfer from the CPU, delivering a good, sustained performance without throttling as seen in the Cinebench R15 multi-core loop graph below.
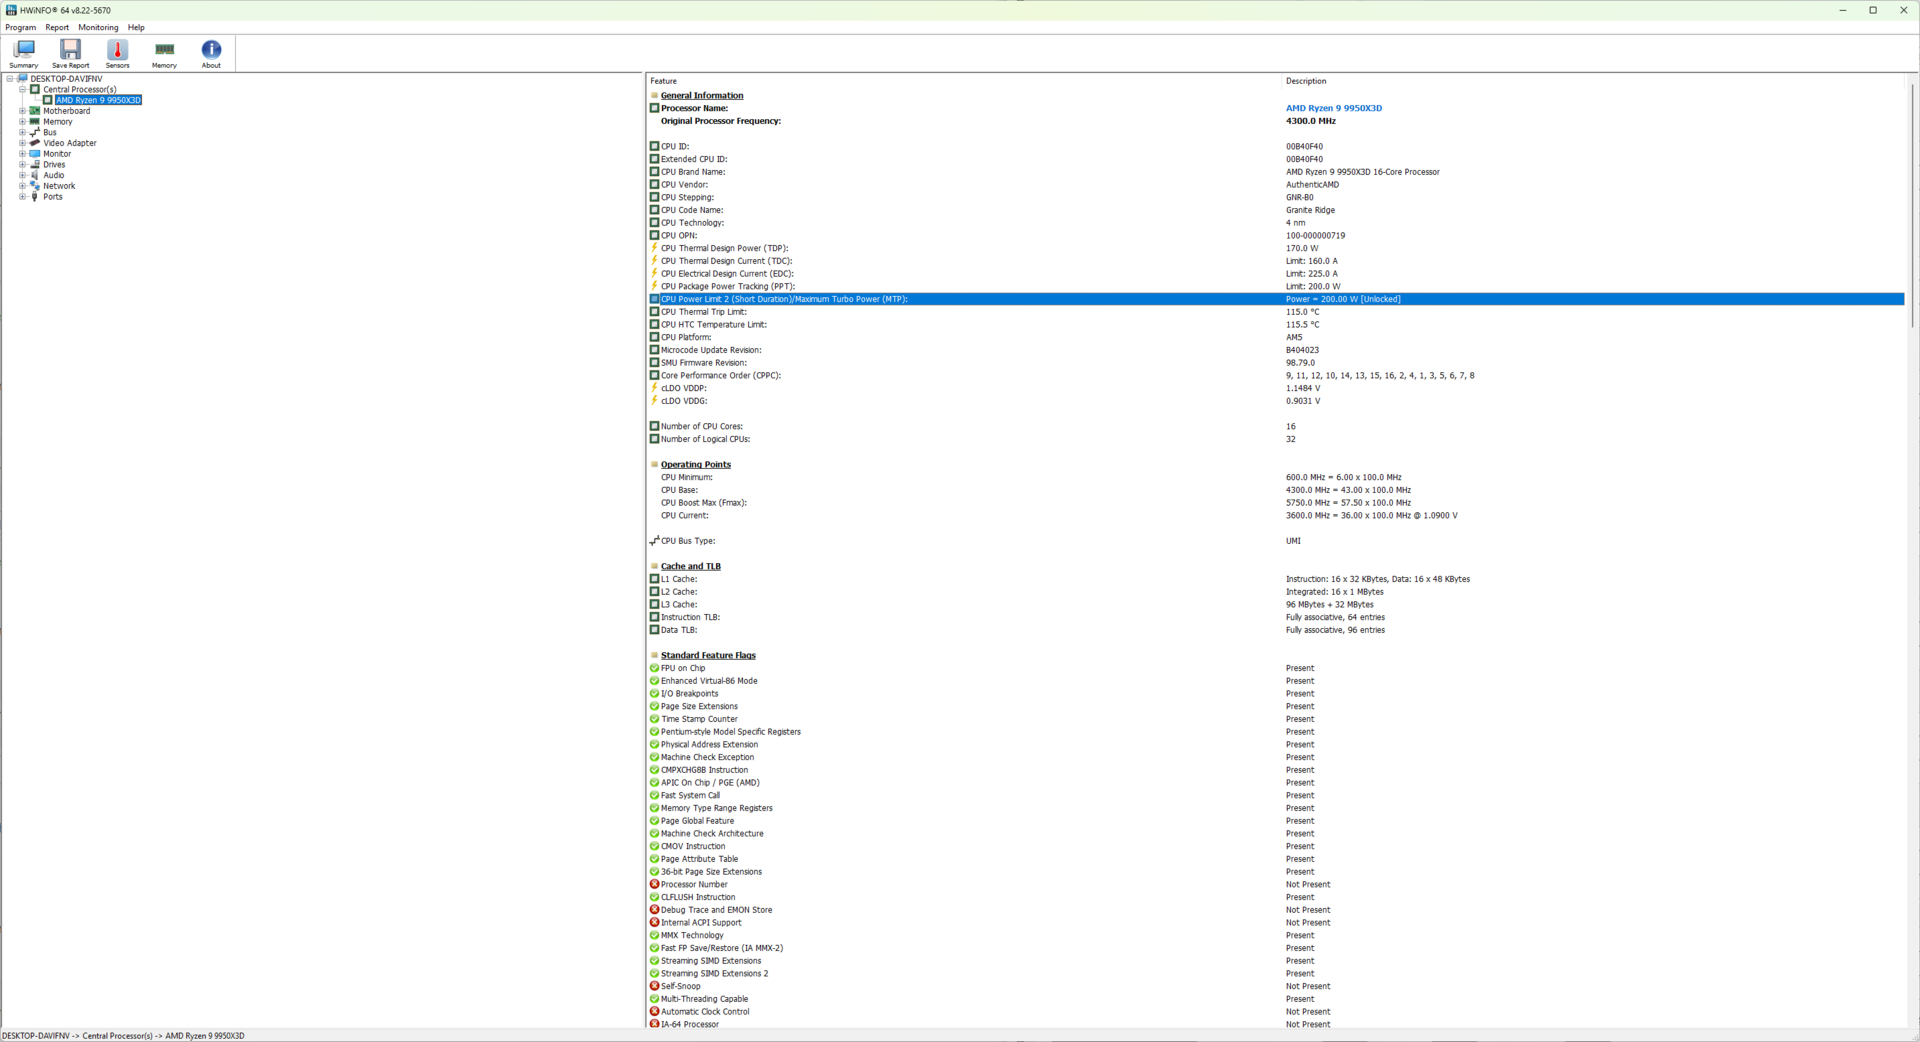
During a 30-loop Cinebench R15 multi-core test, we observe that the Ryzen 9 9950X3D can boost up to 5.5 GHz which is attained with a peak package power consumption of 200 W and max. core temperature of 75.3 °C.
Though rated for a cTDP of 170 W, the Ryzen 9 9950X3D can use up to 200 W PPT from the socket, which is quite higher compared to the 162 W limit of the Ryzen 9 7950X3D.

System performance: Tangible gains over the Ryzen 9 7950X3D
The Ryzen 9 9950X3D does not break any sweat while handling most productivity tasks. Cumulatively, we see 13% gains coming from a Ryzen 9 7950X3D while the delta from the Core Ultra 9 285K is just 6%.
Intel's chips do have an advantage in CrossMark tests, with the Ryzen 9 9950X3D trailing the Core i9-14900K by 9%. On the contrary, AMD CPUs ace most AIDA64 CPU tests save for the CPU PhotoWorxx benchmark.
3DMark 11: 1280x720 Performance Physics
3DMark: 1920x1080 Fire Strike Physics | 2560x1440 Time Spy CPU
CrossMark: Overall | Responsiveness | Creativity | Productivity
PCMark 10: Score | Essentials | Productivity | Digital Content Creation
AIDA64: FP32 Ray-Trace | FPU Julia | CPU SHA3 | CPU Queen | FPU SinJulia | FPU Mandel | CPU AES | CPU ZLib | FP64 Ray-Trace | CPU PhotoWorxx
| PCMark 10 Score | 10843 points | |
Help | ||
We used MicroBenchX to assess inter-core latency in the Ryzen 9 9950X3D with SMT disabled. We measured an average of 54.6 ns latency across both CCDs.
However, data transmission between CCD0 and CCD1 can take quite long, up to 87.5 ns. Conversely, intra-core latency within the same CCD was minimal, with the shortest time being 16.5 ns between Core 11 and Core 9 in CCD1.
| Core 0 | Core 1 | Core 2 | Core 3 | Core 4 | Core 5 | Core 6 | Core 7 | Core 8 | Core 9 | Core 10 | Core 11 | Core 12 | Core 13 | Core 14 | Core 15 | |
|---|---|---|---|---|---|---|---|---|---|---|---|---|---|---|---|---|
| Core 0 | 24 | 22.3 | 22.8 | 21.3 | 19.8 | 21.3 | 22 | 85.3 | 84.8 | 87.5 | 86.3 | 85.5 | 82.8 | 83 | 83.5 | |
| Core 1 | 24 | 22.5 | 20.3 | 21.3 | 21.3 | 20.5 | 21.5 | 83.3 | 84 | 86 | 85.8 | 82.5 | 84.3 | 84 | 85.8 | |
| Core 2 | 22.3 | 22.5 | 21.3 | 20.8 | 21.3 | 21.3 | 22 | 85.8 | 83.5 | 84.3 | 84 | 83.8 | 84.8 | 84 | 83 | |
| Core 3 | 22.8 | 20.3 | 21.3 | 21.3 | 22.5 | 23 | 20.8 | 83.3 | 82.5 | 84.5 | 85.8 | 84 | 83 | 85 | 83.8 | |
| Core 4 | 21.3 | 21.3 | 20.8 | 21.3 | 22.5 | 21 | 19.5 | 83 | 86.8 | 85 | 85.3 | 84.5 | 84 | 84 | 83 | |
| Core 5 | 19.8 | 21.3 | 21.3 | 22.5 | 22.5 | 22.5 | 21 | 84.3 | 80.5 | 84.5 | 81.5 | 85.8 | 84.3 | 85 | 84 | |
| Core 6 | 21.3 | 20.5 | 21.3 | 23 | 21 | 22.5 | 22.5 | 85.8 | 84.5 | 86 | 83.5 | 84.8 | 85 | 84.5 | 84 | |
| Core 7 | 22 | 21.5 | 22 | 20.8 | 19.5 | 21 | 22.5 | 83 | 82.3 | 83.8 | 84.8 | 85.5 | 85.8 | 84.3 | 85 | |
| Core 8 | 85.3 | 83.3 | 85.8 | 83.3 | 83 | 84.3 | 85.8 | 83 | 19.8 | 20.5 | 19.3 | 21 | 20 | 20.5 | 19 | |
| Core 9 | 84.8 | 84 | 83.5 | 82.5 | 86.8 | 80.5 | 84.5 | 82.3 | 19.8 | 19.5 | 16.5 | 18.3 | 19.8 | 19.3 | 19.8 | |
| Core 10 | 87.5 | 86 | 84.3 | 84.5 | 85 | 84.5 | 86 | 83.8 | 20.5 | 19.5 | 17.8 | 20.8 | 21.3 | 22 | 20.3 | |
| Core 11 | 86.3 | 85.8 | 84 | 85.8 | 85.3 | 81.5 | 83.5 | 84.8 | 19.3 | 16.5 | 17.8 | 21.5 | 19.3 | 19 | 19.5 | |
| Core 12 | 85.5 | 82.5 | 83.8 | 84 | 84.5 | 85.8 | 84.8 | 85.5 | 21 | 18.3 | 20.8 | 21.5 | 19.3 | 19 | 23 | |
| Core 13 | 82.8 | 84.3 | 84.8 | 83 | 84 | 84.3 | 85 | 85.8 | 20 | 19.8 | 21.3 | 19.3 | 19.3 | 21.8 | 16.8 | |
| Core 14 | 83 | 84 | 84 | 85 | 84 | 85 | 84.5 | 84.3 | 20.5 | 19.3 | 22 | 19 | 19 | 21.8 | 20 | |
| Core 15 | 83.5 | 85.8 | 83 | 83.8 | 83 | 84 | 84 | 85 | 19 | 19.8 | 20.3 | 19.5 | 23 | 16.8 | 20 |
| AIDA64 Memory Performance rating - Percent | |
| Intel Core i9-12900K -1! | |
| Intel Core i9-14900K | |
| Intel Core i7-14700K | |
| Intel Core i5-12600K -1! | |
| Intel Core i5-14600K | |
| Intel Core Ultra 9 285K | |
| AMD Ryzen 9 7950X3D | |
| AMD Ryzen 9 7950X | |
| AMD Ryzen 9 9950X | |
| Intel Core i9-13900K | |
| AMD Ryzen 9 9900X | |
| AMD Ryzen 9 7900X | |
| AMD Ryzen 9 9950X3D | |
| AMD Ryzen 7 7800X3D | |
| Intel Core i5-13600K | |
| AMD Ryzen 7 9700X | |
| AMD Ryzen 5 9600X | |
| AMD Ryzen 7 9800X3D | |
| Intel Core Ultra 5 245K | |
* ... smaller is better
3D and gaming performance: Gnaws right at the Ryzen 7 9800X3D's heels
For some reason, the Ryzen 9 9950X3D performs rather poorly in 3DMark graphics tests. We've seen this before with the Ryzen 9 7950X3D and the Core Ultra 9 285K as well, but the latest AMD Zen 5 CPU falls behind even further.
| 3DMark 11 Performance | 68617 points | |
| 3DMark Fire Strike Score | 59444 points | |
| 3DMark Time Spy Score | 28882 points | |
Help | ||
720p gaming may be passé, but it still makes academic sense to test at this resolution to see whether the CPU poses any bottleneck for gaming.
In highly CPU-limited resolutions, the Ryzen 9 9950X3D comes ever so close to the reigning gaming champion, the Ryzen 7 9800X3D, in cumulative gaming tests at 720p Low, 1080p Low, and 1080p Ultra.
The Ryzen 9 9950X3D is 10% faster overall than the Core i9-14900K, with good gains seen in titles like Borderlands 3, Shadow of the Tomb Raider, Far Cry 5, and Metro Exodus (non-Enhanced version).
| CPU Limit Gaming Performance rating - Percent | |
| AMD Ryzen 7 9800X3D | |
| AMD Ryzen 9 9950X3D | |
| AMD Ryzen 7 7800X3D | |
| AMD Ryzen 9 7950X3D | |
| Intel Core i9-14900K | |
| AMD Ryzen 7 9700X | |
| AMD Ryzen 9 9900X | |
| AMD Ryzen 5 9600X | |
| AMD Ryzen 9 9950X -2! | |
| Intel Core i5-14600K | |
| Intel Core Ultra 9 285K | |
| Intel Core i7-14700K | |
| Intel Core Ultra 5 245K | |
| The Witcher 3 | |
| 1024x768 Low Graphics & Postprocessing | |
| AMD Ryzen 7 9800X3D | |
| AMD Ryzen 9 7950X3D | |
| AMD Ryzen 7 7800X3D | |
| AMD Ryzen 9 9950X3D | |
| Intel Core i9-14900K | |
| AMD Ryzen 9 9950X | |
| AMD Ryzen 5 9600X | |
| AMD Ryzen 7 9700X | |
| AMD Ryzen 9 9900X | |
| Intel Core i7-14700K | |
| Intel Core i5-14600K | |
| Intel Core Ultra 9 285K | |
| Intel Core Ultra 5 245K | |
| 1920x1080 Ultra Graphics & Postprocessing (HBAO+) | |
| Intel Core i5-14600K | |
| AMD Ryzen 7 7800X3D | |
| Intel Core i9-14900K | |
| Intel Core Ultra 5 245K | |
| AMD Ryzen 9 7950X3D | |
| AMD Ryzen 7 9800X3D | |
| Intel Core Ultra 9 285K | |
| AMD Ryzen 9 9950X3D | |
| Intel Core i7-14700K | |
| AMD Ryzen 5 9600X | |
| AMD Ryzen 9 9950X | |
| AMD Ryzen 7 9700X | |
| AMD Ryzen 9 9900X | |
| Borderlands 3 | |
| 1280x720 Very Low Overall Quality (DX11) | |
| AMD Ryzen 9 9950X3D | |
| AMD Ryzen 7 9800X3D | |
| AMD Ryzen 7 7800X3D | |
| AMD Ryzen 9 7950X3D | |
| Intel Core i9-14900K | |
| AMD Ryzen 7 9700X | |
| AMD Ryzen 9 9900X | |
| AMD Ryzen 9 9950X | |
| Intel Core i5-14600K | |
| AMD Ryzen 5 9600X | |
| Intel Core i7-14700K | |
| Intel Core Ultra 9 285K | |
| Intel Core Ultra 5 245K | |
| 1920x1080 Very Low Overall Quality (DX11) | |
| AMD Ryzen 7 9800X3D | |
| AMD Ryzen 9 9950X3D | |
| AMD Ryzen 9 7950X3D | |
| AMD Ryzen 7 7800X3D | |
| Intel Core i9-14900K | |
| AMD Ryzen 9 9900X | |
| AMD Ryzen 7 9700X | |
| AMD Ryzen 9 9950X | |
| Intel Core i5-14600K | |
| AMD Ryzen 5 9600X | |
| Intel Core i7-14700K | |
| Intel Core Ultra 9 285K | |
| Intel Core Ultra 5 245K | |
| 1920x1080 Badass Overall Quality (DX11) | |
| AMD Ryzen 7 9800X3D | |
| AMD Ryzen 9 9950X3D | |
| AMD Ryzen 9 7950X3D | |
| AMD Ryzen 7 7800X3D | |
| Intel Core i9-14900K | |
| AMD Ryzen 7 9700X | |
| AMD Ryzen 9 9900X | |
| Intel Core i5-14600K | |
| AMD Ryzen 9 9950X | |
| AMD Ryzen 5 9600X | |
| Intel Core i7-14700K | |
| Intel Core Ultra 9 285K | |
| Intel Core Ultra 5 245K | |
At higher resolutions, the Ryzen 7 7800X3D gains a miniscule edge over the Ryzen 9 9950X3D. The Ryzen 9 9950X3D and the Core i9-14900K throw up largely similar average fps numbers in cumulative QHD and 4K gaming.
However, the presence of 3D V-cache helps in better 1% and 0.1% lows which should lend to a much smoother gaming experience at these settings.
| QHD and 4K Gaming Performance rating - Percent | |
| AMD Ryzen 7 9800X3D | |
| AMD Ryzen 7 7800X3D | |
| AMD Ryzen 9 9950X3D | |
| AMD Ryzen 9 7950X3D | |
| Intel Core i9-14900K | |
| Intel Core i5-14600K | |
| AMD Ryzen 9 9900X | |
| AMD Ryzen 7 9700X | |
| AMD Ryzen 5 9600X | |
| AMD Ryzen 9 9950X -2! | |
| Intel Core i7-14700K | |
| Intel Core Ultra 9 285K | |
| Intel Core Ultra 5 245K | |
| F1 22 | |
| 2560x1440 Ultra High Preset AA:T AF:16x | |
| AMD Ryzen 7 9800X3D | |
| AMD Ryzen 7 7800X3D | |
| AMD Ryzen 5 9600X | |
| Intel Core i9-14900K | |
| AMD Ryzen 9 9900X | |
| Intel Core i5-14600K | |
| AMD Ryzen 7 9700X | |
| AMD Ryzen 9 7950X3D | |
| AMD Ryzen 9 9950X3D | |
| AMD Ryzen 9 9950X | |
| Intel Core Ultra 5 245K | |
| Intel Core i7-14700K | |
| Intel Core Ultra 9 285K | |
| 3840x2160 Ultra High Preset AA:T AF:16x | |
| AMD Ryzen 9 9900X | |
| AMD Ryzen 7 9800X3D | |
| Intel Core Ultra 5 245K | |
| AMD Ryzen 5 9600X | |
| AMD Ryzen 7 9700X | |
| AMD Ryzen 7 7800X3D | |
| AMD Ryzen 9 9950X | |
| Intel Core i5-14600K | |
| Intel Core i9-14900K | |
| AMD Ryzen 9 9950X3D | |
| Intel Core Ultra 9 285K | |
| AMD Ryzen 9 7950X3D | |
| Intel Core i7-14700K | |
| X-Plane 11.11 - 3840x2160 high (fps_test=3) | |
| AMD Ryzen 7 7800X3D | |
| AMD Ryzen 9 7950X3D | |
| AMD Ryzen 9 9950X3D | |
| AMD Ryzen 7 9800X3D | |
| AMD Ryzen 7 9700X | |
| AMD Ryzen 5 9600X | |
| Intel Core i9-14900K | |
| AMD Ryzen 9 9900X | |
| Intel Core i7-14700K | |
| Intel Core i5-14600K | |
| AMD Ryzen 9 9950X | |
| Intel Core Ultra 9 285K | |
| Intel Core Ultra 5 245K | |
| Dota 2 Reborn - 3840x2160 ultra (3/3) best looking | |
| AMD Ryzen 7 9800X3D | |
| AMD Ryzen 9 9950X3D | |
| AMD Ryzen 7 7800X3D | |
| AMD Ryzen 9 7950X3D | |
| AMD Ryzen 9 9950X | |
| AMD Ryzen 7 9700X | |
| AMD Ryzen 9 9900X | |
| Intel Core i9-14900K | |
| AMD Ryzen 5 9600X | |
| Intel Core i5-14600K | |
| Intel Core i7-14700K | |
| Intel Core Ultra 9 285K | |
| Intel Core Ultra 5 245K | |
| The Witcher 3 - 3840x2160 Ultra Graphics & Postprocessing (HBAO+) | |
| Intel Core i9-14900K | |
| Intel Core Ultra 5 245K | |
| AMD Ryzen 7 9800X3D | |
| AMD Ryzen 7 7800X3D | |
| Intel Core i5-14600K | |
| AMD Ryzen 9 7950X3D | |
| AMD Ryzen 5 9600X | |
| Intel Core i7-14700K | |
| Intel Core Ultra 9 285K | |
| AMD Ryzen 7 9700X | |
| AMD Ryzen 9 9950X3D | |
| AMD Ryzen 9 9900X | |
| AMD Ryzen 9 9950X | |
| Borderlands 3 | |
| 2560x1440 Badass Overall Quality (DX11) | |
| AMD Ryzen 7 9800X3D | |
| AMD Ryzen 7 7800X3D | |
| AMD Ryzen 9 7950X3D | |
| AMD Ryzen 9 9950X3D | |
| Intel Core i9-14900K | |
| AMD Ryzen 7 9700X | |
| AMD Ryzen 9 9900X | |
| Intel Core i5-14600K | |
| AMD Ryzen 9 9950X | |
| Intel Core i7-14700K | |
| AMD Ryzen 5 9600X | |
| Intel Core Ultra 9 285K | |
| Intel Core Ultra 5 245K | |
| 3840x2160 Badass Overall Quality (DX11) | |
| AMD Ryzen 7 9800X3D | |
| Intel Core i9-14900K | |
| AMD Ryzen 7 7800X3D | |
| AMD Ryzen 9 7950X3D | |
| Intel Core i5-14600K | |
| Intel Core i7-14700K | |
| AMD Ryzen 9 9900X | |
| AMD Ryzen 5 9600X | |
| AMD Ryzen 7 9700X | |
| AMD Ryzen 9 9950X3D | |
| AMD Ryzen 9 9950X | |
| Intel Core Ultra 9 285K | |
| Intel Core Ultra 5 245K | |
| Shadow of the Tomb Raider | |
| 2560x1440 Highest Preset AA:T | |
| AMD Ryzen 7 7800X3D | |
| AMD Ryzen 9 7950X3D | |
| AMD Ryzen 7 9800X3D | |
| AMD Ryzen 9 9950X3D | |
| Intel Core i9-14900K | |
| AMD Ryzen 9 9900X | |
| AMD Ryzen 9 9950X | |
| AMD Ryzen 7 9700X | |
| AMD Ryzen 5 9600X | |
| Intel Core i5-14600K | |
| Intel Core i7-14700K | |
| Intel Core Ultra 9 285K | |
| Intel Core Ultra 5 245K | |
| 3840x2160 Highest Preset AA:T | |
| Intel Core i9-14900K | |
| Intel Core i5-14600K | |
| AMD Ryzen 5 9600X | |
| AMD Ryzen 7 7800X3D | |
| AMD Ryzen 9 7950X3D | |
| Intel Core Ultra 5 245K | |
| AMD Ryzen 9 9900X | |
| AMD Ryzen 7 9700X | |
| AMD Ryzen 7 9800X3D | |
| Intel Core i7-14700K | |
| AMD Ryzen 9 9950X3D | |
| Intel Core Ultra 9 285K | |
| AMD Ryzen 9 9950X | |
| Strange Brigade | |
| 2560x1440 ultra AA:ultra AF:16 | |
| Intel Core i9-14900K | |
| AMD Ryzen 7 9800X3D | |
| AMD Ryzen 7 9700X | |
| AMD Ryzen 7 7800X3D | |
| AMD Ryzen 5 9600X | |
| Intel Core i5-14600K | |
| AMD Ryzen 9 9900X | |
| AMD Ryzen 9 7950X3D | |
| Intel Core Ultra 9 285K | |
| AMD Ryzen 9 9950X3D | |
| Intel Core Ultra 5 245K | |
| Intel Core i7-14700K | |
| 3840x2160 ultra AA:ultra AF:16 | |
| Intel Core i9-14900K | |
| AMD Ryzen 7 7800X3D | |
| Intel Core i5-14600K | |
| AMD Ryzen 7 9800X3D | |
| AMD Ryzen 5 9600X | |
| AMD Ryzen 9 9900X | |
| AMD Ryzen 9 7950X3D | |
| Intel Core Ultra 5 245K | |
| AMD Ryzen 7 9700X | |
| Intel Core Ultra 9 285K | |
| AMD Ryzen 9 9950X3D | |
| Intel Core i7-14700K | |
AMD Ryzen 9 9950X3D with Nvidia GeForce RTX 4090
| low | med. | high | ultra | QHD DLSS | QHD | 4K DLSS | 4K | |
|---|---|---|---|---|---|---|---|---|
| The Witcher 3 (2015) | 839 | 790 | 638 | 290 | 247 | 274 | ||
| Dota 2 Reborn (2015) | 370.5 | 329.9 | 322.9 | 280.5 | 275.6 | |||
| Final Fantasy XV Benchmark (2018) | 236 | 237 | 234 | 222 | 160.1 | |||
| X-Plane 11.11 (2018) | 233 | 220 | 189.3 | 153.9 | ||||
| Far Cry 5 (2018) | 348 | 310 | 302 | 287 | 274 | 179 | ||
| Strange Brigade (2018) | 680 | 575 | 565 | 552 | 499 | 276 | ||
| Shadow of the Tomb Raider (2018) | 407 | 386 | 381 | 365 | 312 | 180 | ||
| Metro Exodus (2019) | 458 | 337 | 281 | 226 | 194.1 | 132.7 | ||
| Borderlands 3 (2019) | 330 | 294 | 270 | 248 | 223 | 131.2 | ||
| F1 22 (2022) | 498 | 541 | 458 | 219 | 158.5 | 83.3 | ||
| Baldur's Gate 3 (2023) | 453 | 365 | 317 | 316 | 237 | 207 | 137.6 | |
| Cyberpunk 2077 (2023) | 261 | 262 | 238 | 212 | 165 | 148.7 | 73.4 | |
| Assassin's Creed Mirage (2023) | 298 | 272 | 264 | 214 | 181 | 158 | 126 | |
| F1 24 (2024) | 501 | 547 | 519 | 239 | 237 | 169.4 | 146.7 | 90.5 |
| Black Myth: Wukong (2024) | 212 | 163 | 130 | 84 | 92 | 68 | 70 | 42 |
Power consumption: Trumps the Core Ultra 9 285K in multi-core efficiency
Despite the added 3D V-cache, the Ryzen 9 9950X3D and the Ryzen 9 9950X show more or less similar power draws from the wall in Cinebench single and multi-core tests.
Nevertheless, the Ryzen 9 9950X3D is still the efficiency champ with a whopping 44% lower power consumption than the Core i9-14900K in Cinebench R15 multi.
Power Consumption: External monitor
| Power Consumption / Cinebench R15 Multi (external Monitor) | |
| Intel Core i9-14900K, NVIDIA GeForce RTX 4090 | |
| Intel Core i7-14700K, NVIDIA GeForce RTX 4090 | |
| Intel Core Ultra 9 285K, NVIDIA GeForce RTX 4090 (Idle: 76.2 W) | |
| Intel Core i5-14600K, NVIDIA GeForce RTX 4090 | |
| AMD Ryzen 9 9950X, NVIDIA GeForce RTX 4090 (Idle: 100 W) | |
| AMD Ryzen 9 9950X3D, NVIDIA GeForce RTX 4090 | |
| AMD Ryzen 9 9900X, NVIDIA GeForce RTX 4090 (Idle: 85.1 W) | |
| AMD Ryzen 9 7950X3D, NVIDIA GeForce RTX 4090 | |
| Intel Core Ultra 5 245K, NVIDIA GeForce RTX 4090 | |
| AMD Ryzen 7 9800X3D, NVIDIA GeForce RTX 4090 | |
| AMD Ryzen 5 9600X, NVIDIA GeForce RTX 4090 | |
| AMD Ryzen 7 7800X3D, NVIDIA GeForce RTX 4090 | |
| AMD Ryzen 7 9700X, NVIDIA GeForce RTX 4090 (Idle: 83 W) | |
| Power Consumption / Cinebench R20 Single (external Monitor) | |
| Intel Core i7-14700K, NVIDIA GeForce RTX 4090 | |
| AMD Ryzen 9 9950X, NVIDIA GeForce RTX 4090 (100) | |
| AMD Ryzen 9 9950X3D, NVIDIA GeForce RTX 4090 | |
| AMD Ryzen 9 9900X, NVIDIA GeForce RTX 4090 (85.1) | |
| AMD Ryzen 7 9700X, NVIDIA GeForce RTX 4090 (83) | |
| Intel Core Ultra 9 285K, NVIDIA GeForce RTX 4090 (76.2) | |
| Power Consumption / Cinebench R20 Multi (external Monitor) | |
| Intel Core i7-14700K, NVIDIA GeForce RTX 4090 | |
| Intel Core Ultra 9 285K, NVIDIA GeForce RTX 4090 (76.2) | |
| AMD Ryzen 9 9950X, NVIDIA GeForce RTX 4090 (100) | |
| AMD Ryzen 9 9950X3D, NVIDIA GeForce RTX 4090 | |
| AMD Ryzen 9 9900X, NVIDIA GeForce RTX 4090 (85.1) | |
| AMD Ryzen 7 9700X, NVIDIA GeForce RTX 4090 (83) | |
| Power Consumption / Cinebench R23 Single (external Monitor) | |
| AMD Ryzen 7 7800X3D, NVIDIA GeForce RTX 4090 | |
| Intel Core i7-14700K, NVIDIA GeForce RTX 4090 | |
| Intel Core i9-14900K, NVIDIA GeForce RTX 4090 | |
| Intel Core i5-14600K, NVIDIA GeForce RTX 4090 | |
| AMD Ryzen 5 9600X, NVIDIA GeForce RTX 4090 | |
| AMD Ryzen 9 9950X, NVIDIA GeForce RTX 4090 (100) | |
| AMD Ryzen 9 9950X3D, NVIDIA GeForce RTX 4090 | |
| AMD Ryzen 9 9900X, NVIDIA GeForce RTX 4090 (85.1) | |
| AMD Ryzen 7 9800X3D, NVIDIA GeForce RTX 4090 | |
| Intel Core Ultra 5 245K, NVIDIA GeForce RTX 4090 | |
| AMD Ryzen 7 9700X, NVIDIA GeForce RTX 4090 (83) | |
| Intel Core Ultra 9 285K, NVIDIA GeForce RTX 4090 (76.2) | |
| Power Consumption / Cinebench 2024 Single Power (external Monitor) | |
| AMD Ryzen 9 9950X3D, NVIDIA GeForce RTX 4090 | |
| AMD Ryzen 9 9950X, NVIDIA GeForce RTX 4090 | |
| AMD Ryzen 9 9900X, NVIDIA GeForce RTX 4090 | |
| AMD Ryzen 7 9700X, NVIDIA GeForce RTX 4090 | |
| Intel Core Ultra 9 285K, NVIDIA GeForce RTX 4090 | |
| Power Consumption / Cinebench 2024 Multi Power (external Monitor) | |
| Intel Core Ultra 9 285K, NVIDIA GeForce RTX 4090 (76.2) | |
| AMD Ryzen 9 9950X, NVIDIA GeForce RTX 4090 (100) | |
| AMD Ryzen 9 9950X3D, NVIDIA GeForce RTX 4090 | |
| AMD Ryzen 9 9900X, NVIDIA GeForce RTX 4090 (85.1) | |
| AMD Ryzen 7 9700X, NVIDIA GeForce RTX 4090 (83) | |
| Power Consumption / Prime95 V2810 Stress (external Monitor) | |
| Intel Core i9-14900K, NVIDIA GeForce RTX 4090 | |
| Intel Core i7-14700K, NVIDIA GeForce RTX 4090 | |
| Intel Core Ultra 9 285K, NVIDIA GeForce RTX 4090 (Idle: 76.2 W) | |
| Intel Core i5-14600K, NVIDIA GeForce RTX 4090 | |
| AMD Ryzen 9 9950X3D, NVIDIA GeForce RTX 4090 | |
| AMD Ryzen 9 9950X, NVIDIA GeForce RTX 4090 (Idle: 100 W) | |
| AMD Ryzen 9 9900X, NVIDIA GeForce RTX 4090 (Idle: 85.1 W) | |
| AMD Ryzen 9 7950X3D, NVIDIA GeForce RTX 4090 | |
| AMD Ryzen 7 9800X3D, NVIDIA GeForce RTX 4090 | |
| Intel Core Ultra 5 245K, NVIDIA GeForce RTX 4090 | |
| AMD Ryzen 7 7800X3D, NVIDIA GeForce RTX 4090 | |
| AMD Ryzen 5 9600X, NVIDIA GeForce RTX 4090 | |
| AMD Ryzen 7 9700X, NVIDIA GeForce RTX 4090 (Idle: 83 W) | |
| Power Consumption / The Witcher 3 ultra (external Monitor) | |
| Intel Core i5-14600K, NVIDIA GeForce RTX 4090 | |
| Intel Core i9-14900K, NVIDIA GeForce RTX 4090 | |
| Intel Core i7-14700K, NVIDIA GeForce RTX 4090 | |
| AMD Ryzen 9 7950X3D, NVIDIA GeForce RTX 4090 | |
| AMD Ryzen 7 7800X3D, NVIDIA GeForce RTX 4090 | |
| AMD Ryzen 9 9950X3D, NVIDIA GeForce RTX 4090 | |
| AMD Ryzen 7 9800X3D, NVIDIA GeForce RTX 4090 | |
| Intel Core Ultra 5 245K, NVIDIA GeForce RTX 4090 | |
| AMD Ryzen 9 9950X, NVIDIA GeForce RTX 4090 (Idle: 100 W) | |
| AMD Ryzen 9 9900X, NVIDIA GeForce RTX 4090 (Idle: 85.1 W) | |
| Intel Core Ultra 9 285K, NVIDIA GeForce RTX 4090 (Idle: 76.2 W) | |
| AMD Ryzen 7 9700X, NVIDIA GeForce RTX 4090 (Idle: 83 W) | |
| Power Consumption / Cyberpunk 2077 FHD ultra no FSR (external Monitor) | |
| AMD Ryzen 9 9950X3D, NVIDIA GeForce RTX 4090 | |
| AMD Ryzen 9 9950X, NVIDIA GeForce RTX 4090 | |
| AMD Ryzen 5 9600X, NVIDIA GeForce RTX 4090 | |
| AMD Ryzen 7 9800X3D, NVIDIA GeForce RTX 4090 | |
| AMD Ryzen 9 9900X, NVIDIA GeForce RTX 4090 | |
| AMD Ryzen 7 9700X, NVIDIA GeForce RTX 4090 | |
| Intel Core Ultra 9 285K, NVIDIA GeForce RTX 4090 | |
| Intel Core Ultra 5 245K, NVIDIA GeForce RTX 4090 | |
* ... smaller is better
Intel has made some significant efficiency strides with Arrow Lake-S still, but the Ryzen 9 9950X3D and other Zen 5 CPUs still have the edge in multi-core power efficiency.
The Ryzen 9 9950X3D manages up to a 5% higher power efficiency over the Ryzen 9 9950X in Cinebench multi-core tests.
Both CPUs are tied when it comes to gaming in The Witcher 3 at 1080p Ultra, but the Core Ultra 9 285K find itself to be 10% more efficient in this regard.
| Power Consumption / Cinebench 2024 Single Power Efficiency - external Monitor | |
| Intel Core Ultra 9 285K, NVIDIA GeForce RTX 4090 | |
| AMD Ryzen 7 9700X, NVIDIA GeForce RTX 4090 | |
| AMD Ryzen 9 9900X, NVIDIA GeForce RTX 4090 | |
| AMD Ryzen 9 9950X3D, NVIDIA GeForce RTX 4090 | |
| AMD Ryzen 9 9950X, NVIDIA GeForce RTX 4090 | |
| Power Consumption / Cinebench 2024 Multi Power Efficiency - external Monitor | |
| AMD Ryzen 9 9950X3D, NVIDIA GeForce RTX 4090 | |
| Intel Core Ultra 9 285K, NVIDIA GeForce RTX 4090 | |
| AMD Ryzen 9 9950X, NVIDIA GeForce RTX 4090 | |
| AMD Ryzen 7 9700X, NVIDIA GeForce RTX 4090 | |
| AMD Ryzen 9 9900X, NVIDIA GeForce RTX 4090 | |
Notebookcheck's impressions of the AMD Ryzen 9 9950X3D
The AMD Ryzen 9 9950X3D brings 3D V-cache goodness to the flagship 16-core 32-thread part. While the addition of 3D V-cache does help the Ryzen 9 9950X3D match the venerable Ryzen 7 9800X3D in CPU-limited titles, the advantages at higher resolutions don't become immediately apparent.
Notwithstanding the fact that you will have to cough up an extra $50 over the Ryzen 9 9950X's SEP for little to no performance or efficiency gains.
Transparency
The selection of devices to be reviewed is made by our editorial team. The test sample was provided to the author as a loan by the manufacturer or retailer for the purpose of this review. The lender had no influence on this review, nor did the manufacturer receive a copy of this review before publication. There was no obligation to publish this review. As an independent media company, Notebookcheck is not subjected to the authority of manufacturers, retailers or publishers.
This is how Notebookcheck is testing
Every year, Notebookcheck independently reviews hundreds of laptops and smartphones using standardized procedures to ensure that all results are comparable. We have continuously developed our test methods for around 20 years and set industry standards in the process. In our test labs, high-quality measuring equipment is utilized by experienced technicians and editors. These tests involve a multi-stage validation process. Our complex rating system is based on hundreds of well-founded measurements and benchmarks, which maintains objectivity. Further information on our test methods can be found here.
