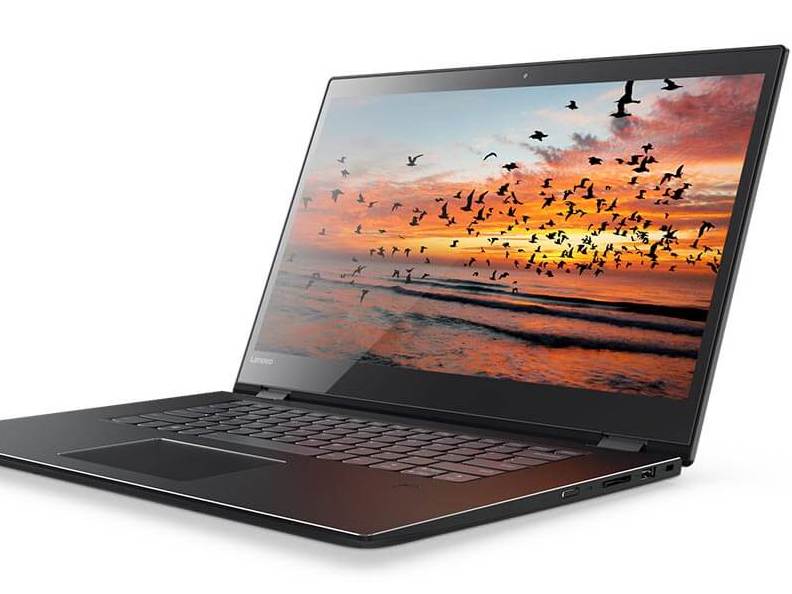
Lenovo Flex 5 15 (i7-8550U, GeForce MX130) Convertible Review
Lenovo kickstarted its 2-in-1 laptops with the flagship Yoga series years ago. In order to bring laptop convertibles to the hands of more consumers, however, the manufacturer later launched the affordable Flex series with the same 2-in-1 features but at lower starting prices. The Flex 5 15 is Lenovo's latest 15.6-inch convertible laptop that starts at just $700 USD compared to $1200 or more for the Dell XPS 15 9575 or HP Spectre x360 15. It carries much of the same hardware as found on costlier alternatives like an 8th gen Intel Kaby Lake-R CPU, discrete Nvidia GeForce graphics, and even support for WACOM-enabled pens. While a good deal on paper, our review below will reveal why the Lenovo convertible is a hard recommendation even at this low of a price.
The Flex 5 15 competes against other budget 15-inch convertibles like the Asus VivoBook Flip 15, HP Envy x360 15, Acer Spin 5 SP515, Dell Inspiron 15 5578, and the HP Pavilion 15 x360. Pricier alternatives include the Asus Zenbook Flip 15 and the aforementioned XPS 15 9575 and Spectre x360 15.
Case
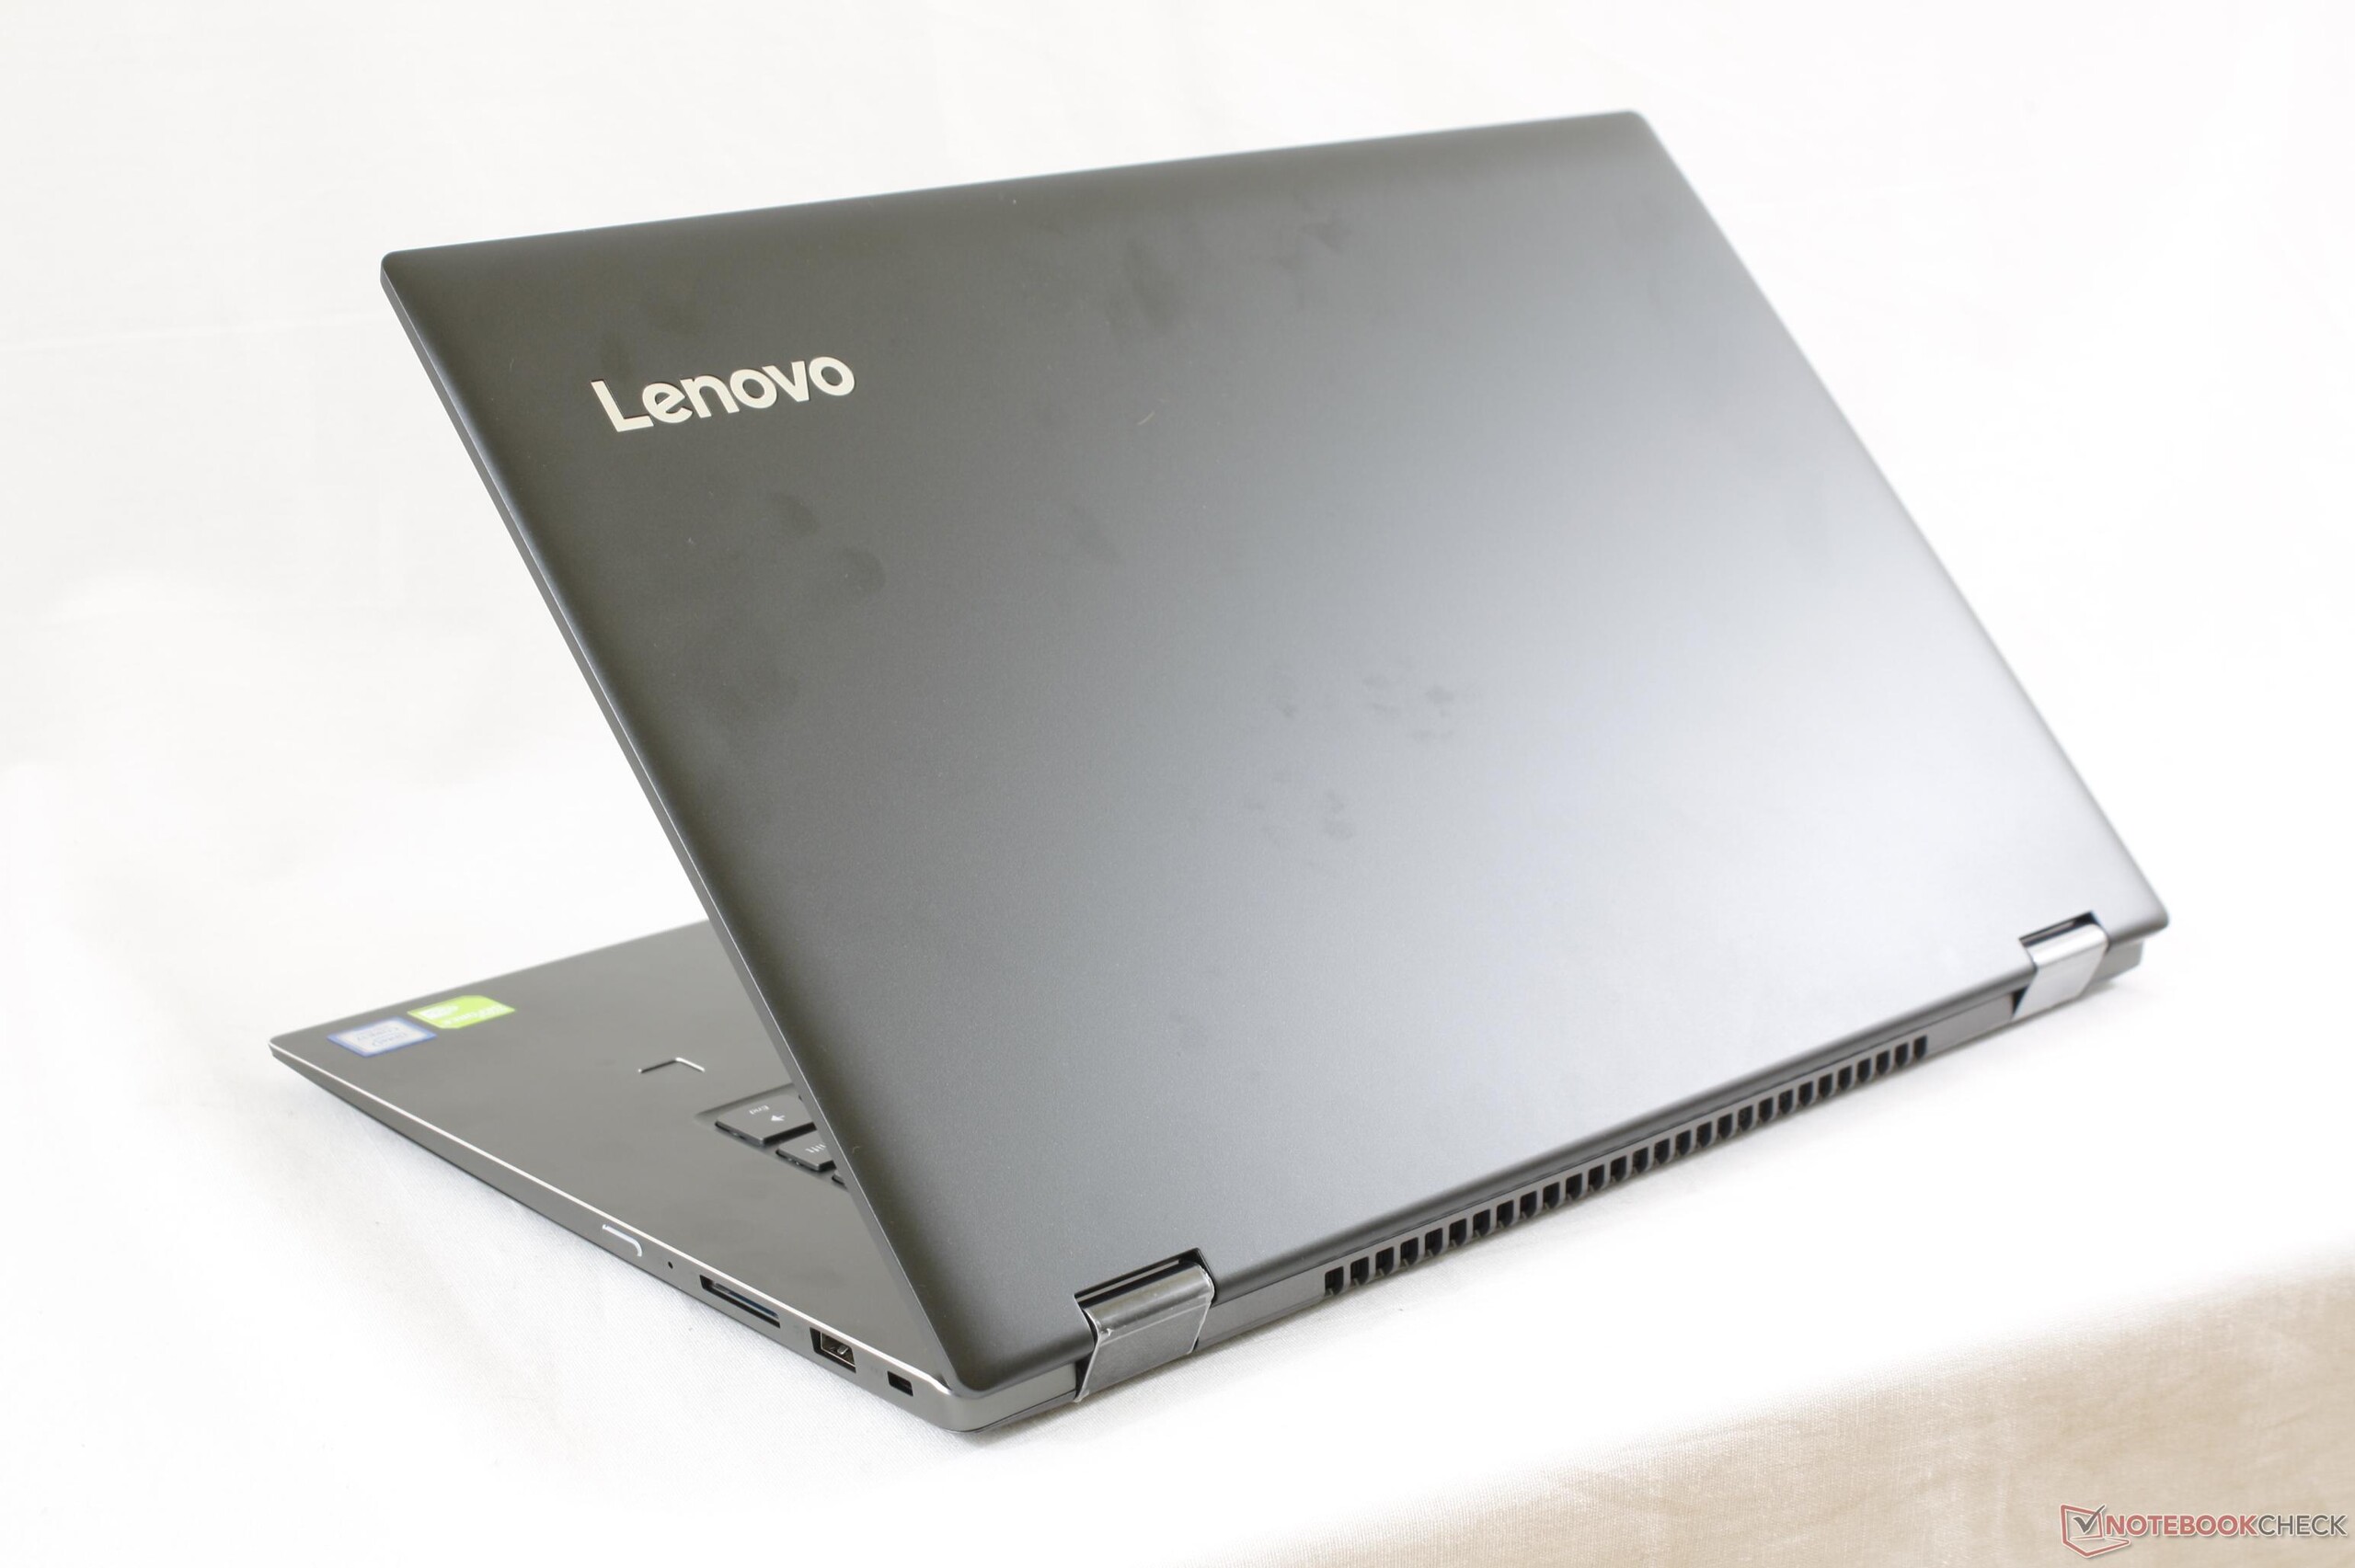
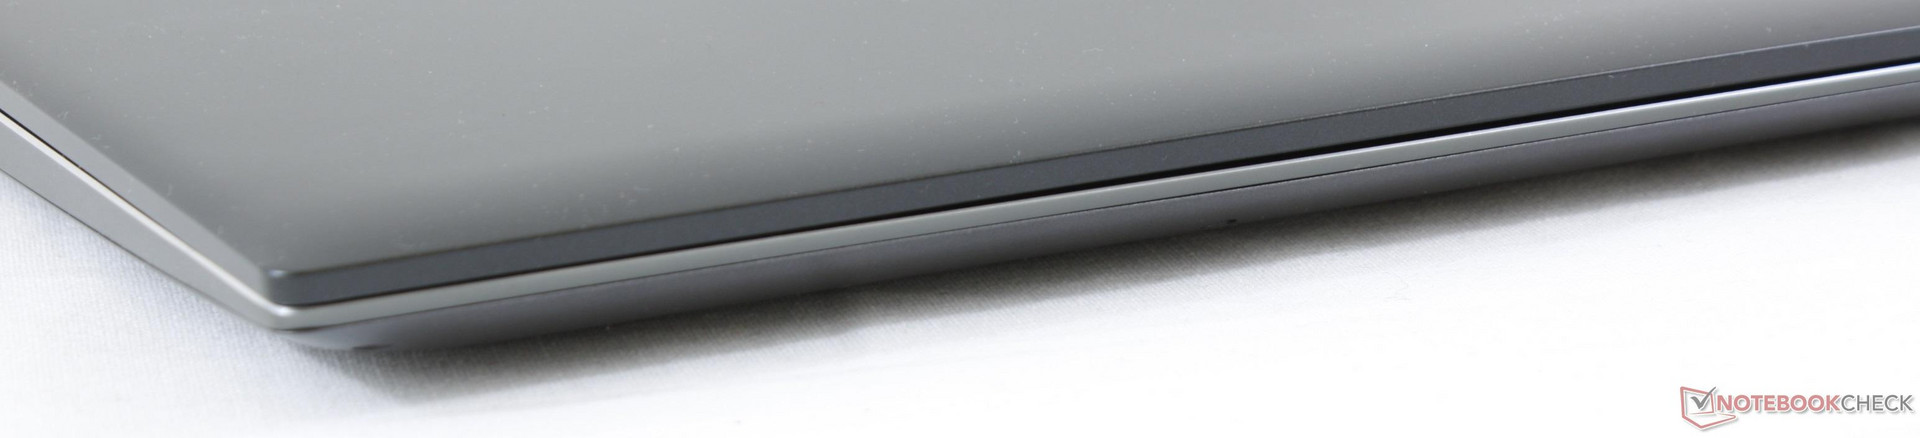
The chassis is reasonably rigid given its budget-mainstream price. There is minimal flexing around the aluminum palm rests and even the lid for a stronger first impression than the HP Pavilion x360 15. Its weakest spot is down the center of the outer lid where warping is most visible. Thankfully, it's not significant enough to affect day-to-day use.
Unlike the weighty higher-end XPS 15 9575 or Spectre x360 15, the Lenovo convertible feels hollow. It's tough to shake off the impression that the system could have been thinner or sleeker because of all the empty space inside. Its design is on the dull side and more reminiscent to the Ideapad series of laptops rather than the pricier Yoga series.
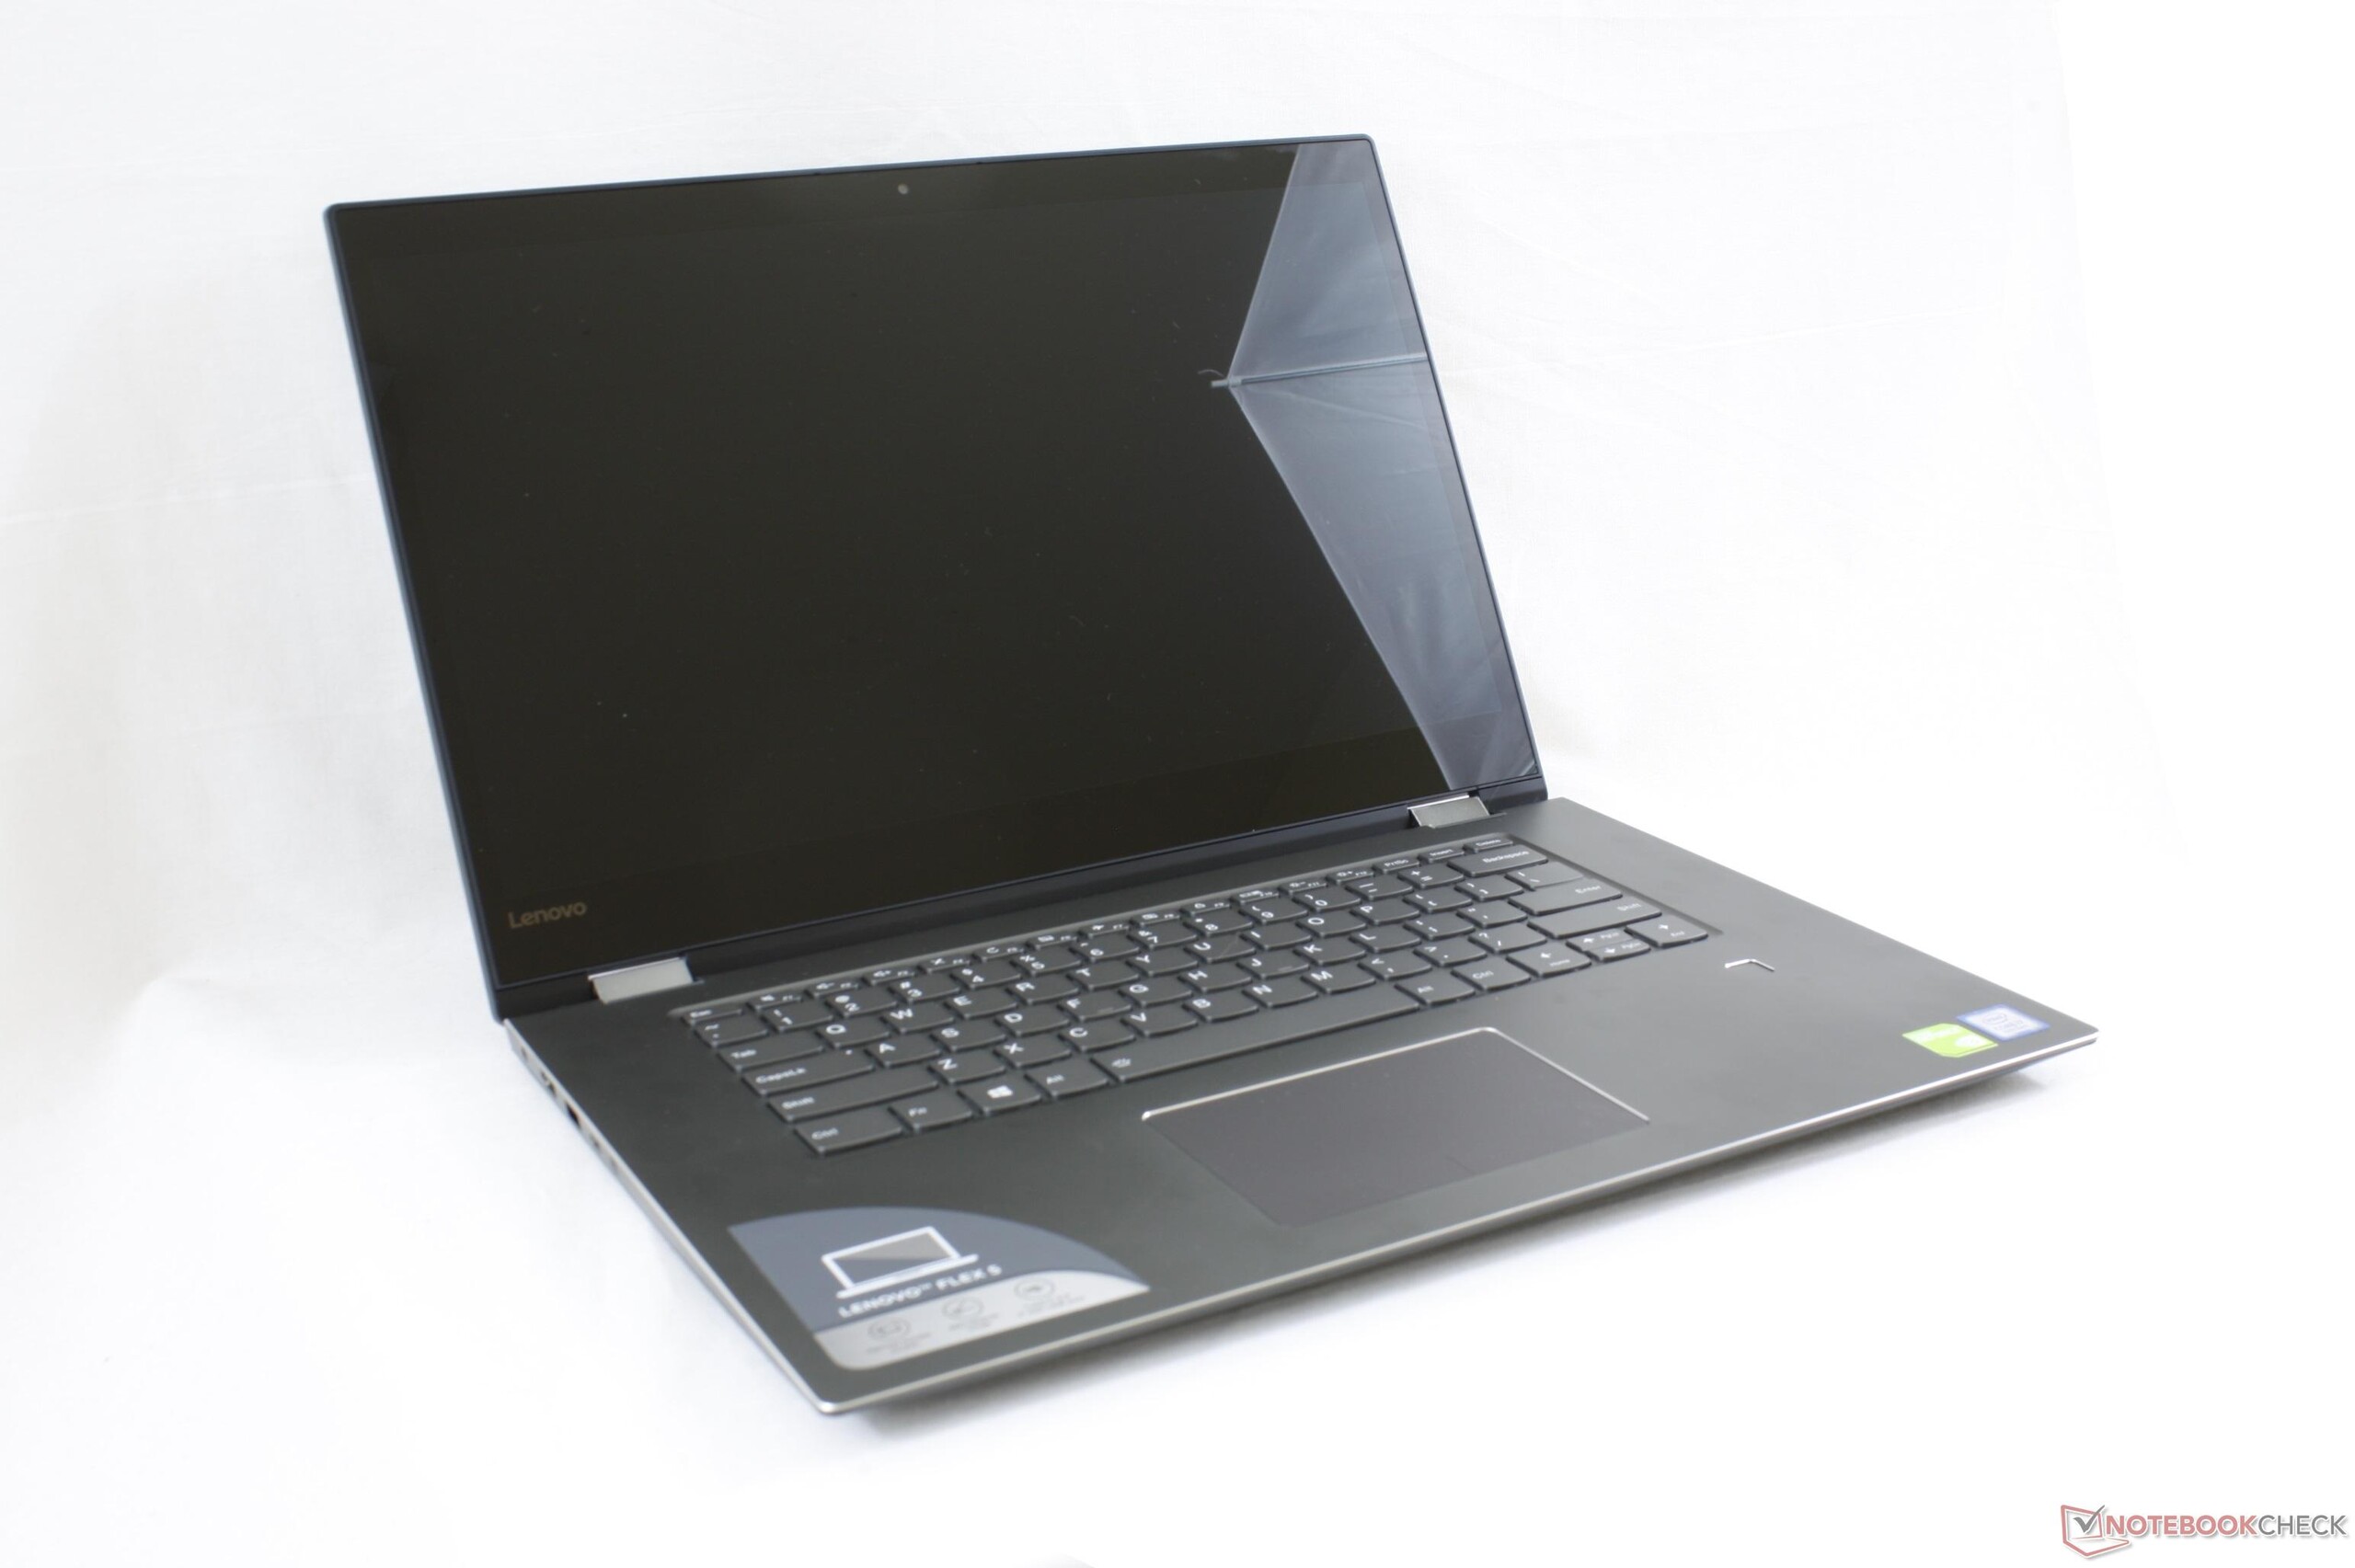
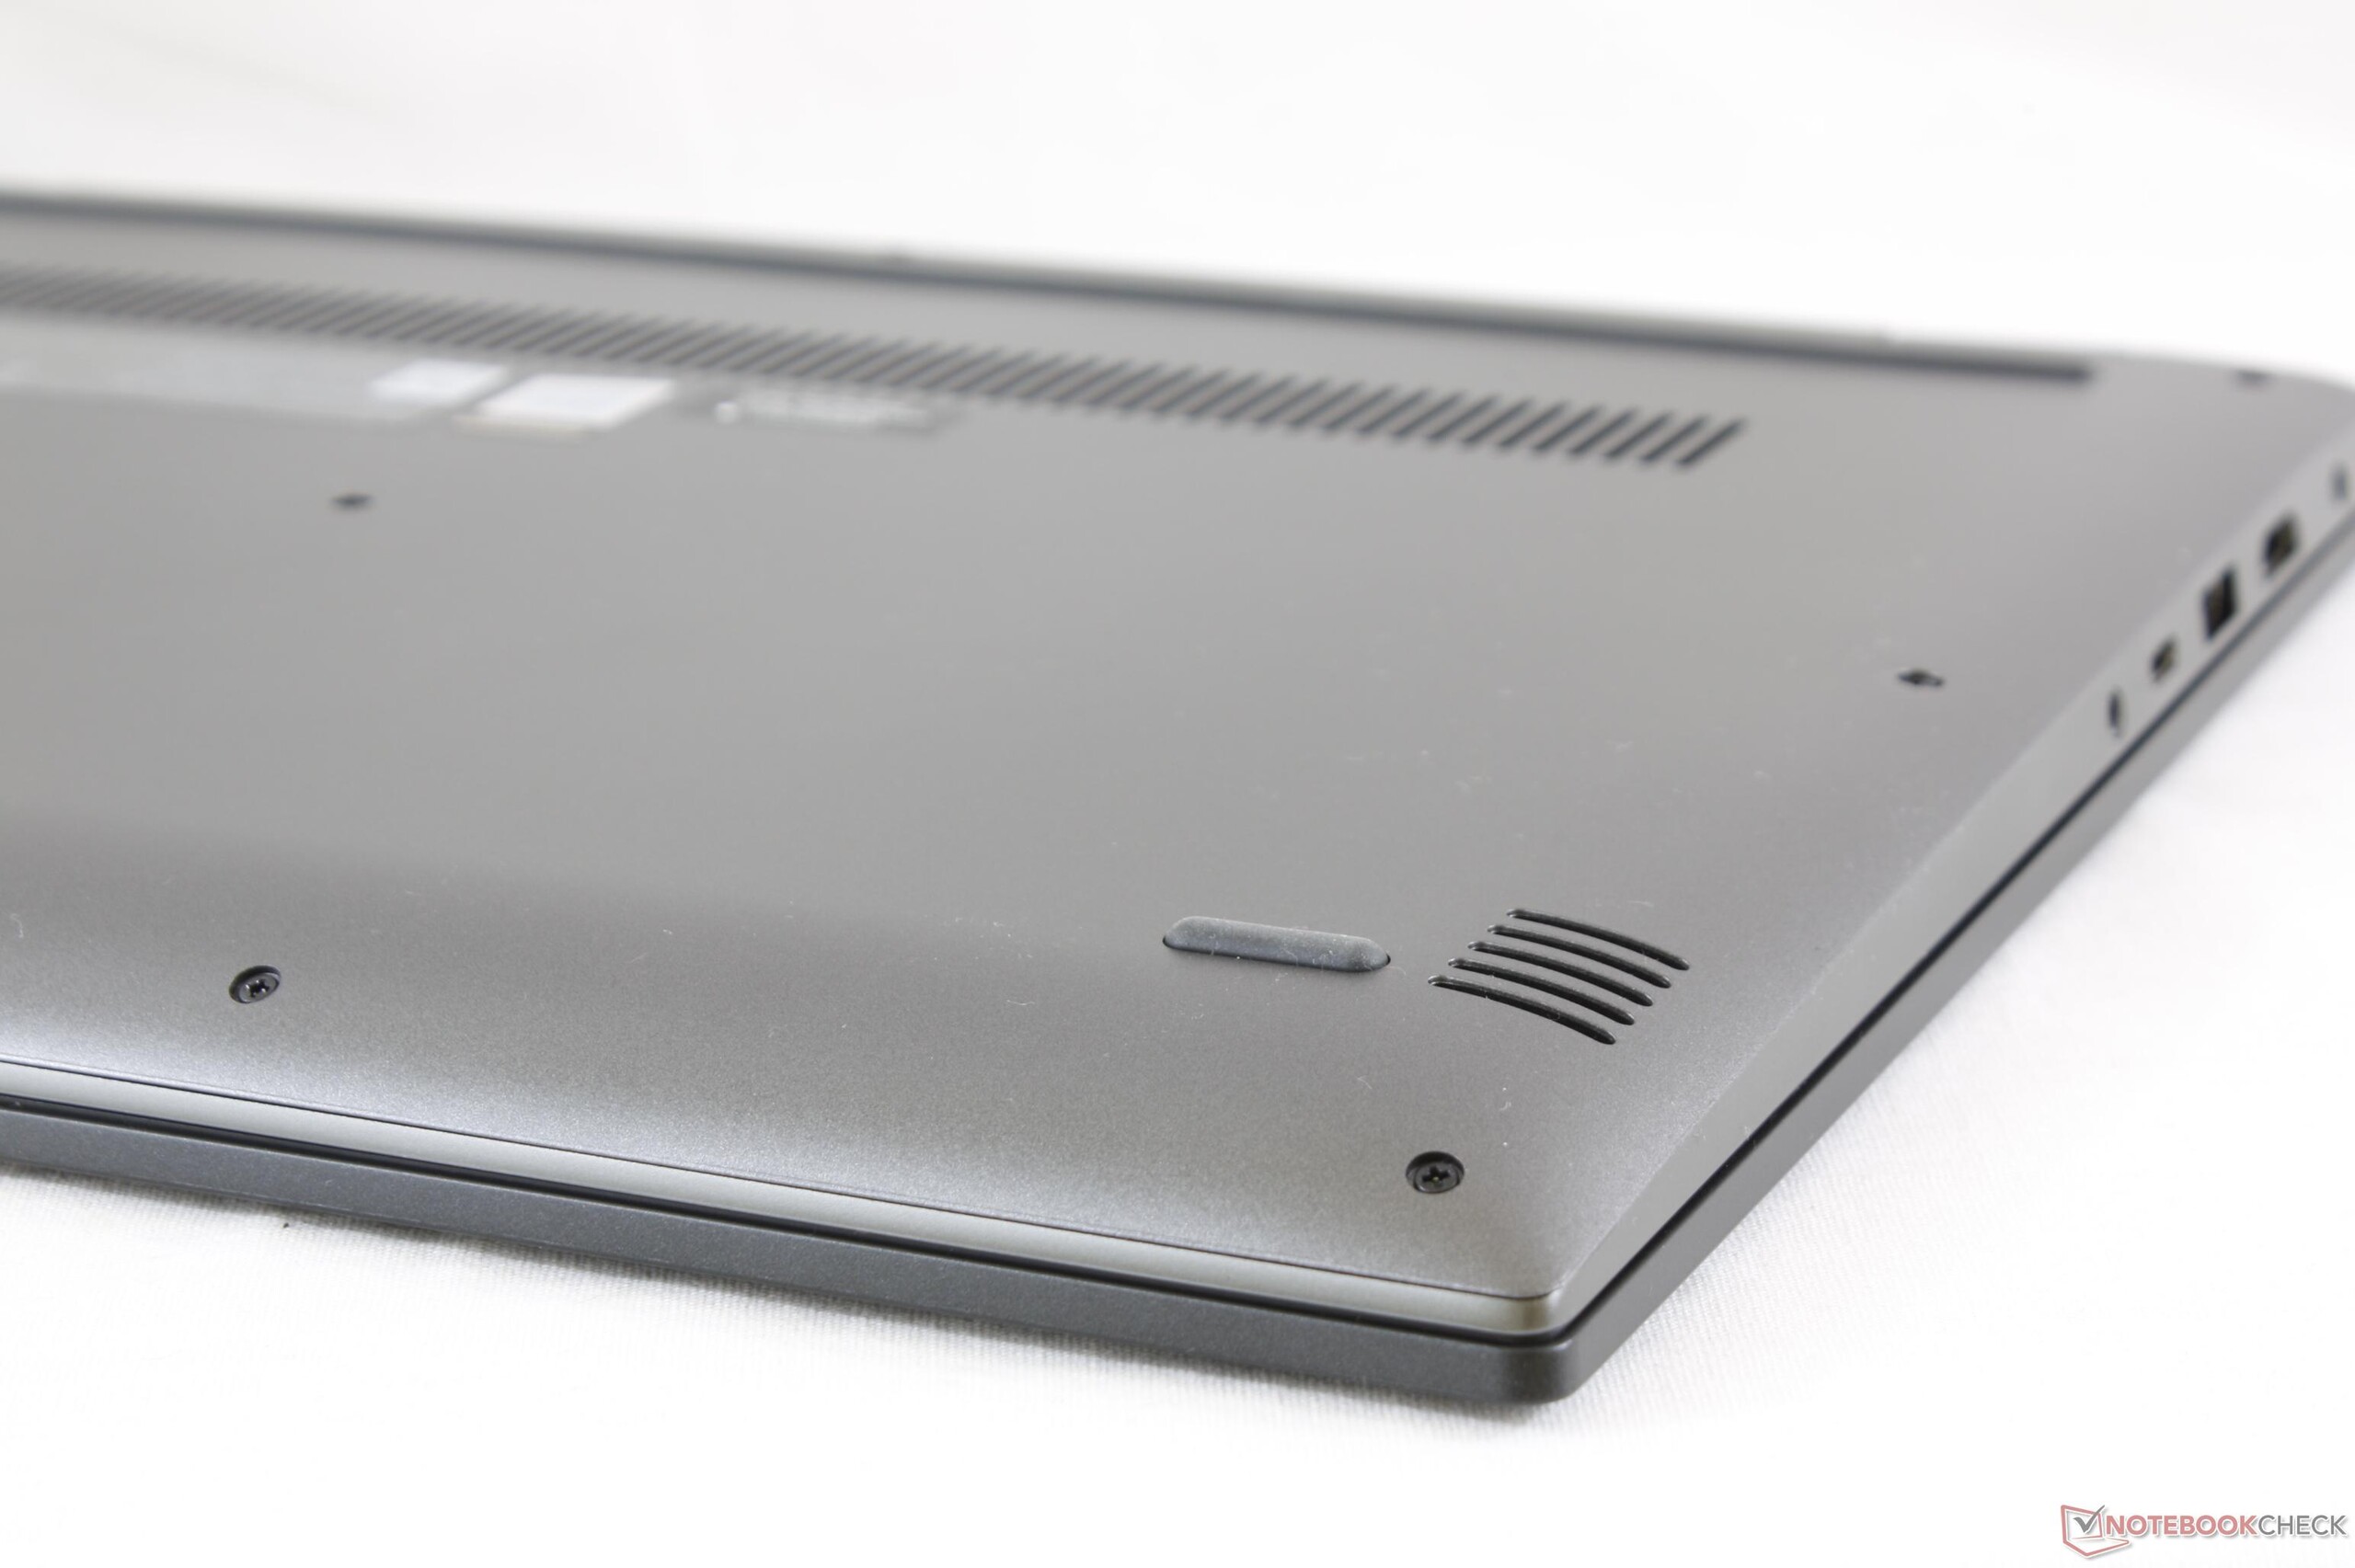
As for size and weight, the Flex 5 15 is thinner than the Asus Zenbook Flip 15 but thicker than the HP Envy x360 15 while weighing slightly less than both. The differences are minimal at best and hard to notice in practice A traditional 15-inch Lenovo laptop like the Ideapad 530S is still much thinner and lighter than the Flex 5 15 by a few millimeters and hundreds of grams, respectively. A dedicated tablet is much more comfortable to use since 15-inch convertibles in general are naturally bulky.

Connectivity
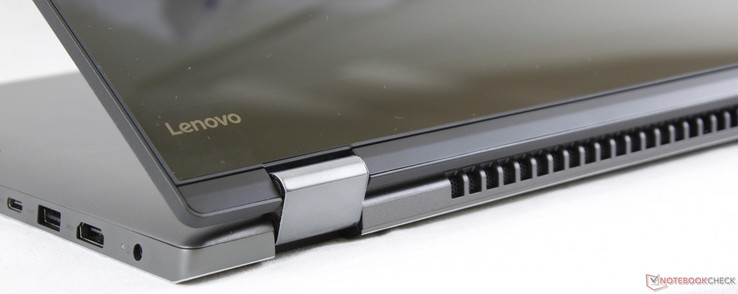
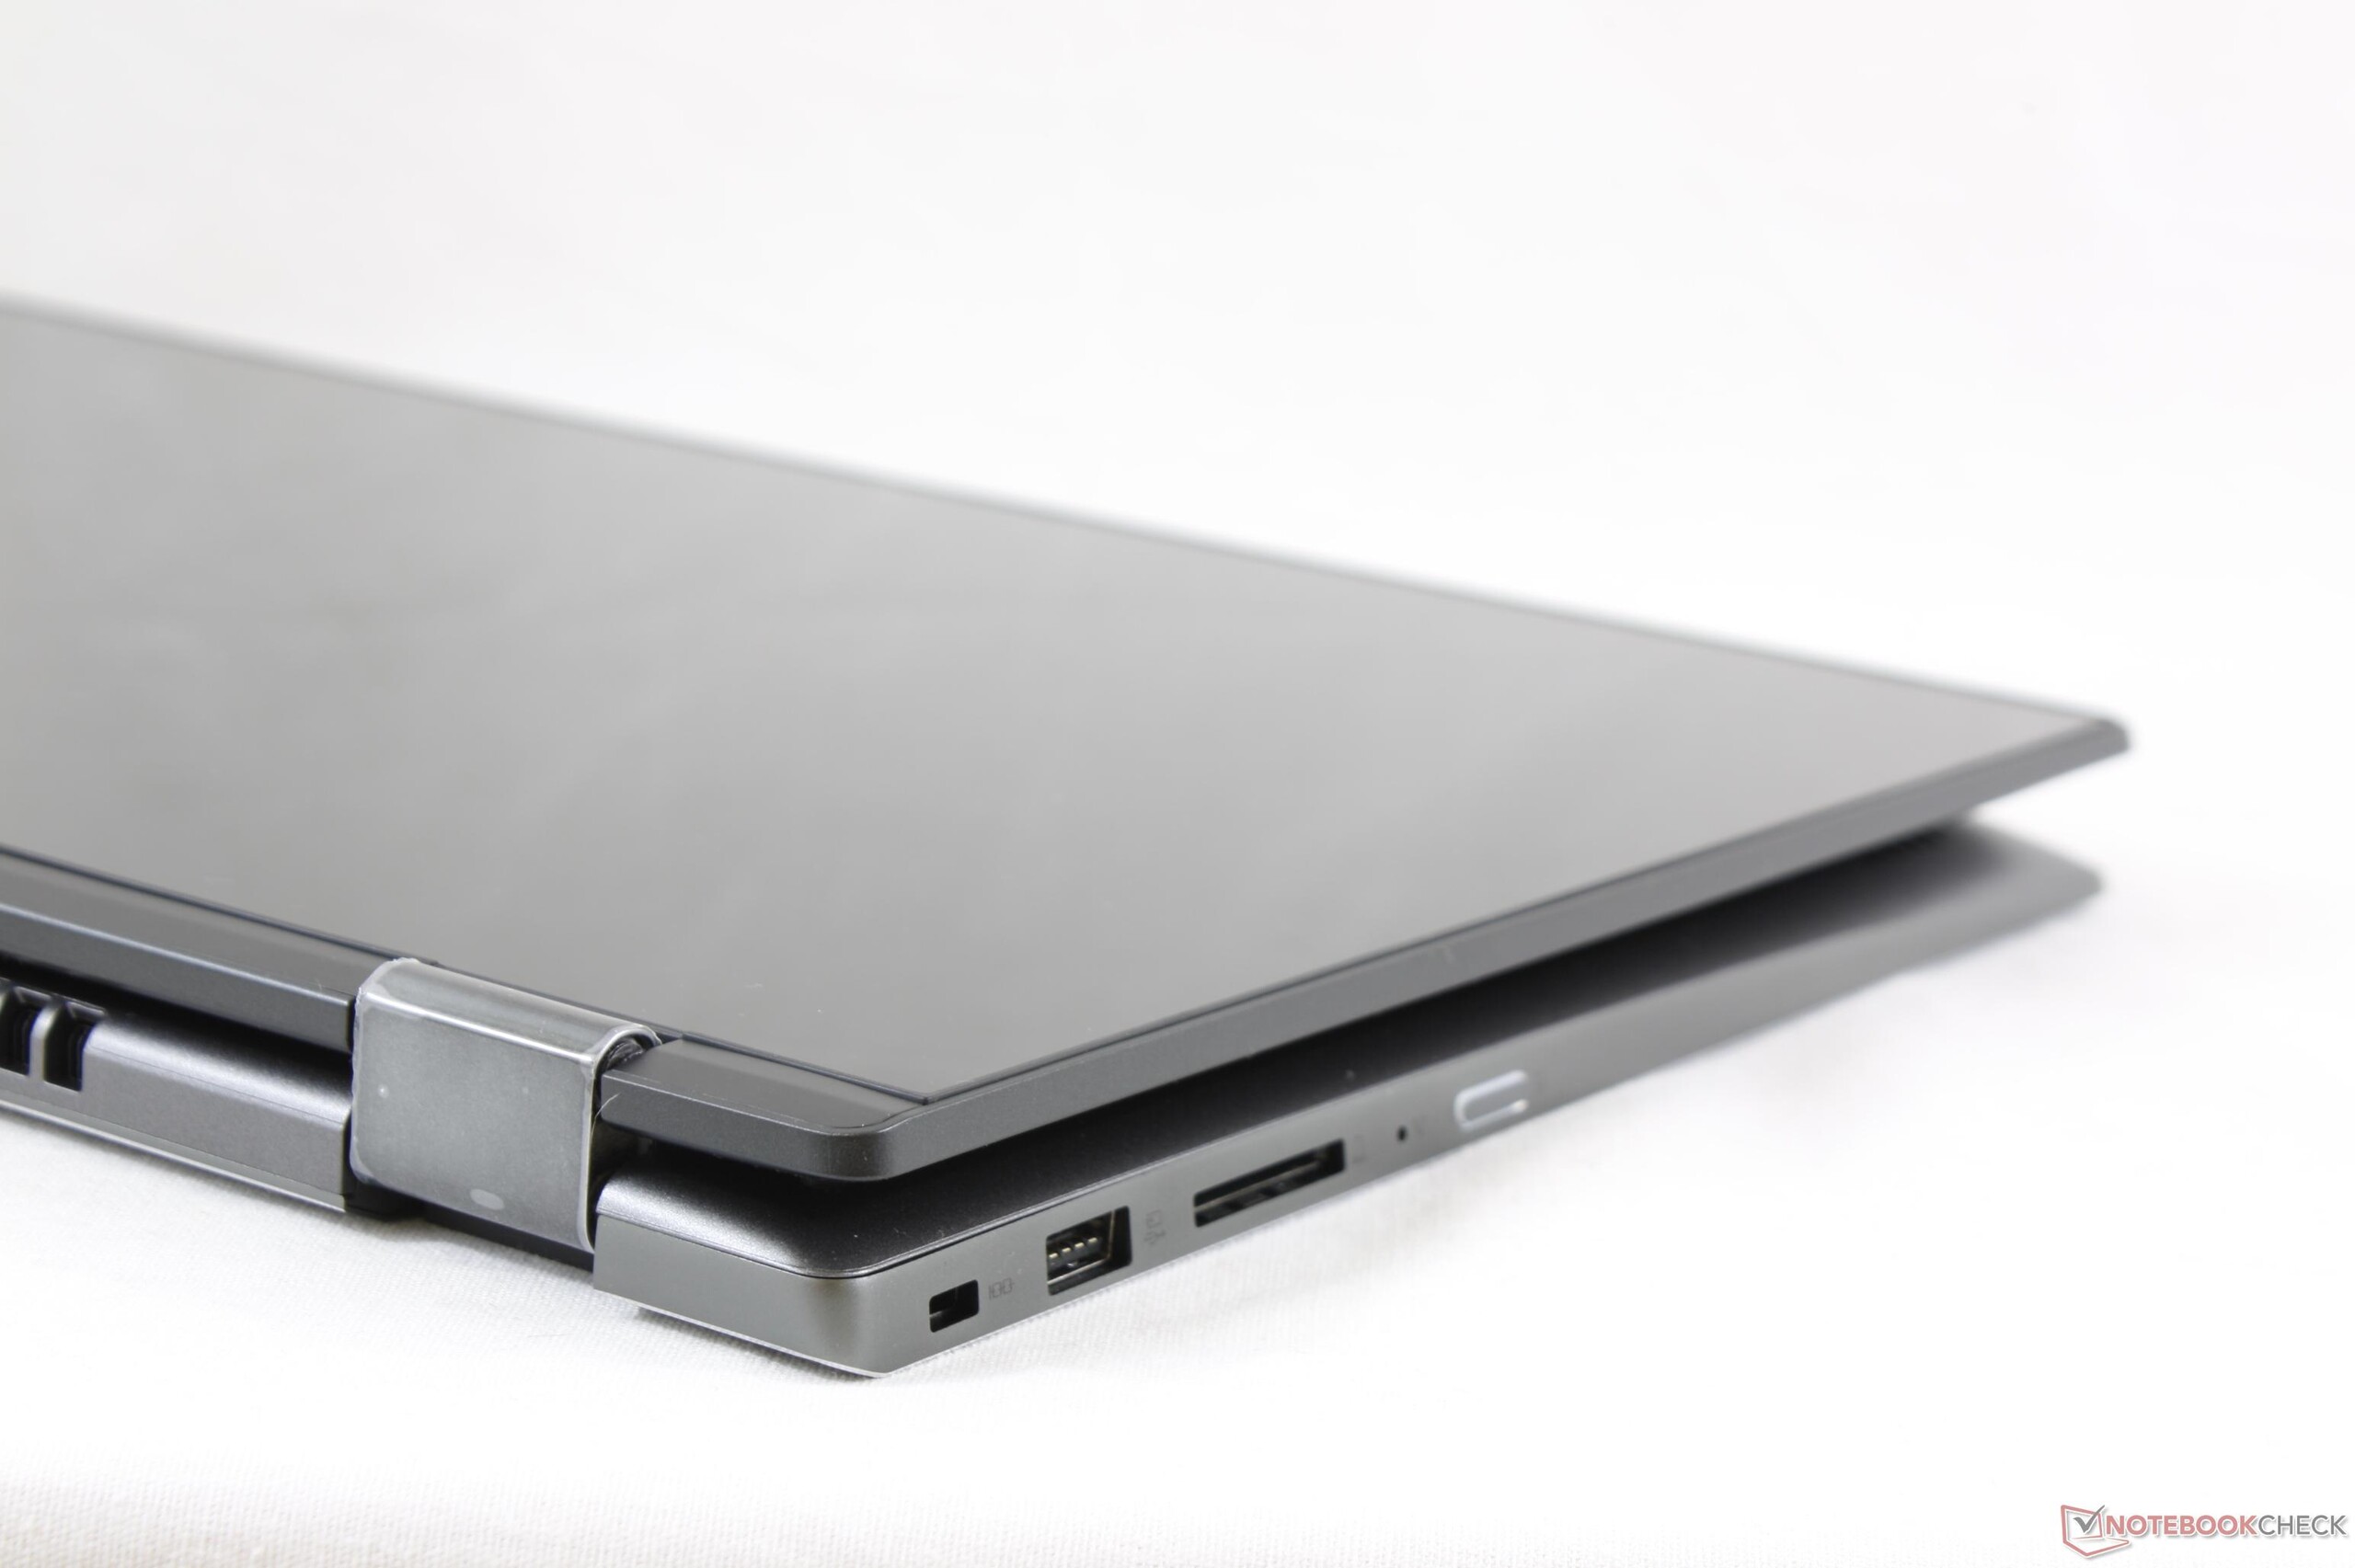
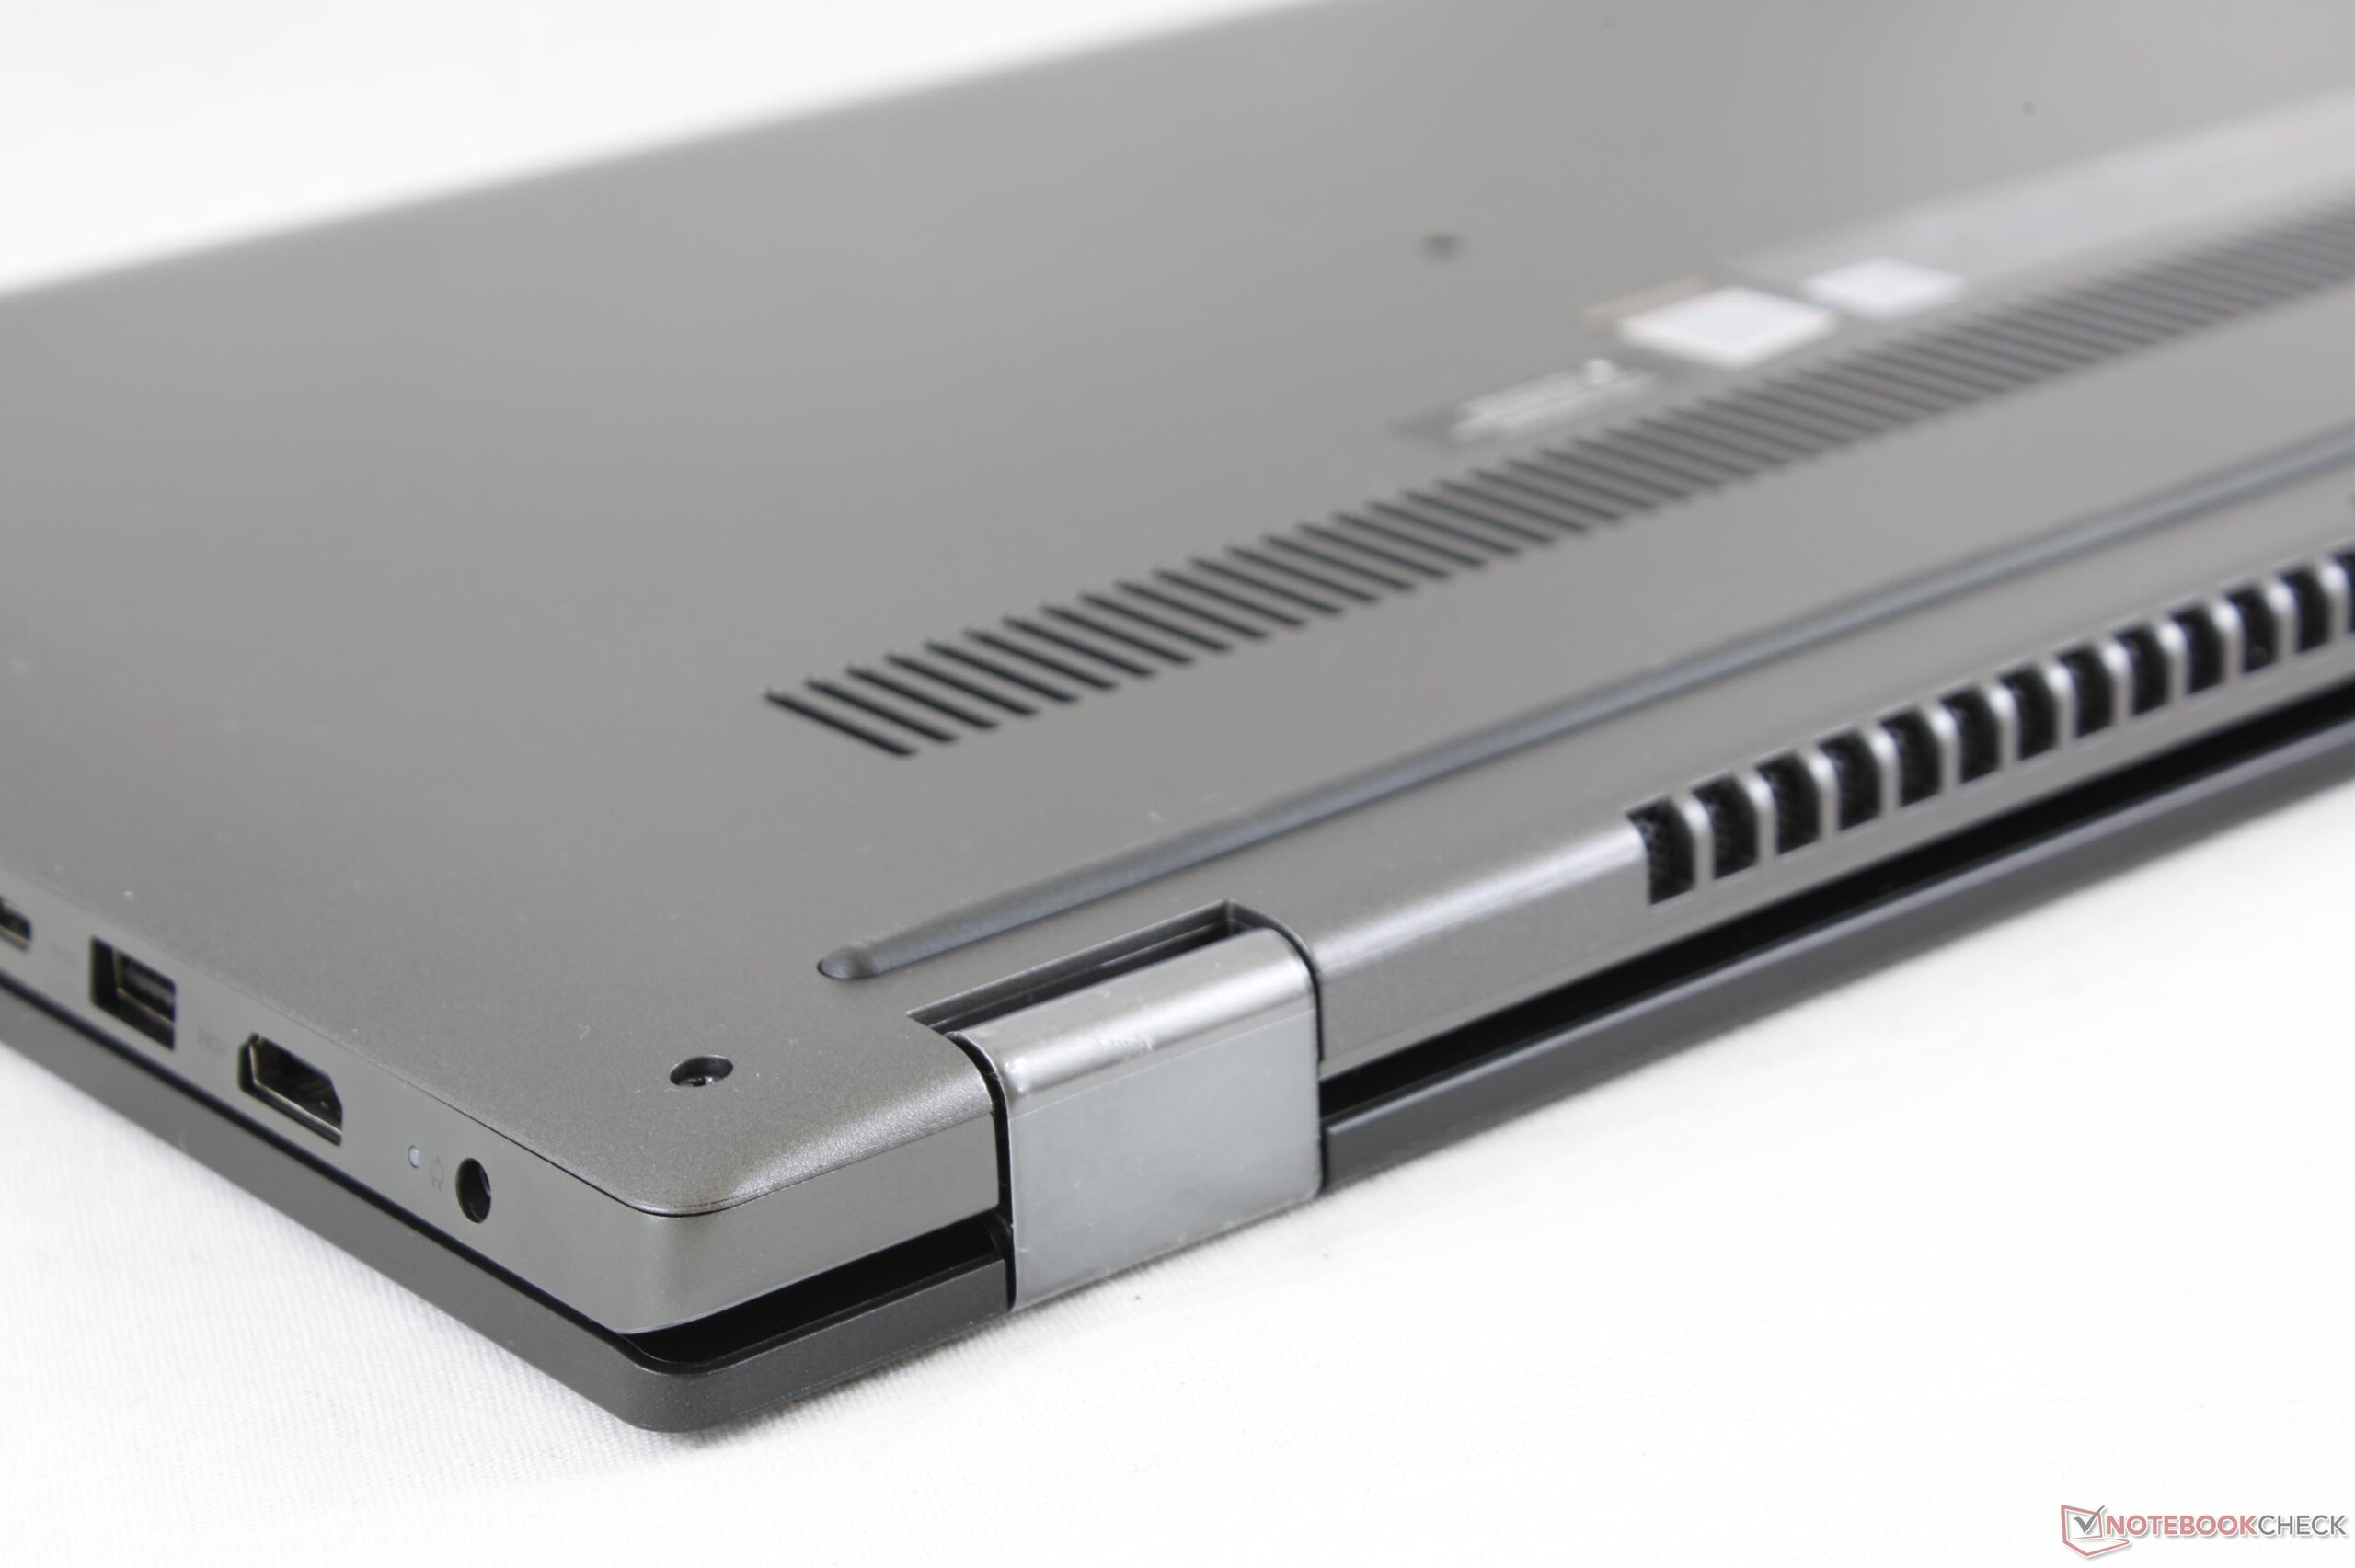
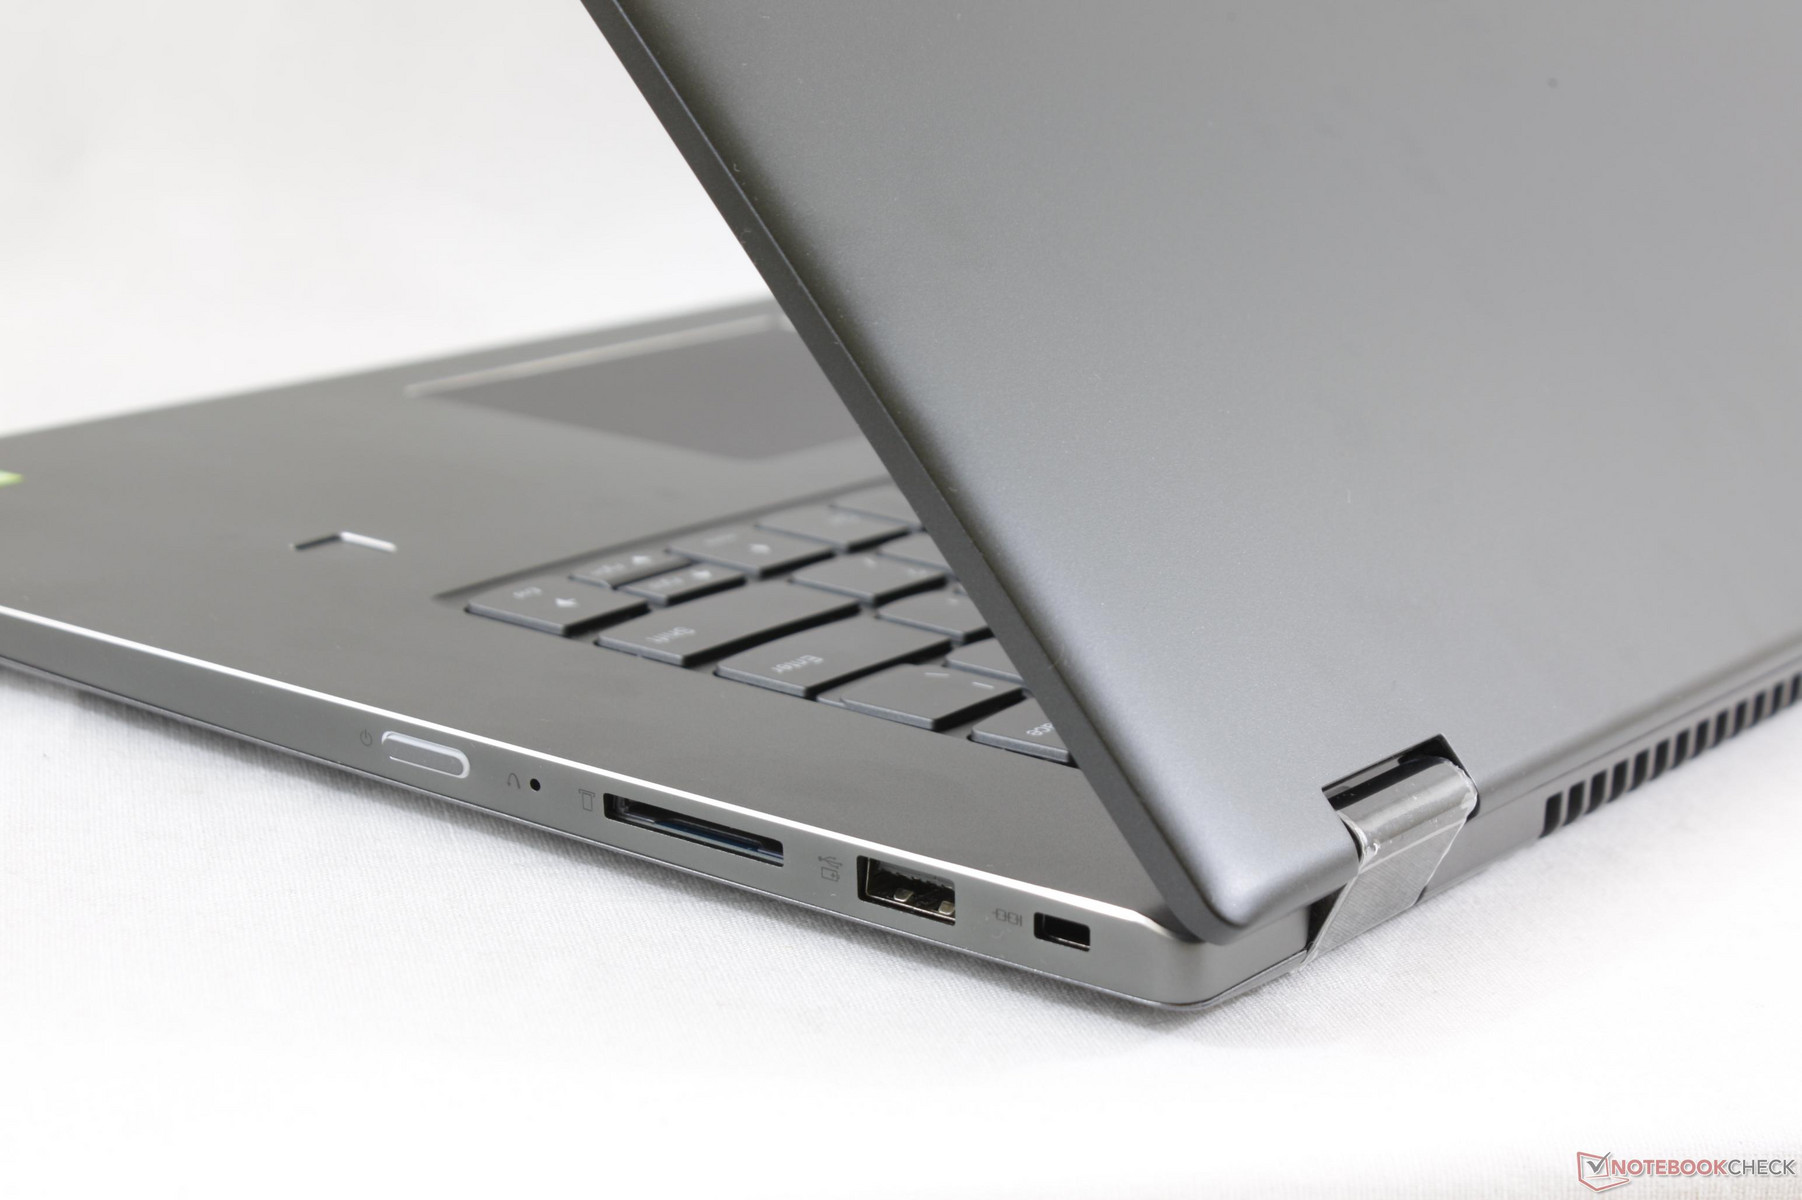
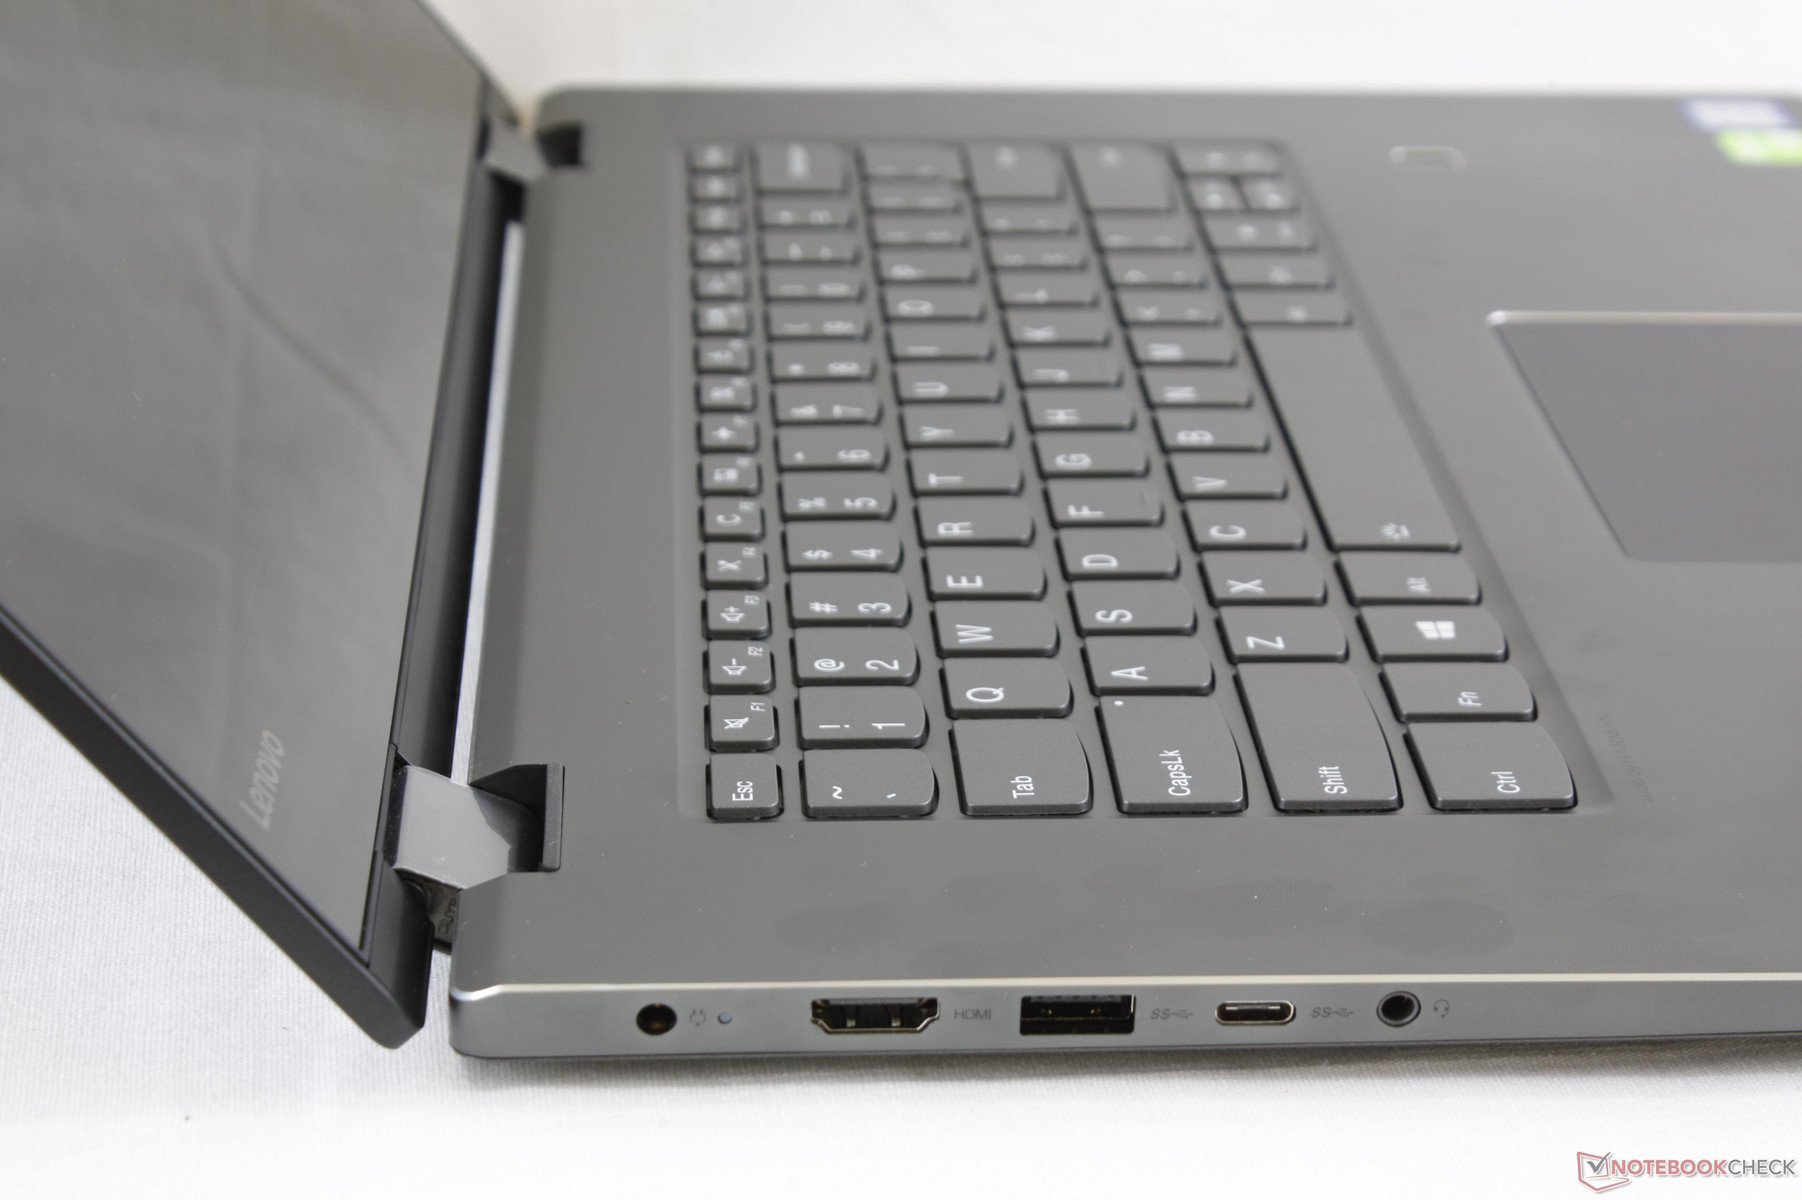
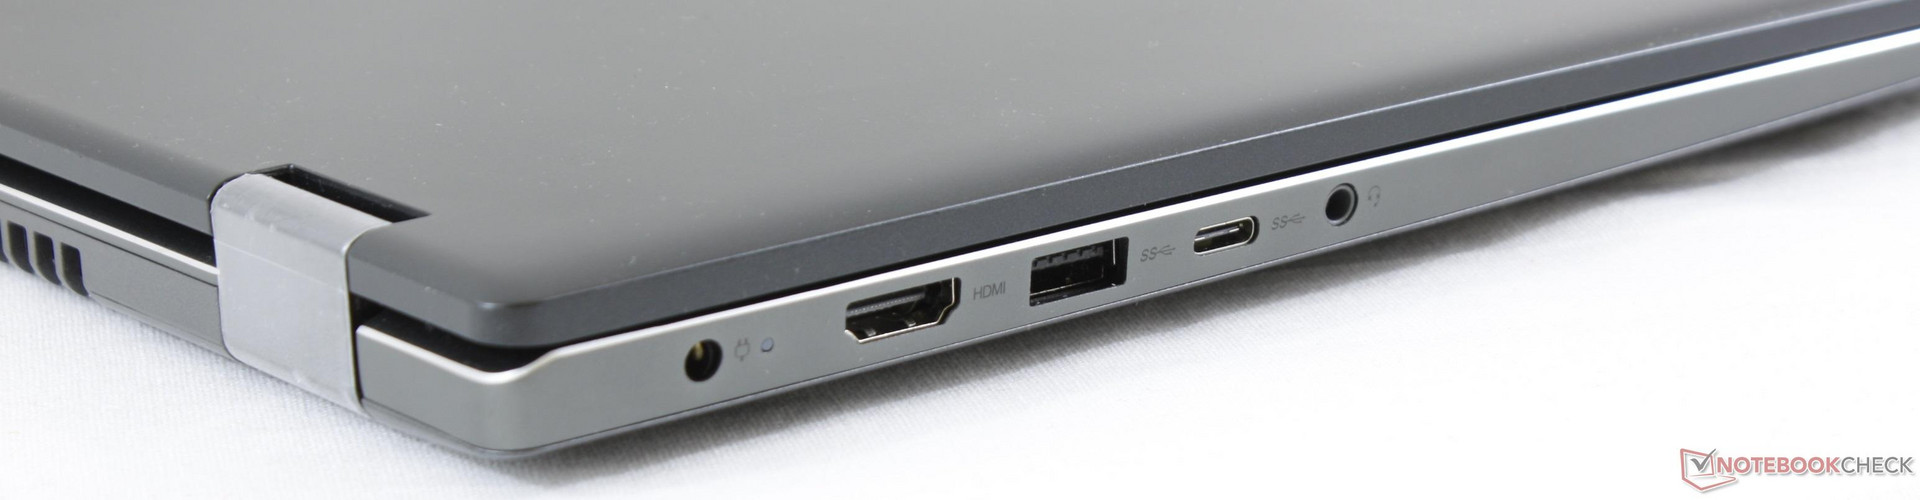
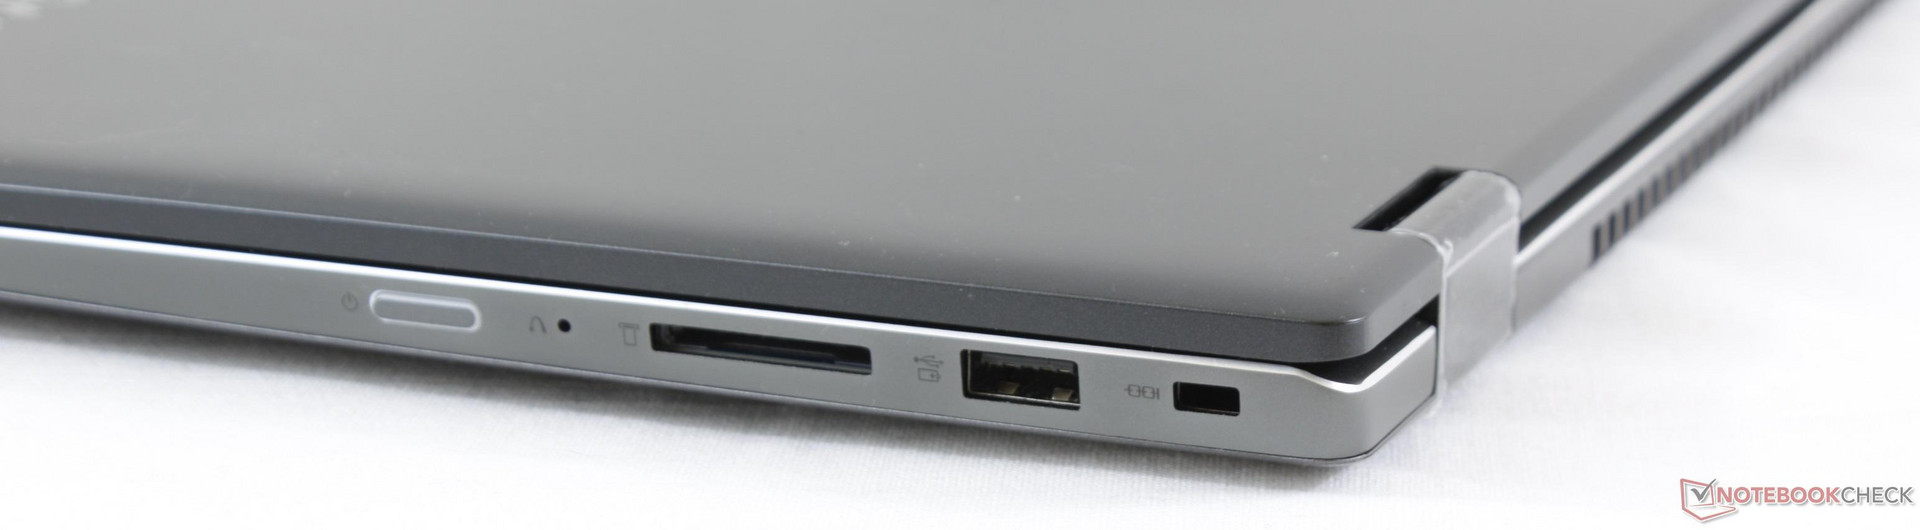
The system is equipped with all of the basic ports distributed evenly along the left and right edges. The ports are widely spaced between them and are all easy to reach. The only major downside is that the model relies on a proprietary AC adapter port for charging. A Thunderbolt 3 port with power delivery would have been more than enough to displace the AC port.
There is no dedicated volume rocker on the unit unlike on the Zenbook Flip 15 or Spectre x360 15.

SD Card Reader
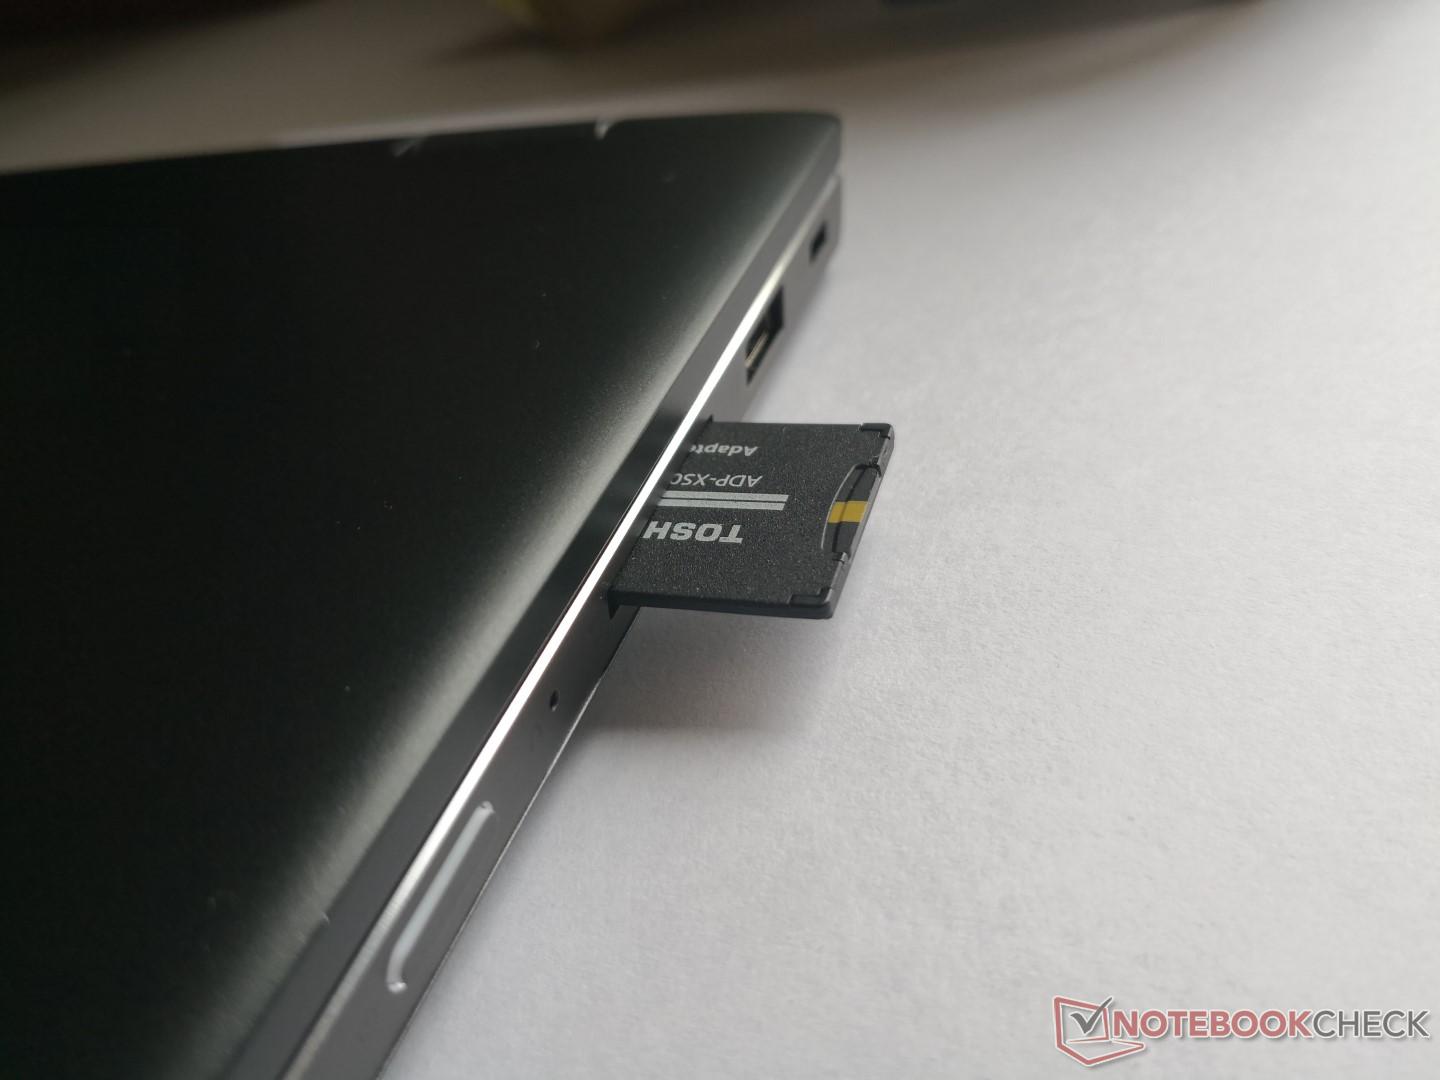
Transfer rates from the integrated card reader are average for the multimedia category. Moving 1 GB worth of images from card to desktop takes about 13 seconds. The card reader is not spring-loaded and a fully inserted card will still protrude by half its length. It is recommended to remove any inserted cards before transporting.
| SD Card Reader | |
| average JPG Copy Test (av. of 3 runs) | |
| Dell XPS 15 9575 i7-8705G (Toshiba Exceria Pro M501 UHS-II) | |
| Lenovo IdeaPad Flex-1570 81CA000RUS (Toshiba Exceria Pro SDXC 64 GB UHS-II) | |
| HP Pavilion 15-cs0053cl (Toshiba Exceria Pro SDXC 64 GB UHS-II) | |
| Lenovo Ideapad 530S-15IKB (Toshiba Exceria Pro SDXC 64 GB UHS-II) | |
| maximum AS SSD Seq Read Test (1GB) | |
| Dell XPS 15 9575 i7-8705G (Toshiba Exceria Pro M501 UHS-II) | |
| Lenovo IdeaPad Flex-1570 81CA000RUS (Toshiba Exceria Pro SDXC 64 GB UHS-II) | |
| HP Pavilion 15-cs0053cl (Toshiba Exceria Pro SDXC 64 GB UHS-II) | |
| Lenovo Ideapad 530S-15IKB (Toshiba Exceria Pro SDXC 64 GB UHS-II) | |
Communication
The Qualcomm wireless module exhibits no connectivity issues. We're relieved to see 2x2 wireless across all SKUs of the Flex 5 15 as some OEMs like to cut corners on some budget offerings by including only 1x1 wireless.
Accessories
Included extras are a warranty card, Quick Start guide, and a Lenovo Active Pen with battery. It's commendable to see a stylus in the standard packaging and not just an option. A cleaning cloth would have been appreciated since the chassis and glossy display are fingerprint magnets.
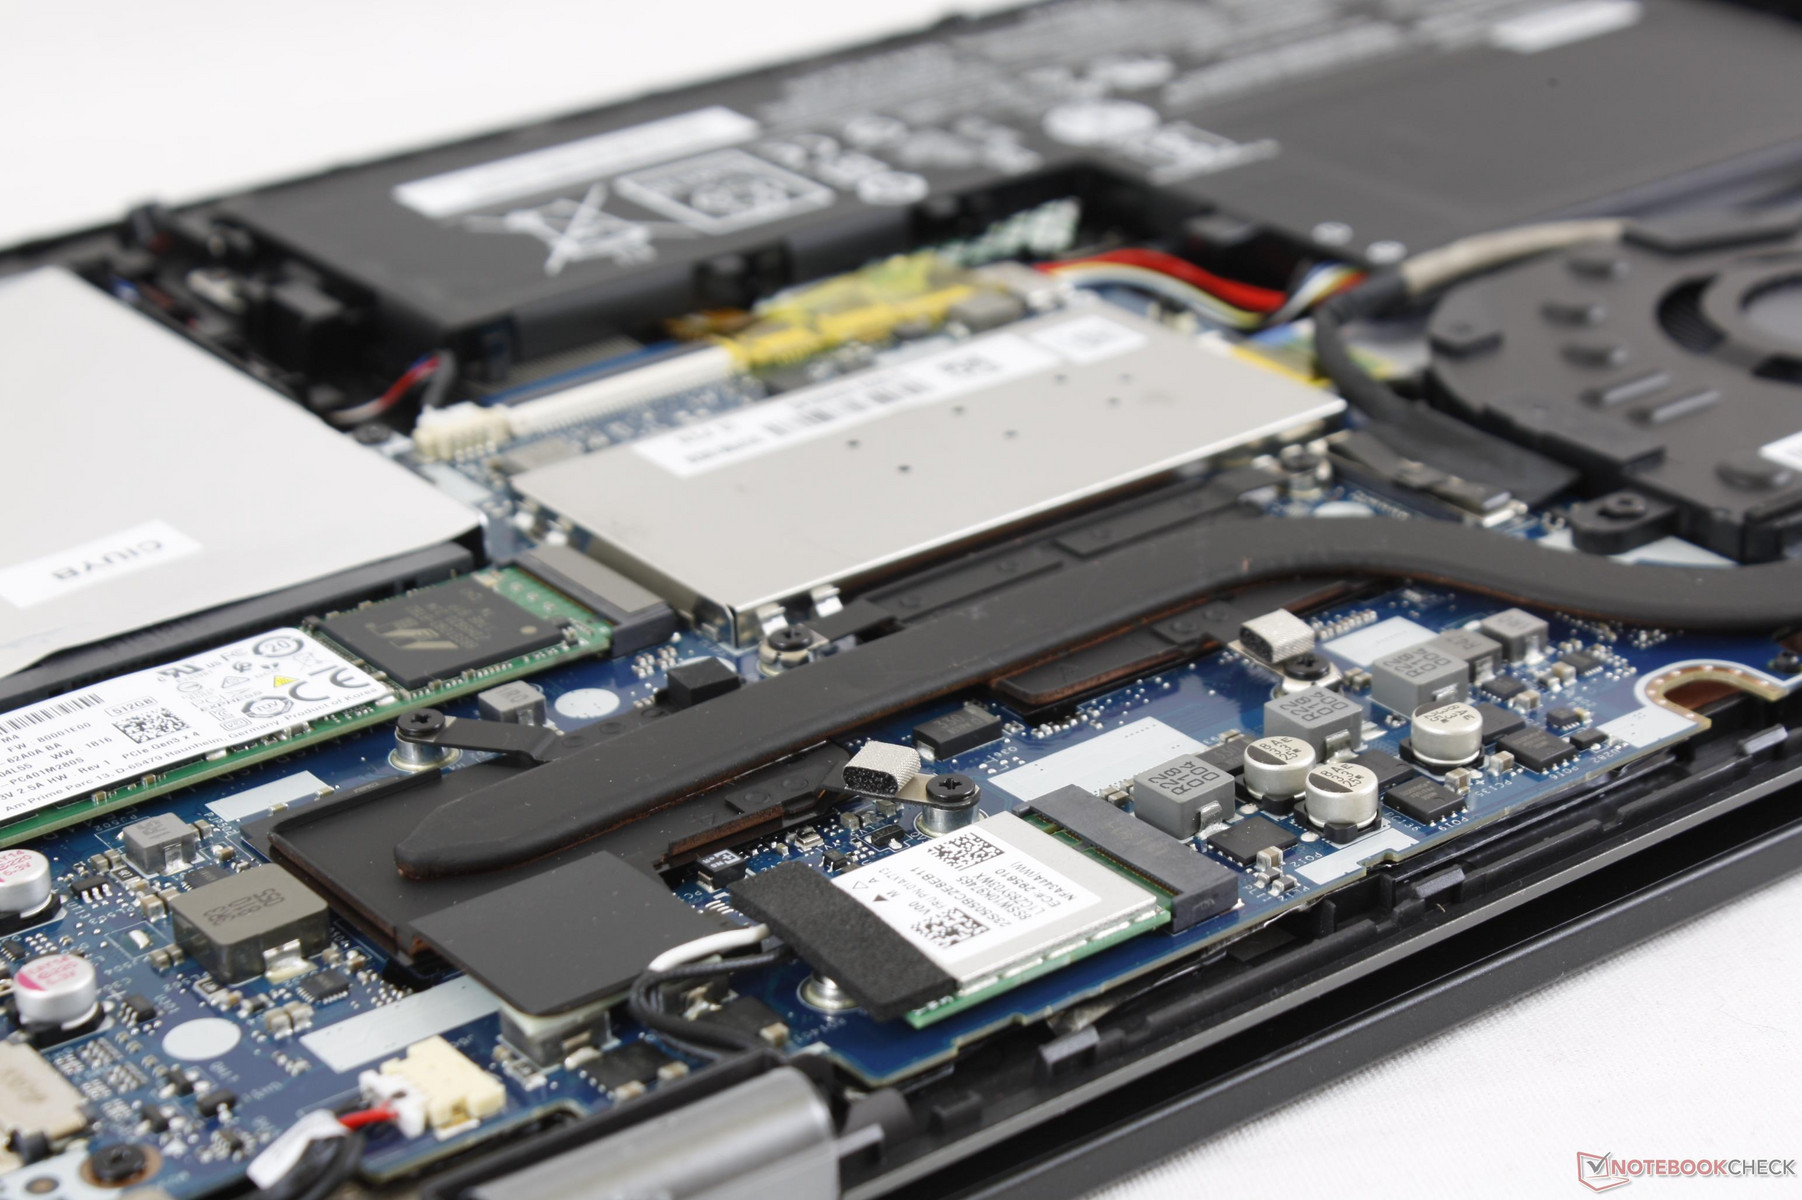
Maintenance
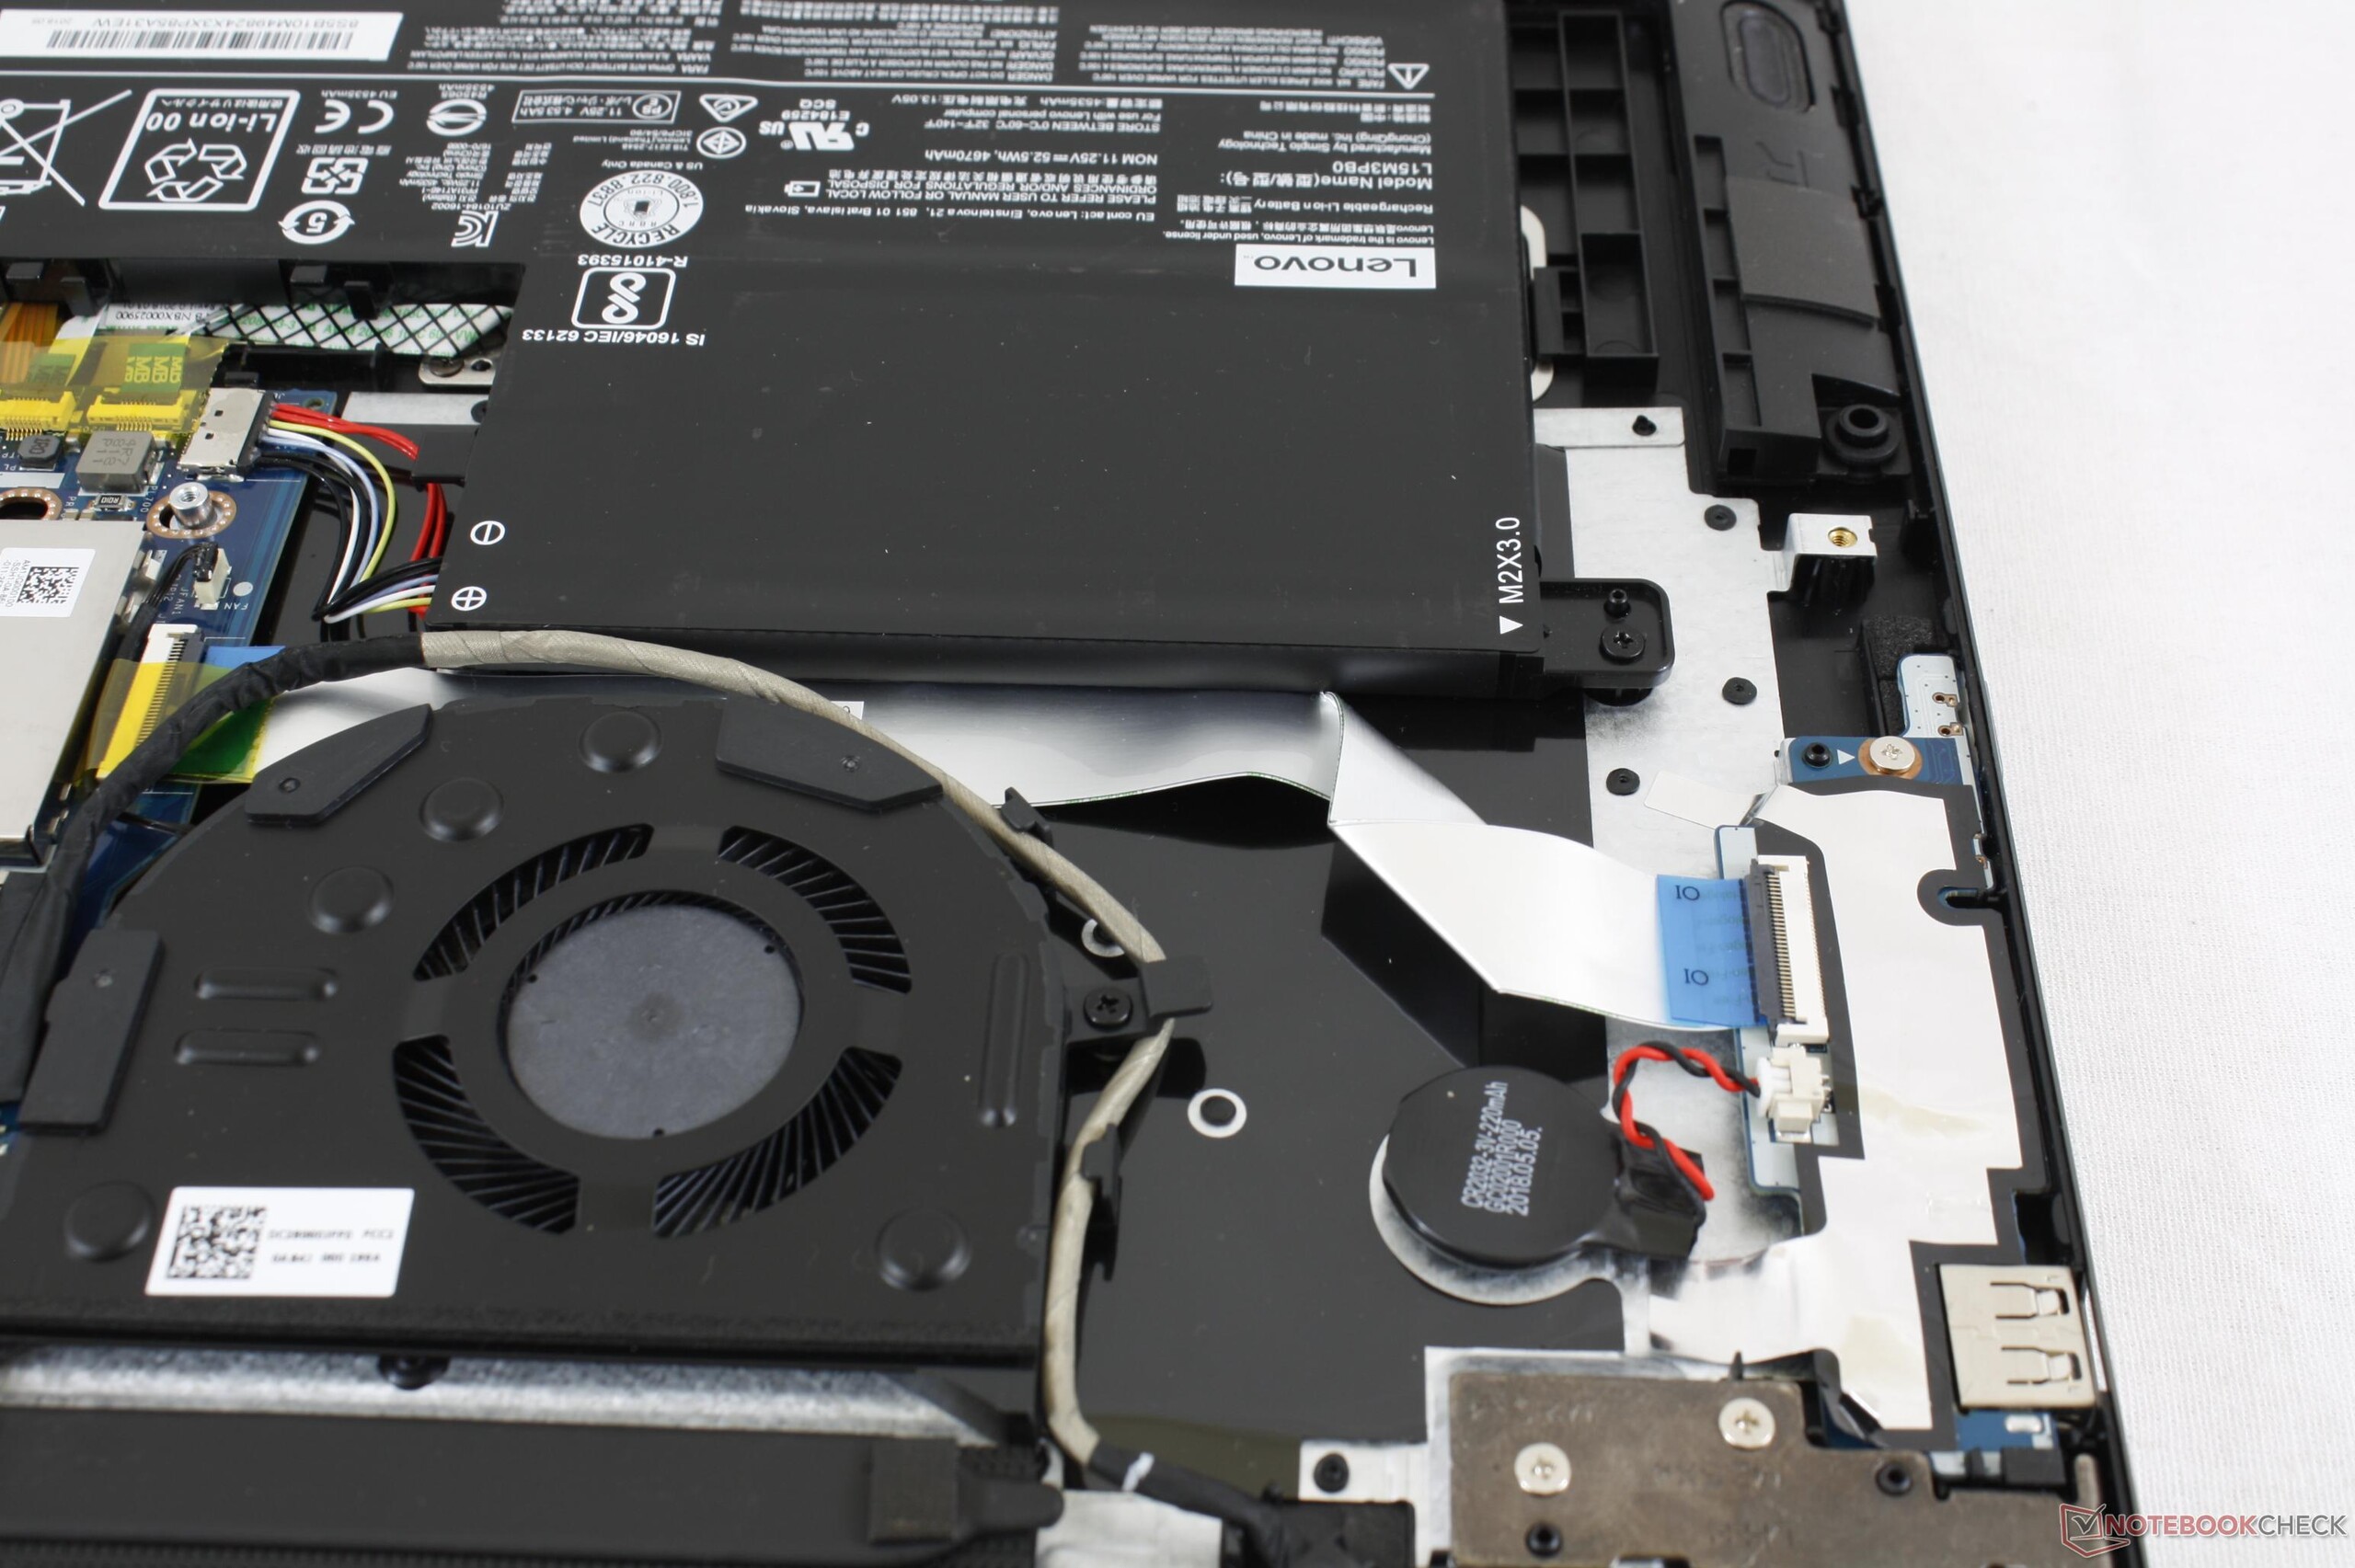
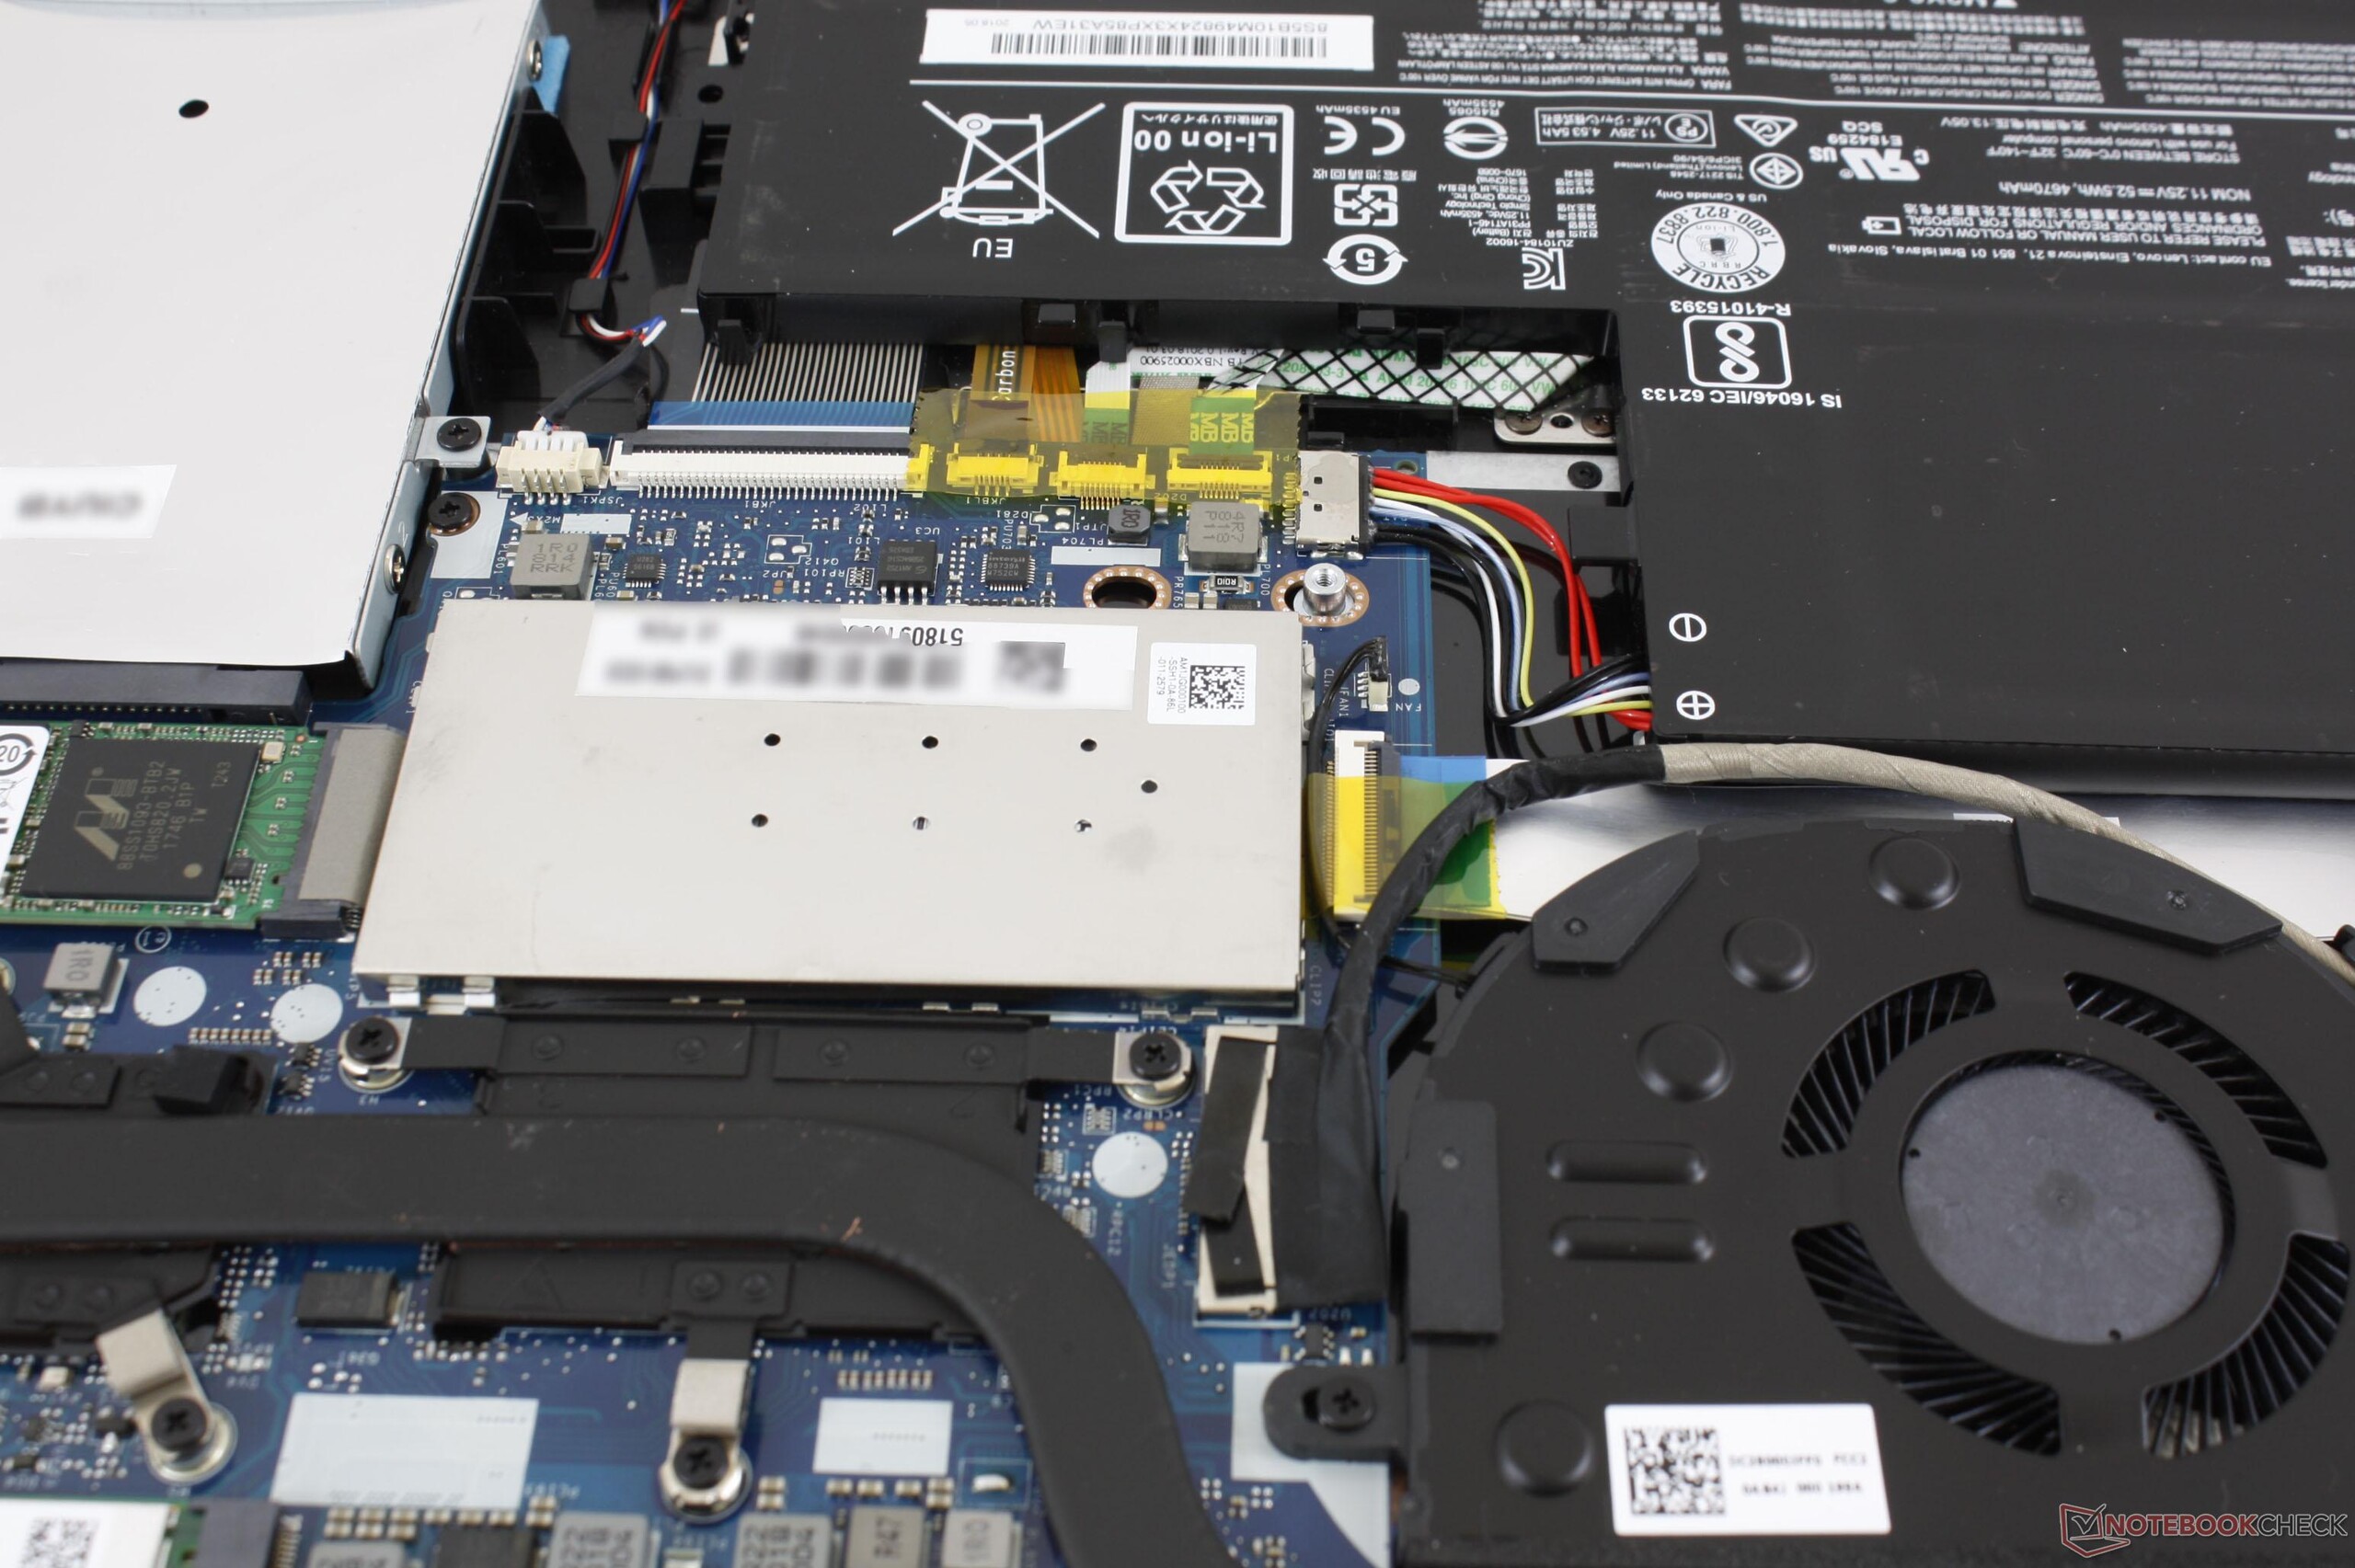
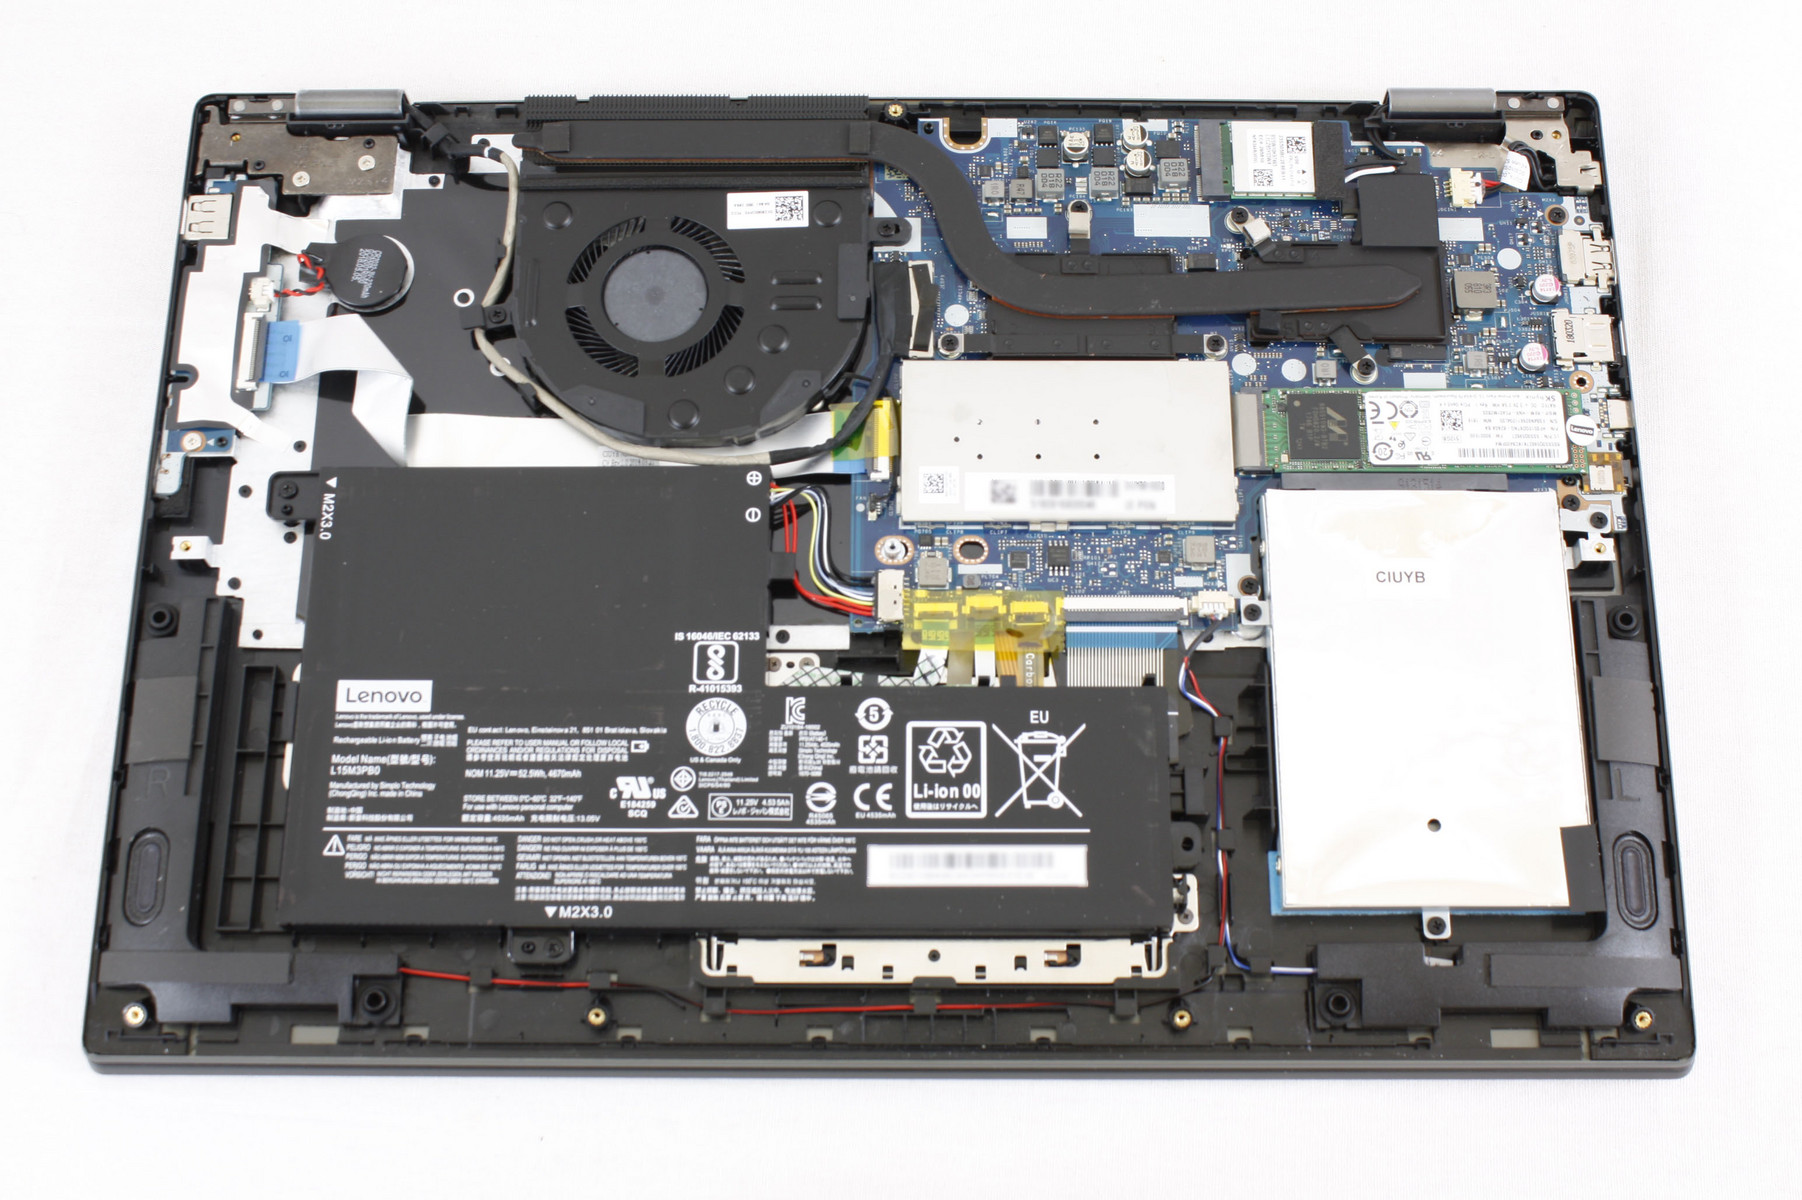
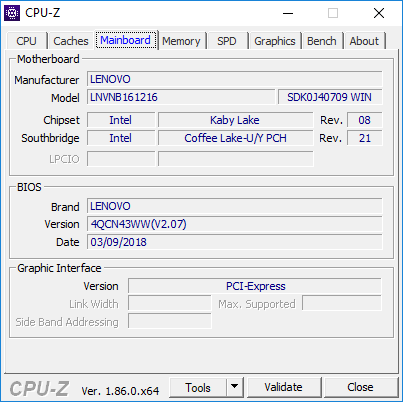
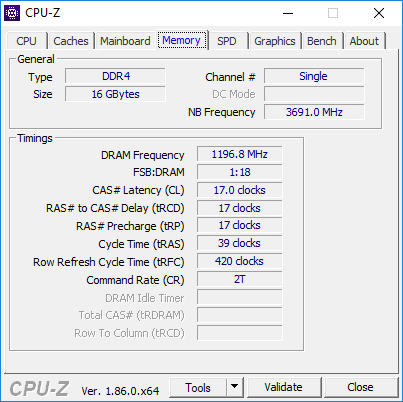
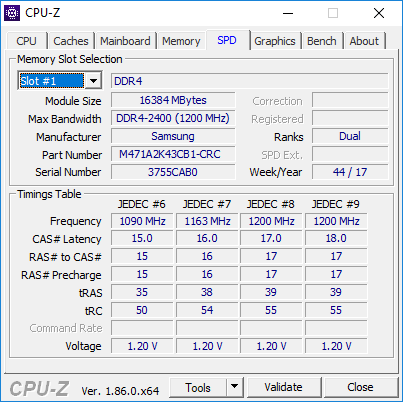
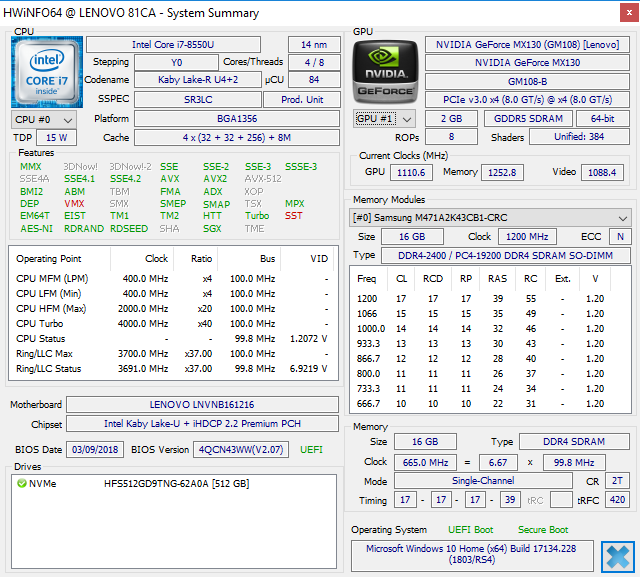
A Philips screwdriver and sharp edge will be required to pry off the bottom panel. Users are granted direct access to the cooling solution, both M.2 and 2.5-inch storage bays, WLAN module, and both the internal and BIOS batteries. The single RAM module is protected by an aluminum cover and so all SKUs are limited to single-channel memory only.
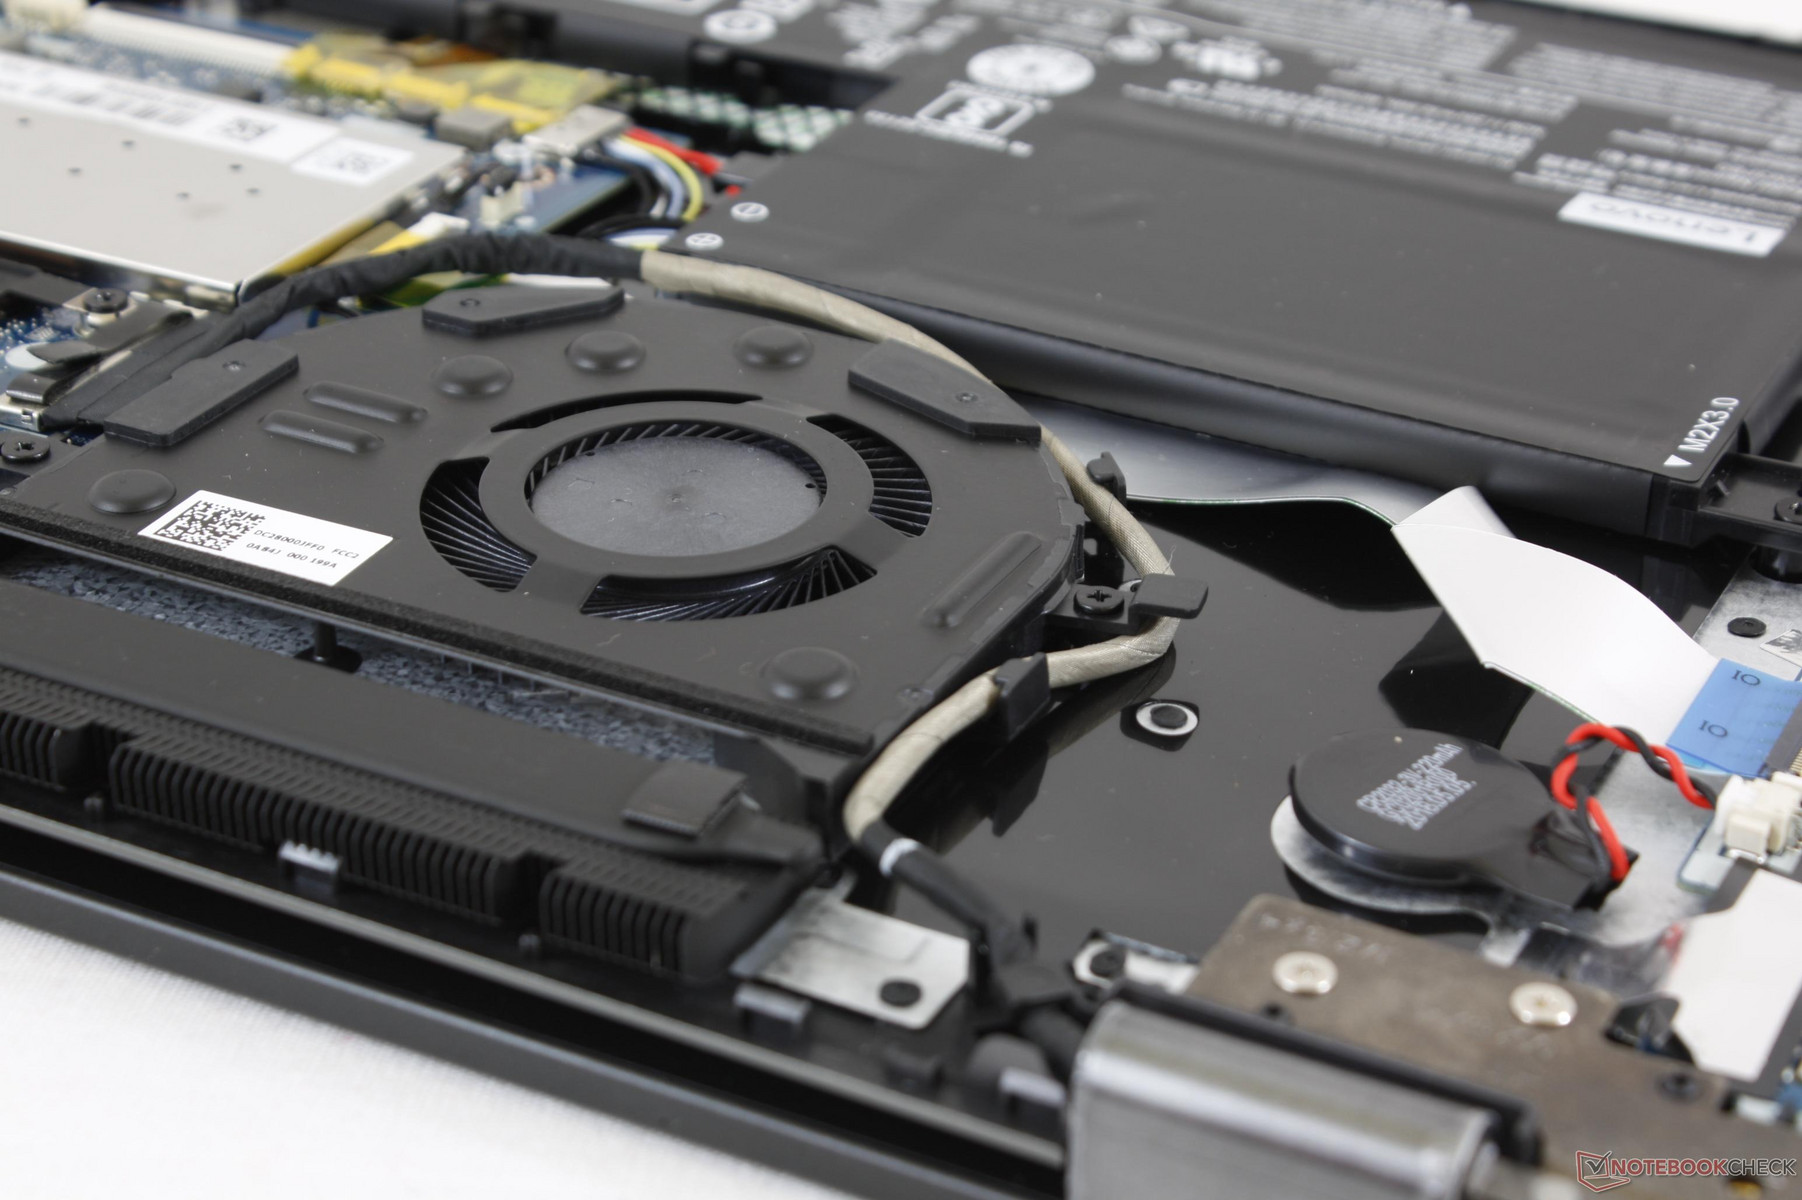
Note the large volume of unused and potentially wasted space between the system fan and battery.
Warranty
The standard one-year limited warranty applies. The OEM offers additional protection of up to three years with onsite service and Accidental Damage Protection if desired.
Input Devices
Keyboard
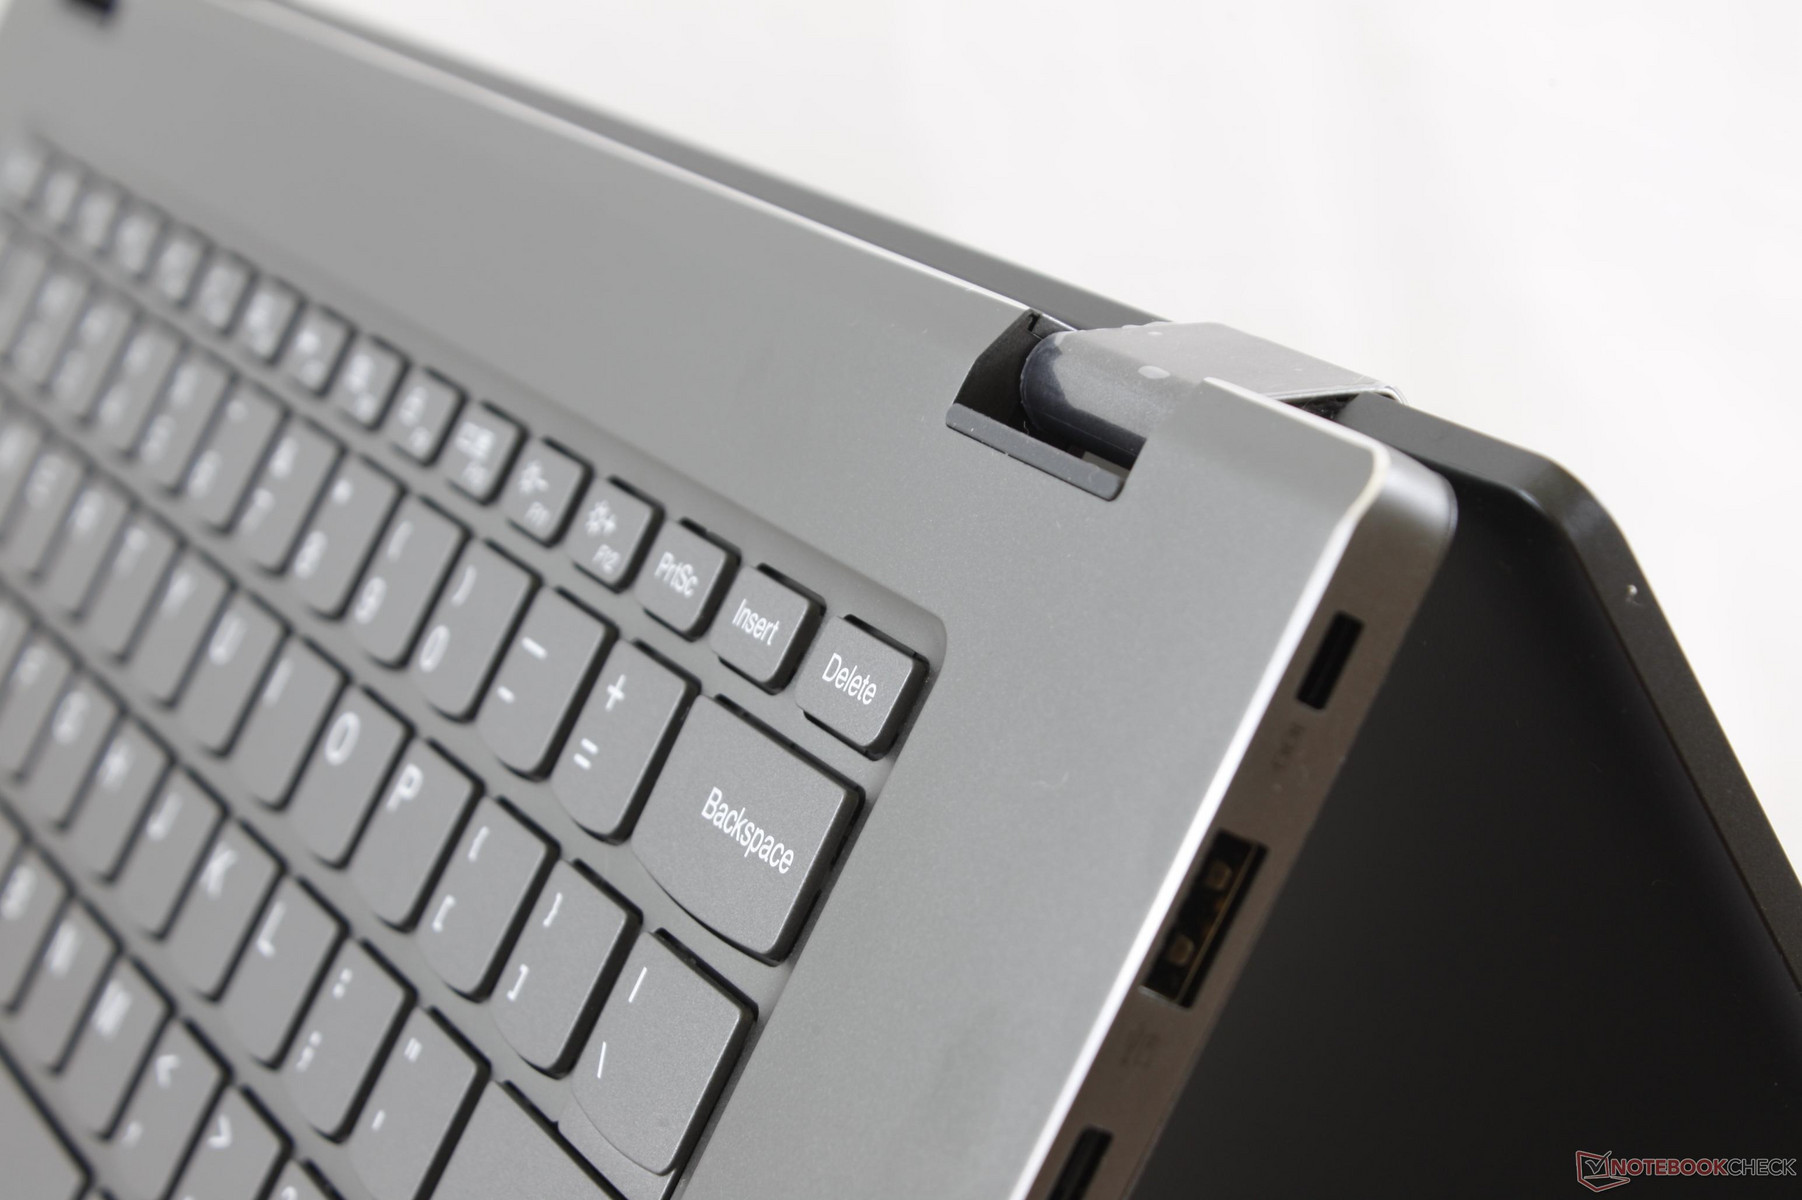
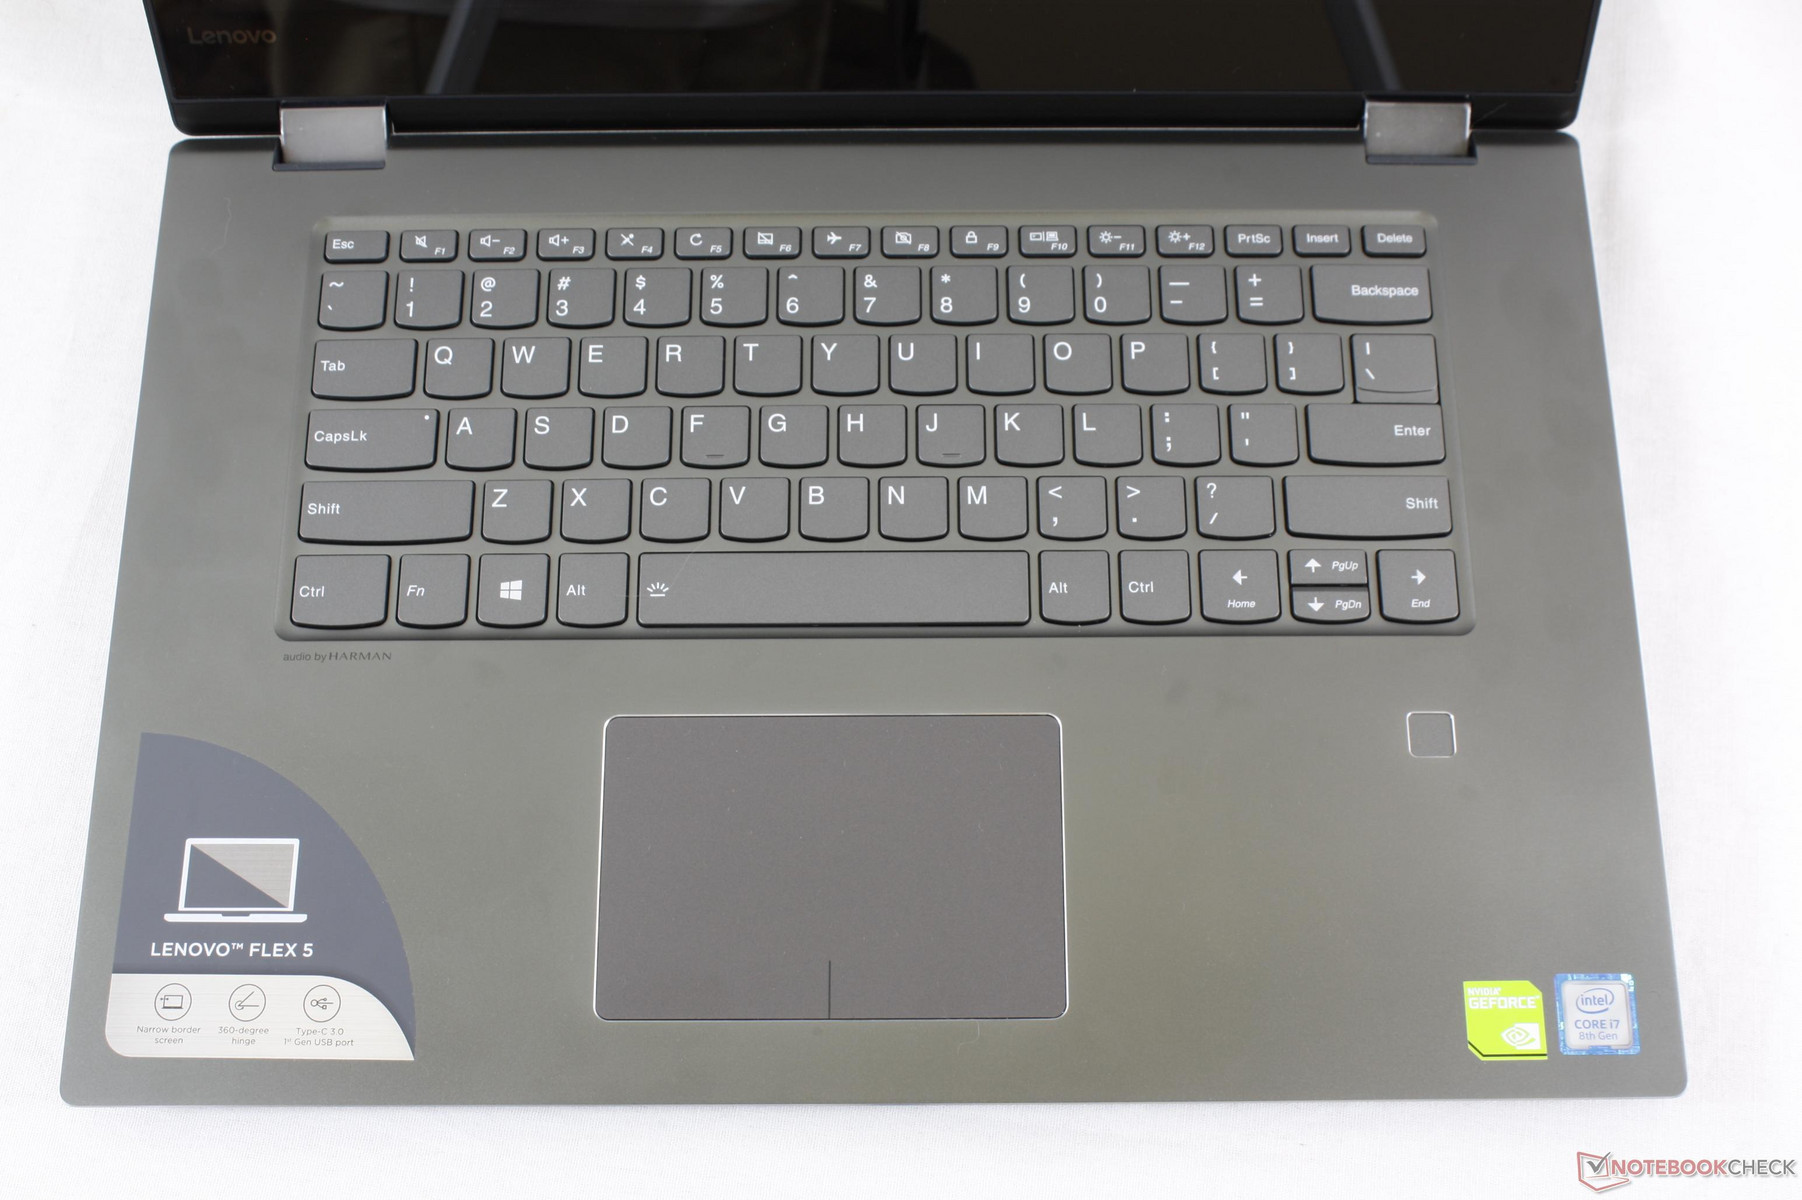
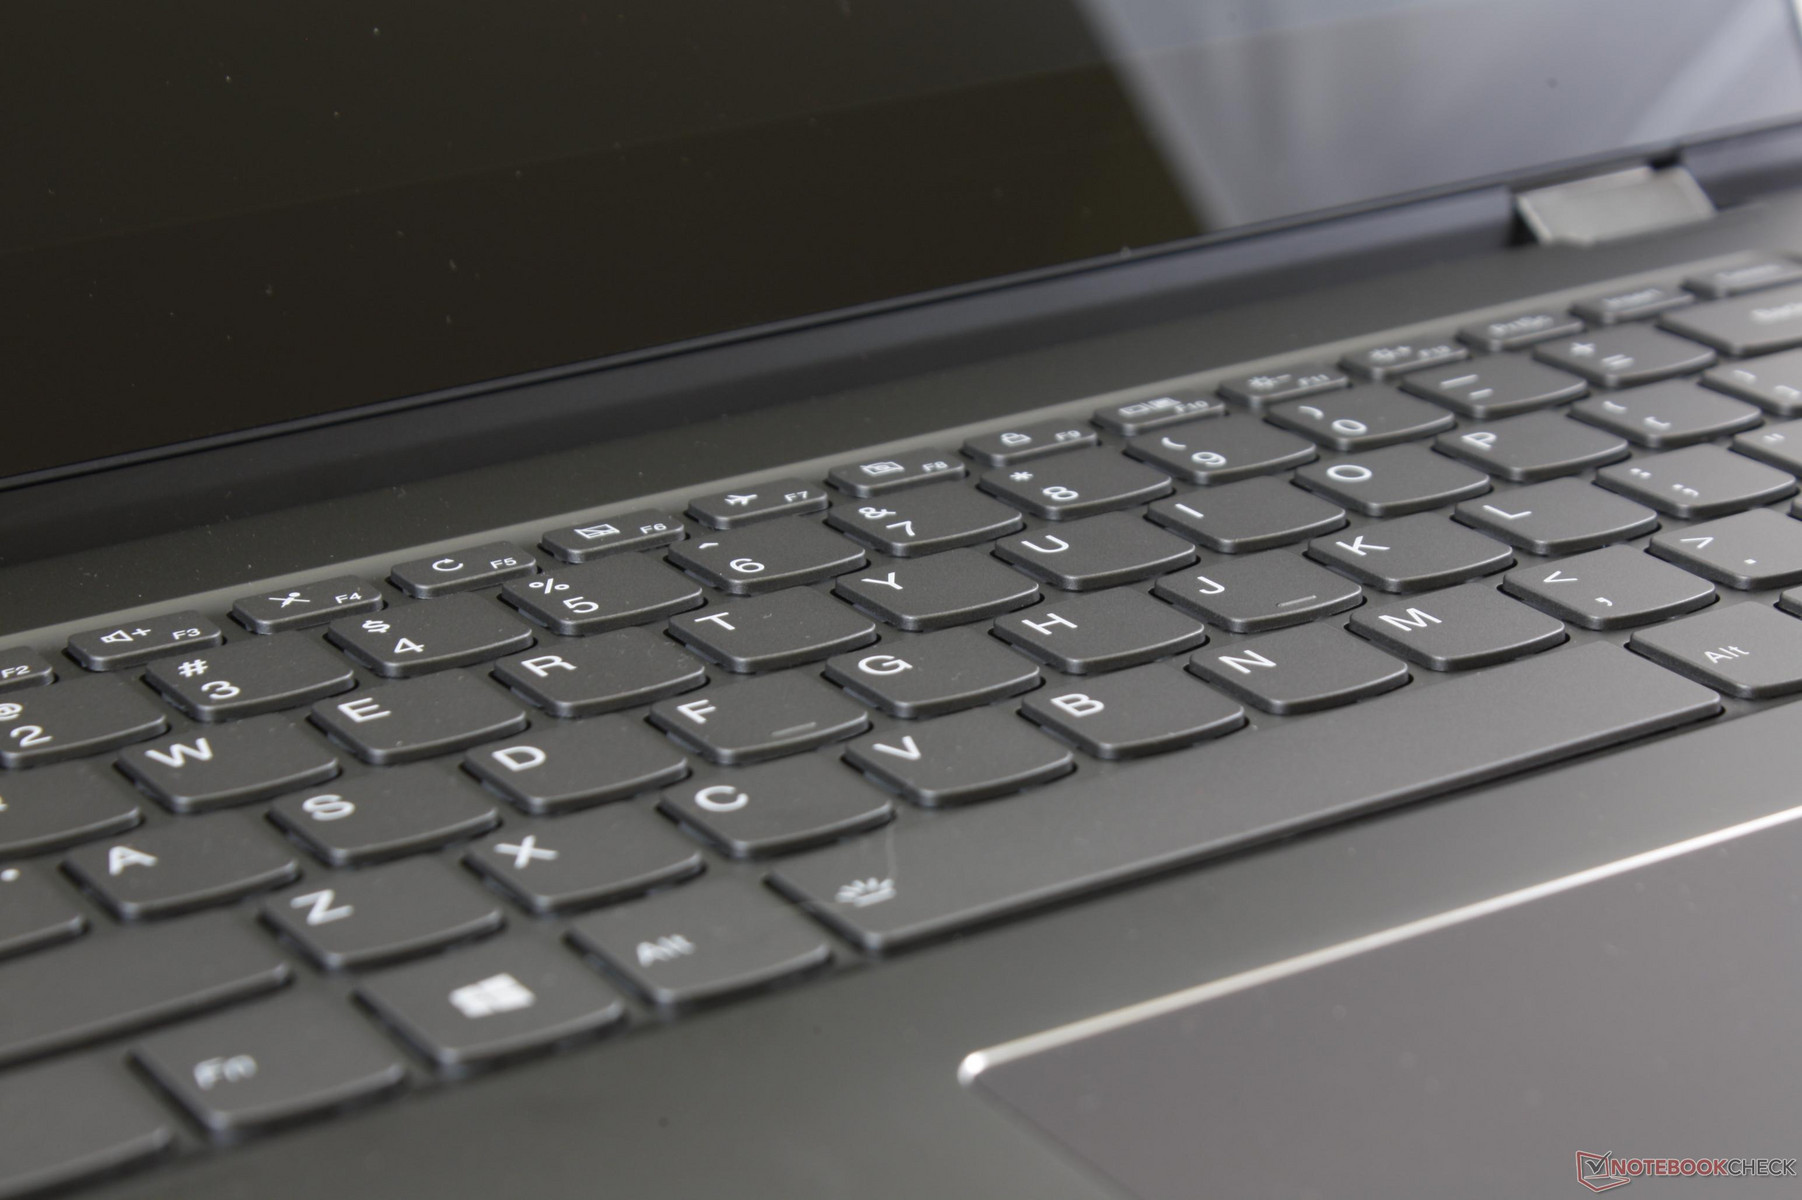
The keyboard (27.8 x 10.5 cm) is essentially identical to what the Ideapad series has to offer. Users who have typed on the Ideapad 530S or 720S will know what to expect from the Flex 5 15. The flat keys are shallow and relatively quiet with a low-medium level of feedback. The Enter key and small top row of Function keys could have benefited from being firmer.
A two-level white backlight is included across all SKUs.
Touchpad
The Precision trackpad (10.5 x 7.0 cm) is smaller than the trackpads on the XPS 15 (10.5 x 8.5 cm) and Zenbook Flip 15 (10.5 x 7.3 cm). Fortunately, glide is still smooth and responsive without any issues. The integrated click keys are a bit soft and could have been firmer. They also tend to stick and so rapid clicks are more difficult to perform than they should be.
Display
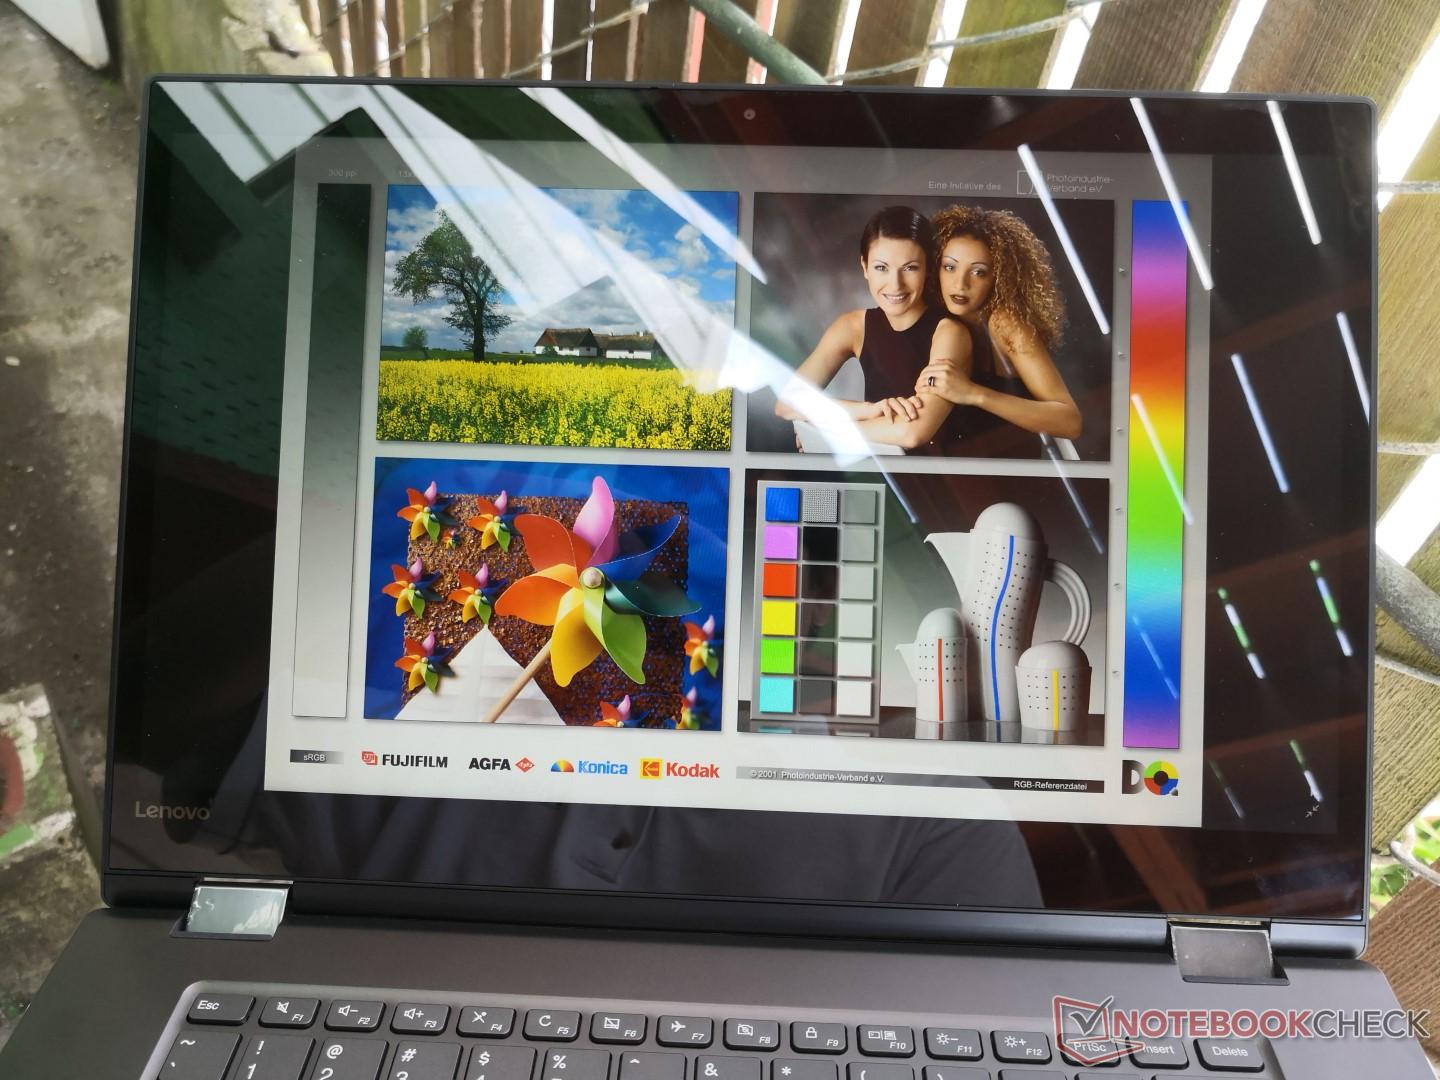
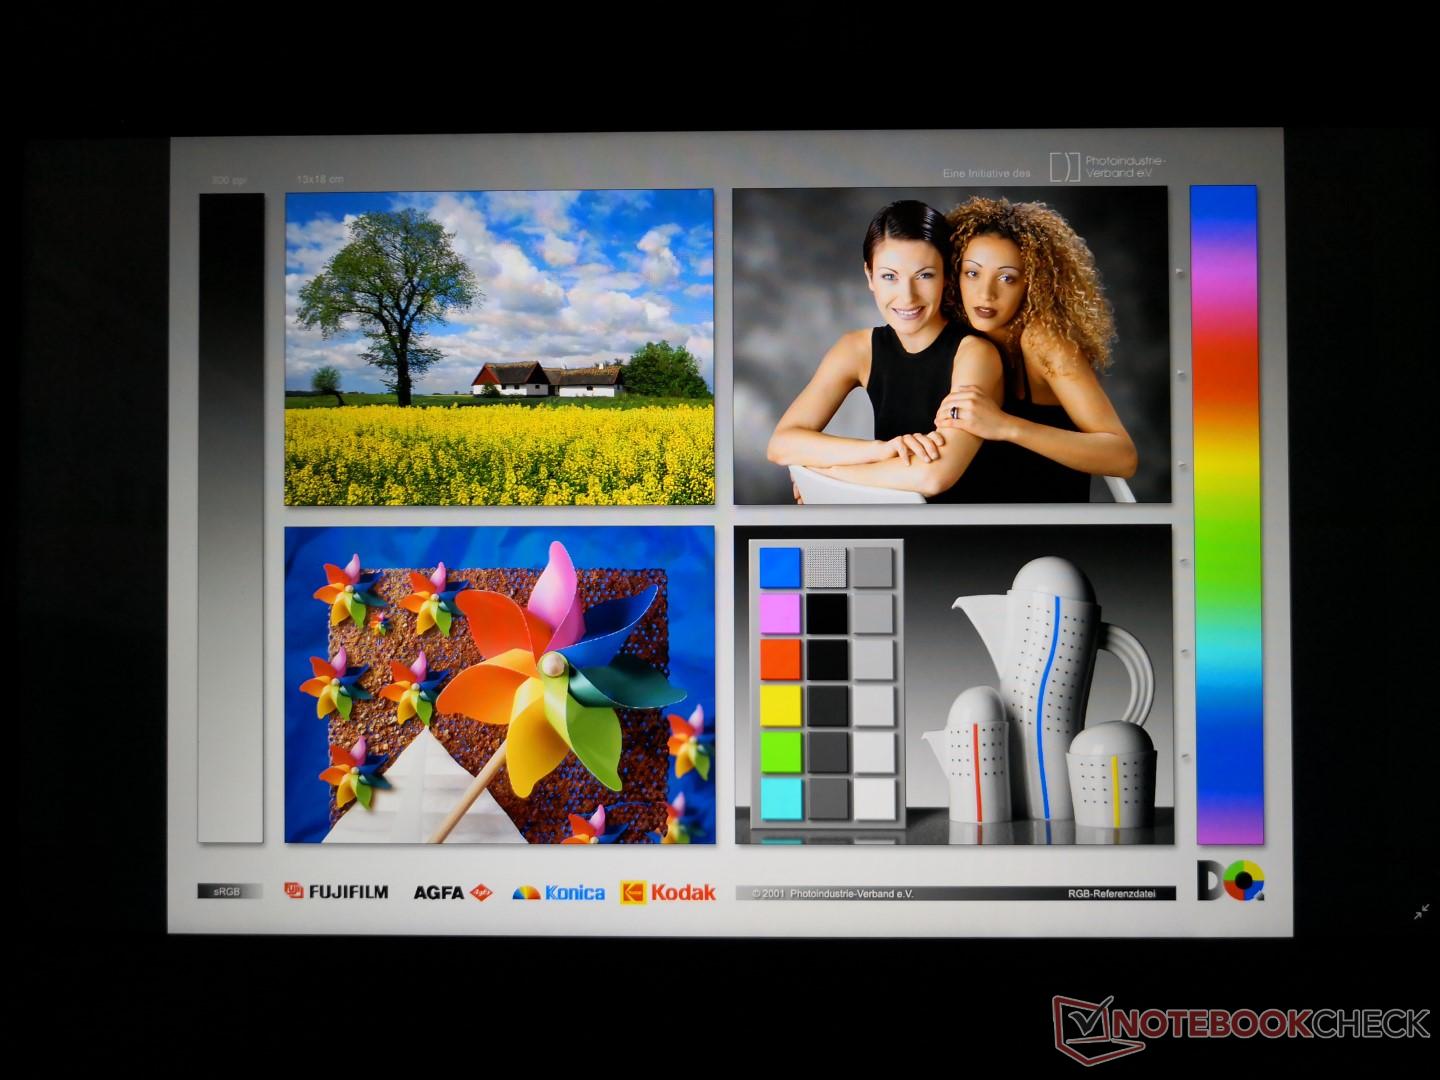
The glossy 1080p IPS touchscreen is crisp if not unexceptional. Its dim backlight and narrow gamut prevent colors from popping and leaving a better impression. In fact, the Flex 5 has one of the dimmest displays we've tested on a 15-inch notebook with an average of just 185 nits. The Ideapad 530S is almost 50 percent brighter while the MacBook Pro 15 can reach over 500 nits. Contrast is otherwise good for its price range to reduce muddy grays and blacks during video playback. WACOM pens are supported including the Lenovo Active Pen.
It's worth noting that the same BOE NV156FHM-N48 panel can also be found on the budget 15-inch Acer Aspire 3 SF315 and the two systems share very similar colors, contrast, and response times as a result.
Our unit suffers from some uneven backlight bleeding as shown by the image below that can become noticeable during video playback with black borders. Users sensitive to onscreen flickering should keep in mind that pulse-width modulation is present on all brightness levels except maximum.


| |||||||||||||||||||||||||
Brightness Distribution: 82 %
Center on Battery: 196.3 cd/m²
Contrast: 755:1 (Black: 0.26 cd/m²)
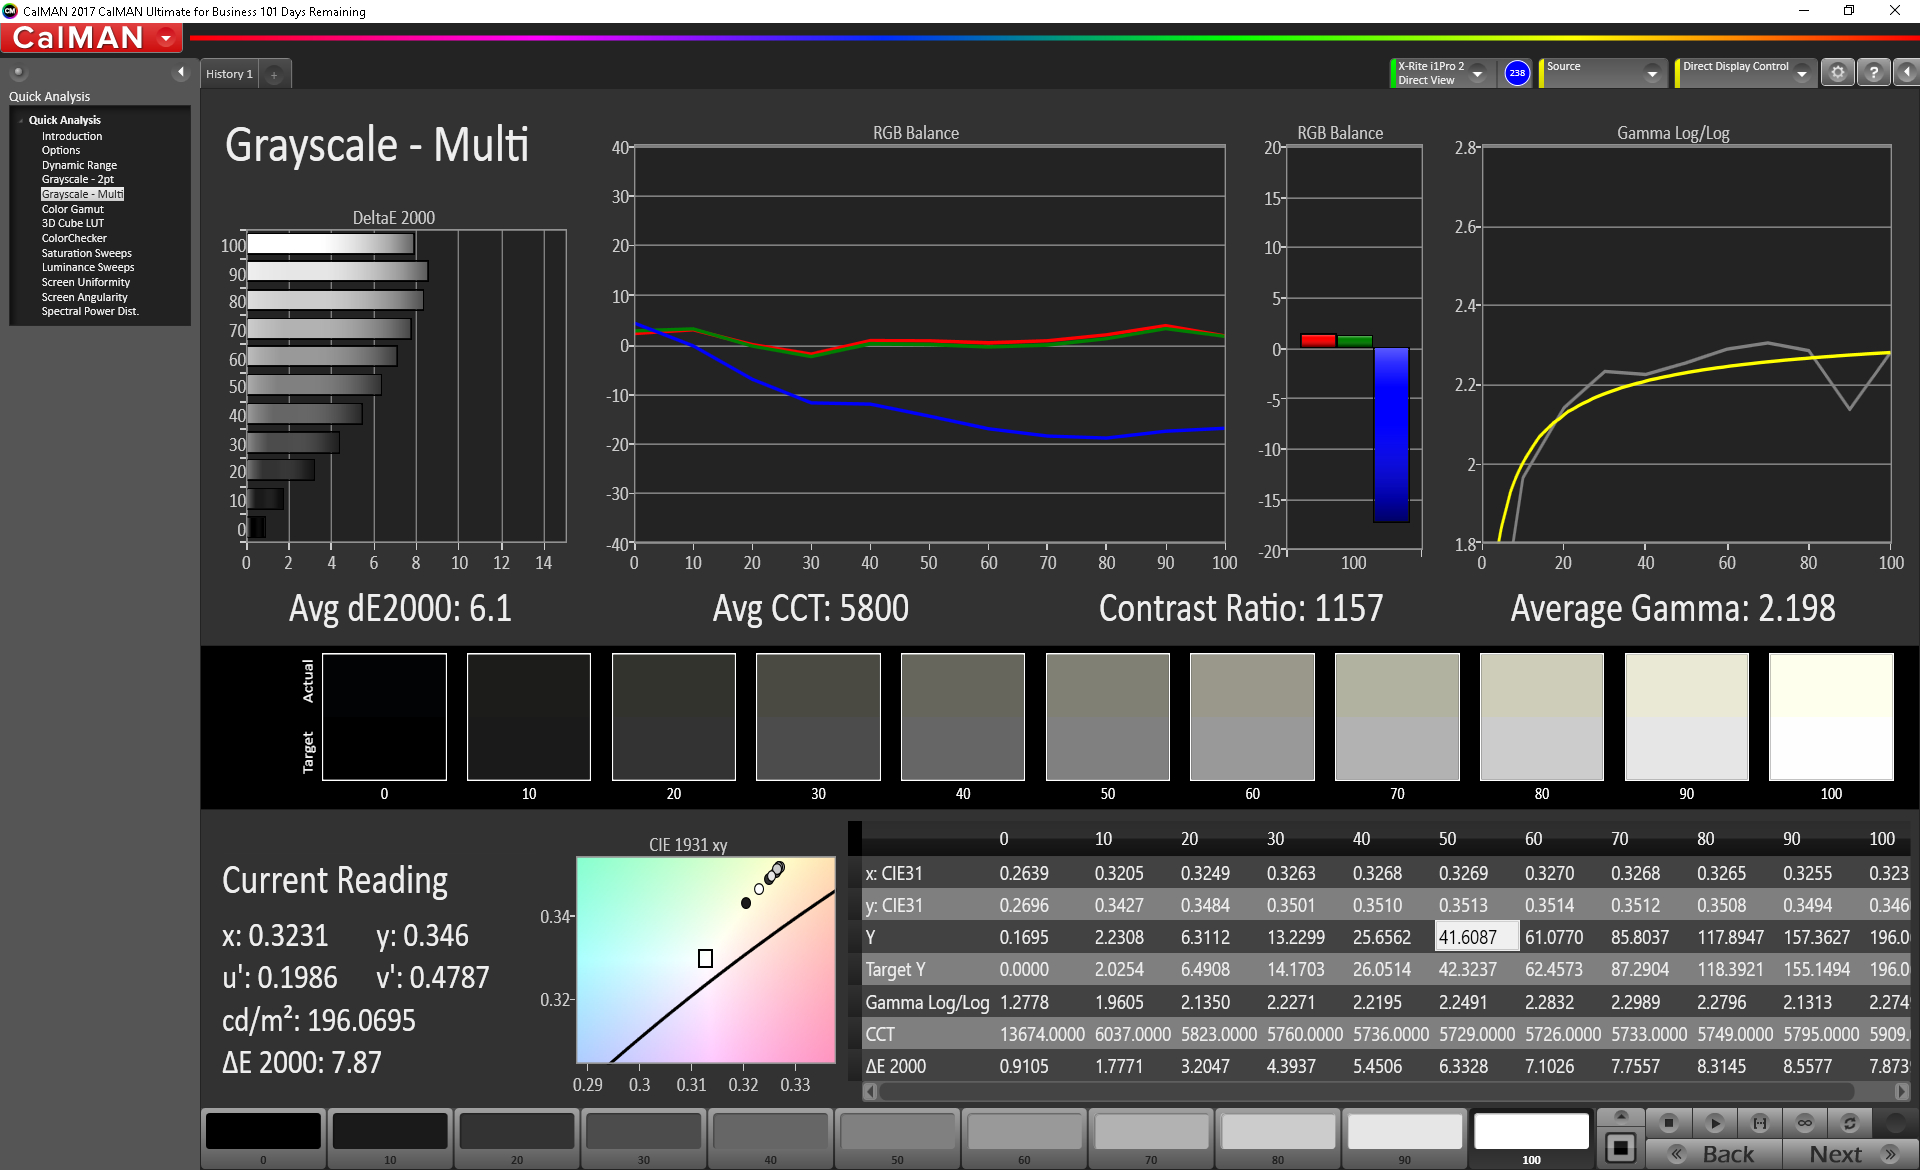
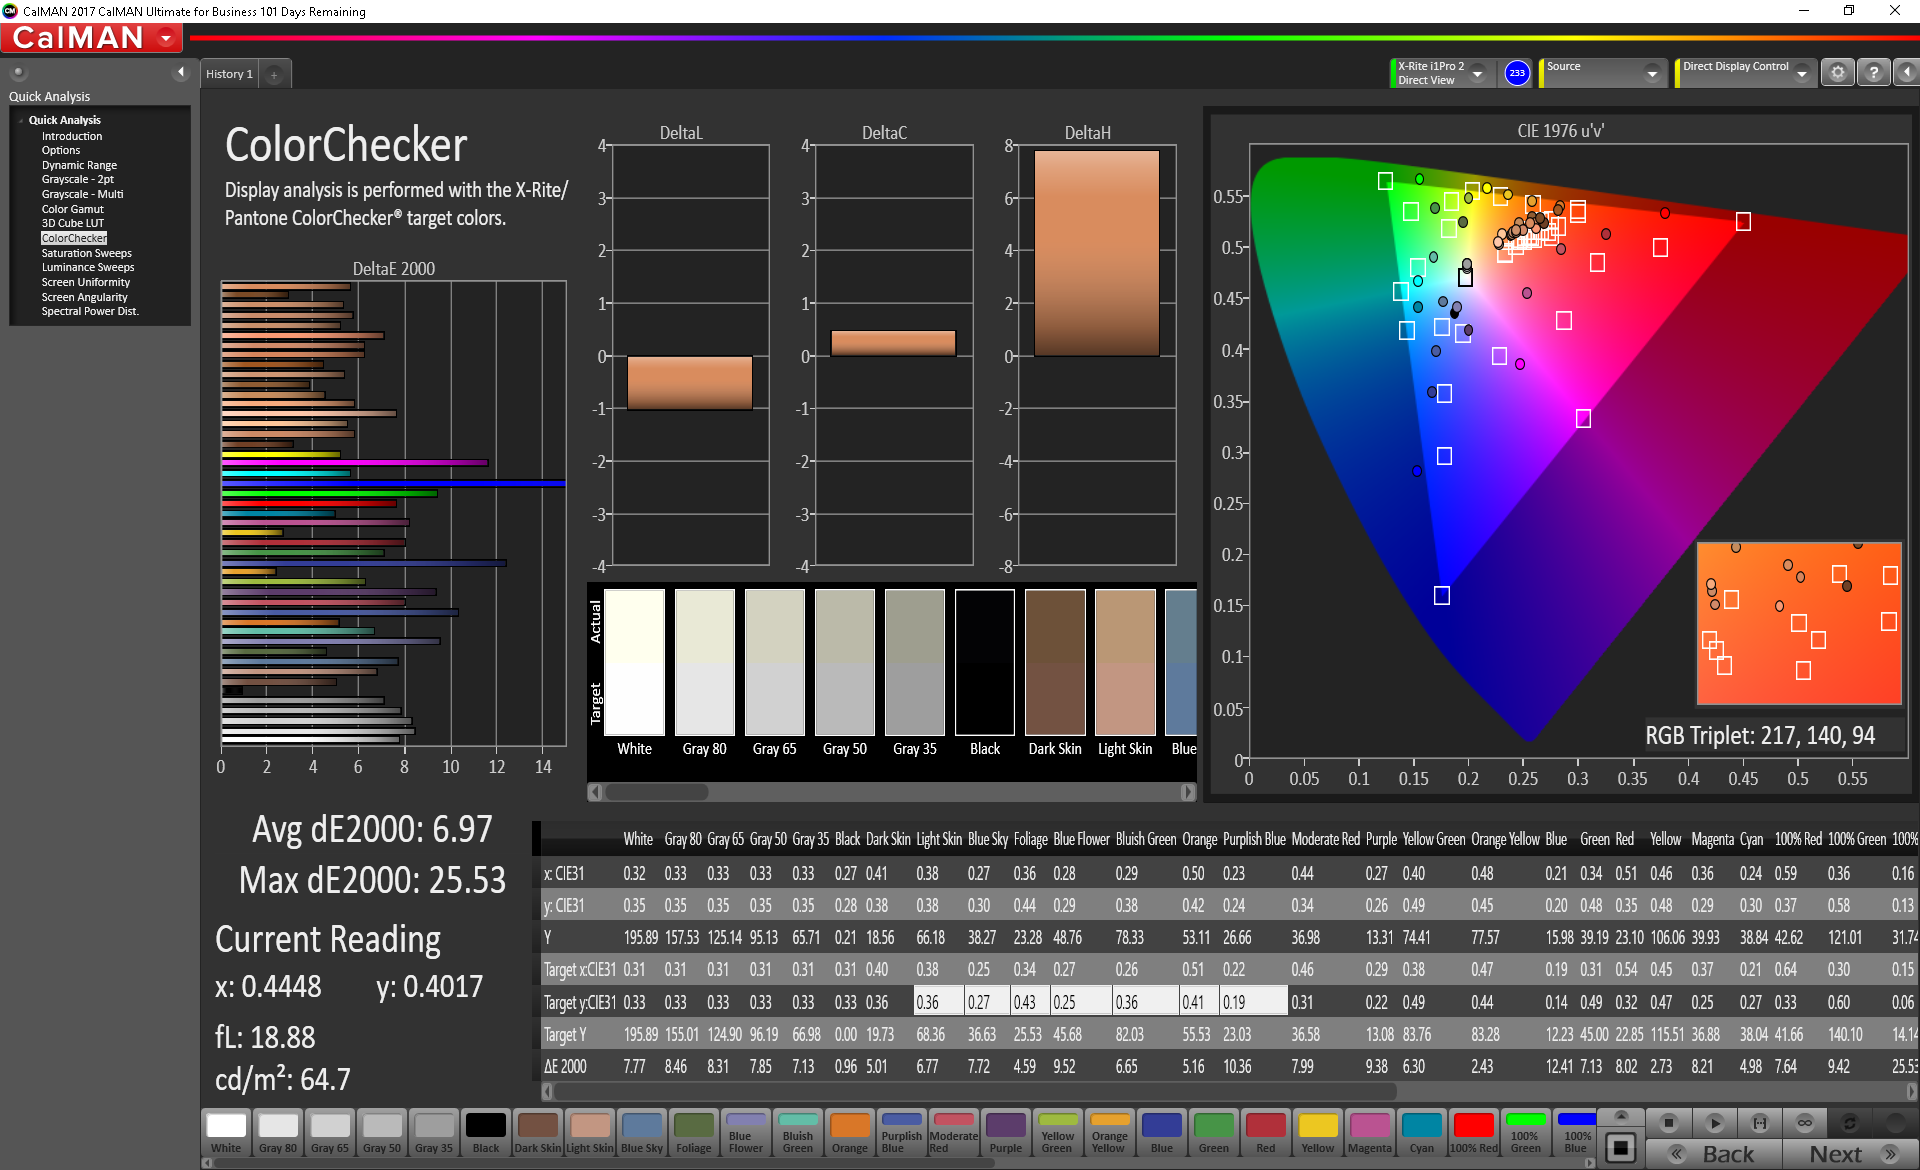
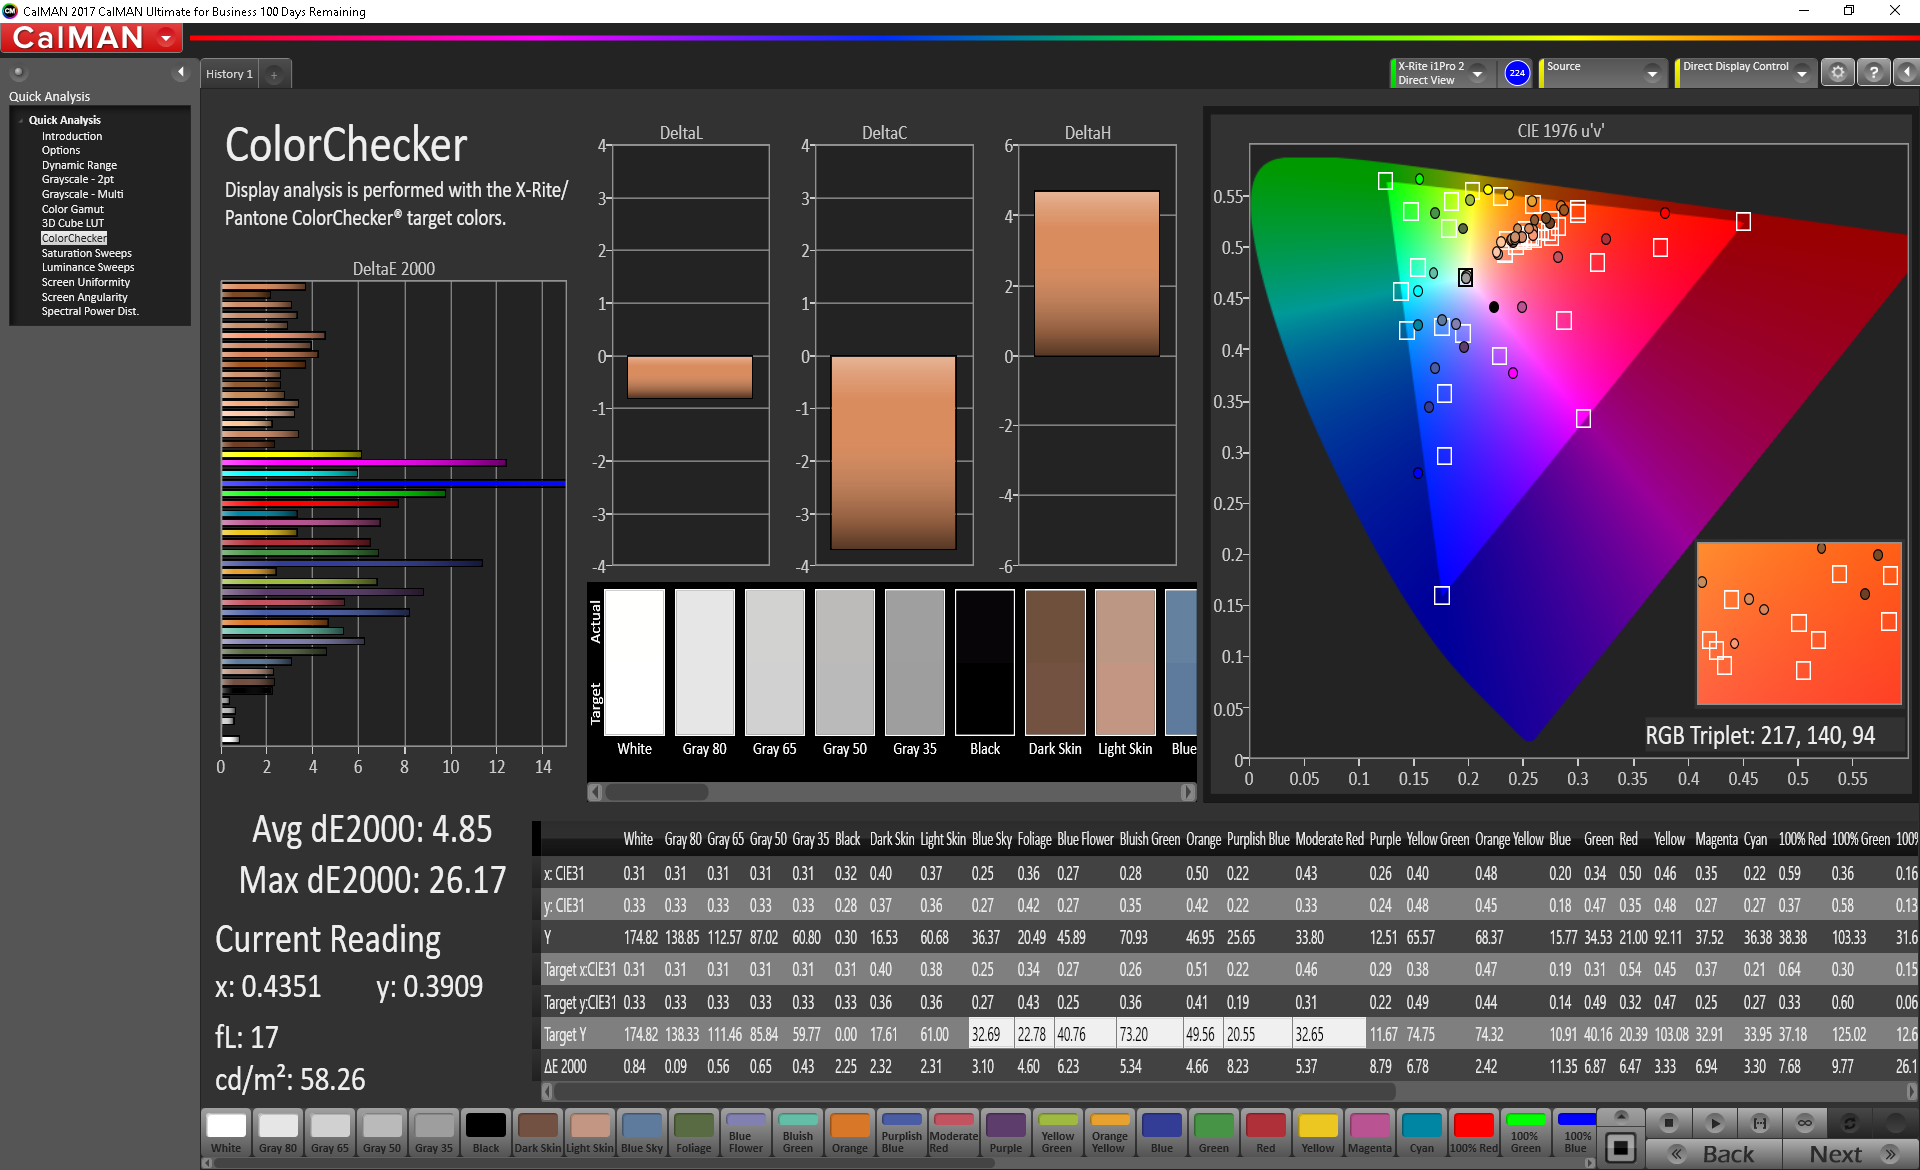
ΔE ColorChecker Calman: 6.97 | ∀{0.5-29.43 Ø4.72}
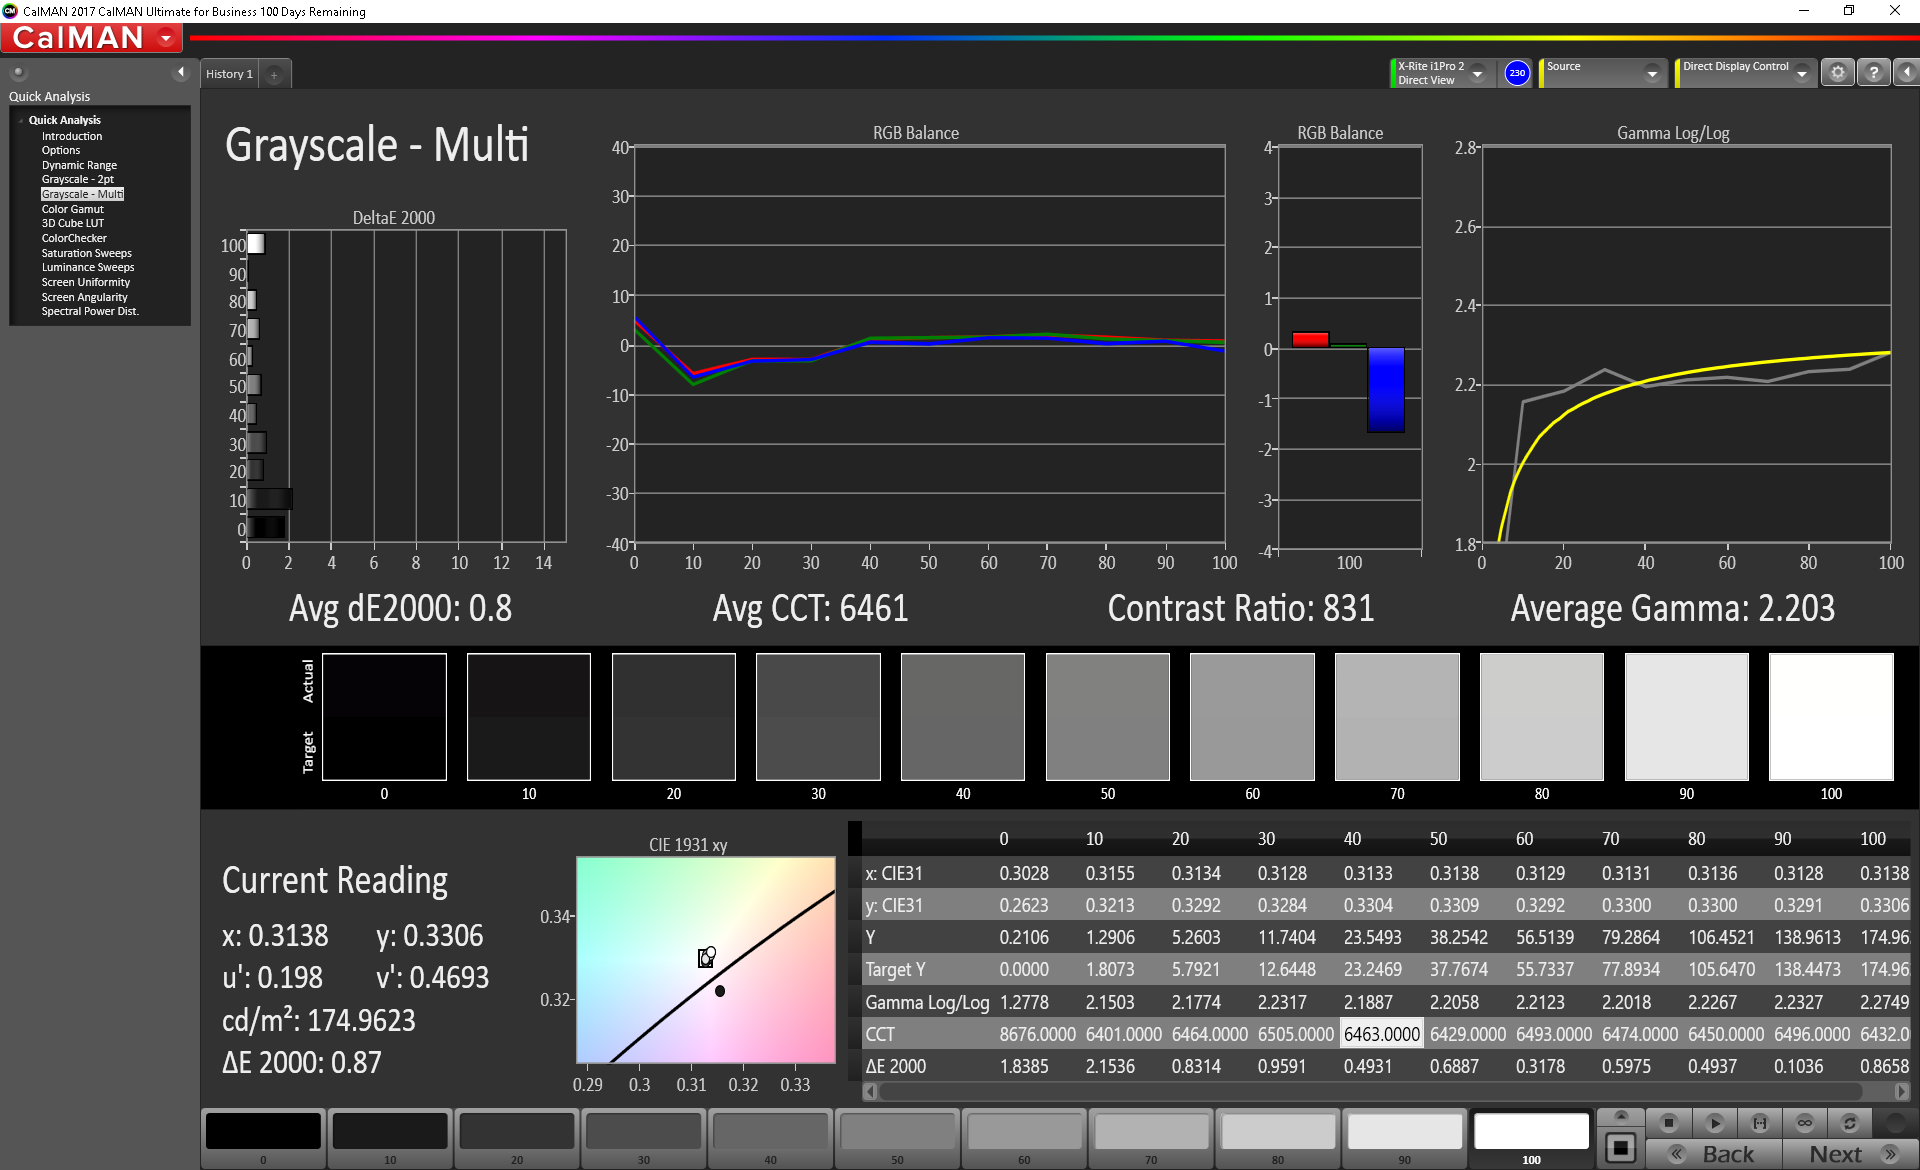
calibrated: 4.85
ΔE Greyscale Calman: 6.1 | ∀{0.09-98 Ø4.97}
57.7% sRGB (Argyll 1.6.3 3D)
37.4% AdobeRGB 1998 (Argyll 1.6.3 3D)
41.77% AdobeRGB 1998 (Argyll 3D)
58.2% sRGB (Argyll 3D)
40.43% Display P3 (Argyll 3D)
Gamma: 2.2
CCT: 5800 K
| Lenovo IdeaPad Flex-1570 81CA000RUS NV156FHM-N48, IPS, 15.6", 1920x1080 | Dell XPS 15 9575 i7-8705G Sharp SHP148D, IPS, 15.6", 3840x2160 | Lenovo Ideapad 530S-15IKB N156HCA-EAB, IPS, 15.6", 1920x1080 | Huawei MateBook D 15-53010BAJ AU Optronics B156HW02, IPS, 15.6", 1920x1080 | Asus ZenBook Flip 15 UX561UD B156ZAN03.1, IPS, 15.6", 3840x2160 | Acer Swift 3 SF315-41G-R6BR BOE CQ NV156FHM-N48, IPS, 15.6", 1920x1080 | |
|---|---|---|---|---|---|---|
| Display | 84% | 5% | 2% | 108% | -0% | |
| Display P3 Coverage (%) | 40.43 | 78.7 95% | 41.84 3% | 40.96 1% | 86.6 114% | 40.1 -1% |
| sRGB Coverage (%) | 58.2 | 97.9 68% | 62.4 7% | 60.9 5% | 100 72% | 59 1% |
| AdobeRGB 1998 Coverage (%) | 41.77 | 79.2 90% | 43.32 4% | 42.24 1% | 99.5 138% | 41.43 -1% |
| Response Times | -24% | -5% | 5% | -19% | -9% | |
| Response Time Grey 50% / Grey 80% * (ms) | 37.6 ? | 48.4 ? -29% | 37.2 ? 1% | 36.4 ? 3% | 52 ? -38% | 43 ? -14% |
| Response Time Black / White * (ms) | 29.2 ? | 34.8 ? -19% | 32.4 ? -11% | 27.2 ? 7% | 29 ? 1% | 30 ? -3% |
| PWM Frequency (Hz) | 21190 ? | 1000 ? | 25770 ? | 1471 ? | ||
| Screen | 72% | 23% | 16% | 63% | 29% | |
| Brightness middle (cd/m²) | 196.3 | 488 149% | 285.1 45% | 265.7 35% | 380 94% | 284 45% |
| Brightness (cd/m²) | 185 | 440 138% | 271 46% | 258 39% | 371 101% | 254 37% |
| Brightness Distribution (%) | 82 | 81 -1% | 88 7% | 91 11% | 87 6% | 80 -2% |
| Black Level * (cd/m²) | 0.26 | 0.3 -15% | 0.28 -8% | 0.31 -19% | 0.28 -8% | 0.29 -12% |
| Contrast (:1) | 755 | 1627 115% | 1018 35% | 857 14% | 1357 80% | 979 30% |
| Colorchecker dE 2000 * | 6.97 | 3.16 55% | 4.38 37% | 6.01 14% | 4.38 37% | 4.22 39% |
| Colorchecker dE 2000 max. * | 25.53 | 8.8 66% | 24.07 6% | 18.87 26% | 7.59 70% | 9.29 64% |
| Colorchecker dE 2000 calibrated * | 4.85 | 3.95 19% | 3.94 19% | |||
| Greyscale dE 2000 * | 6.1 | 3.3 46% | 3.1 49% | 5 18% | 3.6 41% | 1.17 81% |
| Gamma | 2.2 100% | 2.178 101% | 2.24 98% | 2.7 81% | 2.32 95% | 2.39 92% |
| CCT | 5800 112% | 6811 95% | 6705 97% | 6569 99% | 6860 95% | 6360 102% |
| Color Space (Percent of AdobeRGB 1998) (%) | 37.4 | 71.7 92% | 40 7% | 42.24 13% | 88 135% | 38 2% |
| Color Space (Percent of sRGB) (%) | 57.7 | 97.9 70% | 62 7% | 60.92 6% | 100 73% | 59 2% |
| Total Average (Program / Settings) | 44% /
61% | 8% /
16% | 8% /
12% | 51% /
61% | 7% /
18% |
* ... smaller is better
Color space is only 37 percent and 58 percent of the AdobeRGB and sRGB standards, respectively. These results are typical of budget panels where <60 percent sRGB coverage is common. Very accurate colors are generally unimportant for home or multimedia use, but alternative 15-inch convertibles with full sRGB coverage is available from Dell, Asus, and HP for more vibrant colors.
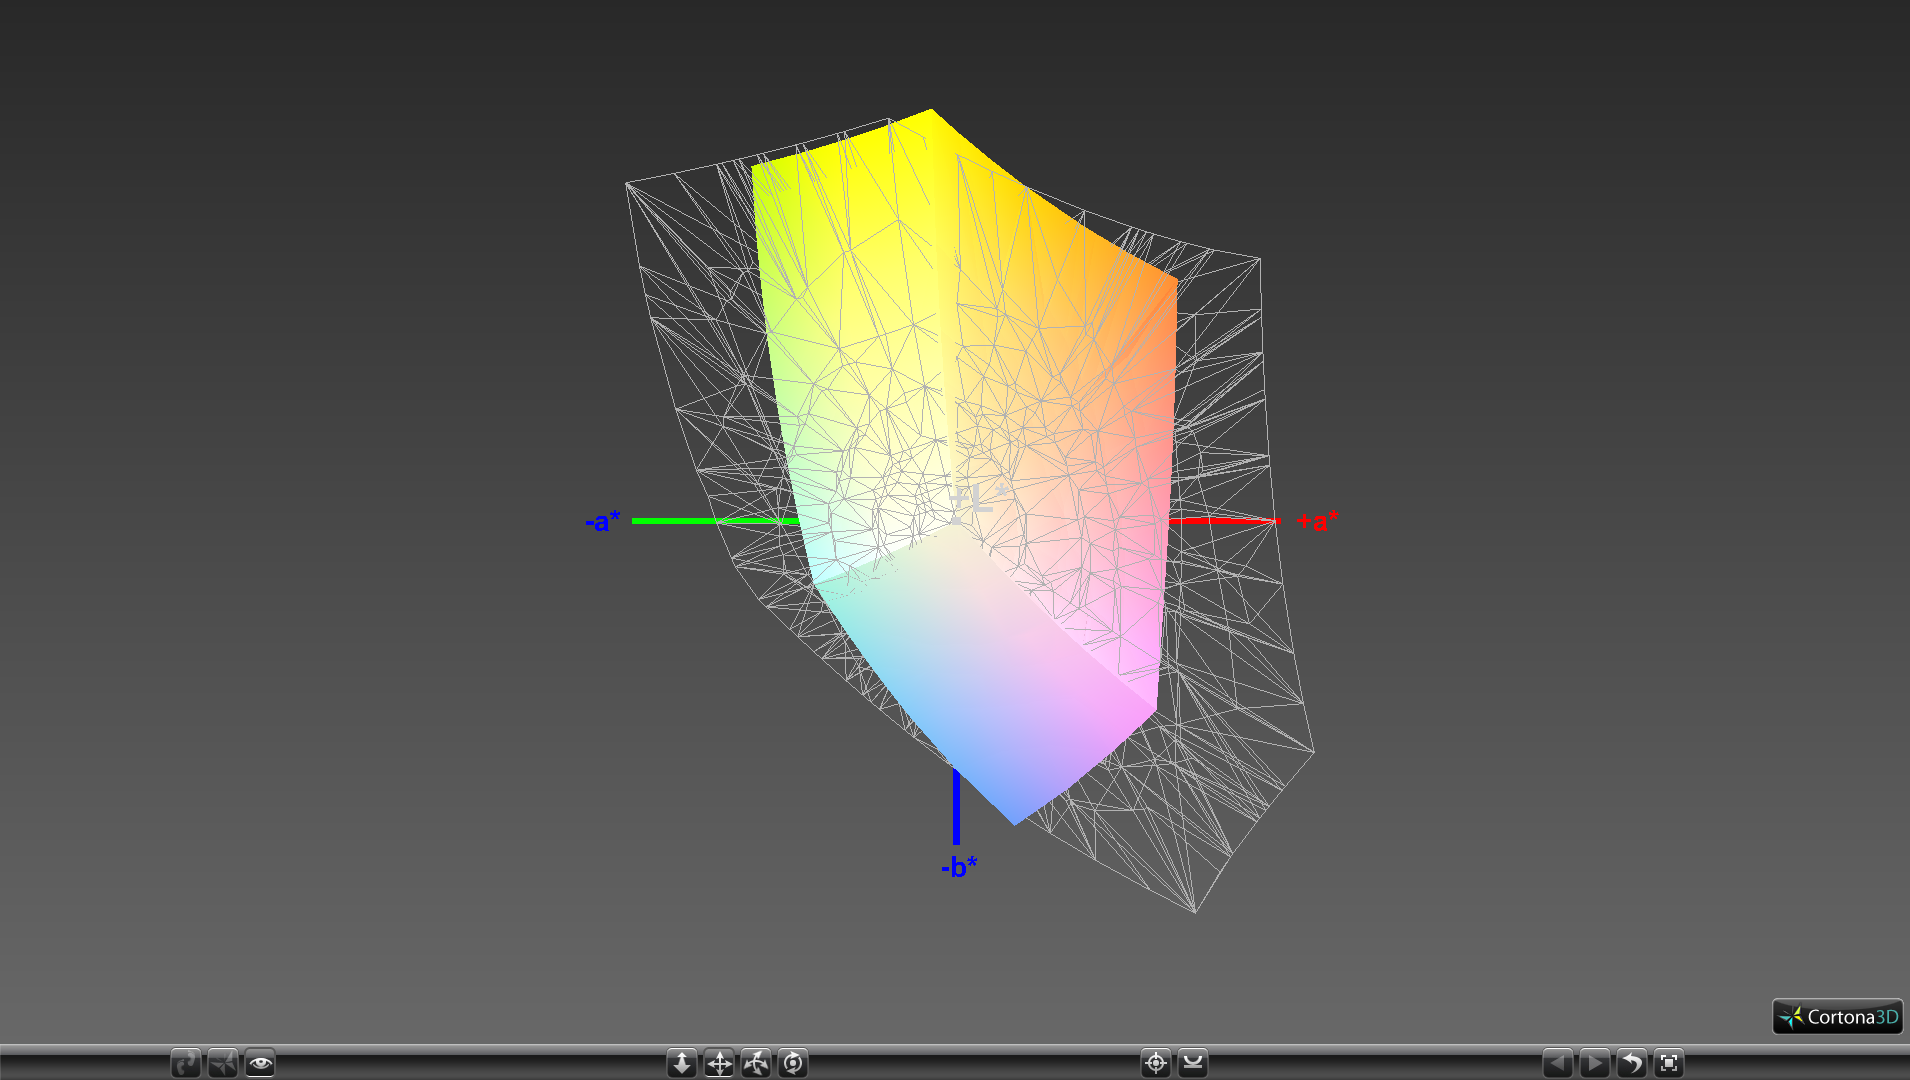
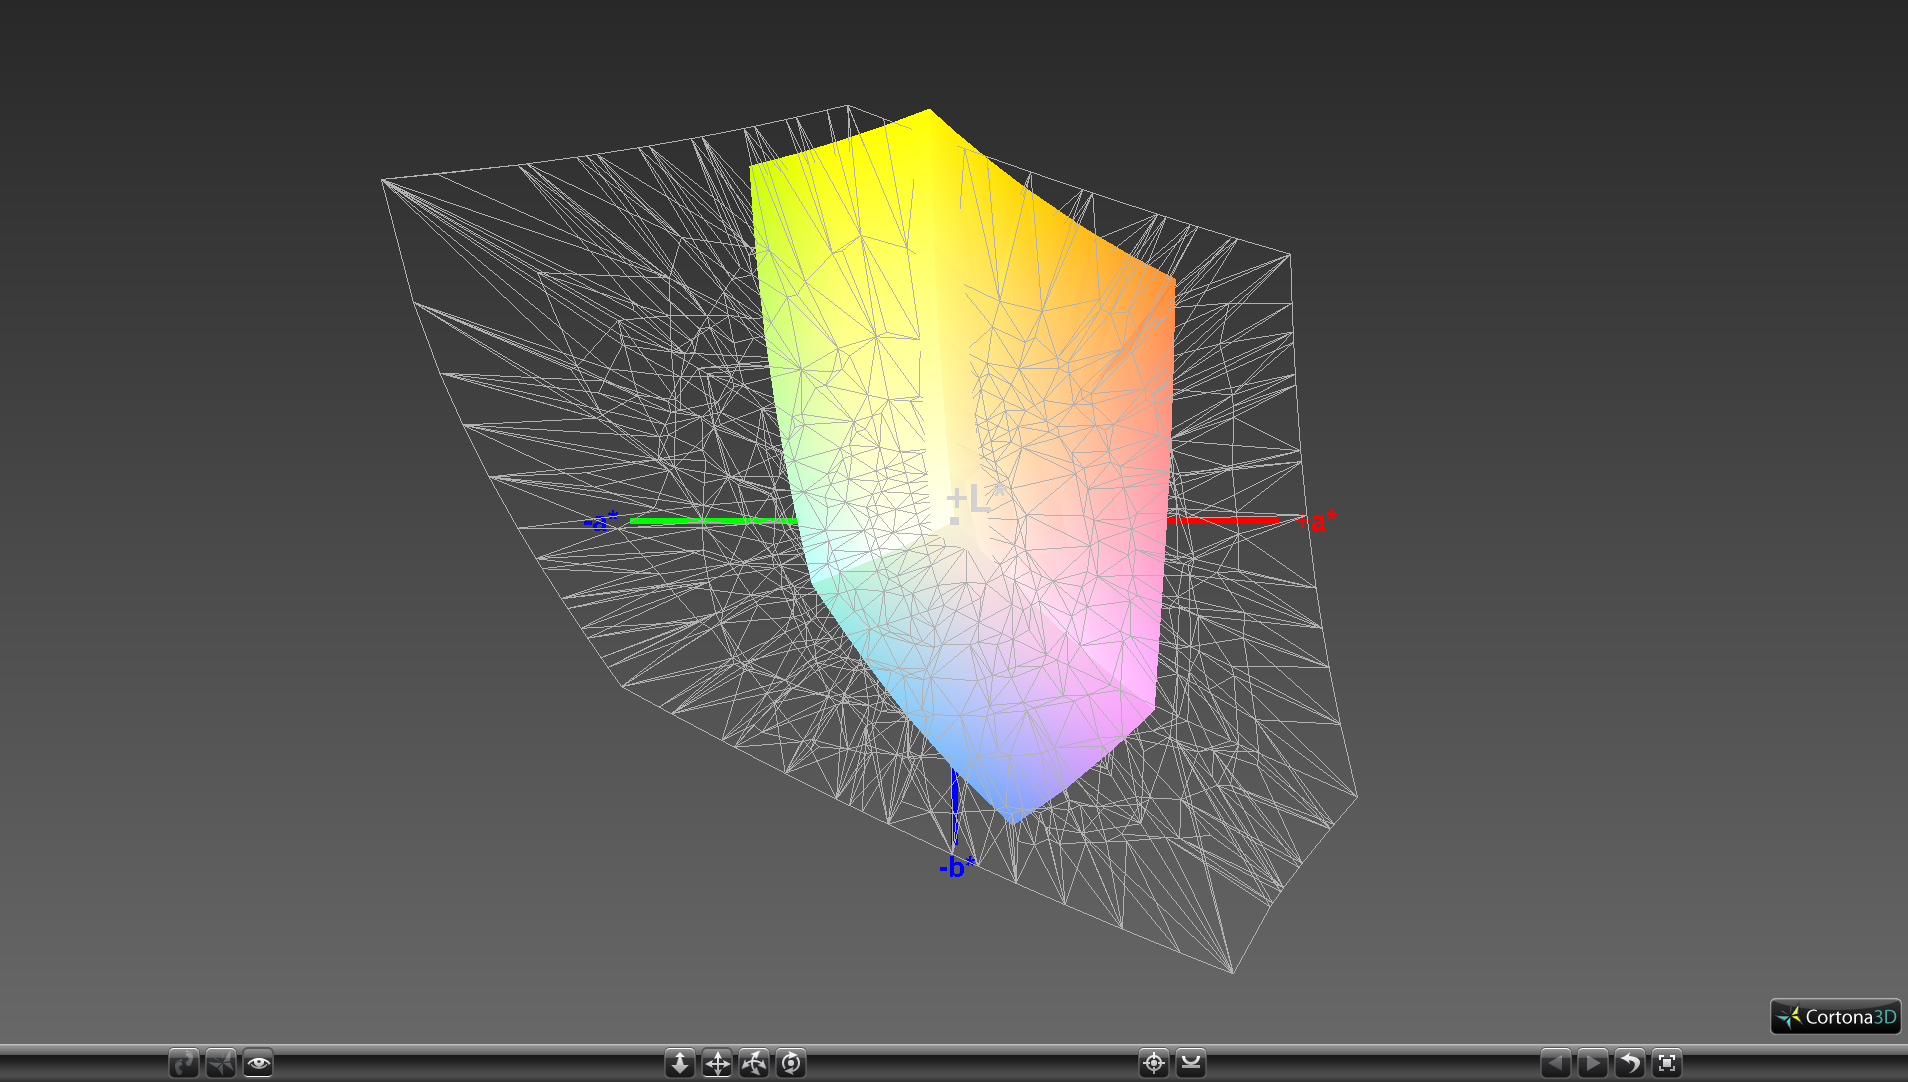
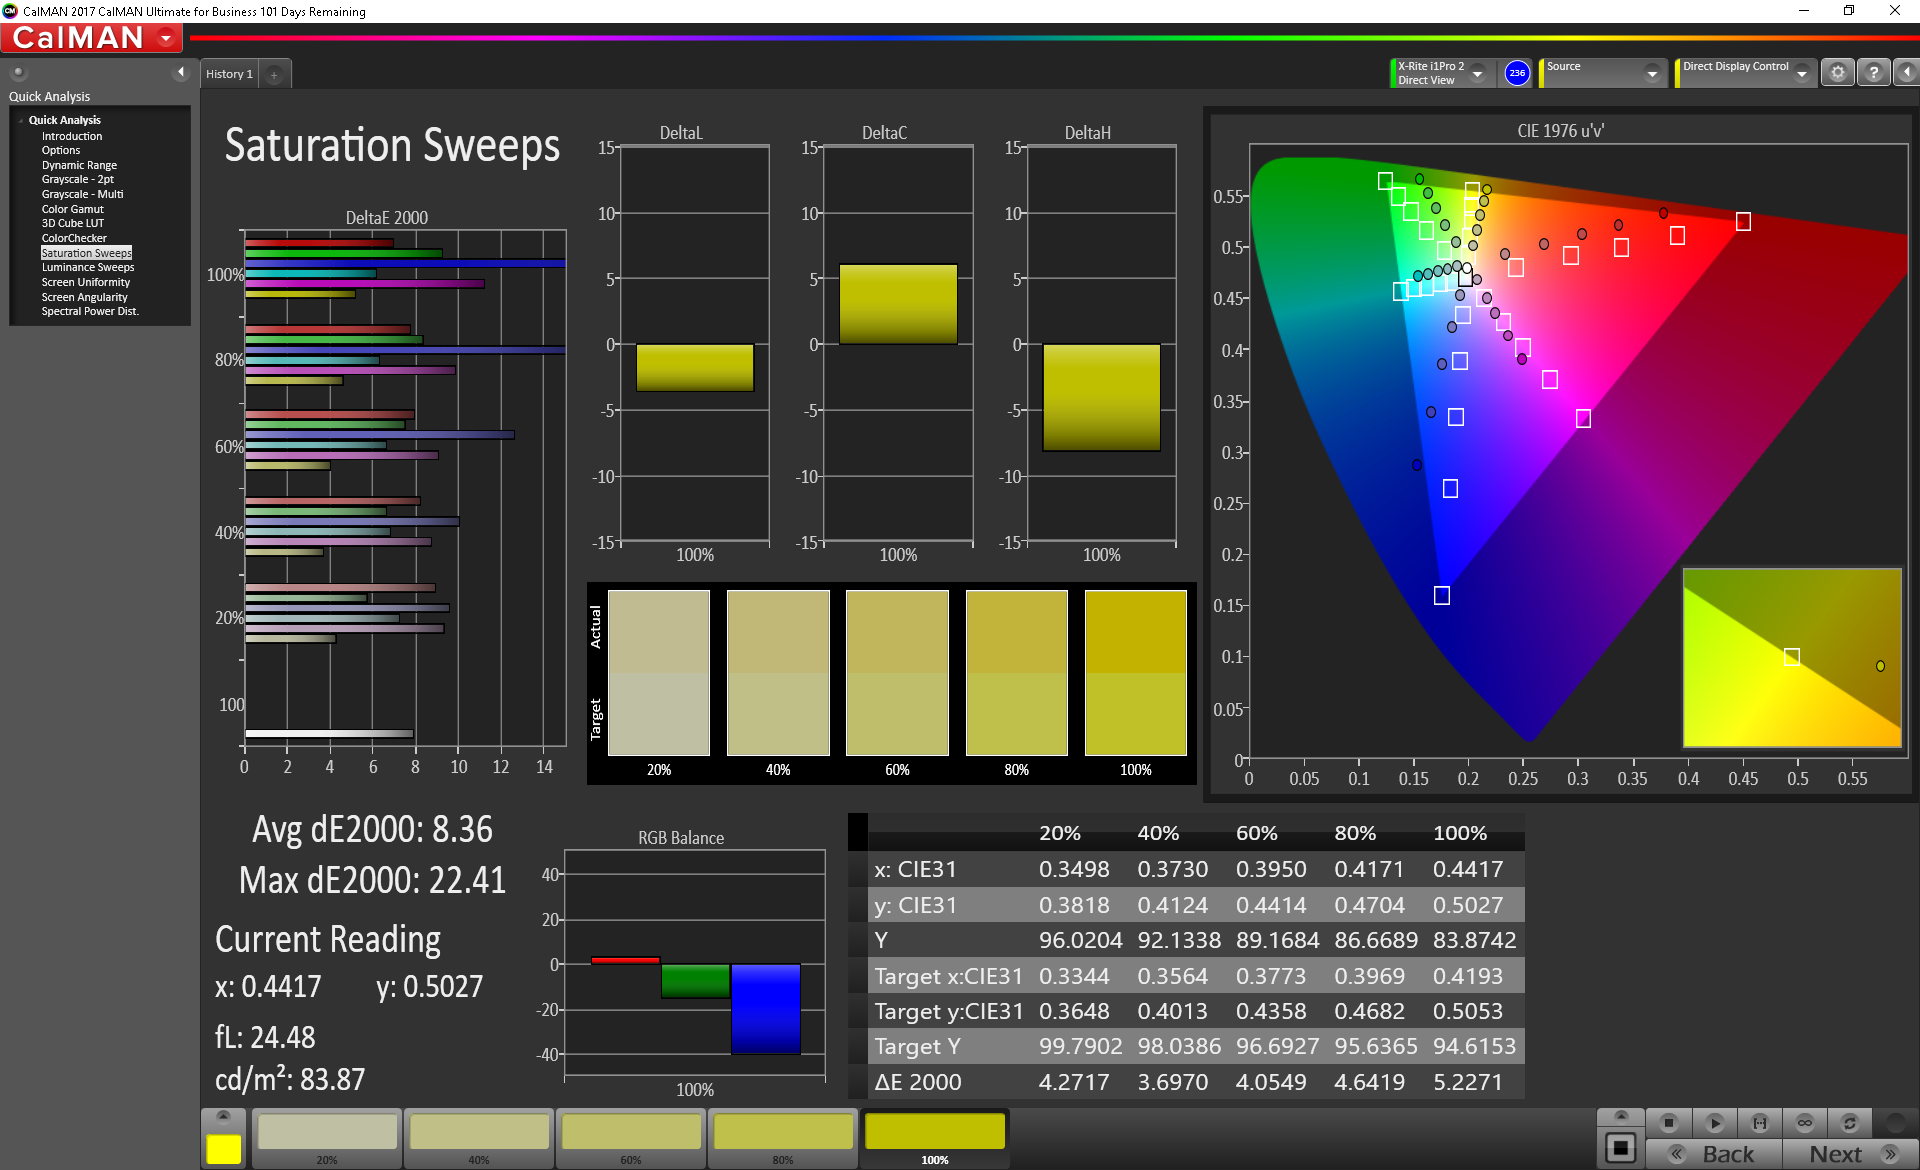
Further analyses with a X-Rite spectrophotometer reveal an overly warm color temperature and generally inaccurate colors across all tested saturation levels. Our calibration attempts improve grayscale and RGB balance significantly and we recommend applying our ICC profile above to get more out of the display. Colors will still be inaccurate at higher saturation levels due to the limited reproducible color gamut of the panel.

Display Response Times
| ↔ Response Time Black to White | ||
|---|---|---|
| 29.2 ms ... rise ↗ and fall ↘ combined | ↗ 17.6 ms rise | 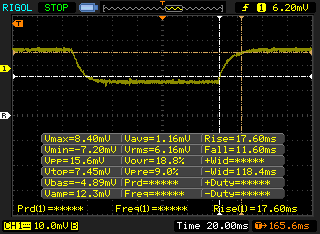 |
| ↘ 11.6 ms fall | ||
| The screen shows relatively slow response rates in our tests and may be too slow for gamers. In comparison, all tested devices range from 0.1 (minimum) to 240 (maximum) ms. » 78 % of all devices are better. This means that the measured response time is worse than the average of all tested devices (19.8 ms). | ||
| ↔ Response Time 50% Grey to 80% Grey | ||
| 37.6 ms ... rise ↗ and fall ↘ combined | ↗ 19.2 ms rise | 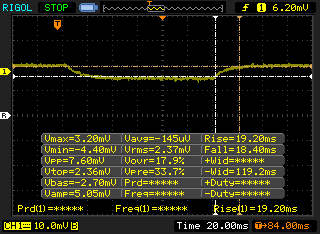 |
| ↘ 18.4 ms fall | ||
| The screen shows slow response rates in our tests and will be unsatisfactory for gamers. In comparison, all tested devices range from 0.165 (minimum) to 636 (maximum) ms. » 55 % of all devices are better. This means that the measured response time is worse than the average of all tested devices (31 ms). | ||
Screen Flickering / PWM (Pulse-Width Modulation)
| Screen flickering / PWM detected | 21190 Hz | ≤ 99 % brightness setting | 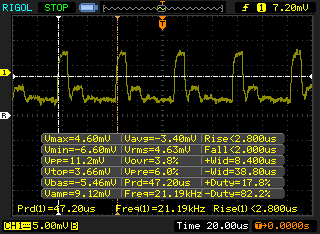 |
The display backlight flickers at 21190 Hz (worst case, e.g., utilizing PWM) Flickering detected at a brightness setting of 99 % and below. There should be no flickering or PWM above this brightness setting. The frequency of 21190 Hz is quite high, so most users sensitive to PWM should not notice any flickering. In comparison: 52 % of all tested devices do not use PWM to dim the display. If PWM was detected, an average of 7747 (minimum: 5 - maximum: 343500) Hz was measured. | |||
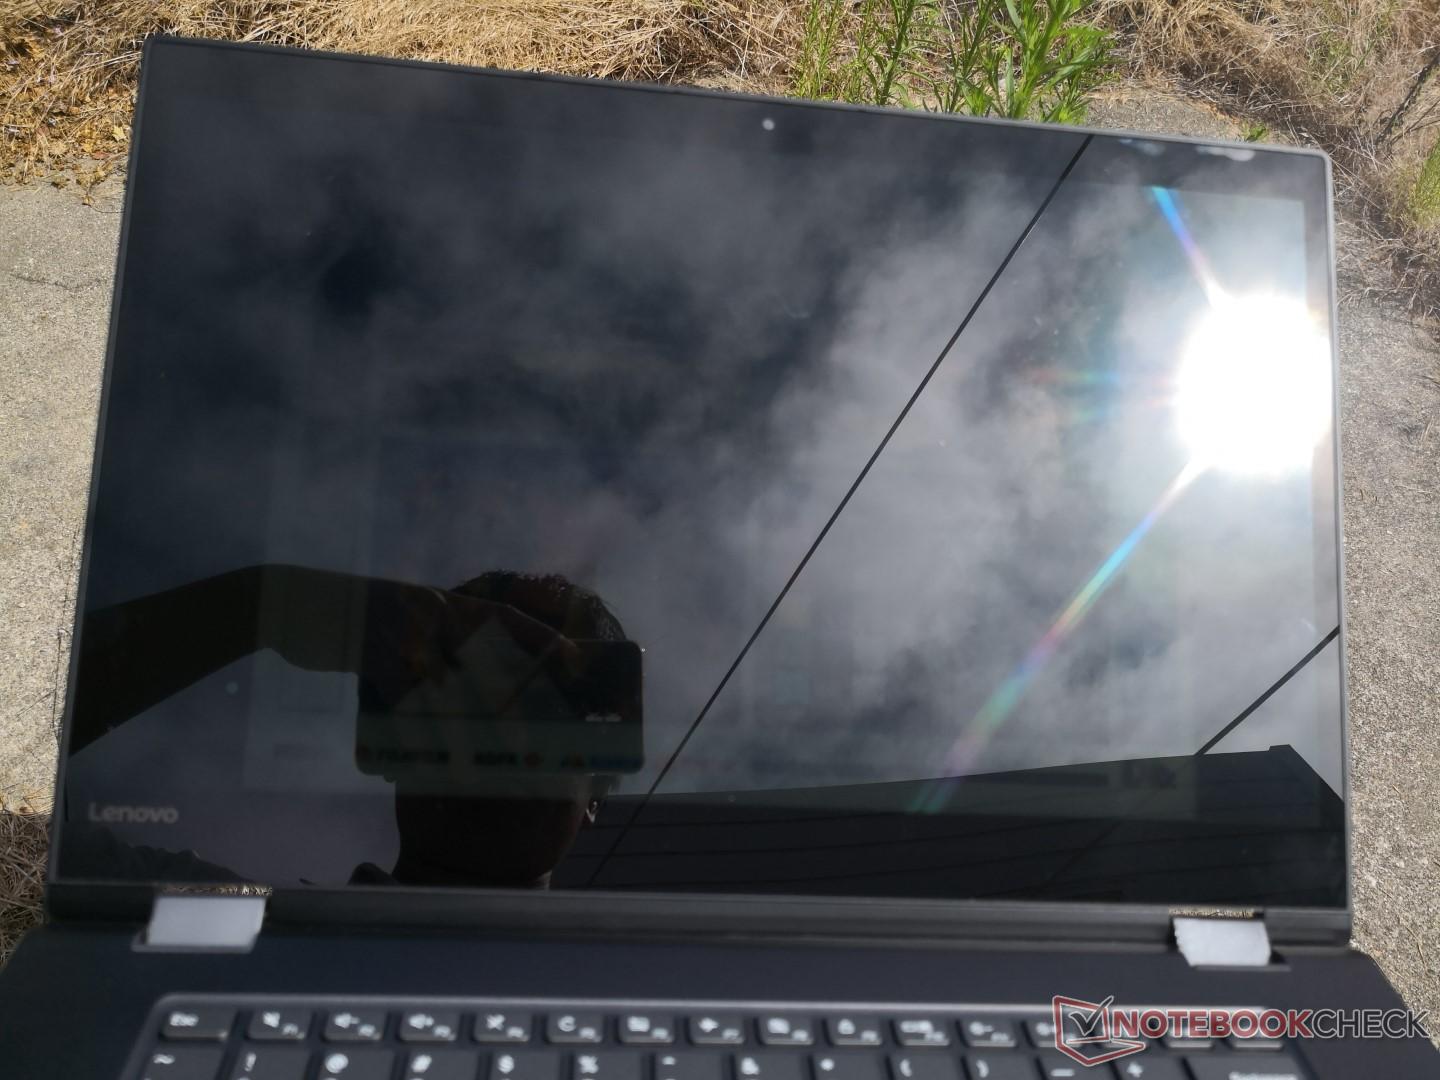
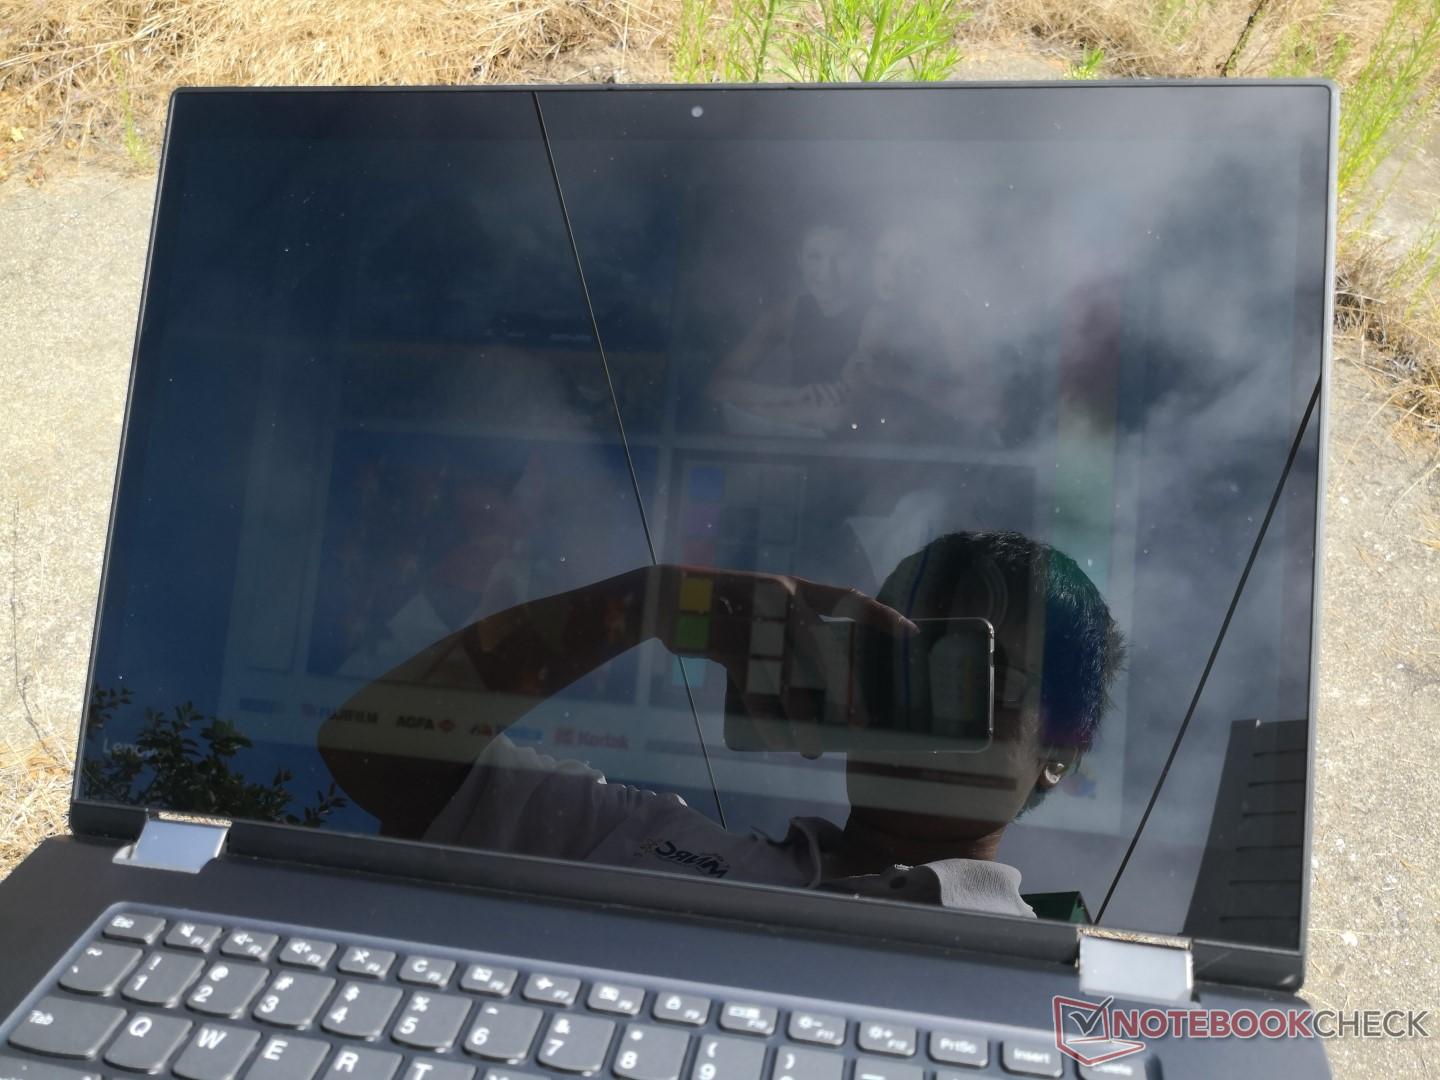
Outdoor visibility is average at best because of the dim backlight. Be prepared to squint at every word and fend off glare from the glossy display even if under shade. The Flex 5 is a poor outdoor companion despite its versatile form factor.
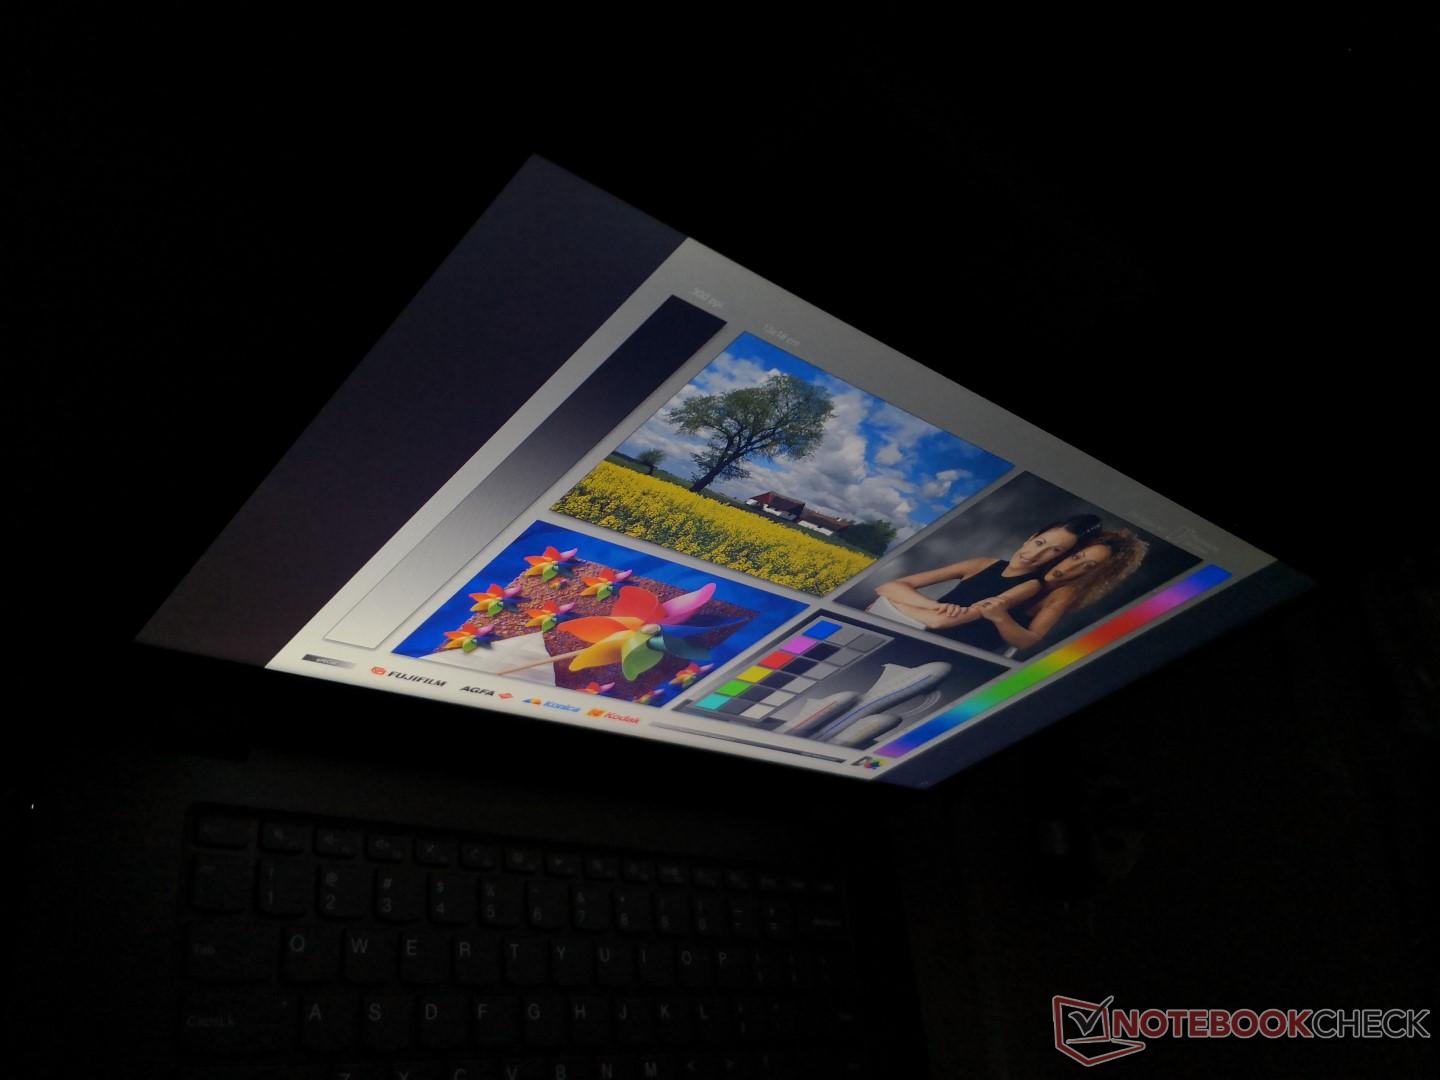
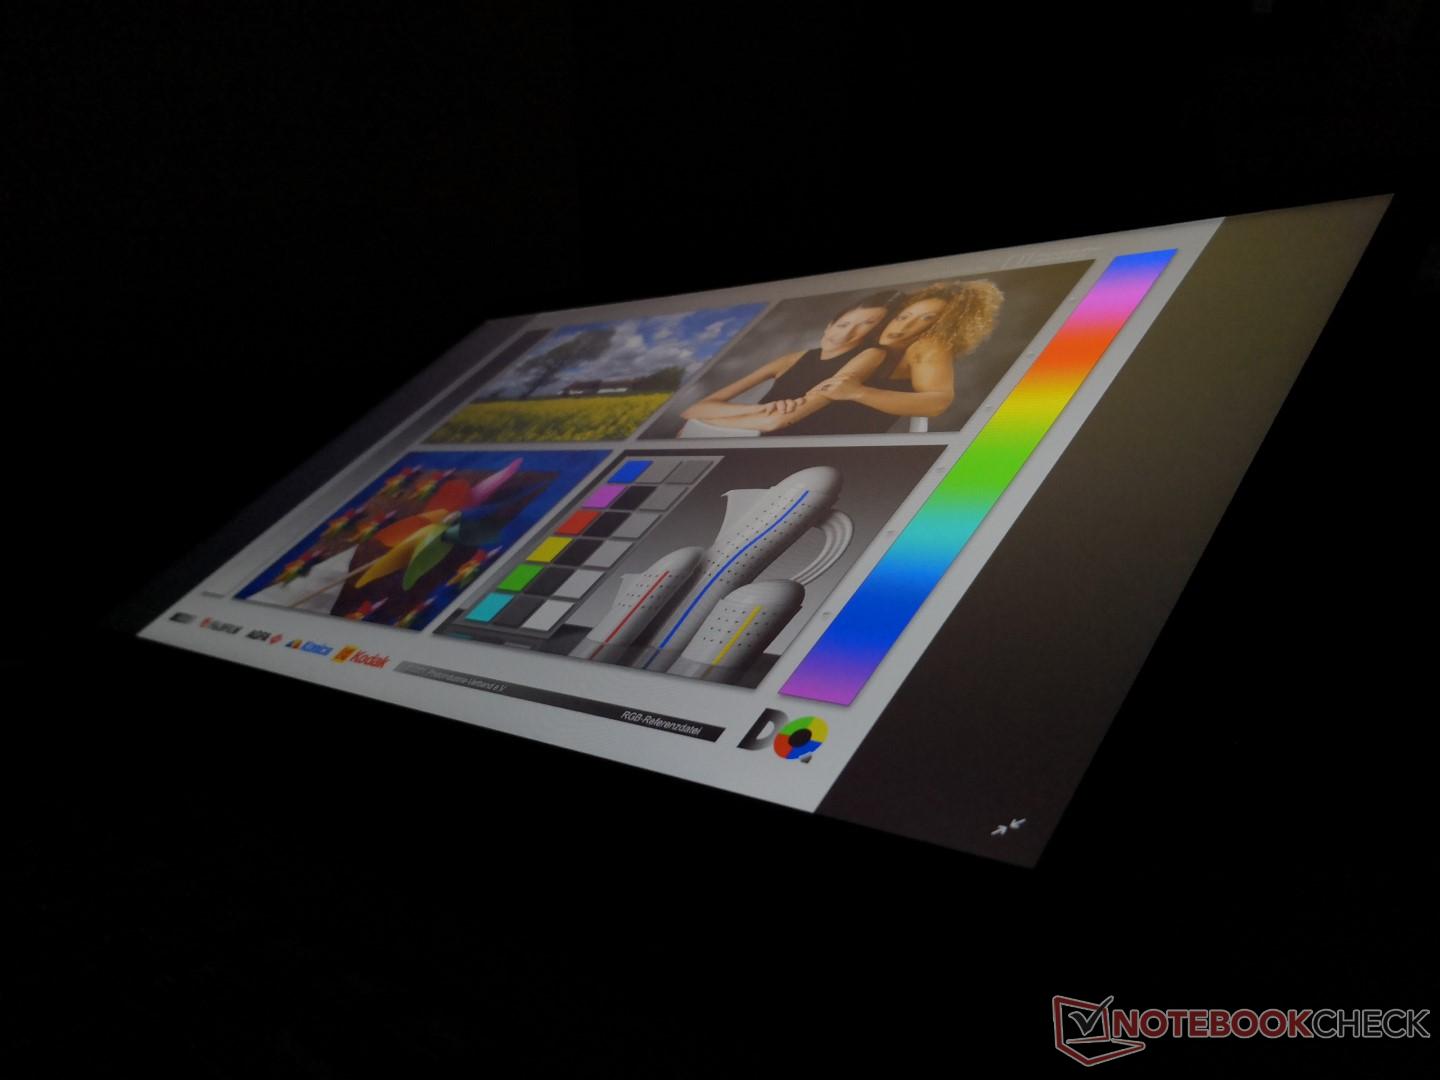
Viewing angles are excellent and the system can be used in either landscape or portrait orientation without major color shifting issues. Apparent brightness decreases if in portrait mode and so images do not appear as vibrant when compared to the default landscape mode.
Performance
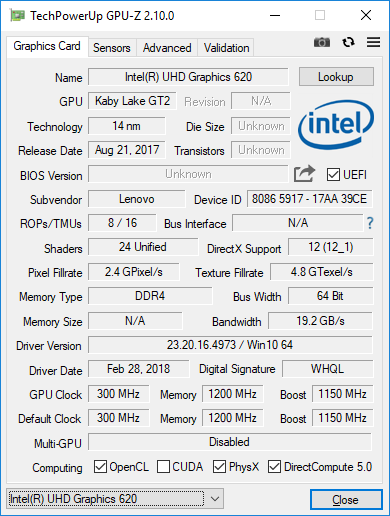
Current SKUs of the Flex 5 15 can be configured with the Core i5-8250U or i7-8550U CPU and either UHD Graphics 620 or GeForce MX130 graphics. The same FHD IPS touchscreen comes standard across all configurations. It's clear that Lenovo is marketing the system as an affordable alternative to the popular Dell XPS 15 or HP Spectre x360 15 based on the specifications alone. Sadly, no Ryzen options are available which would have fit perfectly within the TDP envelope of the Flex 5.
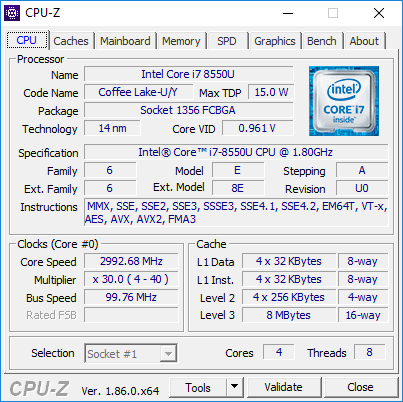
Processor
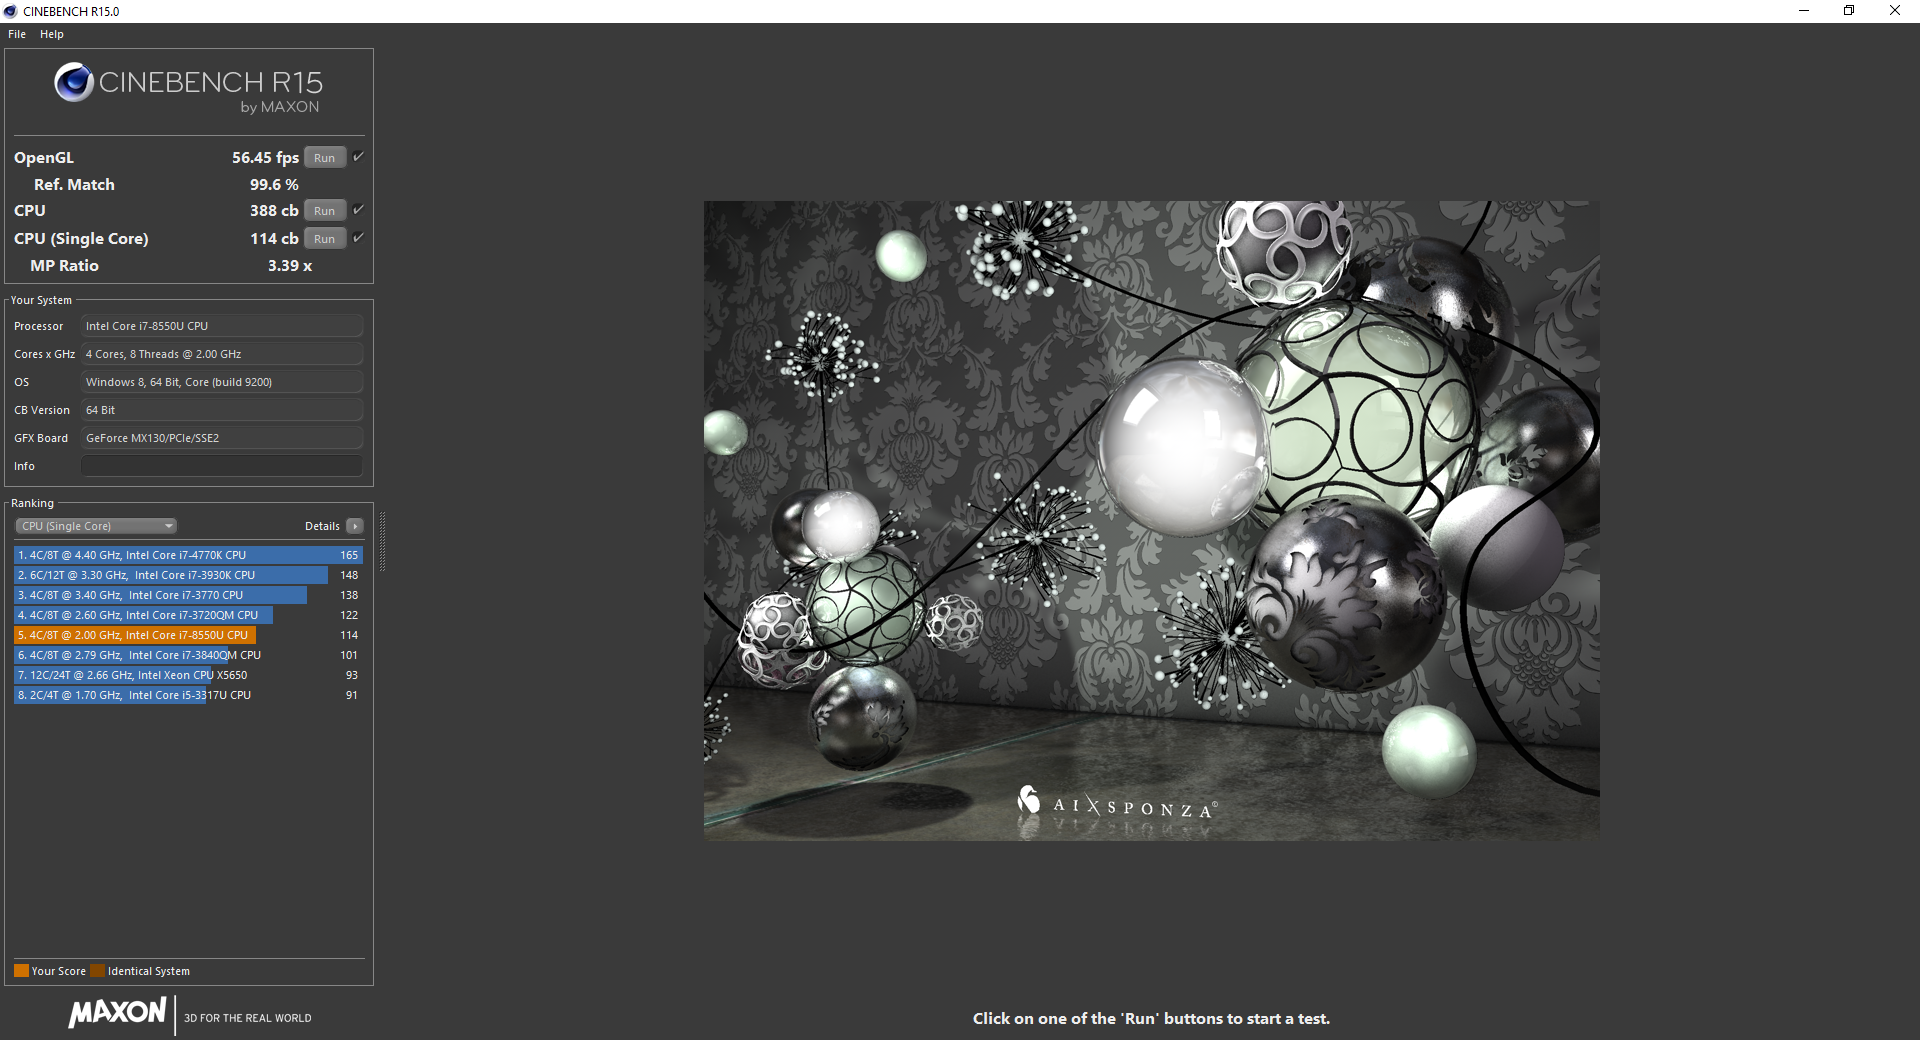
CPU performance is poor when compared to other systems equipped with the same i7-8550U CPU. The Flex 5 is able to score just 388 points in CineBench R15 Multi-Thread whereas the average Core i7-8550U in our database scores about 571 points. This massive delta is further explored in our Stress Test section below, but it essentially boils down to poor Turbo Boost performance from the Lenovo convertible. Its CPU is simply not able to maintain Turbo Boost clock rates for even short periods and so performance suffers as a result. Final scores are disappointing to say the least when even the Core i5-8250U in the Ideapad 530S is able to outperform the i7-8550U in our Flex 5 by 26 percent.
Running CineBench R15 Multi-Thread in a loop shows us just how bad the Flex 5 can be at sustaining Turbo Boost. Its initial score of 541 points tanks to just 385 points after only two or three loops to represent a performance drop of 29 percent. Our system never recovers thereafter until the loop test is stopped.
See our dedicated page on the Core i7-8550U for more technical information and benchmark comparisons.
| Cinebench R11.5 | |
| CPU Single 64Bit | |
| Lenovo ThinkPad P52 20MAS03N00 | |
| Average Intel Core i7-8550U (1.43 - 1.95, n=32) | |
| CPU Multi 64Bit | |
| Lenovo ThinkPad P52 20MAS03N00 | |
| Average Intel Core i7-8550U (4.38 - 8.56, n=32) | |
| Cinebench R10 | |
| Rendering Multiple CPUs 32Bit | |
| Lenovo ThinkPad P52 20MAS03N00 | |
| Average Intel Core i7-8550U (11694 - 24180, n=31) | |
| Lenovo Ideapad 720S-13ARR | |
| Rendering Single 32Bit | |
| Lenovo ThinkPad P52 20MAS03N00 | |
| Average Intel Core i7-8550U (4202 - 8211, n=31) | |
| Lenovo Ideapad 720S-13ARR | |
| wPrime 2.10 - 1024m | |
| Lenovo ThinkPad 13 20J1005TPB | |
| Average Intel Core i7-8550U (258 - 435, n=11) | |
* ... smaller is better
System Performance
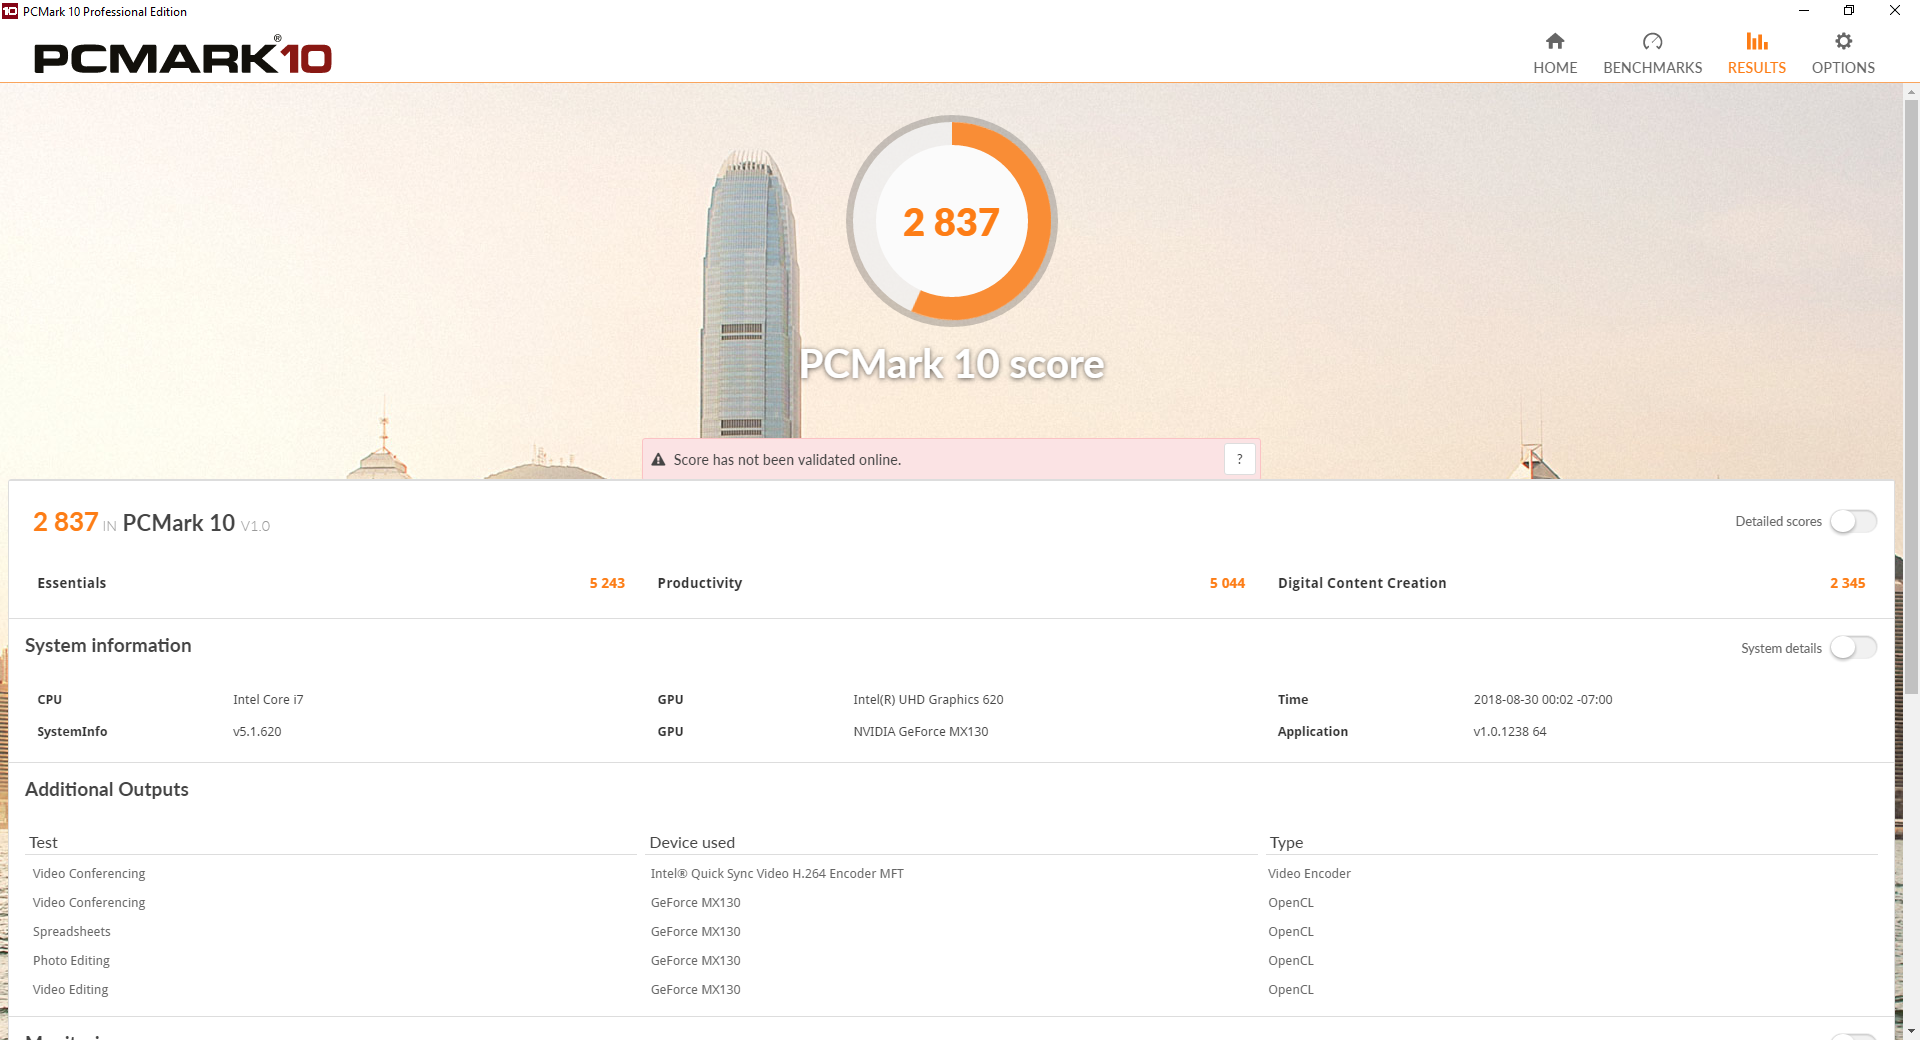
PCMark scores are rather mediocre when compared to other 15-inch multimedia systems like the Zenbook Flip 15 or XPS 15 9575. Nonetheless, results are where we expect them to be when considering the ULV CPU and low-power GeForce GPU. Launching apps and navigating through the OS are swift with no hiccups as expected from a SSD-based laptop.
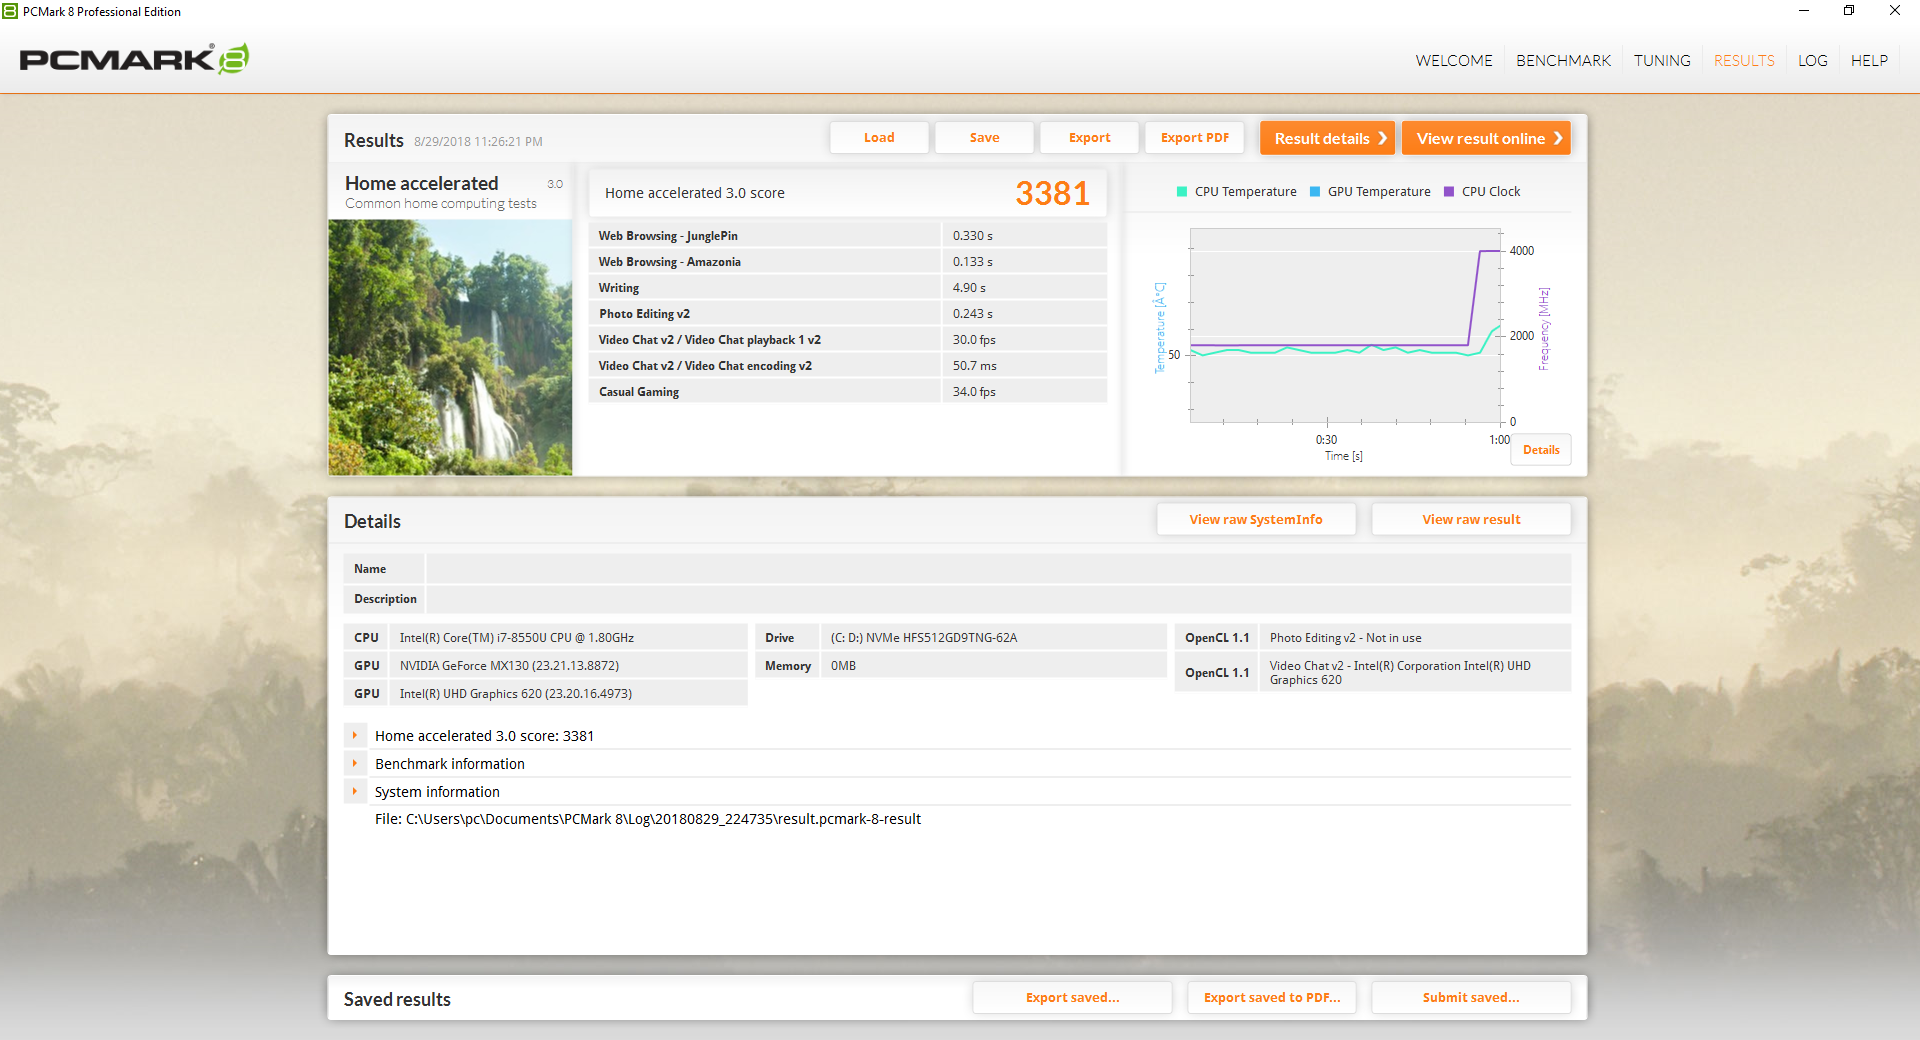
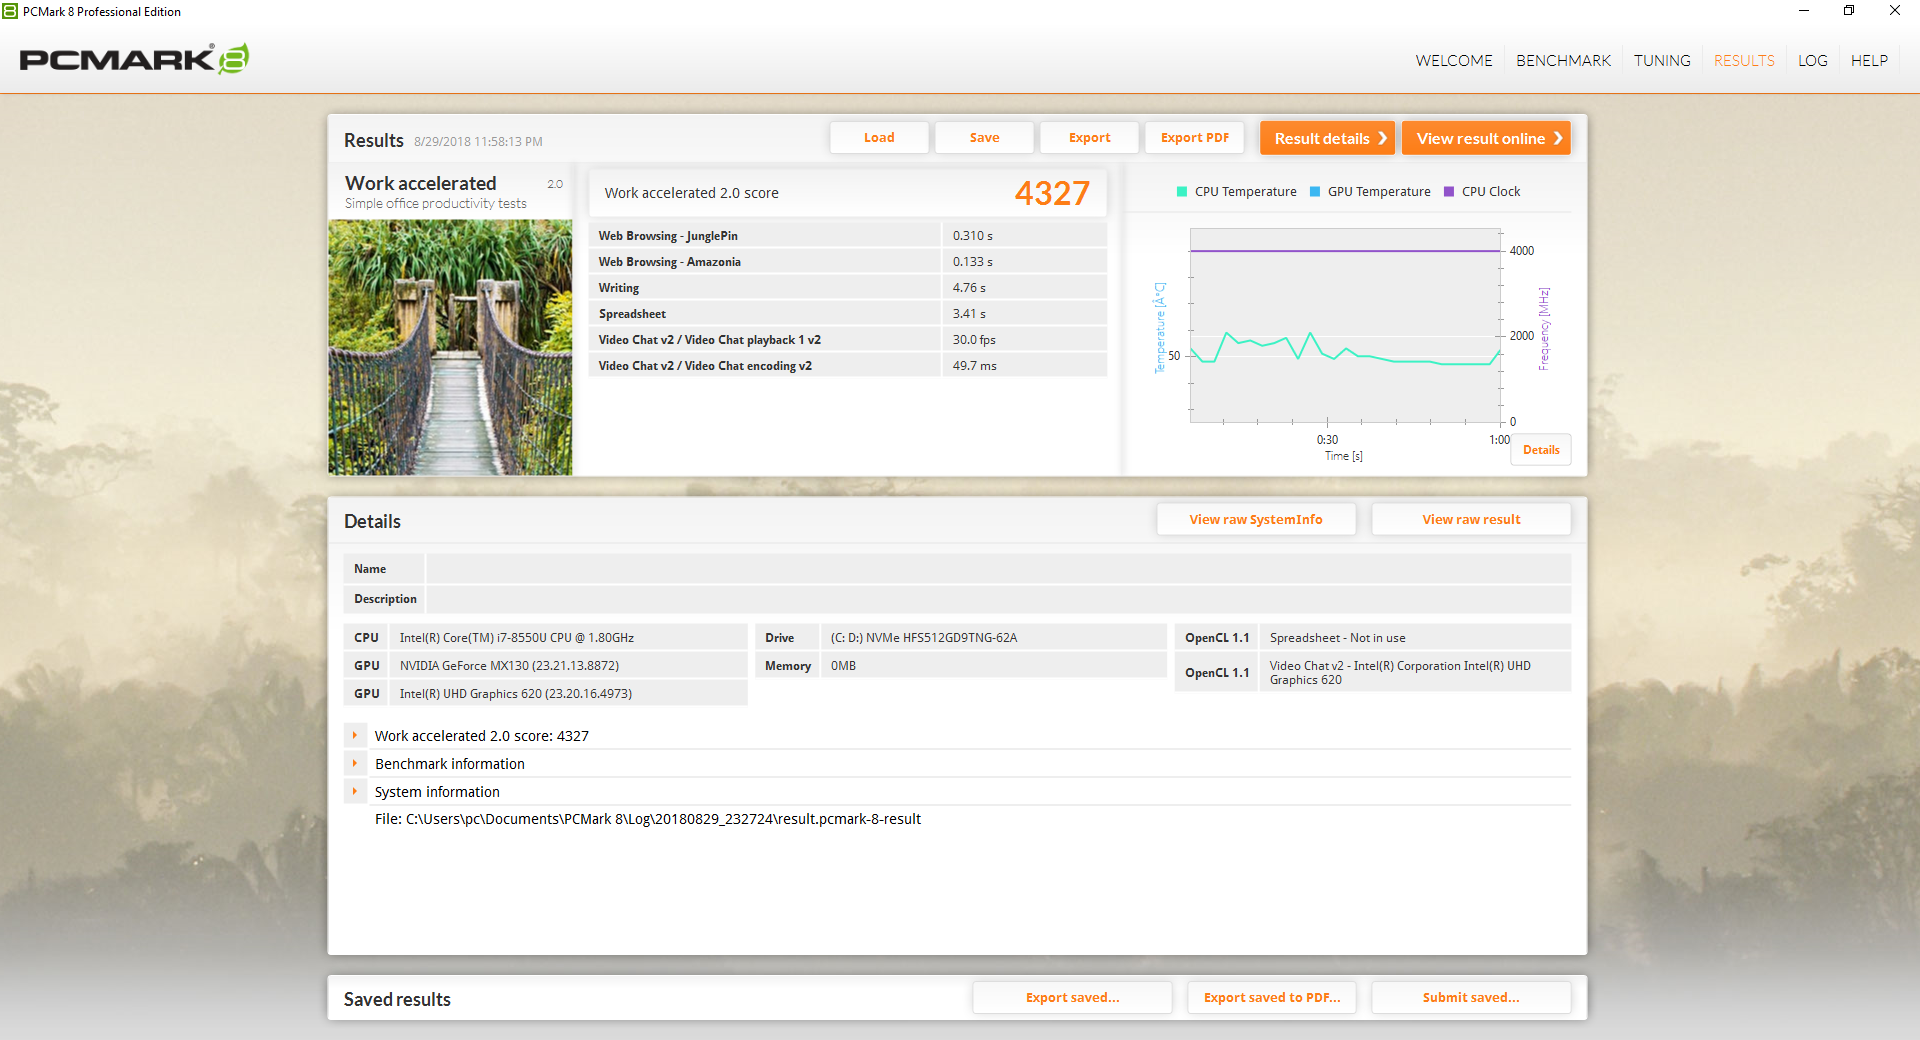
| PCMark 8 Home Score Accelerated v2 | 3381 points | |
| PCMark 8 Work Score Accelerated v2 | 4327 points | |
| PCMark 10 Score | 2837 points | |
Help | ||
Storage Devices
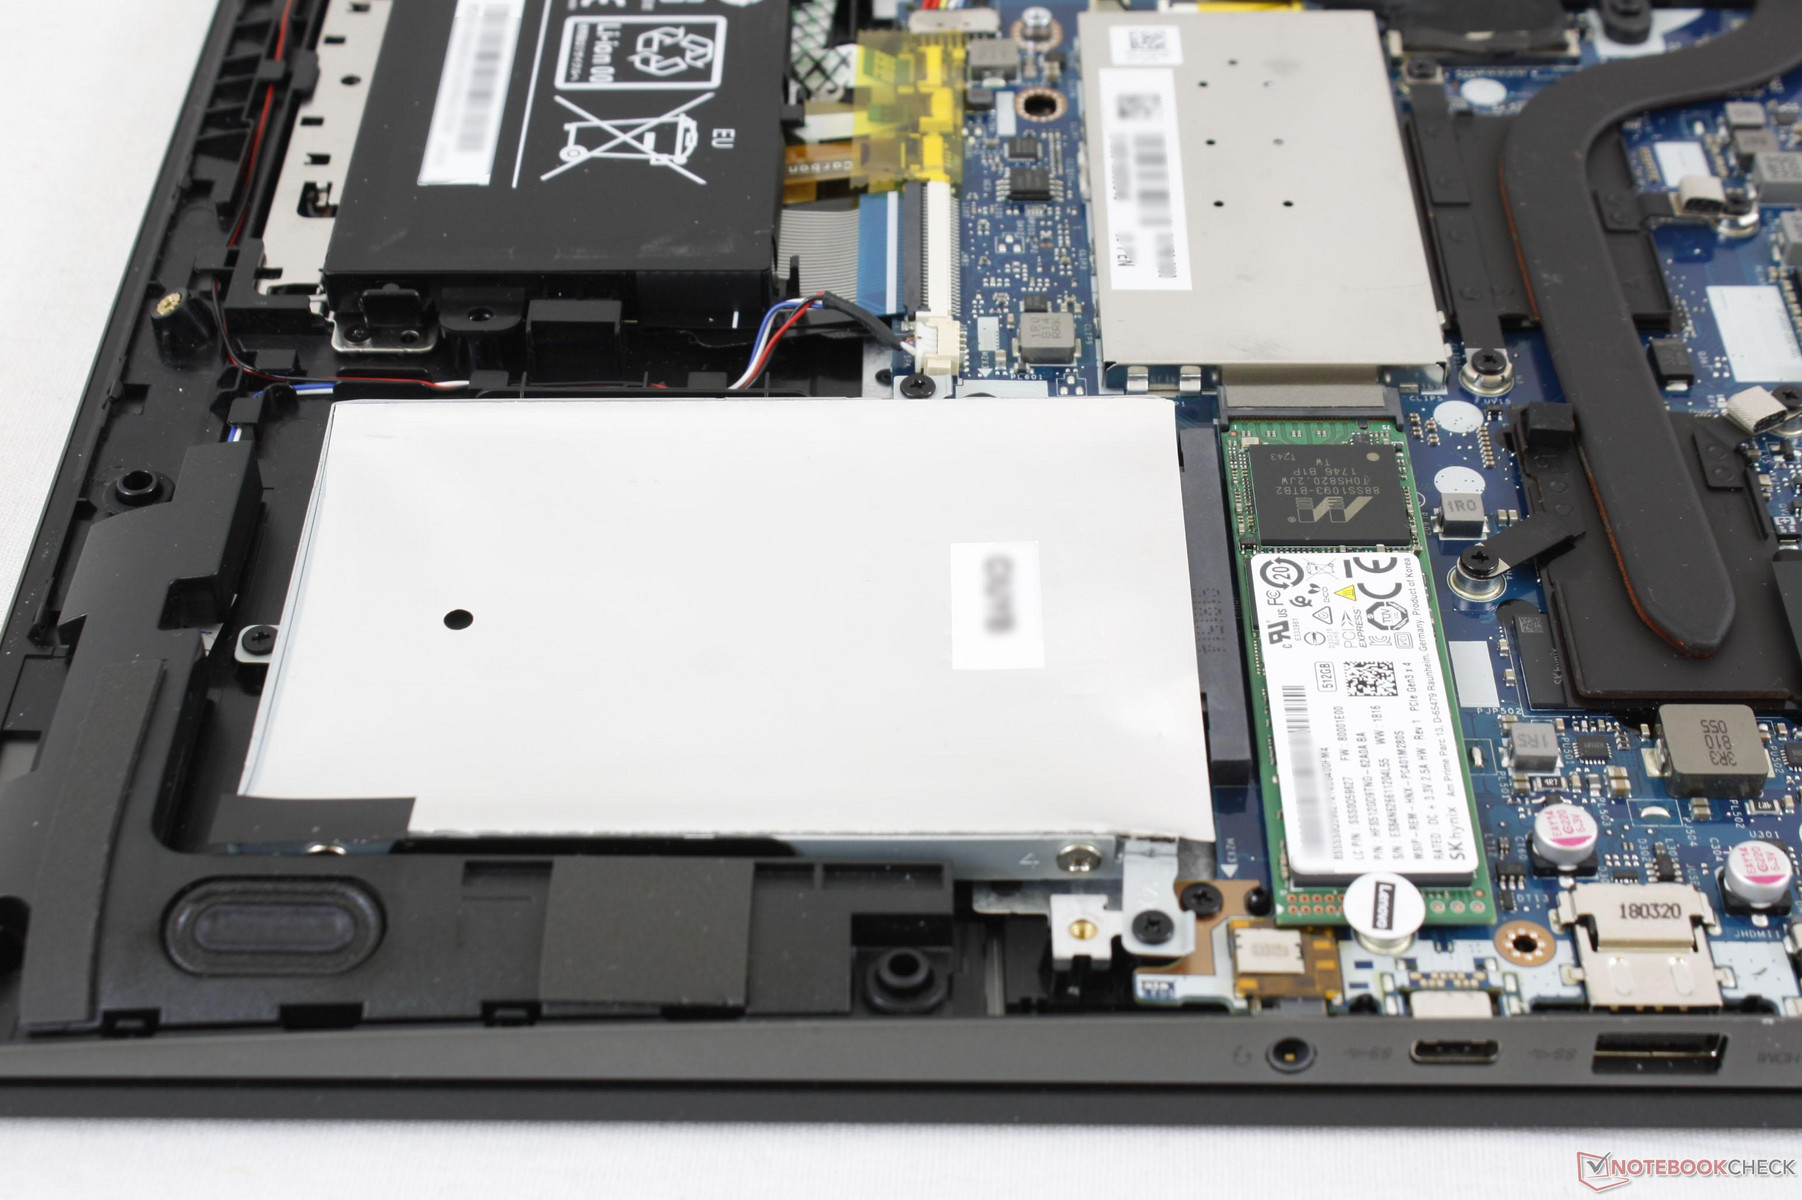
Two internal storage bays are available. Our particular test unit is equipped with just a single 512 GB M.2 SSD from SK Hynix with respectable sequential read and write rates of over 1000 MB/s each. It doesn't quite outperform the Samsung NVMe SSDs like the PM981 series, but its performance is more than sufficient for the target audience and still much faster than what SATA III can offer.
See our table of SSDs and HDDs for more benchmark comparisons.
| Lenovo IdeaPad Flex-1570 81CA000RUS SK Hynix PC401 512GB M.2 (HFS512GD9TNG) | Dell XPS 15 9575 i7-8705G SK hynix PC401 NVMe 500 GB | Huawei MateBook D 15-53010BAJ Samsung SSD PM981 MZVLB512HAJQ | Asus ZenBook Flip 15 UX561UD Micron 1100 MTFDDAV256TBN | Lenovo Ideapad 530S-15IKB SK hynix PC401 HFS256GD9TNG | |
|---|---|---|---|---|---|
| AS SSD | 7% | 34% | -58% | -28% | |
| Copy Game MB/s (MB/s) | 684 | 944 38% | 1047 53% | 282.3 -59% | 301.1 -56% |
| Copy Program MB/s (MB/s) | 495.6 | 487.9 -2% | 438.1 -12% | 196.8 -60% | 233.5 -53% |
| Copy ISO MB/s (MB/s) | 1013 | 1523 50% | 1287 27% | 291 -71% | 868 -14% |
| Score Total (Points) | 2123 | 2132 0% | 4225 99% | 844 -60% | 1387 -35% |
| Score Write (Points) | 832 | 807 -3% | 1709 105% | 371 -55% | 415 -50% |
| Score Read (Points) | 860 | 921 7% | 1665 94% | 310 -64% | 690 -20% |
| Access Time Write * (ms) | 0.051 | 0.051 -0% | 0.143 -180% | 0.056 -10% | 0.051 -0% |
| Access Time Read * (ms) | 0.045 | 0.044 2% | 0.043 4% | 0.097 -116% | 0.06 -33% |
| 4K-64 Write (MB/s) | 612 | 637 4% | 1486 143% | 248.5 -59% | 271.6 -56% |
| 4K-64 Read (MB/s) | 660 | 649 -2% | 1455 120% | 235.5 -64% | 431.3 -35% |
| 4K Write (MB/s) | 99.5 | 94.3 -5% | 81.9 -18% | 84.8 -15% | 88.4 -11% |
| 4K Read (MB/s) | 40.59 | 41.38 2% | 53 31% | 25.79 -36% | 38.69 -5% |
| Seq Write (MB/s) | 1209 | 752 -38% | 1411 17% | 379.3 -69% | 550 -55% |
| Seq Read (MB/s) | 1596 | 2302 44% | 1567 -2% | 488 -69% | 2205 38% |
* ... smaller is better

GPU Performance
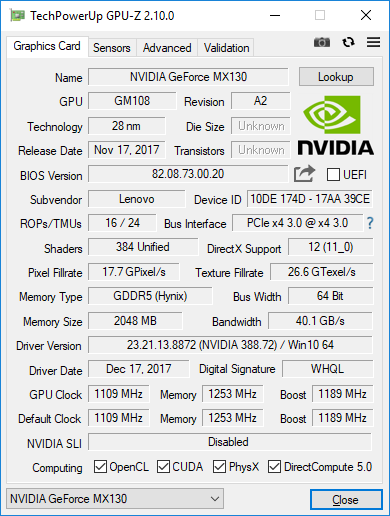
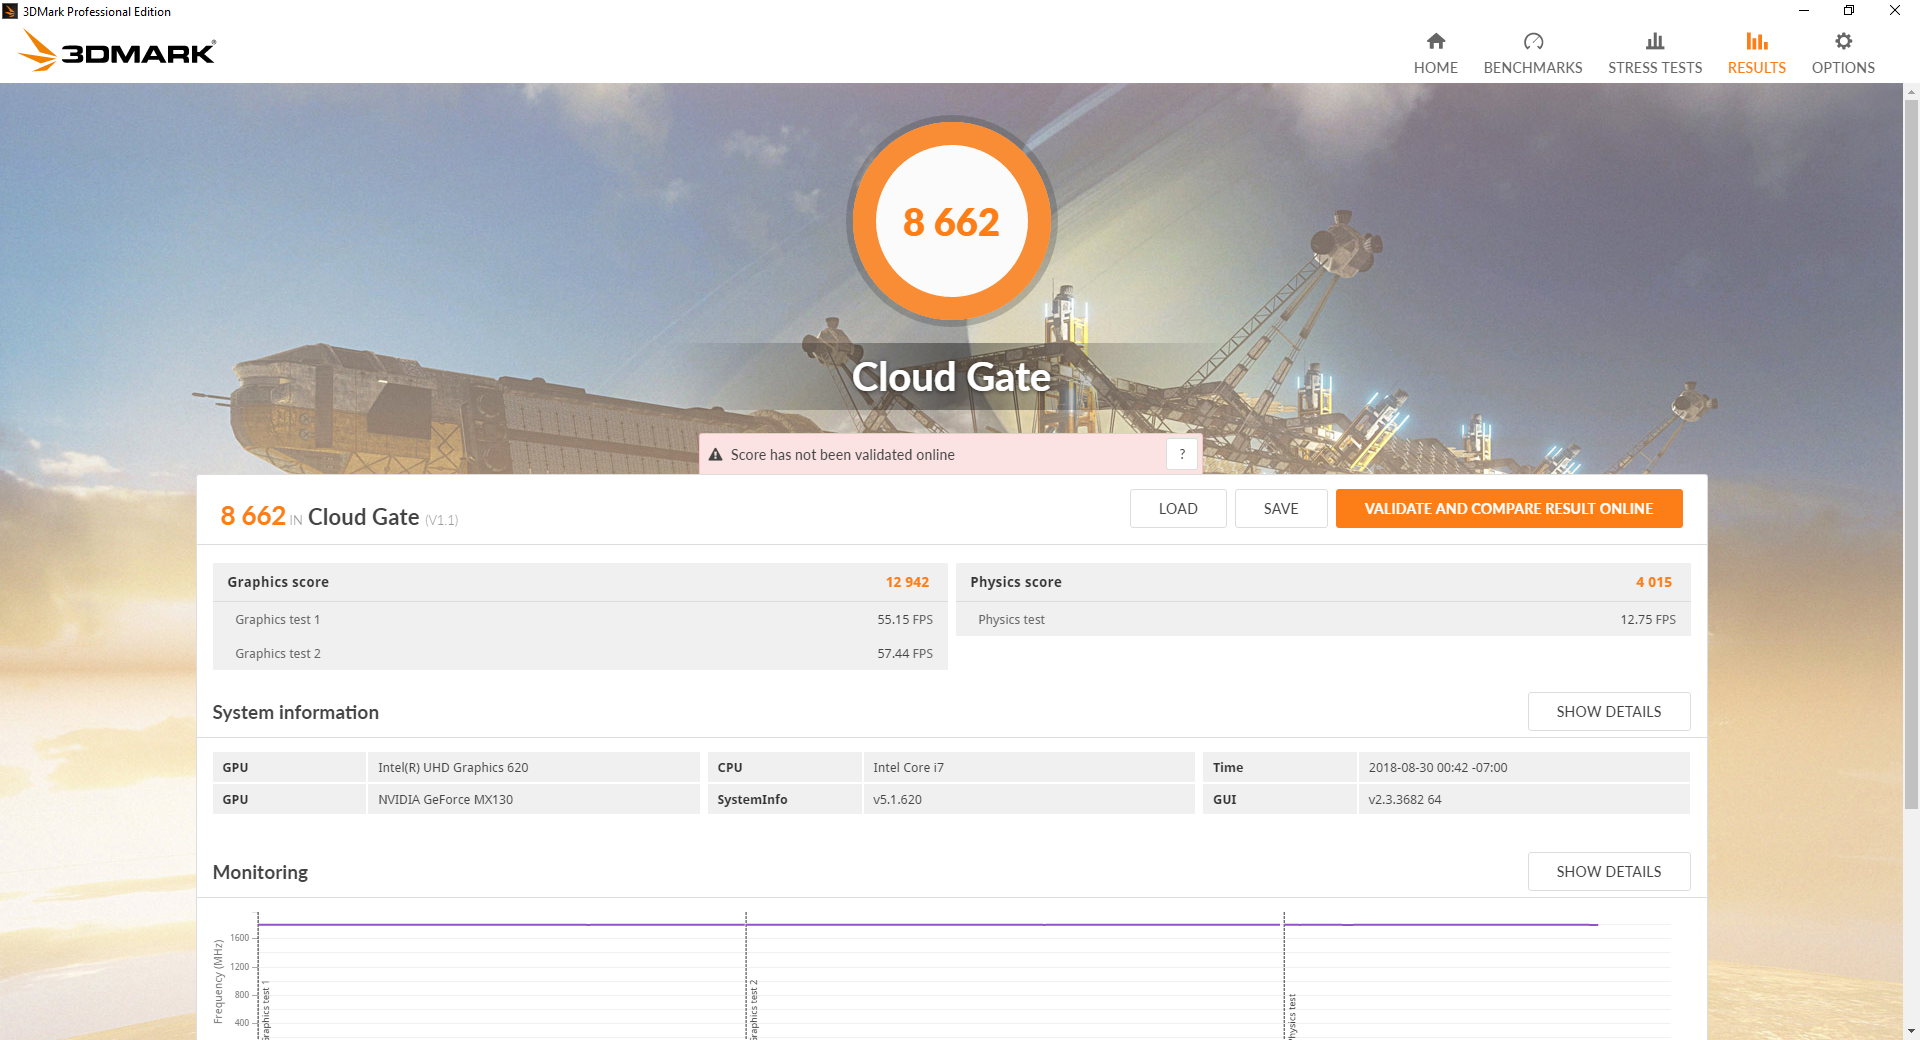
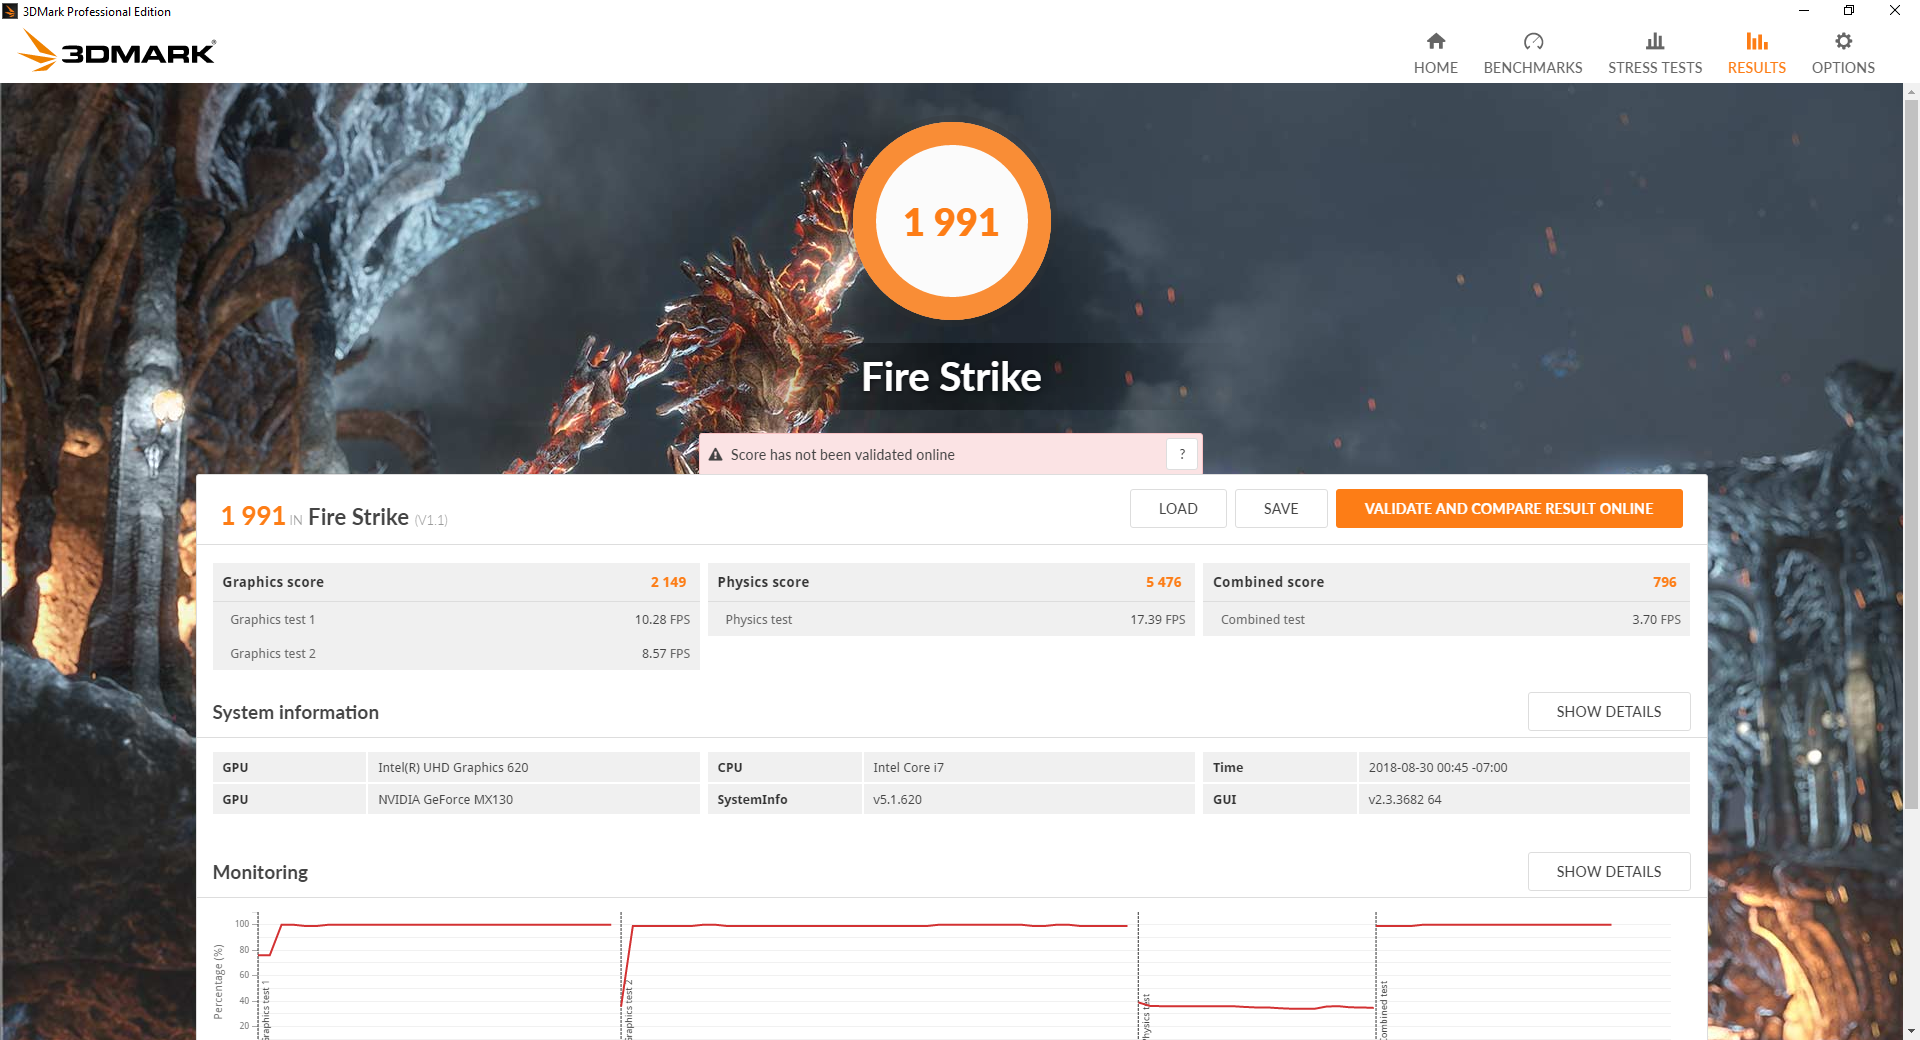
The GeForce MX130 is essentially on par with the last generation GeForce 940MX according to 3DMark benchmarks. It's also comparable to the integrated AMD Radeon RX Vega 10 provided that the latter is equipped with dual-channel RAM. If not, then said AMD owners can expect a rough 35 percent boost if moving up to the GeForce MX130. Jumping from the MX130 to the more common MX150 will bring a substantial 50 percent boost in raw graphics performance.
Gaming performance is limited to undemanding or older titles like LoL, DOTA 2, Starcraft II. The Flex 5 is more of a general multimedia machine than one for playing games.
See our dedicated page on the GeForce MX130 for more technical information and benchmark comparisons.
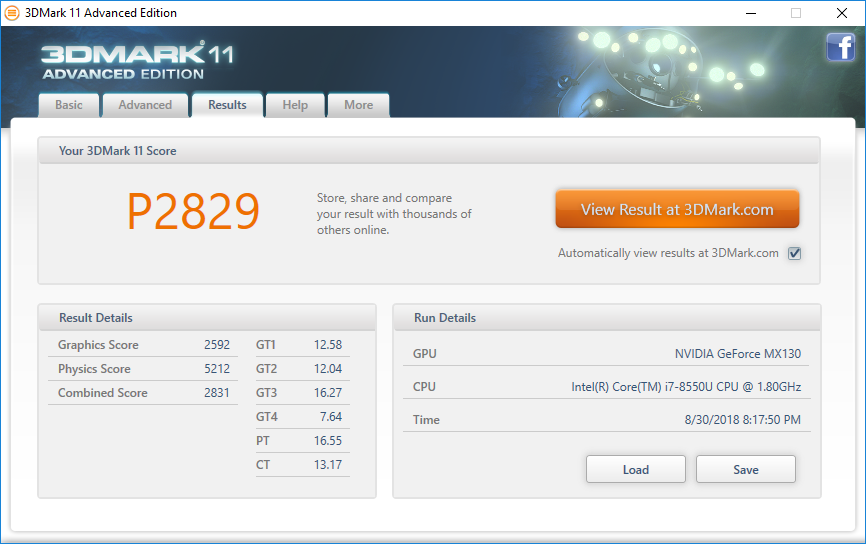
| 3DMark 11 Performance | 28 points | |
| 3DMark Cloud Gate Standard Score | 8662 points | |
| 3DMark Fire Strike Score | 1991 points | |
Help | ||
| low | med. | high | ultra | |
|---|---|---|---|---|
| BioShock Infinite (2013) | 126.9 | 74.2 | 64.4 | 23.1 |
| The Witcher 3 (2015) | 42.7 | 25 | 13.6 | 7.2 |
| Rise of the Tomb Raider (2016) | 51.2 | 28.6 | 15.6 | 12.5 |
Stress Test
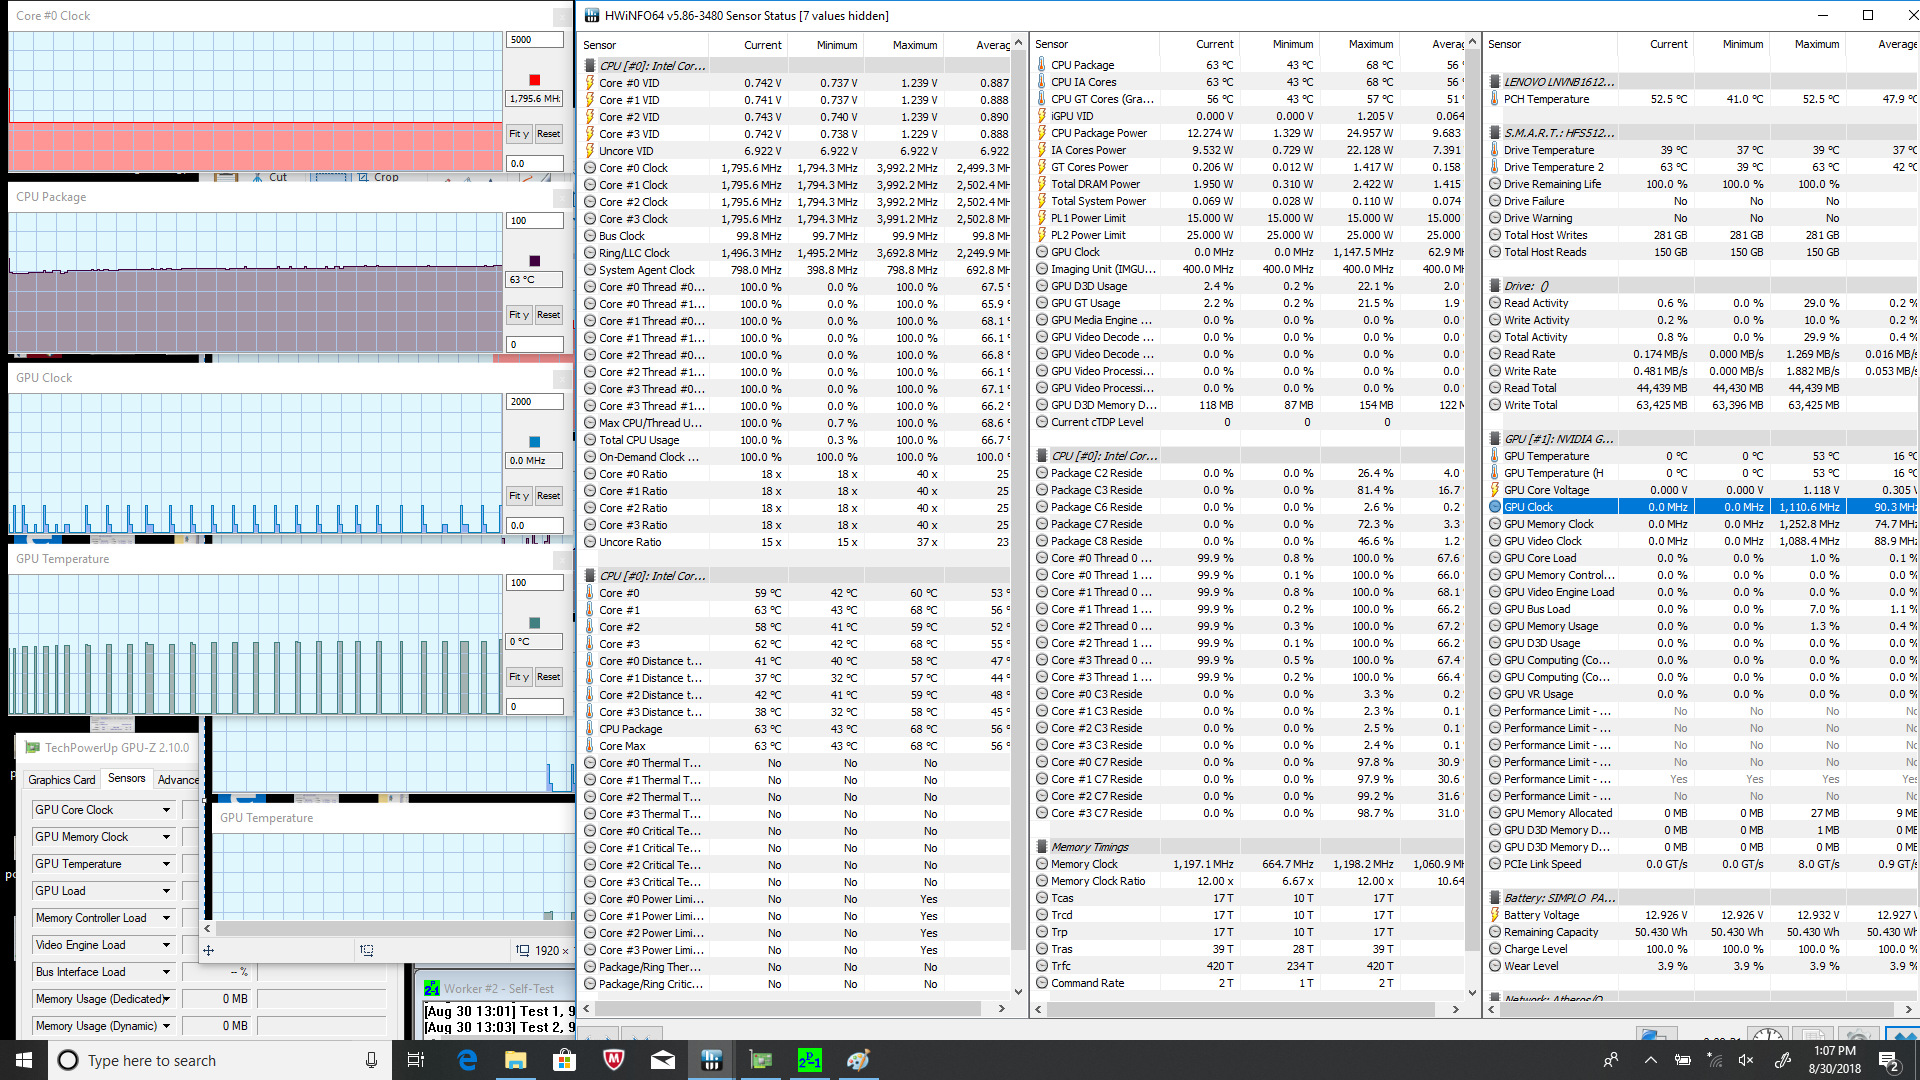
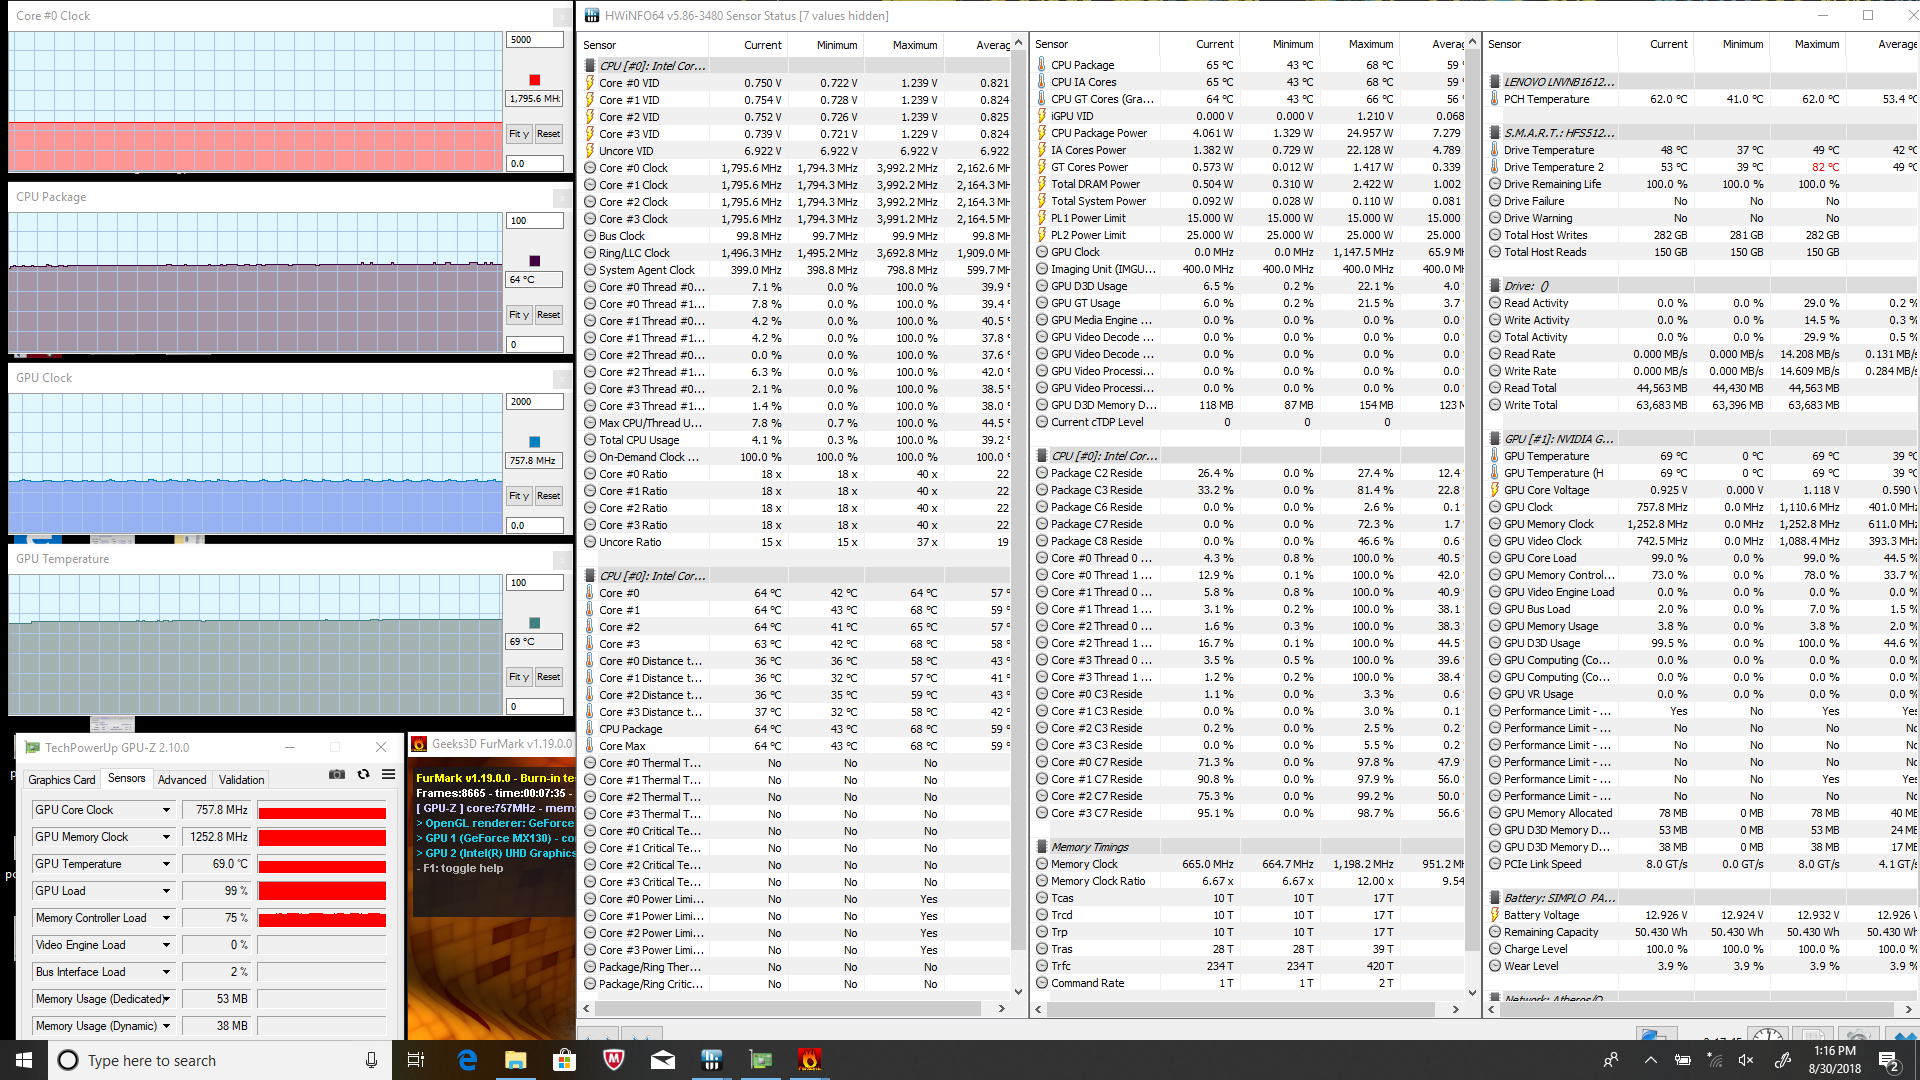
We stress the notebook with synthetic loads in order to identify for any potential throttling or stability issues. When running Prime95, the CPU can be observed operating at 3 GHz at the very start of the test before immediately falling and stabilizing at its base clock rate of 1.8 GHz. It's disappointing to see that the Flex 5 is unable to sustain any Turbo Boost at all when under high load. We believe there is some headroom for faster clock rates since the CPU tops out at just 63 C, but Lenovo apparently thinks otherwise. Running both Prime95 and FurMark simultaneously will cause the CPU and GPU to stabilize at 89 C and 86 C, respectively.
Running Witcher 3 stress is more representative of real-world gaming load. The CPU and GPU remain steady at 70 C and 73 C, respectively, albeit with no Turbo Boost from the CPU yet again. Frame rates are otherwise steady with no recurring drops over time.
Running on battery power will reduce CPU performance. A 3DMark 11 run on batteries returns Physics and Graphics scores of 4619 and 2797, respectively, compared to 5212 and 2592 points when on mains.
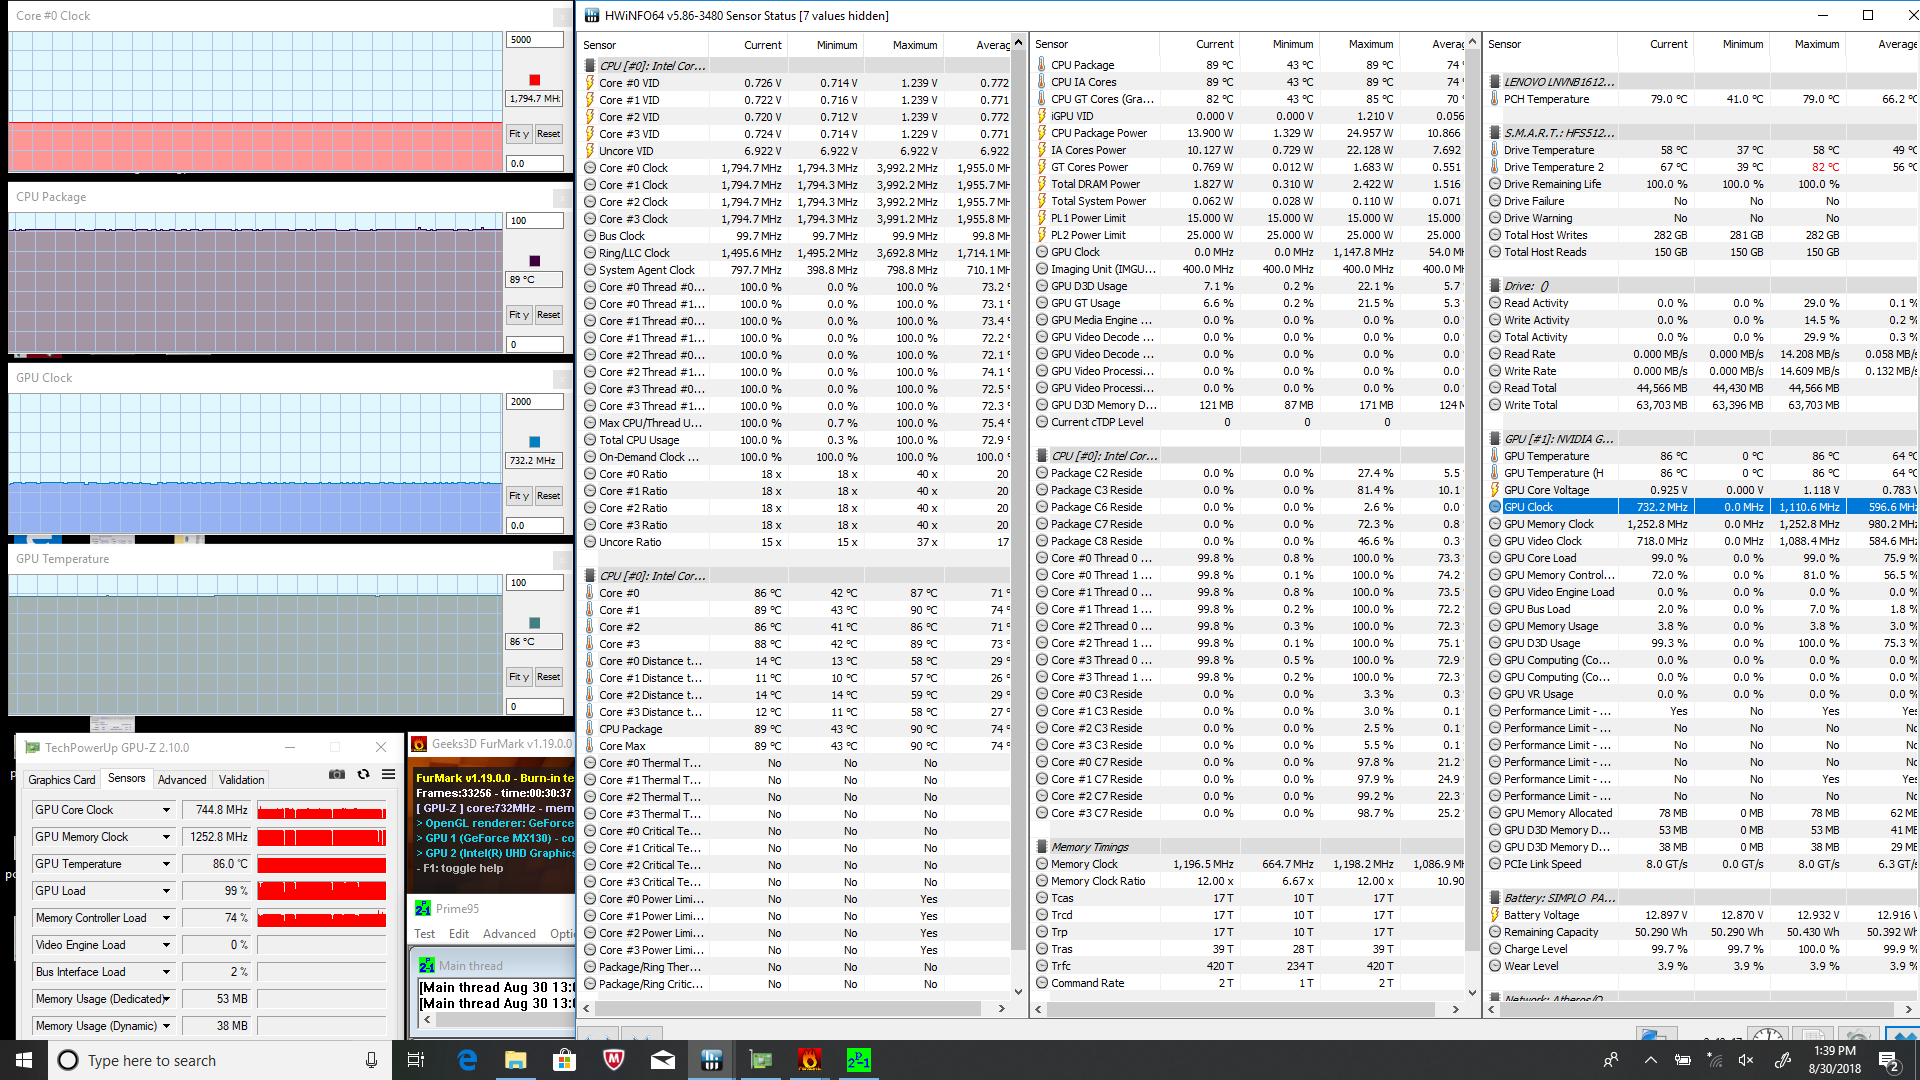
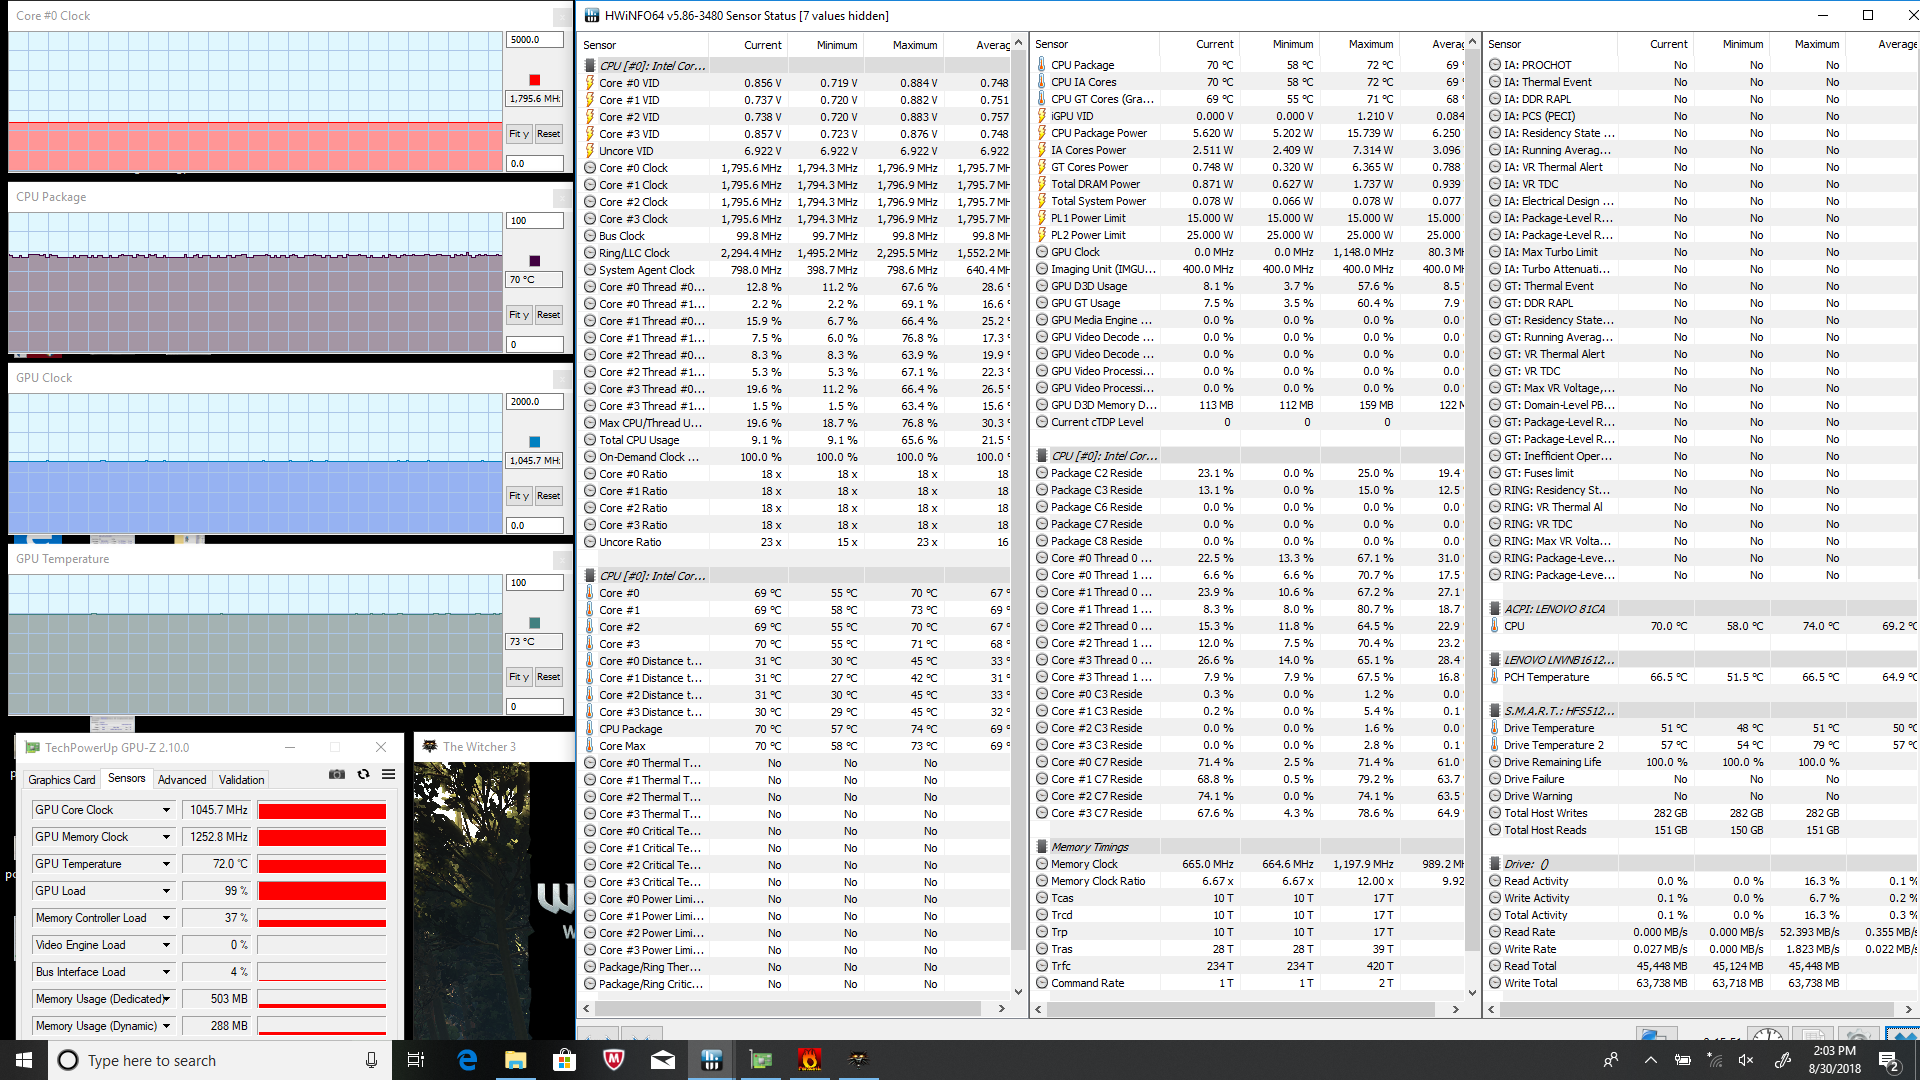
| CPU Clock (GHz) | GPU Clock (MHz) | Average CPU Temperature (°C) | Average GPU Temperature (°C) | |
| Prime95 Stress | 1.8 | -- | 63 | -- |
| FurMark Stress | -- | 758 | -- | 69 |
| Prime95 + FurMark Stress | 1.8 | 732 | 89 | 86 |
| Witcher 3 Stress | 1.8 | 1046 | 70 | 73 |
Emissions
System Noise
The cooling solution consists of a single 50 mm fan and a short heat pipe shared between the CPU and GPU. In comparison, some smaller laptops like the HP EliteBook x360 1030 or Yoga 920 utilize two fans and a longer heat pipe for cooling just a single CPU. The relatively small cooing solution of the 15-inch Lenovo negatively impacts noise as the fan is almost always active and audible even during low loads like streaming. We recommend using the Power Saver profile and the integrated GPU to reduce pulsing and fan noise if the extra horsepower is not needed.
Fan noise when under higher loads like gaming is comparable to the HP Envy x360 15 but surprisingly louder than the ZenBook Flip 15 with the more powerful GeForce GTX GPU. Furthermore, the fan in the Lenovo is relatively high-pitched as shown by our microphone measurements below. The fan is therefore more noticeable to the ear than we would like.
Our system does not exhibit any coil whine or electronic noise. Even if it did, however, the constant fan noise would likely overpower it.
Noise level
| Idle |
| 29.6 / 29.6 / 29.6 dB(A) |
| Load |
| 39.2 / 41.6 dB(A) |
 | ||
30 dB silent 40 dB(A) audible 50 dB(A) loud |
||
min: | ||
| Lenovo IdeaPad Flex-1570 81CA000RUS GeForce MX130, i5-8550U, SK Hynix PC401 512GB M.2 (HFS512GD9TNG) | Dell XPS 15 9575 i7-8705G Vega M GL / 870, i7-8705G, SK hynix PC401 NVMe 500 GB | Lenovo Ideapad 530S-15IKB UHD Graphics 620, i5-8250U, SK hynix PC401 HFS256GD9TNG | Asus ZenBook Flip 15 UX561UD GeForce GTX 1050 Mobile, i5-8550U, Micron 1100 MTFDDAV256TBN | HP Envy x360 15-bq102ng Vega 8, R5 2500U, Samsung PM961 MZVLW256HEHP | |
|---|---|---|---|---|---|
| Noise | 2% | 9% | -1% | -1% | |
| off / environment * (dB) | 28.2 | 28.2 -0% | 28 1% | 30.4 -8% | 30.13 -7% |
| Idle Minimum * (dB) | 29.6 | 28.2 5% | 28 5% | 31.3 -6% | 30.13 -2% |
| Idle Average * (dB) | 29.6 | 28.2 5% | 28 5% | 31.3 -6% | 30.13 -2% |
| Idle Maximum * (dB) | 29.6 | 28.2 5% | 30.1 -2% | 31.3 -6% | 30.13 -2% |
| Load Average * (dB) | 39.2 | 29 26% | 30.2 23% | 36.4 7% | 38.8 1% |
| Witcher 3 ultra * (dB) | 39.2 | 44.7 -14% | |||
| Load Maximum * (dB) | 41.6 | 47.4 -14% | 33.2 20% | 37.1 11% | 38.8 7% |
* ... smaller is better
Temperature
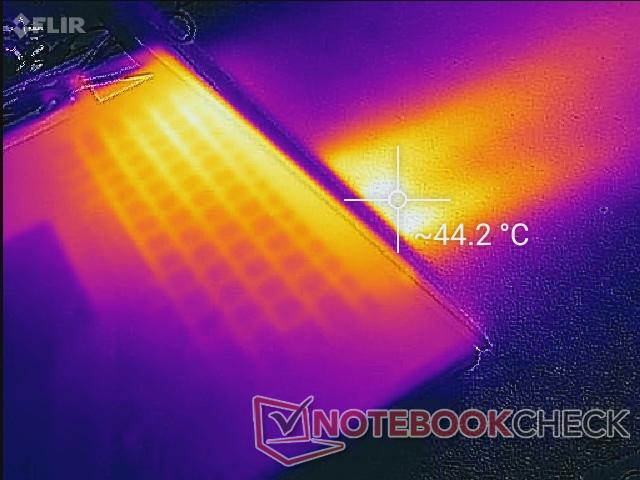
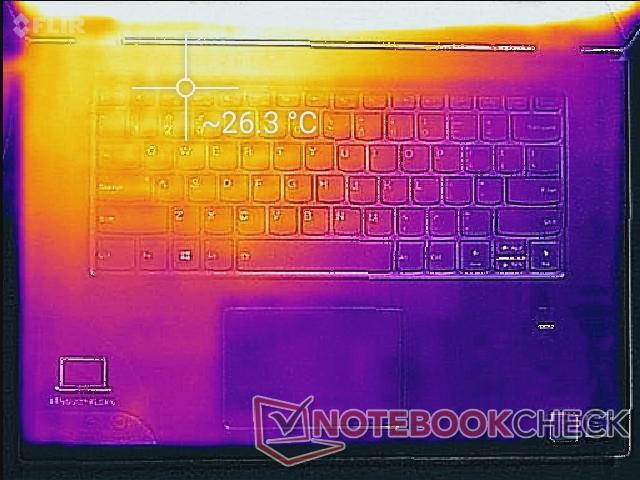
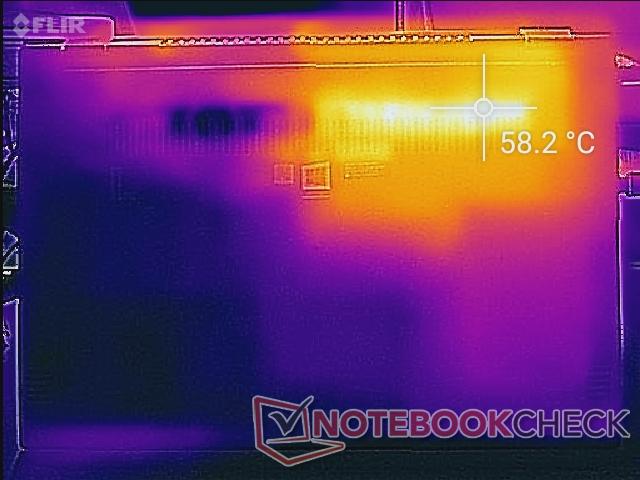
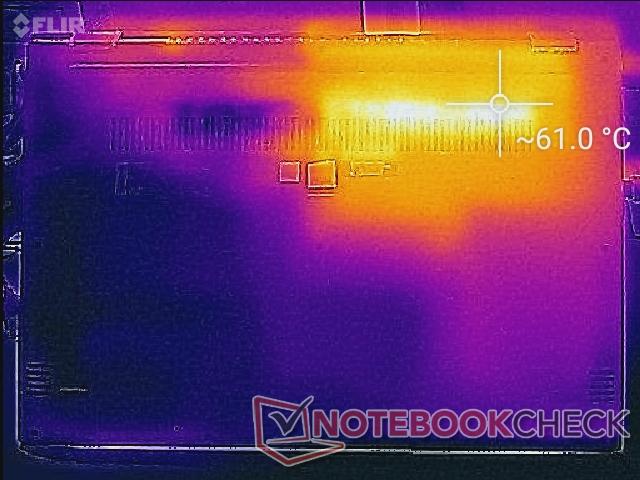
Expect the left half of the notebook to always be warmer than the right half because of how the processors and storage drives are positioned around the motherboard. Surface temperatures are generally flat on both sides when idling or during very low loads and so the temperature discrepancy shouldn't be an issue when browsing or word processing. If gaming, however, the left side of the keyboard can be over 10 C warmer than the right side. A more symmetrical temperature gradient, such as on the HP Spectre series, is preferred.
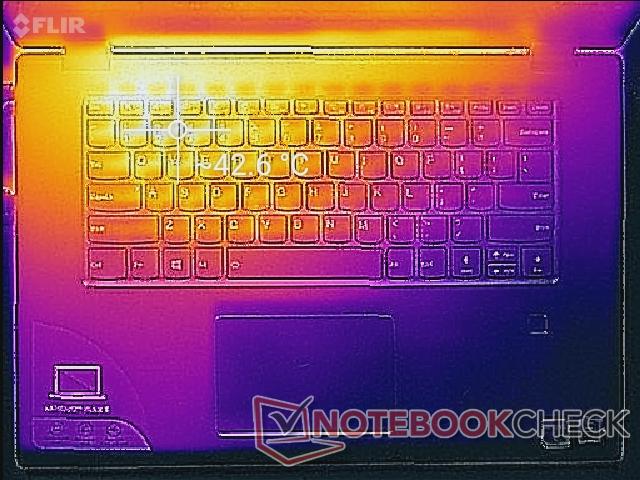
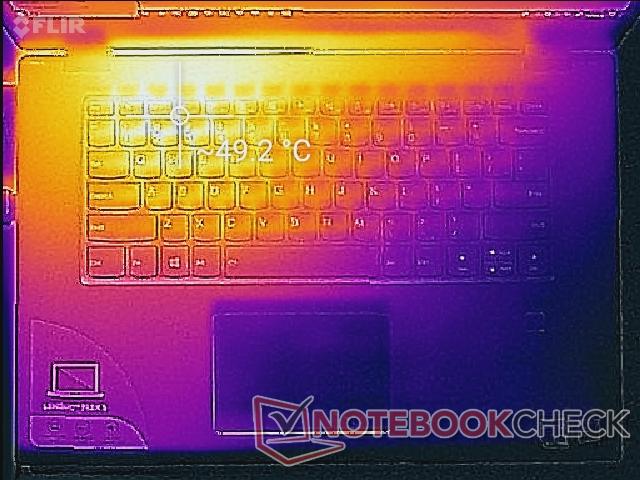
(-) The maximum temperature on the upper side is 49 °C / 120 F, compared to the average of 36.8 °C / 98 F, ranging from 21 to 71 °C for the class Multimedia.
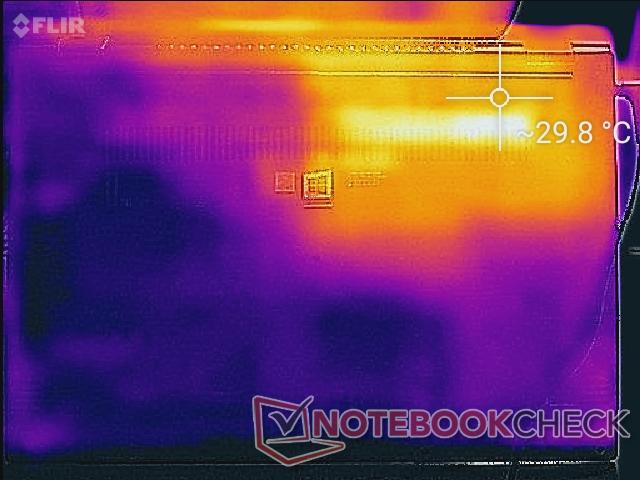
(-) The bottom heats up to a maximum of 55.2 °C / 131 F, compared to the average of 39.1 °C / 102 F
(+) In idle usage, the average temperature for the upper side is 24.6 °C / 76 F, compared to the device average of 31.3 °C / 88 F.
(±) Playing The Witcher 3, the average temperature for the upper side is 32.6 °C / 91 F, compared to the device average of 31.3 °C / 88 F.
(+) The palmrests and touchpad are cooler than skin temperature with a maximum of 31.2 °C / 88.2 F and are therefore cool to the touch.
(-) The average temperature of the palmrest area of similar devices was 28.7 °C / 83.7 F (-2.5 °C / -4.5 F).
Speakers
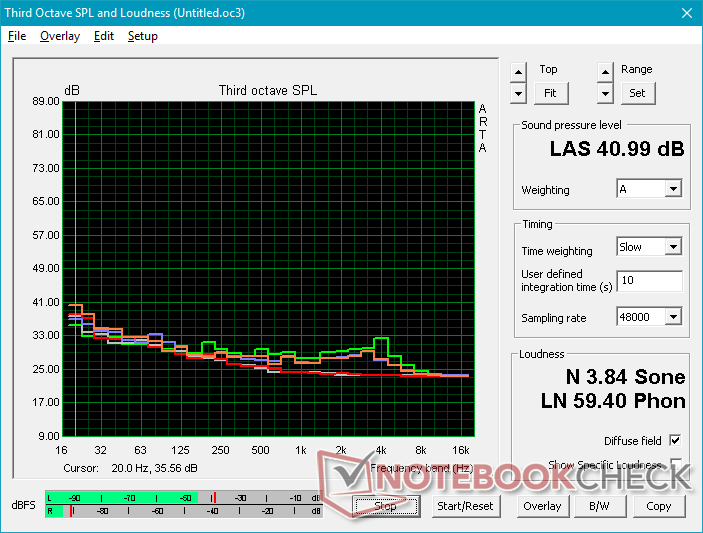
The stereo speakers from Harman are sufficiently loud to fill a small-medium room. Sounds are relatively imbalanced on the default setting as shown by our pink graph below meaning that some frequencies are reproduced markedly worse than others. It's passable for music and video if not unspectacular.
A high volume setting introduces no static but will reverberate the chassis slightly.


Lenovo IdeaPad Flex-1570 81CA000RUS audio analysis
(±) | speaker loudness is average but good (74.3 dB)
Bass 100 - 315 Hz
(±) | reduced bass - on average 14.4% lower than median
(-) | bass is not linear (15.7% delta to prev. frequency)
Mids 400 - 2000 Hz
(+) | balanced mids - only 4.6% away from median
(±) | linearity of mids is average (14.5% delta to prev. frequency)
Highs 2 - 16 kHz
(+) | balanced highs - only 3% away from median
(±) | linearity of highs is average (11.7% delta to prev. frequency)
Overall 100 - 16.000 Hz
(±) | linearity of overall sound is average (22.4% difference to median)
Compared to same class
» 80% of all tested devices in this class were better, 4% similar, 16% worse
» The best had a delta of 5%, average was 17%, worst was 45%
Compared to all devices tested
» 66% of all tested devices were better, 6% similar, 29% worse
» The best had a delta of 4%, average was 23%, worst was 134%
Apple MacBook 12 (Early 2016) 1.1 GHz audio analysis
(+) | speakers can play relatively loud (83.6 dB)
Bass 100 - 315 Hz
(±) | reduced bass - on average 11.3% lower than median
(±) | linearity of bass is average (14.2% delta to prev. frequency)
Mids 400 - 2000 Hz
(+) | balanced mids - only 2.4% away from median
(+) | mids are linear (5.5% delta to prev. frequency)
Highs 2 - 16 kHz
(+) | balanced highs - only 2% away from median
(+) | highs are linear (4.5% delta to prev. frequency)
Overall 100 - 16.000 Hz
(+) | overall sound is linear (10.2% difference to median)
Compared to same class
» 7% of all tested devices in this class were better, 2% similar, 90% worse
» The best had a delta of 5%, average was 18%, worst was 53%
Compared to all devices tested
» 5% of all tested devices were better, 1% similar, 94% worse
» The best had a delta of 4%, average was 23%, worst was 134%
Energy Management
Power Consumption
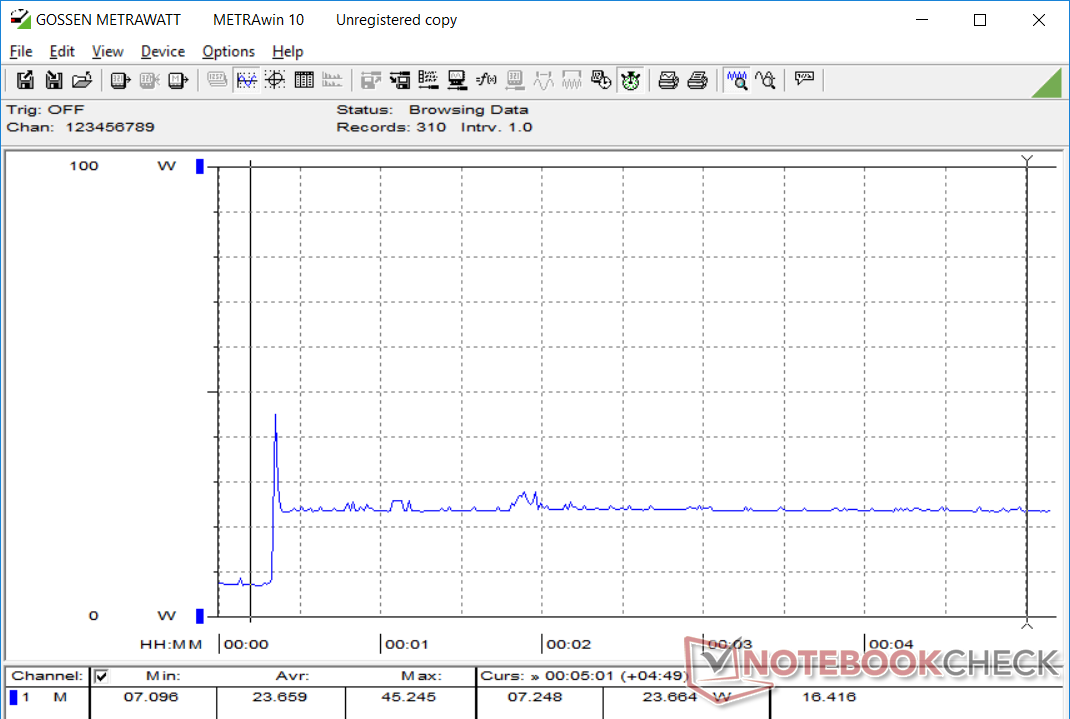
Idling on desktop demands anywhere between 4 W to 8 W depending on the brightness setting and power profile. Maximum load draws about 43 W over a 90-second period from the small (~7.5 x 7.5 x 2.8 cm) 65 W AC adapter. The Huawei MateBook D draws about 9 W more with its slightly faster GeForce MX150 graphics when under high loads.
Monitoring power consumption over time while running Prime95 shows interesting results. Consumption spikes to as high 45 W at the very start of the test before immediately falling and stabilizing at 23.7 W as shown by the image on the right. This reflects our CineBench loop test above where Turbo Boost sustainability was shown to be very poor.
| Off / Standby | |
| Idle | |
| Load |
|
Key:
min: | |
| Lenovo IdeaPad Flex-1570 81CA000RUS i5-8550U, GeForce MX130, SK Hynix PC401 512GB M.2 (HFS512GD9TNG), IPS, 1920x1080, 15.6" | Dell XPS 15 9575 i7-8705G i7-8705G, Vega M GL / 870, SK hynix PC401 NVMe 500 GB, IPS, 3840x2160, 15.6" | Huawei MateBook D 15-53010BAJ i5-8250U, GeForce MX150, Samsung SSD PM981 MZVLB512HAJQ, IPS, 1920x1080, 15.6" | HP Pavilion 15-cs0053cl i5-8250U, UHD Graphics 620, Toshiba MQ04ABF100, TN LED, 1366x768, 15.6" | Lenovo Ideapad 530S-15IKB i5-8250U, UHD Graphics 620, SK hynix PC401 HFS256GD9TNG, IPS, 1920x1080, 15.6" | Asus ZenBook Flip 15 UX561UD i5-8550U, GeForce GTX 1050 Mobile, Micron 1100 MTFDDAV256TBN, IPS, 3840x2160, 15.6" | |
|---|---|---|---|---|---|---|
| Power Consumption | -79% | -20% | 7% | 15% | -77% | |
| Idle Minimum * (Watt) | 4.1 | 6.2 -51% | 4.2 -2% | 5.6 -37% | 3.5 15% | 5.4 -32% |
| Idle Average * (Watt) | 7.6 | 12.9 -70% | 7.2 5% | 7.1 7% | 5.6 26% | 10.8 -42% |
| Idle Maximum * (Watt) | 7.9 | 13.6 -72% | 12.1 -53% | 7.9 -0% | 10.3 -30% | 13.9 -76% |
| Load Average * (Watt) | 42.5 | 76.1 -79% | 51.1 -20% | 32.8 23% | 30.5 28% | 94 -121% |
| Witcher 3 ultra * (Watt) | 38.6 | 84.3 -118% | 52.7 -37% | |||
| Load Maximum * (Watt) | 54 | 99.4 -84% | 59.9 -11% | 30.5 44% | 33.8 37% | 116.6 -116% |
* ... smaller is better
Battery Life
The internal 52.5 Wh battery is larger than what you'd find on the Pavilion x360 15 and about the same as on the more powerful Asus ZenBook Flip 15. Runtime during WLAN load is respectable at 7.5 hours to be comparable to other 15-inch multimedia systems.
Idling on desktop at the lowest settings and brightness can last for almost 19 hours before shutdown. The system cheats a bit, however, as its lowest brightness setting turns off the backlight and display completely to save on power. For most other notebooks, the display is still visible even if on the lowest brightness setting. Getting anywhere near 19 hours is pretty much impossible on the Flex 5 during real-world scenarios.
Charging from near empty to full capacity takes about 2 hours.
| Lenovo IdeaPad Flex-1570 81CA000RUS i5-8550U, GeForce MX130, 52.5 Wh | Dell XPS 15 9575 i7-8705G i7-8705G, Vega M GL / 870, 75 Wh | Huawei MateBook D 15-53010BAJ i5-8250U, GeForce MX150, 43.3 Wh | HP Pavilion 15-cs0053cl i5-8250U, UHD Graphics 620, 41 Wh | Lenovo Ideapad 530S-15IKB i5-8250U, UHD Graphics 620, 45 Wh | Asus ZenBook Flip 15 UX561UD i5-8550U, GeForce GTX 1050 Mobile, 52 Wh | |
|---|---|---|---|---|---|---|
| Battery runtime | -36% | -25% | -22% | -13% | -44% | |
| Reader / Idle (h) | 18.9 | 11.2 -41% | 15.2 -20% | 12 -37% | 9.3 -51% | |
| WiFi v1.3 (h) | 7.5 | 7 -7% | 7.7 3% | 7 -7% | 6.5 -13% | 5.2 -31% |
| Load (h) | 2.8 | 1.1 -61% | 1.2 -57% | 2.2 -21% | 1.4 -50% |
Pros
Cons
Verdict
The Flex 5 is not for enthusiasts or performance users and Lenovo knows this. Instead, the budget system is for the home multimedia user or student who may simply want an inexpensive 15-inch Windows laptop with tablet features for movie playback, word processing, and the occasional casual games. It offers no significant advantages over the Pavilion 2-in-1, Vivobook 2-in-1, Envy 2-in-1, or heavier Inspiron 15 2-in-1 other than an option for the slow GeForce MX130 GPU. As an at-home family convertible, the Flex 5 fits the bill just barely.
There is a long list of unfortunate performance cutbacks. The very dim display means this is a convertible mainly for indoor use and the extremely limited Turbo Boost means there is very little reason to purchase the Core i7-8550U SKU when the less expensive i5-8250U SKU can perform nearly the same. Its single-channel RAM hampers performance even further and the cooling solution is embarrassingly small given the roomy 15-inch form factor. There is ample empty space surrounding the fan that could have been utilized for a larger cooling solution to reduce fan noise.
The $700 starting price is fair for a lackluster and honestly forgettable system while its higher-end SKUs can reach over $1000 USD. We recommend avoiding the costlier options as you'd be better off with a well-made traditional laptop like the XPS 15 or spending a bit more on the Spectre x360 15. The extremely poor Turbo Boost and dim screen make this a tough sell.
Lenovo IdeaPad Flex-1570 81CA000RUS
- 09/03/2018 v6 (old)
Allen Ngo
Price comparison
