Notebook reviews with AMD Radeon RX Vega 10 graphics card
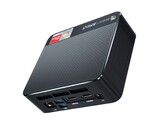
Beelink SER3 mini PC review: The older Ryzen 7 3750H has its uses
If Intel isn't your thing, then the AMD-powered SER3 can offer a similar level of performance as an older 8th gen Core-U series while costing a bit less. It also comes with dual storage and RAM options for easy upgrades down the road.
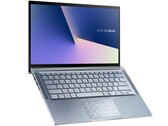
AMD Ryzen 7 3750H, Vega 10, 492 gAsus ZenBook 14 UM431DA laptop review: Also makes a good impression with Ryzen
The Asus ZenBook 14 also makes a good impression with AMD's stronger Ryzen 7 but can't reach its full performance potential despite the fans turning up. With its flat design, the 14-inch laptop stays handy as usual and small features such as the integrated number pad are fun. Our review shows what else is found in the ZenBook 14.
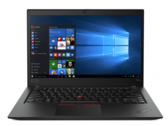
AMD Ryzen 7 3700U, Vega 10, 14", 1.4 kgLenovo ThinkPad T495s Review: The AMD business laptop is good, but the fan is annoying
The ThinkPad T495s with the Ryzen 7 Pro 3700U is a serious alternative to the Intel-based T490s. The price in particular makes the device very interesting, since there are not many compromises compared to the Intel model.
AMD Ryzen 7 PRO 3700U, Vega 10, 14", 1.3 kg
ASUS ZenBook Flip 14 UM462DA Convertible Review: A solid all-rounder, but not for outdoors
The ZenBook Flip 14 attracts attention, not least because of its numeric keypad, which ASUS integrates within its trackpad. The pretty-looking convertible has a 360° hinge and packs an AMD processor, with a stylish design that puts it on par with its competitors. Laptops with AMD processors are on the rise, but currently remain rare. Read on to find out how the ZenBook Flip 14 fares in our tests.
AMD Ryzen 7 3700U, Vega 10, 14", 1.6 kgDell Inspiron 15 5000 5585 Laptop Review: An Excellent Alternative to Intel
The entry-level Inspiron 15 5585 sports the latest AMD Ryzen CPU with great results across the board. Graphics performance in particular is a leap ahead of the Intel UHD Graphics series that should satisfy casual gamers of Fortnite, Rocket League, and other undemanding titles.
AMD Ryzen 7 3700U, Vega 10, 15.6", 1.8 kgLenovo ThinkPad E595-20NF0000GE: AMD Ryzen 7 3700U, 15.60", 1.9 kg
Review » Lenovo ThinkPad E595 laptop review: AMD laptop better than its Intel counterpart?
HP Envy x360 13-ar0601ng: AMD Ryzen 7 3700U, 13.30", 1.3 kg
Review » HP Envy x360 13 Convertible Review: Display highlight with AMD Ryzen support
HP 14-dk0008ng: AMD Ryzen 7 3700U, 14.00", 1.5 kg
Review » Review of the HP 14: Ryzen 7 3700U-based Laptop with an Engaged Handbrake
Lenovo Yoga 530-14ARR-81H9000VGE: AMD Ryzen 7 2700U, 14.00", 1.7 kg
Review » Lenovo Yoga 530-14ARR (Ryzen 7 2700U, RX Vega 10, SSD, FHD) Convertible Review
Dell Latitude 14 5495: AMD Ryzen 7 2700U, 14.00", 1.7 kg
Review » Dell Latitude 5495 (Ryzen 7 Pro, FHD) Laptop Review
HP EliteBook 735 G5 3UN62EA: AMD Ryzen 7 2700U, 13.30", 1.3 kg
Review » HP EliteBook 735 G5 (7 2700U, Vega 10) Laptop Review
Lenovo Ideapad 720S-13ARR: AMD Ryzen 7 2700U, 13.30", 1.1 kg
Review » Lenovo IdeaPad 720s-13ARR (Ryzen 7 2700U, RX Vega 10) Laptop Review
HP EliteBook 745 G5 3UN74EA: AMD Ryzen 7 2700U, 14.00", 1.5 kg
Review » HP EliteBook 745 G5 (Ryzen 7 2700U) Laptop Review
HP EliteBook 755 G5 3UN79EA: AMD Ryzen 7 2700U, 15.60", 1.8 kg
Review » HP EliteBook 755 G5 (Ryzen 7 2700U, Vega 10) Laptop Review
Acer Swift 3 SF315-41-R6J9: AMD Ryzen 7 2700U, 15.60", 2 kg
Review » Acer Swift 3 (Ryzen 7 2700U, Radeon RX Vega 10) Laptop Review
Lenovo ThinkPad E595-20NF0000GE: AMD Ryzen 7 3700U, 15.60", 1.9 kg
External Review » Lenovo ThinkPad E595-20NF0000GE
Lenovo Yoga 530-14ARR-81H9000VGE: AMD Ryzen 7 2700U, 14.00", 1.7 kg
External Review » Lenovo Yoga 530-14ARR-81H9000VGE
Acer Aspire 5 A515-46-R3CZ: AMD Ryzen 7 3700U, 15.60", 1.8 kg
External Review » Acer Aspire 5 A515-46-R3CZ
HP 15-db1068au: AMD Ryzen 7 3700U, 15.60", 1.8 kg
External Review » HP 15-db1068au
Huawei MateBook 13 2020, Ryzen 7 3700U: AMD Ryzen 7 3700U, 13.00", 1.3 kg
External Review » Huawei MateBook 13 2020, Ryzen 7 3700U
Lenovo IdeaPad 3 14ADA05-81W000LFMH: AMD Ryzen 7 3700U, 14.00", 1.6 kg
External Review » Lenovo IdeaPad 3 14ADA05-81W000LFMH
Asus VivoBook 14 M415DA-EK337: AMD Ryzen 7 3700U, 14.00", 1.6 kg
External Review » Asus VivoBook 14 M415DA-EK337
VAIO E15, R7 3700U: AMD Ryzen 7 3700U, 15.60", 1.8 kg
External Review » VAIO E15, R7 3700U
Asus VivoBook 14 M413DA-EB462: AMD Ryzen 7 3700U, 14.00", 1.4 kg
External Review » Asus VivoBook 14 M413DA-EB462
Asus M509DA-EJ071: AMD Ryzen 7 3700U, 15.60", 1.9 kg
External Review » Asus M509DA-EJ071
Asus VivoBook 15 X512DA-EJ389T: AMD Ryzen 7 3700U, 15.60", 1.6 kg
External Review » Asus VivoBook 15 X512DA-EJ389T
Lenovo IdeaPad C340 14API-81N600D2GE: AMD Ryzen 7 3700U, 14.00", 1.7 kg
External Review » Lenovo IdeaPad C340 14API-81N600D2GE
Lenovo Ideapad L340-15API-81LW00HUMH: AMD Ryzen 7 3700U, 15.60", 2.2 kg
External Review » Lenovo Ideapad L340-15API-81LW00HUMH
Huawei MateBook D 14-53010WXN: AMD Ryzen 7 3700U, 14.00", 1.4 kg
External Review » Huawei MateBook D 14-53010WXN
HP EliteBook 745 G6-7DB48AW: AMD Ryzen 7 3700U, 14.00", 1.5 kg
External Review » HP EliteBook 745 G6-7DB48AW
HP Envy x360 15-ds0760nd: AMD Ryzen 7 3700U, 15.60", 2 kg
External Review » HP Envy x360 15-ds0760nd
HP Envy x360 13-ar0004ur: AMD Ryzen 7 3700U, 13.30", 1.3 kg
External Review » HP Envy x360 13-ar0004ur
HP Gaming Pavilion 15-ec0001ns: AMD Ryzen 7 3750H, 15.60", 2.3 kg
External Review » HP Gaming Pavilion 15-ec0001ns
Asus ZenBook 14 UM431DA-AM022: AMD Ryzen 7 3700U, 14.00", 1.4 kg
External Review » Asus ZenBook 14 UM431DA-AM022
Asus VivoBook 17 M712DA-AU069T: AMD Ryzen 7 3700U, 17.30", 2.3 kg
External Review » Asus VivoBook 17 M712DA-AU069T
Asus VivoBook D509DA-EJ098: AMD Ryzen 7 3700U, 15.60", 1.9 kg
External Review » Asus VivoBook D509DA-EJ098
Asus ZenBook Flip 14 UM462DA-AI023T: AMD Ryzen 7 3700U, 14.00", 1.6 kg
External Review » Asus ZenBook Flip 14 UM462DA-AI023T
Acer Swift 3 SF315-41-R7NP: AMD Ryzen 7 2700U, 15.60", 1.9 kg
External Review » Acer Swift 3 SF315-41-R7NP
Lenovo IdeaPad S540-14API-81NH002BFR: AMD Ryzen 7 3700U, 14.00", 1.5 kg
External Review » Lenovo IdeaPad S540-14API-81NH002BFR
HP Envy x360 13-ar0802no: AMD Ryzen 7 3700U, 13.30", 1.3 kg
External Review » HP Envy x360 13-ar0802no
Lenovo IdeaPad S540-81NH007UPB: AMD Ryzen 7 3700U, 14.00", 1.5 kg
External Review » Lenovo IdeaPad S540-81NH007UPB
HP 14-dk0017ns: AMD Ryzen 7 3700U, 14.00", 1.5 kg
External Review » HP 14-dk0017ns
Lenovo IdeaPad S540-14API: AMD Ryzen 7 3700U, 14.00", 1.4 kg
External Review » Lenovo IdeaPad S540-14API
HP Envy x360 13-ar0350nd: AMD Ryzen 7 3700U, 13.30", 1.3 kg
External Review » HP Envy x360 13-ar0350nd
HP Pavilion 15-cw1009ur: AMD Ryzen 7 3700U, 15.60", 1.9 kg
External Review » HP Pavilion 15-cw1009ur
Lenovo ThinkPad T495s-20QKS01E00: AMD Ryzen 7 PRO 3700U, 14.00", 1.3 kg
External Review » Lenovo ThinkPad T495s-20QKS01E00
Asus VivoBook 15 F512DA-EJ109T: AMD Ryzen 7 3700U, 15.60", 1.8 kg
External Review » Asus VivoBook 15 F512DA-EJ109T
HP 15-db1015ns: AMD Ryzen 7 3700U, 15.60", 1.8 kg
External Review » HP 15-db1015ns
Acer Aspire 3 A315-41-R869: AMD Ryzen 7 3700U, 15.60", 2.4 kg
External Review » Acer Aspire 3 A315-41-R869
HP Envy x360 15-ds0000ng: AMD Ryzen 7 3700U, 15.60", 2.1 kg
External Review » HP Envy x360 15-ds0000ng
HP Envy x360 13-ar0601ng: AMD Ryzen 7 3700U, 13.30", 1.3 kg
External Review » HP Envy x360 13-ar0601ng
HP Envy x360 13-ar0210ng: AMD Ryzen 7 3700U, 13.30", 1.3 kg
External Review » HP Envy x360 13-ar0210ng
Asus ZenBook 14 UM433DA, Ryzen 7 3700U: AMD Ryzen 7 3700U, 14.00", 1.1 kg
External Review » Asus ZenBook 14 UM433DA, Ryzen 7 3700U
Acer Aspire 3 A315-41-R8N8: AMD Ryzen 7 2700U, 15.60", 2.3 kg
External Review » Acer Aspire 3 A315-41-R8N8
HP 15-db1010ns: AMD Ryzen 7 3700U, 15.60", 1.8 kg
External Review » HP 15-db1010ns
HP Envy x360 13-ar0003no: AMD Ryzen 7 3700U, 13.30", 1.3 kg
External Review » HP Envy x360 13-ar0003no
HP EliteBook 735 G5 3UN62EA: AMD Ryzen 7 2700U, 13.30", 1.3 kg
External Review » HP EliteBook 735 G5 3UN62EA
HP Envy x360 13-ag0019ur: AMD Ryzen 7 2700U, 13.30", 1.3 kg
External Review » HP Envy x360 13-ag0019ur
HP EliteBook 745 G5-3UP39EA: AMD Ryzen 7 2700U, 14.00", 1.5 kg
External Review » HP EliteBook 745 G5-3UP39EA
Asus VivoBook 15 F505ZA-BQ117T: AMD Ryzen 7 2700U, 15.60", 1.7 kg
External Review » Asus VivoBook 15 F505ZA-BQ117T
Lenovo Yoga 530-14ARR-81H9004RGE: AMD Ryzen 7 2700U, 14.00", 1.6 kg
External Review » Lenovo Yoga 530-14ARR-81H9004RGE
Asus VivoBook 15 X505ZA-BQ298: AMD Ryzen 7 PRO 2700U, 15.60", 1.6 kg
External Review » Asus VivoBook 15 X505ZA-BQ298
HP Envy x360 13-ag0003na: AMD Ryzen 7 2700U, 13.30", 1.3 kg
External Review » HP Envy x360 13-ag0003na
HP EliteBook 745 G5 3UN74EA: AMD Ryzen 7 2700U, 14.00", 1.5 kg
External Review » HP EliteBook 745 G5 3UN74EA
Acer Swift 3 SF315-41-R6J9: AMD Ryzen 7 2700U, 15.60", 2 kg
External Review » Acer Swift 3 SF315-41-R6J9
Lenovo IdeaPad 720s-13ARR 81BR0028MH : AMD Ryzen 7 2700U, 13.30", 1.2 kg
External Review » Lenovo IdeaPad 720s-13ARR 81BR0028MH
Lenovo IdeaPad 720S-13ARR-81BR000XGE: AMD Ryzen 7 2700U, 13.30", 1.1 kg
External Review » Lenovo IdeaPad 720S-13ARR-81BR000XGE
Acer Swift 3 SF315-41-R4AE: AMD Ryzen 7 2700U, 15.60", 2.1 kg
External Review » Acer Swift 3 SF315-41-R4AE
Acer Swift 3 SF315-41-R054: AMD Ryzen 7 2700U, 15.60", 2.1 kg
External Review » Acer Swift 3 SF315-41-R054
Asus ZenBook 14 UM431DA-AM020T: AMD Ryzen 7 3700U, 14.00", 1.4 kg
» Asus ZenBook 14 UM431DA: With a slowed-down AMD CPU