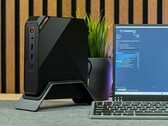
Notebookcheck Logo

Intel UHD Graphics Xe 16EUs (Tiger Lake-H)

The Intel UHD Graphics Xe 750 (Rocket-Lake GPU with 16 EUs) is a integrated graphics card in the low end Tiger Lake-H CPUs. It is using the new Xe architecture (Gen12) and was announced in May 2021. This variant only uses 16 of the 32 EUs in the chip (=128 shaders) and therefore is significantly slower than the 32 EU version.

Compared to the previous generation of UHD Graphics ,the Xe architecture and the improved shader count lead to a big leap in graphics performance.

Gen. 12 / Xe Series

Iris Xe G7 96EUs compare 96 @ 0.4 - 1.35 GHz
Iris Xe G7 80EUs compare 80 @ 0.4 - 1.35 GHz
UHD Graphics 64EUs compare 64 @ 1.4 GHz
UHD Graphics Xe G4 48EUs compare 48 @ 0.35 - 1.45 GHz
UHD Graphics Xe 32EUs (Tiger Lake-H) compare 32 @ 0.35 - 1.45 GHz
UHD Graphics Xe 750 32EUs compare 32 @ 0.35 - 1.45 GHz
UHD Graphics Xe 24EUs compare 32 @ 0.45 - 1.25 GHz
UHD Graphics Xe 16EUs (Tiger Lake-H) 16 @ 0.35 - 1.45 GHz
CodenameTiger Lake Xe
ArchitectureGen. 12
Pipelines16 - unified
Core Speed350 - 1450 (Boost) MHz
Shared Memoryyes
APIDirectX 12_1, OpenGL 4.6
technology10 nm
FeaturesQuickSync
Date of Announcement30.03.2021
CPU in UHD Graphics Xe 16EUs (Tiger Lake-H)GPU Base SpeedGPU Boost / Turbo
Intel Core i7-13650HX14 x 1900 MHz, 55 W? MHz1550 MHz
Intel Core i5-12450HX8 x 1800 MHz, 55 W? MHz1300 MHz
Intel Core i5-11400H6 x 2700 MHz, 45 W350 MHz1450 MHz
min. - max.? - 350 MHz750 - 1550 MHz

Benchmarks

Performance Rating - 3DMark 11 + Fire Strike + Time Spy
3.3 pt (3%)
3DMark - 3DMark Ice Storm Unlimited Graphics
min: 54964     avg: 60718     median: 60717.5 (7%)     max: 66471 Points
3DMark Vantage
3DM Vant. Perf. total +
3DM Vant. Perf. GPU no PhysX +
3DMark 06 3DMark 06 - Standard 1280x1024 +
3DMark 06
min: 9774     avg: 11289     median: 11288.5 (16%)     max: 12803 Points
Cinebench R10 Cinebench R10 Shading (32bit) +
Cinebench R11.5 Cinebench R11.5 OpenGL 64 Bit +
Cinebench R15
Cinebench R15 OpenGL 64 Bit +
Cinebench R15 OpenGL Ref. Match 64 Bit +
GFXBench (DX / GLBenchmark) 2.7
GFXBench 2.7 T-Rex HD Onscreen C24Z16 +
GFXBench T-Rex HD Offscreen C24Z16 +
Power Consumption - Furmark Stress Test Power Consumption - external Monitor *
min: 15.4     avg: 19.4     median: 19.4 (3%)     max: 23.4 Watt
0510152025Tooltip
- Range of benchmark values for this graphics card
- Average benchmark values for this graphics card
* Smaller numbers mean a higher performance

Game Benchmarks

The following benchmarks stem from our benchmarks of review laptops. The performance depends on the used graphics memory, clock rate, processor, system settings, drivers, and operating systems. So the results don't have to be representative for all laptops with this GPU. For detailed information on the benchmark results, click on the fps number.

low 1280x720
23  fps    + Compare
med. 1920x1080
9  fps    + Compare
» The benchmarks indicate that the game is not playable in the tested settings.
Additional Benchmarks
Low Preset 1920x1080
12
low 1280x720
13  fps    + Compare
» The benchmarks indicate that the game is not playable in the tested settings.
Additional Benchmarks
Low Preset 1920x1080
9
low 1280x720
19  fps    + Compare + 📈 Graph
med. 1920x1080
9.3  fps    + Compare + 📈 Graph
» The benchmarks indicate that the game is not playable in the tested settings.
Additional Benchmarks
Low Preset (DX12) 1920x1080
12.7
low 1280x720
21.7  fps    + Compare + 📈 Graph
» The benchmarks indicate that the game is not playable in the tested settings.
Additional Benchmarks
Low Preset 1920x1080
11.7
F1 2021

F1 2021

2021
low 1280x720
34 36.6 ~ 35 fps    + Compare
med. 1920x1080
14.7  fps    + Compare
high 1920x1080
11.9  fps    + Compare
» The benchmarks indicate that the game is not playable in the tested settings.
low 1280x720
48.9  fps    + Compare + 📈 Graph
med. 1920x1080
25.1  fps    + Compare + 📈 Graph
high 1920x1080
21  fps    + Compare + 📈 Graph
» With all tested laptops playable in detail settings low.
Additional Benchmarks
Low Preset 1920x1080
28.9
Days Gone

Days Gone

2021
low 1280x720
13  fps    + Compare + 📈 Graph
» The benchmarks indicate that the game is not playable in the tested settings.
Additional Benchmarks
Low Preset 1920x1080
8.8
Outriders

Outriders

2021
low 1280x720
22  fps    + Compare + 📈 Graph
med. 1920x1080
13  fps    + Compare + 📈 Graph