NVIDIA Quadro FX 3800M
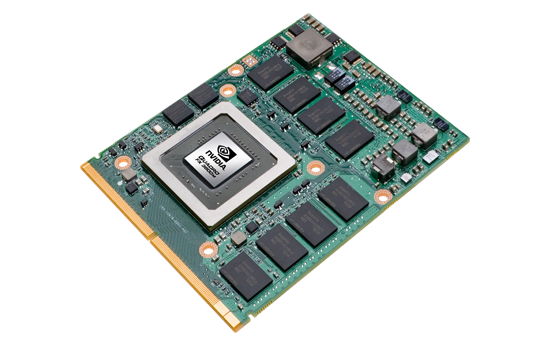
The NVIDIA Quadro FX 3800M is a mobile workstation graphics card for high end laptops. It is based on the Geforce GTX 280M core (G92 core) and features 128 CUDA cores (unified shaders).
Compared to the Quadro FX 3700M, the Quadro FX 3800M features a higher clock speed and is manufacturered in 55nm (compared to 65nm of the 3700M). In fact, the FX3800M is clocked even higher than the consumer GeForce GTX 280M and performs notably better as a result.
The Quadro FX series of cards are optimized for professional applications like CAD or DCC. Notably, OpenGL performance should be much improved compared to consumer GeForce cards of similar specifications.
At the time its announcement (December 2009), the FX 3800M was the fastest workstation graphics card for laptops.
Quadro FX Series
| |||||||||||||||||||||||||||||||||||||||||||||||||||||||
| Codename | N10E-GLM4 | ||||||||||||||||||||||||||||||||||||||||||||||||||||||
| Architecture | G9x | ||||||||||||||||||||||||||||||||||||||||||||||||||||||
| Pipelines | 128 - unified | ||||||||||||||||||||||||||||||||||||||||||||||||||||||
| Core Speed | 675 MHz | ||||||||||||||||||||||||||||||||||||||||||||||||||||||
| Shader Speed | 1688 MHz | ||||||||||||||||||||||||||||||||||||||||||||||||||||||
| Memory Speed | 1000 MHz | ||||||||||||||||||||||||||||||||||||||||||||||||||||||
| Memory Bus Width | 256 Bit | ||||||||||||||||||||||||||||||||||||||||||||||||||||||
| Memory Type | GDDR3 | ||||||||||||||||||||||||||||||||||||||||||||||||||||||
| Max. Amount of Memory | 1024 MB | ||||||||||||||||||||||||||||||||||||||||||||||||||||||
| Shared Memory | no | ||||||||||||||||||||||||||||||||||||||||||||||||||||||
| API | DirectX 10, Shader 4.0 | ||||||||||||||||||||||||||||||||||||||||||||||||||||||
| Power Consumption | 100 Watt | ||||||||||||||||||||||||||||||||||||||||||||||||||||||
| Transistor Count | 754 Million | ||||||||||||||||||||||||||||||||||||||||||||||||||||||
| Man. Technology | 55 nm | ||||||||||||||||||||||||||||||||||||||||||||||||||||||
| Features | OpenGL 2.1, CUDA, PowerMizer 8.0 | ||||||||||||||||||||||||||||||||||||||||||||||||||||||
| Notebook Size | large | ||||||||||||||||||||||||||||||||||||||||||||||||||||||
| Date of Announcement | 20.12.2009 | ||||||||||||||||||||||||||||||||||||||||||||||||||||||
| Link to Manufacturer Page | www.nvidia.com | ||||||||||||||||||||||||||||||||||||||||||||||||||||||
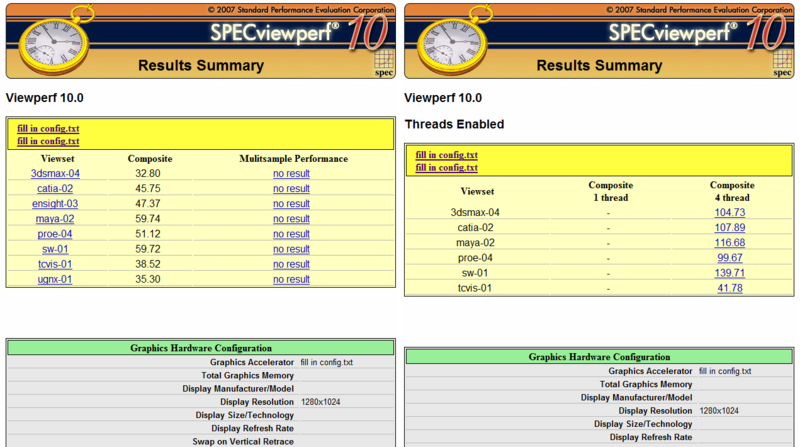
Benchmarks
3DM Vant. Perf. total +

specvp11 snx-01 +
* Smaller numbers mean a higher performance
Game Benchmarks
The following benchmarks stem from our benchmarks of review laptops. The performance depends on the used graphics memory, clock rate, processor, system settings, drivers, and operating systems. So the results don't have to be representative for all laptops with this GPU. For detailed information on the benchmark results, click on the fps number.

Fifa 11
2010
Risen
2009
Need for Speed Shift
2009
Colin McRae: DIRT 2
2009
Anno 1404
2009| low | med. | high | ultra | QHD | 4K | |
|---|---|---|---|---|---|---|
| Fifa 11 | 230.6 | 124.2 | ||||
| Risen | 64.9 | 31.8 | ||||
| Need for Speed Shift | 78.5 | 40.9 | ||||
| Colin McRae: DIRT 2 | 97 | 82 | 29.9 | |||
| Anno 1404 | 142.8 | 61.9 | ||||
| low | med. | high | ultra | QHD | 4K | < 30 fps < 60 fps < 120 fps ≥ 120 fps | 1 1 | 3 1 | 1 | 1 2 1 | | |
For more games that might be playable and a list of all games and graphics cards visit our Gaming List
- $96.99NVIDIA Quadro FX 3800 1GB PCI-E Graphics Adapter
- $32.99NVIDIA Quadro FX 3800 by PNY 1GB GDDR3 PCI Express Gen 2 x16 DVI-I DL Dual DisplayPort and Stereo OpenGL, DirectX, CUDA, and OpenCL Professional Graphics Board, VCQFX3800-PCIE-PB
- $202.99PNY NVIDIA Quadro RTX 4000 - The World’S First Ray Tracing GPU
- $29.55PNY NVIDIA Quadro FX 580 by PNY 512MB GDDR3 PCI Express Gen 2 x16 DVI-I DL and Dual DisplayPort OpenGL, DirectX, CUDA and OpenCL Profesional Graphics Board, VCQFX580-PCIE-PB (Renewed)
- $229.00PNY NVIDIA Quadro P4000
Notebook reviews with NVIDIA Quadro FX 3800M graphics card
Eurocom Panther 2.0: Intel Core i7-980X EE, 17.30", 3.6 kg
External Review » Eurocom Panther 2.0
HP EliteBook 8740W-XT911UT: Intel Core i7-740QM, 17.00", 3.6 kg
External Review » HP EliteBook 8740W-XT911UT
HP 8740W-WW427PA: Intel Core i7-820QM, 17.00", 3.6 kg
External Review » HP 8740W-WW427PA
HP EliteBook 8740w-WD943EA: Intel Core i7-840QM, 17.00", 3.6 kg
External Review » HP EliteBook 8740w-WD943EA
Lenovo ThinkPad W701ds: Intel Core i7-920XM, 17.00", 4.1 kg
External Review » Lenovo ThinkPad W701ds