


Review HP EliteBook 8740w Mobile Workstation
Tool for Professionals. The air at the summit of notebooks is exceptionally thin. Only very few manufacturers accomplish positioning selected models there permanently. The American manufacturer, Hewlett Packard, pilots the Elitebook 8740w to this position. It includes latest quad core CPUs, high-performance graphics cards and last, but not least, a promise of best rates in many fields due to its Dreamcolor display.
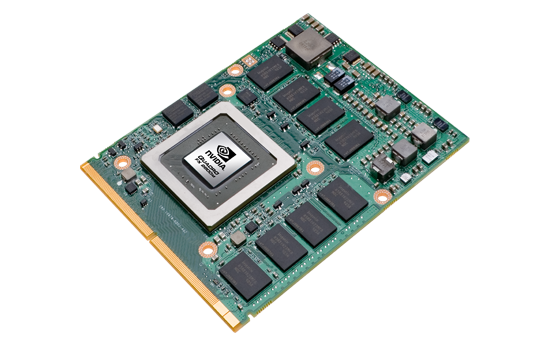
Intel Core i7-820QM, NVIDIA Quadro FX 2800M, 17", 3.8 kg