Notebook reviews with NVIDIA GeForce GTX 1050 Ti Mobile graphics card
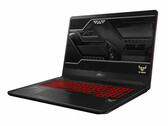
Asus TUF Gaming FX705GE (i7-8750H, GTX 1050 Ti, SSD, FHD) Laptop Review
The 17.3-inch Asus TUF Gaming FX705GE can run all the latest games smoothly at 1080p. The long battery life proves to be a pleasant surprise. However, the notebook does not offer a lot of ports.
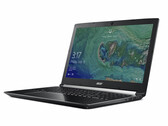
Intel Core i7-8750H, NVIDIA GeForce GTX 1050 Ti Mobile, 17.3", 2.6 kgAcer Aspire 7 A715-72G (i7-8750H, GTX 1050 Ti, SSD, FHD) Laptop Review
Acer’s 15.6-inch multimedia notebook is an all-rounder with very decent hardware that can handle all modern games at 1080p. Despite its price tag of 1200 Euros (~$1374), the device is not free from flaws.
Intel Core i7-8750H, NVIDIA GeForce GTX 1050 Ti Mobile, 15.6", 2.4 kgLenovo Legion Y730-15ICH (i5-8300H, GTX 1050 Ti) Laptop Review
The Legion Y730 is the higher-end alternative to the Legion Y530 and legion Y7000 with flagship-like features including per-key RGB lighting, Thunderbolt 3, and dedicated Macro keys. It's just too bad that current SKUs are limited to the GeForce GTX 1050 Ti.
Intel Core i5-8300H, NVIDIA GeForce GTX 1050 Ti Mobile, 15.6", 2.2 kgHP Pavilion Gaming 15 (i7-8750H, GTX 1050 Ti, Optane Memory, FHD) Laptop Review
The Coffee Lake hexa-core processor and the GeForce GTX 1050 Ti graphics card can display all current games smoothly on the matte Full HD IPS display. On top of that, the device offers 8 GB of RAM in dual-channel mode, Intel Optane Memory and a decent keyboard. However, it also has some weaknesses.
Intel Core i7-8750H, NVIDIA GeForce GTX 1050 Ti Mobile, 15.6", 2.4 kgLenovo Legion Y730-17ICH (i7-8750H, GTX 1050 Ti) Laptop Review
Lenovo wants to reshape its Legion series to appeal to a broader audience outside of just hardcore gamers. The Legion Y730 represents the first step in this new direction and it is subsequently the most balanced laptop in the family to date.
Intel Core i7-8750H, NVIDIA GeForce GTX 1050 Ti Mobile, 17.3", 2.9 kgAcer Nitro 5 AN515-52-74DR: Intel Core i7-8750H, 15.60", 2.3 kg
Review » Acer Nitro 5 (i7-8750H, GTX 1050 Ti, FHD) Laptop Review
Lenovo Legion Y530-15ICH: Intel Core i5-8300H, 15.60", 2.3 kg
Review » Lenovo Legion Y530 (Core i5-8300H, GTX 1050 Ti) Laptop Review
HP Omen 15-dc0001ng: Intel Core i5-8300H, 15.60", 2.4 kg
Review » HP Omen 15 (i5-8300H, GTX 1050 Ti, FHD) Laptop Review
Schenker XMG A707 Coffee Lake: Intel Core i7-8750H, 17.30", 2.9 kg
Review » Schenker XMG A707 (Clevo N871EK1) Laptop Review
Xiaomi Mi Gaming Laptop 7300HQ 1050Ti: Intel Core i5-7300HQ, 15.60", 2.7 kg
Review » Xiaomi Mi Gaming Laptop Review - entry-level device with GTX 1050 Ti and i5-7300HQ
Asus ZenBook Pro 15 UX580GE: Intel Core i9-8950HK, 15.60", 1.9 kg
Review » Asus ZenBook Pro 15 UX580GE (i9-8950HK, GTX 1050 Ti, 4K UHD) Laptop Review
Acer Predator Helios 300 PH317-52-51M6: Intel Core i5-8300H, 17.30", 2.9 kg
Review » Acer Predator Helios 300 (i5-8300H, GTX 1050 Ti, Full-HD) Laptop Review
Asus GL703GE-ES73: Intel Core i7-8750H, 17.30", 2.7 kg
Review » Asus GL703GE (Core i7-8750H, GTX 1050 Ti) Laptop Review
Gigabyte Aero 14-K8: Intel Core i7-8750H, 14.00", 1.9 kg
Review » Gigabyte Aero 14 v8 (i7-8750H, GTX 1050 Ti, QHD) Laptop Review
Alienware 13 R3 (i5-7300HQ, GTX 1050 Ti): Intel Core i5-7300HQ, 13.30", 2.5 kg
Review » Alienware 13 R3 (FHD, i5, GTX 1050 Ti) Laptop Review
Asus Zenbook Pro UX550VE-DB71T: Intel Core i7-7700HQ, 15.60", 1.9 kg
Review » Asus Zenbook Pro UX550VE (i7-7700HQ, GTX 1050 Ti) Laptop Review
Gigabyte Aero 14-K7: Intel Core i7-7700HQ, 14.00", 1.9 kg
Review » Gigabyte Aero 14K (i7-7700HQ, GTX 1050 Ti, QHD) Laptop Review
Lenovo Legion Y520-15IKBN 80WK0042GE: Intel Core i5-7300HQ, 15.60", 2.4 kg
Review » Lenovo Legion Y520-15IKBN (7300HQ, GTX 1050 Ti, FHD) Laptop Review
Acer Nitro 5 AN515-51-788E: Intel Core i7-7700HQ, 15.60", 2.7 kg
Review » Acer Nitro 5 (7700HQ, GTX 1050 Ti) Laptop Review
MSI GP62 7REX-1045US: Intel Core i7-7700HQ, 15.60", 2.5 kg
Review » MSI GP62 7REX (i7-7700HQ, GTX 1050 Ti) Xotic PC Edition Laptop Review
HP Omen 15-ax213ng: Intel Core i7-7700HQ, 15.60", 2.3 kg
Review » HP Omen 15t 2017 (7700HQ, GTX 1050 Ti, Full HD) Laptop Review
HP Omen 17-w206ng: Intel Core i7-7700HQ, 17.30", 2.9 kg
Review » HP Omen 17 (7700HQ, GTX 1050 Ti, FHD) Laptop Review
Asus GL753VE-DS74: Intel Core i7-7700HQ, 17.30", 3 kg
Review » Asus ROG GL753VE (7700HQ, 1050 Ti) Laptop Review
Lenovo Legion Y520-15IKBN-80WK001KUS: Intel Core i7-7700HQ, 15.60", 2.5 kg
Review » Lenovo Legion Y520 15IKBN (7700HQ, FHD, GTX 1050 Ti) Laptop Review
Acer Aspire Nitro BE VN7-793G-5811: Intel Core i5-7300HQ, 17.30", 3.1 kg
Review » Acer Aspire V17 Nitro BE VN7-793G (7300HQ, GTX 1050 Ti, FHD) Laptop Review
Acer Aspire VX5-591G-75C4 VX15: Intel Core i7-7700HQ, 15.60", 2.5 kg
Review » Acer Aspire VX5-591G (7700HQ, FHD, GTX 1050 Ti) Laptop Review
Nexoc G739: Intel Core i7-7700HQ, 17.30", 2.9 kg
Review » Nexoc G739 (Clevo N870HK1) Laptop Review
Schenker XMG P407: Intel Core i7-7700HQ, 14.00", 2.1 kg
Review » Schenker Technologies XMG P407 (Clevo P641HK1) Notebook Review
Dell Inspiron 15 7000 7567: Intel Core i7-7700HQ, 15.60", 2.8 kg
Review » Dell Inspiron 15 7000 7567 Gaming Notebook Review
MSI GE72 7RE-046: Intel Core i7-7700HQ, 17.30", 3 kg
Review » MSI GE72 7RE Apache Pro Notebook Review
Acer Aspire VX5-591G-D0DD: Intel Core i7-7700HQ, 15.60", 2.6 kg
Review » Acer Aspire VX5-591G (VX 15) Notebook Preview
HP Pavilion 15-cs1006ur: Intel Core i7-8565U, 15.60", 1.9 kg
External Review » HP Pavilion 15-cs1006ur
MSI GF63 8RD-028ES: Intel Core i7-8750H, 15.60", 1.9 kg
External Review » MSI GF63 8RD-028ES
HP Pavilion 17-ab455nd: Intel Core i7-8750H, 17.30", 3.1 kg
External Review » HP Pavilion 17-ab455nd
MSI GF75 Thin 9RCX-270ID: Intel Core i7-9750H, 17.30", 2.2 kg
External Review » MSI GF75 Thin 9RCX-270ID
HP Omen 15-DC0046NS: Intel Core i7-8750H, 15.60", 2.4 kg
External Review » HP Omen 15-DC0046NS
MSI GP63 Leopard 8RD-694XES: Intel Core i7-8750H, 15.60", 2.2 kg
External Review » MSI GP63 Leopard 8RD-694XES
HP Pavilion 15-BC410NS: Intel Core i7-8750H, 15.60", 2.2 kg
External Review » HP Pavilion 15-BC410NS
HP Omen 15-dc0015NS: Intel Core i7-8750H, 15.60", 2.4 kg
External Review » HP Omen 15-DC0015NS
HP Spectre x360 15-df0500nd: Intel Core i7-8750H, 15.60", 2.2 kg
External Review » HP Spectre x360 15-df0500nd
Asus Zenbook Pro 15 UX580GE-BO024: Intel Core i7-8750H, 15.60", 1.4 kg
External Review » Asus Zenbook Pro 15 UX580GE-BO024
MSI P65 Creator 8RD-095XES: Intel Core i7-8750H, 15.60", 1.9 kg
External Review » MSI P65 Creator 8RD-095XES
MSI GL63 8RD-643XES: Intel Core i7-8750H, 15.60", 2.2 kg
External Review » MSI GL63 8RD-643XES
MSI GL63 8RD-675ES: Intel Core i7-8750H, 15.60", 2.2 kg
External Review » MSI GL63 8RD-675ES
MSI GL73 8RD-099XES: Intel Core i7-8750H, 17.30", 2.7 kg
External Review » MSI GL73 8RD-099XES
Medion Erazer P6705-MD61347: Intel Core i7-8750H, 15.60", 2.5 kg
External Review » Medion Erazer P6705-MD61347
Medion Erazer P6705-MD61343: Intel Core i7-8750H, 15.60", 2.7 kg
External Review » Medion Erazer P6705-MD61343
HP Gaming Pavilion 15-cx0205ng: Intel Core i7-8750H, 15.60", 2.3 kg
External Review » HP Gaming Pavilion 15-cx0205ng
Asus TUF FX505GE-BQ166: Intel Core i7-8750H, 15.60", 2.2 kg
External Review » Asus TUF FX505GE-BQ166
MSI GV62 8RD-011XES: Intel Core i7-8750H, 15.60", 2.2 kg
External Review » MSI GV62 8RD-011XES
BTO Notebooks X-Book 17X872: Intel Core i7-8750H, 17.20", 2.5 kg
External Review » BTO Notebooks X-Book 17X872
MSI PS63 Modern-091: Intel Core i7-8565U, 15.60", 1.7 kg
External Review » MSI PS63 Modern-091
Asus TUF FX705GE-EW096T: Intel Core i7-8750H, 17.30", 2.6 kg
External Review » Asus TUF FX705GE-EW096T
Lenovo ThinkPad X1 Extreme-20MF000XUK: Intel Core i7-8750H, 15.60", 1.7 kg
External Review » Lenovo ThinkPad X1 Extreme-20MF000XUK
Asus TUF FX504GE-E4183T: Intel Core i7-8750H, 15.60", 2.3 kg
External Review » Asus TUF FX504GE-E4183T
Asus F570ZD: AMD Ryzen 5 2500U, 15.60", 2 kg
External Review » Asus F570ZD
Asus TUF FX504GE-DM122T: Intel Core i5-8300H, 15.60", 2.3 kg
External Review » Asus TUF FX504GE-DM122T
Lenovo ThinkPad X1 Extreme-20MF000TMD: Intel Core i7-8750H, 15.60", 1.8 kg
External Review » Lenovo ThinkPad X1 Extreme-20MF000TMD
MSI GF72 8RD-081XES: Intel Core i7-8750H, 17.30", 2.7 kg
External Review » MSI GF72 8RD-081XES
HP Pavilion 15-bc409ns: Intel Core i5-8300H, 15.60", 2.2 kg
External Review » HP Pavilion 15-bc409ns
HP Spectre x360 15-df0004: Intel Core i7-8750H, 15.60", 2.2 kg
External Review » HP Spectre x360 15-df0004
Lenovo Legion Y530-15ICH-81FV001MTX: Intel Core i7-8750H, 15.60", 2.3 kg
External Review » Lenovo Legion Y530-15ICH-81FV001MTX
Lenovo Legion Y730-15ICH i5-8300H: Intel Core i5-8300H, 15.60", 2.2 kg
External Review » Lenovo Legion Y730-15ICH i5-8300H
Asus TUF FX504GE-DM286: Intel Core i7-8750H, 15.60", 2.3 kg
External Review » Asus TUF FX504GE-DM286
Lenovo Legion Y730-15ICH-81HD001LSP: Intel Core i7-8750H, 15.60", 2.2 kg
External Review » Lenovo Legion Y730-15ICH-81HD001LSP
Medion Erazer P6705-MD61204: Intel Core i7-8750H, 15.60", 2.5 kg
External Review » Medion Erazer P6705-MD61204
HP Pavilion Gaming 15-cx0000ns : Intel Core i7-8750H, 15.60", 2.3 kg
External Review » HP Pavilion Gaming 15-cx0000ns
Medion Erazer P6705-MD61205: Intel Core i5-8300H, 15.60", 2.7 kg
External Review » Medion Erazer P6705-MD61205
MSI GF63 8RD-254UK: Intel Core i7-8750H, 15.60", 1.9 kg
External Review » MSI GF63 8RD-254UK
Medion Erazer P6705-MD61203: Intel Core i7-8750H, 15.60", 2.7 kg
External Review » Medion Erazer P6705-MD61203
MSI GS73 Stealth 8RD-006XES: Intel Core i7-8750H, 17.30", 2.4 kg
External Review » MSI GS73 Stealth 8RD-006XES
Medion Erazer P6705-MD61206: Intel Core i5-8300H, 15.60", 2.7 kg
External Review » Medion Erazer P6705-MD61206
Asus TUF FX705GE-EW103: Intel Core i7-8750H, 17.30", 2.7 kg
External Review » Asus TUF FX705GE-EW103
Asus TUF FX505GE-BQ159T: Intel Core i7-8750H, 15.60", 2.2 kg
External Review » Asus TUF FX505GE-BQ159T
Lenovo ThinkPad X1 Extreme-20MF000TGE: Intel Core i7-8750H, 15.60", 1.8 kg
External Review » Lenovo ThinkPad X1 Extreme-20MF000TGE
Lenovo Legion Y530-15ICH-81FV00L5TX: Intel Core i7-8750H, 15.60", 2.8 kg
External Review » Lenovo Legion Y530-15ICH-81FV00L5TX
HP 15-dc0036TX: Intel Core i7-8750H, 15.60", 2.3 kg
External Review » HP 15-dc0036TX
Lenovo Legion Y530-81FV00JQPB: Intel Core i7-8750H, 15.60", 2.2 kg
External Review » Lenovo Legion Y530-81FV00JQPB
Asus TUF FX505GE-BQ115T: Intel Core i5-8300H, 15.60", 2.2 kg
External Review » Asus TUF FX505GE-BQ115T
HP Pavilion 15-cx0004ng: Intel Core i7-8750H, 15.60", 2.3 kg
External Review » HP Pavilion 15-cx0004ng
MSI GF63 8RD-050NL: Intel Core i7-8750H, 15.60", 1.9 kg
External Review » MSI GF63 8RD-050NL
Acer Nitro 5 AN515-51-76BD: Intel Core i7-7700HQ, 15.60", 2.7 kg
External Review » Acer Nitro 5 AN515-51-76BD
Acer Aspire 7 A715-72G-56E9: Intel Core i5-8300H, 15.60", 2.4 kg
External Review » Acer Aspire 7 A715-72G-56E9
Asus FX504GE-E4063: Intel Core i7-8750H, 15.60", 2.3 kg
External Review » Asus FX504GE-E4063
Asus ZenBook Pro 15 UX580GE-E2036T: Intel Core i9-8950HK, 15.60", 1.9 kg
External Review » Asus ZenBook Pro 15 UX580GE-E2036T
MSI GF62 8RD-010XES: Intel Core i7-8750H, 15.60", 2.2 kg
External Review » MSI GF62 8RD-010XES
Dell G3 15 3579-CN35712: Intel Core i7-8750H, 15.60", 2.5 kg
External Review » Dell G3 15 3579-CN35712
HP Pavilion 15-cx0053ns: Intel Core i5-8300H, 15.60", 2.3 kg
External Review » HP Pavilion 15-cx0053ns
Asus STRIX GL503GE-RS71 SCAR Edition: Intel Core i7-8750H, 15.60", 2.6 kg
External Review » Asus STRIX GL503GE-RS71 SCAR Edition
HP Gaming Pavilion 15-cx0144tx: Intel Core i7-8750H, 15.60", 2.2 kg
External Review » HP Gaming Pavilion 15-cx0144tx
MSI GP63 8RD-409MY Leopard: Intel Core i7-8750H, 15.60", 2.3 kg
External Review » MSI GP63 8RD-409MY Leopard
Lenovo Legion Y530-15ICH-81FV008SGE: Intel Core i7-8750H, 15.60", 2.3 kg
External Review » Lenovo Legion Y530-15ICH-81FV008SGE
Asus TUF FX505GE-BQ153T: Intel Core i7-8750H, 15.60", 2.2 kg
External Review » Asus TUF FX505GE-BQ153T
Acer Nitro 5 AN515-52-5228: Intel Core i5-8300H, 15.60", 2.7 kg
External Review » Acer Nitro 5 AN515-52-5228
HP Gaming Pavilion 15-cx0002ng: Intel Core i5-8300H, 15.60", 2.3 kg
External Review » HP Gaming Pavilion 15-cx0002ng
Acer Predator Helios 300 PH317-52-78X3: Intel Core i7-8750H, 17.30", 3 kg
External Review » Acer Predator Helios 300 PH317-52-78X3
HP Pavilion 15-cx0670nd: Intel Core i7-8750H, 15.60", 2.4 kg
External Review » HP Pavilion 15-cx0670nd
HP Omen 15-dc0850nd: Intel Core i7-8750H, 15.60", 2.4 kg
External Review » HP Omen 15-dc0850nd
Dell XPS 15 9570 CNX97009: Intel Core i7-8750H, 15.60", 1.8 kg
External Review » Dell XPS 15 9570 CNX97009
Dell XPS 15 9570-CPC1J: Intel Core i7-8750H, 15.60", 1.9 kg
External Review » Dell XPS 15 9570-CPC1J
HP Omen 15-dc0001ng: Intel Core i5-8300H, 15.60", 2.4 kg
External Review » HP Omen 15-dc0001ng
MSI GL73 8RD-019XES: Intel Core i7-8750H, 17.30", 2.7 kg
External Review » MSI GL73 8RD-019XES
MSI Stealth Pro GS63 7RE-095XES: Intel Core i7-7700HQ, 15.60", 1.8 kg
External Review » MSI Stealth Pro GS63 7RE-095XES
MSI GP63 8RD-008BE: Intel Core i7-8750H, 15.60", 2.2 kg
External Review » MSI GP63 8RD-008BE
Asus Zenbook Pro 15 UX580GE E2048T: Intel Core i9-8950HK, 15.60", 1.9 kg
External Review » Asus Zenbook Pro 15 UX580GE E2048T
Dell XPS 15 9570-CTXKW: Intel Core i7-8750H, 15.60", 1.8 kg
External Review » Dell XPS 15 9570-CTXKW
Dell G3 15 3579-7972BLK: Intel Core i7-8750H, 15.60", 2.5 kg
External Review » Dell G3 15 3579-7972BLK
Asus TUF FX504GE-US52: Intel Core i5-8300H, 15.60", 2.3 kg
External Review » Asus TUF FX504GE-US52
Lenovo Legion Y730-17ICH, i7-8750H: Intel Core i7-8750H, 17.30", 2.9 kg
External Review » Lenovo Legion Y730-17ICH, i7-8750H
Lenovo Legion Y730-15ICH, i7-8750H: Intel Core i7-8750H, 15.60", 2.2 kg
External Review » Lenovo Legion Y730-15ICH, i7-8750H
Acer Nitro 5 AN515-53-55G9: Intel Core i5-8300H, 15.60", 2.3 kg
External Review » Acer Nitro 5 AN515-53-55G9
Lenovo Legion Y530-15ICH-81FV008RGE: Intel Core i7-8750H, 15.60", 2.3 kg
External Review » Lenovo Legion Y530-15ICH-81FV008RGE
Acer Nitro 5 AN515-52-74DR: Intel Core i7-8750H, 15.60", 2.3 kg
External Review » Acer Nitro 5 AN515-52-74DR
HP Pavilion Gaming 15-cx0003ng: Intel Core i7-8750H, 15.60", 2.3 kg
External Review » HP Pavilion Gaming 15-cx0003ng
Asus Zenbook Pro 15 UX580GE-E2005T: Intel Core i7-8750H, 15.60", 1.9 kg
External Review » Asus Zenbook Pro 15 UX580GE-E2005T
Gigabyte Aero 14-K8: Intel Core i7-8750H, 14.00", 1.9 kg
External Review » Gigabyte Aero 14-K8
Dell G5 15 5587 CN55815: Intel Core i7-8750H, 15.60", 2.7 kg
External Review » Dell G5 15 5587 CN55815
MSI GF62 7RE-1808XES: Intel Core i7-7700HQ, 15.60", 2.2 kg
External Review » MSI GF62 7RE-1808XES
Acer Predator Helios 300 PH317-51-76Y2: Intel Core i7-7700HQ, 17.30", 3 kg
External Review » Acer Predator Helios 300 PH317-51-76Y2
Xiaomi Mi Gaming Laptop 7300HQ 1050Ti: Intel Core i5-7300HQ, 15.60", 2.7 kg
External Review » Xiaomi Mi Gaming Laptop 7300HQ 1050Ti
Lenovo Legion Y530-15ICH: Intel Core i5-8300H, 15.60", 2.3 kg
External Review » Lenovo Legion Y530-15ICH
Dell G3 15 3579, GTX 1050 Ti, i5-8300H: Intel Core i5-8300H, 15.60", 2.4 kg
External Review » Dell G3 3579, GTX 1050 Ti, i5-8300H
HP Pavilion 17-ab404ng: Intel Core i7-8750H, 17.30", 3.1 kg
External Review » HP Pavilion 17-ab404ng
MSI GL63 8RD-407XES: Intel Core i7-8750H, 15.60", 2.2 kg
External Review » MSI GL63 8RD-407XES
Asus FX504GE-DM198T: Intel Core i7-8750H, 15.60", 2.3 kg
External Review » Asus FX504GE-DM198T
MSI GE63 Raider 7RD-021XES: Intel Core i7-7700HQ, 15.60", 2.4 kg
External Review » MSI GE63 Raider 7RD-021XES
MSI GL62M 7REX-2201XES: Intel Core i7-7700HQ, 15.60", 2.2 kg
External Review » MSI GL62M 7REX-2201XES
HP Pavilion 17-ab309ng: Intel Core i7-7700HQ, 17.30", 2.9 kg
External Review » HP Pavilion 17-ab309ng
Asus TUF FX504GE-EN088T: Intel Core i7-8750H, 15.60", 2.3 kg
External Review » Asus TUF FX504GE-EN088T
Acer Nitro 5 AN515-51-504A: Intel Core i5-7300HQ, 15.60", 2.7 kg
External Review » Acer Nitro 5 AN515-51-504A
Acer Predator Helios 300 PH317-52-51M6: Intel Core i5-8300H, 17.30", 2.9 kg
External Review » Acer Predator Helios 300 PH317-52-51M6
MSI GP72M 7REX-1245NL Leopard Pro: Intel Core i7-7700HQ, 17.30", 2.7 kg
External Review » MSI GP72M 7REX-1245NL Leopard Pro
Asus ZenBook Pro UX550VE-E3130T: Intel Core i7-7700HQ, 15.60", 1.8 kg
External Review » Asus ZenBook Pro UX550VE-E3130T
Asus Zenbook Pro 15 UX550GE-BN026R: Intel Core i7-8750H, 15.60", 2 kg
External Review » Asus Zenbook Pro 15 UX550GE-BN026R
Asus ZenBook Pro 15 UX580GE: Intel Core i9-8950HK, 15.60", 1.9 kg
External Review » Asus ZenBook Pro 15 UX580GE
Acer Aspire 7 A715-71G-71Q5: Intel Core i7-7700HQ, 15.60", 2.4 kg
External Review » Acer Aspire 7 A715-71G-71Q5
MSI GL62M 7REX-2281NL: Intel Core i7-7700HQ, 15.60", 2.2 kg
External Review » MSI GL62M 7REX-2281NL
MSI PE62 7RE-2494IT: Intel Core i7-7700HQ, 15.60", 2.3 kg
External Review » MSI PE62 7RE-2494IT
Acer Predator Helios 300 G3-572-7056: Intel Core i7-7700HQ, 15.60", 2.7 kg
External Review » Acer Predator Helios 300 G3-572-7056
Gigabyte Aero 14 v8: Intel Core i7-8750H, 14.00", 1.9 kg
External Review » Gigabyte Aero 14 v8
Dell G5 15 5587: Intel Core i5-8300H, 15.60", 2.6 kg
External Review » Dell G5 15 5587
Dell Vostro 15 7570: Intel Core i7-7700HQ, 15.60", 2.7 kg
External Review » Dell Vostro 15 7570
Acer Nitro 5 AN515-51-788E: Intel Core i7-7700HQ, 15.60", 2.7 kg
External Review » Acer Nitro 5 AN515-51-788E
MSI GL63 8RD-014XES: Intel Core i7-8750H, 15.60", 2.2 kg
External Review » MSI GL63 8RD-014XES
Acer Aspire Nitro VN7-793G-77RA: Intel Core i7-7700HQ, 17.30", 3.1 kg
External Review » Acer Aspire Nitro VN7-793G-77RA
Acer Aspire Nitro 5 AN515-52-50YX : Intel Core i5-8300H, 15.60", 2.7 kg
External Review » Acer Aspire Nitro 5 AN515-52-50YX
Acer Aspire 7 A717-71G-74LF: Intel Core i7-7700HQ, 17.30", 3 kg
External Review » Acer Aspire 7 A717-71G-74LF
MSI GP62M 7REX-2621MY: Intel Core i7-7700HQ, 15.60", 2.2 kg
External Review » MSI GP62M 7REX-2621MY
Acer Nitro 5 AN515-51-79N0: Intel Core i7-7700HQ, 15.60", 2.7 kg
External Review » Acer Nitro 5 AN515-51-79N0
MSI GS63 7RE-052IT Stealth Pro: Intel Core i7-7700HQ, 15.60", 1.8 kg
External Review » MSI GS63 7RE-052IT Stealth Pro
Acer Nitro 5 AN515-51-55WL: Intel Core i5-7300HQ, 15.60", 2.7 kg
External Review » Acer Nitro 5 AN515-51-55WL
Lenovo Ideapad Y520-15IKBN-80WK00TBSP: Intel Core i7-7700HQ, 15.60", 2.5 kg
External Review » Lenovo Ideapad Y520-15IKBN-80WK00TBSP
Acer Nitro 5 AN515-51-76CN: Intel Core i7-7700HQ, 15.60", 2.7 kg
External Review » Acer Nitro 5 AN515-51-76CN
Asus Zenbook Pro UX550VE-BO104T: Intel Core i7-7700HQ, 15.60", 1.8 kg
External Review » Asus Zenbook Pro UX550VE-BO104T
Dell Inspiron 15 7577-0074: Intel Core i7-7700HQ, 15.60", 2.7 kg
External Review » Dell Inspiron 15 7577-0074
HP Omen 15-CE086TX: Intel Core i7-7700HQ, 15.60", 2.6 kg
External Review » HP Omen 15-CE086TX
Lenovo Legion Y520-15IKBN-255: Intel Core i7-7700HQ, 15.60", 2.4 kg
External Review » Lenovo Legion Y520-15IKBN-255
Acer Aspire Nitro 5 AN515-51-720N: Intel Core i7-7700HQ, 15.60", 2 kg
External Review » Acer Aspire Nitro 5 AN515-51-720N
Lenovo Ideapad Y520-15IKBN-80WK00JQSP: Intel Core i5-7300HQ, 15.60", 2.5 kg
External Review » Lenovo Ideapad Y520-15IKBN-80WK00JQSP
Asus Zenbook Pro UX550VE-DB71T: Intel Core i7-7700HQ, 15.60", 1.9 kg
External Review » Asus Zenbook Pro UX550VE-DB71T
Acer Nitro 5 AN515-51-71B5: Intel Core i7-7700HQ, 15.60", 2.7 kg
External Review » Acer Nitro 5 AN515-51-71B5
Acer Aspire 7 A715-71G-70FK: Intel Core i7-7700HQ, 15.60", 2.4 kg
External Review » Acer Aspire 7 A715-71G-70FK
Acer Aspire VX5-591G-77SQ: Intel Core i7-7700HQ, 15.60", 2.5 kg
External Review » Acer Aspire VX5-591G-77SQ
MSI GV72 7RE-862RU: Intel Core i7-7700HQ, 17.30", 2.7 kg
External Review » MSI GV72 7RE-862RU
HP Omen 17-an008ur: Intel Core i7-7700HQ, 17.30", 3.8 kg
External Review » HP Omen 17-an008ur
Acer Aspire 7 A715-71G-72WV: Intel Core i7-7700HQ, 15.60", 2.4 kg
External Review » Acer Aspire 7 A715-71G-72WV
Asus Zenbook Pro UX550VE-BN072R: Intel Core i7-7700HQ, 15.60", 1.8 kg
External Review » Asus Zenbook Pro UX550VE-BN072R
MSI GE72 7RE-668XES: Intel Core i7-7700HQ, 17.30", 2.7 kg
External Review » MSI GE72 7RE-668XES
Schenker XMG A707-nyd: Intel Core i7-7700HQ, 17.30", 2.9 kg
External Review » Schenker XMG A707-nyd
Acer Predator Helios 300 PH317-51-78H7: Intel Core i7-7700HQ, 15.60", 2.6 kg
External Review » Acer Predator Helios 300 PH317-51-78H7
Asus GL553VE-FY101T: Intel Core i7-7700HQ, 15.60", 2.5 kg
External Review » Asus GL553VE-FY101T
MSI GP62M 7REX-1289NL: Intel Core i7-7700HQ, 15.60", 2.2 kg
External Review » MSI GP62M 7REX-1289NL
MSI GV62 7RE-1810XES: Intel Core i7-7700HQ, 15.60", 2.2 kg
External Review » MSI GV62 7RE-1810XES
Dell Inspiron 15 7567-716K: Intel Core i7-7700HQ, 15.60", 2.6 kg
External Review » Dell Inspiron 15 7567-716K
Lenovo Ideapad Y520-15IKBN-80WK00EXSP: Intel Core i7-7700HQ, 15.60", 2.5 kg
External Review » Lenovo Ideapad Y520-15IKBN-80WK00EXSP
MSI GE62 7RE-094NL: Intel Core i7-7700HQ, 15.60", 2.4 kg
External Review » MSI GE62 7RE-094NL
MSI GL62M 7REX-1448NL: Intel Core i7-7700HQ, 15.60", 2.7 kg
External Review » MSI GL62M 7REX-1448NL
Acer Aspire V Nitro VN7-793G-74NP: Intel Core i7-7700HQ, 17.30", 3.2 kg
External Review » Acer Aspire V Nitro VN7-793G-74NP
Asus ZenBook Pro UX550VE-BN050T: Intel Core i7-7700HQ, 15.60", 1.8 kg
External Review » Asus ZenBook Pro UX550VE-BN050T
Lenovo Legion Y520-15IKBN 80WK0042GE: Intel Core i5-7300HQ, 15.60", 2.4 kg
External Review » Lenovo Legion Y520-15IKBN 80WK0042GE
Gigabyte Aero 14-K7: Intel Core i7-7700HQ, 14.00", 1.9 kg
External Review » Gigabyte Aero 14-K7
HP Omen 17-an011ng: Intel Core i7-7700HQ, 17.30", 3.8 kg
External Review » HP Omen 17-an011ng
MSI GP72M 7REX-687NL: Intel Core i7-7700HQ, 17.30", 2.7 kg
External Review » MSI GP72M 7REX-687NL
MSI GP62X Leopard Pro-1045: Intel Core i7-7700HQ, 15.60", 2.2 kg
External Review » MSI GP62X Leopard Pro-1045
Gigabyte Sabre 17K-CF1: Intel Core i7-7700HQ, 17.30", 2.5 kg
External Review » Gigabyte Sabre 17K-CF1
Asus UX550VE (HID Edition): Intel Core i7-7700HQ, 15.60", 1.9 kg
External Review » Asus UX550VE (HID Edition)
HP Omen 15-ce013nu: Intel Core i7-7700HQ, 15.60", 2.6 kg
External Review » HP Omen 15-ce013nu
MSI GP62 7RE-281XES: Intel Core i7-7700HQ, 15.60", 2.4 kg
External Review » MSI GP62 7RE-281XES
MSI GL62M 7REX-1252CN: Intel Core i7-7700HQ, 15.60", 2.3 kg
External Review » MSI GL62M 7REX-1252CN
MSI GP62 7REX-1045US: Intel Core i7-7700HQ, 15.60", 2.5 kg
External Review » MSI GP62 7REX-1045US
Acer Aspire 7 A717-71G-58R1: Intel Core i7-7700HQ, 17.30", 2.9 kg
External Review » Acer Aspire 7 A717-71G-58R1
Schenker XMG A507: Intel Core i7-7700HQ, 15.60", 2.4 kg
External Review » Schenker XMG A507
Medion Erazer X6603: Intel Core i7-7700HQ, 15.60", 2.6 kg
External Review » Medion Erazer X6603
MSI GS63 7RE-025ES Stealth Pro: Intel Core i7-7700HQ, 15.60", 1.8 kg
External Review » MSI GS63 7RE-025ES Stealth Pro
HP OMEN 17-w204ur: Intel Core i7-7700HQ, 17.30", 2.9 kg
External Review » HP OMEN 17-w204ur
Lenovo Legion Y520-15IKBN-80WK001KUS: Intel Core i7-7700HQ, 15.60", 2.5 kg
External Review » Lenovo Legion Y520-15IKBN-80WK001KUS
MSI GL62M 7REX-1601XES: Intel Core i7-7700HQ, 15.60", 2.2 kg
External Review » MSI GL62M 7REX-1601XES
Lenovo Ideapad Y520-15IKBN-80WK00HVSP: Intel Core i5-7300HQ, 15.60", 2.5 kg
External Review » Lenovo Ideapad Y520-15IKBN-80WK00HVSP
Lenovo Legion Y520-15IKBN-80WK0042GE: Intel Core i5-7300HQ, 15.60", 2.4 kg
External Review » Lenovo Legion Y520-15IKBN-80WK0042GE
MSI GP72 7REX-612XES Leopard Pro: Intel Core i7-7700HQ, 17.30", 2.7 kg
External Review » MSI GP72 7REX-612XES Leopard Pro
MSI GS63 7RE-026XES: Intel Core i7-7700HQ, 15.60", 1.8 kg
External Review » MSI GS63 7RE-026XES
Lenovo Legion Y520-15IKBN-80WK00J0SP: Intel Core i7-7700HQ, 15.60", 2.4 kg
External Review » Lenovo Legion Y520-15IKBN-80WK00J0SP
Dell Inspiron 15 7567-9323: Intel Core i7-7700HQ, 15.60", 2.7 kg
External Review » Dell Inspiron 15 7567-9323
Origin PC Eon15-S 2017: Intel Core i7-7700HQ, 15.60", 2.3 kg
External Review » Origin PC Eon15-S 2017
Asus ZenBook Pro UX550VE: Intel Core i7-7700HQ, 15.60", 1.9 kg
External Review » Asus ZenBook Pro UX550VE
MSI GS63 7RE-011 Stealth Pro: Intel Core i7-7700HQ, 15.60", 1.8 kg
External Review » MSI GS63 7RE-011 Stealth Pro
HP Omen 15-ax204ng: Intel Core i7-7700HQ, 15.60", 2.2 kg
External Review » HP Omen 15-ax204ng
MSI GP62 7RE-431XES: Intel Core i7-7700HQ, 15.60", 2.4 kg
External Review » MSI GP62 7RE-431XES
Lenovo Legion Y520-15IKBN-80WK0028RK: Intel Core i5-7300HQ, 15.60", 2.4 kg
External Review » Lenovo Legion Y520-15IKBN-80WK0028RK
Acer Aspire VX5-591G-56B4: Intel Core i5-7300HQ, 15.60", 2.5 kg
External Review » Acer Aspire VX5-591G-56B4
Asus GL553VE-FY022T: Intel Core i7-7700HQ, 15.60", 2.5 kg
External Review » Asus GL553VE-FY022T
Gigabyte Sabre 15K-DE022T: Intel Core i7-7700HQ, 15.60", 2.5 kg
External Review » Gigabyte Sabre 15K-DE022T
Lenovo Legion Y520-15IKB-80WK00BTCK: Intel Core i7-7700HQ, 15.60", 2.4 kg
External Review » Lenovo Legion Y520-15IKB-80WK00BTCK
MSI GP72 7RE Leopard Pro: Intel Core i7-7700HQ, 17.30", 2.7 kg
External Review » MSI GP72 7RE Leopard Pro
MSI GS73 Stealth Pro-009: Intel Core i7-7700HQ, 17.30", 2.4 kg
External Review » MSI GS73 Stealth Pro-009
Lenovo Legion Y520-15IKBN-80WK00F7GE: Intel Core i7-7700HQ, 15.60", 2.4 kg
External Review » Lenovo Legion Y520-15IKBN-80WK00F7GE
MSI GL62M 7RE-407: Intel Core i5-7300HQ, 15.60", 2.2 kg
External Review » MSI GL62M 7RE-407
Acer Aspire V17 Nitro BE VN7-793G-5811: Intel Core i5-7300HQ, 17.30", 3.1 kg
External Review » Acer Aspire V17 Nitro BE VN7-793G-5811
MSI GL72 7RD-028: Intel Core i7-7700HQ, 17.30", 2.7 kg
External Review » MSI GL72 7RD-028
Schenker XMG P407: Intel Core i7-7700HQ, 14.00", 2.1 kg
External Review » Schenker XMG P407
MSI GE72 7RE-084XES Apache Pro: Intel Core i7-7700HQ, 17.30", 2.9 kg
External Review » MSI GE72 7RE-084XES Apache Pro
MSI GE62 7RE-216XES: Intel Core i7-7700HQ, 15.60", 2.4 kg
External Review » MSI GE62 7RE-216XES
Dell Inspiron 15 7567-9316: Intel Core i7-7700HQ, 15.60", 2.6 kg
External Review » Dell Inspiron 15 7567-9316
Dell Inspiron 15 7000 7567: Intel Core i7-7700HQ, 15.60", 2.8 kg
External Review » Dell Inspiron 15 7000 7567
Acer Aspire VX5-591G-71EF: Intel Core i7-7700HQ, 15.60", 2.6 kg
External Review » Acer Aspire VX5-591G-71EF
MSI GE72 7RE-050NL Apache Pro: Intel Core i7-7700HQ, 17.30", 2.7 kg
External Review » MSI GE72 7RE-050NL Apache Pro
Lenovo Legion Y520-80WK001SMX: Intel Core i5-7300HQ, 15.60", 2.4 kg
External Review » Lenovo Legion Y520-80WK001SMX
MSI GL72 7RD-075XES: Intel Core i7-7700HQ, 17.30", 2.7 kg
External Review » MSI GL72 7RD-075XES
MSI GE72 7RE Apache Pro 212RU: Intel Core i7-7700HQ, 17.30", 2.7 kg
External Review » MSI GE72 7RE Apache Pro 212RU
BTO Notebooks X-Book 15CL71: Intel Core i7-7700HQ, 15.60", 2.3 kg
External Review » BTO Notebooks X-Book 15CL71
Acer Aspire VX5-591G-75C4 VX15: Intel Core i7-7700HQ, 15.60", 2.5 kg
External Review » Acer Aspire VX5-591G-78HD VX15
Asus GL553VE-FY003T: Intel Core i7-7700HQ, 15.60", 2.5 kg
External Review » Asus GL553VE-FY003T
MSI GE62 7RD Apache: Intel Core i7-7700HQ, 15.60", 2.4 kg
External Review » MSI GE62 7RD Apache
Acer Aspire VX5-591G-75RM: Intel Core i7-7700HQ, 15.60", 2.6 kg
External Review » Acer Aspire VX5-591G-75RM
Asus GL753VE-DS74: Intel Core i7-7700HQ, 17.30", 3 kg
External Review » Asus GL753VE-DS74
MSI GE62 7RE-027UK Apache Pro: Intel Core i7-7700HQ, 15.60", 2.4 kg
External Review » MSI GE62 7RE-027UK Apache Pro
Dell Inspiron 15 7567-5372: Intel Core i5-7300HQ, 15.60", 2.8 kg
External Review » Dell Inspiron 15 7567-5372
Acer Aspire VX5-591G-75C4: Intel Core i7-7700HQ, 15.60", 2.6 kg
External Review » Acer Aspire VX5-591G-75C4
Asus GL553VE-DS74: Intel Core i7-7700HQ, 15.60", 2.5 kg
External Review » Asus GL553VE-DS74
MSI GE72 7RE-006PL: Intel Core i7-7700HQ, 17.30", 2.9 kg
External Review » MSI GE72 7RE-006PL
MSI GE72 7RE-045CZ: Intel Core i7-7700HQ, 17.30", 2.7 kg
External Review » MSI GE72 7RE-045CZ
Acer Aspire VX5-591G-D0DD: Intel Core i7-7700HQ, 15.60", 2.6 kg
External Review » Acer Aspire VX5-591G-D0DD
MSI GE62 7RE Apache Pro - 7RE-088: Intel Core i7-7700HQ, 15.60", 2.4 kg
External Review » MSI GE62 7RE Apache Pro - 7RE-088
MSI GE72 7RE-046: Intel Core i7-7700HQ, 17.30", 3 kg
External Review » MSI GE72 7RE-046