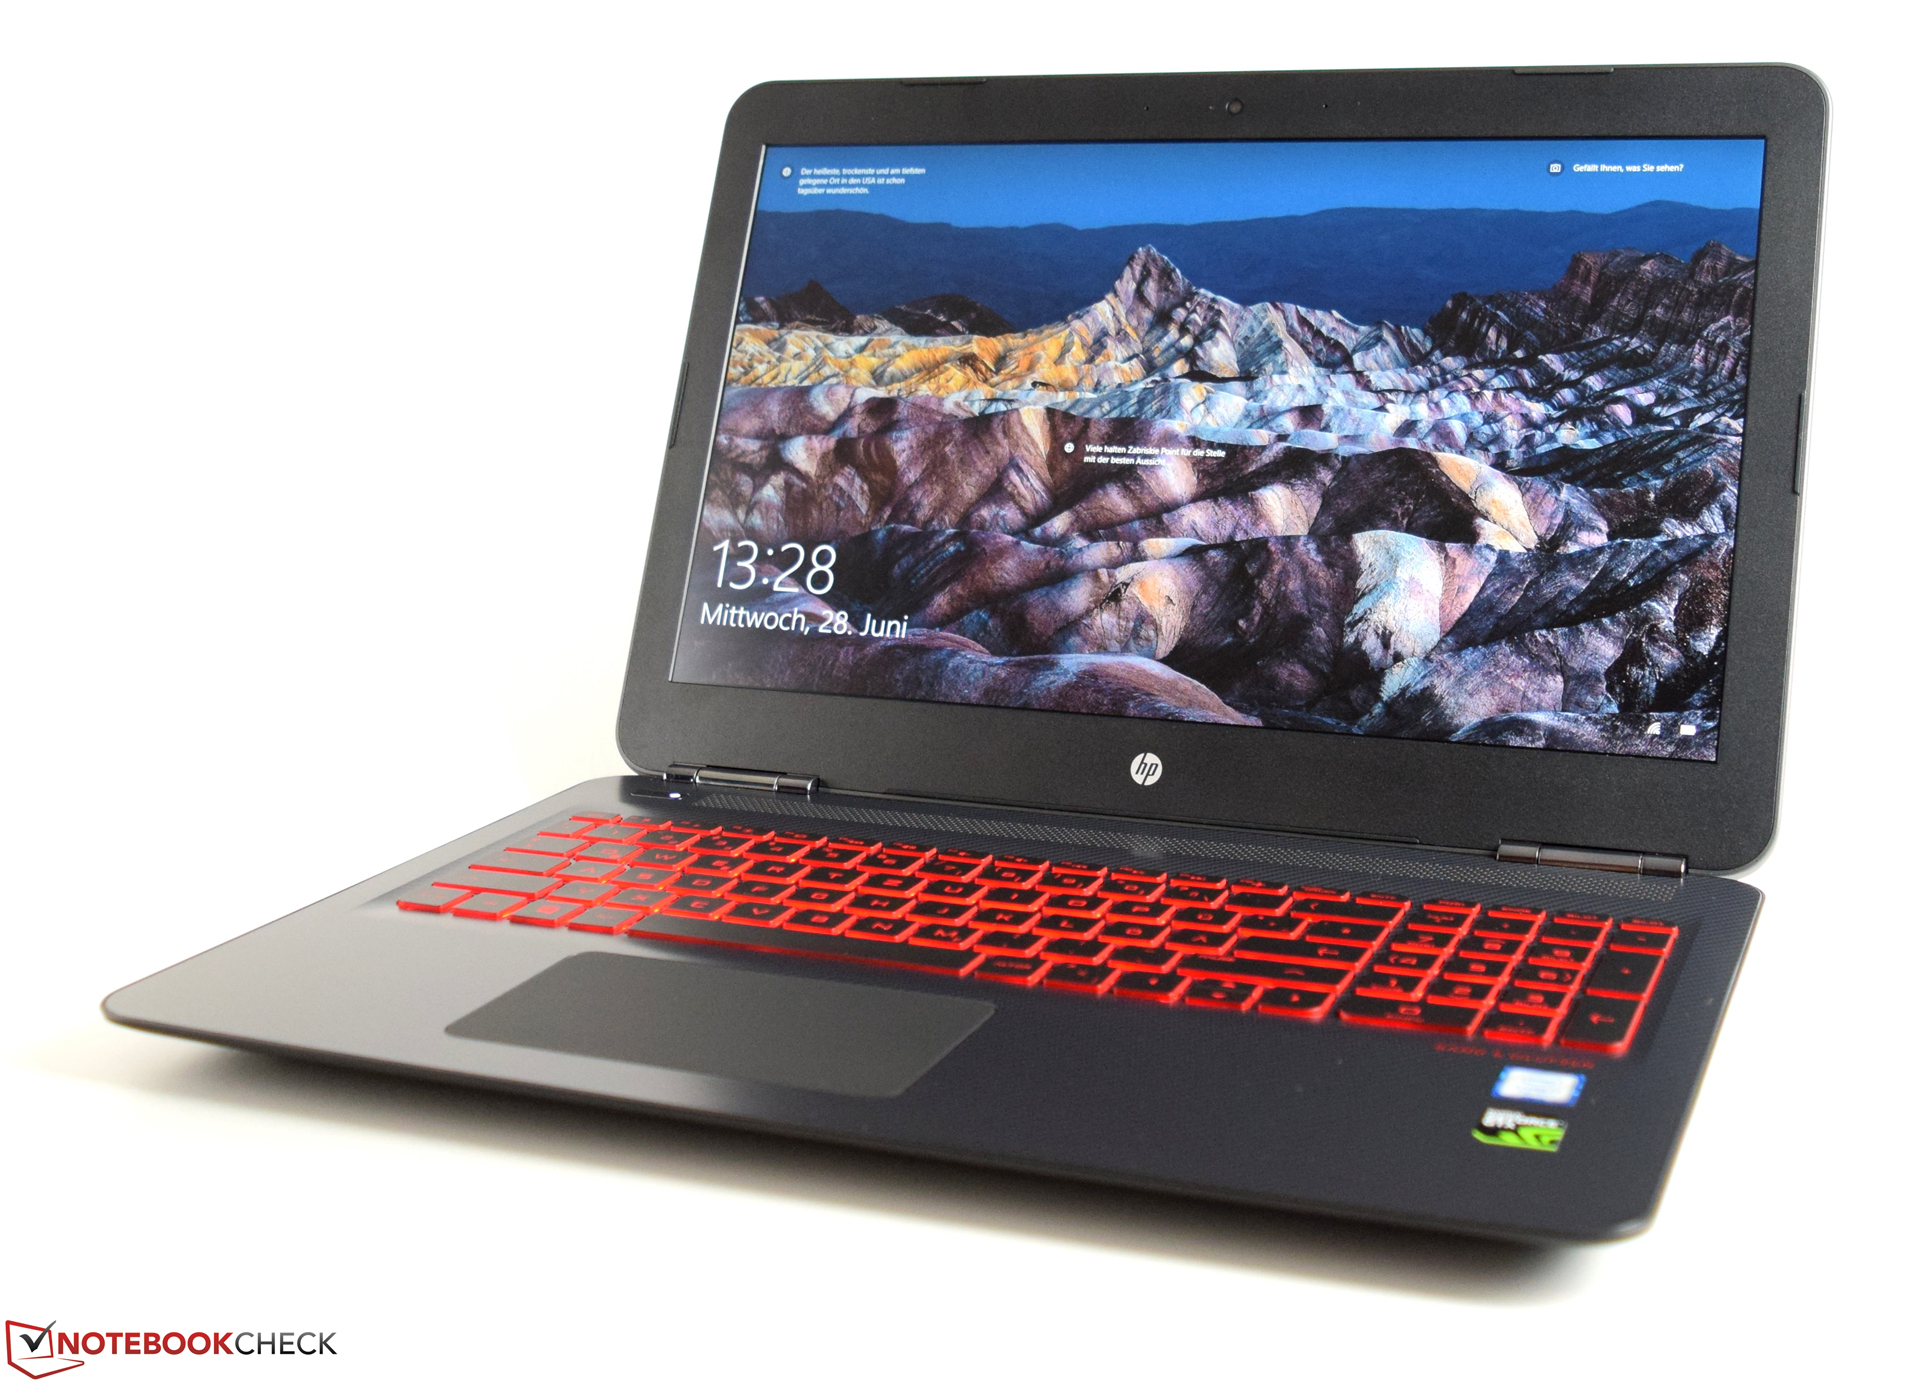
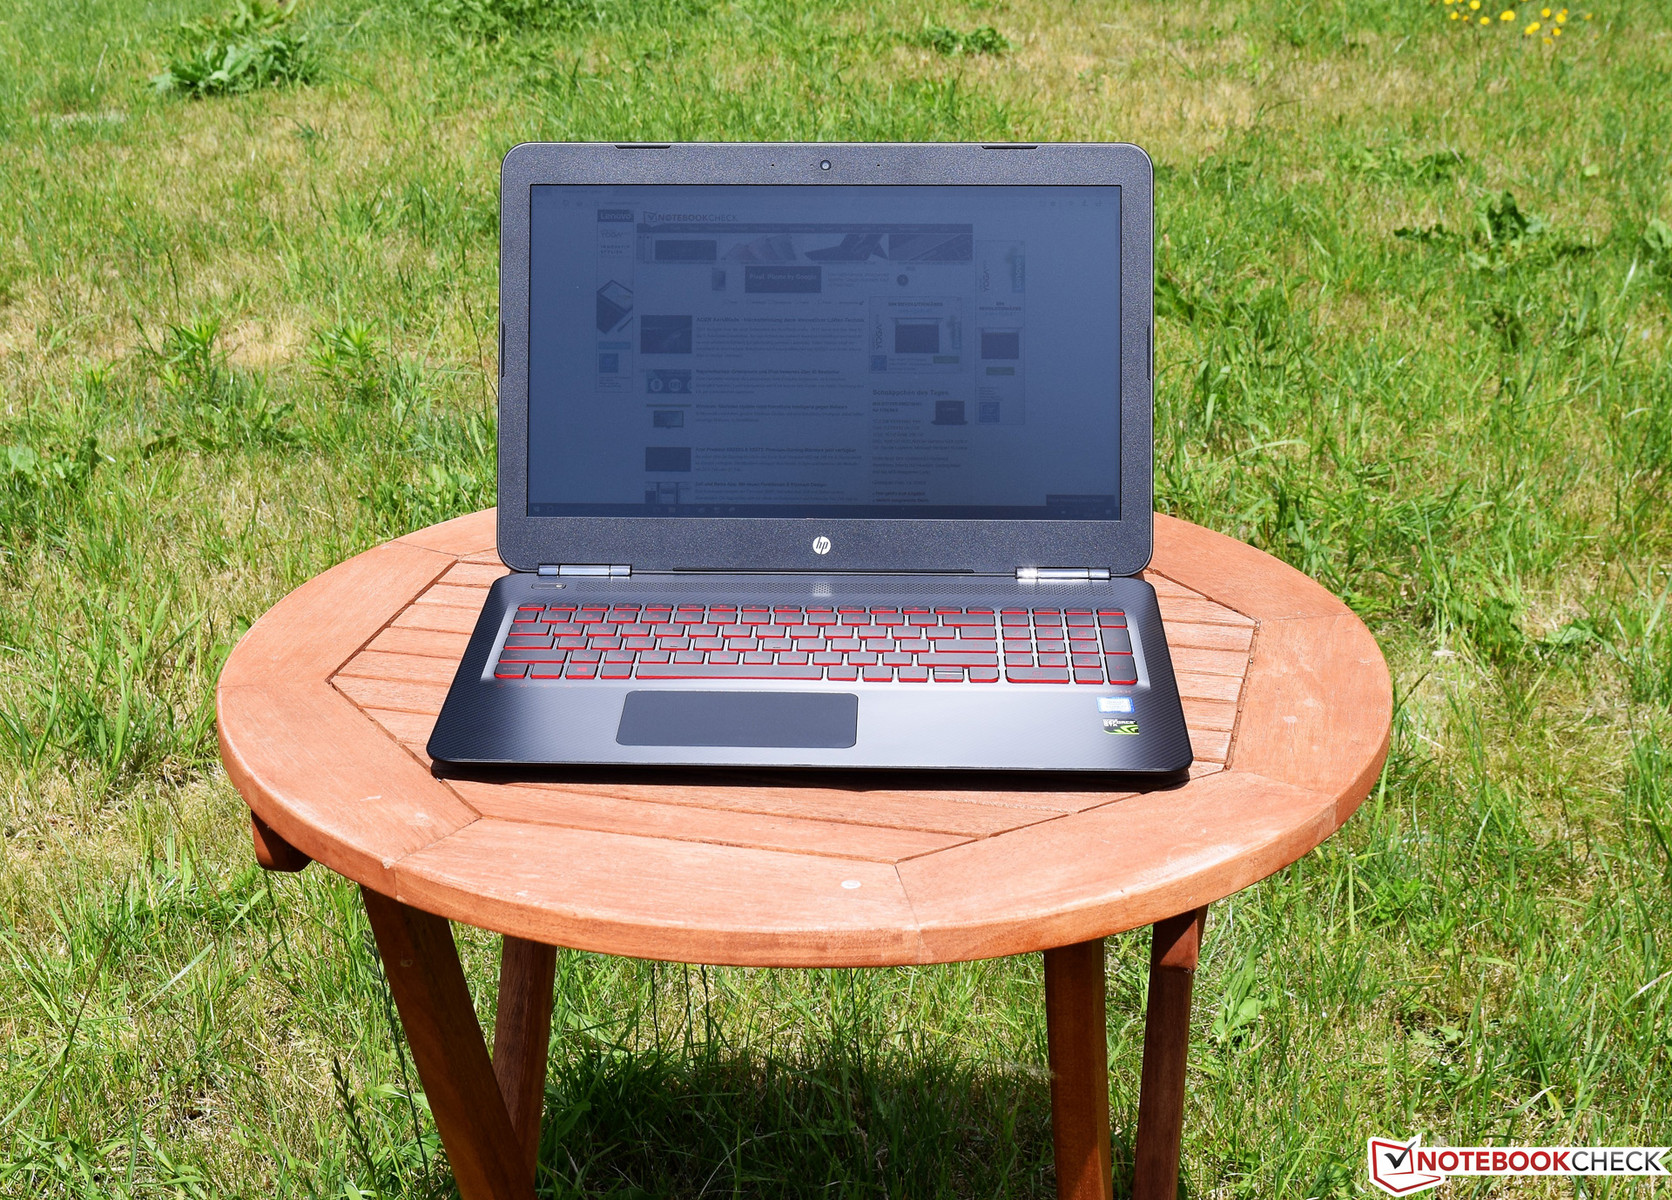
HP Omen 15t 2017 (7700HQ, GTX 1050 Ti, Full HD) Laptop Review

For the original German review, see here.
Last time, it took the manufacturer one and a half years to present a decent update. Since then, another year has gone by and HP has now launched a gaming laptop which is mostly directed at occasional gamers. Nothing has changed on the outside and the manufacturer has focused on giving the device a performance upgrade. The Skylake processor has been replaced by the more up-to-date Kaby Lake processor and the Maxwell-based GeForce GTX 965M had to give way to a modern GeForce GTX 965M based on Pascal architecture.
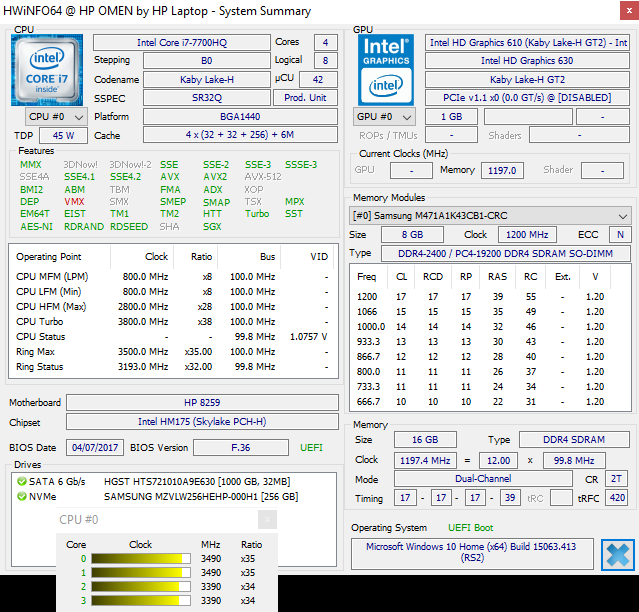
Our test unit is currently available for $1510. It is equipped with an Intel Core i7-7700HQ, a GeForce GTX 1050 Ti and 16 GB of DDR4 RAM. HP has also gifted the Omen 15t (2017) with a 256-GB SSD and an additional 1-TB hard drive.
Our comparison devices all have very similar configurations. The question is which model can make the best use of its components' possibilities and offers the best overall performance? We have also included the previous Omen model in our comparison, to underline the increased performance. The following table lists the most important technical specifications of all comparison devices.
| HP Omen 15t (2016) | Acer Aspire VX5 | Dell Inspiron 15 | Lenovo Legion Y520 | Asus FX502VM | |
| CPU | Intel Core i7-6700HQ | Intel Core i7-7700HQ | Intel Core i7-7700HQ | Intel Core i7-7700HQ | Intel Core i7-7700HQ |
| GPU | Nvidia GeForce GTX 965M | Nvidia GeForce GTX 1050 Ti | Nvidia GeForce GTX 1050 Ti | Nvidia GeForce GTX 1050 Ti | Nvidia GeForce GTX 1060 |
| Panel | 15.6 inch 1920 x 1080 | 15.6 inch 1920 x 1080 | 15.6 inch 1920 x 1080 | 15.6 inch 1920 x 1080 | 15.6 inch 1920 x 1080 |
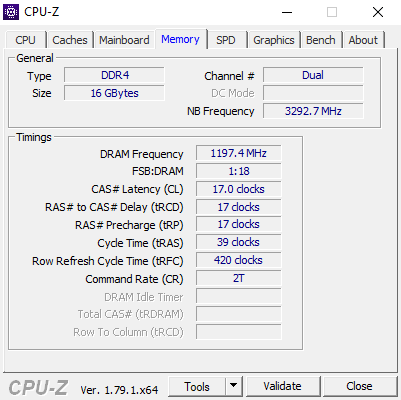
| RAM | 16 GB DDR4-2131 | 8 GB DDR4-2400 | 16 GB DDR4-2400 | 16 GB DDR4-2400 | 16 GB DDR4-2400 |
| SSD | 128 GB SSD + 2 TB HDD | 1 TB HDD | 256 GB SSD + 1 TB HDD | 256 GB SSD | 256 GB SSD + 1 TB HDD |
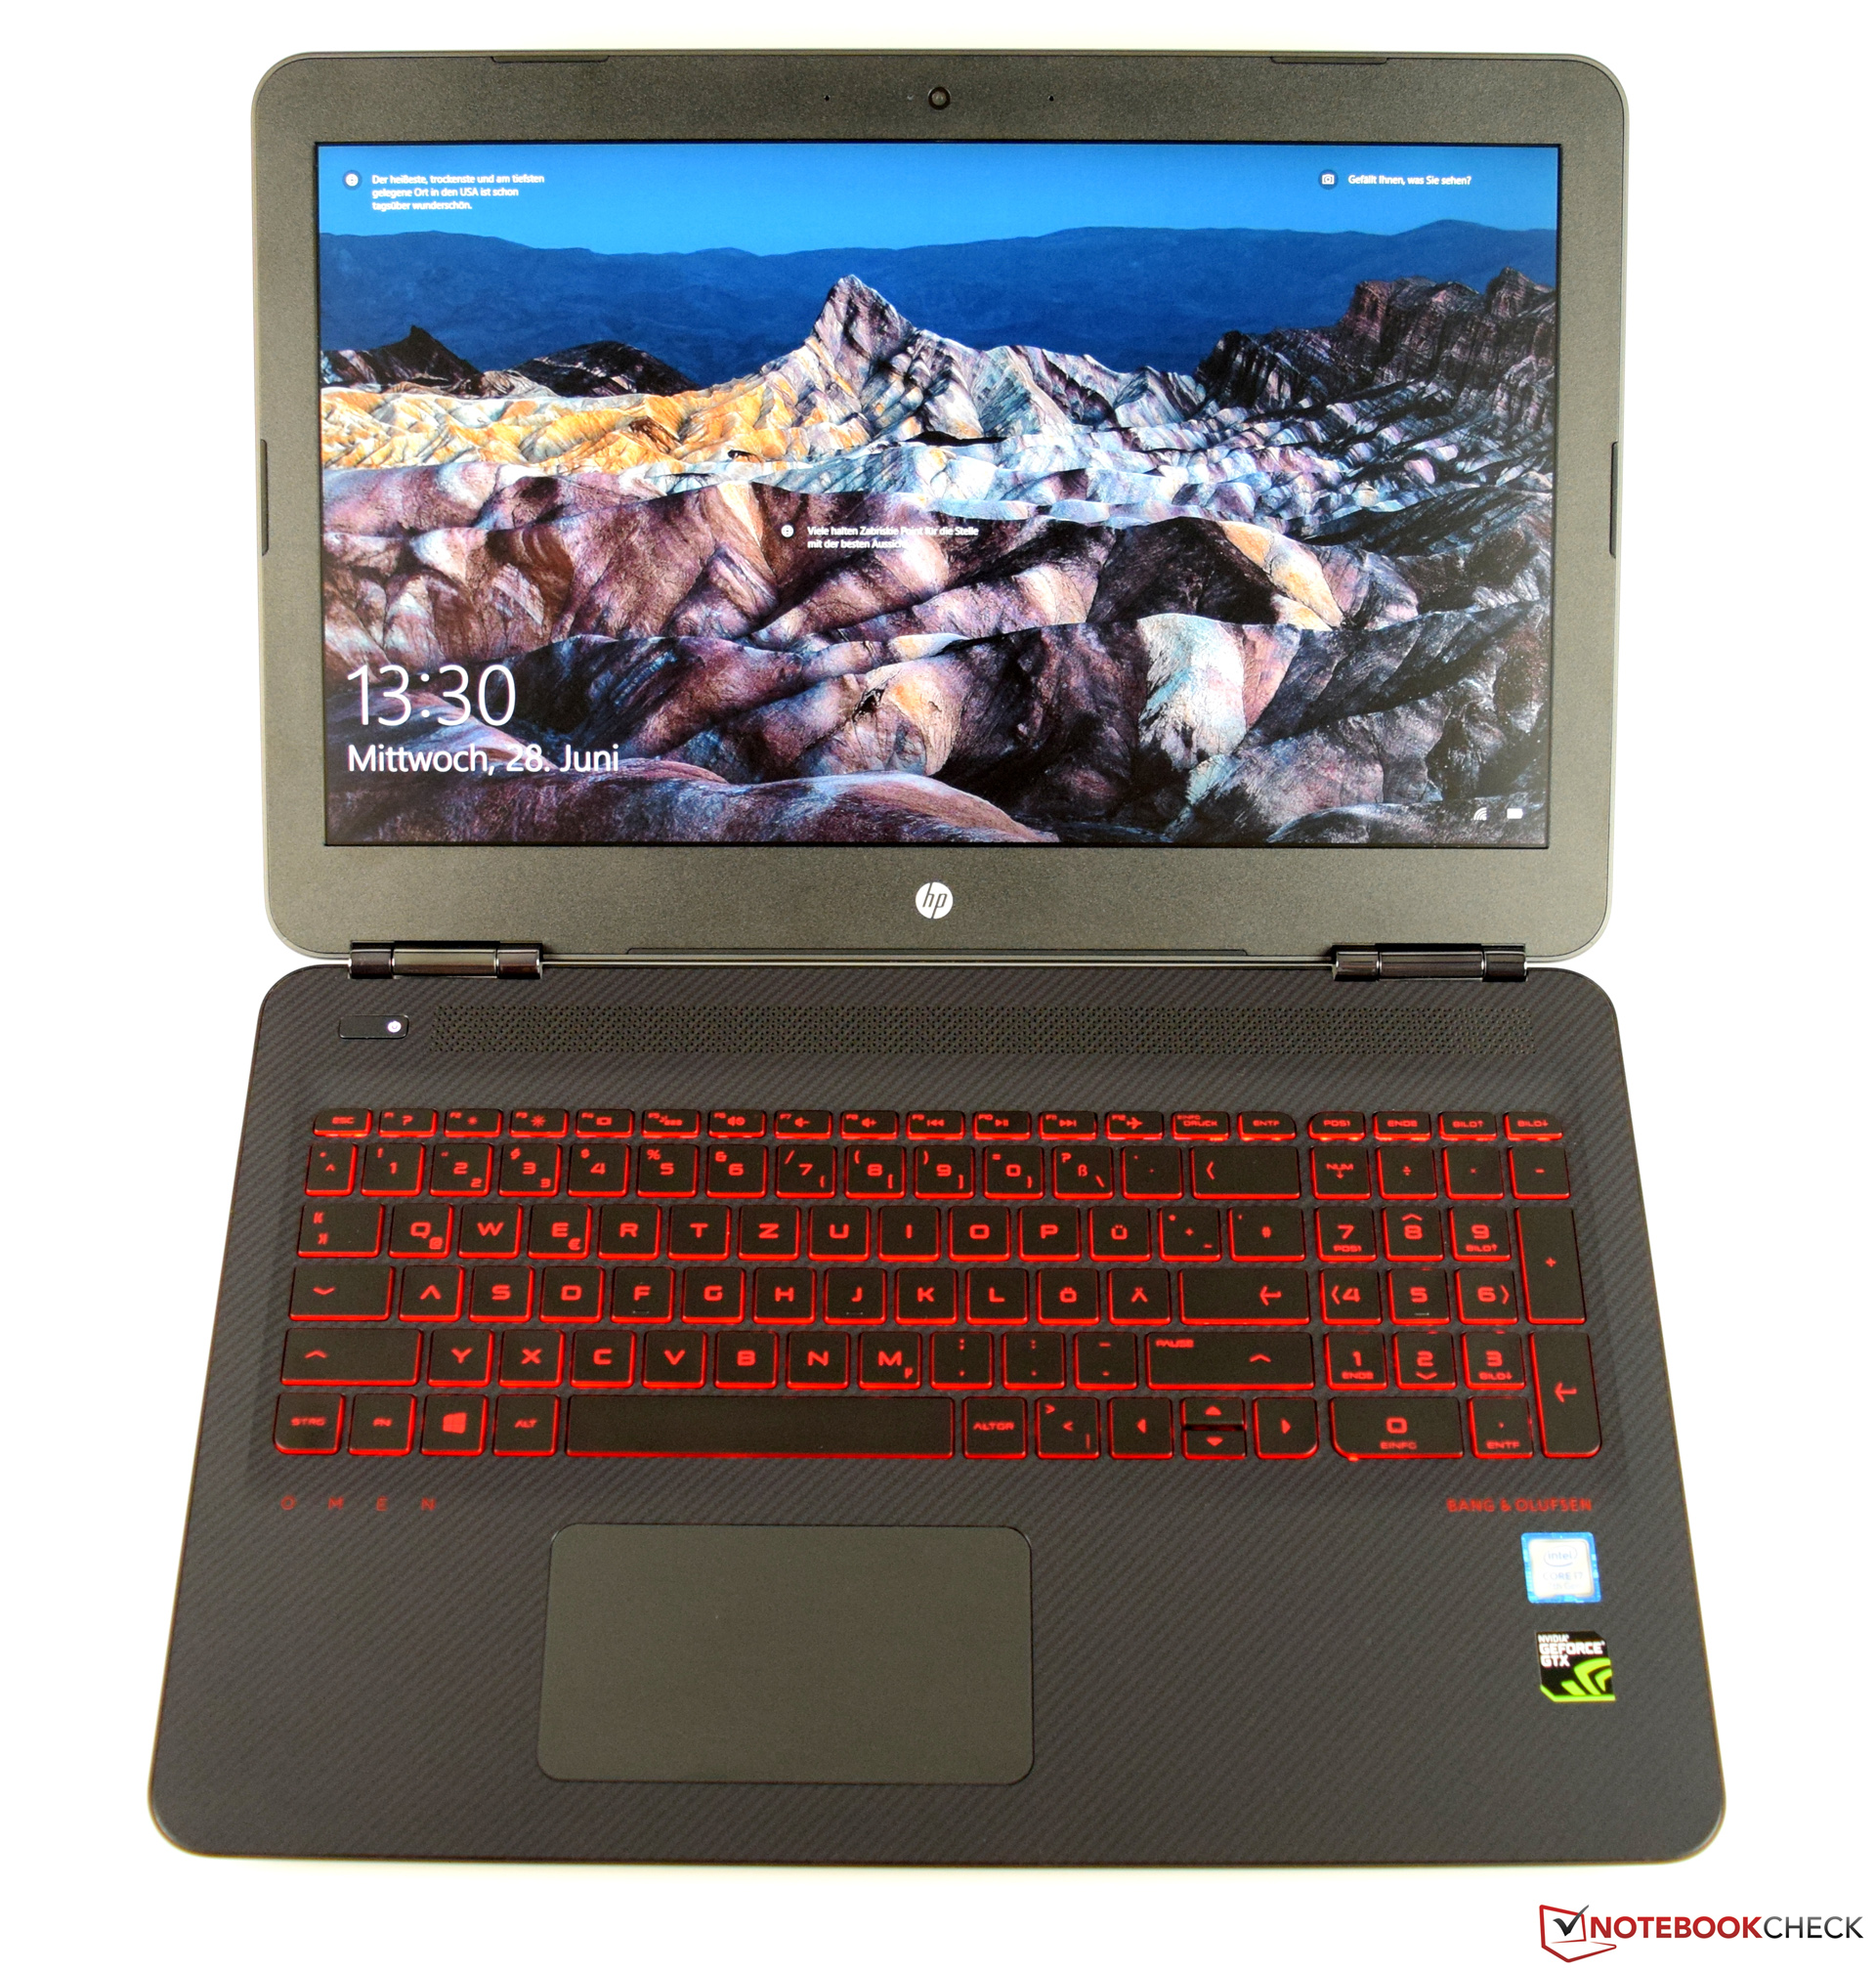
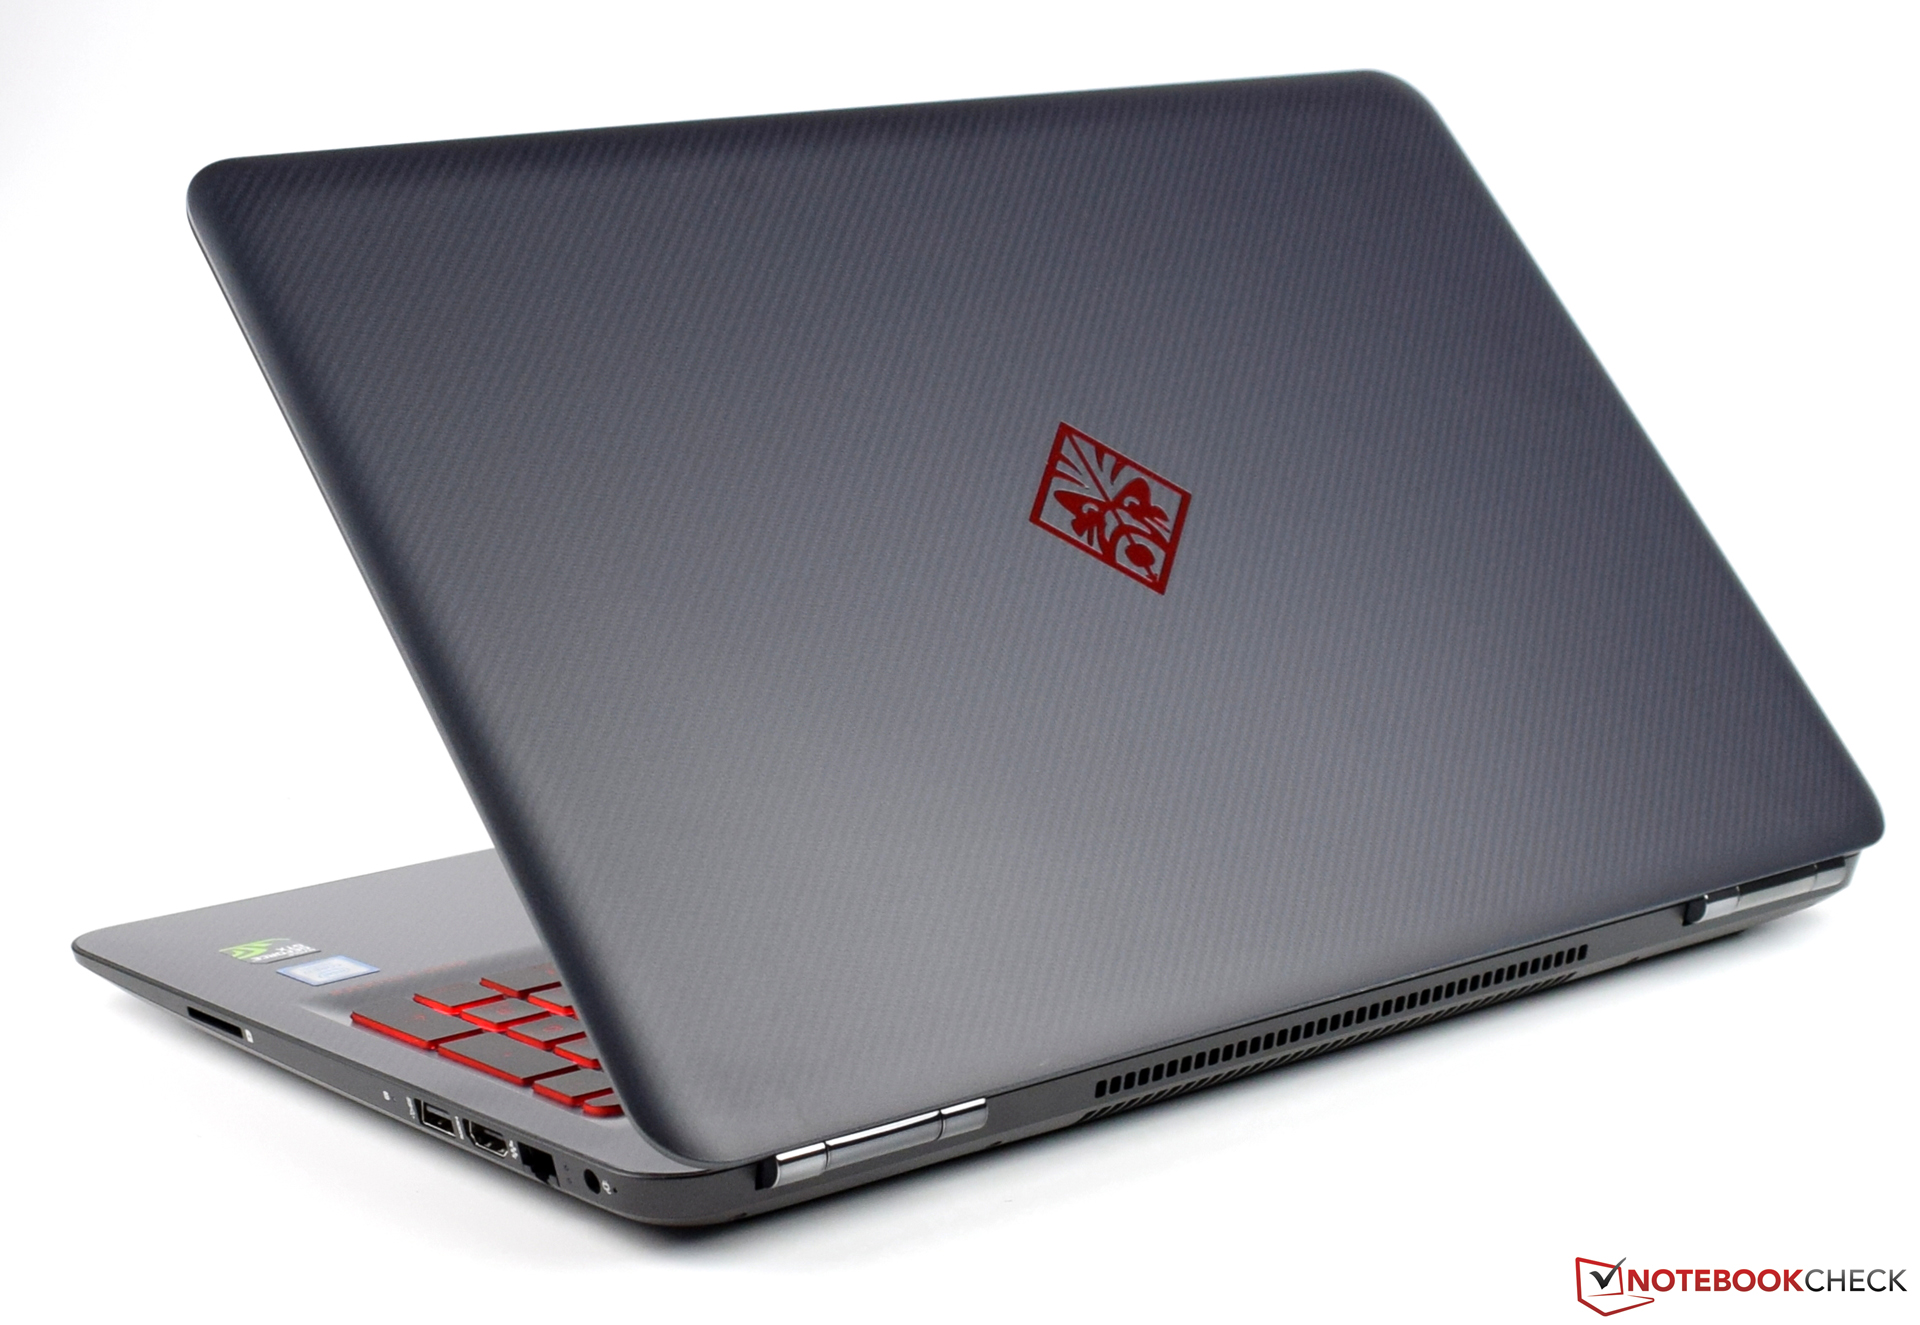
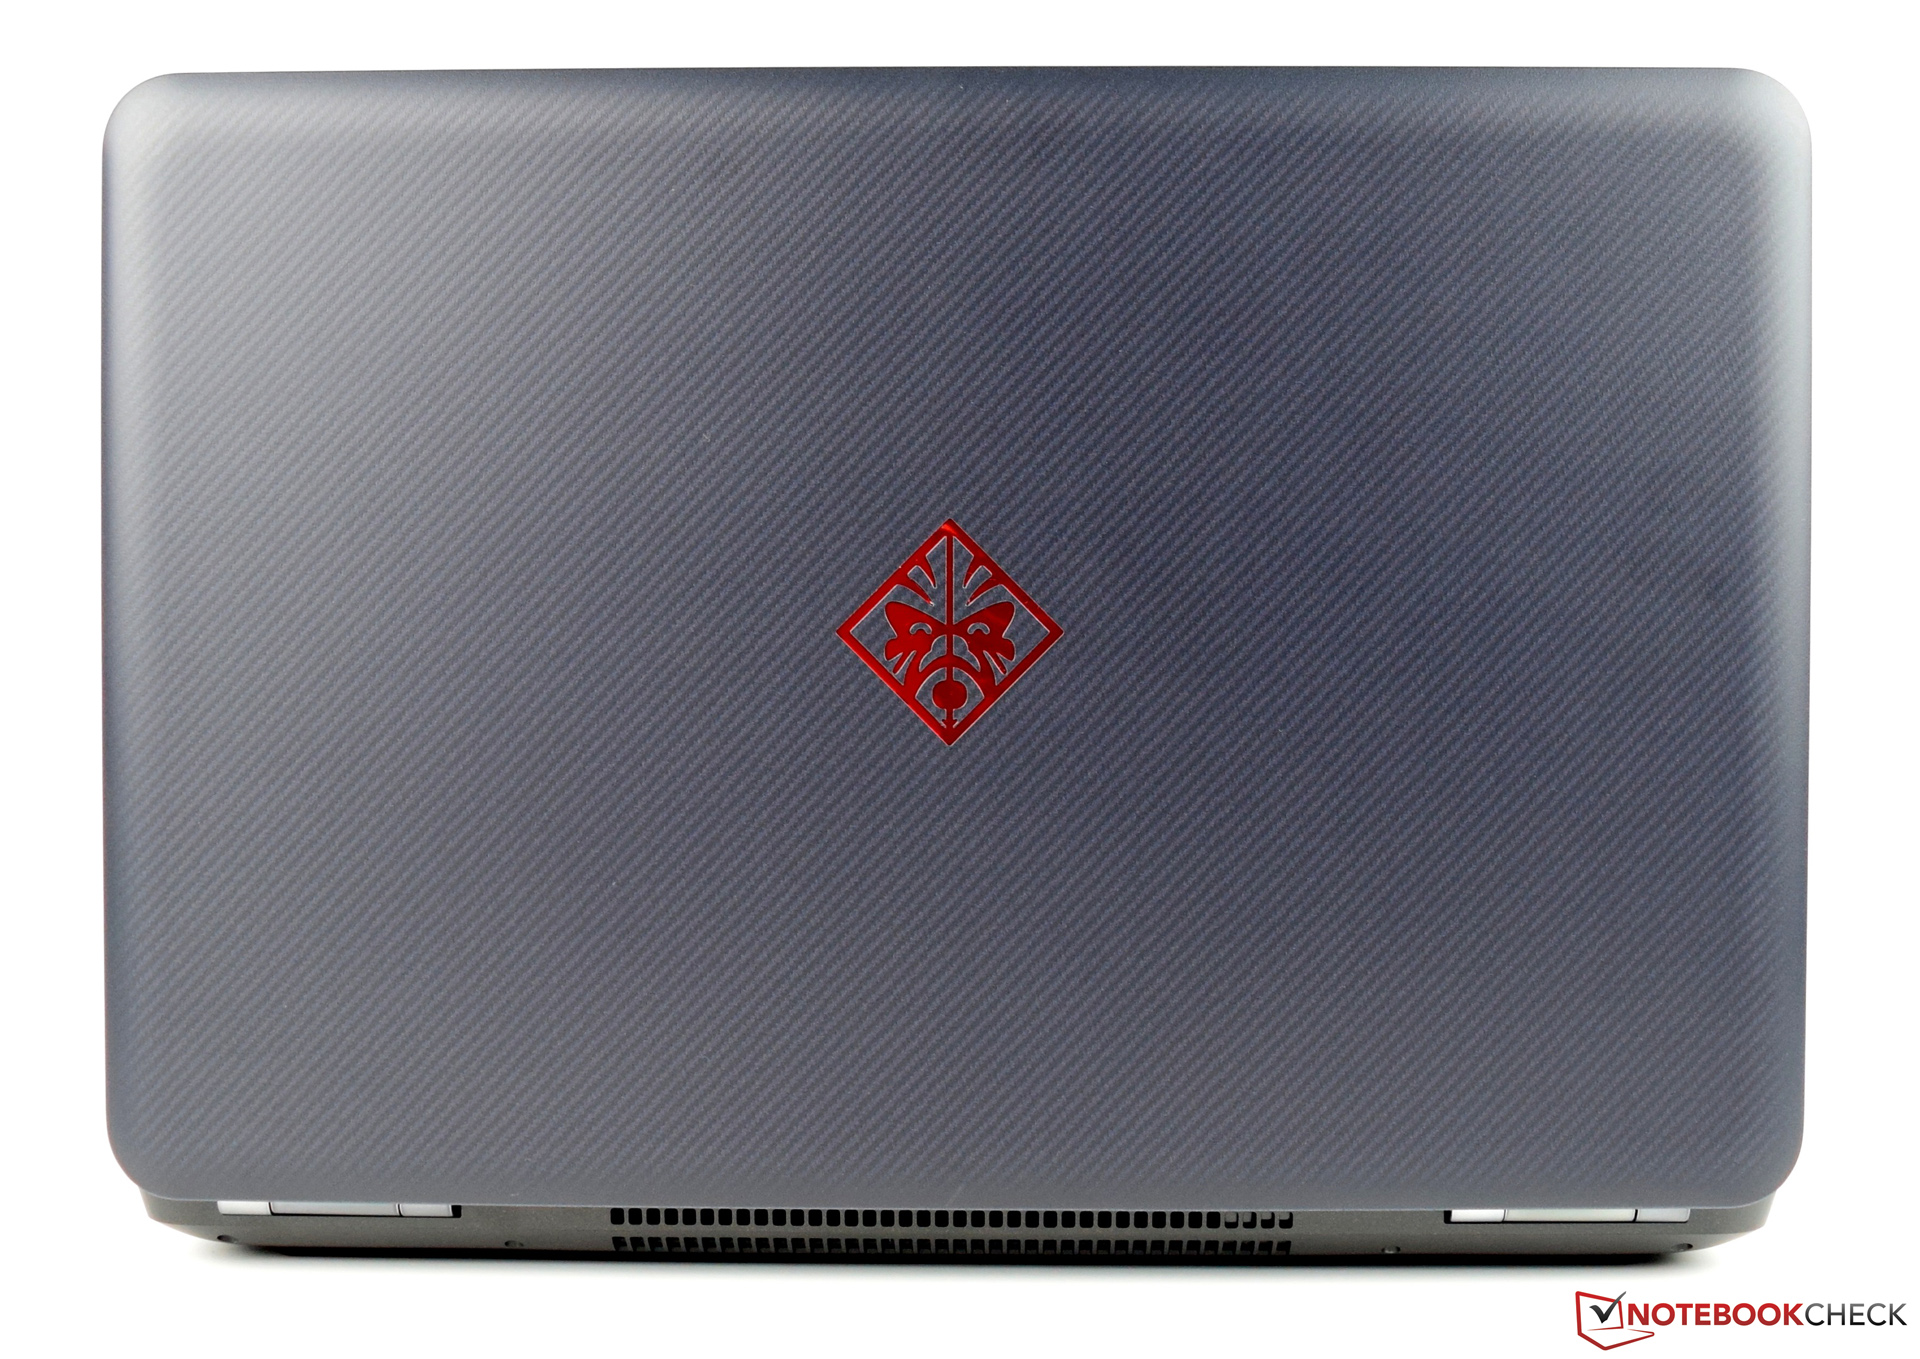
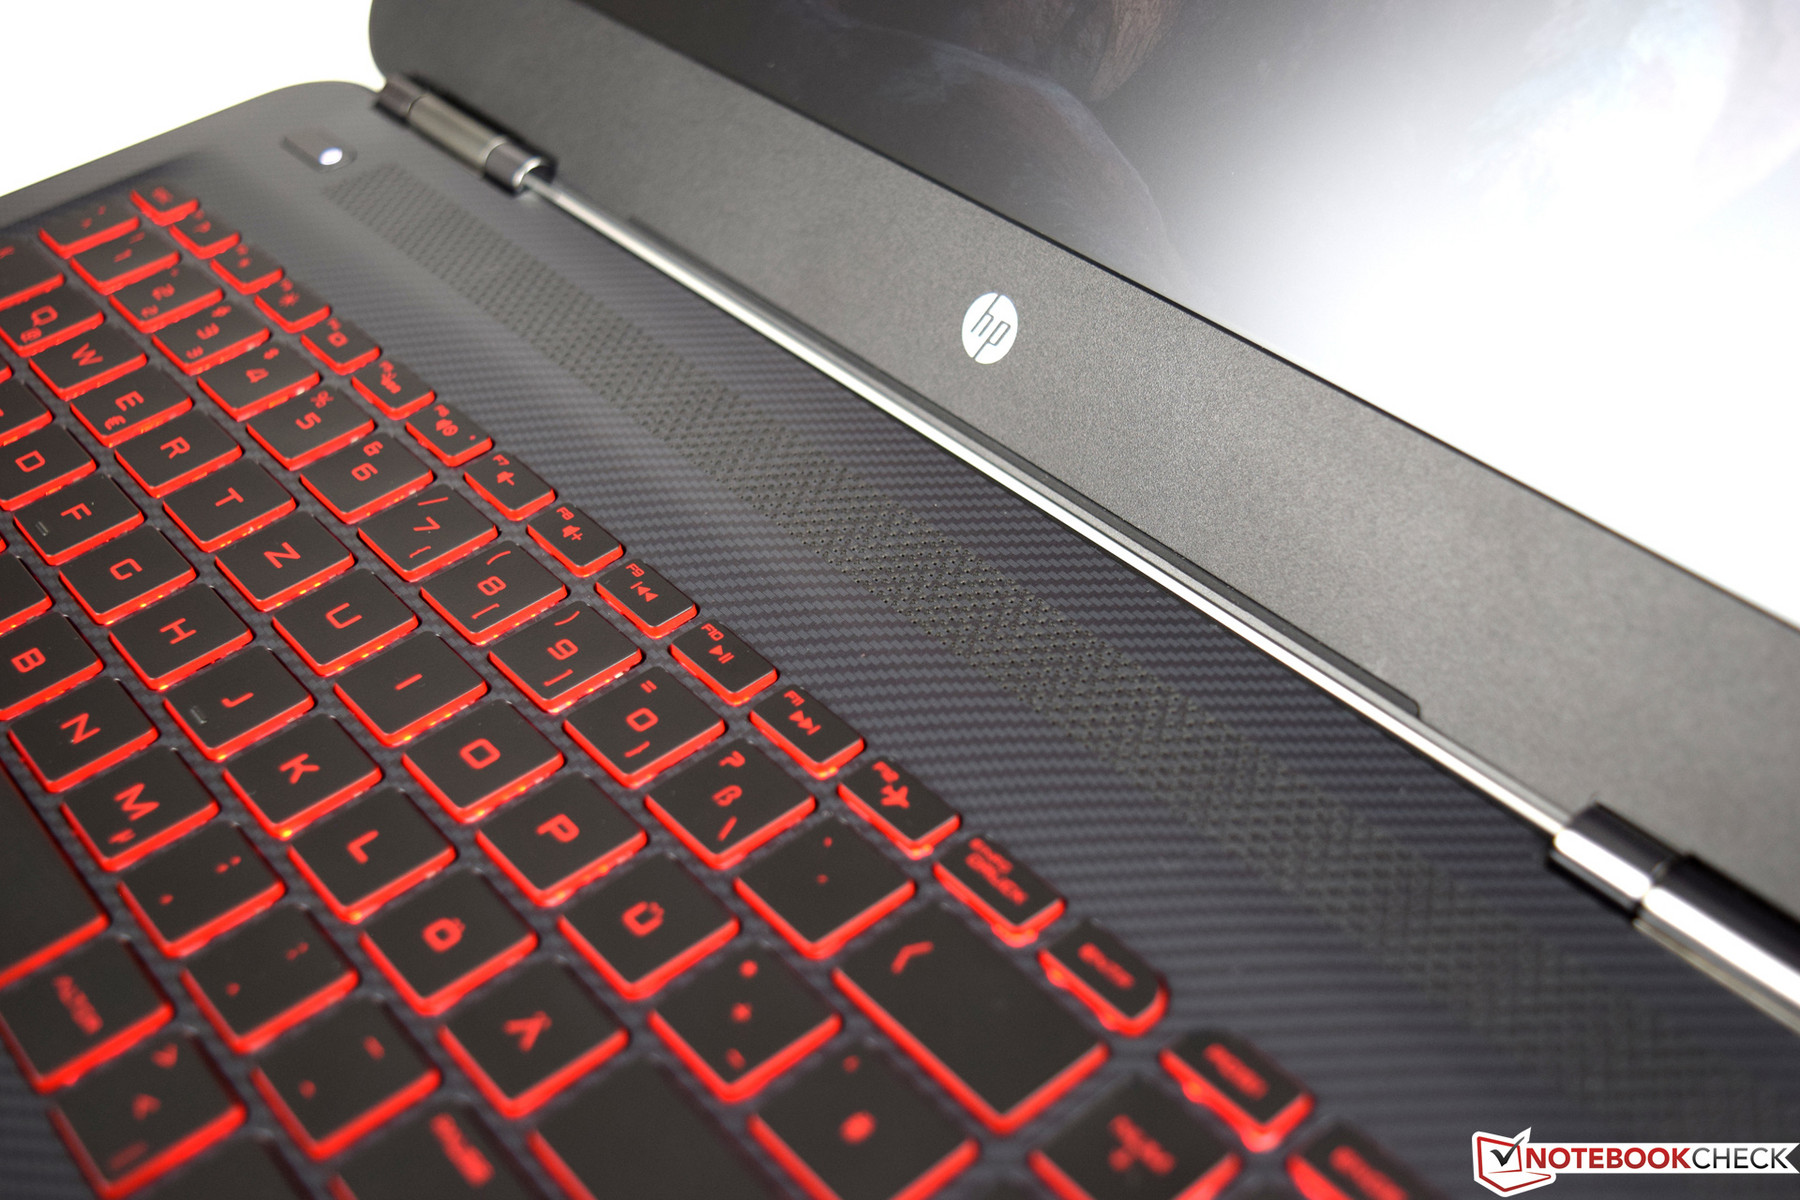
Case
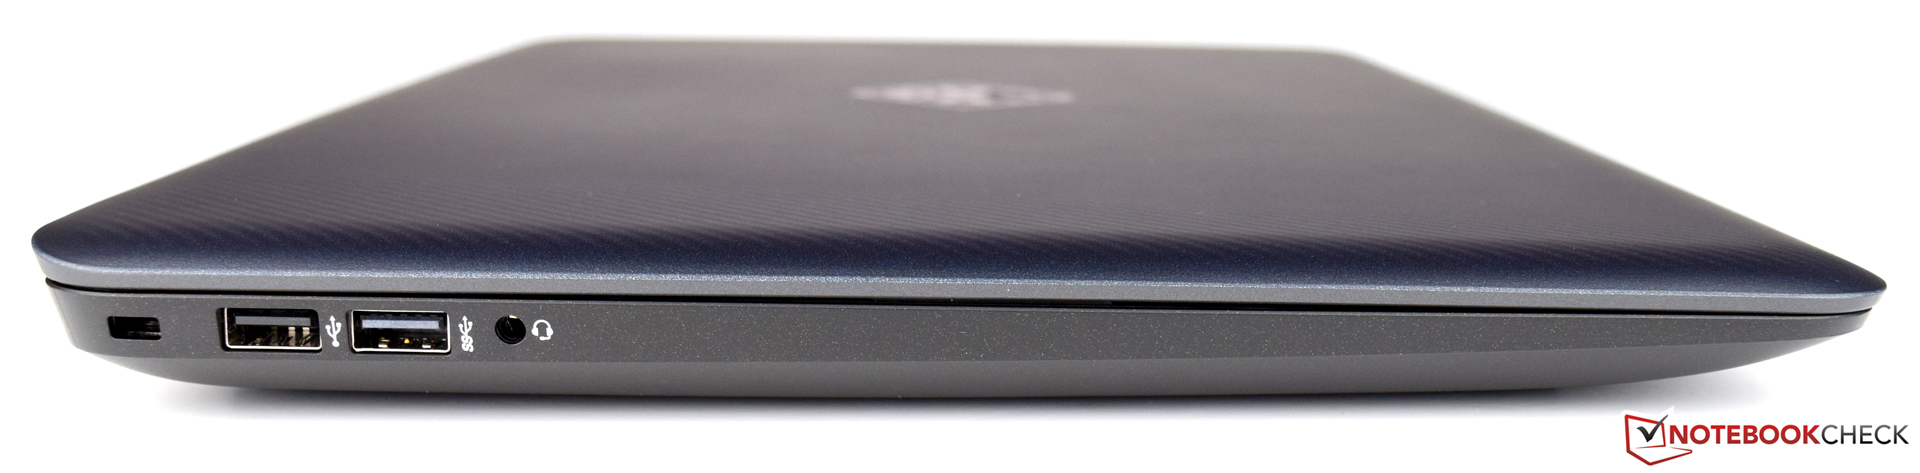
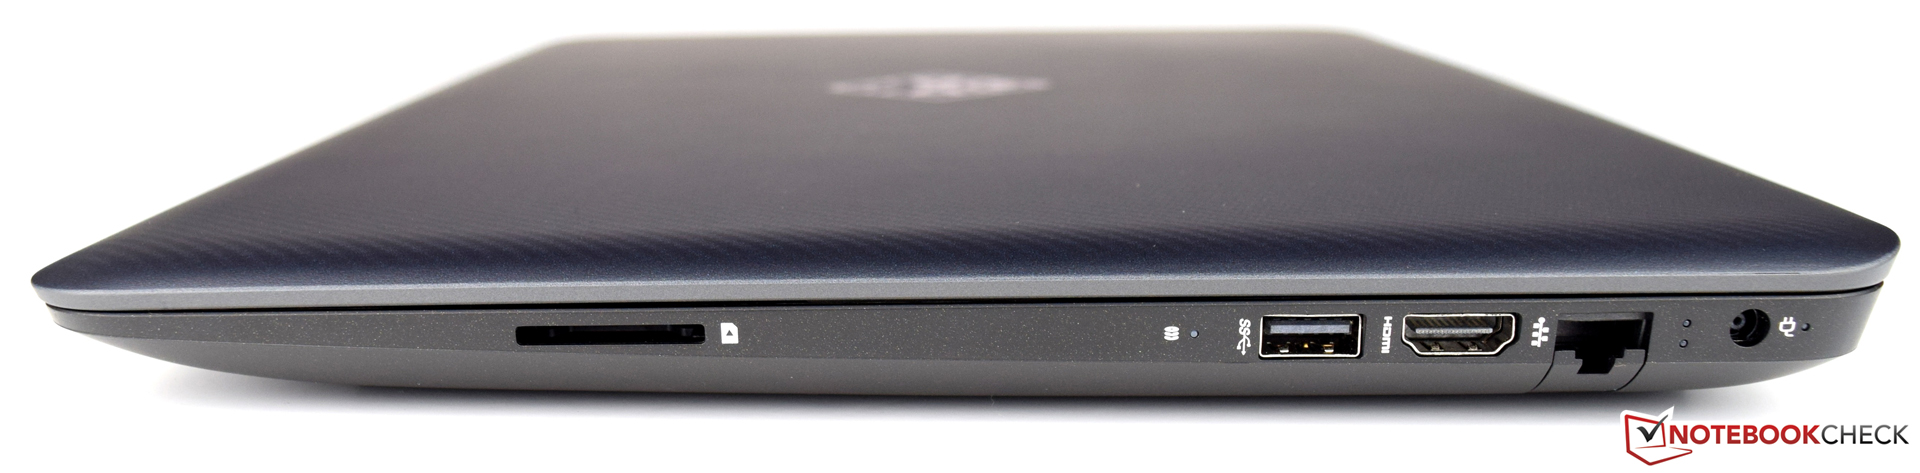
The case, connectivity and input devices of the HP Omen 15t (2017) are identical to those of its predecessor. Please take a look at the review of the HP Omen 15t (2016) for more information.

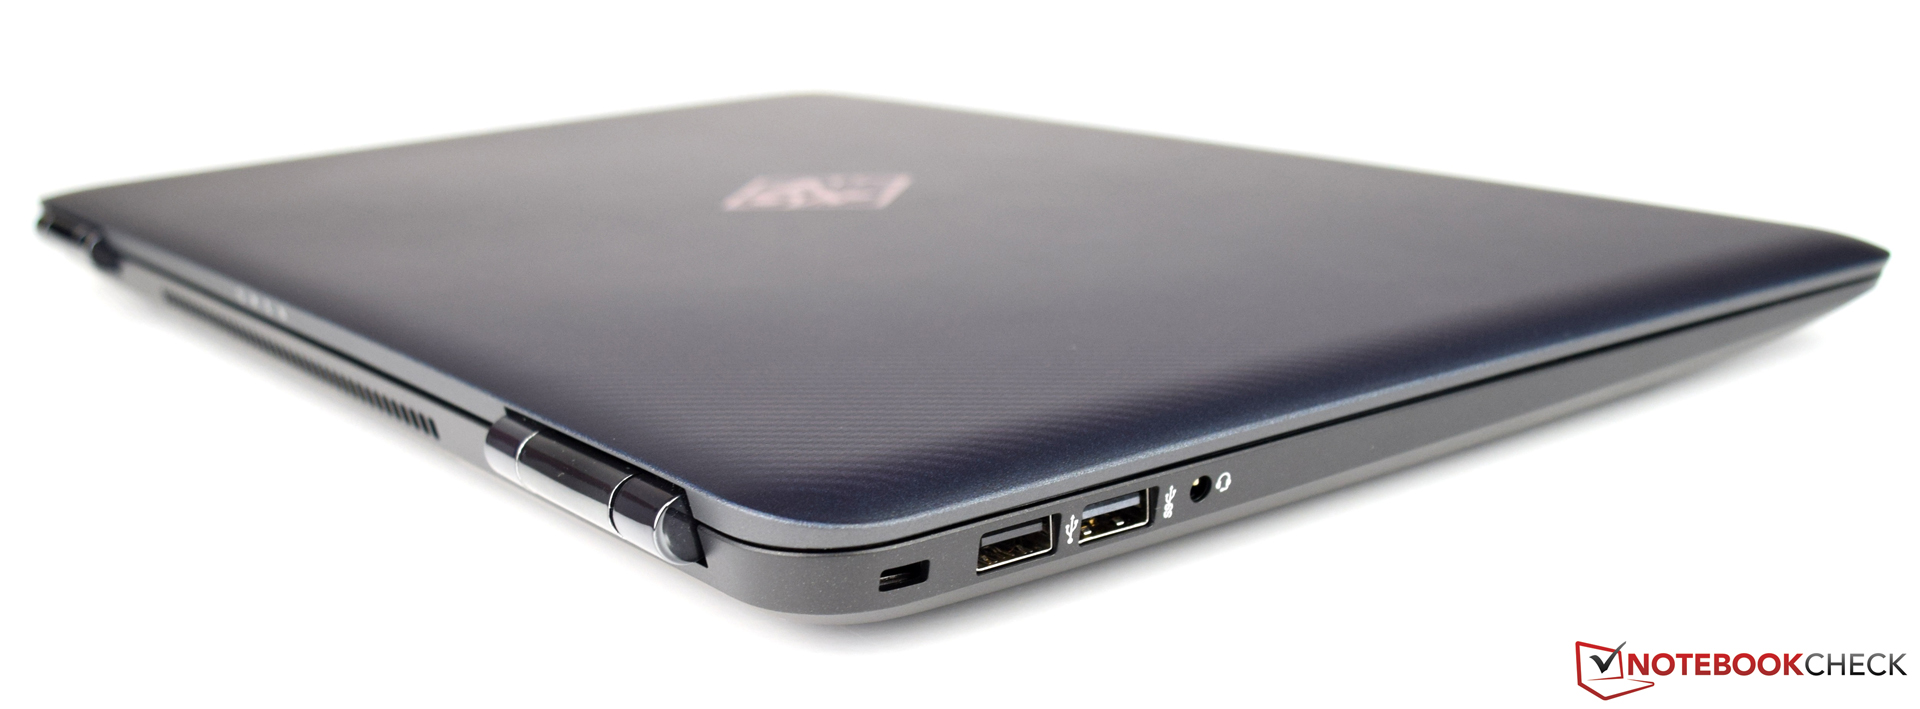
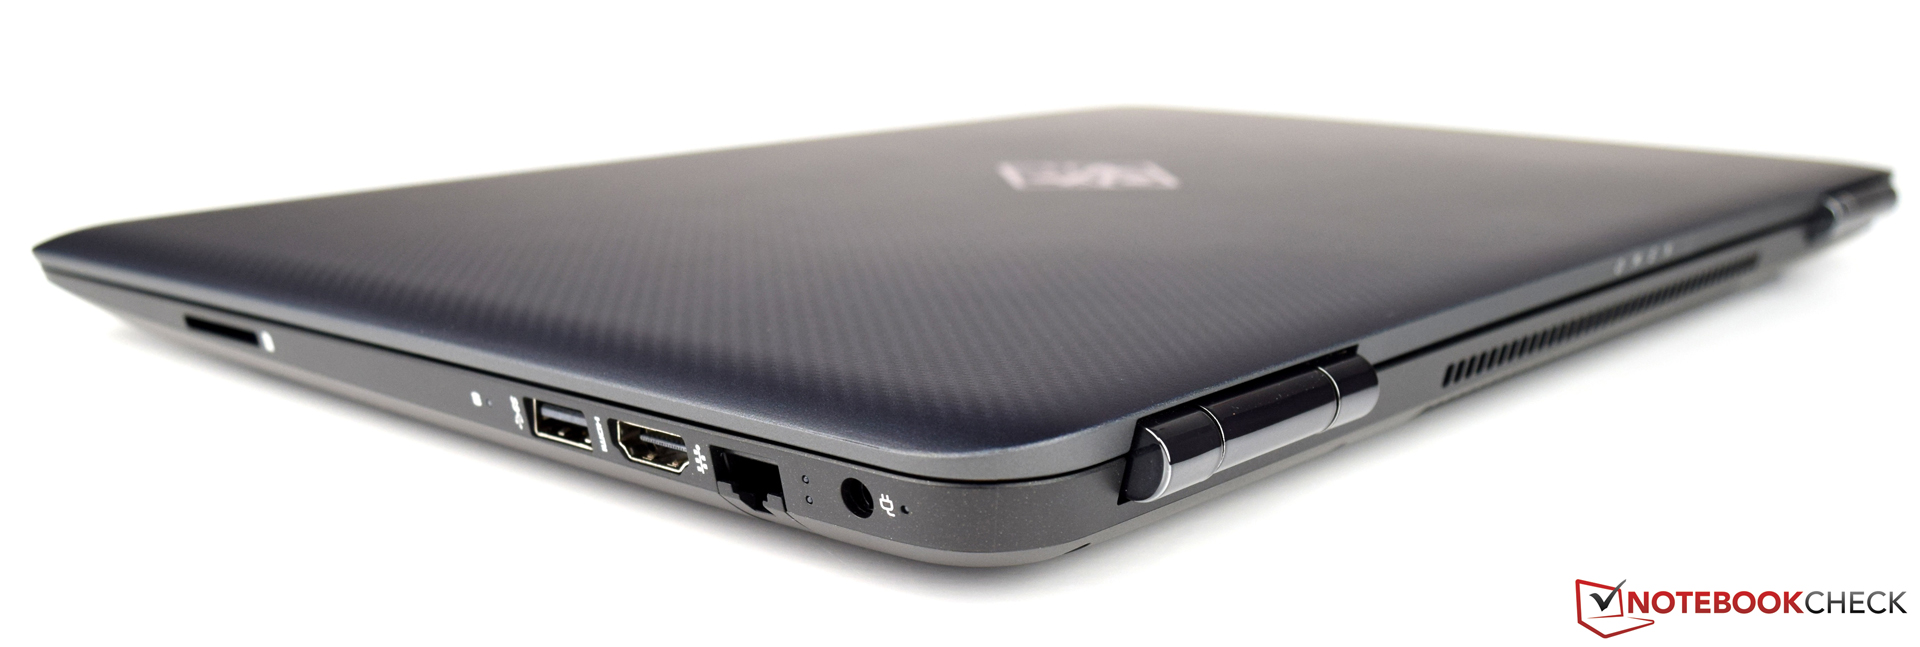

Connectivity
| SD Card Reader | |
| average JPG Copy Test (av. of 3 runs) | |
| Asus FX502VM-AS73 | |
| HP Omen 15-ax007ng | |
| HP Omen 15-ax213ng | |
| Lenovo Legion Y520-15IKBN-80WK001KUS | |
| Acer Aspire VX5-591G-75C4 VX15 | |
| Dell Inspiron 15 7000 7567 | |
| maximum AS SSD Seq Read Test (1GB) | |
| Lenovo Legion Y520-15IKBN-80WK001KUS | |
| HP Omen 15-ax213ng | |
| Asus FX502VM-AS73 | |
| HP Omen 15-ax007ng | |
| Acer Aspire VX5-591G-75C4 VX15 | |
| Dell Inspiron 15 7000 7567 | |
| Networking | |
| iperf3 transmit AX12 | |
| Acer Aspire VX5-591G-75C4 VX15 | |
| HP Omen 15-ax213ng | |
| Asus FX502VM-AS73 | |
| Dell Inspiron 15 7000 7567 (jseb) | |
| Lenovo Legion Y520-15IKBN-80WK001KUS | |
| iperf3 receive AX12 | |
| HP Omen 15-ax213ng | |
| Asus FX502VM-AS73 | |
| Acer Aspire VX5-591G-75C4 VX15 | |
| Lenovo Legion Y520-15IKBN-80WK001KUS | |
| Dell Inspiron 15 7000 7567 (jseb) | |
Display

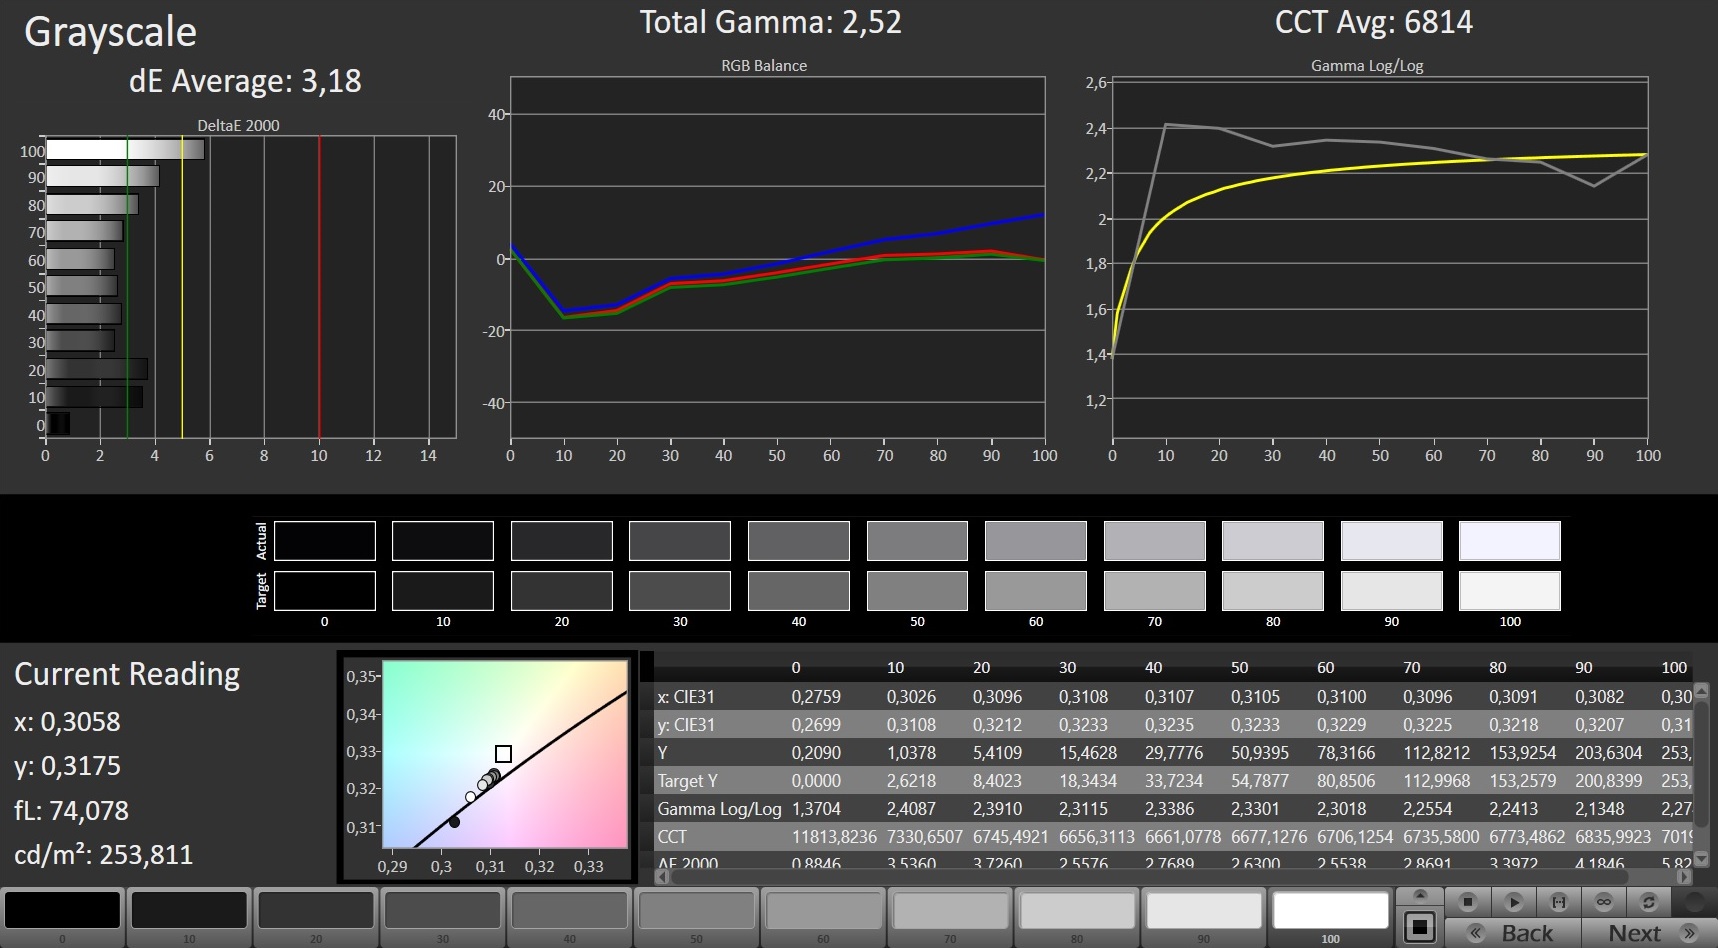
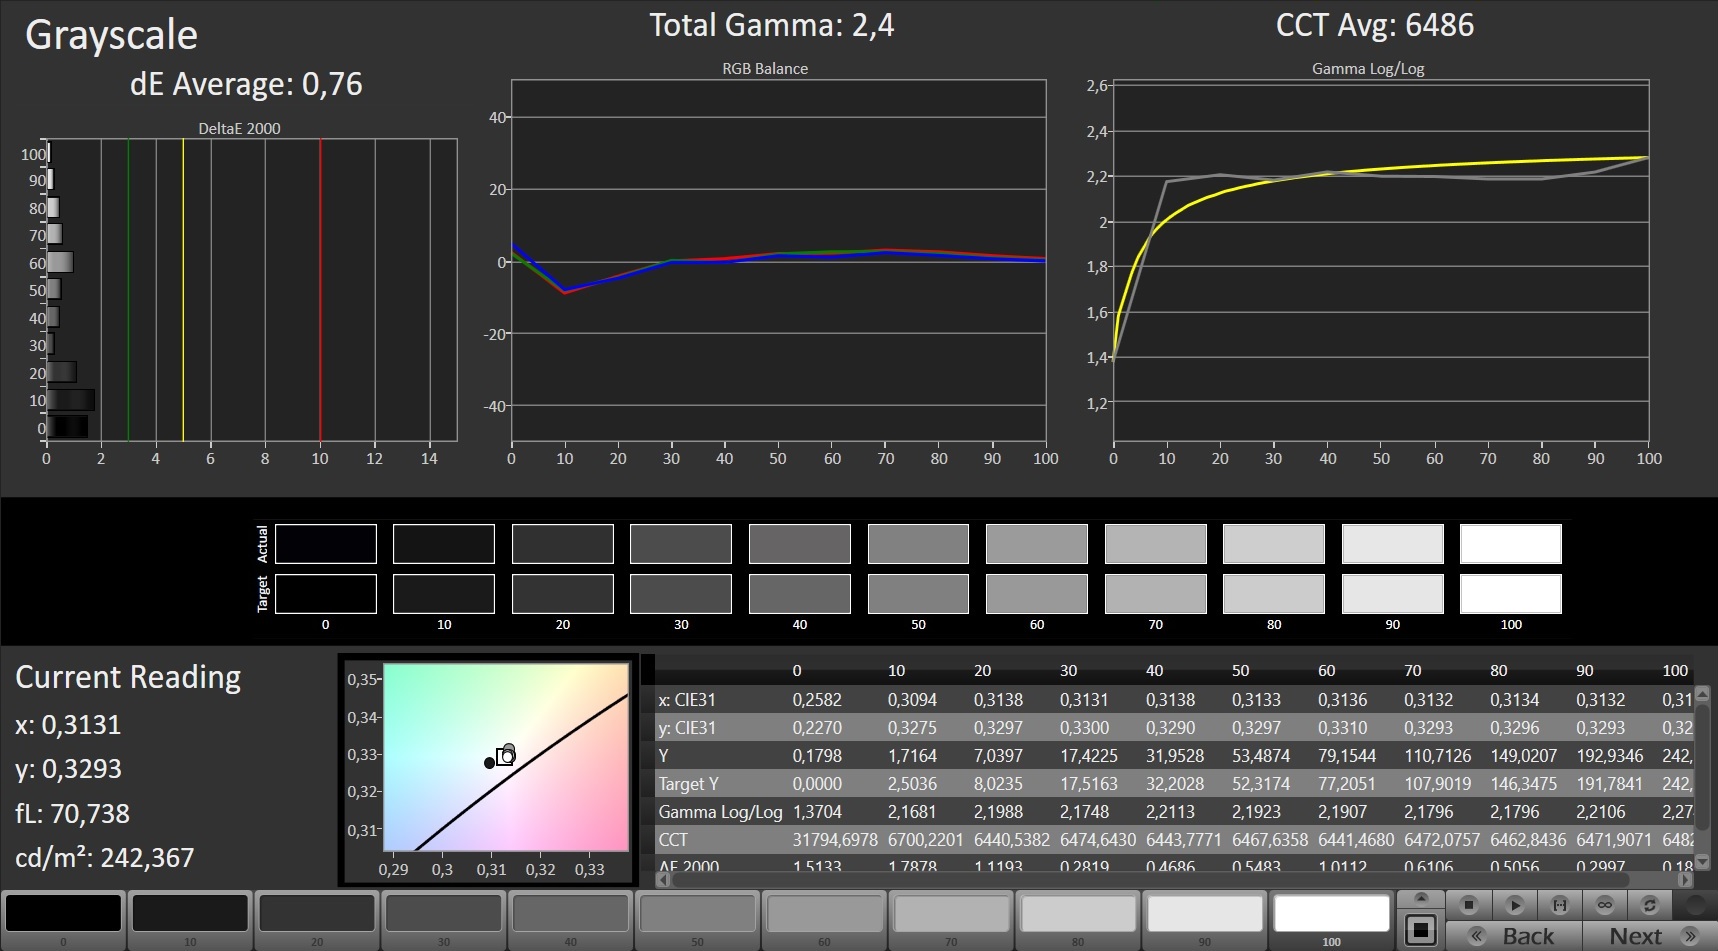
While the HP Omen 15t (2016) was equipped with an FHD panel from LG, HP has equipped our current test unit with a panel from AU Optronics. The 15.6-inch Full-HD IPS display is not particularly bright with a maximum of 228 cd/m². It also has only 88% brightness distribution. Still, HP was able to make quite a few improvements in comparison to the previous version. The black value (0.21) is the best of all comparison devices, and consequently contrast is good too at 1095:1. The screen has some minor problems with screen clouding which is visible at the sides of the screen when displaying dark content. The HP Omen 15t (2017) with the AU Optronics panel does not use PWM to regulate the screen brightness.
| |||||||||||||||||||||||||
Brightness Distribution: 88 %
Center on Battery: 230 cd/m²
Contrast: 1095:1 (Black: 0.21 cd/m²)
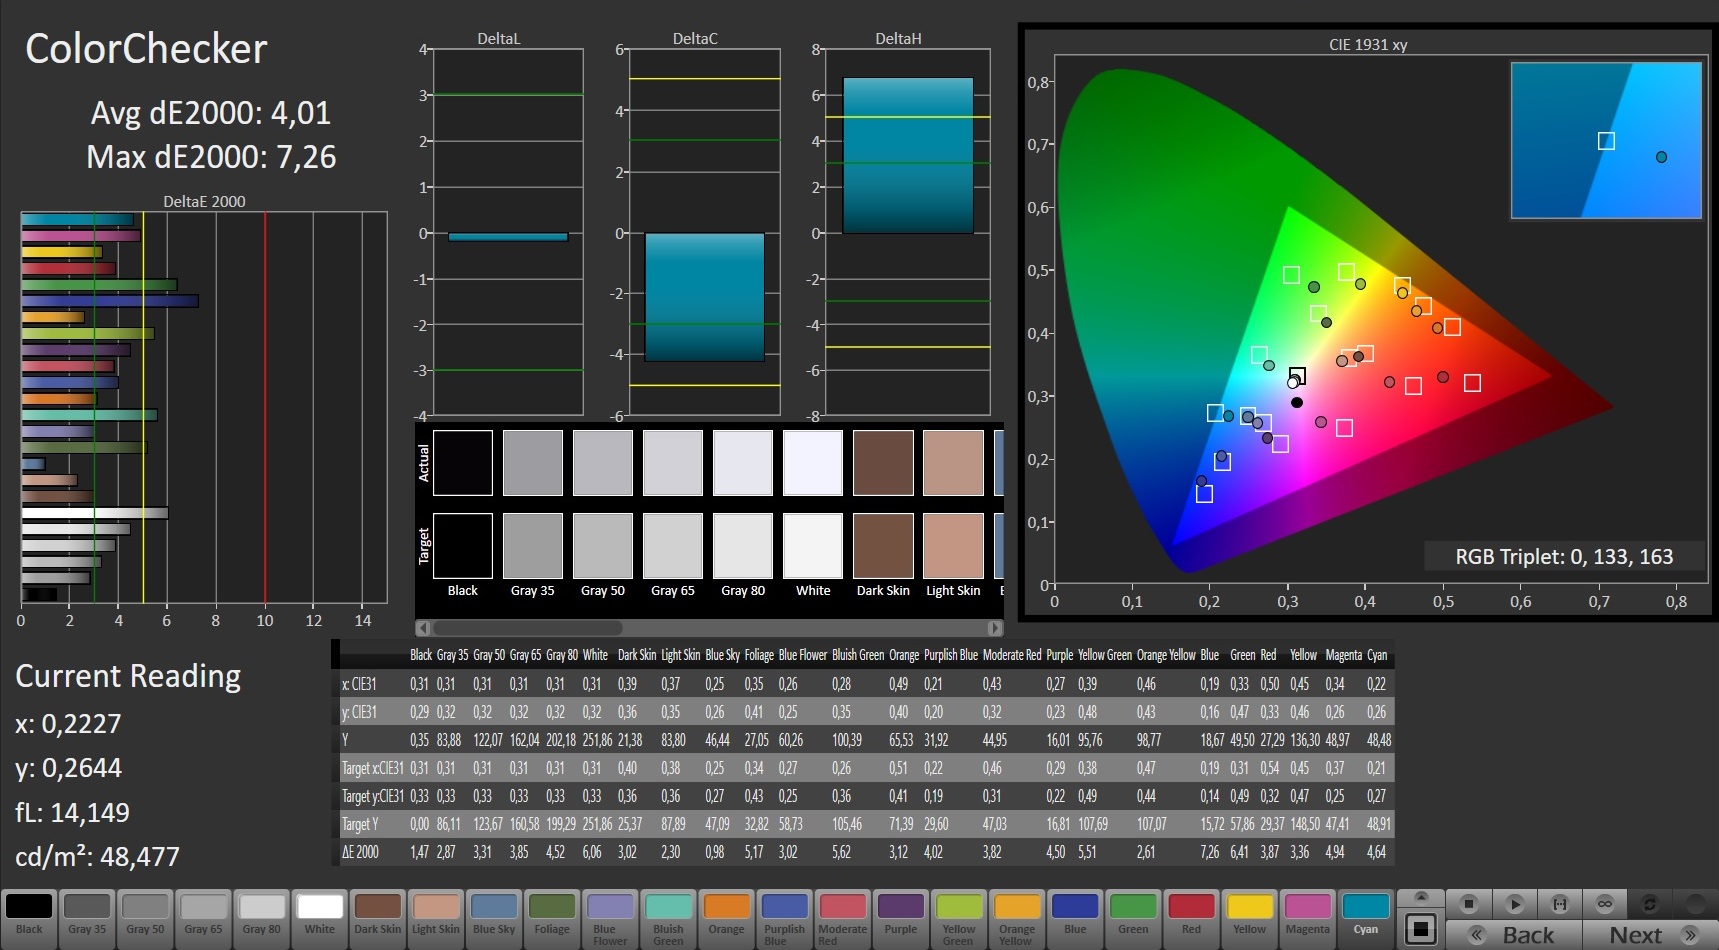
ΔE ColorChecker Calman: 4.01 | ∀{0.5-29.43 Ø4.71}
ΔE Greyscale Calman: 3.18 | ∀{0.09-98 Ø4.96}
58% sRGB (Argyll 1.6.3 3D)
37% AdobeRGB 1998 (Argyll 1.6.3 3D)
39.87% AdobeRGB 1998 (Argyll 3D)
58% sRGB (Argyll 3D)
38.59% Display P3 (Argyll 3D)
Gamma: 2.52
CCT: 6814 K
| HP Omen 15-ax213ng AU Optronics AUO41ED, 1920x1080, 15.6" | HP Omen 15-ax007ng LGD0519, 1920x1080, 15.6" | Acer Aspire VX5-591G-75C4 VX15 LG Philips LGD0550 / LP156WF6-SPK4, 1920x1080, 15.6" | Dell Inspiron 15 7000 7567 AU Optronics AUO38ED B156HTN 28H80, 1920x1080, 15.6" | Lenovo Legion Y520-15IKBN-80WK001KUS LP156WF6-SPK3, 1920x1080, 15.6" | Asus FX502VM-AS73 1920x1080, 15.6" | |
|---|---|---|---|---|---|---|
| Display | 29% | 1% | -6% | -1% | ||
| Display P3 Coverage (%) | 38.59 | 59.9 55% 40.34 5% | 38.88 1% | 36.42 -6% | 38.28 -1% | |
| sRGB Coverage (%) | 58 | 85.9 48% 60.3 4% | 58.2 0% | 54.9 -5% | 56.9 -2% | |
| AdobeRGB 1998 Coverage (%) | 39.87 | 61.6 55% 41.73 5% | 40.2 1% | 37.62 -6% | 39.47 -1% | |
| Response Times | -21% | 33% | -8% | -35% | 26% | |
| Response Time Grey 50% / Grey 80% * (ms) | 42 ? | 55 ? -31% | 22 ? 48% | 36 ? 14% | 58.8 ? -40% | 28.4 ? 32% |
| Response Time Black / White * (ms) | 28 ? | 31 ? -11% | 23 ? 18% | 36 ? -29% | 36 ? -29% | 22.4 ? 20% |
| PWM Frequency (Hz) | 21550 ? | |||||
| Screen | -29% | -14% | -84% | -48% | -46% | |
| Brightness middle (cd/m²) | 230 | 214 -7% | 281 22% | 246 7% | 239 4% | 209.5 -9% |
| Brightness (cd/m²) | 228 | 203 -11% | 257 13% | 235 3% | 244 7% | 205 -10% |
| Brightness Distribution (%) | 88 | 79 -10% | 85 -3% | 75 -15% | 88 0% | 92 5% |
| Black Level * (cd/m²) | 0.21 | 0.28 -33% | 0.32 -52% | 0.55 -162% | 0.35 -67% | 0.69 -229% |
| Contrast (:1) | 1095 | 764 -30% | 878 -20% | 447 -59% | 683 -38% | 304 -72% |
| Colorchecker dE 2000 * | 4.01 | 6.04 -51% | 5.16 -29% | 10.97 -174% | 7.3 -82% | 4.7 -17% |
| Colorchecker dE 2000 max. * | 7.26 | 12 -65% | 9.09 -25% | 24.7 -240% | 19.7 -171% | |
| Greyscale dE 2000 * | 3.18 | 5.91 -86% | 4.57 -44% | 14.25 -348% | 4.9 -54% | 1.8 43% |
| Gamma | 2.52 87% | 2.44 90% | 2.59 85% | 1.83 120% | 2.19 100% | 2.23 99% |
| CCT | 6814 95% | 7362 88% | 6931 94% | 11200 58% | 7332 89% | 6975 93% |
| Color Space (Percent of AdobeRGB 1998) (%) | 37 | 38 3% | 37 0% | 35 -5% | 35 -5% | 36.2 -2% |
| Color Space (Percent of sRGB) (%) | 58 | 60 3% | 58 0% | 55 -5% | 55 -5% | 56.6 -2% |
| Total Average (Program / Settings) | -7% /
-9% | 7% /
-5% | -33% /
-56% | -42% /
-46% | -7% /
-28% |
* ... smaller is better

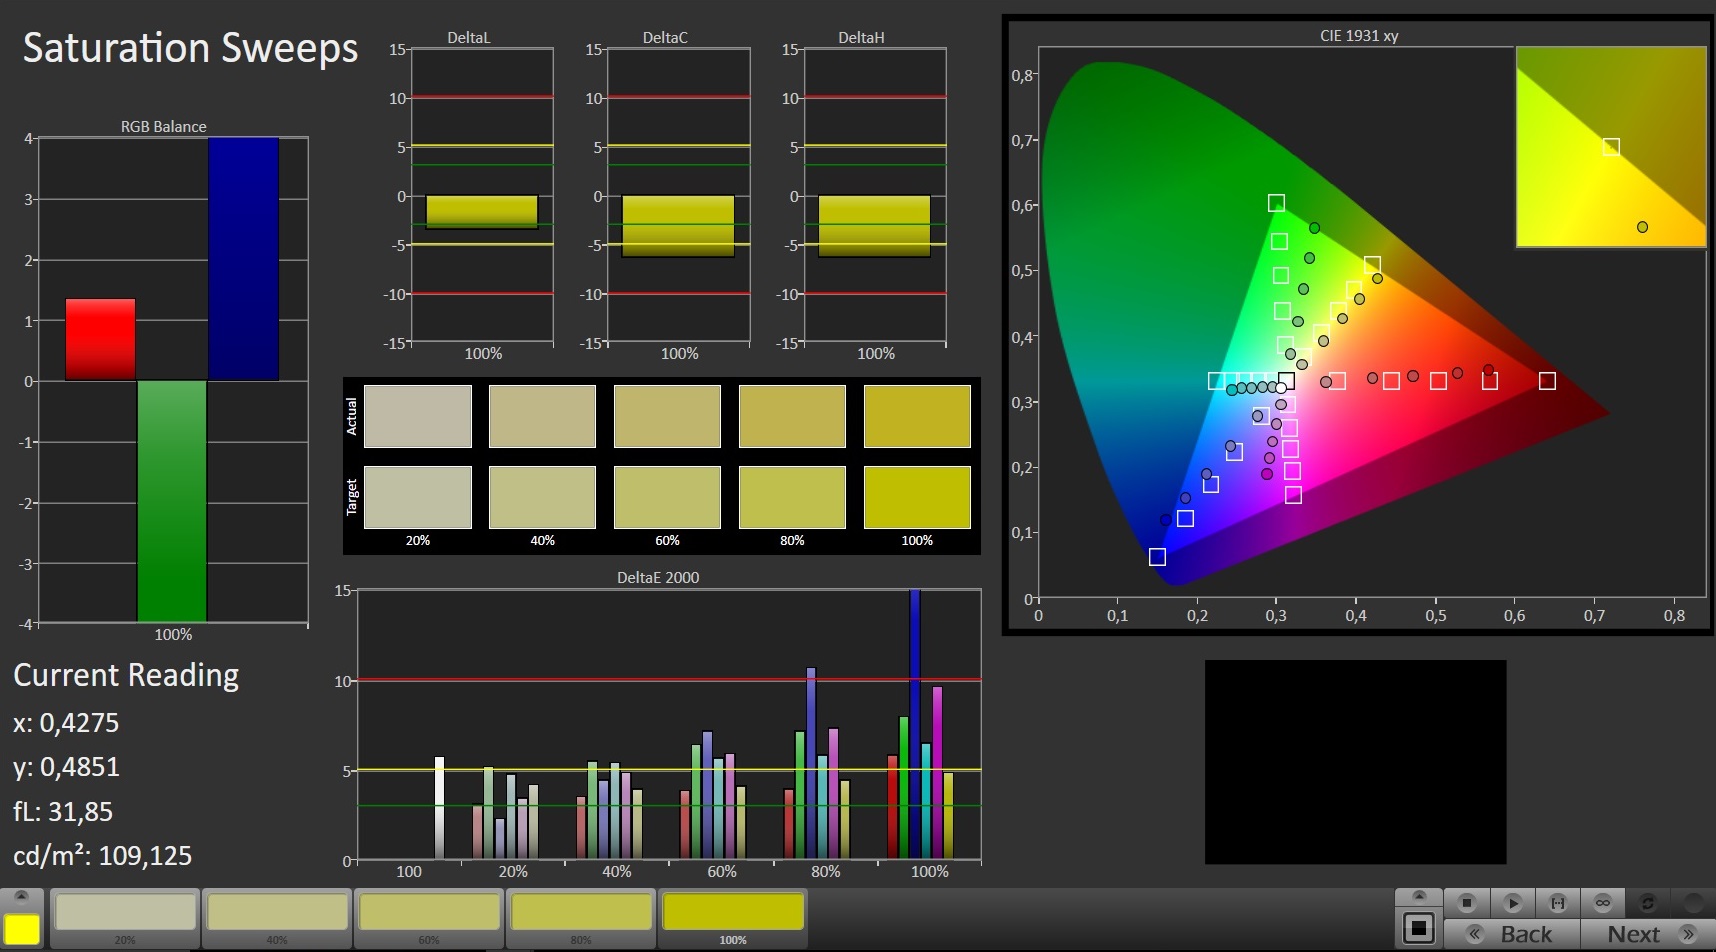
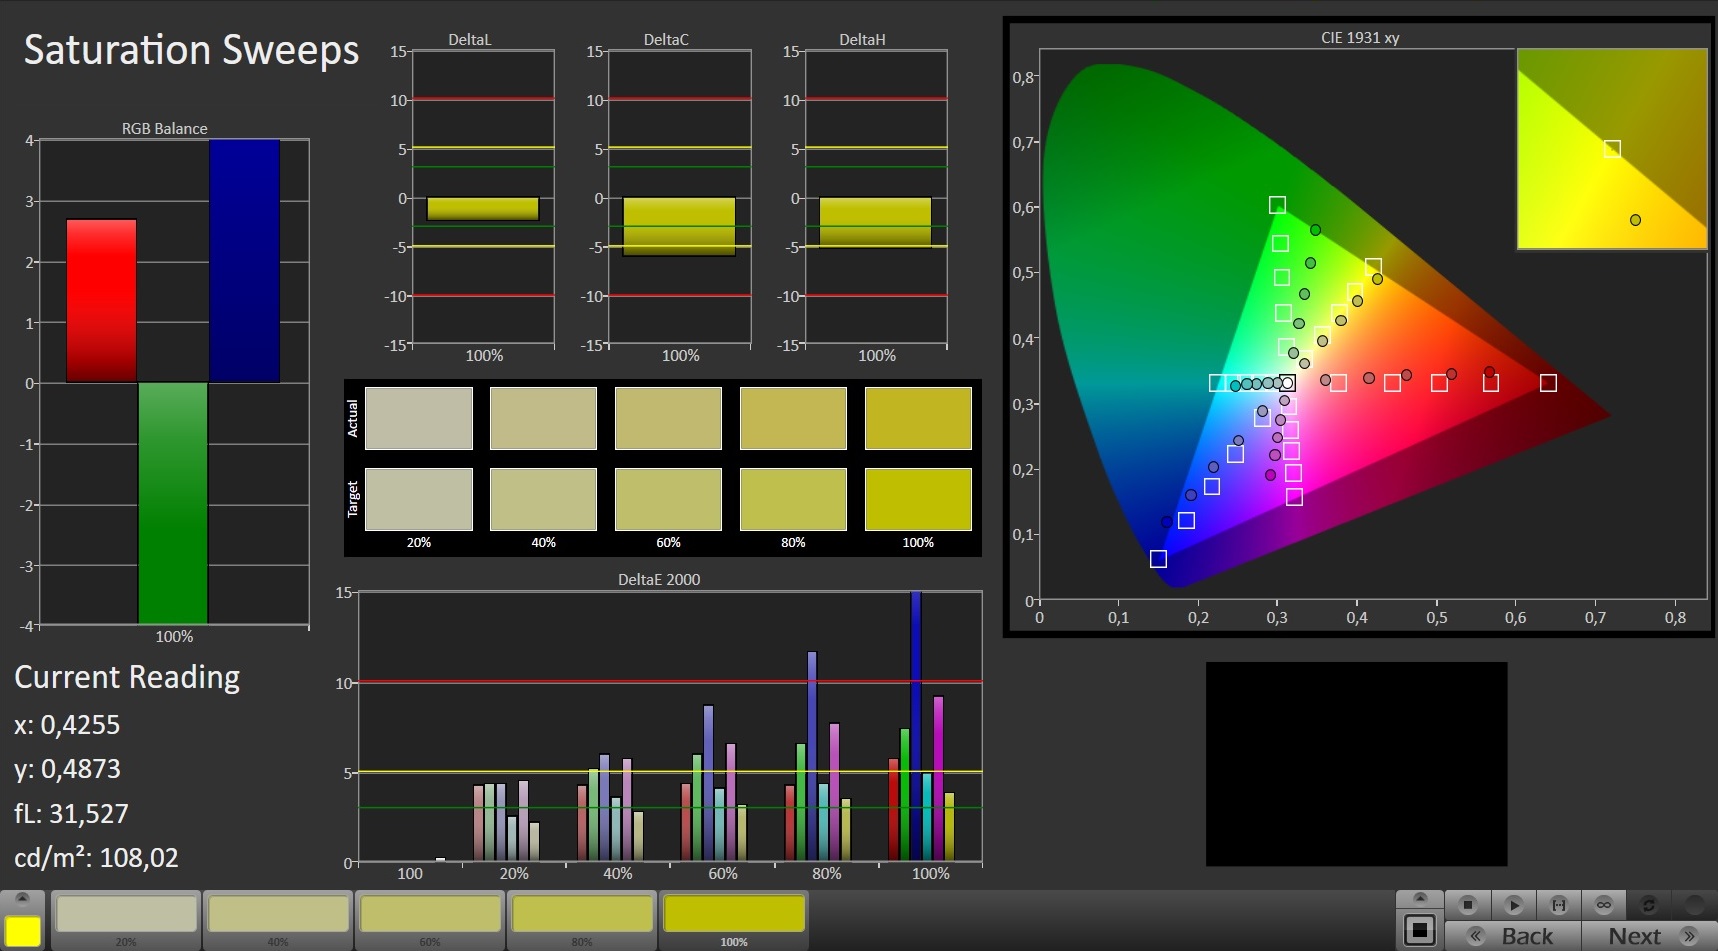
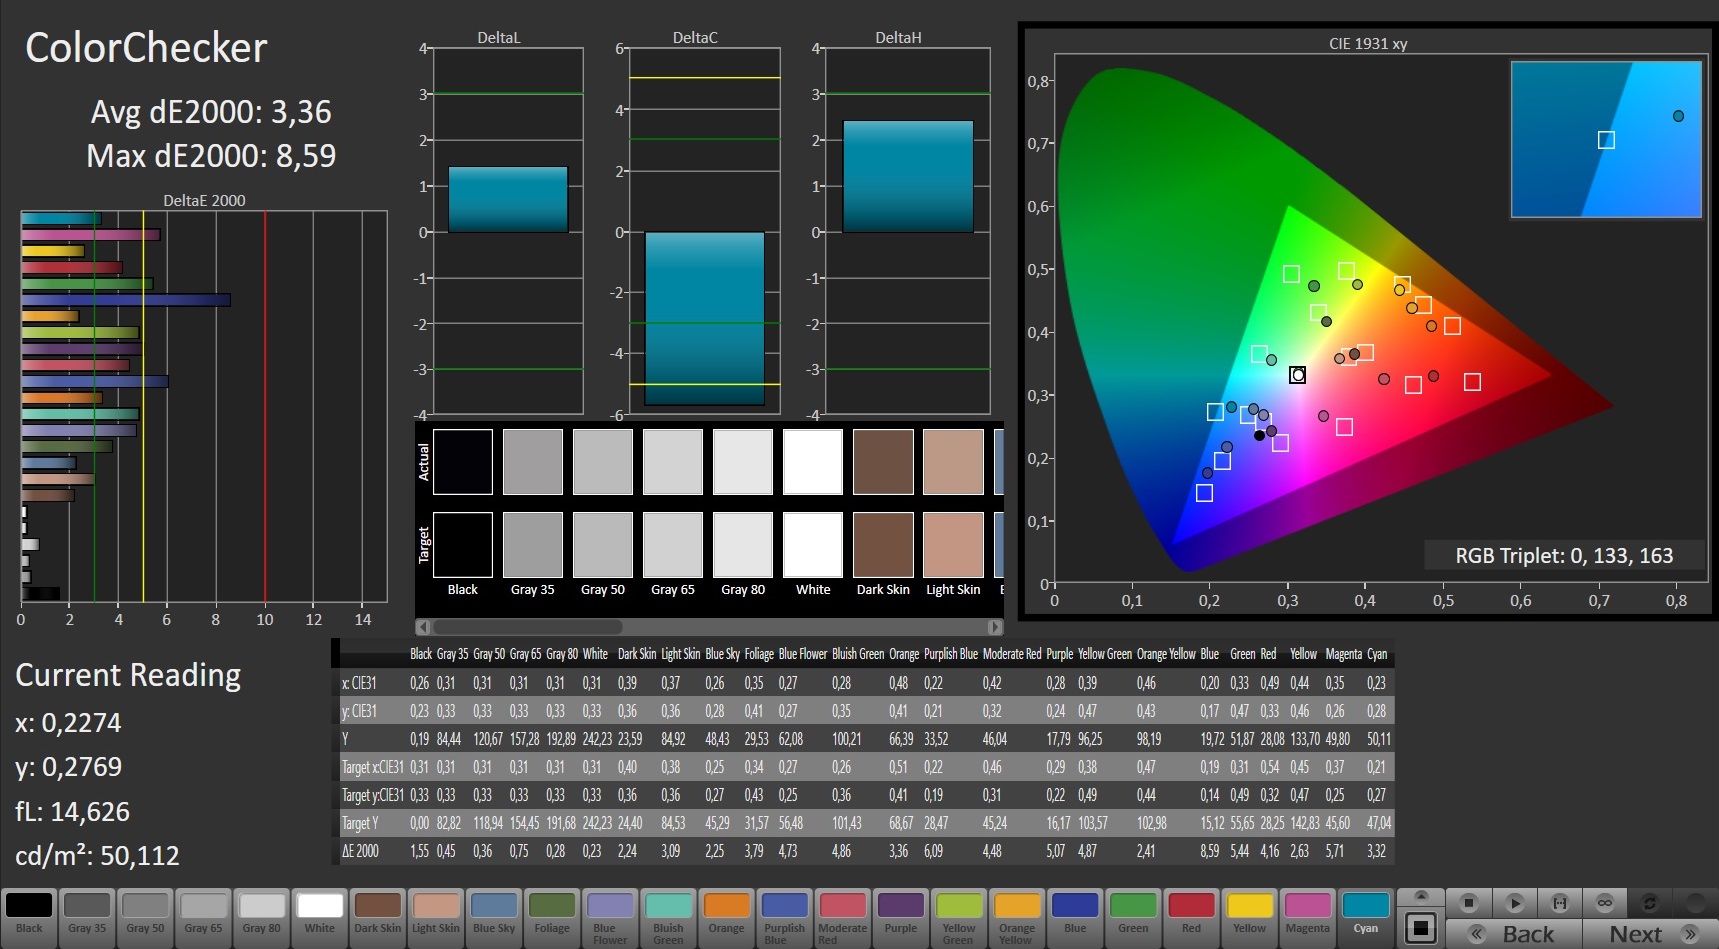
Despite good contrast and low black values, we are not convinced by the device's display quality. Although it only has a slight color deviation from the sRGB color space ex-works, color space coverage is at only 58% of the sRGB color space and 37% of the AdobeRGB color space. This is definitely below our expectations. We managed to improve the already acceptable color deviation with the help of our x-Rite i1 Pro 2 spectrophotometer. Gray scales in particular benefited from calibration.
If you want to use this device mainly as a desktop replacement together with an external screen, you will reap the benefits of good performance for image or video processing. Without an external display, the low color accuracy will suffice for amateur image or video processing, but not more.
The HP Omen 15t (2017) is not suitable for outdoor use due to its low brightness levels. Its predecessor had the same problems. It is very difficult to work with the device in direct sunlight. While it is possible to use it in the shade, it becomes rather uncomfortable after a while.

Display Response Times
| ↔ Response Time Black to White | ||
|---|---|---|
| 28 ms ... rise ↗ and fall ↘ combined | ↗ 16.4 ms rise | 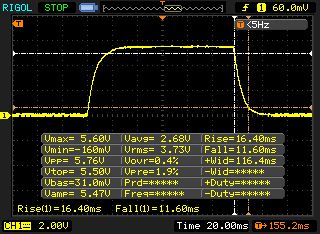 |
| ↘ 11.6 ms fall | ||
| The screen shows relatively slow response rates in our tests and may be too slow for gamers. In comparison, all tested devices range from 0.1 (minimum) to 240 (maximum) ms. » 71 % of all devices are better. This means that the measured response time is worse than the average of all tested devices (19.8 ms). | ||
| ↔ Response Time 50% Grey to 80% Grey | ||
| 42 ms ... rise ↗ and fall ↘ combined | ↗ 20.4 ms rise | 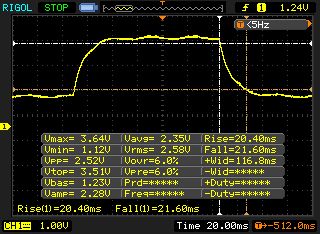 |
| ↘ 21.6 ms fall | ||
| The screen shows slow response rates in our tests and will be unsatisfactory for gamers. In comparison, all tested devices range from 0.165 (minimum) to 636 (maximum) ms. » 67 % of all devices are better. This means that the measured response time is worse than the average of all tested devices (31 ms). | ||
Screen Flickering / PWM (Pulse-Width Modulation)
| Screen flickering / PWM not detected | 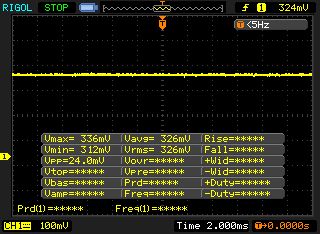 | ||
In comparison: 52 % of all tested devices do not use PWM to dim the display. If PWM was detected, an average of 7751 (minimum: 5 - maximum: 343500) Hz was measured. | |||
The IPS panel does have advantages: its good viewing angles. The two top corner images have a light gray film, which is a problem that many IPS screens face. But looking at the screen from these viewing angles is rather uncommon, so you should have no problem with viewing angles in day-to-day use.

Performance
Although the performance of the GeForce GTX 1050 Ti can in no way be compared with the top GeForce GTX 1080, it does offer good gaming performance. The fast quad-core processor and 16 GB of DDR4 RAM also play a part in ensuring good performance.


Processor
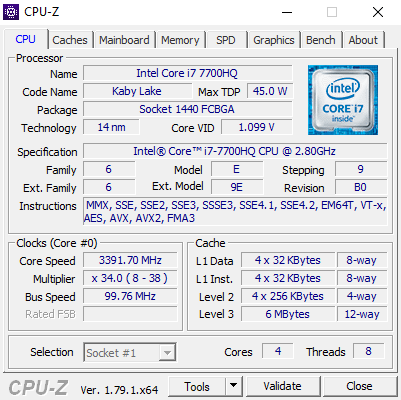
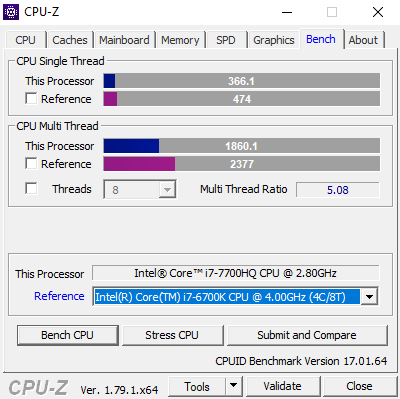
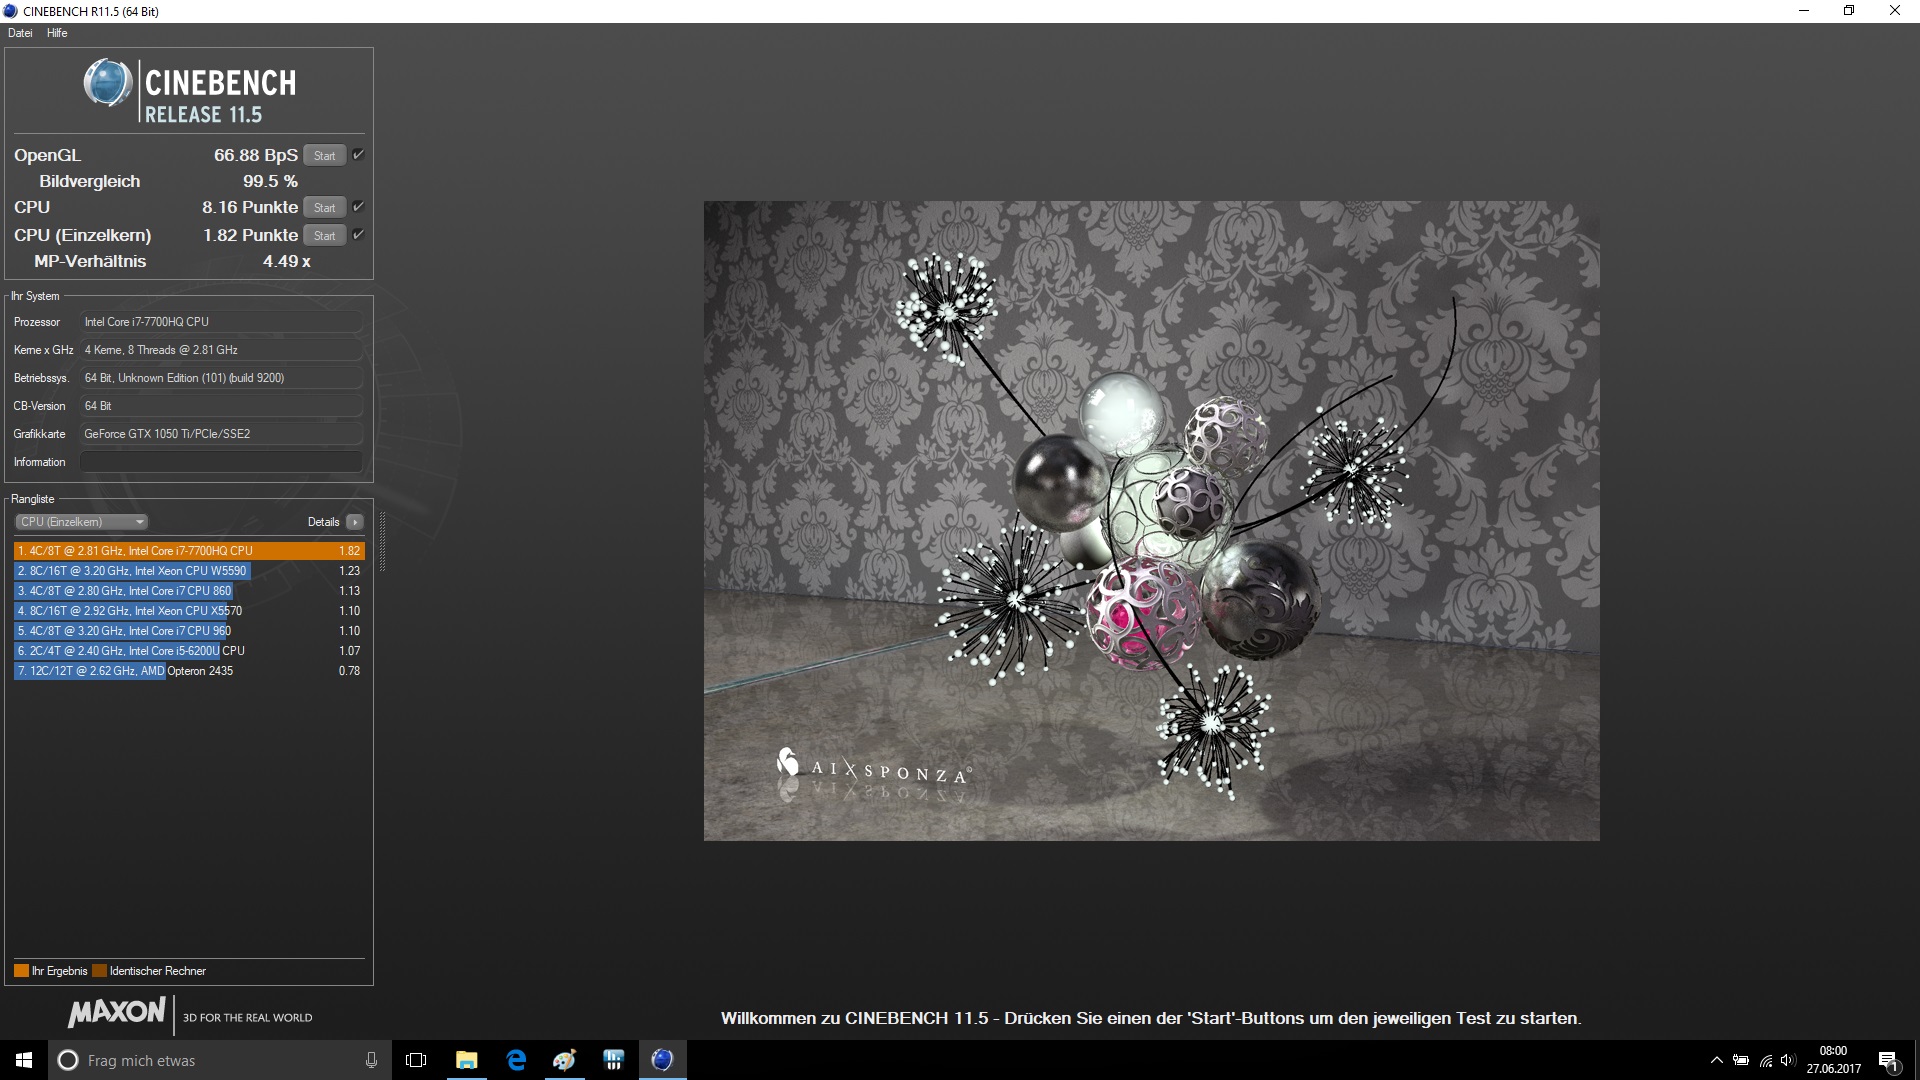
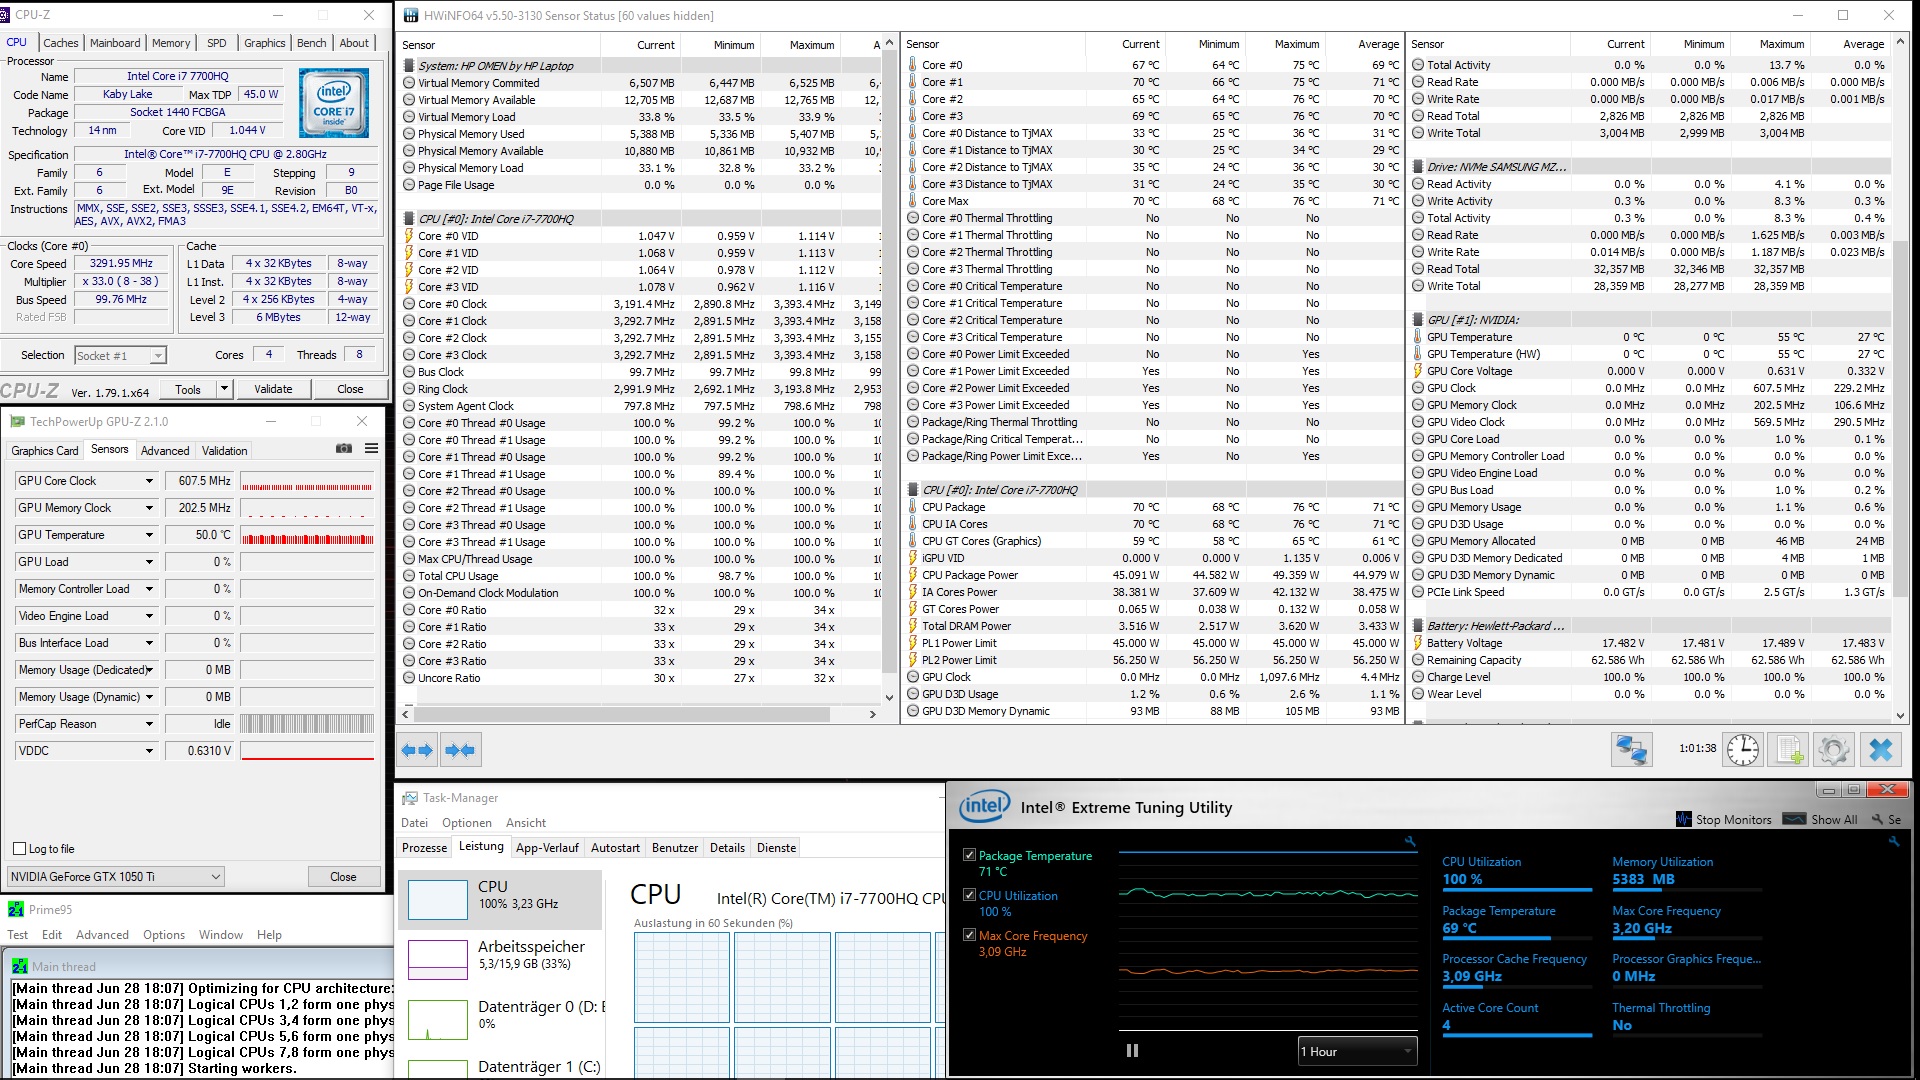
The Intel Core i7-7700HQ is a quad-core processor and belongs to the commonly used Kaby Lake series. Just like its Skylake predecessor, the current processor can execute up to eight threads simultaneously. The clock rate has been altered slightly and the base clock speed for the Intel Core i7-7700HQ is 2.8 GHz. This is an increase of 200 MHz compared to the Intel Core i7-6700HQ with the same TDP of 45 watts.
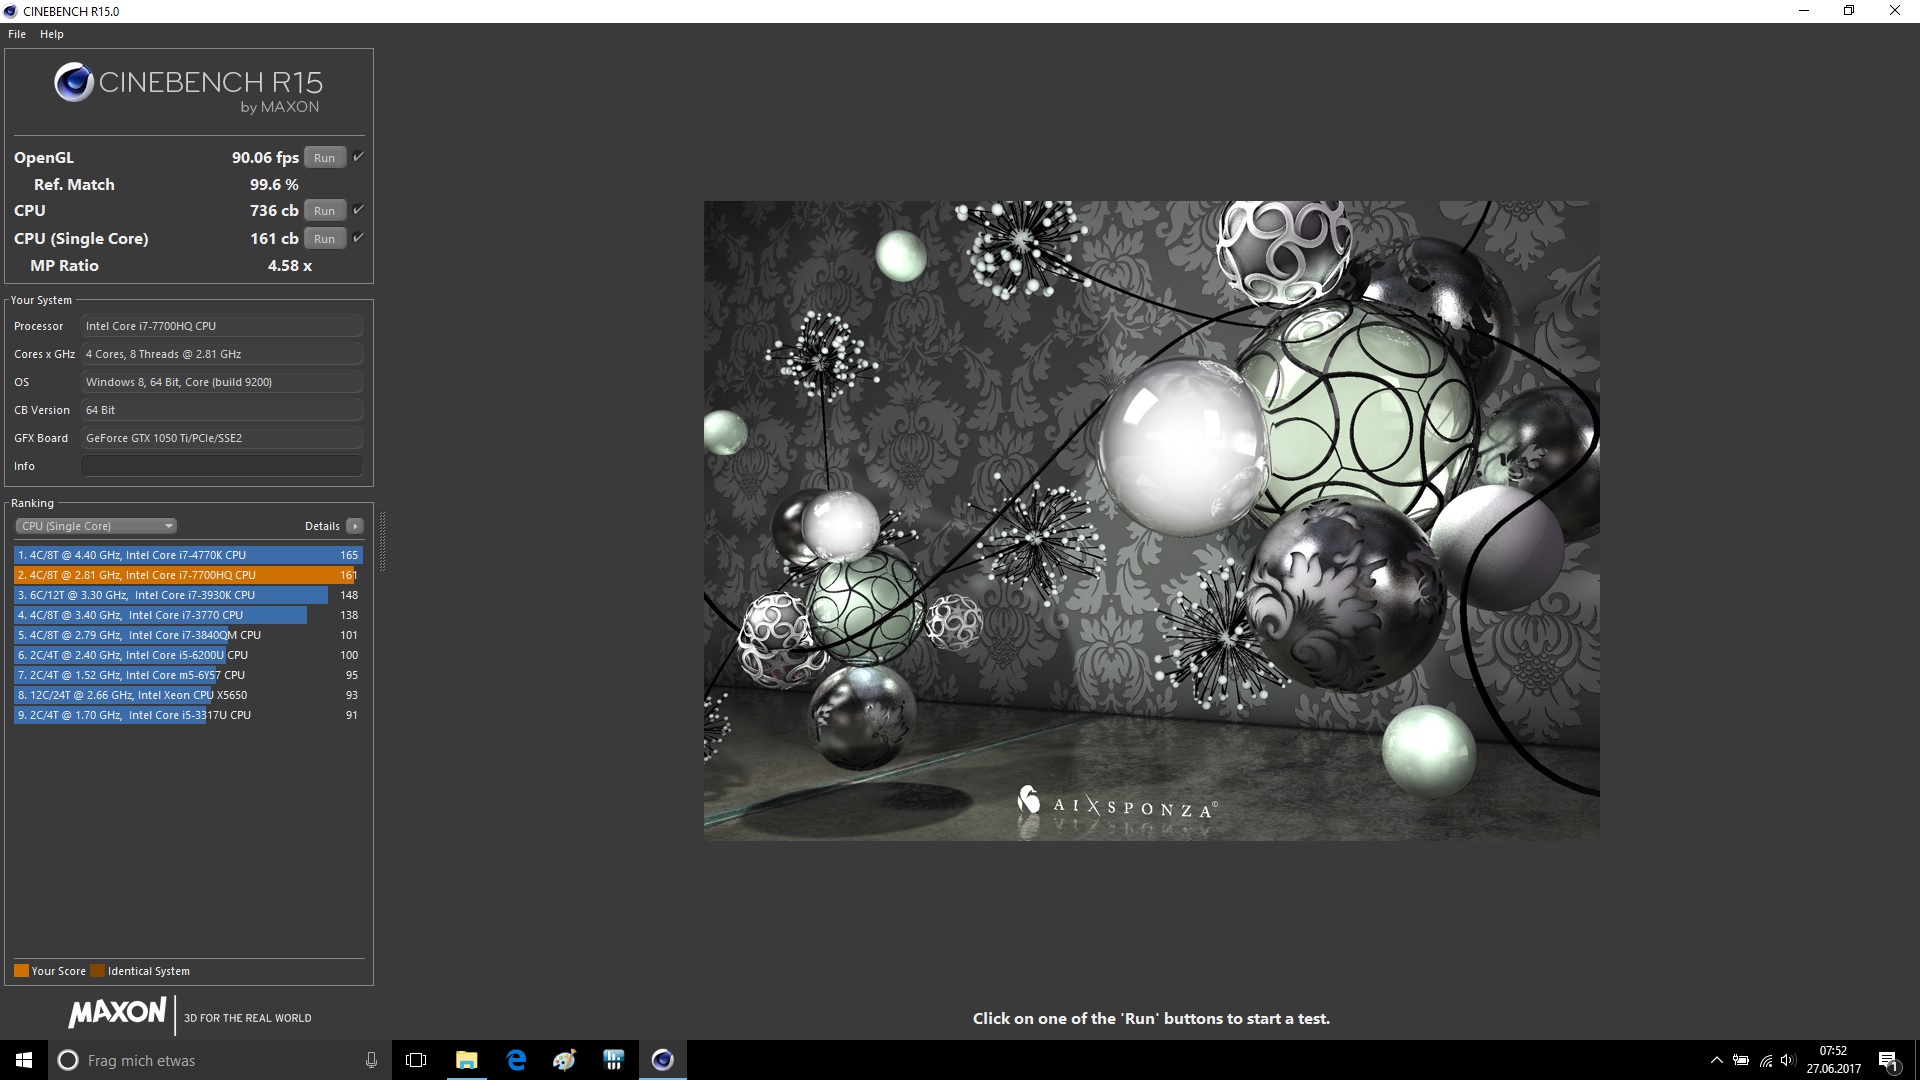
The HP Omen 15t (2017) makes good use of the processor's performance, which can be seen from the results of the various benchmarks (Cinebench R15, ...). Almost all devices equipped with the Core i7-7700HQ have more or less the same results. Compared to last year's model, the HP Omen 15t's performance has improved by about 10%.
Find out more about Intel Core i7-7700HQ benchmarks here.
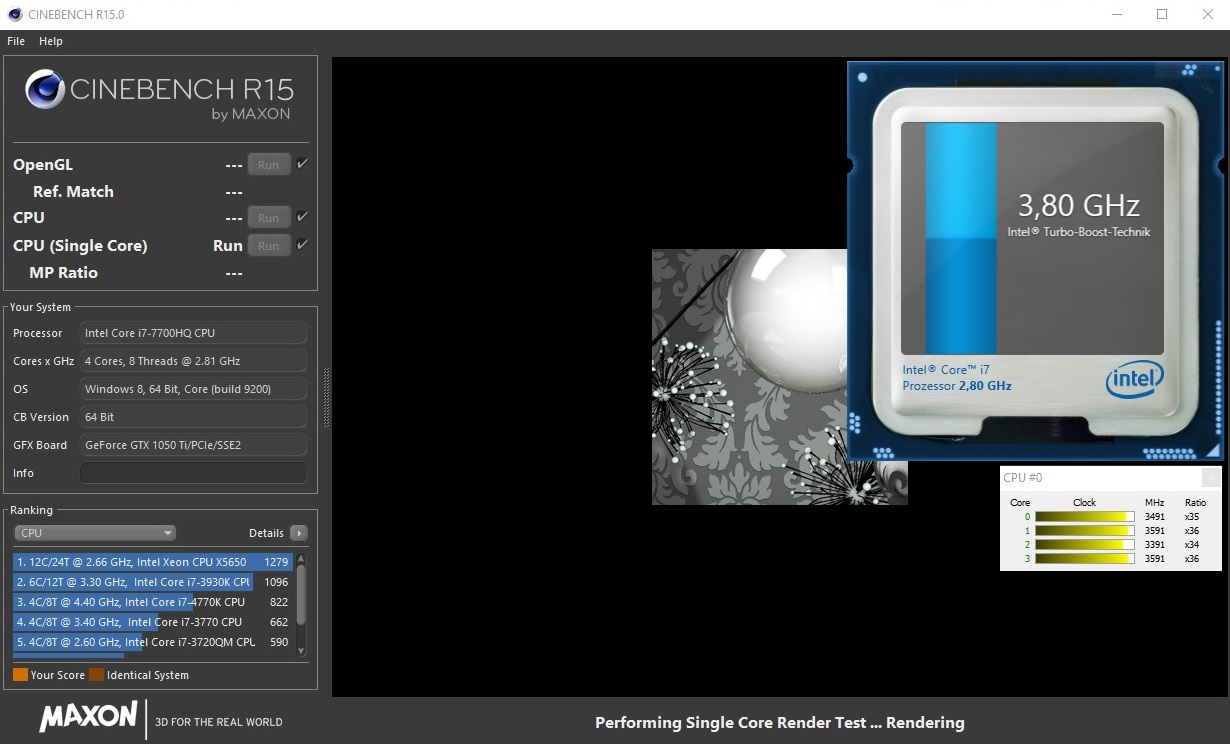
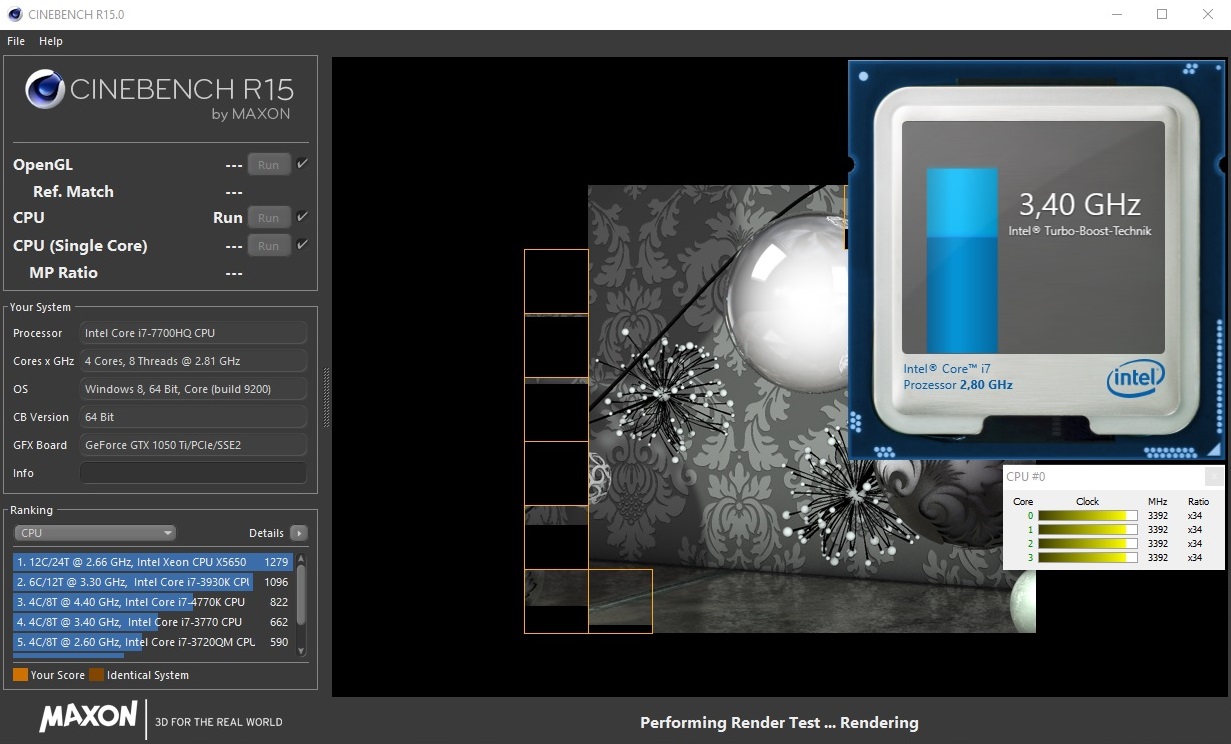
The Cinebench R15 loop test has also brought good results for the Intel Core i7-7700HQ. There are no noticeable drops in performance, which would have meant that there was thermal throttling. There were only minimal fluctuations in performance and all results lie between 733 and 740 points.
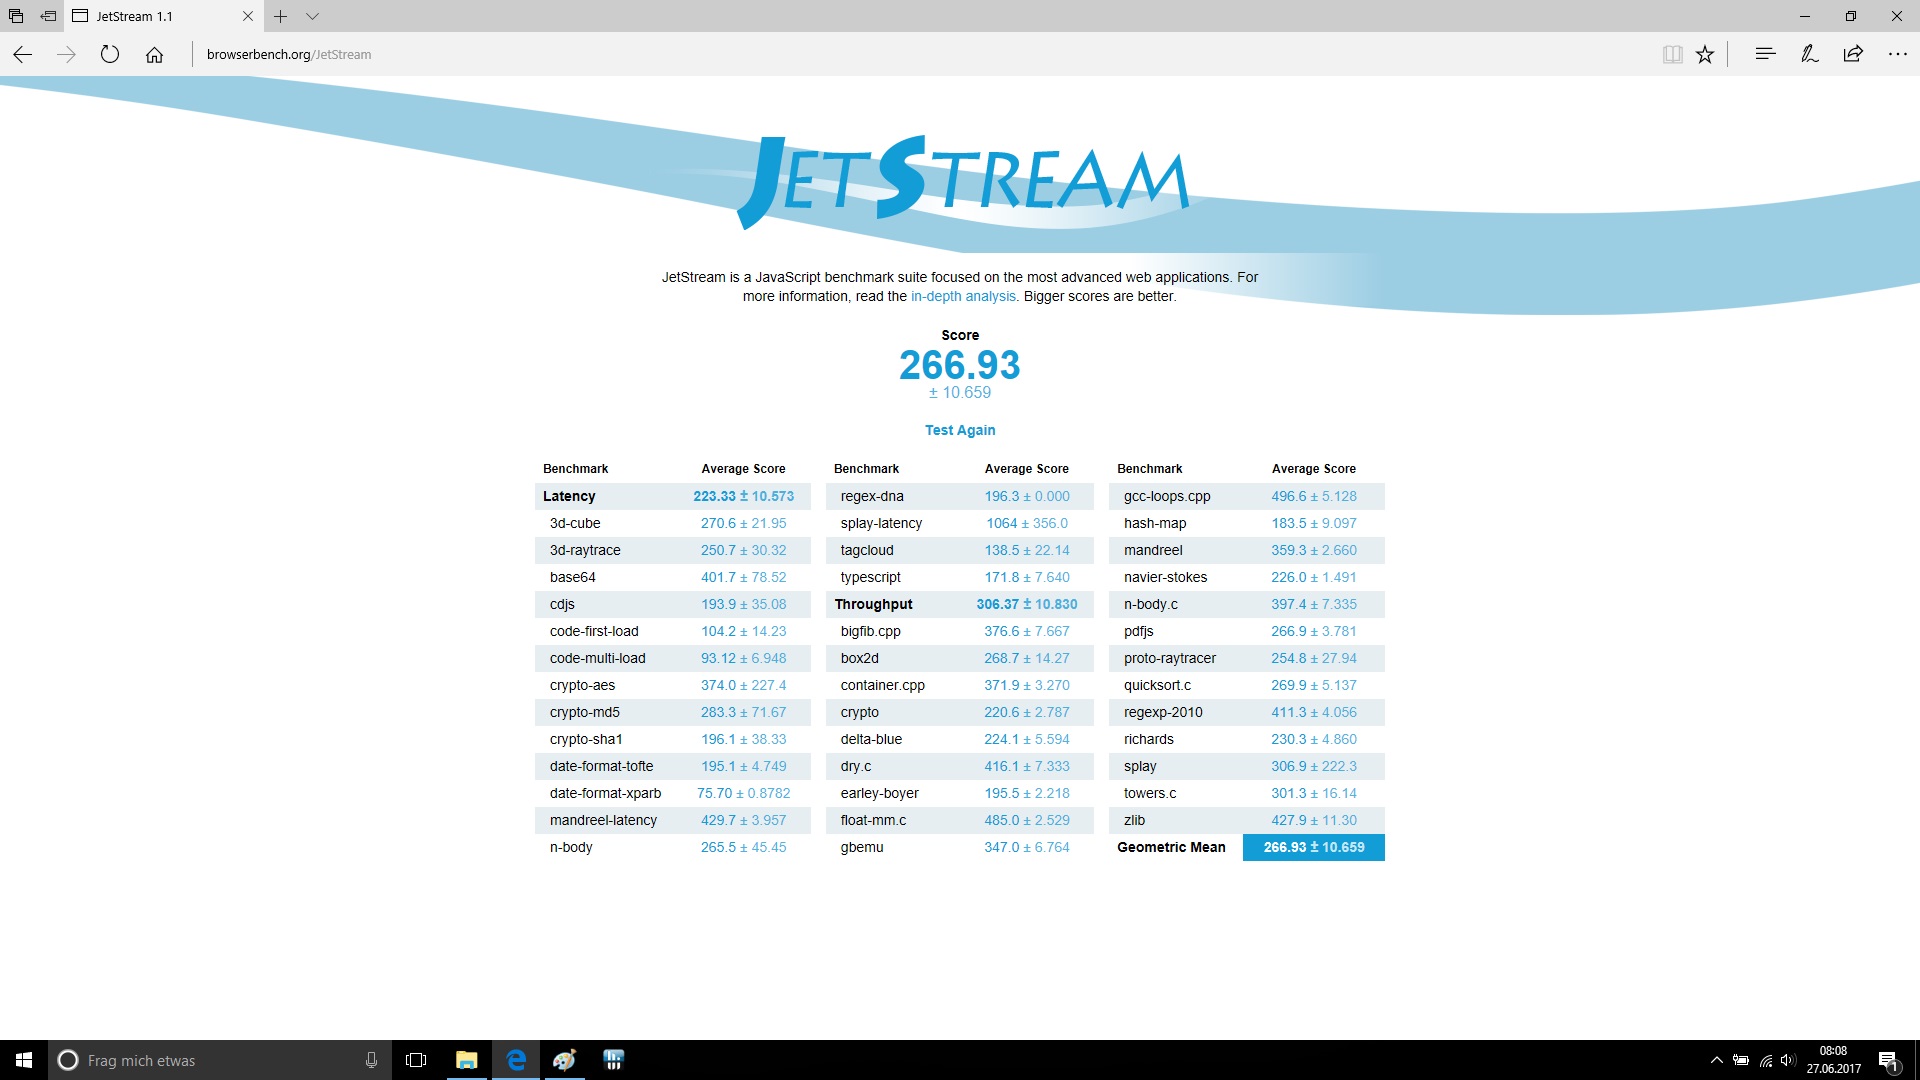
| JetStream 1.1 - 1.1 Total | |
| HP Omen 15-ax213ng | |
| Lenovo Legion Y520-15IKBN-80WK001KUS | |
| Dell Inspiron 15 7000 7567 | |
| MSI GS63VR 7RF-228US | |
| Asus FX502VM-AS73 | |
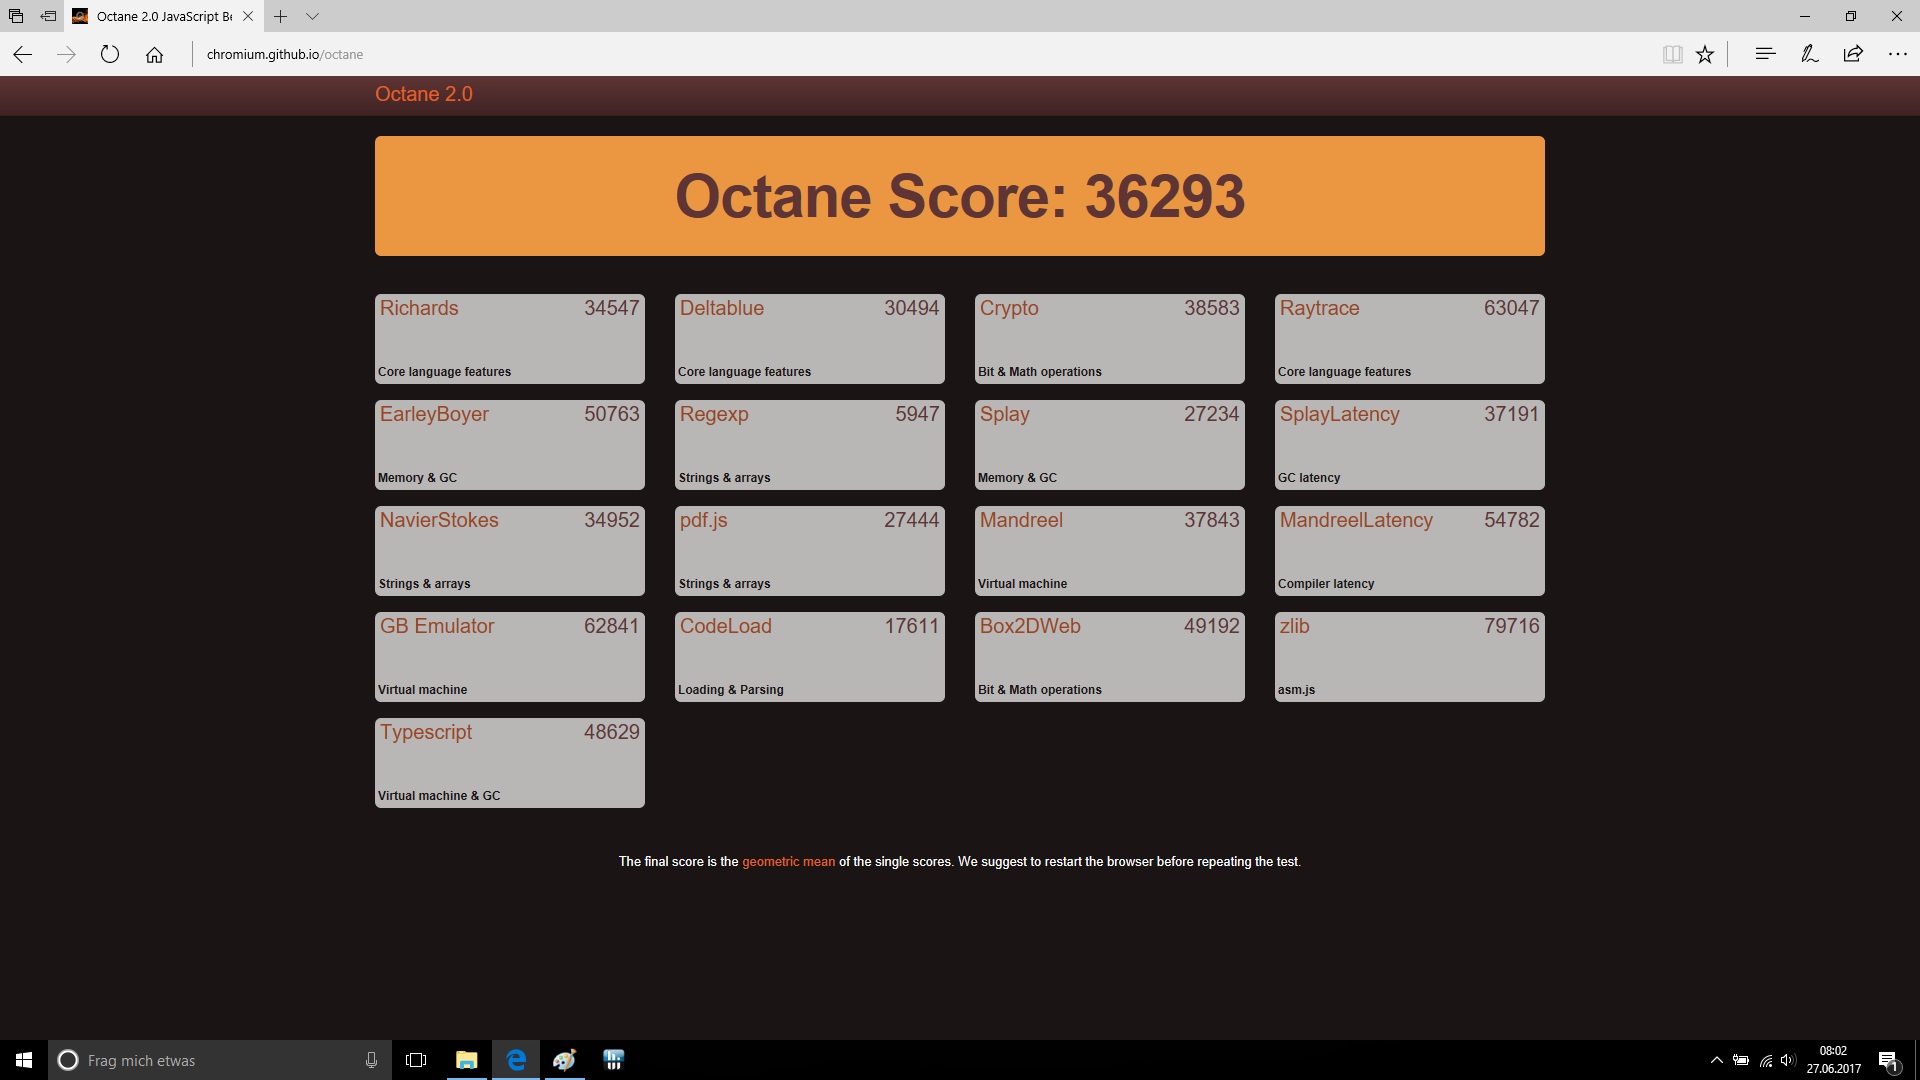
| Octane V2 - Total Score | |
| Dell Inspiron 15 7000 7567 | |
| Asus FX502VM-AS73 | |
| HP Omen 15-ax213ng | |
| Lenovo Legion Y520-15IKBN-80WK001KUS | |
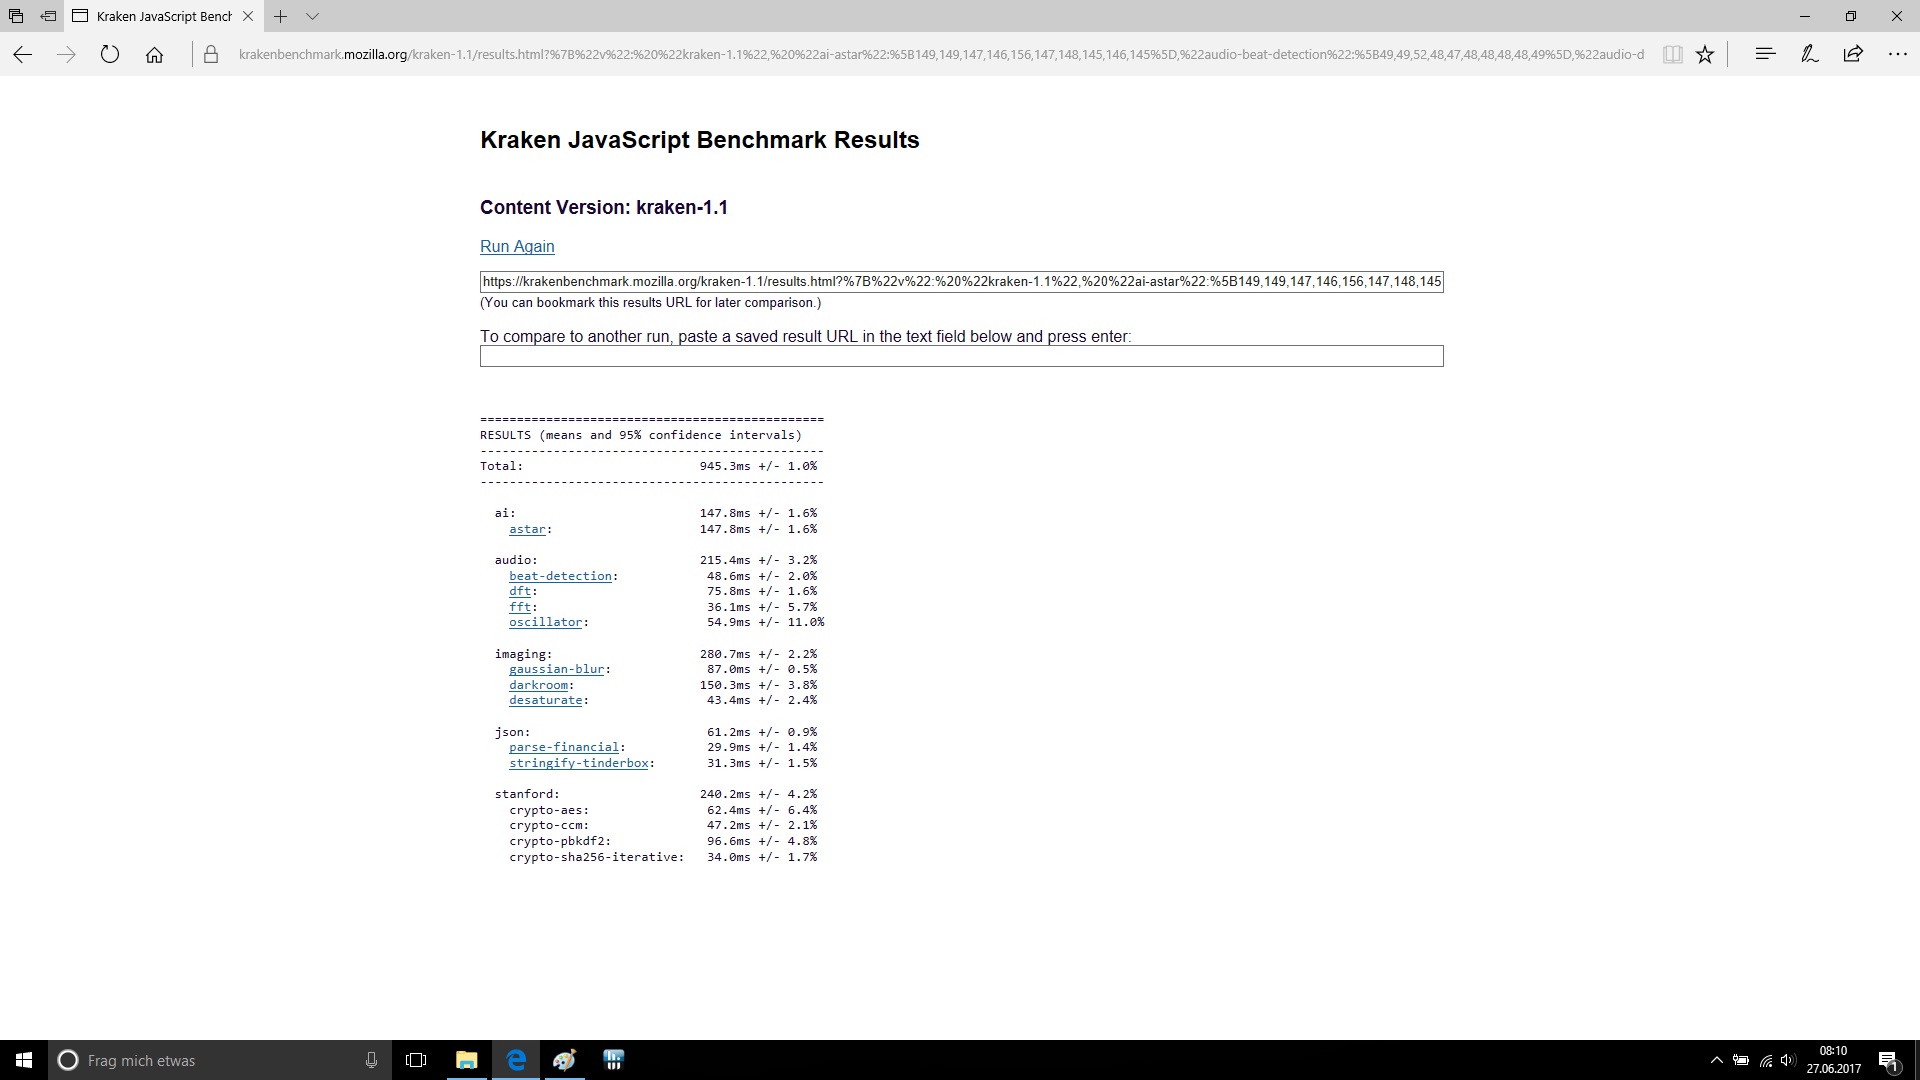
| Mozilla Kraken 1.1 - Total | |
| Acer Aspire VX5-591G-75C4 VX15 | |
| MSI GS63VR 7RF-228US | |
| Dell Inspiron 15 7000 7567 | |
| Lenovo Legion Y520-15IKBN-80WK001KUS | |
| HP Omen 15-ax213ng | |
* ... smaller is better
System Performance
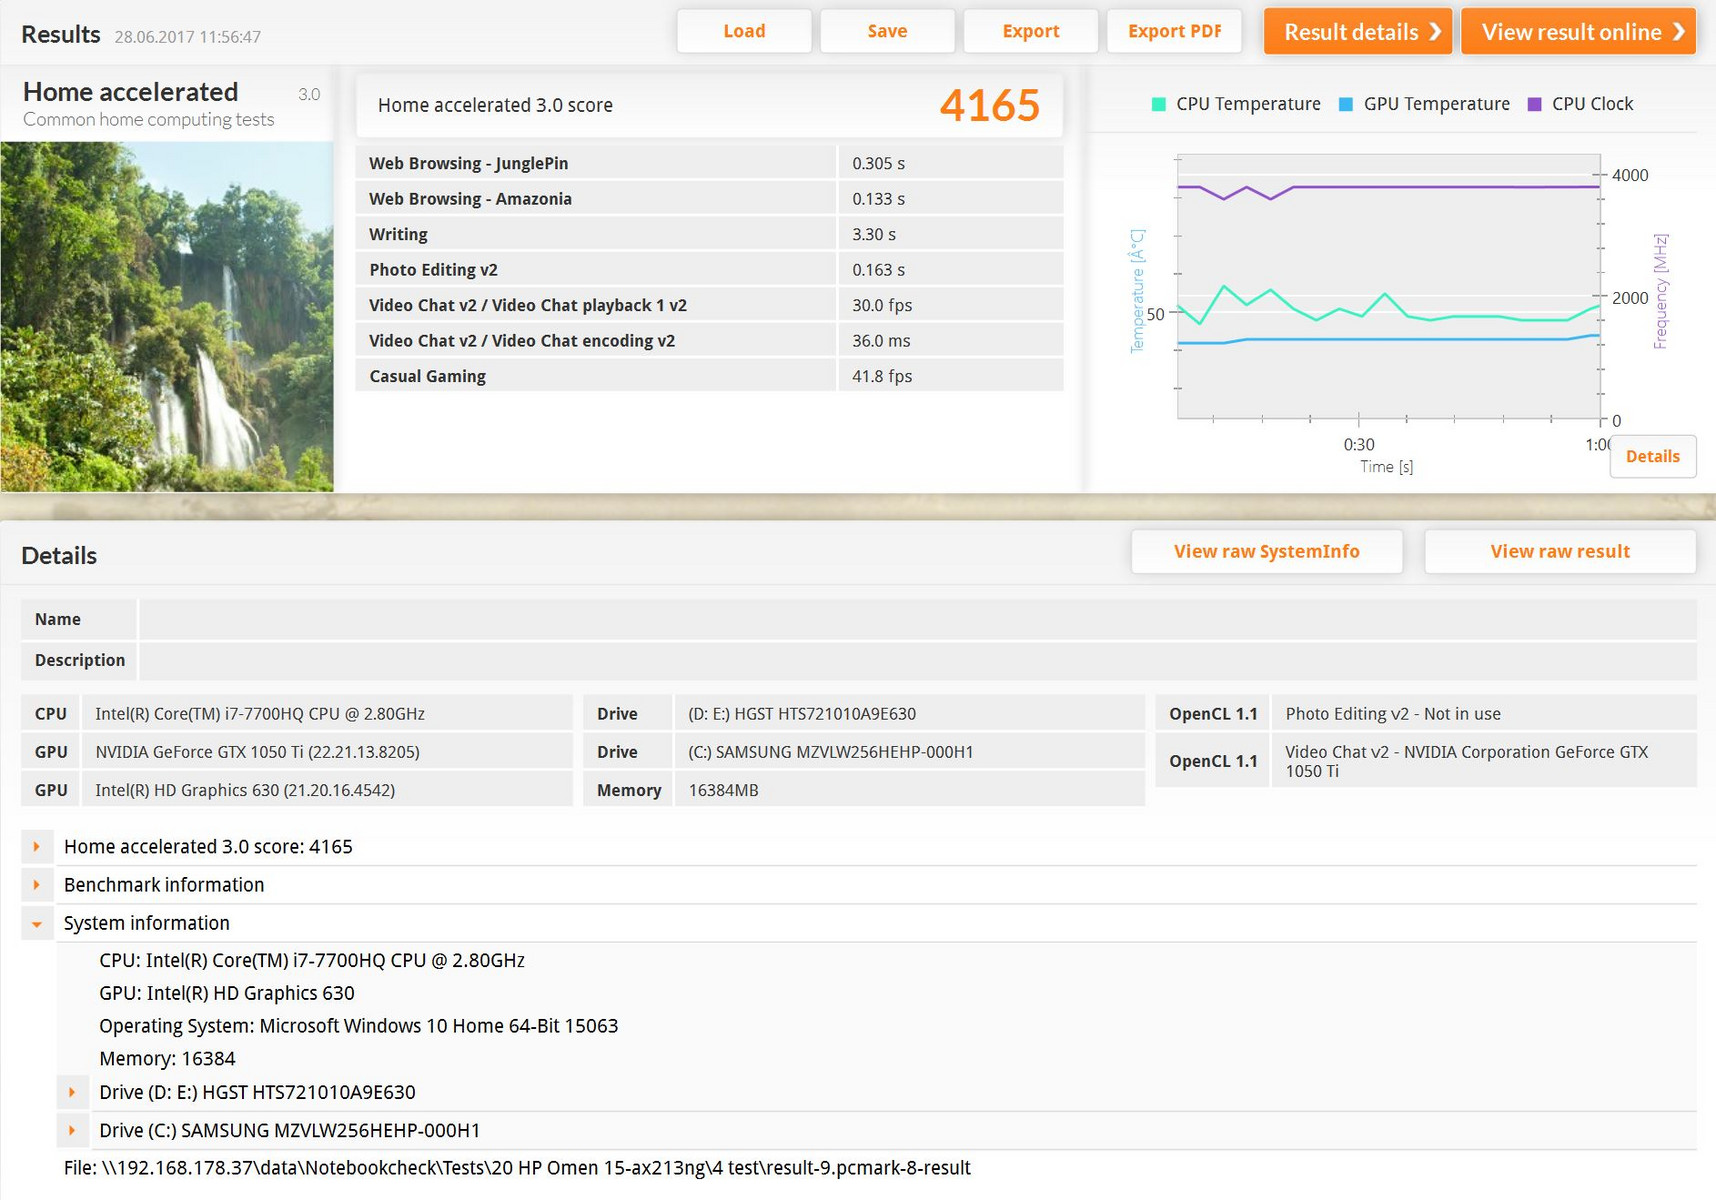
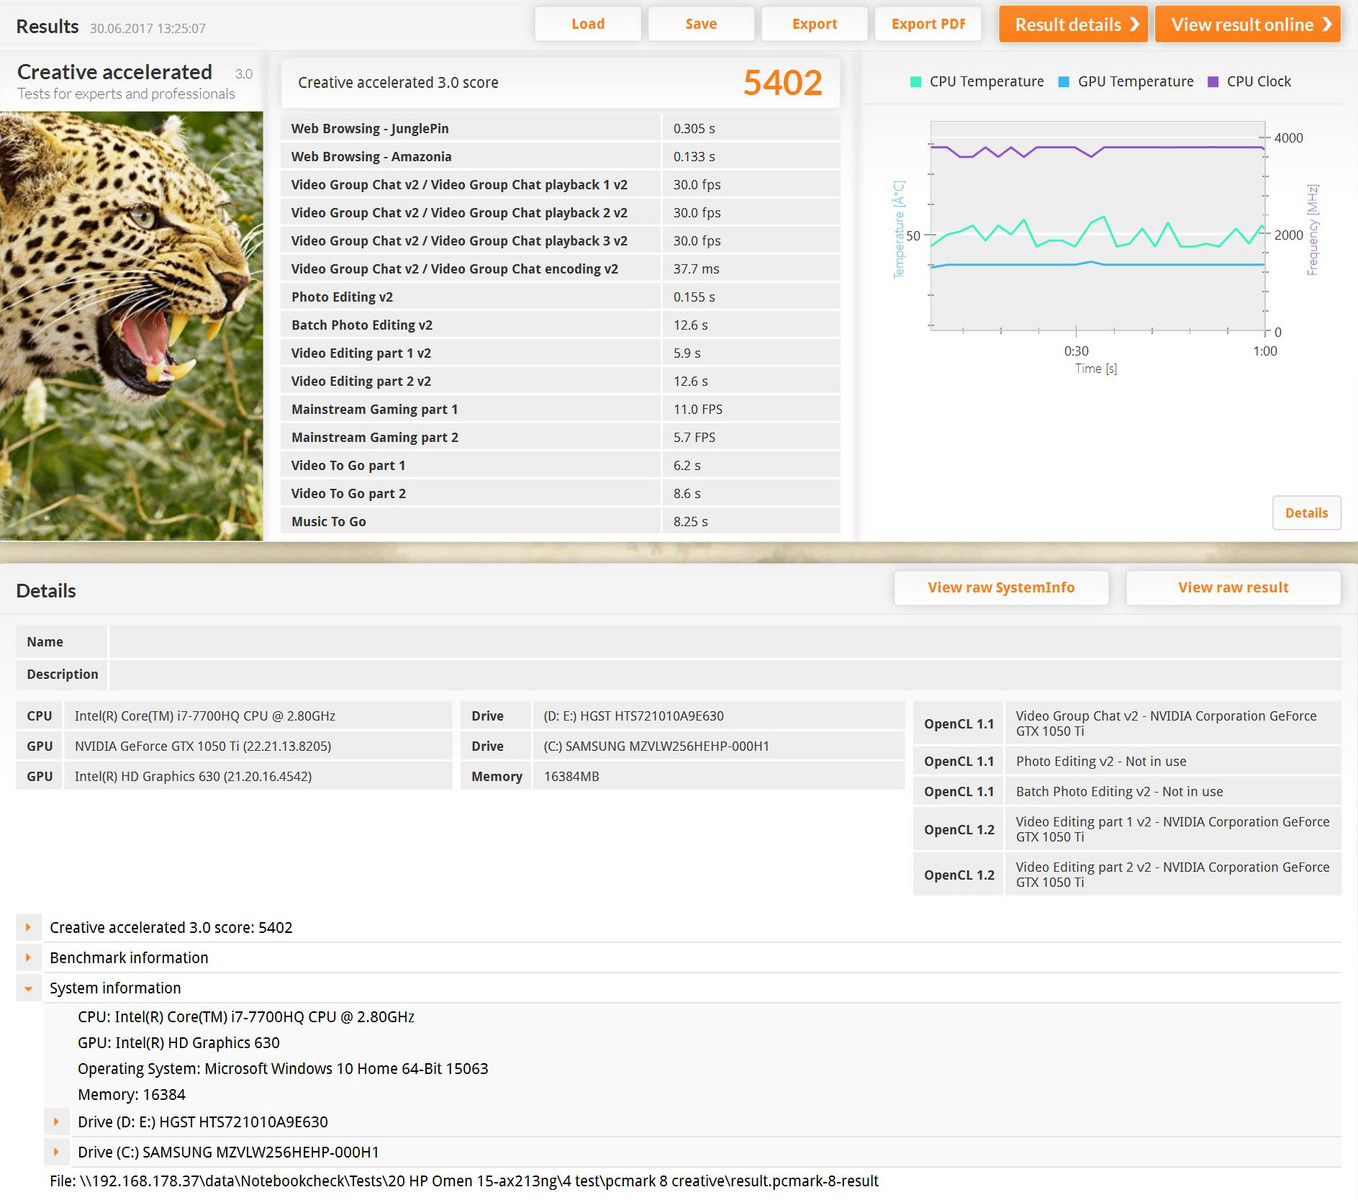
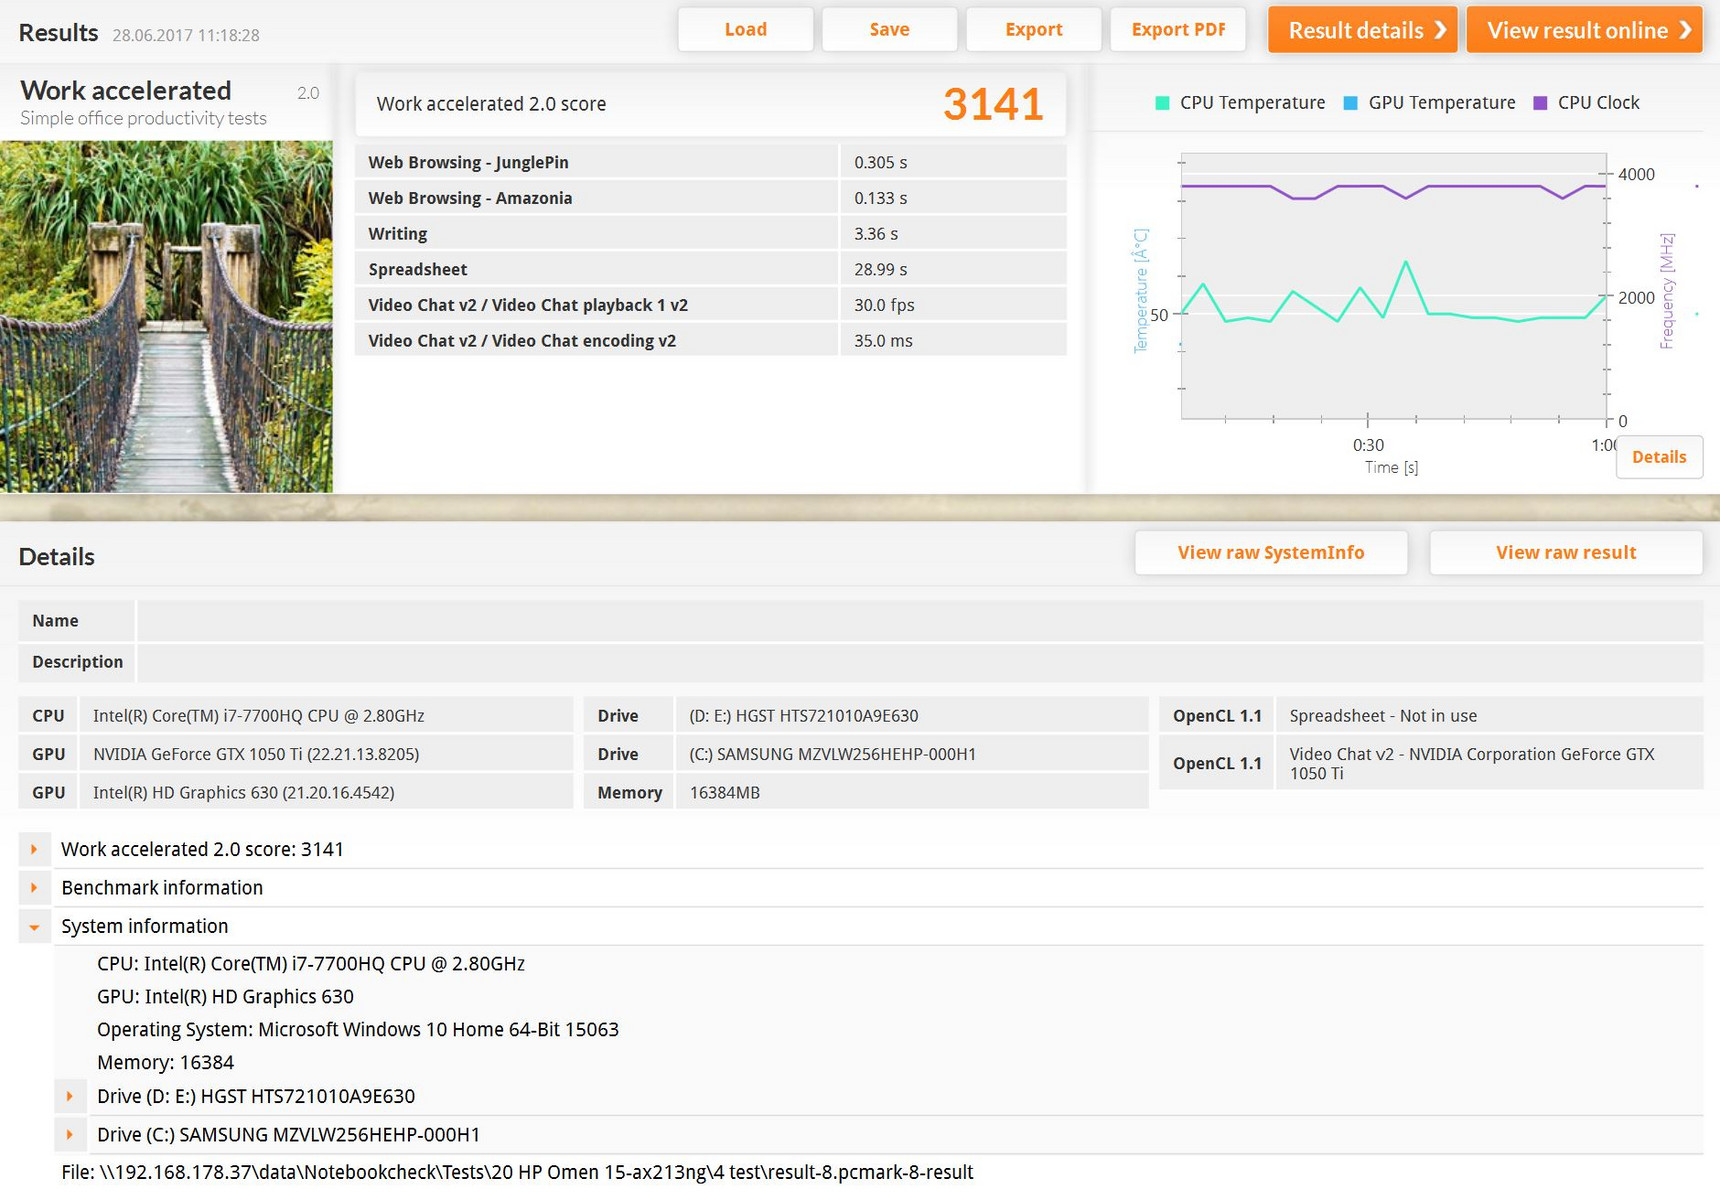
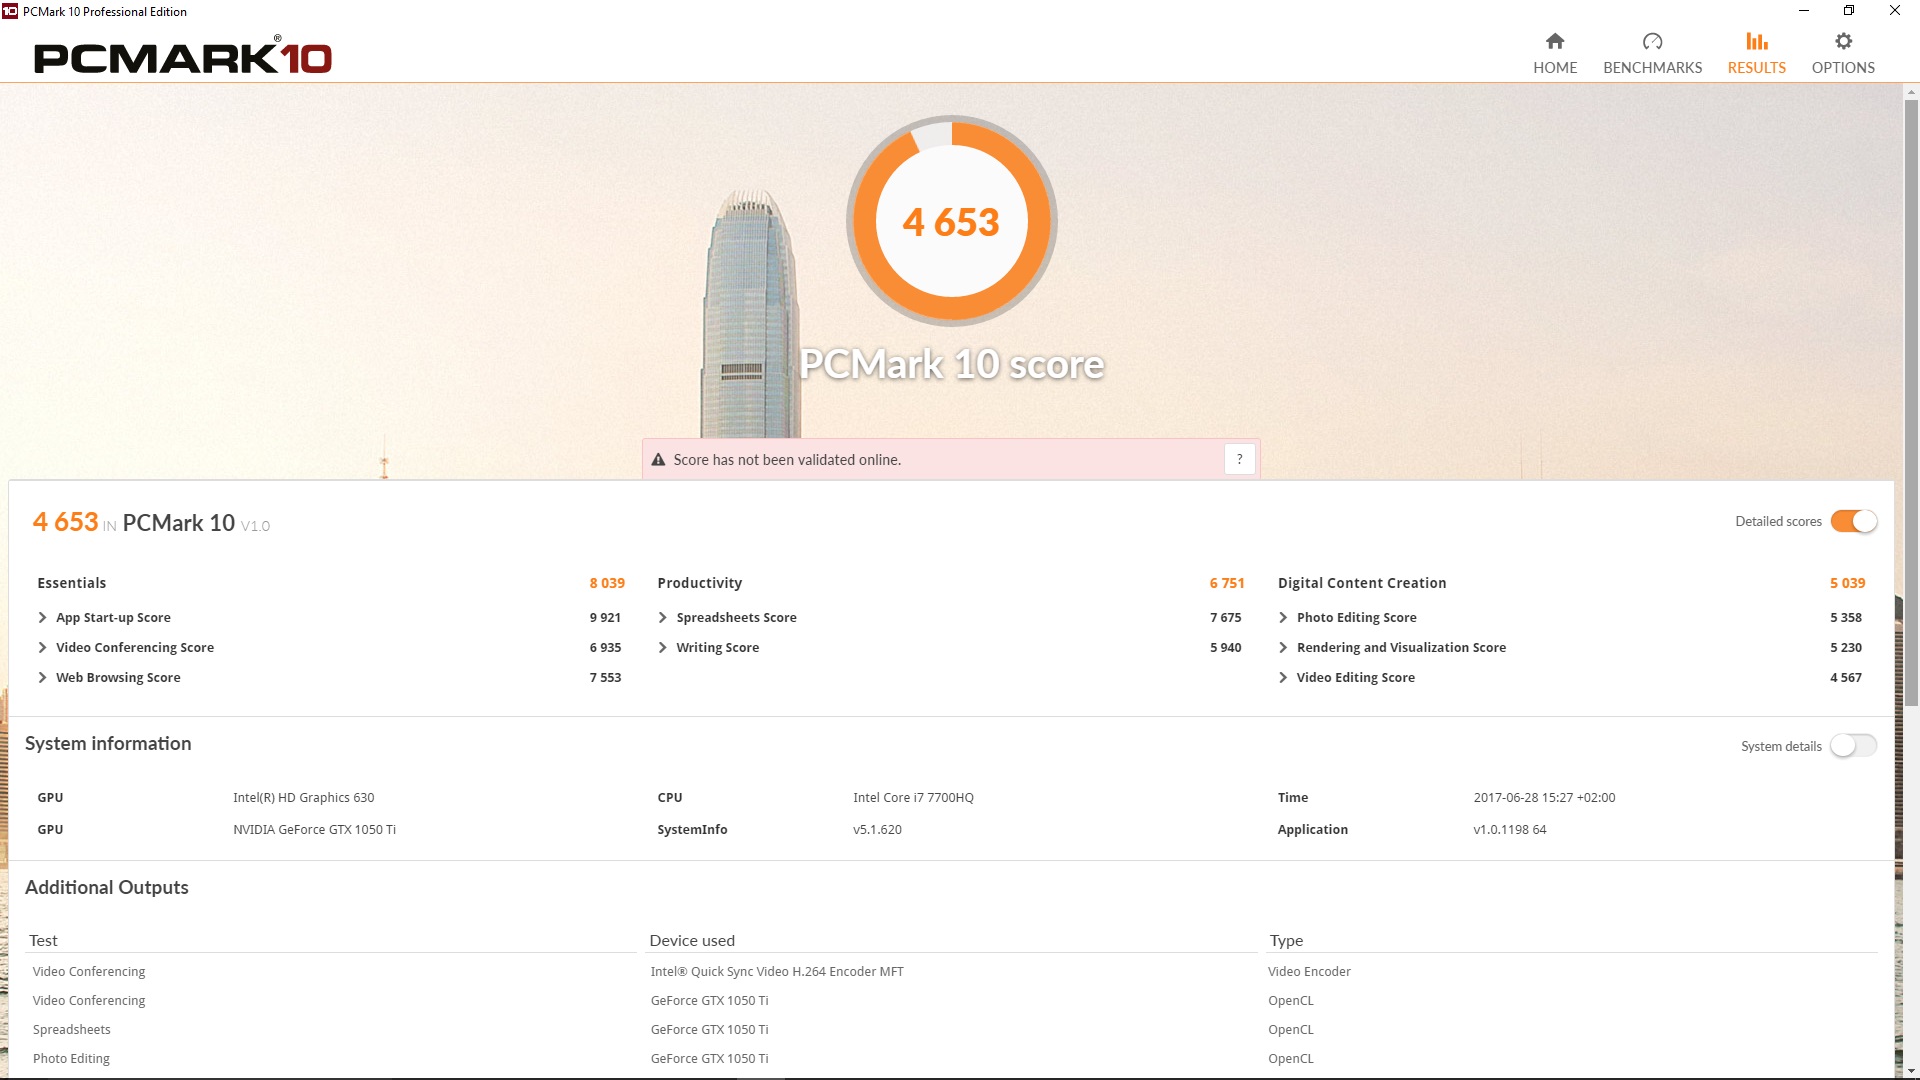
We tested system performance with the PCMark 8 benchmark (Home/Creative/Work Suite). Performance has been improved slightly and the Windows operating system is installed on the SSD, which helps the system run smoothly. Overall, the device runs fast and reliably and Windows 10 is ready to go after a few seconds.
| PCMark 8 | |
| Home Score Accelerated v2 | |
| Asus FX502VM-AS73 | |
| HP Omen 15-ax213ng | |
| MSI GS63VR 7RF-228US | |
| HP Omen 15-ax007ng | |
| Dell Inspiron 15 7000 7567 | |
| Acer Aspire VX5-591G-75C4 VX15 | |
| Work Score Accelerated v2 | |
| MSI GS63VR 7RF-228US | |
| Dell Inspiron 15 7000 7567 | |
| HP Omen 15-ax007ng | |
| Acer Aspire VX5-591G-75C4 VX15 | |
| HP Omen 15-ax213ng | |
| Asus FX502VM-AS73 | |
| Creative Score Accelerated v2 | |
| Asus FX502VM-AS73 | |
| HP Omen 15-ax213ng | |
| MSI GS63VR 7RF-228US | |
| HP Omen 15-ax007ng | |
| PCMark 8 Home Score Accelerated v2 | 4165 points | |
| PCMark 8 Creative Score Accelerated v2 | 5402 points | |
| PCMark 8 Work Score Accelerated v2 | 3141 points | |
| PCMark 10 Score | 4653 points | |
Help | ||
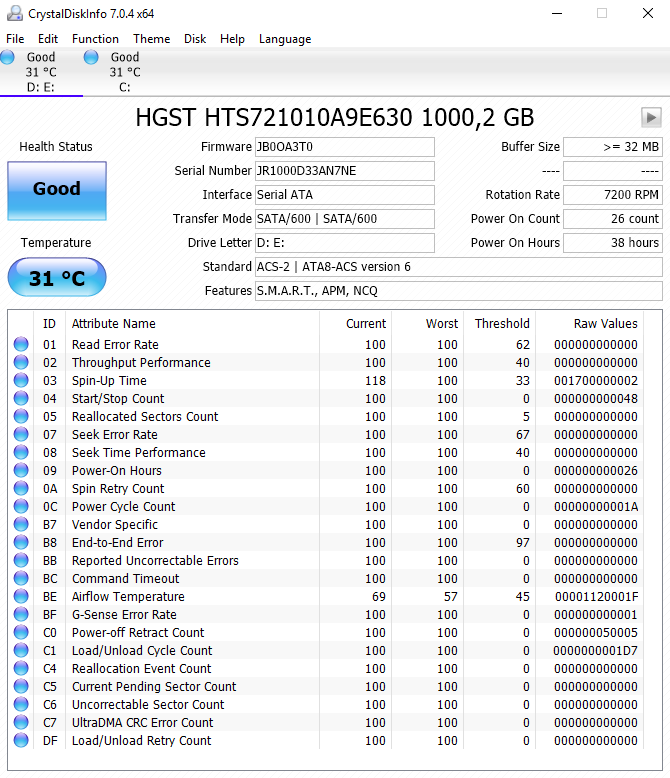
Storage Devices
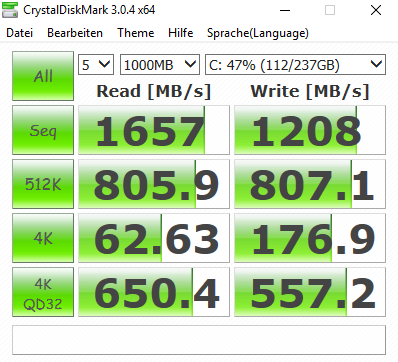
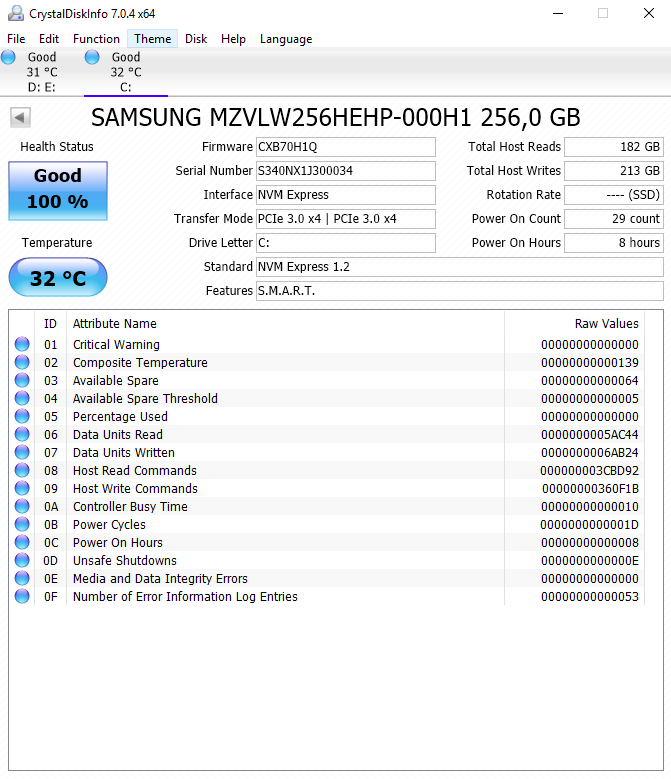
HP has chosen to combine an SSD for the operating system with an HDD for other data. The 256-GB M.2 SSD has sufficient space for Windows and other regularly used programs. It has very good performance due to the fast PCIe connection. According to CrystalDiskMark, the SSD reaches a speed of 1657 MB/s during sequential reading and 1208 MB/s during sequential writing. In the comparison table, you can see that this SSD has an advantage over SATA SSDs. Performance has almost tripled in comparison to the HP Omen 15t (2016).
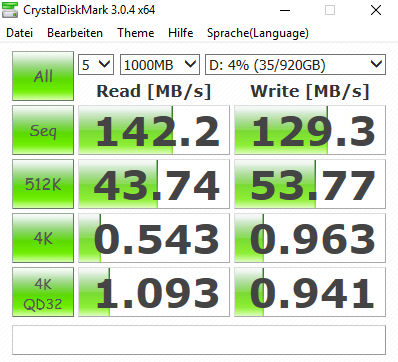
Other data can be saved on the conventional 1-TB hard drive, which has an average transfer rate of 109 MB/s in HDTune.


| HP Omen 15-ax213ng Samsung PM961 MZVLW256HEHP | HP Omen 15-ax007ng Adata IM2S3138E-128GM-B | Acer Aspire VX5-591G-75C4 VX15 Toshiba MQ01ABD100 | Dell Inspiron 15 7000 7567 Intel SSDSCKKF256H6 | Lenovo Legion Y520-15IKBN-80WK001KUS Samsung PM961 MZVLW256HEHP | Asus FX502VM-AS73 SK Hynix HFS256G39TND-N210A | MSI GS63VR 7RF-228US Samsung SM961 MZVKW512HMJP m.2 PCI-e | |
|---|---|---|---|---|---|---|---|
| CrystalDiskMark 3.0 | -65% | -97% | -60% | -6% | -67% | 10% | |
| Read Seq (MB/s) | 1657 | 475.7 -71% | 101.5 -94% | 485.8 -71% | 2170 31% | 503 -70% | 2141 29% |
| Write Seq (MB/s) | 1208 | 169.2 -86% | 100.6 -92% | 422.8 -65% | 1202 0% | 138.2 -89% | 1621 34% |
| Read 512 (MB/s) | 806 | 327.6 -59% | 28.33 -96% | 338.9 -58% | 786 -2% | 343.5 -57% | 499.7 -38% |
| Write 512 (MB/s) | 807 | 169.6 -79% | 28.31 -96% | 304 -62% | 822 2% | 137.8 -83% | 1531 90% |
| Read 4k (MB/s) | 62.6 | 33.14 -47% | 0.327 -99% | 27.11 -57% | 58.9 -6% | 29.36 -53% | 54.2 -13% |
| Write 4k (MB/s) | 176.9 | 81.4 -54% | 0.846 -100% | 85.4 -52% | 146.4 -17% | 70.9 -60% | 158.2 -11% |
| Read 4k QD32 (MB/s) | 650 | 276.8 -57% | 0.718 -100% | 279.6 -57% | 457.7 -30% | 369.9 -43% | 632 -3% |
| Write 4k QD32 (MB/s) | 557 | 168 -70% | 0.893 -100% | 255.1 -54% | 392.9 -29% | 99.7 -82% | 527 -5% |

Graphics
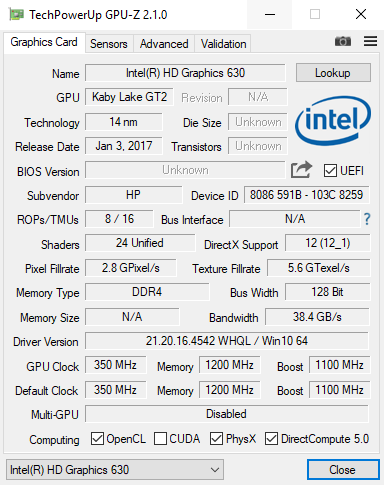
The integrated graphics unit Intel HD Graphics 630 is only partially responsible for graphics display. While working in Windows, it takes care of playing videos in the newest codecs (H.265/HVEC or Googles VP9).
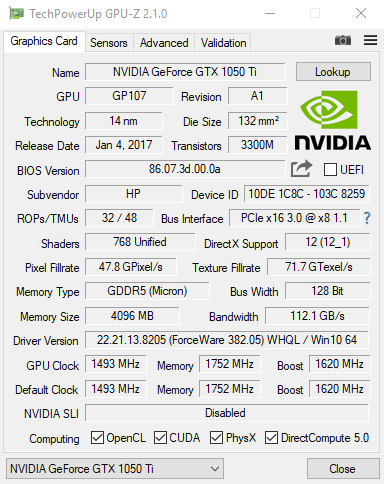
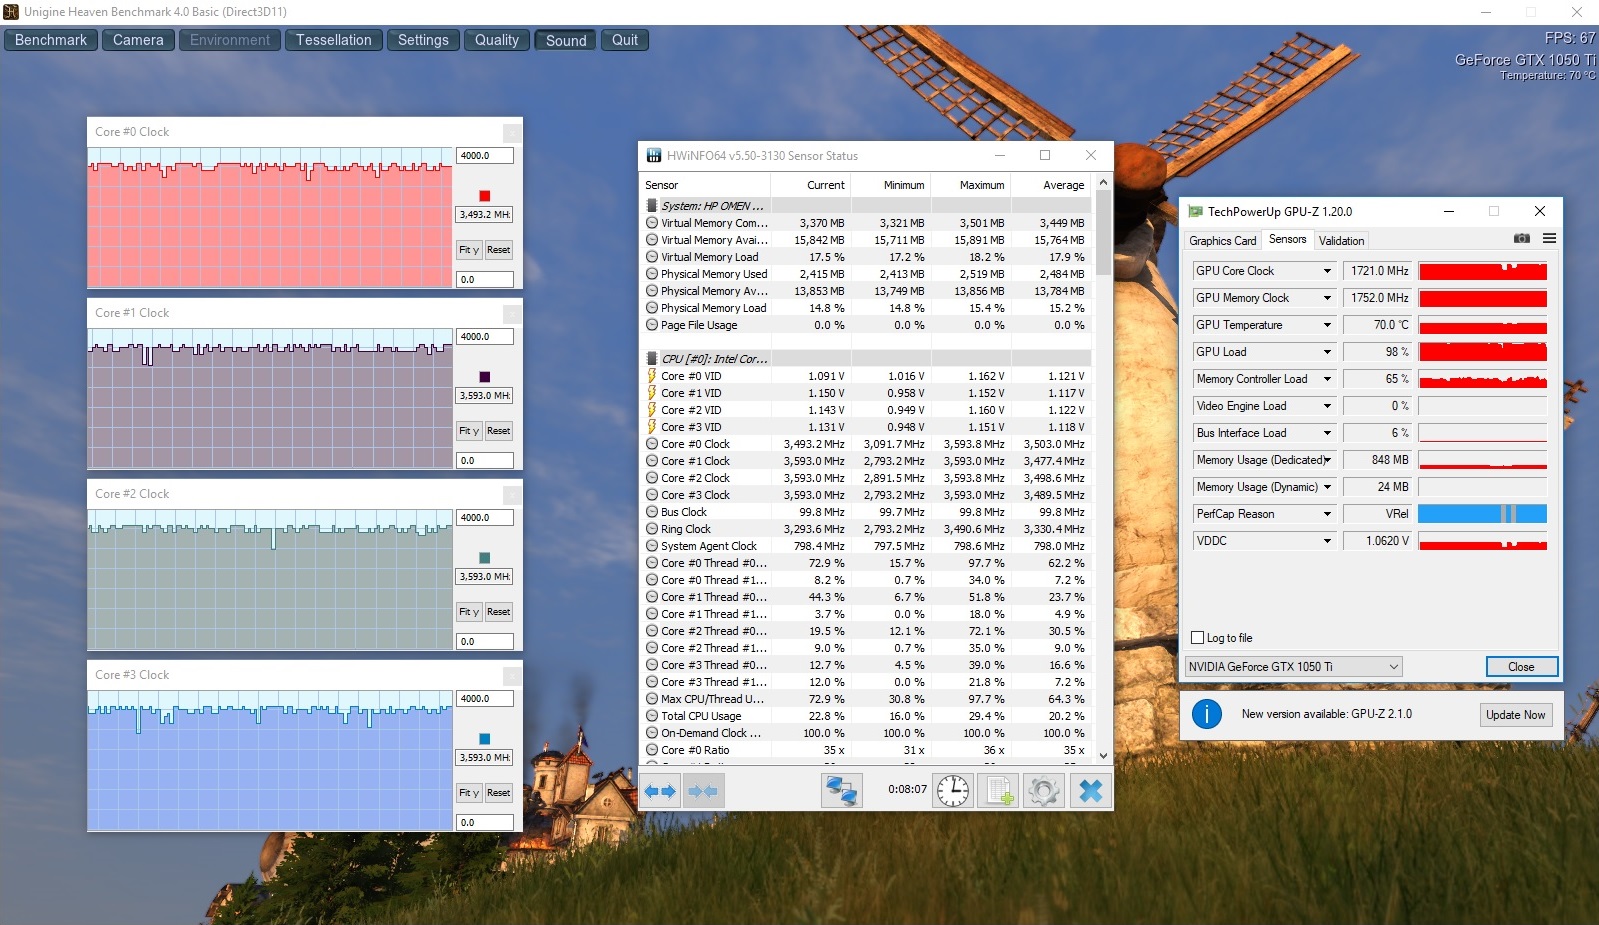
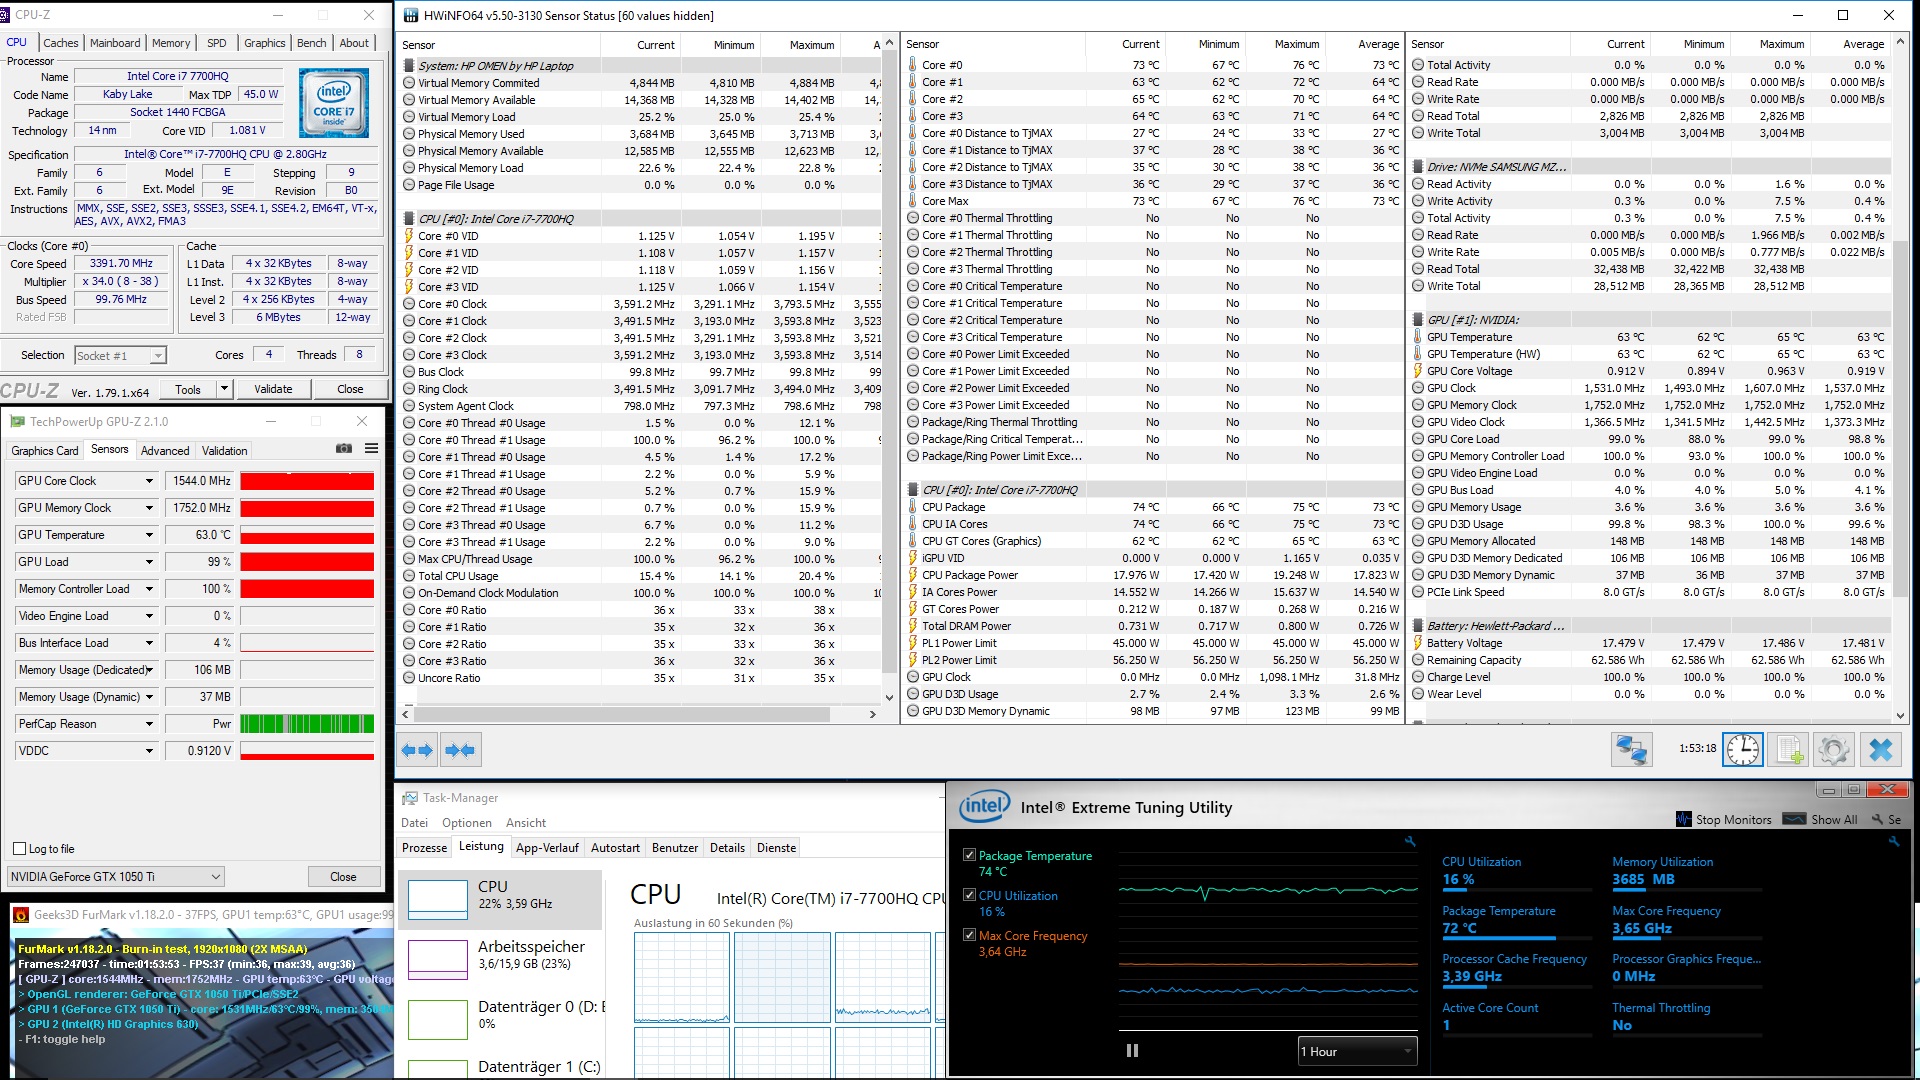
The Nvidia GeForce GTX 1050 Ti is responsible for 3D performance. Switching between the two graphics chips works smoothly without the user having to do anything. The GeForce GTX 1050 Ti is based on Pascal architecture. The graphics chip has a clock rate of 1493 MHz and a Boost rate of 1620 MHz. The GeForce GTX 1050 Ti is equipped with 4 GB of GDDR5 VRAM.
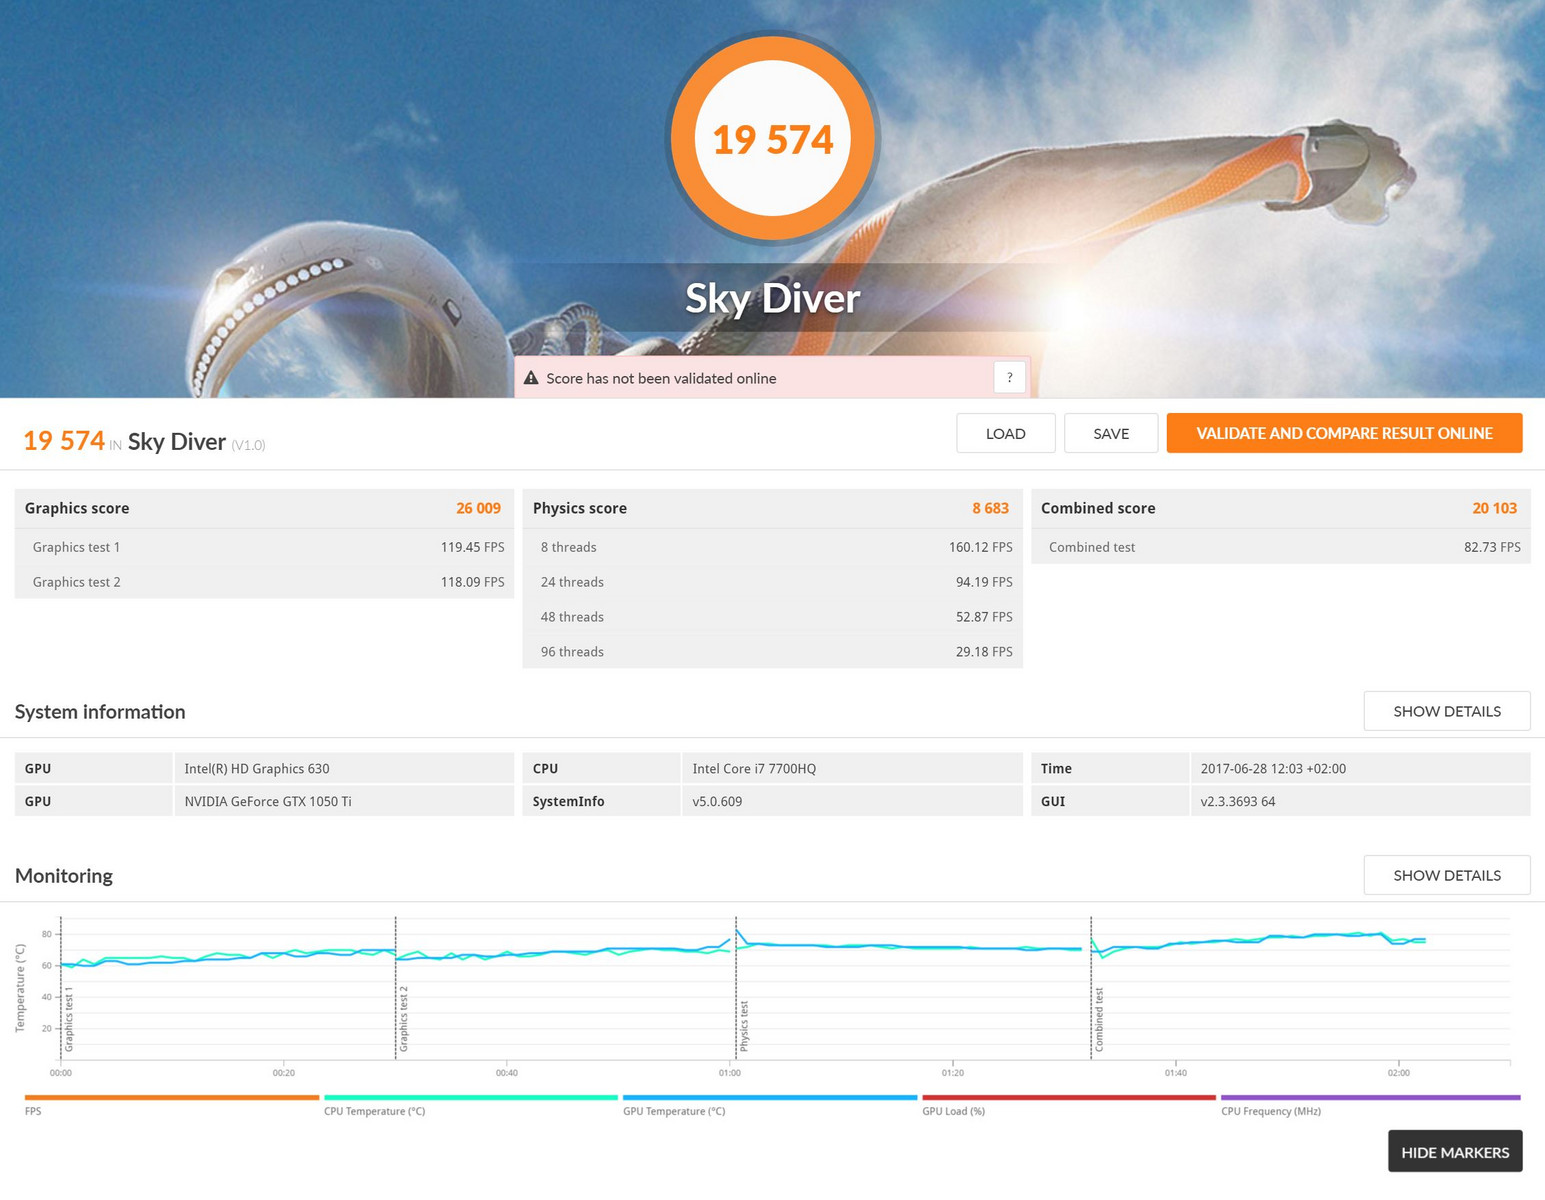
The performance of the Nvidia GeForce GTX 1050 Ti is similar to that of our comparison devices also equipped with an Nvidia GeForce GTX 1050 Ti. Only the Asus FX502VM, equipped with the faster Nvidia GeForce GTX 1060 could offer better performance. Our test device's performance increase lies at 30% compared to its predecessor with the Nvidia GeForce GTX 965M.
You can find more GPU benchmarks here.
| 3DMark | |
| 1280x720 Cloud Gate Standard Graphics | |
| Asus FX502VM-AS73 | |
| Lenovo Legion Y520-15IKBN-80WK001KUS | |
| Dell Inspiron 15 7000 7567 | |
| HP Omen 15-ax213ng | |
| Acer Aspire VX5-591G-75C4 VX15 | |
| HP Omen 15-ax007ng | |
| 1920x1080 Fire Strike Graphics | |
| Asus FX502VM-AS73 | |
| HP Omen 15-ax213ng | |
| Acer Aspire VX5-591G-75C4 VX15 | |
| Lenovo Legion Y520-15IKBN-80WK001KUS | |
| Dell Inspiron 15 7000 7567 | |
| HP Omen 15-ax007ng | |
| 3DMark 11 - 1280x720 Performance GPU | |
| Asus FX502VM-AS73 | |
| HP Omen 15-ax213ng | |
| Acer Aspire VX5-591G-75C4 VX15 | |
| Dell Inspiron 15 7000 7567 | |
| HP Omen 15-ax007ng | |
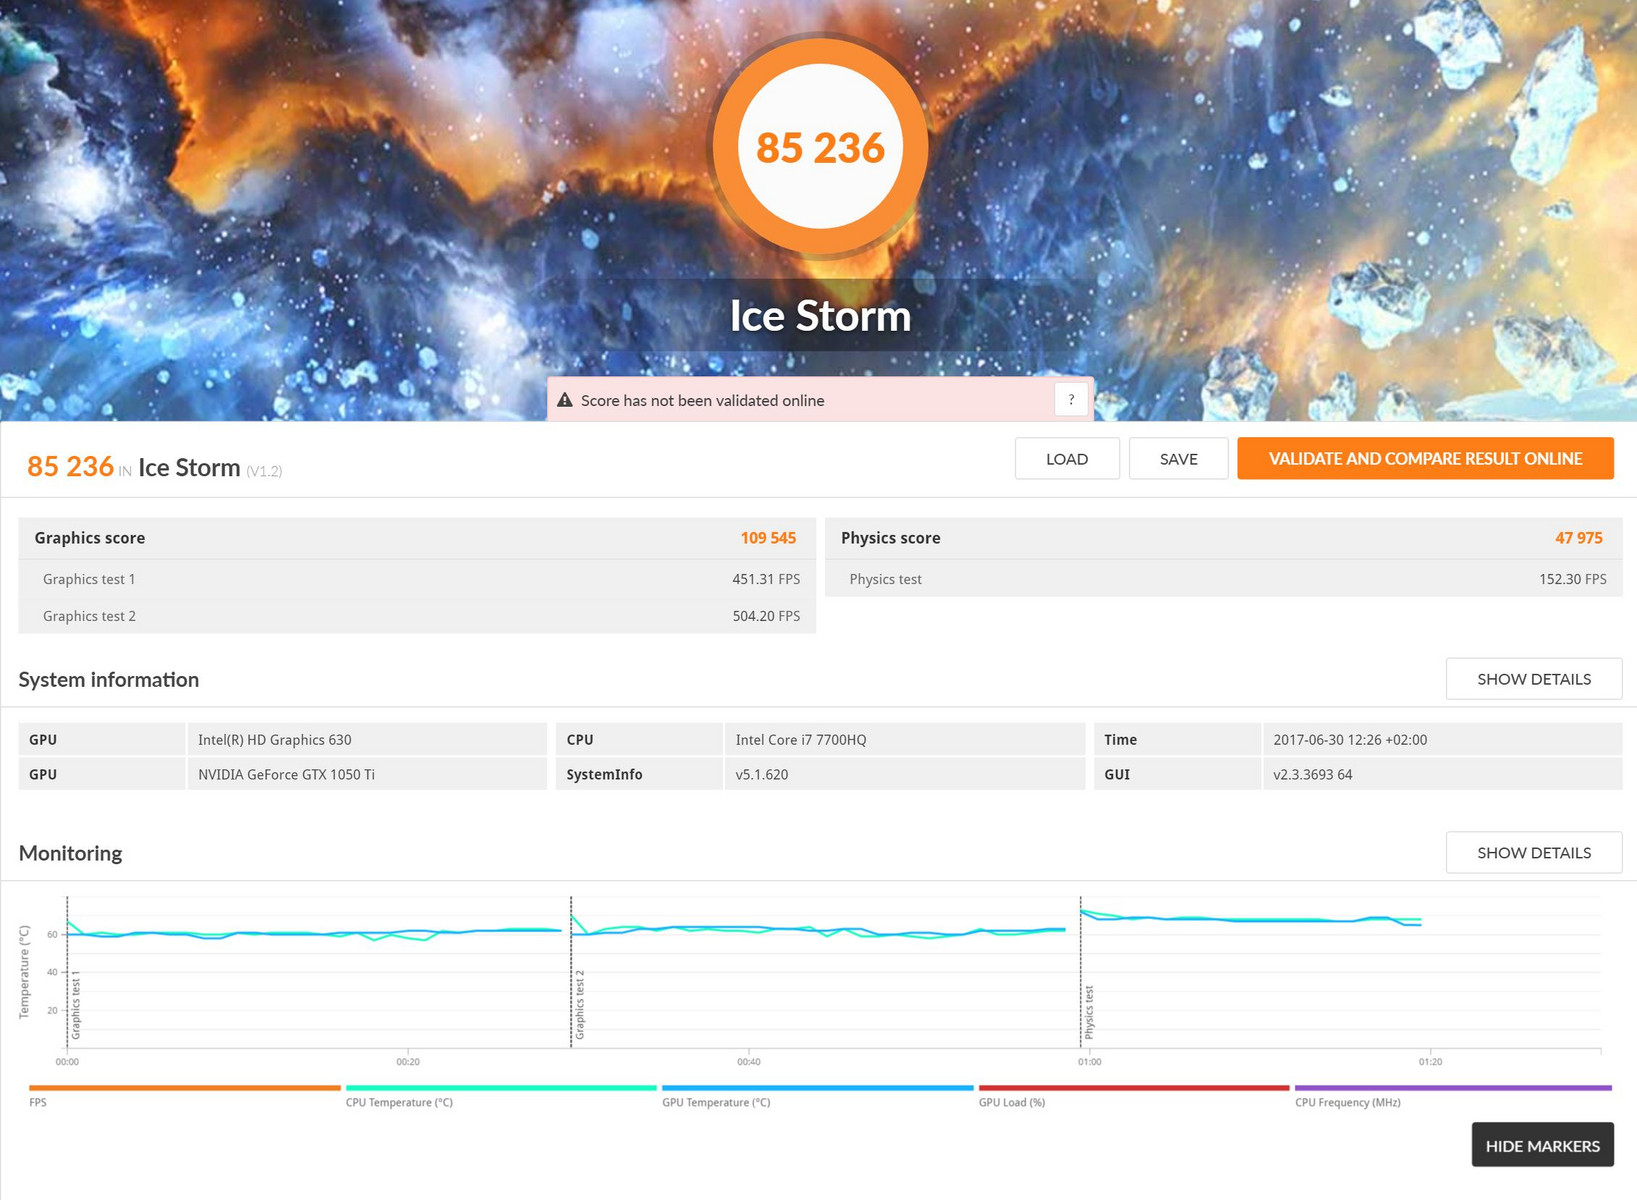
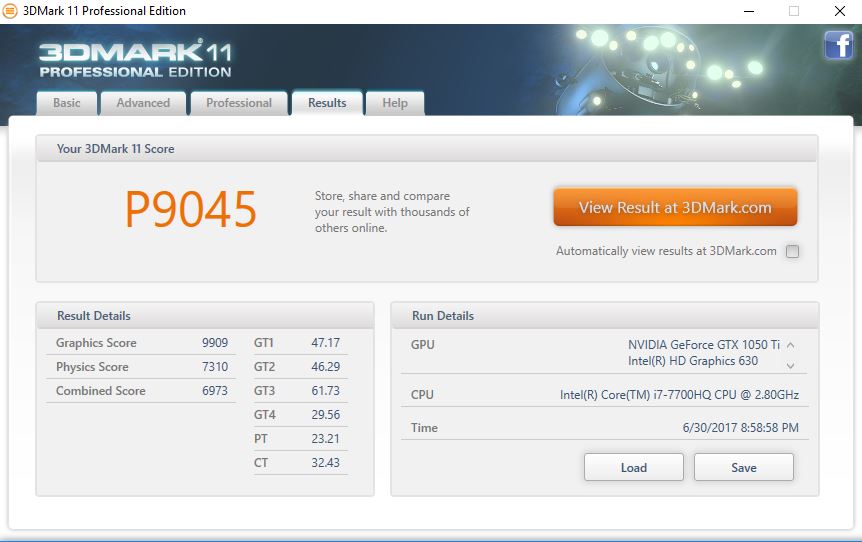
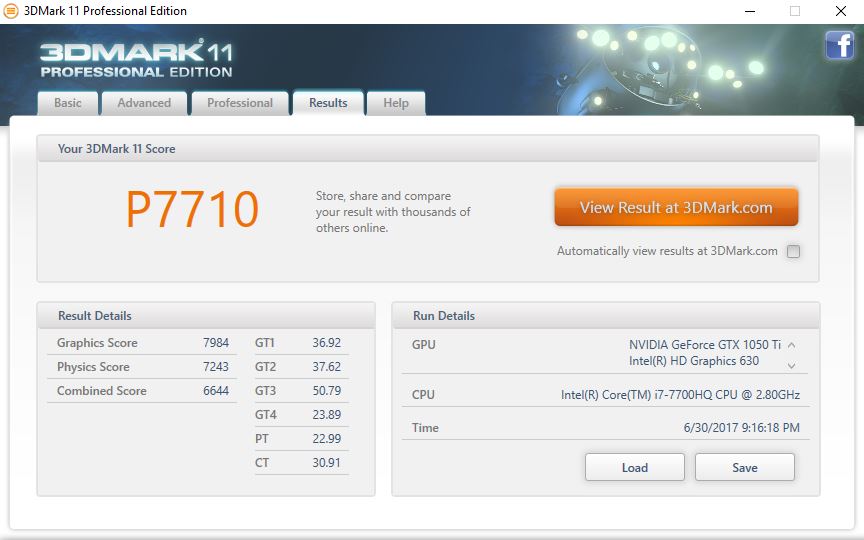
| 3DMark 11 Performance | 9045 points | |
| 3DMark Ice Storm Standard Score | 85236 points | |
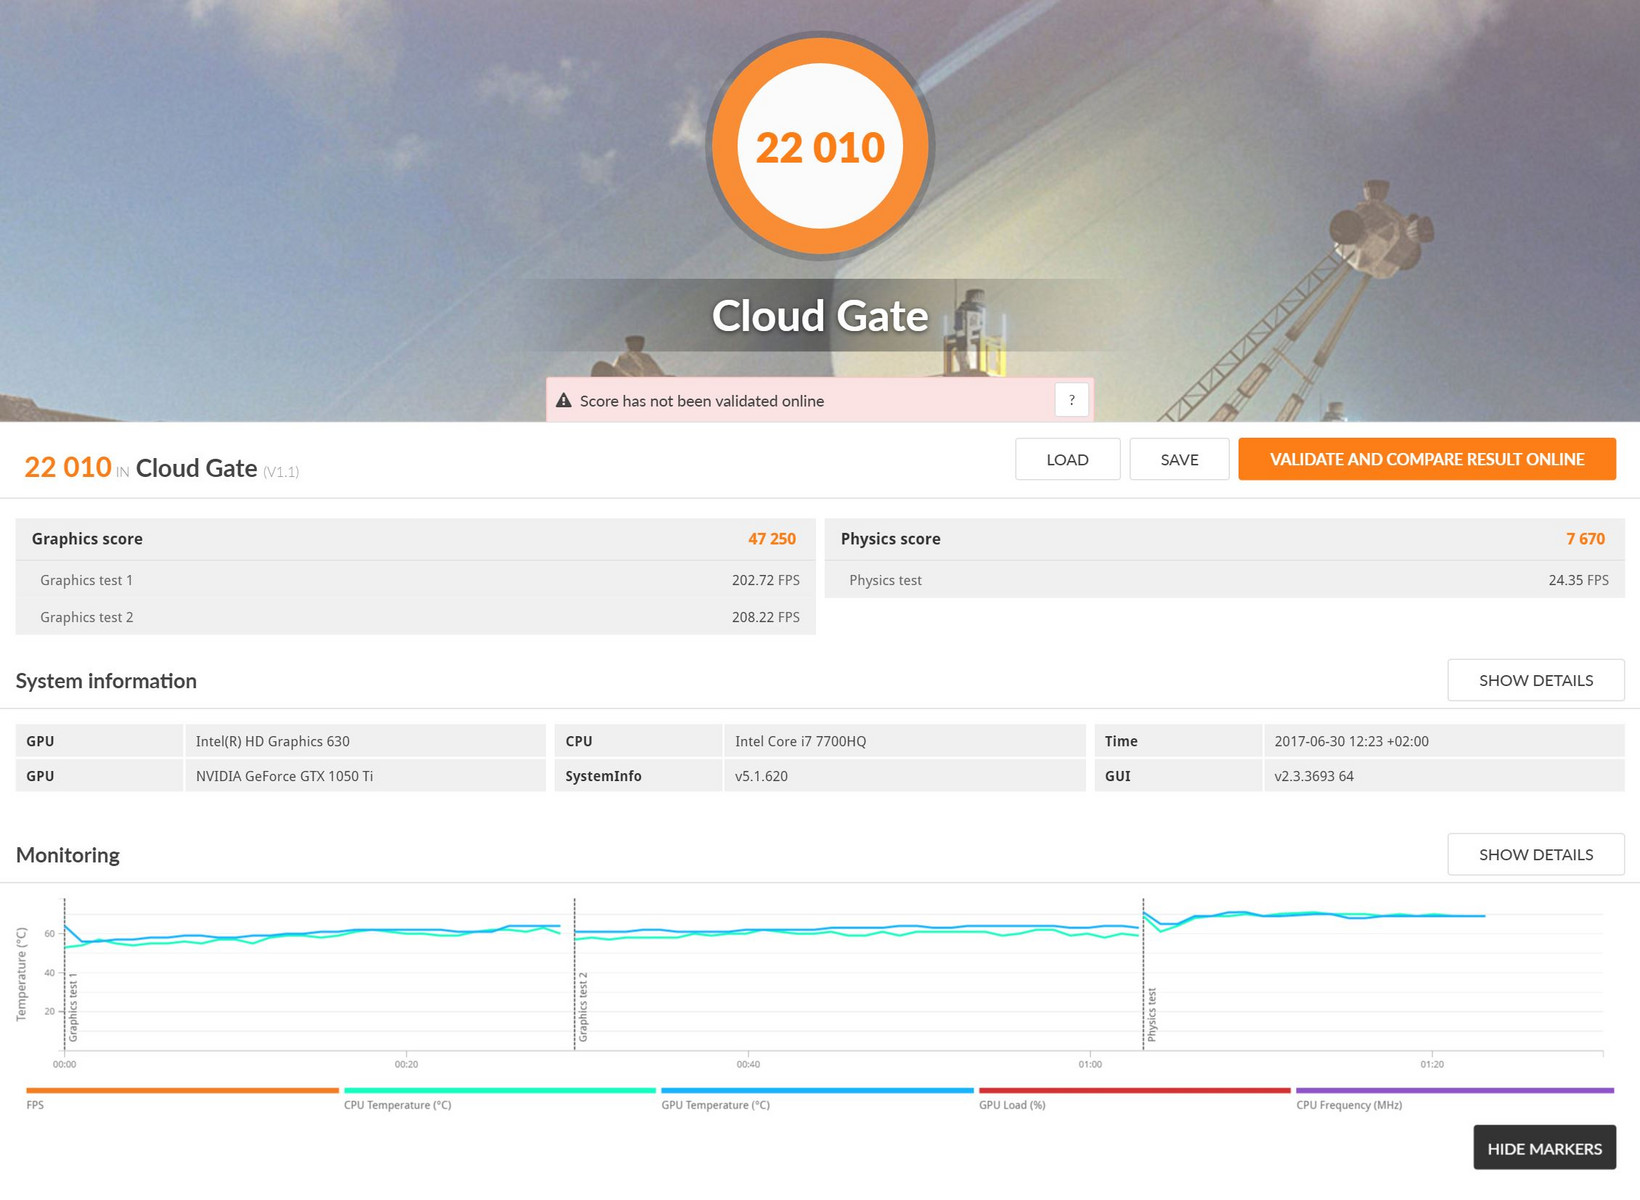
| 3DMark Cloud Gate Standard Score | 22010 points | |
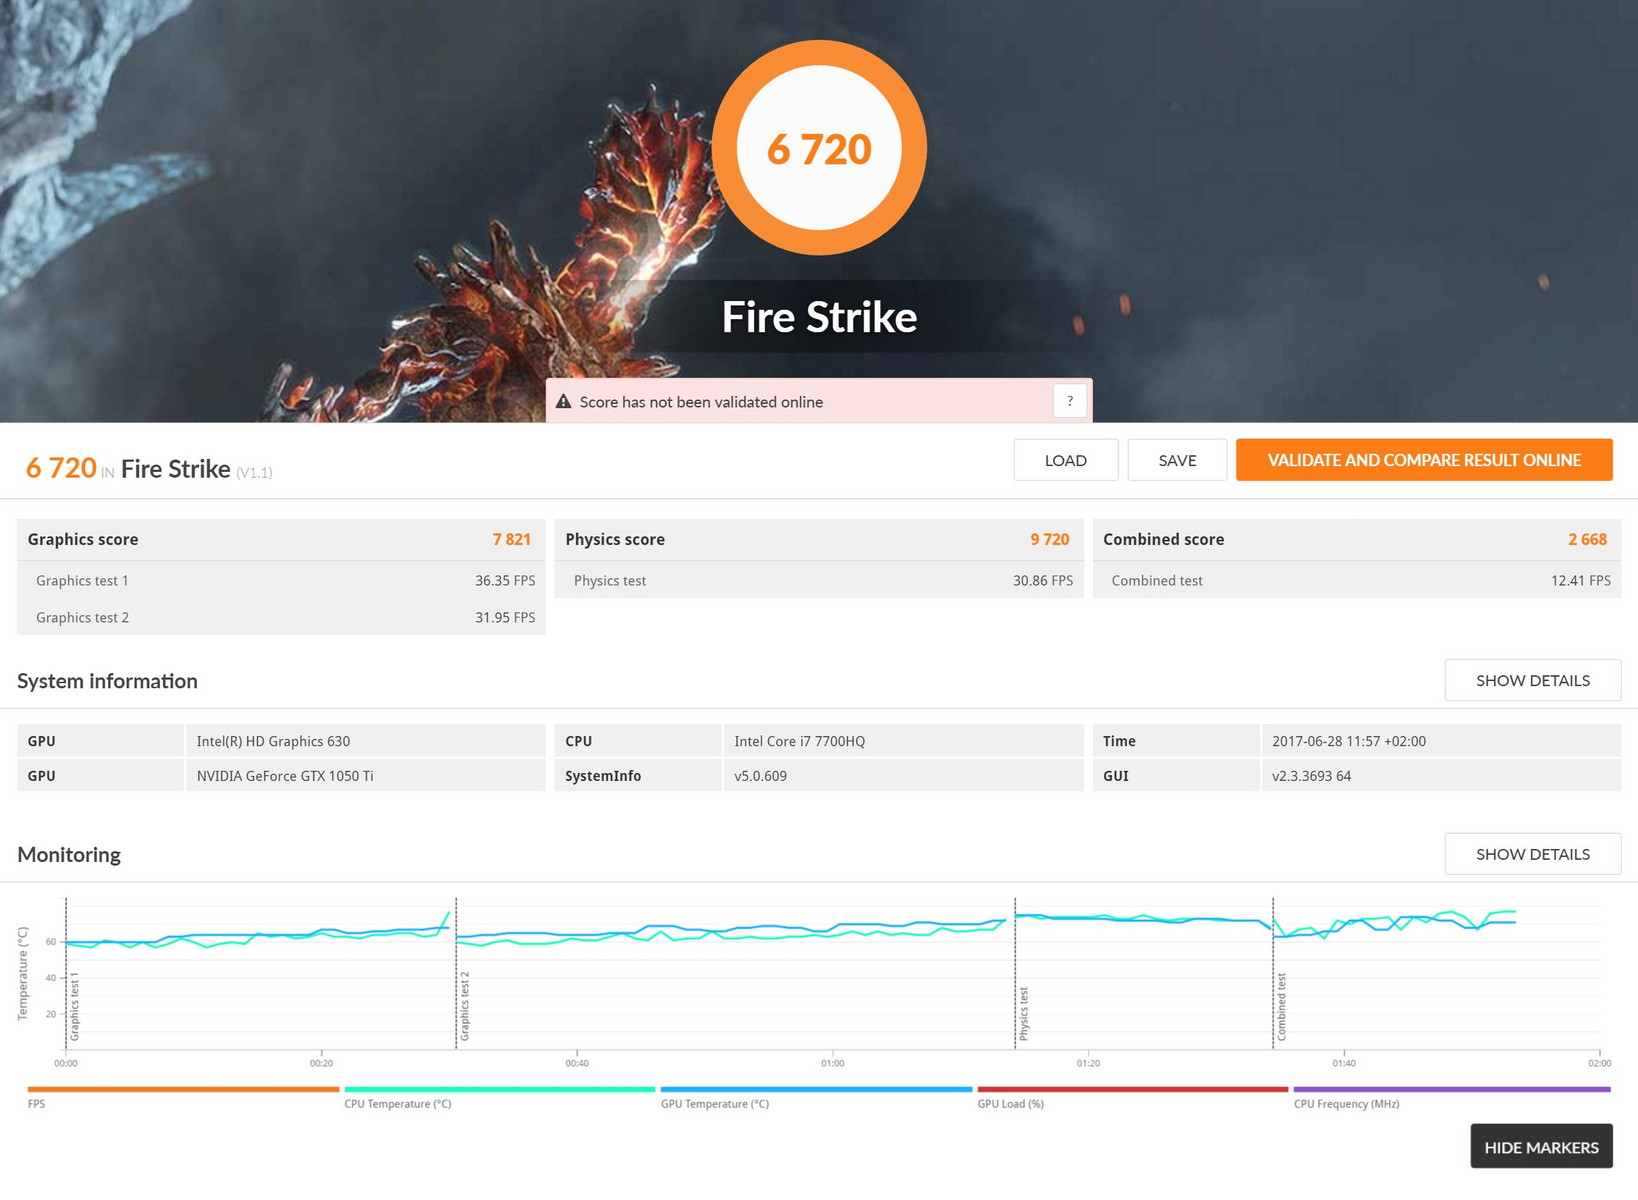
| 3DMark Fire Strike Score | 6720 points | |
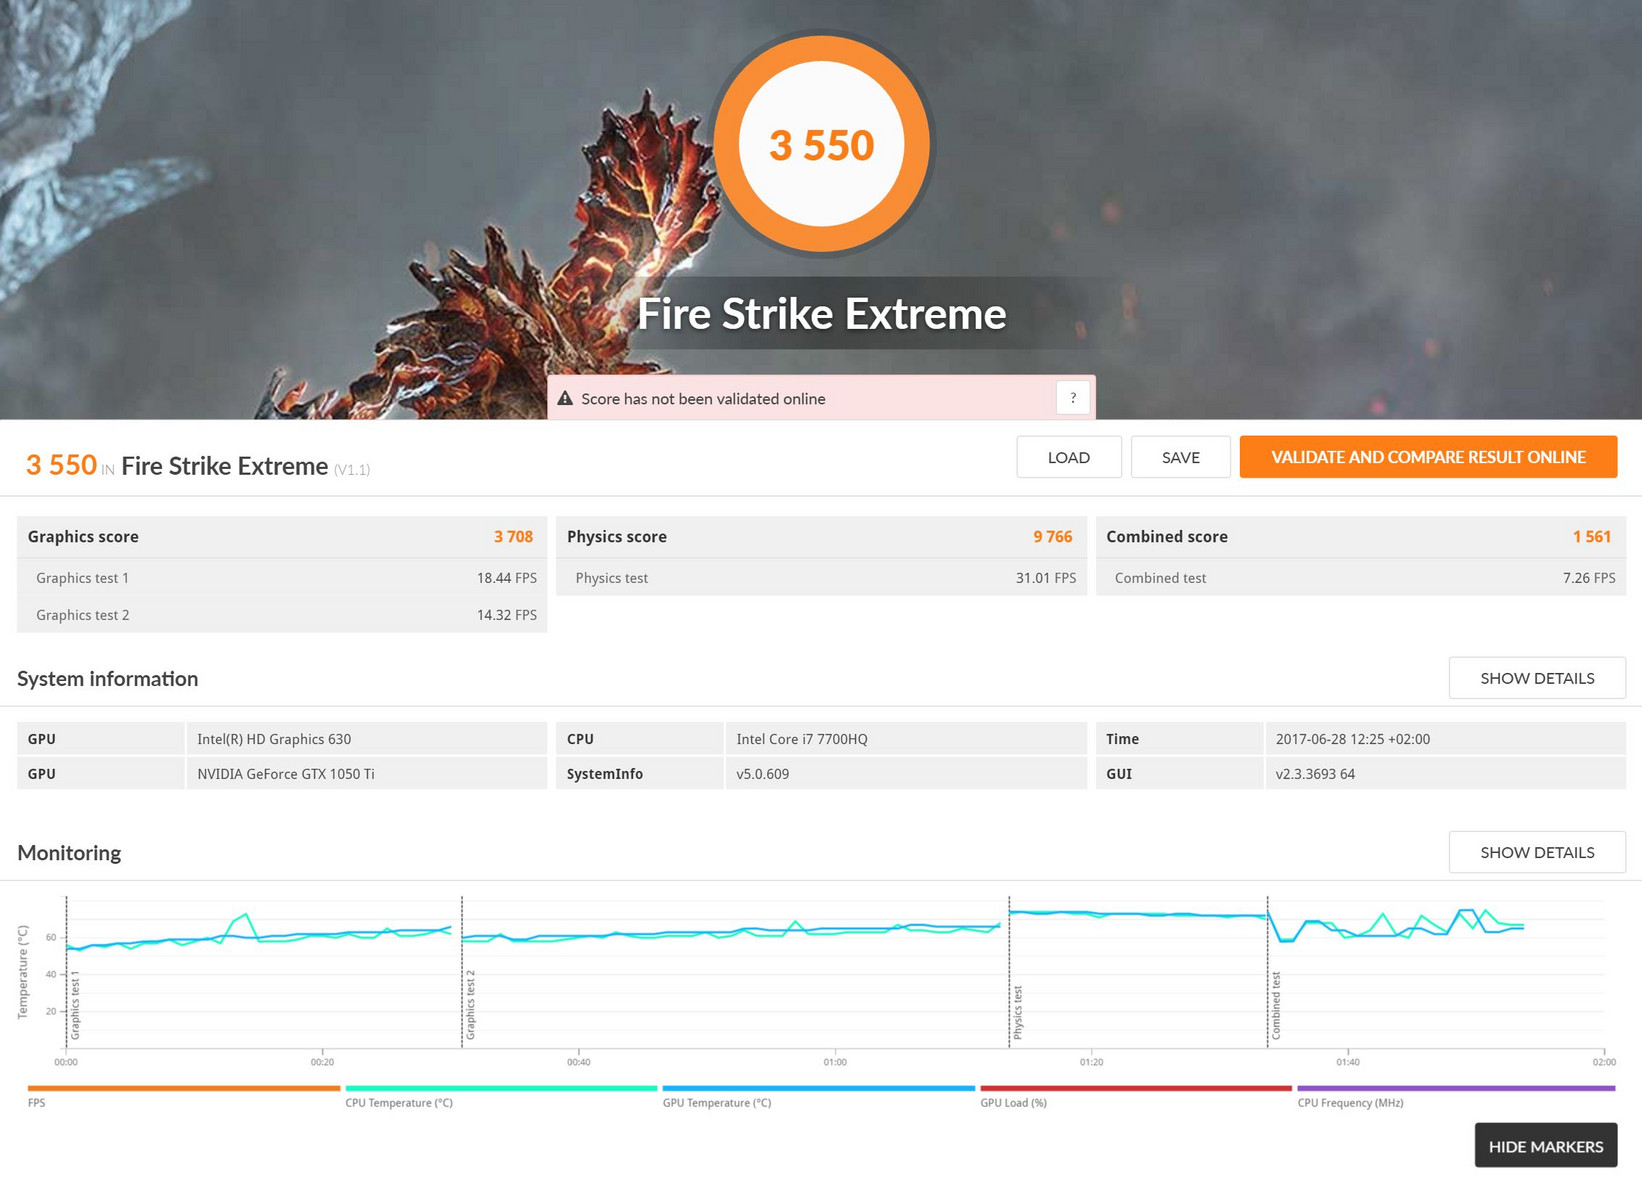
| 3DMark Fire Strike Extreme Score | 3550 points | |
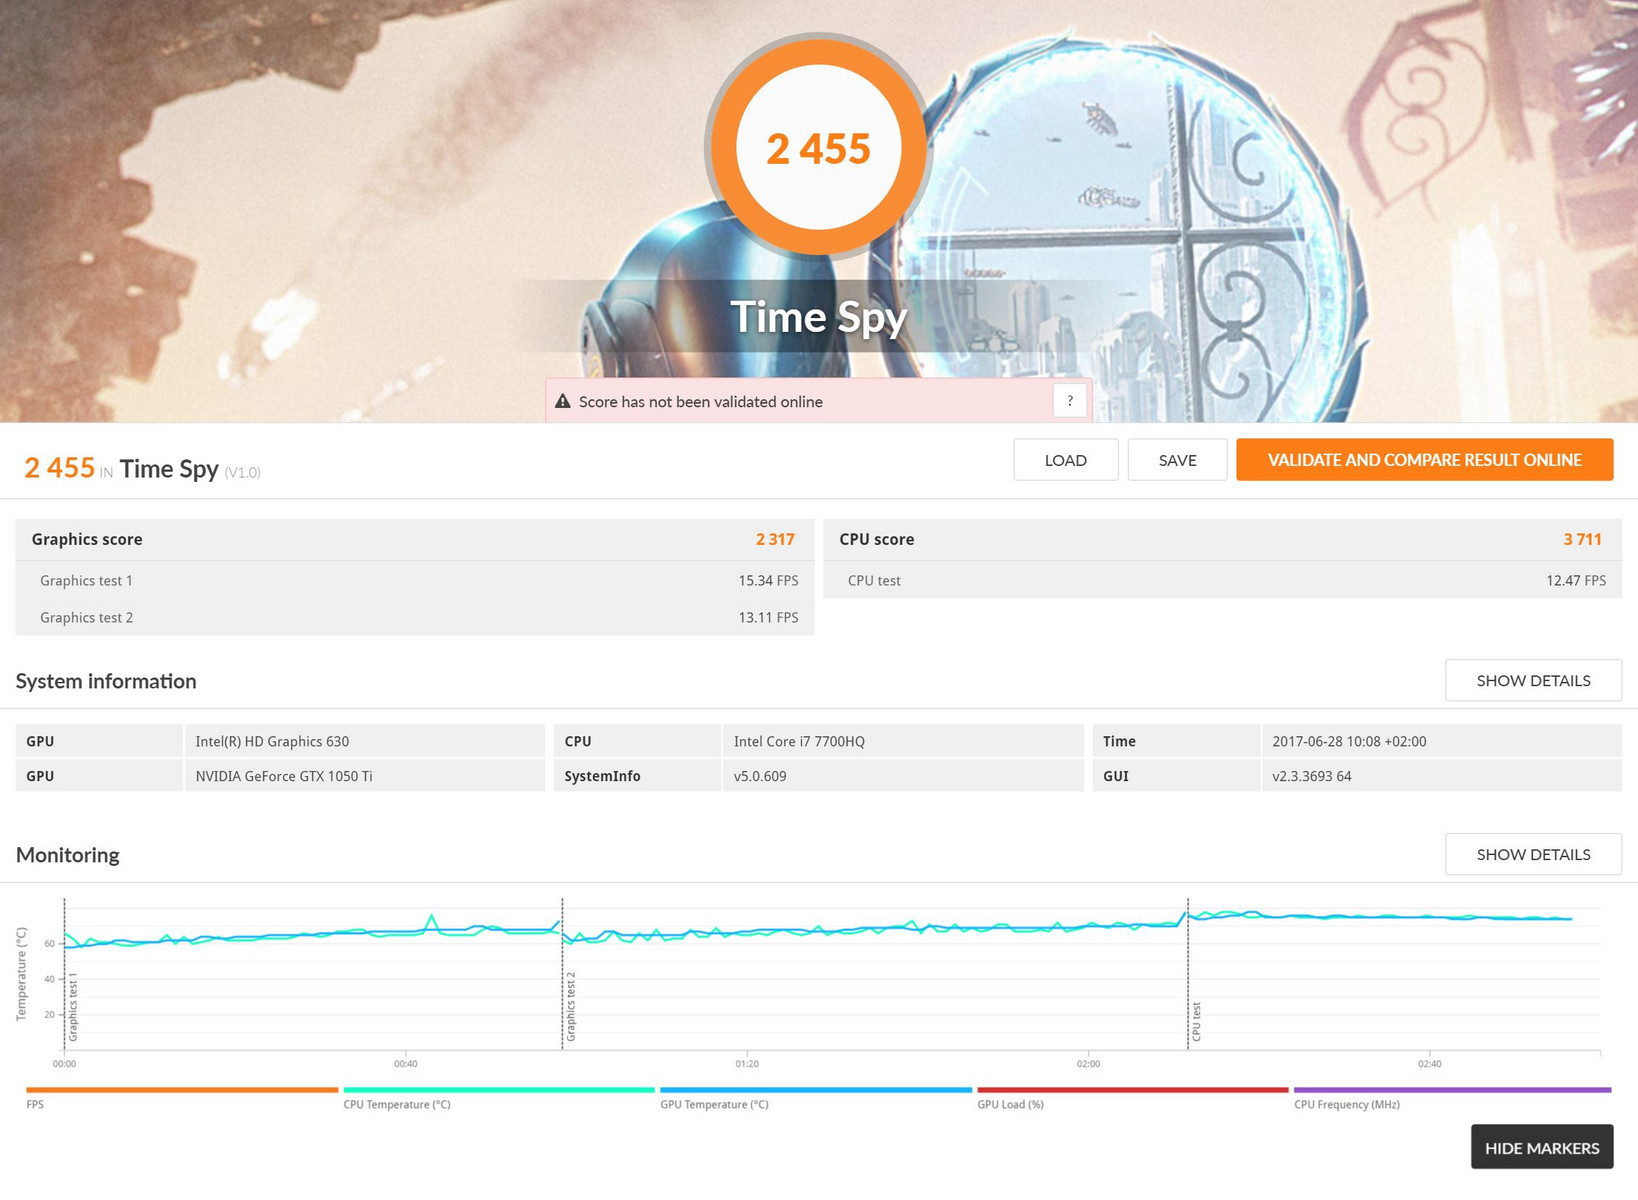
| 3DMark Time Spy Score | 2455 points | |
Help | ||
Gaming Performance
The performance of the Nvidia GeForce GTX 1050 Ti is good enough to play most demanding games smoothly in maximum detail. Very demanding games such as "The Witcher 3" or "Rise of the Tomb Raider" do bring the Nvidia GeForce GTX 1050 Ti to its limits, however. We would recommend choosing the predefined setting "high" for unrestricted gaming fun. Nonetheless, the HP Omen 15t (2017) offers good, reliable performance, which is particularly suited for casual gamers.
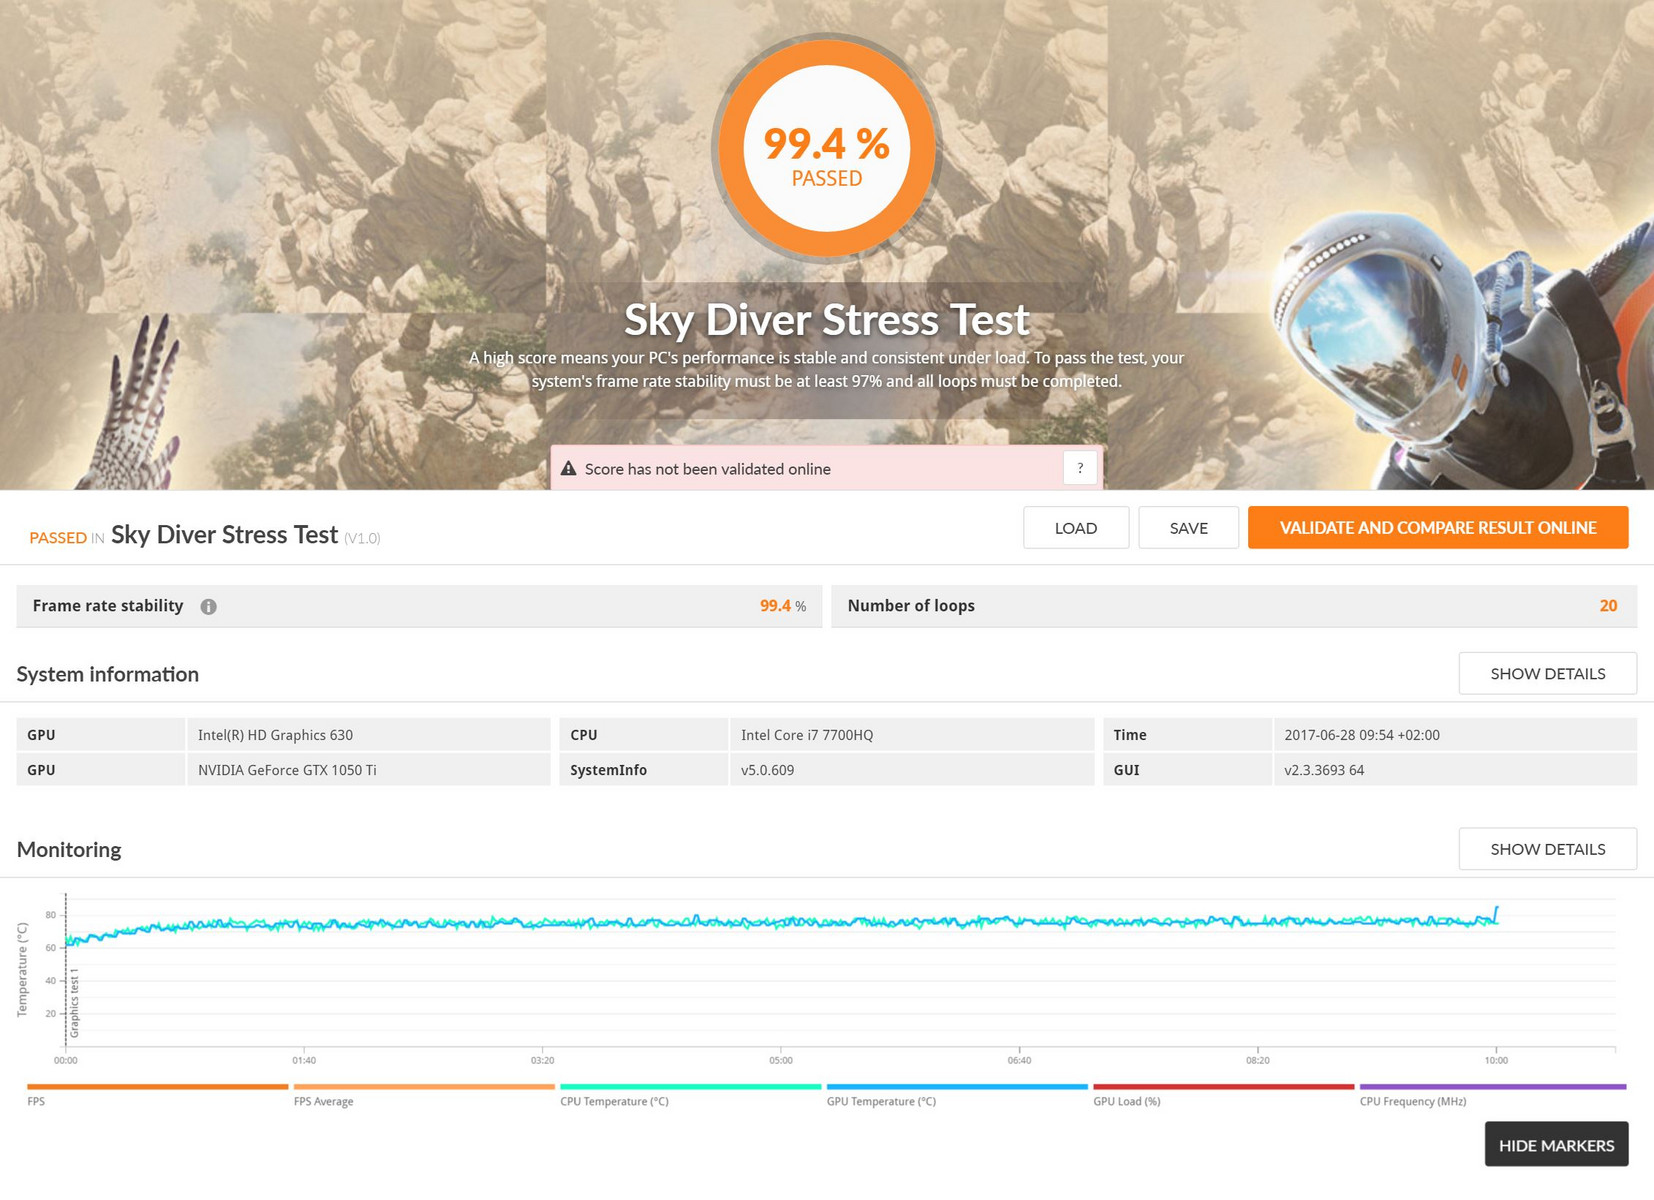
The Nvidia GeForce GTX 1050 Ti manages to offer steady performance levels, even during long sessions. Under maximum load the frame rate dropped from 26-27 fps to 24-25 fps (The Witcher 3 Ultra).
| low | med. | high | ultra | |
|---|---|---|---|---|
| BioShock Infinite (2013) | 216 | 176.8 | 163.4 | 70.7 |
| Battlefield 4 (2013) | 180.2 | 176.4 | 146 | 71.3 |
| The Witcher 3 (2015) | 128.1 | 86.2 | 48.3 | 26.6 |
| Rise of the Tomb Raider (2016) | 115.4 | 68.2 | 38.9 | 32.5 |
Emissions
System Noise
The cooling fans of the HP Omen 15t (2017) are in constant use. The fan runs even when the device is idle and makes a quiet noise between 32 and 34 dB(A). We measured a maximum of 51 dB(A) during our stress test. This makes the HP Omen 15t (2017) a little louder than its predecessor; its system noise is only topped by the Asus FX502VM with 52.3 dB(A).
Noise level
| Idle |
| 32 / 34 / 36 dB(A) |
| HDD |
| 34 dB(A) |
| Load |
| 48 / 51 dB(A) |
 | ||
30 dB silent 40 dB(A) audible 50 dB(A) loud |
||
min: | ||
| HP Omen 15-ax213ng GeForce GTX 1050 Ti Mobile, i7-7700HQ | HP Omen 15-ax007ng GeForce GTX 965M, 6700HQ | Acer Aspire VX5-591G-75C4 VX15 GeForce GTX 1050 Ti Mobile, i7-7700HQ | Dell Inspiron 15 7000 7567 GeForce GTX 1050 Ti Mobile, i7-7700HQ | Lenovo Legion Y520-15IKBN-80WK001KUS GeForce GTX 1050 Ti Mobile, i7-7700HQ | Asus FX502VM-AS73 GeForce GTX 1060 Mobile, i7-7700HQ | MSI GS63VR 7RF-228US GeForce GTX 1060 Mobile, i7-7700HQ | |
|---|---|---|---|---|---|---|---|
| Noise | 3% | 11% | 6% | 13% | 6% | 7% | |
| off / environment * (dB) | 30 | 30 -0% | 30.4 -1% | 30.3 -1% | 27.7 8% | 28.7 4% | 28.8 4% |
| Idle Minimum * (dB) | 32 | 32 -0% | 31.4 2% | 30.9 3% | 30.5 5% | 30.6 4% | 33.1 -3% |
| Idle Average * (dB) | 34 | 33 3% | 31.4 8% | 30.9 9% | 30.5 10% | 30.6 10% | 33.1 3% |
| Idle Maximum * (dB) | 36 | 36 -0% | 31.4 13% | 31 14% | 30.6 15% | 31 14% | 34 6% |
| Load Average * (dB) | 48 | 43 10% | 36.8 23% | 46.5 3% | 40 17% | 46.2 4% | 37.2 22% |
| Witcher 3 ultra * (dB) | 49 | 40 18% | 46.1 6% | ||||
| Load Maximum * (dB) | 51 | 49 4% | 41.3 19% | 46.8 8% | 42.6 16% | 52.3 -3% | 47.1 8% |
* ... smaller is better
Temperature

The temperatures of our test unit are similar to those of its predecessor. The device reaches a maximum of 54 °C (~129 °F) on the bottom of the base unit, so it is not suitable to gaming sessions on your lap. The case remains rather cool while idling with a maximum temperature of 30 °C (86 °F) (top).
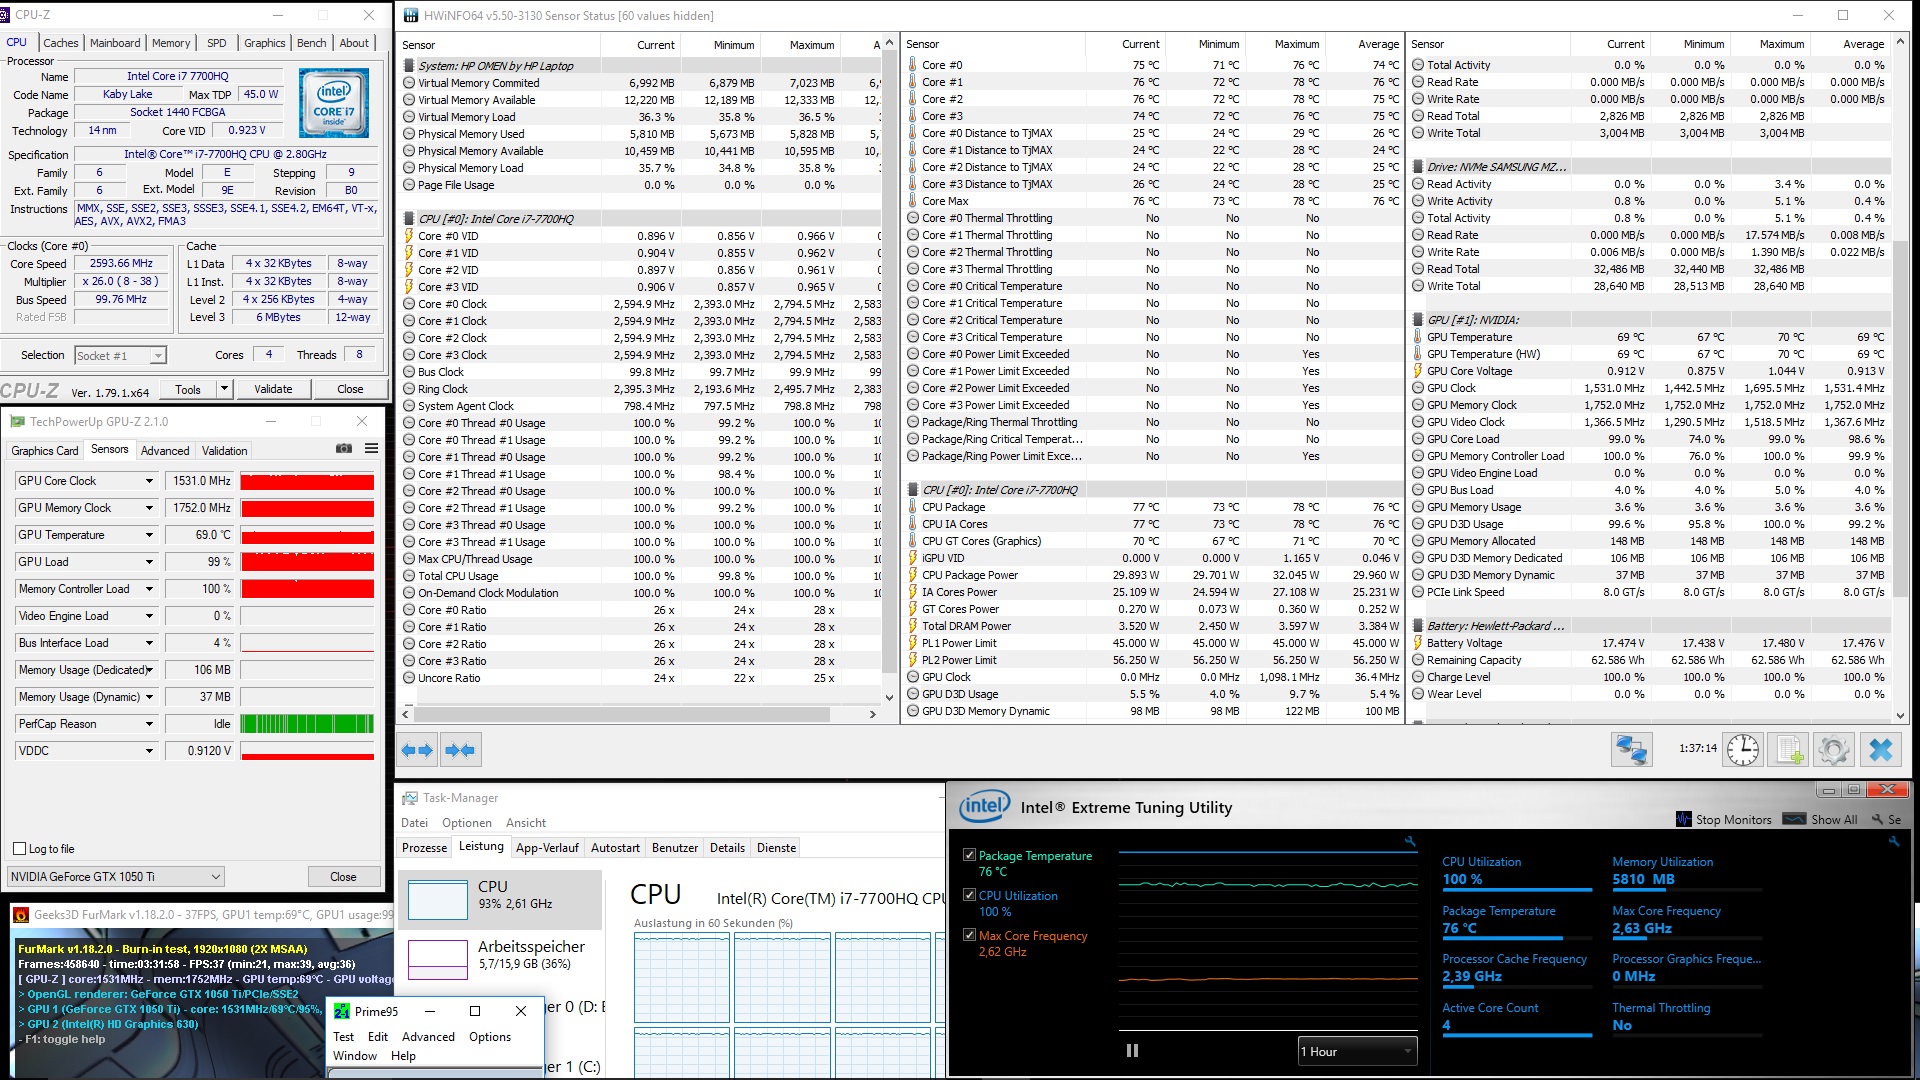
The processor heated up to a maximum of 84 °C (~183 °F) during our stress test. The graphics card reached a maximum temperature of 76 °C (~169 °F). We ran the 3DMark 11 again right after the stress test, but noticed no drop in performance.
| HP Omen 15-ax213ng GeForce GTX 1050 Ti Mobile, i7-7700HQ | HP Omen 15-ax007ng GeForce GTX 965M, 6700HQ | Acer Aspire VX5-591G-75C4 VX15 GeForce GTX 1050 Ti Mobile, i7-7700HQ | Dell Inspiron 15 7000 7567 GeForce GTX 1050 Ti Mobile, i7-7700HQ | Lenovo Legion Y520-15IKBN-80WK001KUS GeForce GTX 1050 Ti Mobile, i7-7700HQ | Asus FX502VM-AS73 GeForce GTX 1060 Mobile, i7-7700HQ | MSI GS63VR 7RF-228US GeForce GTX 1060 Mobile, i7-7700HQ | |
|---|---|---|---|---|---|---|---|
| Heat | 3% | 9% | 21% | 4% | -3% | 1% | |
| Maximum Upper Side * (°C) | 52.4 | 48.5 7% | 47 10% | 43.4 17% | 46.8 11% | 53.2 -2% | |
| Maximum Bottom * (°C) | 54.2 | 59 -9% | 47 13% | 37.7 30% | 55.8 -3% | 56.8 -5% | |
| Idle Upper Side * (°C) | 30.5 | 28.7 6% | 28.4 7% | 24.3 20% | 27.6 10% | 28.8 6% | 28.4 7% |
| Idle Bottom * (°C) | 28.2 | 25.7 9% | 27.1 4% | 23.6 16% | 28.4 -1% | 31.4 -11% | 29.6 -5% |
* ... smaller is better
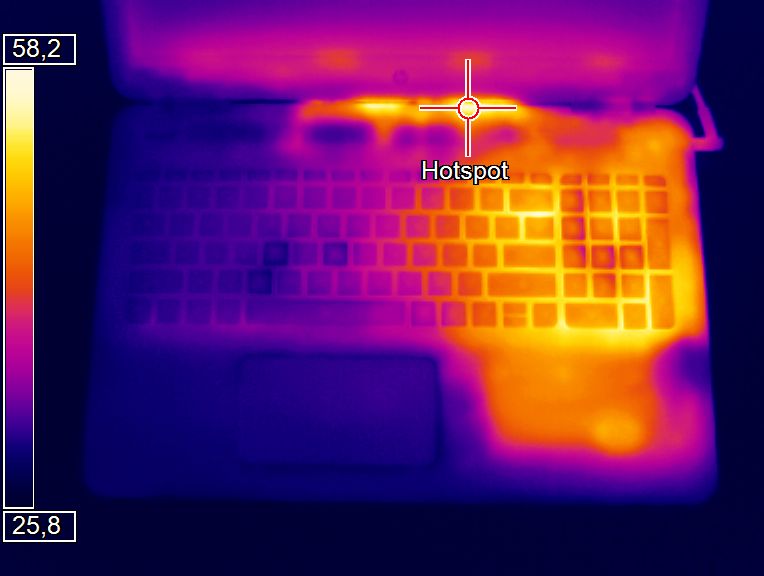
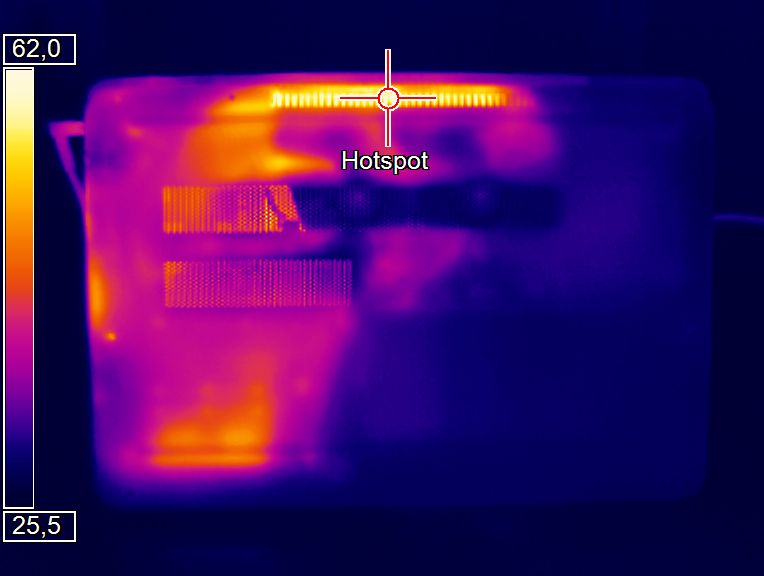
(-) The maximum temperature on the upper side is 52.4 °C / 126 F, compared to the average of 36.8 °C / 98 F, ranging from 21 to 71 °C for the class Multimedia.
(-) The bottom heats up to a maximum of 54.2 °C / 130 F, compared to the average of 39.1 °C / 102 F
(+) In idle usage, the average temperature for the upper side is 28.5 °C / 83 F, compared to the device average of 31.3 °C / 88 F.
(-) Playing The Witcher 3, the average temperature for the upper side is 38.9 °C / 102 F, compared to the device average of 31.3 °C / 88 F.
(-) The palmrests and touchpad can get very hot to the touch with a maximum of 45.4 °C / 113.7 F.
(-) The average temperature of the palmrest area of similar devices was 28.7 °C / 83.7 F (-16.7 °C / -30 F).
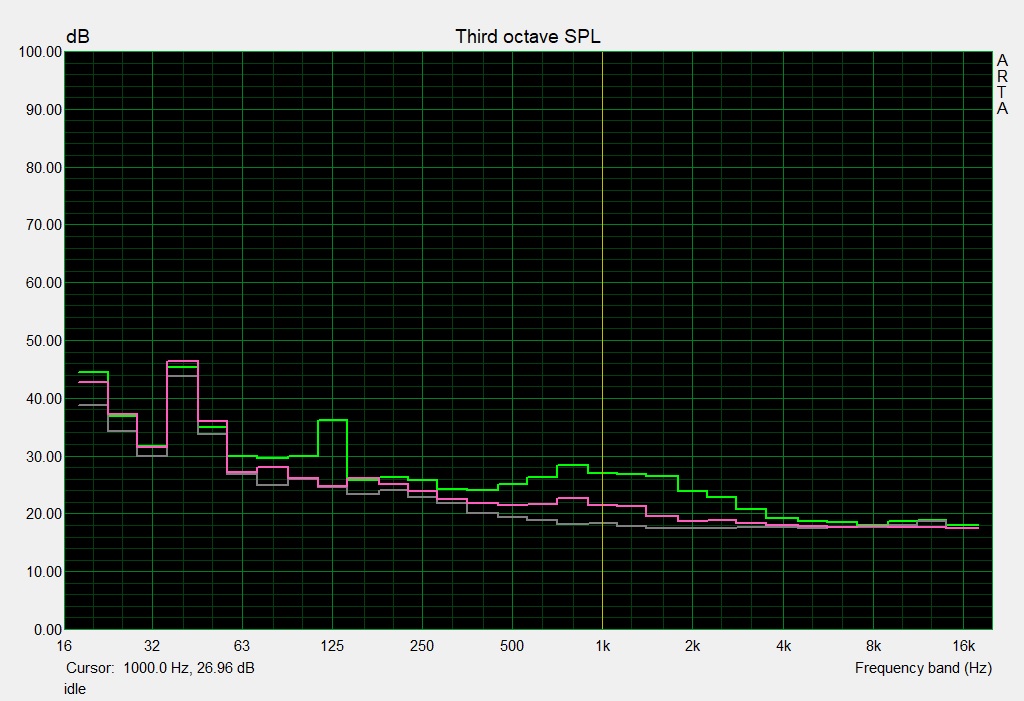
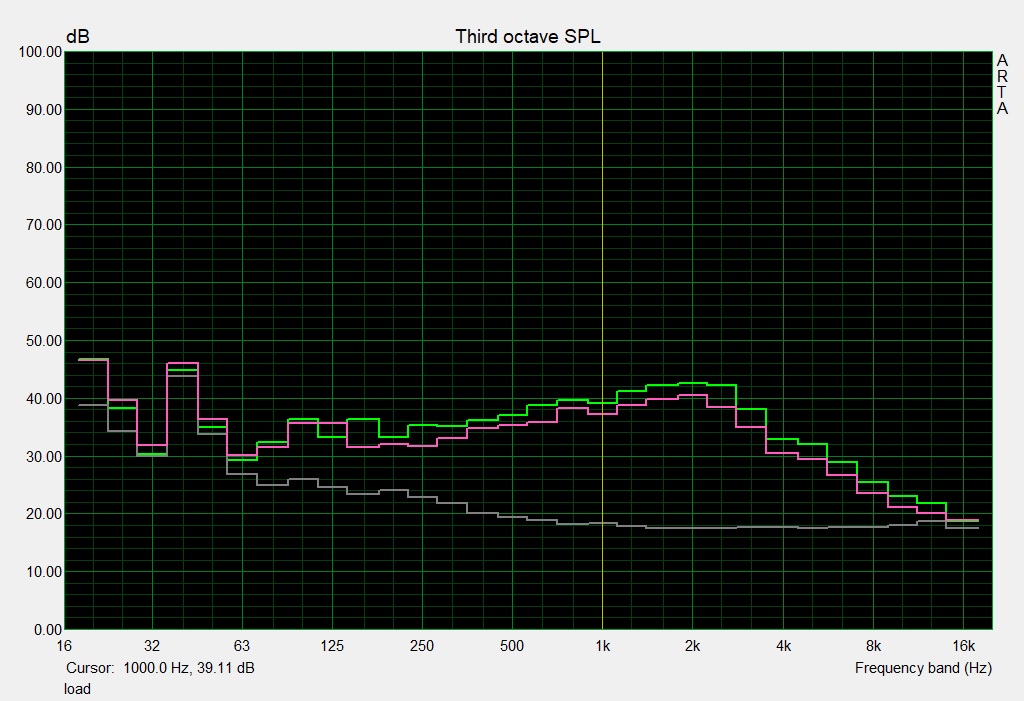
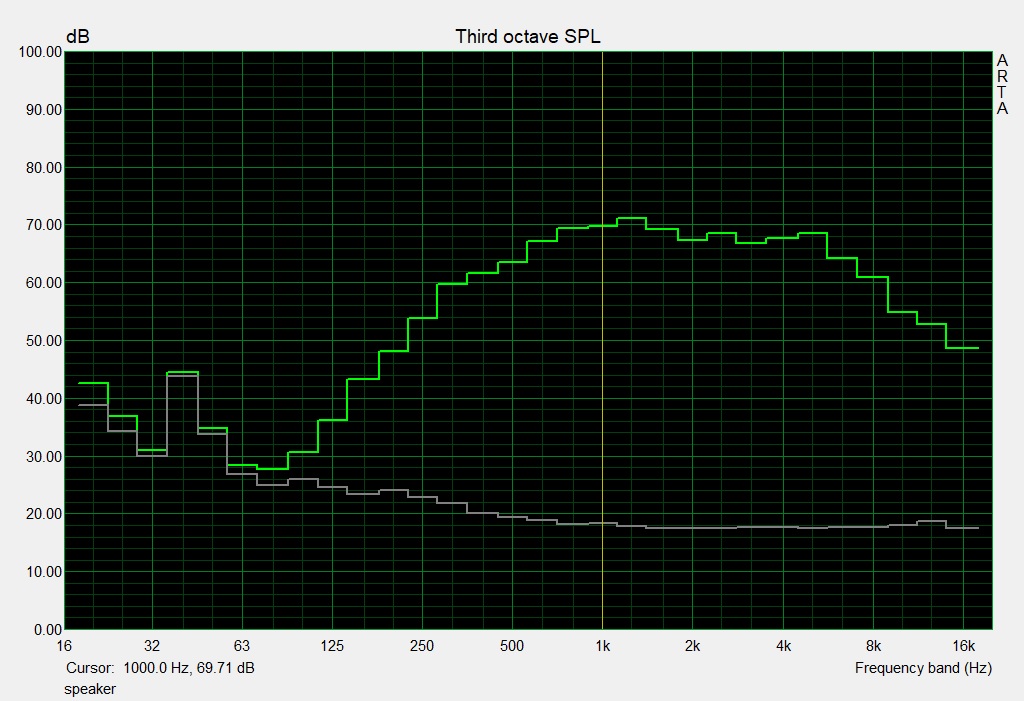
Speakers
There have been no changes to last year's Bang and Olufsen sound system. Naturally, this also means that it still has all the advantages and disadvantages of the previous model. There is a clear lack of bass, and high and mid-range frequencies are very strong. We would recommend using good headphones or external speakers for better sound quality.
HP Omen 15-ax213ng audio analysis
(±) | speaker loudness is average but good (80 dB)
Bass 100 - 315 Hz
(-) | nearly no bass - on average 18.2% lower than median
(±) | linearity of bass is average (11.8% delta to prev. frequency)
Mids 400 - 2000 Hz
(+) | balanced mids - only 4.3% away from median
(+) | mids are linear (4.2% delta to prev. frequency)
Highs 2 - 16 kHz
(+) | balanced highs - only 4.2% away from median
(+) | highs are linear (5.8% delta to prev. frequency)
Overall 100 - 16.000 Hz
(±) | linearity of overall sound is average (20.6% difference to median)
Compared to same class
» 70% of all tested devices in this class were better, 8% similar, 22% worse
» The best had a delta of 5%, average was 17%, worst was 45%
Compared to all devices tested
» 55% of all tested devices were better, 8% similar, 37% worse
» The best had a delta of 4%, average was 23%, worst was 134%
MSI GS63VR 7RF-228US audio analysis
(±) | speaker loudness is average but good (75 dB)
Bass 100 - 315 Hz
(-) | nearly no bass - on average 25.3% lower than median
(±) | linearity of bass is average (12.4% delta to prev. frequency)
Mids 400 - 2000 Hz
(+) | balanced mids - only 3.3% away from median
(±) | linearity of mids is average (7% delta to prev. frequency)
Highs 2 - 16 kHz
(±) | higher highs - on average 8.1% higher than median
(±) | linearity of highs is average (8.6% delta to prev. frequency)
Overall 100 - 16.000 Hz
(±) | linearity of overall sound is average (28.4% difference to median)
Compared to same class
» 94% of all tested devices in this class were better, 1% similar, 4% worse
» The best had a delta of 6%, average was 18%, worst was 132%
Compared to all devices tested
» 86% of all tested devices were better, 3% similar, 12% worse
» The best had a delta of 4%, average was 23%, worst was 134%
Frequency diagram in comparison (checkboxes above can be turned on/off)
Energy Management
Power Consumption
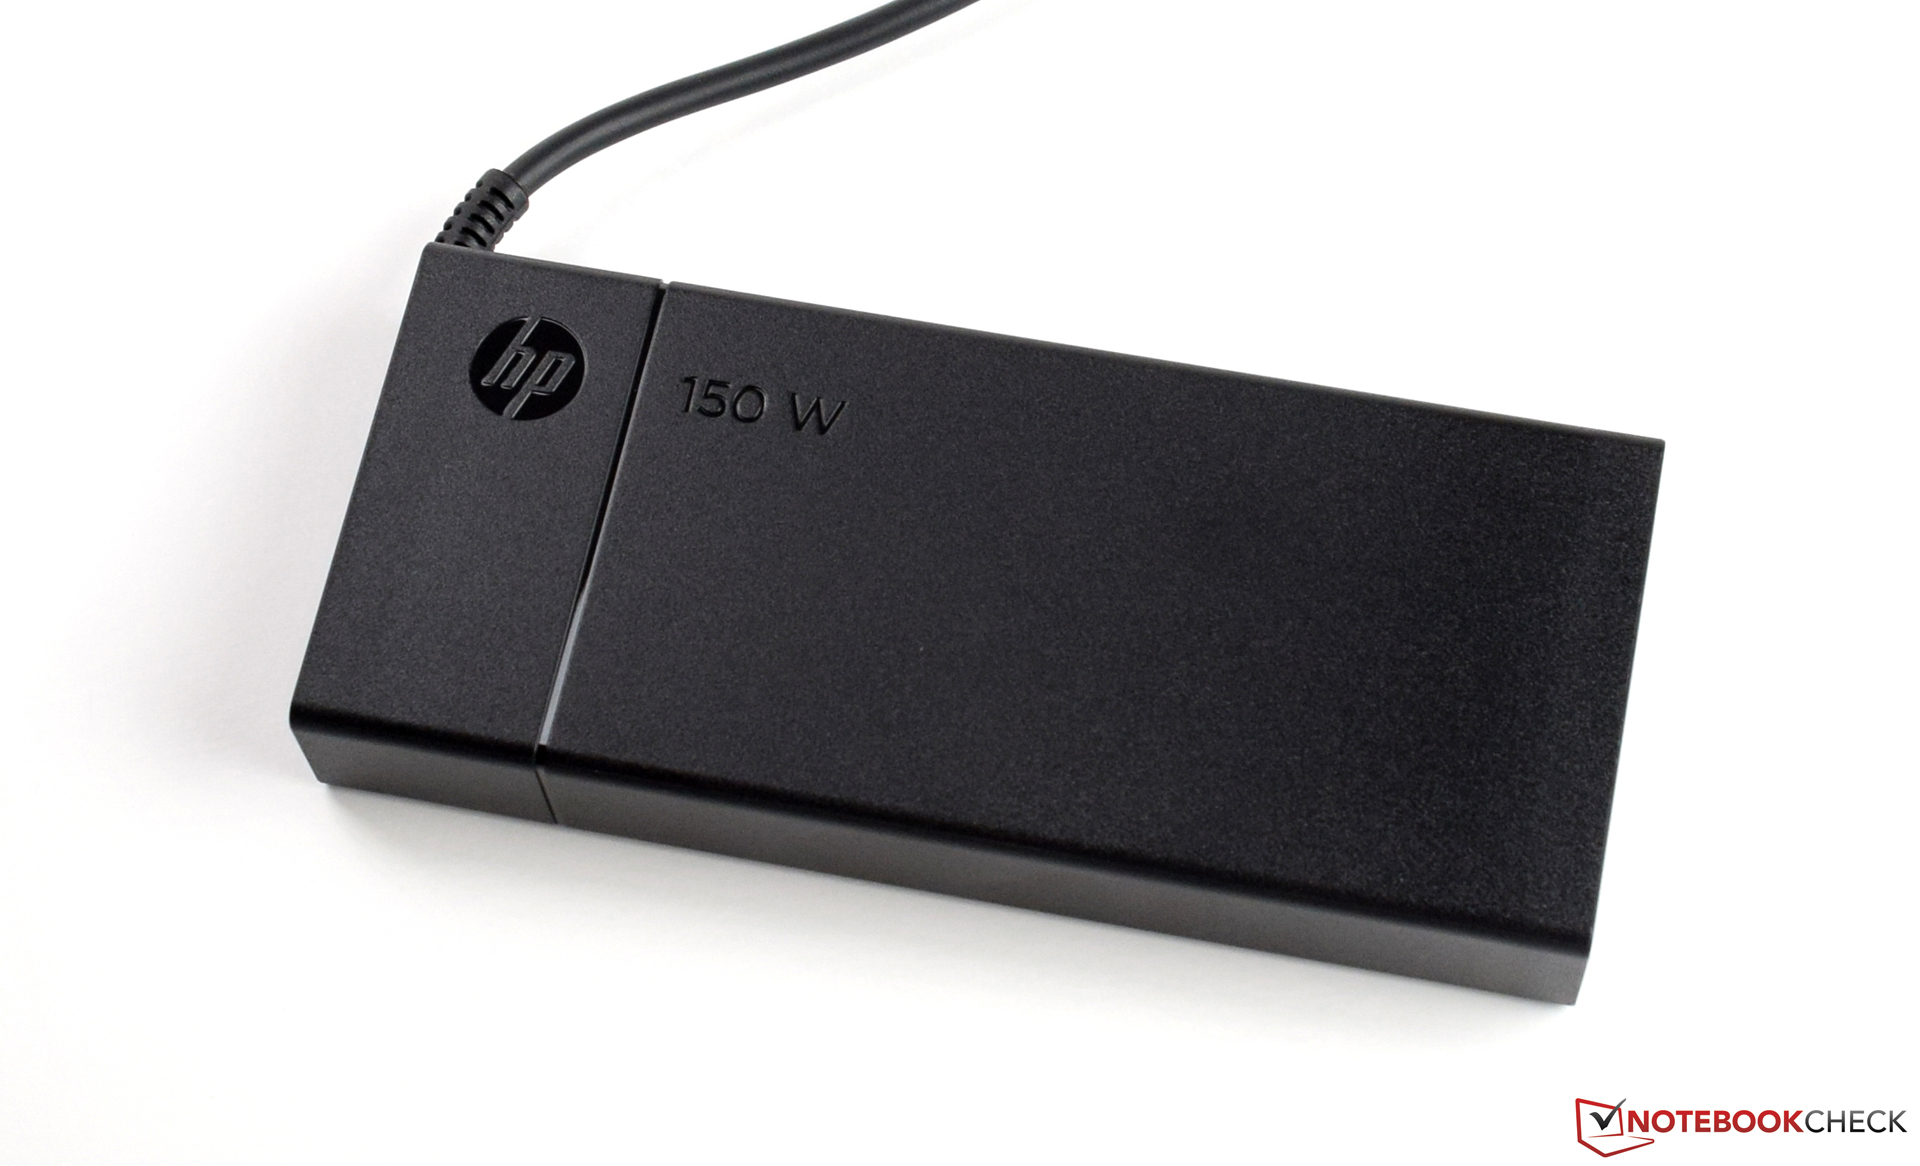
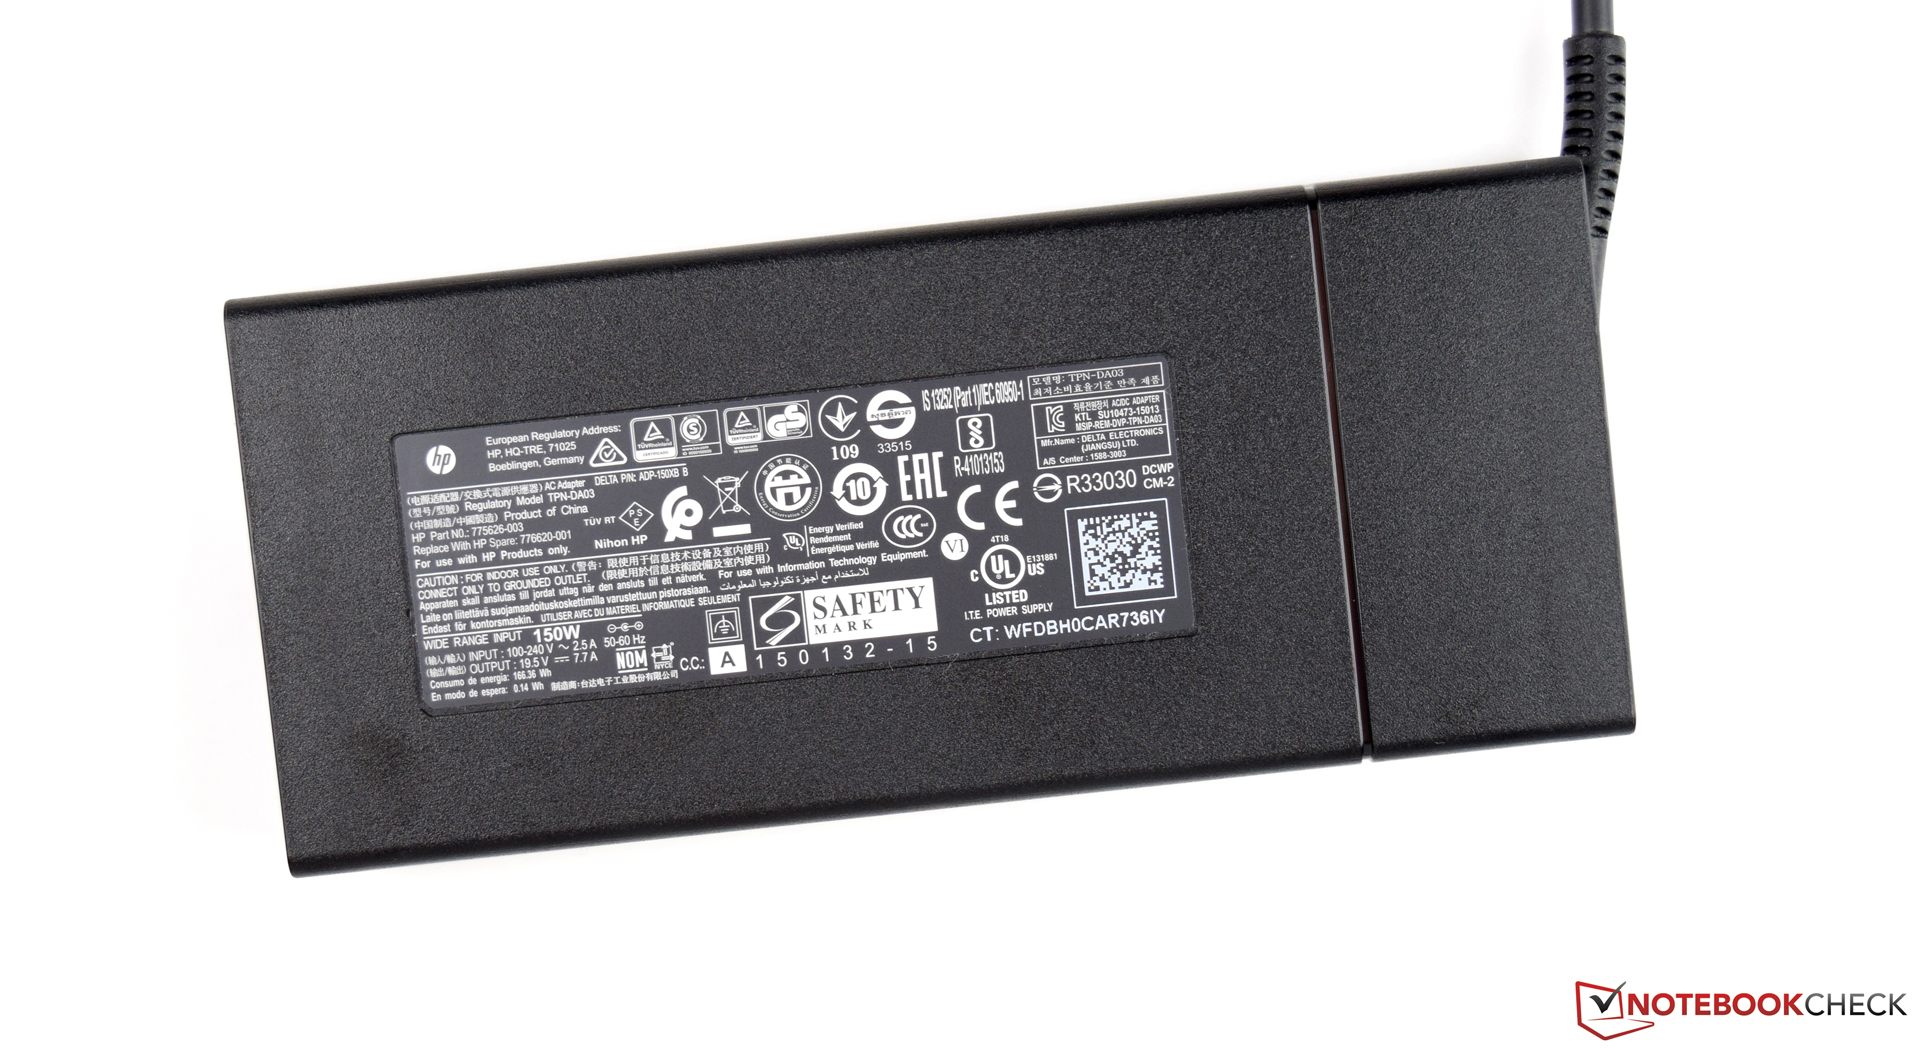
The HP Omen 15t (2017) consumes little power (6 to 18 watts) while idling, thanks to Nvidia Optimus. The Dell Inspiron 15 and the Lenovo Legion Y520 show that there is still room for improvement. Power consumption increases under load. We measured an average of 81 watts during the first part of the 3DMark 06. Under full load the device consumes 146 watts, which is close to the power supply's maximum, which is stated as 150 watts. We did not notice the battery emptying like it did with the previous version.
| Off / Standby | |
| Idle | |
| Load |
|
Key:
min: | |
| HP Omen 15-ax213ng GeForce GTX 1050 Ti Mobile, i7-7700HQ | HP Omen 15-ax007ng GeForce GTX 965M, 6700HQ | Acer Aspire VX5-591G-75C4 VX15 GeForce GTX 1050 Ti Mobile, i7-7700HQ | Dell Inspiron 15 7000 7567 GeForce GTX 1050 Ti Mobile, i7-7700HQ | Lenovo Legion Y520-15IKBN-80WK001KUS GeForce GTX 1050 Ti Mobile, i7-7700HQ | Asus FX502VM-AS73 GeForce GTX 1060 Mobile, i7-7700HQ | MSI GS63VR 7RF-228US GeForce GTX 1060 Mobile, i7-7700HQ | |
|---|---|---|---|---|---|---|---|
| Power Consumption | -1% | 6% | 26% | 5% | -40% | -51% | |
| Idle Minimum * (Watt) | 6 | 7 -17% | 7 -17% | 4.4 27% | 8.5 -42% | 14.9 -148% | 14.5 -142% |
| Idle Average * (Watt) | 11 | 11 -0% | 10.2 7% | 6.8 38% | 9.1 17% | 15.1 -37% | 17.3 -57% |
| Idle Maximum * (Watt) | 18 | 19 -6% | 14 22% | 8.3 54% | 9.7 46% | 15.2 16% | 17.4 3% |
| Load Average * (Watt) | 81 | 79 2% | 78 4% | 81 -0% | 79.9 1% | 105.8 -31% | 93 -15% |
| Witcher 3 ultra * (Watt) | 90 | 97.7 -9% | 128.8 -43% | ||||
| Load Maximum * (Watt) | 146 | 119 18% | 127 13% | 127 13% | 121.5 17% | 148.8 -2% |
* ... smaller is better
Battery Runtime
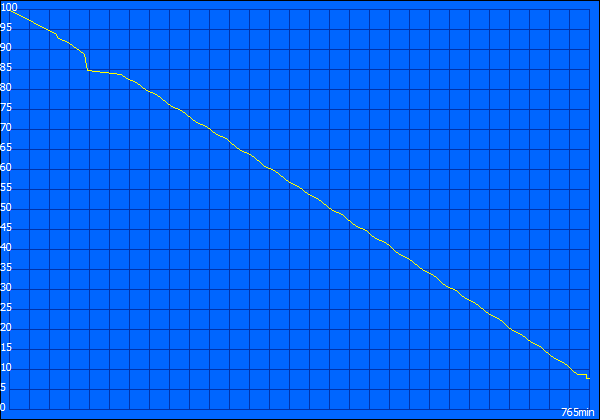
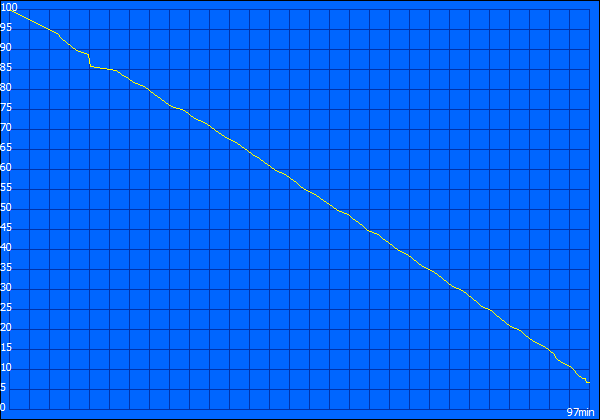
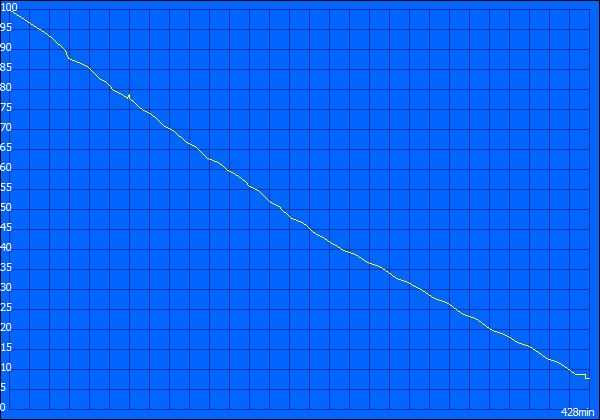
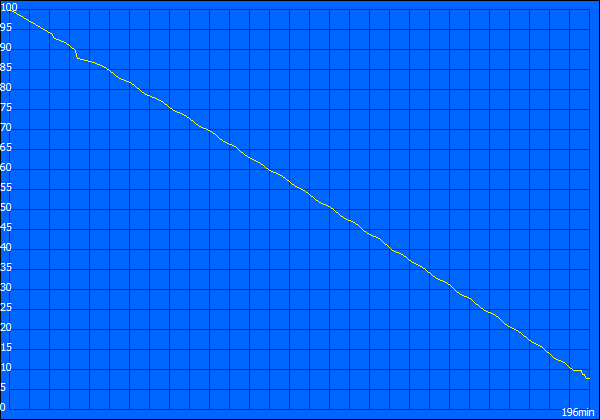
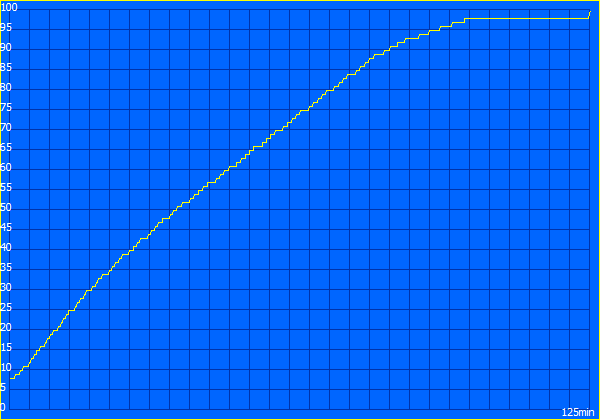
The battery is not removable and is larger than last year's (63.3 Wh). The battery runtime has been increased significantly: twelve hours while idling it can almost be considered a long-distance runner in the gaming segment. Only the Dell Inspiron 15 can top this time. Under maximum load the lights go off after only 97 minutes, however. Our test unit managed a runtime of over seven hours during our Wi-Fi test. When playing films in HD, one battery charge lasts a good three hours. We also tested its 3D performance in battery mode with 3DMark 11. The results were not quite as good as on power supply. Nonetheless, the device can also be used for gaming while on battery, although graphics performance might be a little lower.
| HP Omen 15-ax213ng i7-7700HQ, GeForce GTX 1050 Ti Mobile, 63.3 Wh | HP Omen 15-ax007ng 6700HQ, GeForce GTX 965M, 61.5 Wh | Acer Aspire VX5-591G-75C4 VX15 i7-7700HQ, GeForce GTX 1050 Ti Mobile, 52.5 Wh | Dell Inspiron 15 7000 7567 i7-7700HQ, GeForce GTX 1050 Ti Mobile, 74 Wh | Lenovo Legion Y520-15IKBN-80WK001KUS i7-7700HQ, GeForce GTX 1050 Ti Mobile, 45 Wh | Asus FX502VM-AS73 i7-7700HQ, GeForce GTX 1060 Mobile, 64 Wh | MSI GS63VR 7RF-228US i7-7700HQ, GeForce GTX 1060 Mobile, 65 Wh | |
|---|---|---|---|---|---|---|---|
| Battery runtime | -13% | -34% | 54% | -43% | -39% | -38% | |
| Reader / Idle (h) | 12.8 | 7.8 -39% | 5.4 -58% | 19.6 53% | 8.5 -34% | 6.1 -52% | 6.4 -50% |
| H.264 (h) | 3.3 | 4.1 24% | 7.6 130% | ||||
| WiFi v1.3 (h) | 7.1 | 4.5 -37% | 5 -30% | 10.4 46% | 4 -44% | 4.6 -35% | 3.9 -45% |
| Load (h) | 1.6 | 1.6 0% | 1.4 -13% | 1.4 -13% | 0.8 -50% | 1.1 -31% | 1.3 -19% |
Verdict
Pros
Cons

The HP Omen 15t (2017) will not have an easy time, especially as the competition has been offering various devices with the new Pascal architecture for a while now. The 15-inch device has a nice design, although the workmanship could be better for a $1500 device. We also cannot understand why modern ports such as DisplayPort or USB 3.1 Gen2 are missing. Its connectivity is not fit for the future.
The HP Omen 15t (2017) showed a solid performance, which played a big part in our rating. The device is equipped with an Nvidia GeForce GTX 1050 Ti and a strong Intel Core i7-7700HQ. This combination, supported by 16 GB of RAM, lets you play current games smoothly with high details.
If you have been waiting for the HP Omen 15t (2017), you will be rewarded with reliable gaming performance. However, the manufacturer has decided not to update its ports and to stick to what it knows.
HP also lost several rating points due to its display, which is not bright enough. The color space coverage is just as disappointing. Nonetheless, we liked the HP Omen 15's system performance, which is enhanced by its NVMe SSD.
HP Omen 15-ax213ng
- 07/03/2017 v6 (old)
Sebastian Bade
Price comparison
