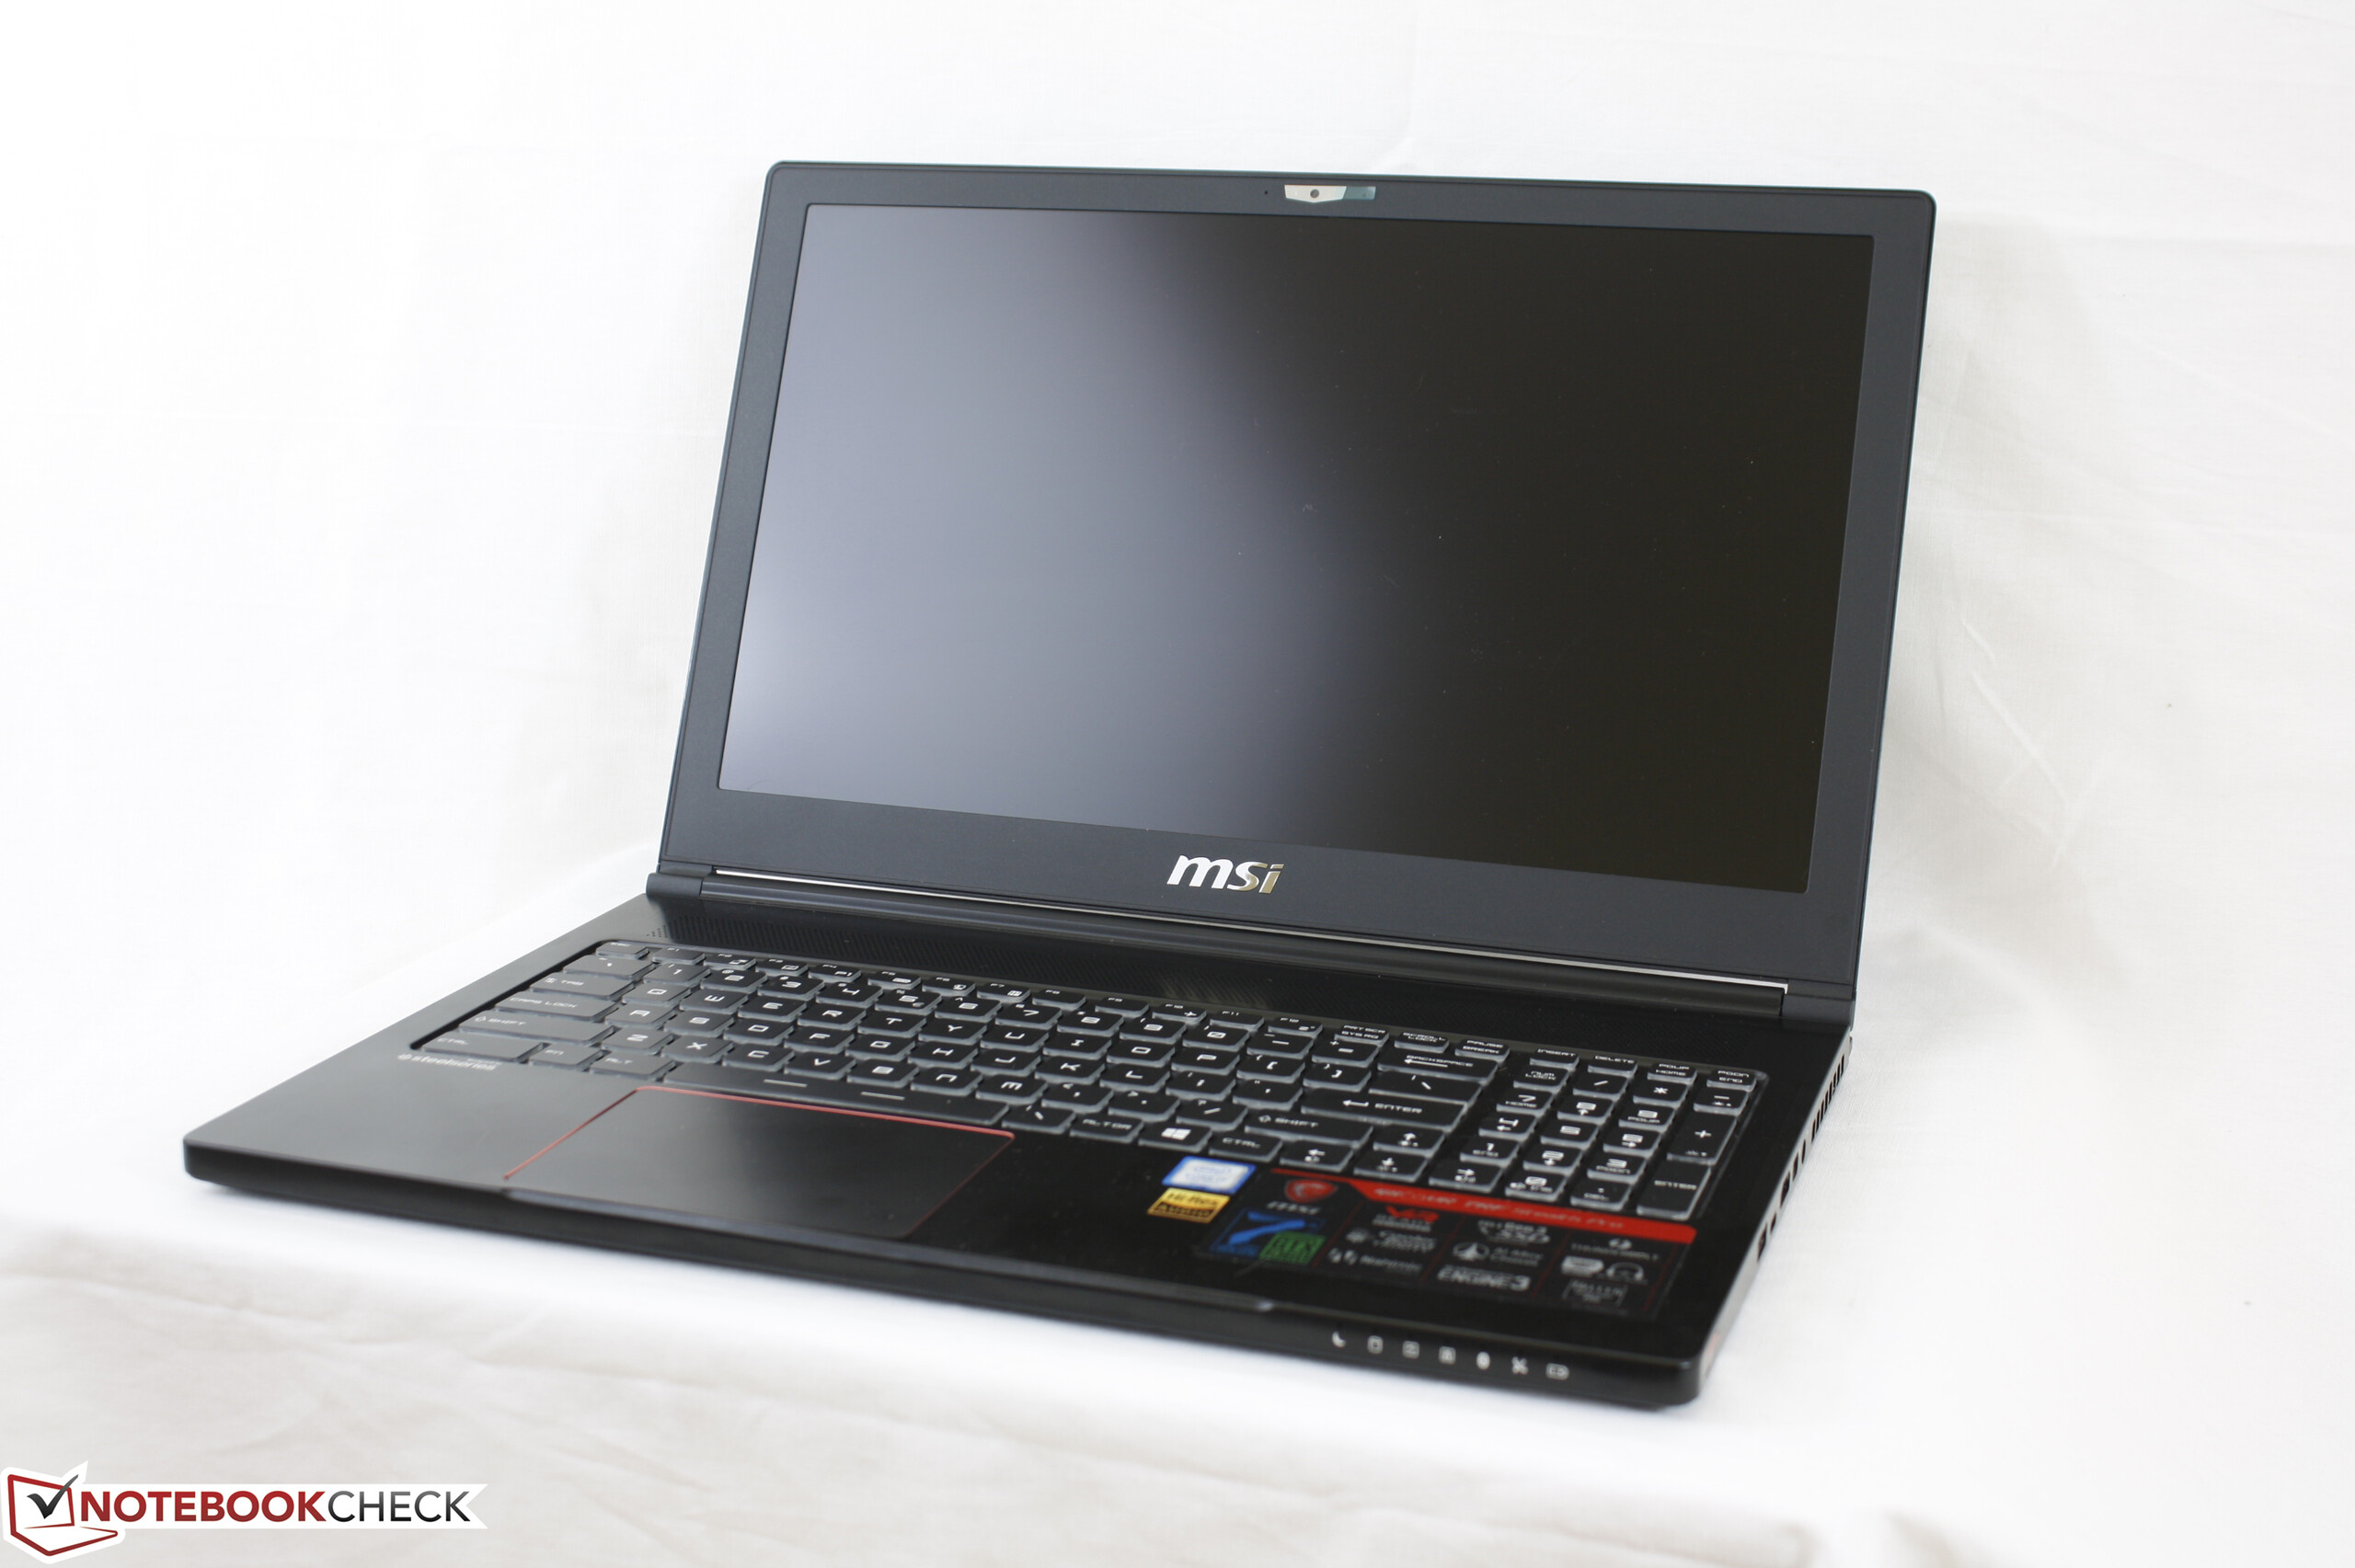
MSI GS63VR 7RF (7700HQ, 4K UHD, GTX 1060) Laptop Review

The MSI GS series holds some of the thinnest gaming notebooks available and the new Pascal GPUs have turned them into more powerful machines than even most thicker Maxwell alternatives. The original GS60 notebooks were undeniably attractive, but they also suffered from extremely warm surface temperatures and very loud fan noise. The latest refresh tackles these major issues directly both by adding in a third internal fan and incorporating more power-efficient Kaby Lake and Pascal processors compared to the older Haswell and Maxwell incarnations.
The GS63VR 7RF is the Kaby Lake update to the Skylake GS63VR 6RF we reviewed last year. As such, we recommend checking out our original GS63VR page as the two systems are otherwise identical in hardware and features. The 15.6-inch GS Ghost and 17.3-inch Stealth series of notebooks compete directly against the Razer Blade series, most Gigabyte models, and the older Asus G501 series of super-thin gaming notebooks.
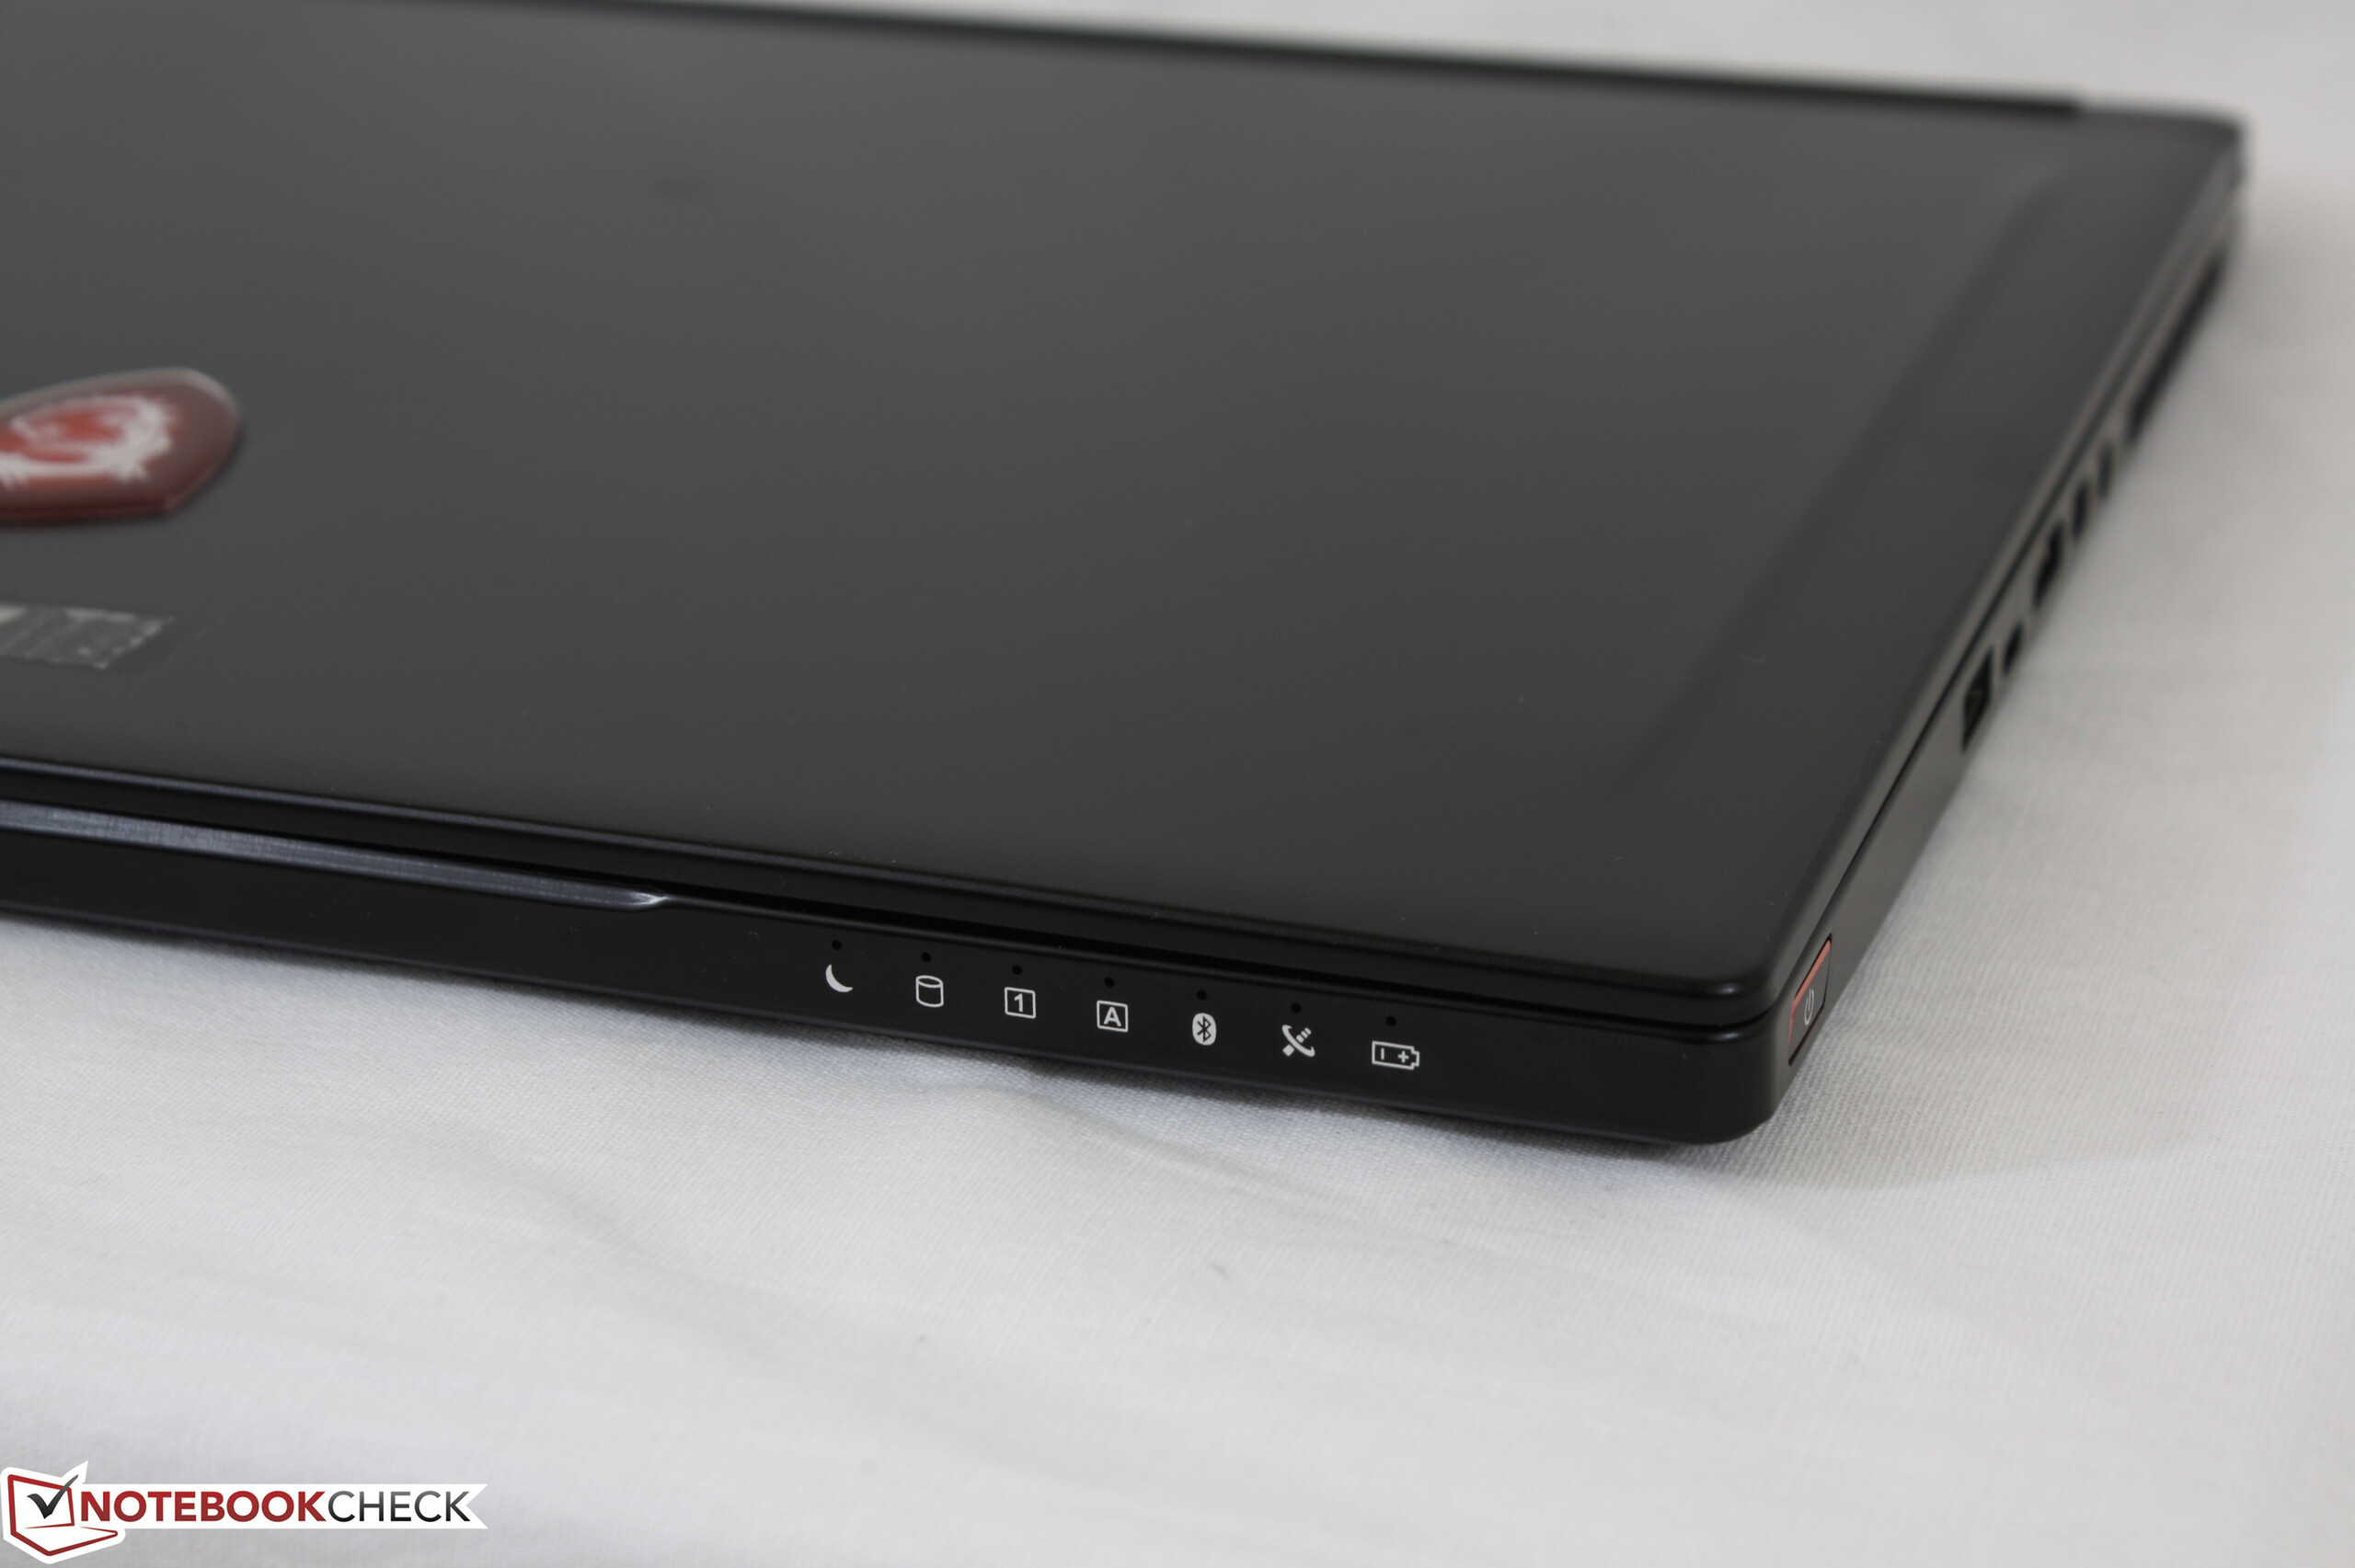
Case
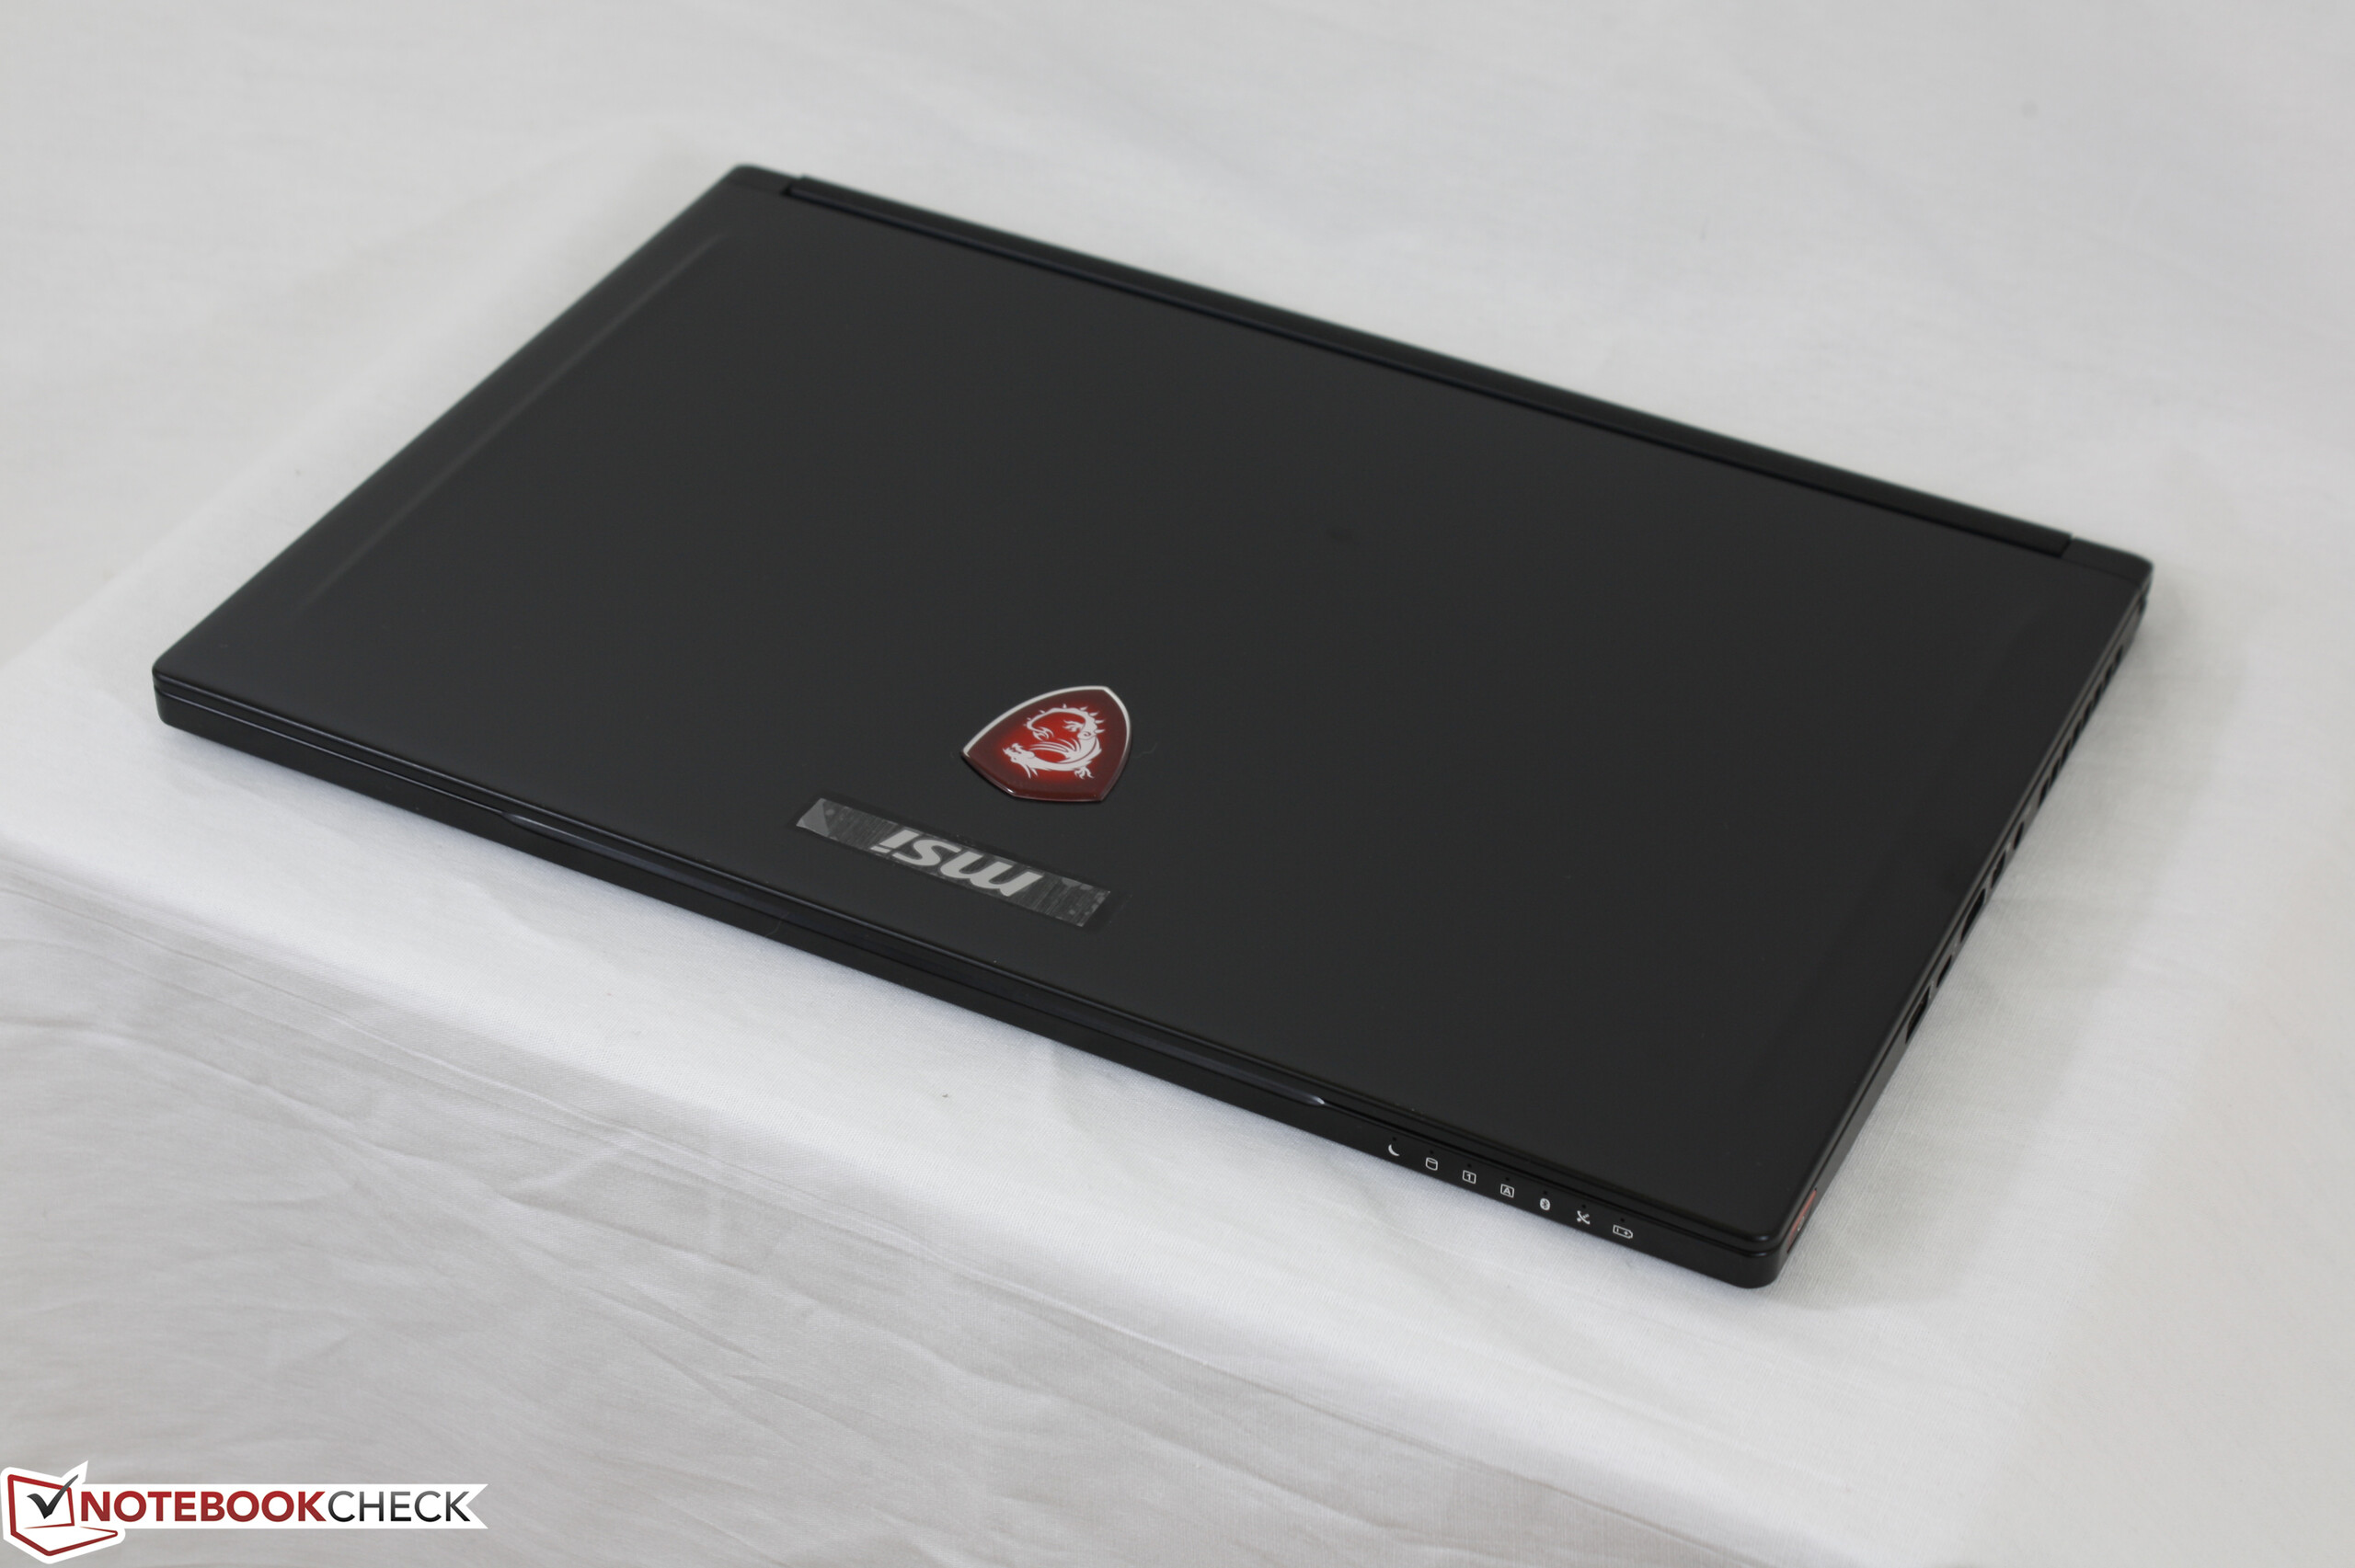
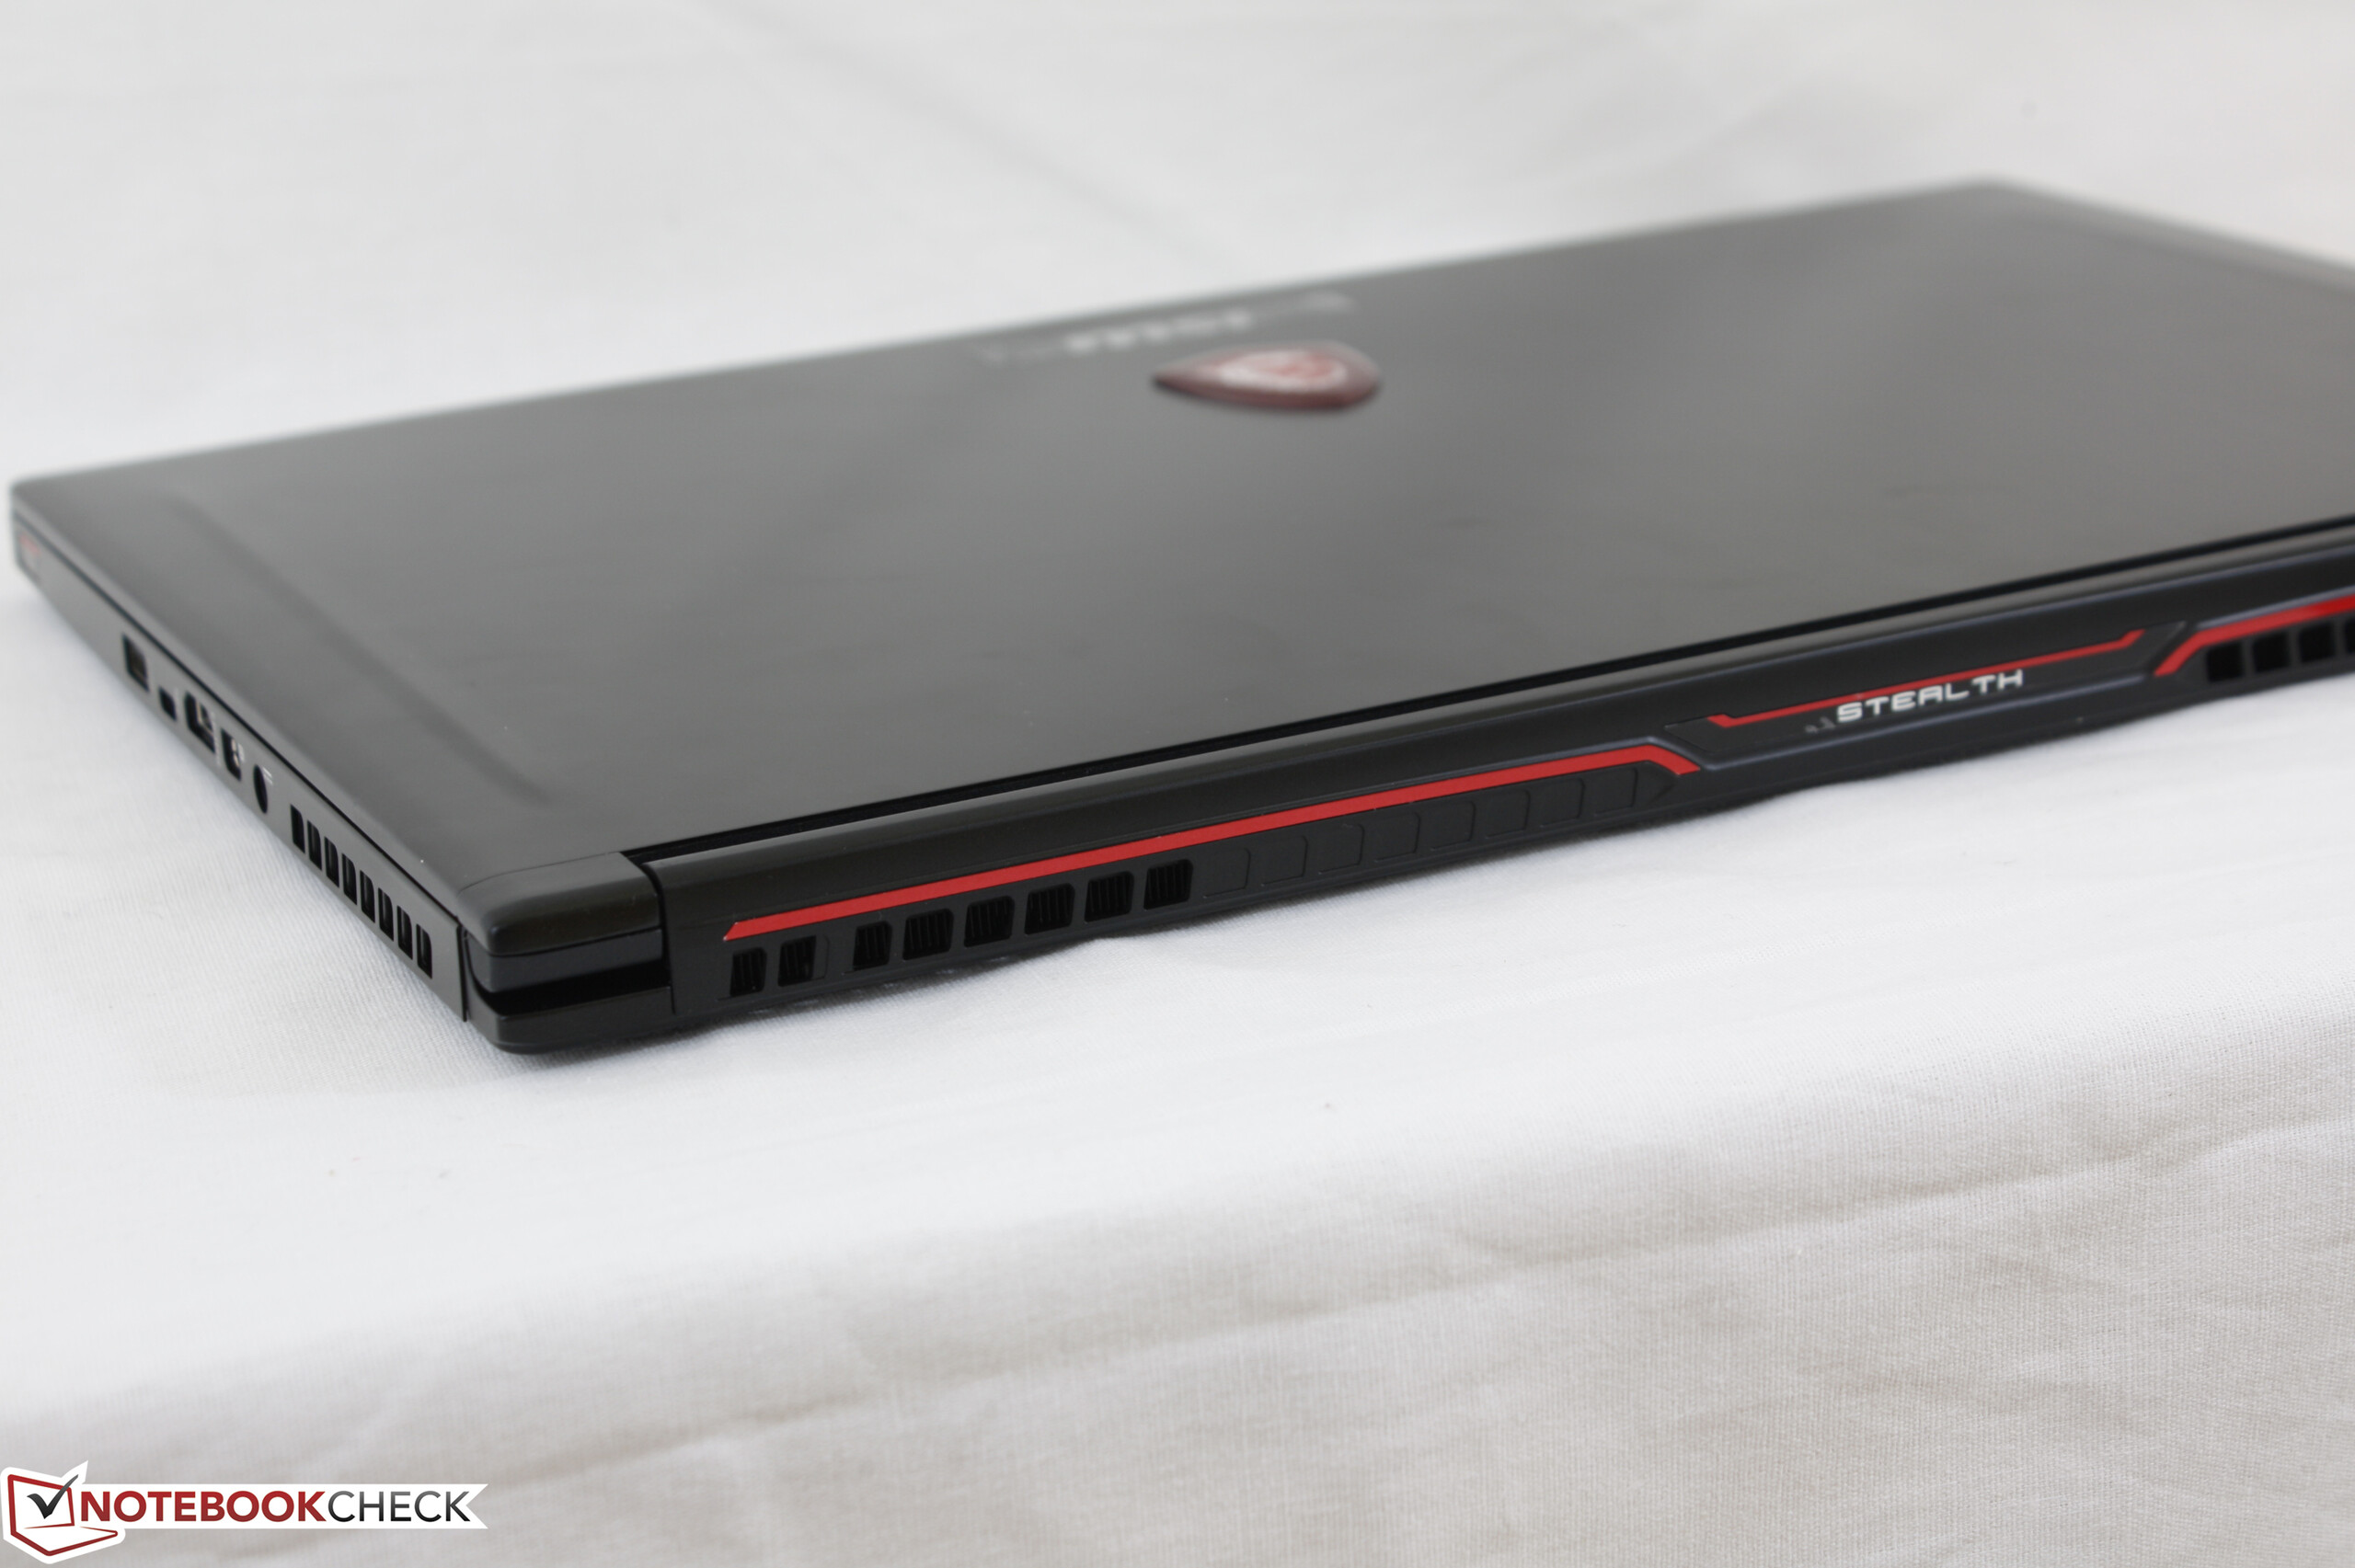
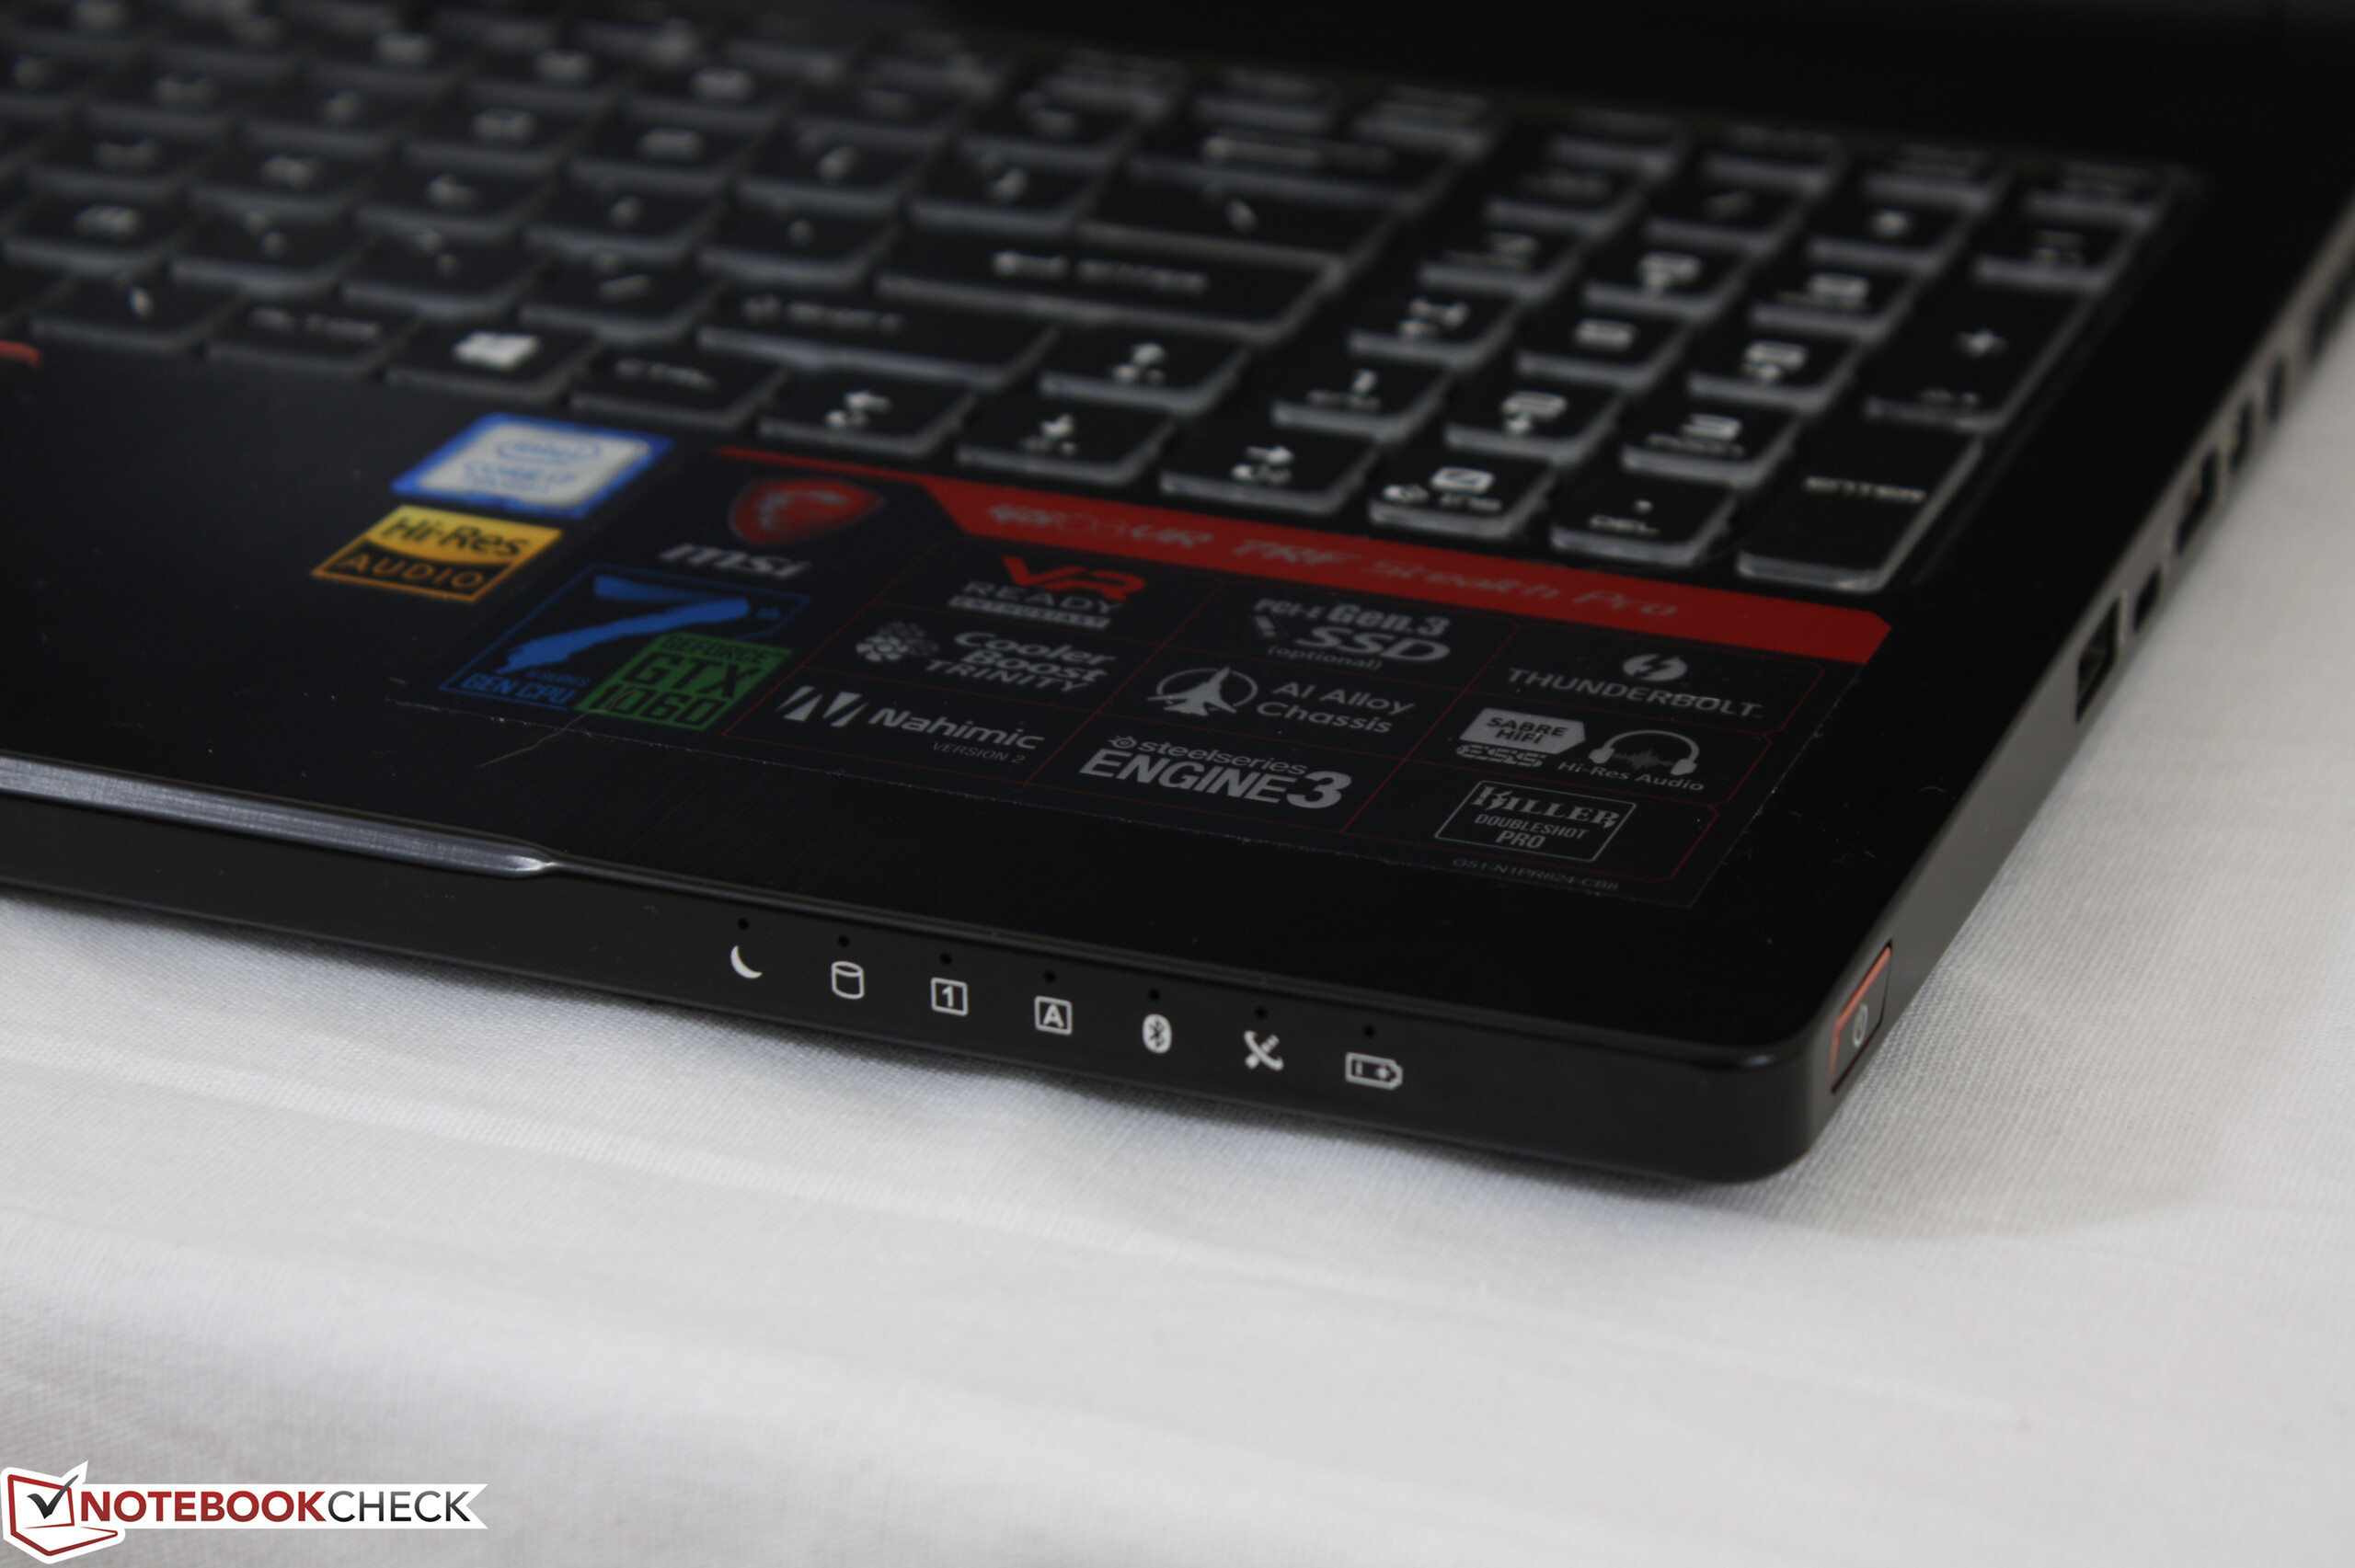
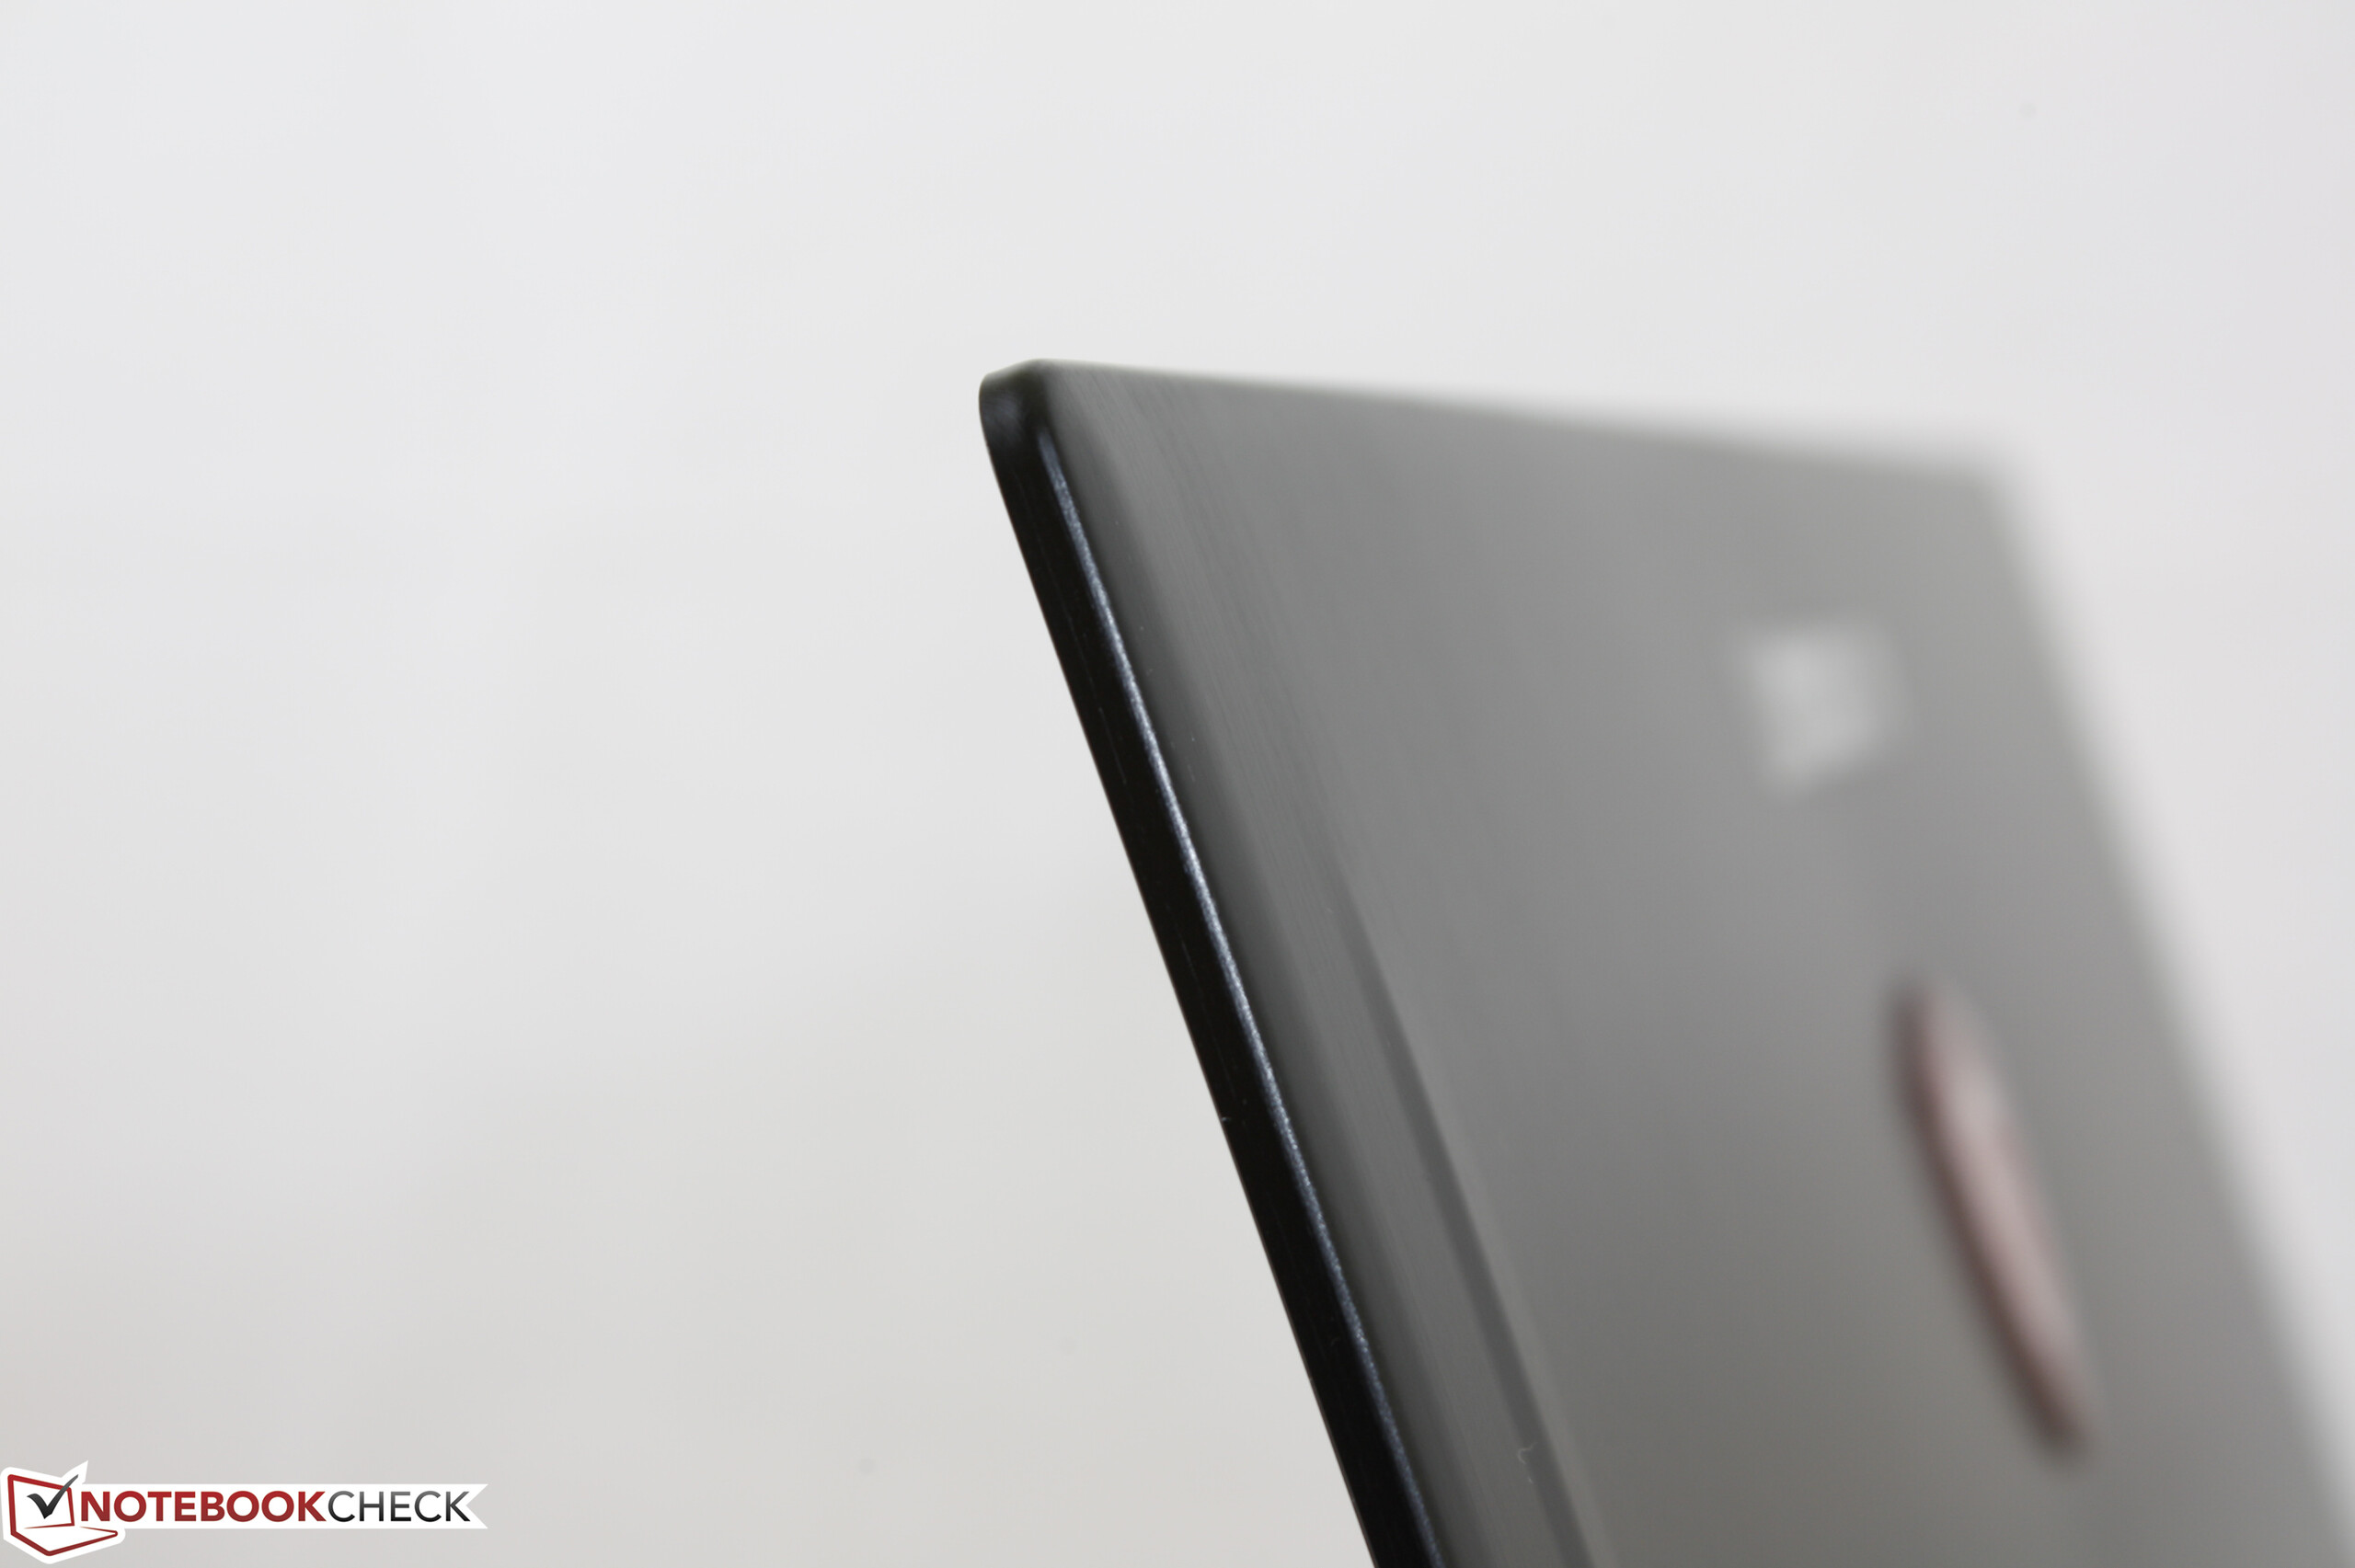
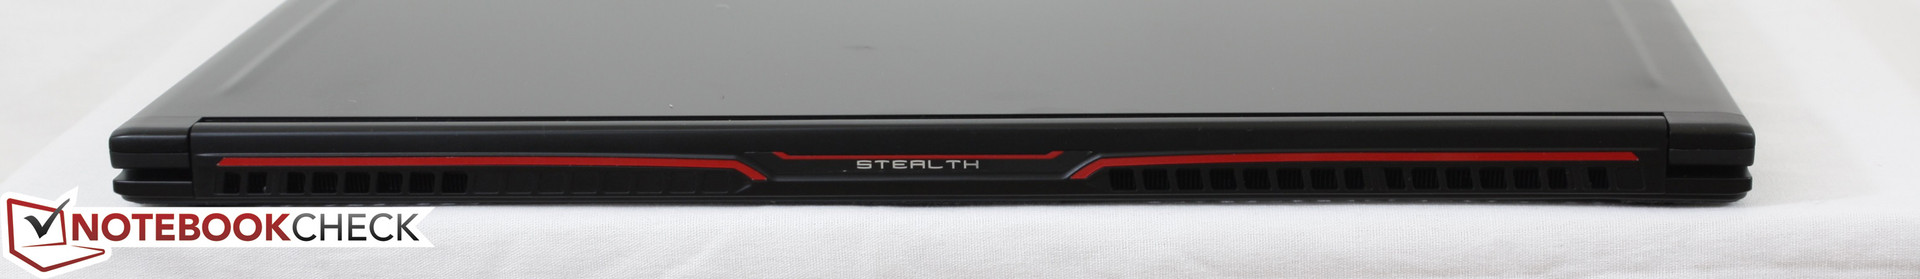
It's tough to dislike the thin design and brushed aluminum surfaces of the GS series from a visual standpoint. Unfortunately, build quality has not been dramatically improved over the GS60 models and we find that it pales in comparison to the Razer Blade, Blade Pro, XPS 15, and the MacBook Pro series. The base is susceptible to twisting and creaking and it is possible to depress both the palm rests and keyboard surfaces with a moderate push of a finger. The lid flexes more easily than a Razer as well, though not nearly as bad as on the Aorus X5. While we're not expecting the chassis to be as sound as the massive GT72 or GT73VR, it could have still been sturdier and firmer considering what other super-thin notebooks have managed.
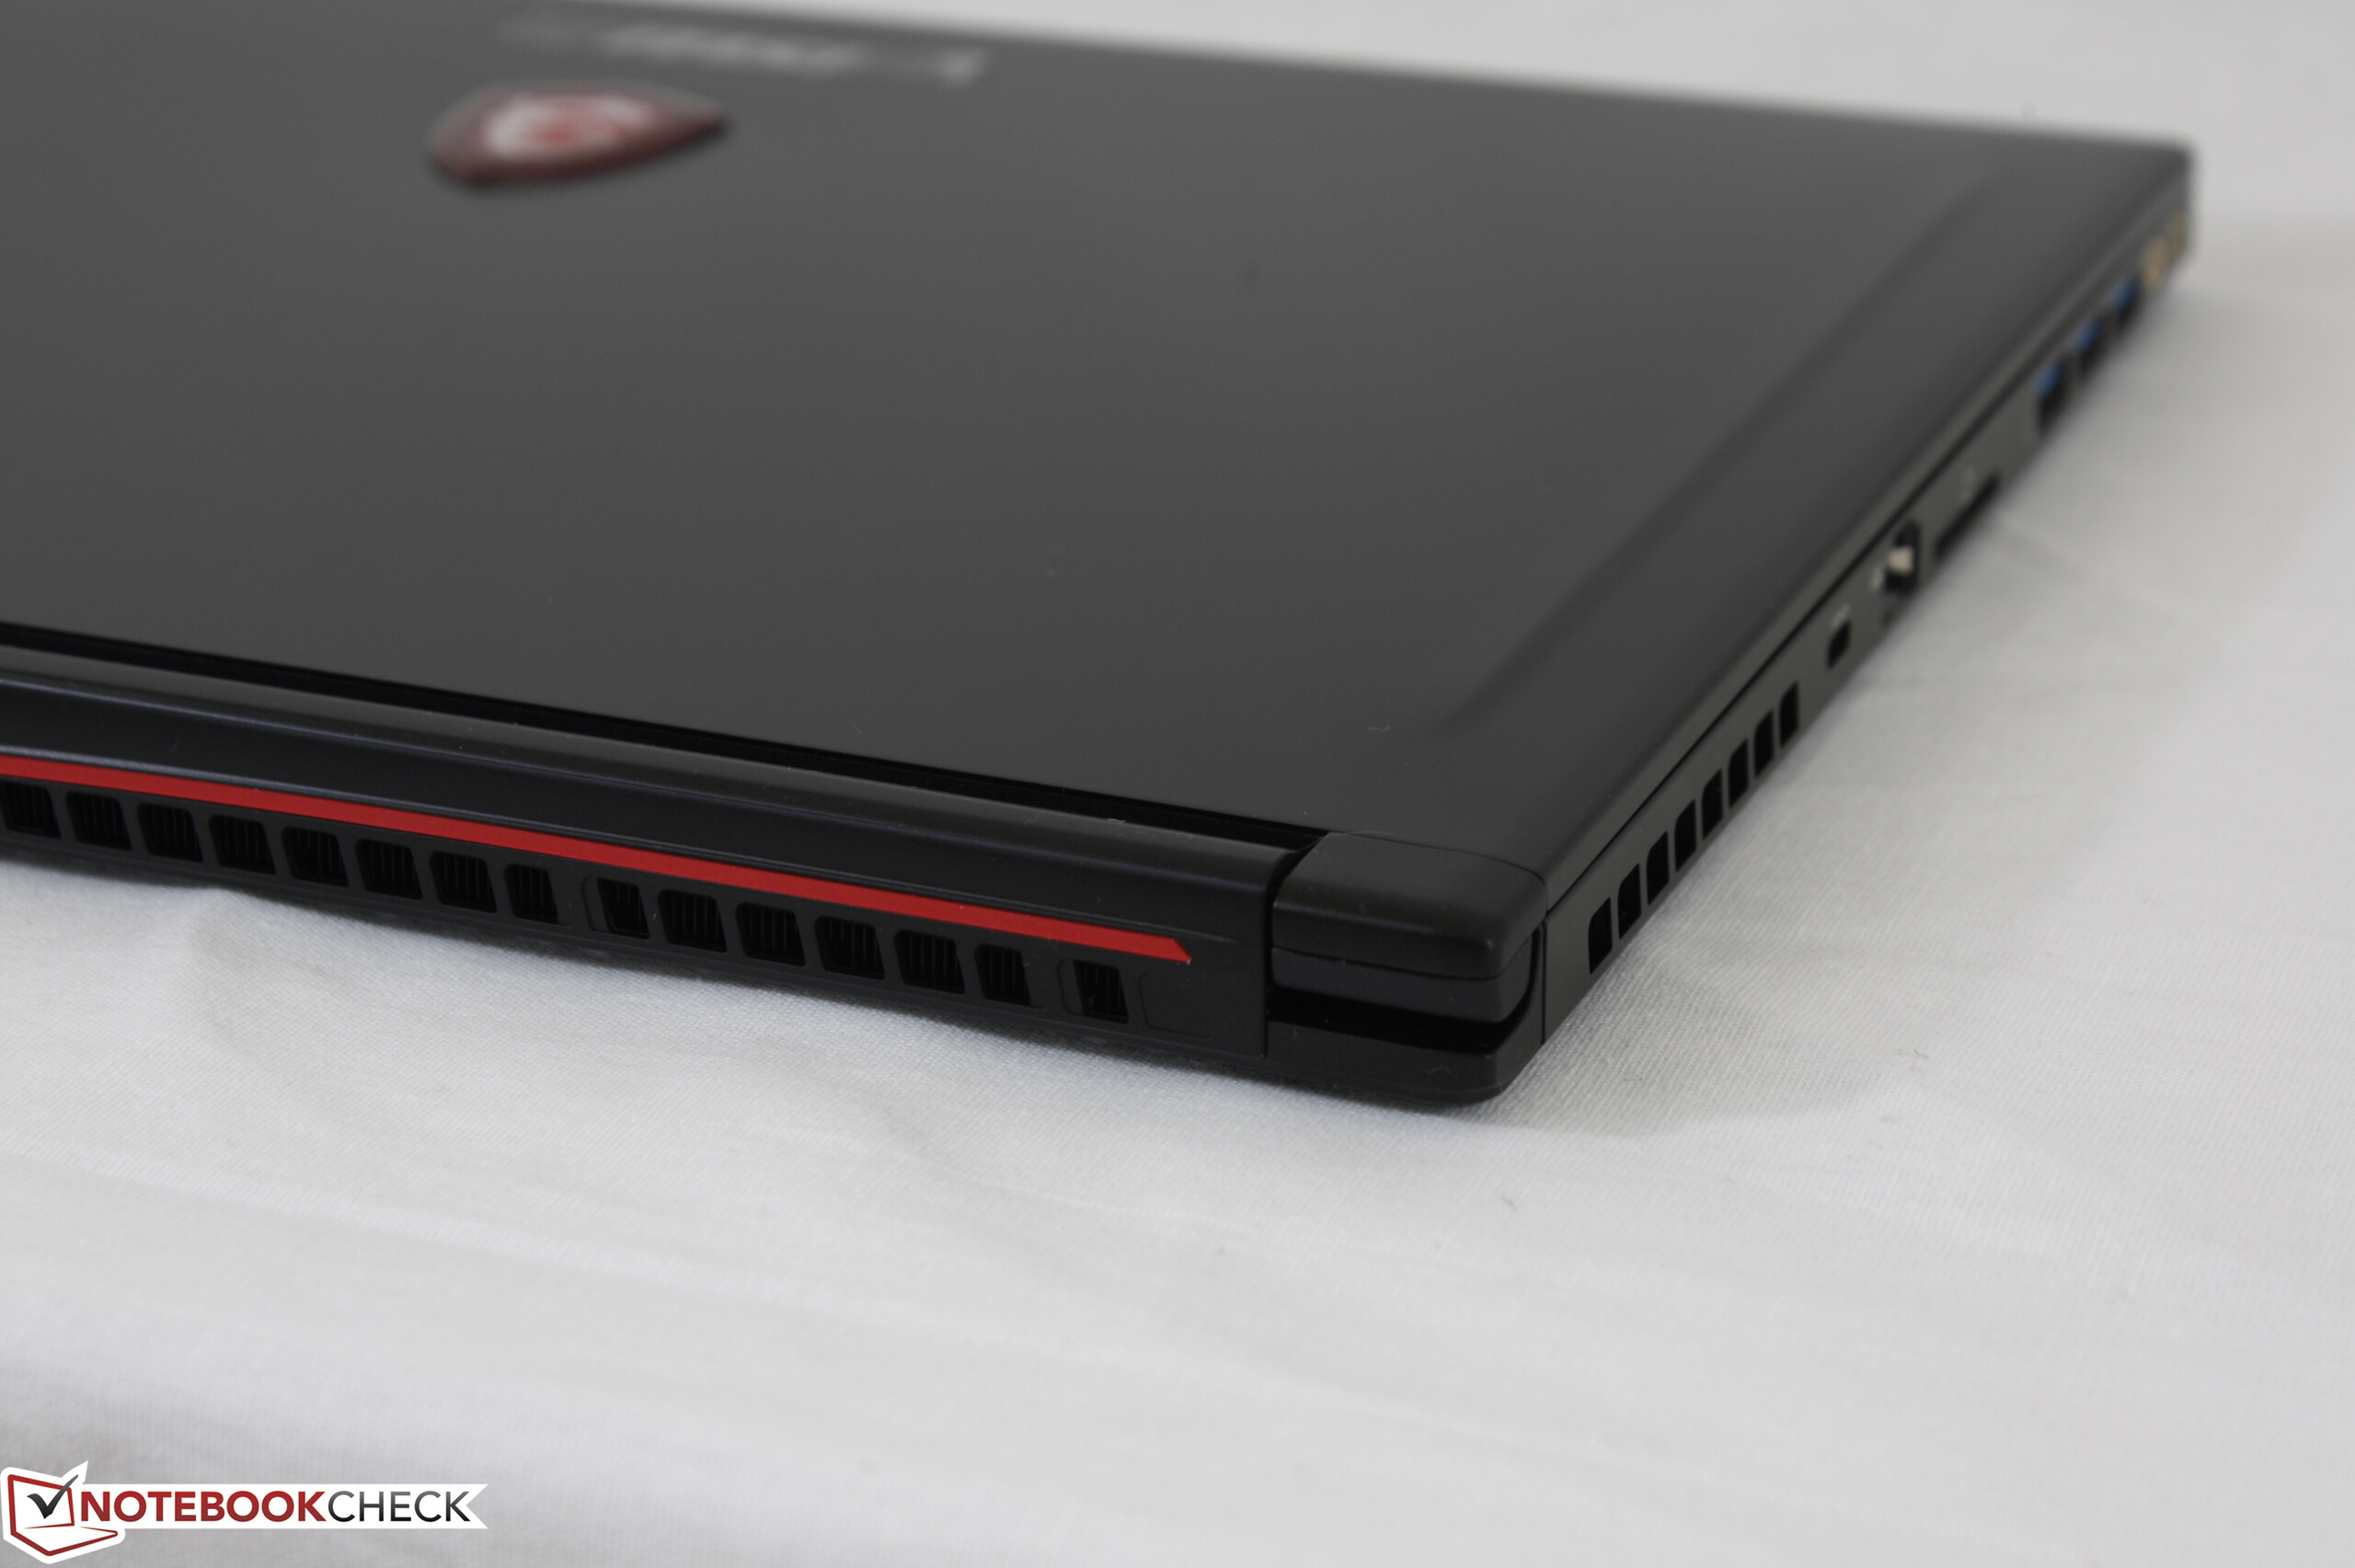
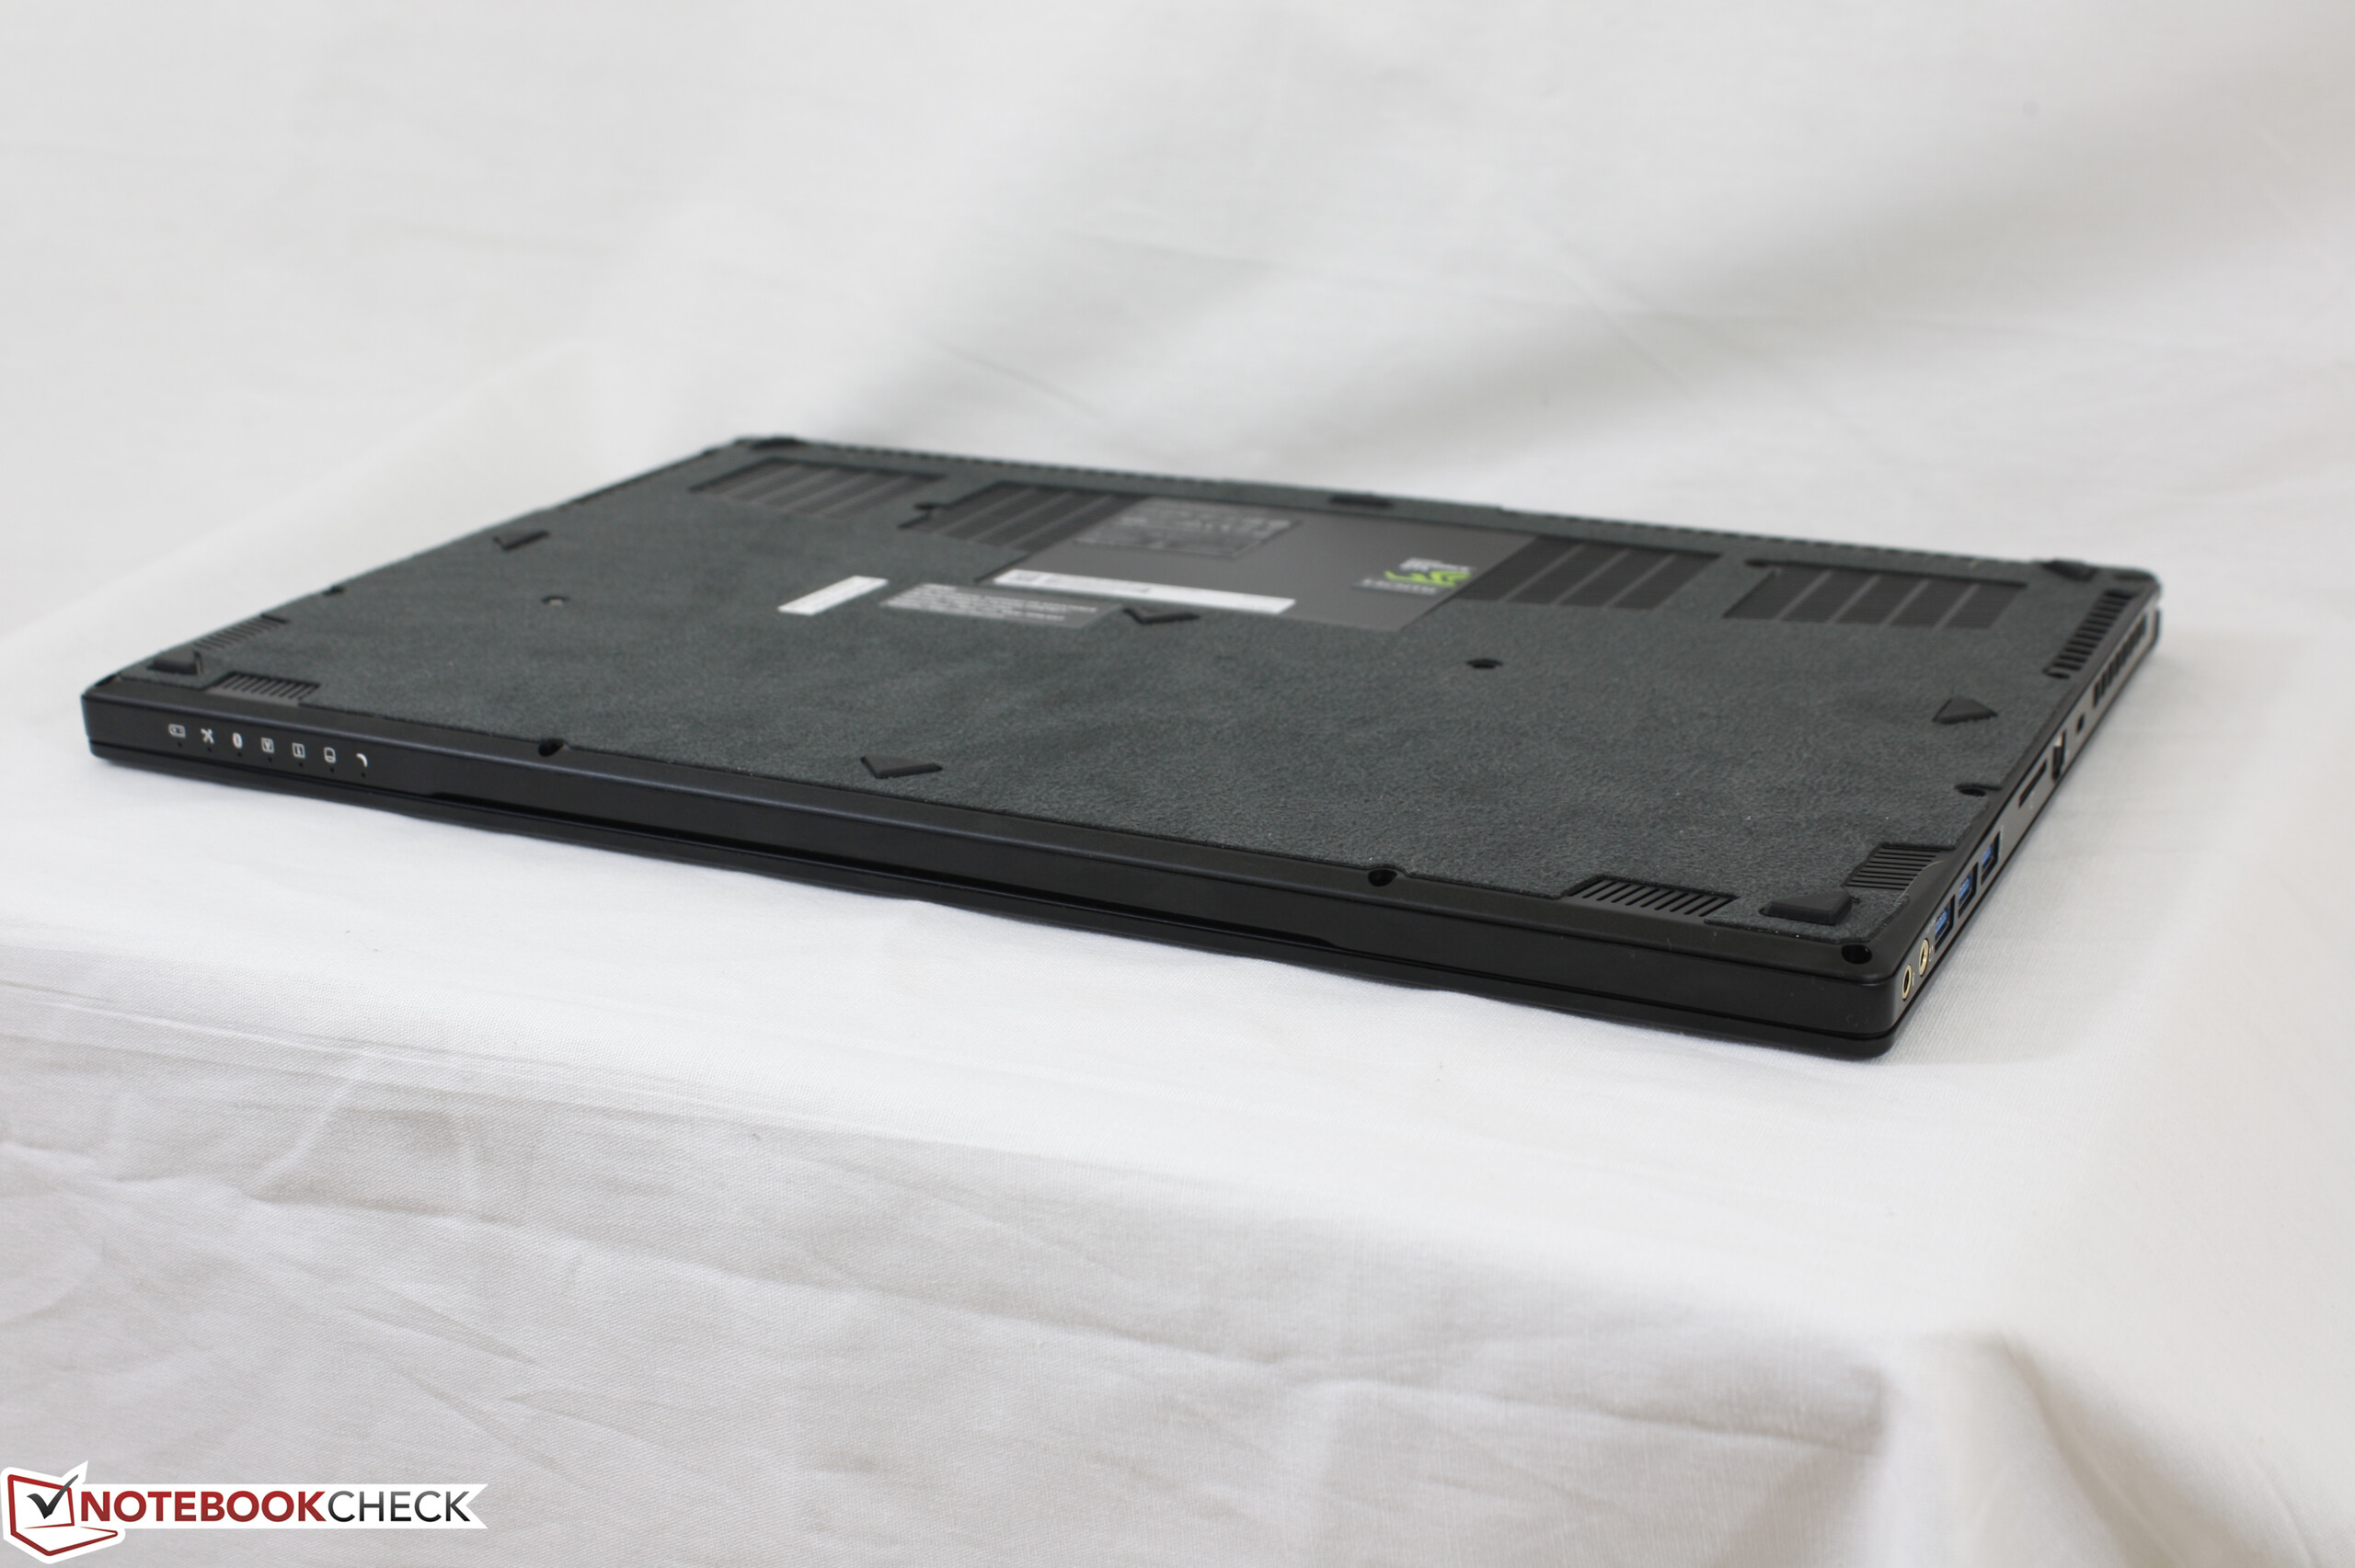
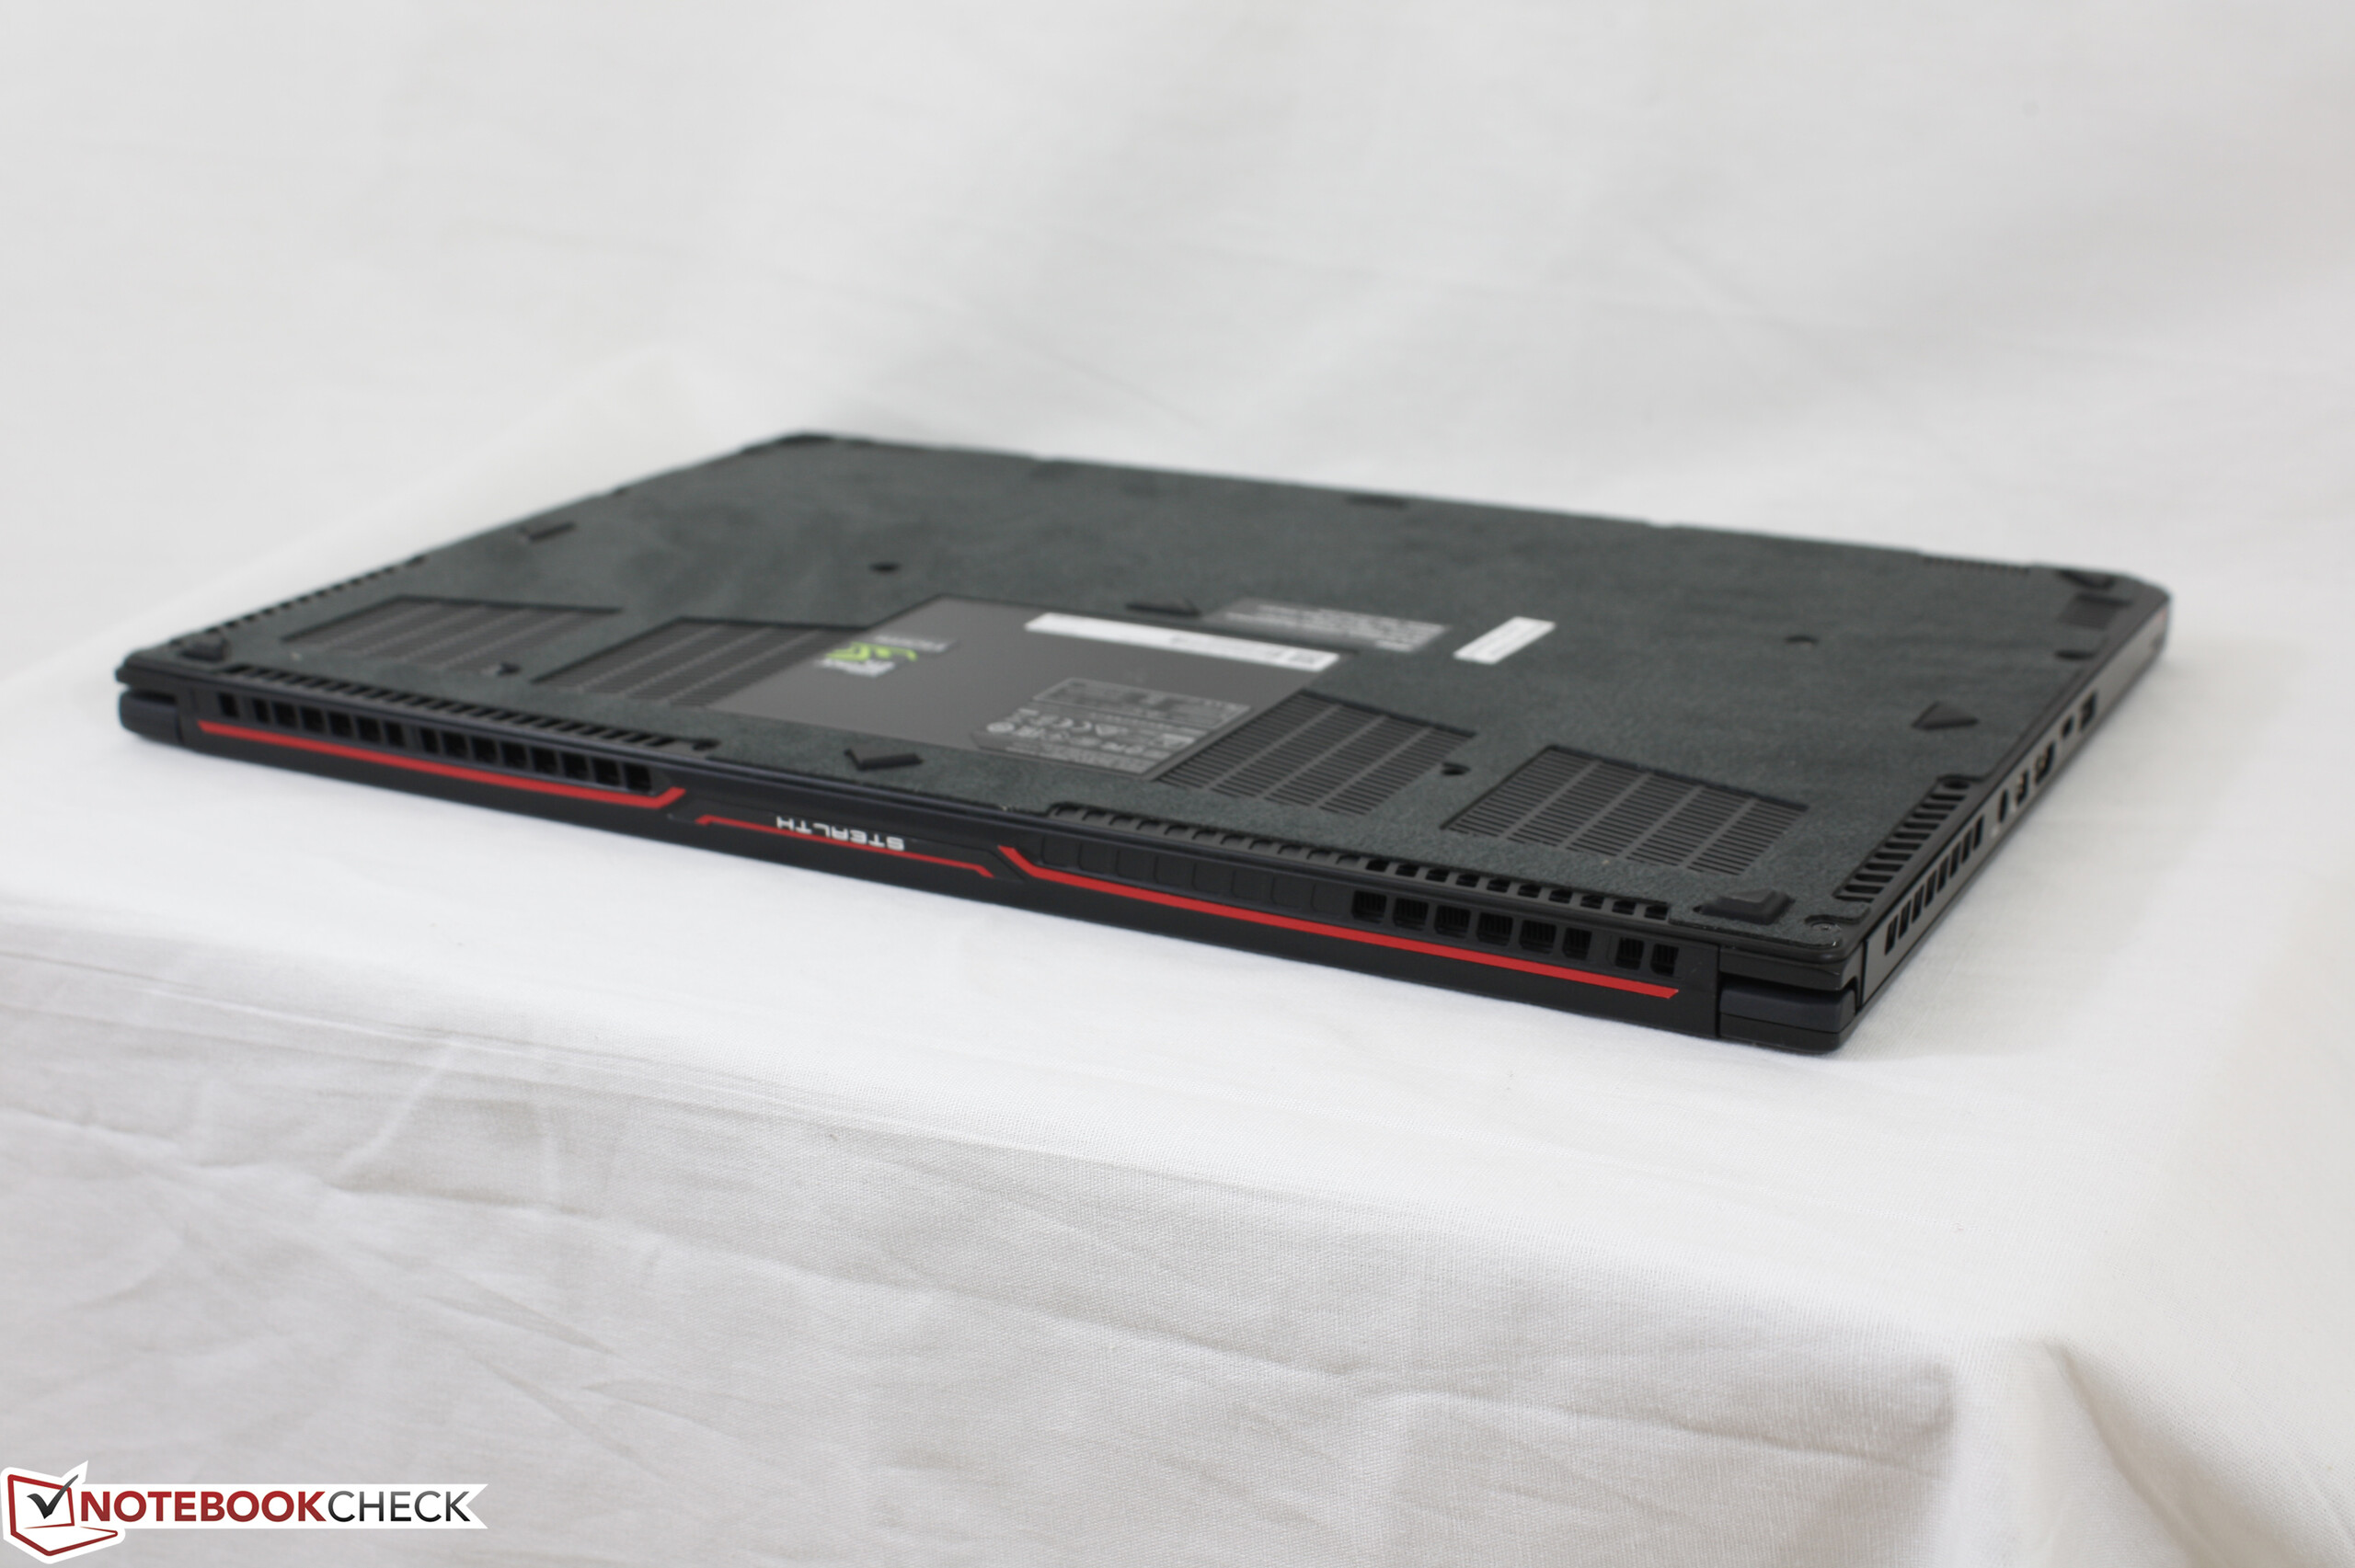
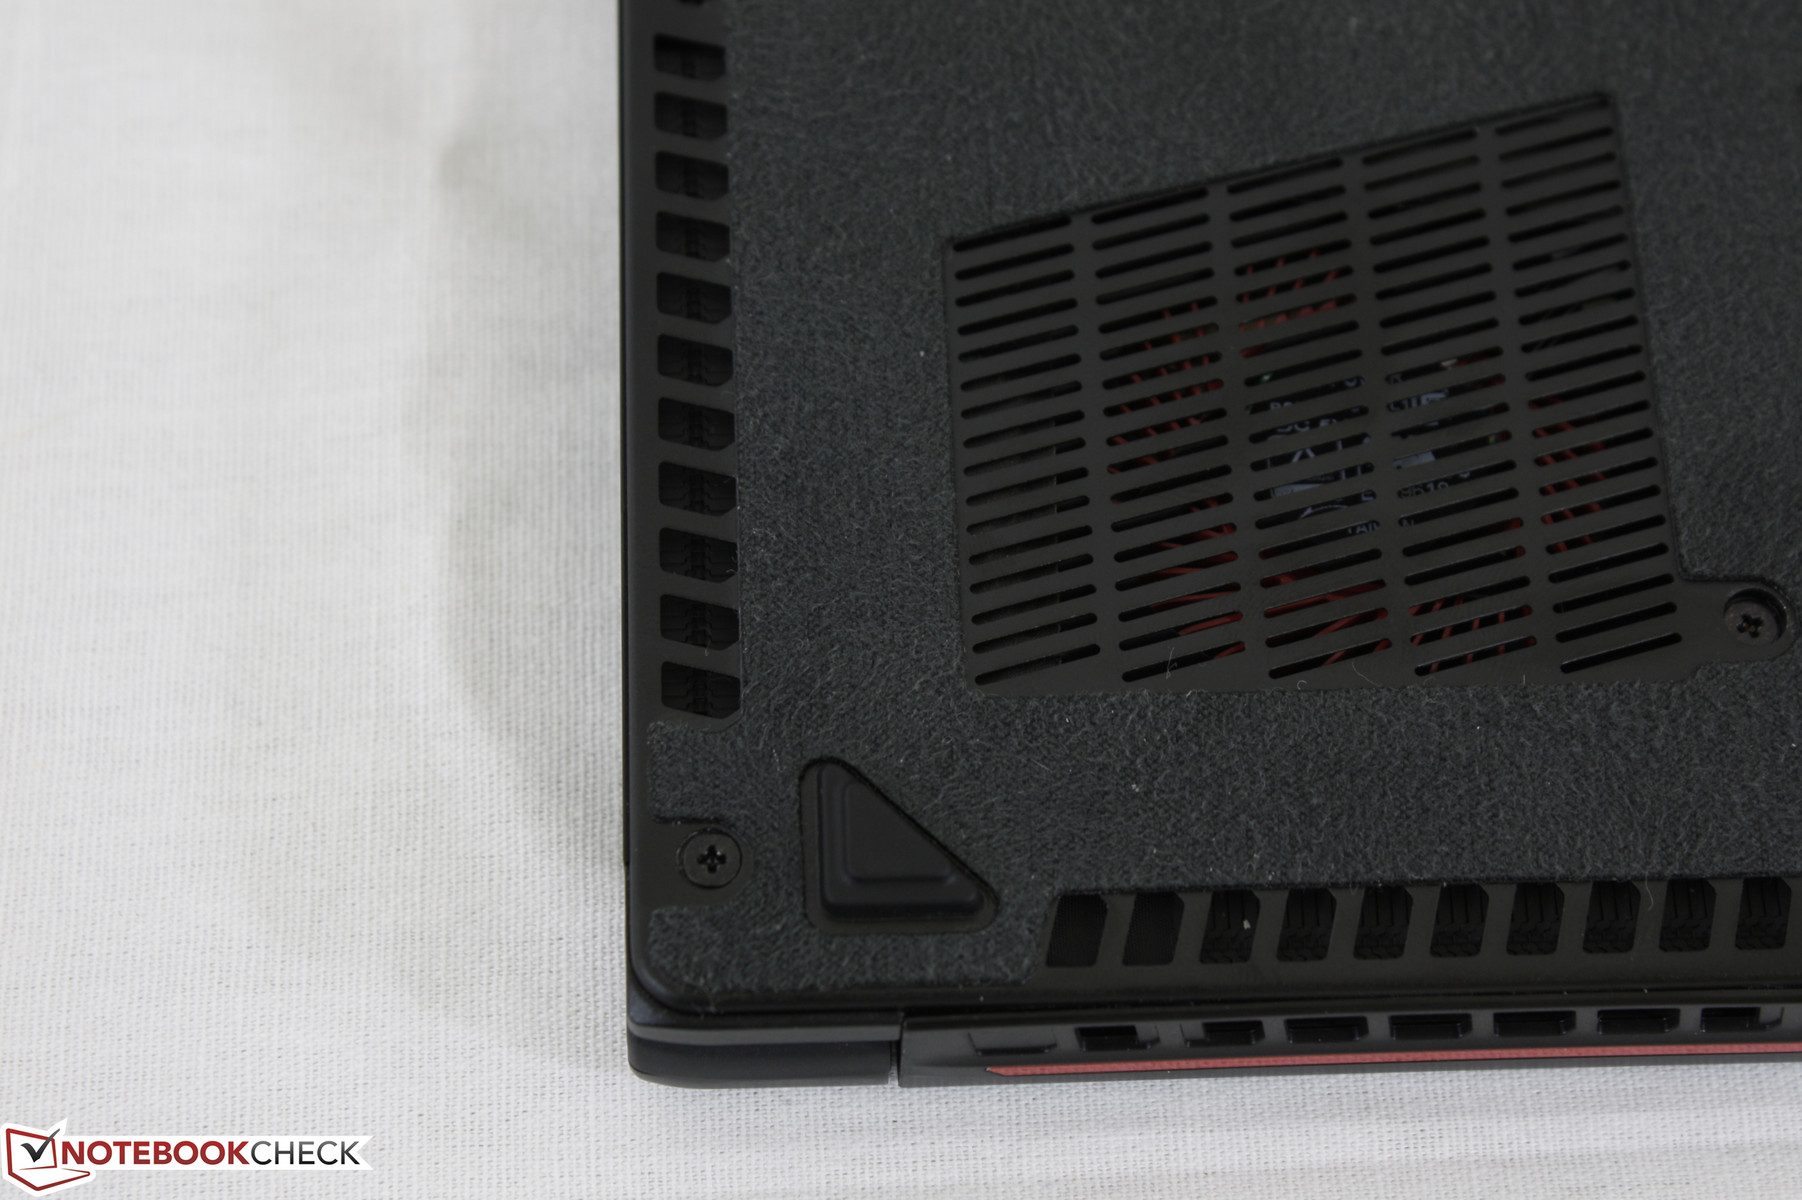
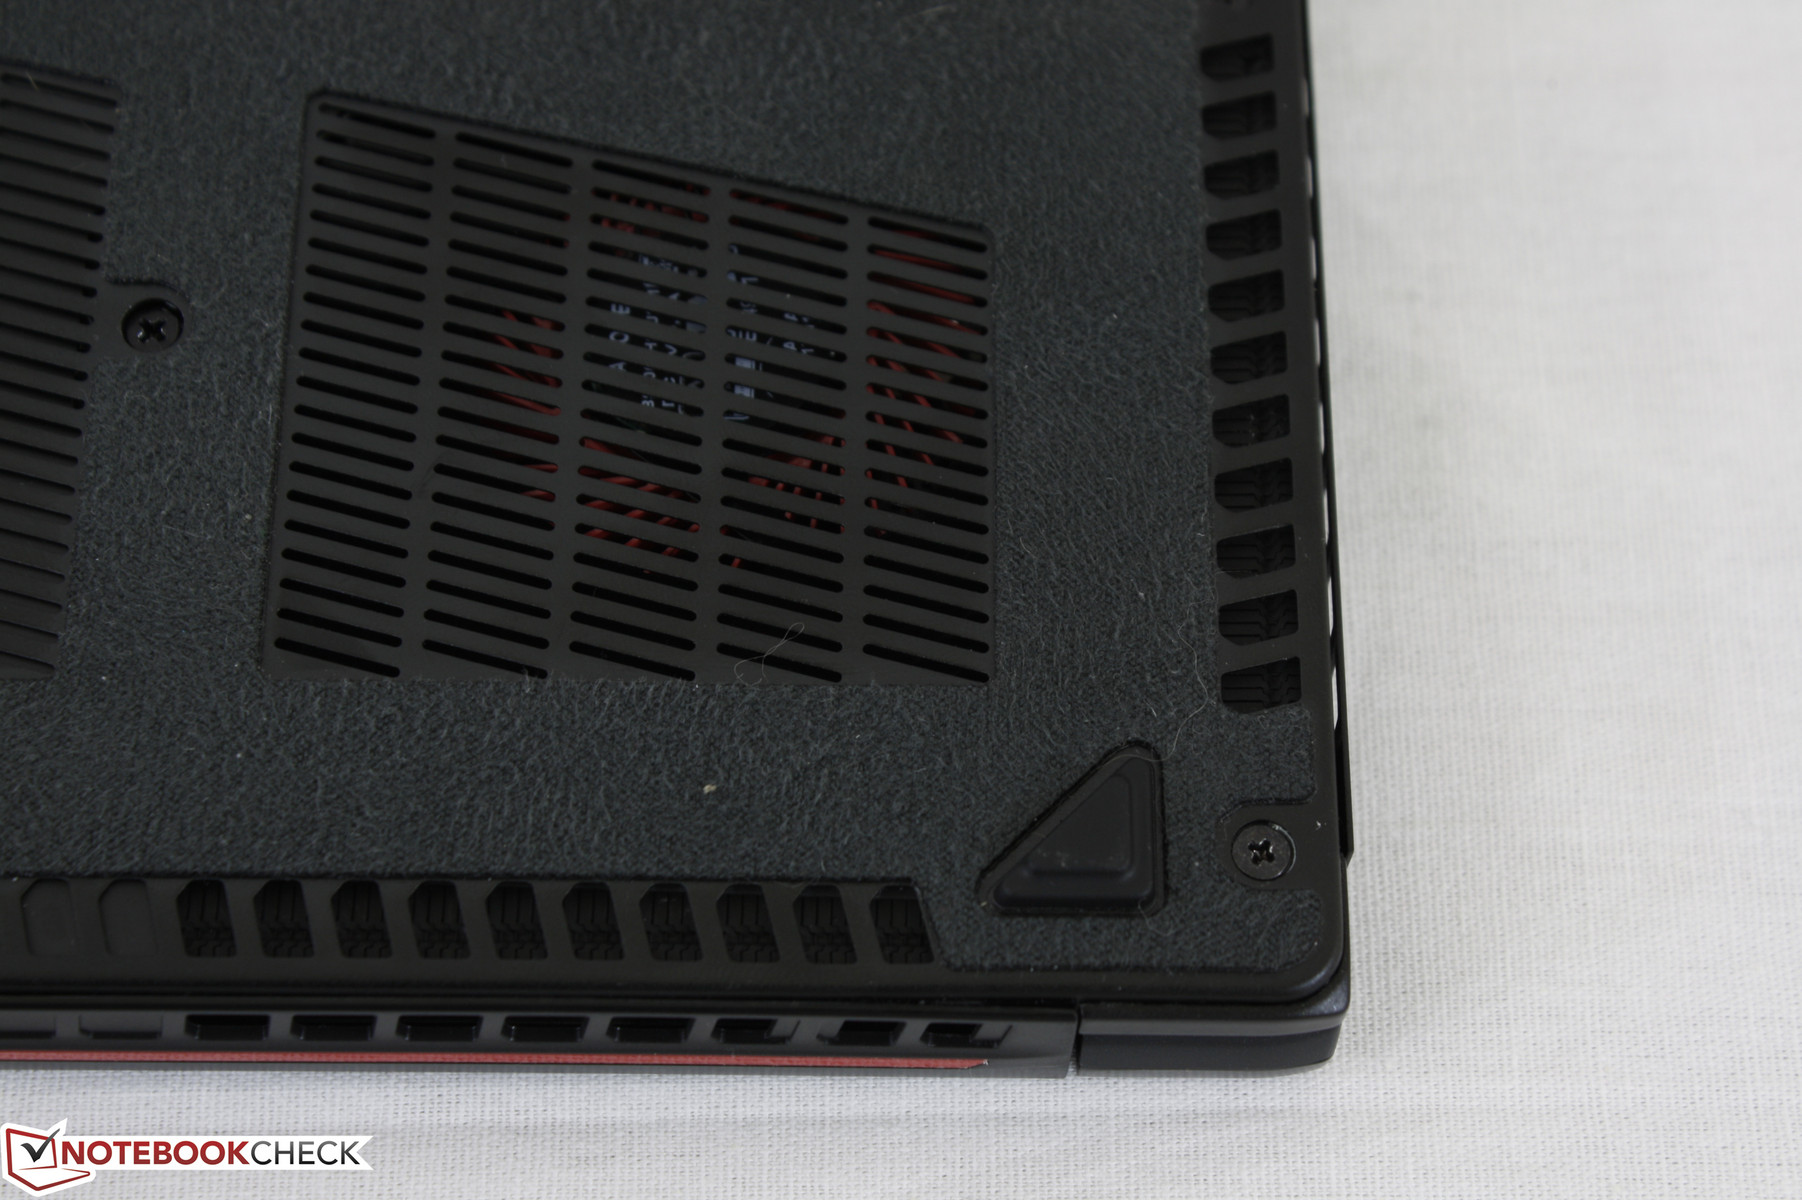
The thin material makeup is also not perfect on our test unit. As shown by the two images below, the ventilation grilles near the right corner of the notebook are not sitting flat against the edge and is instead protruding slightly. We've had this same observation on the larger GS73VR as well, so we're hoping that this isn't a widespread issue with the GS family as a whole.
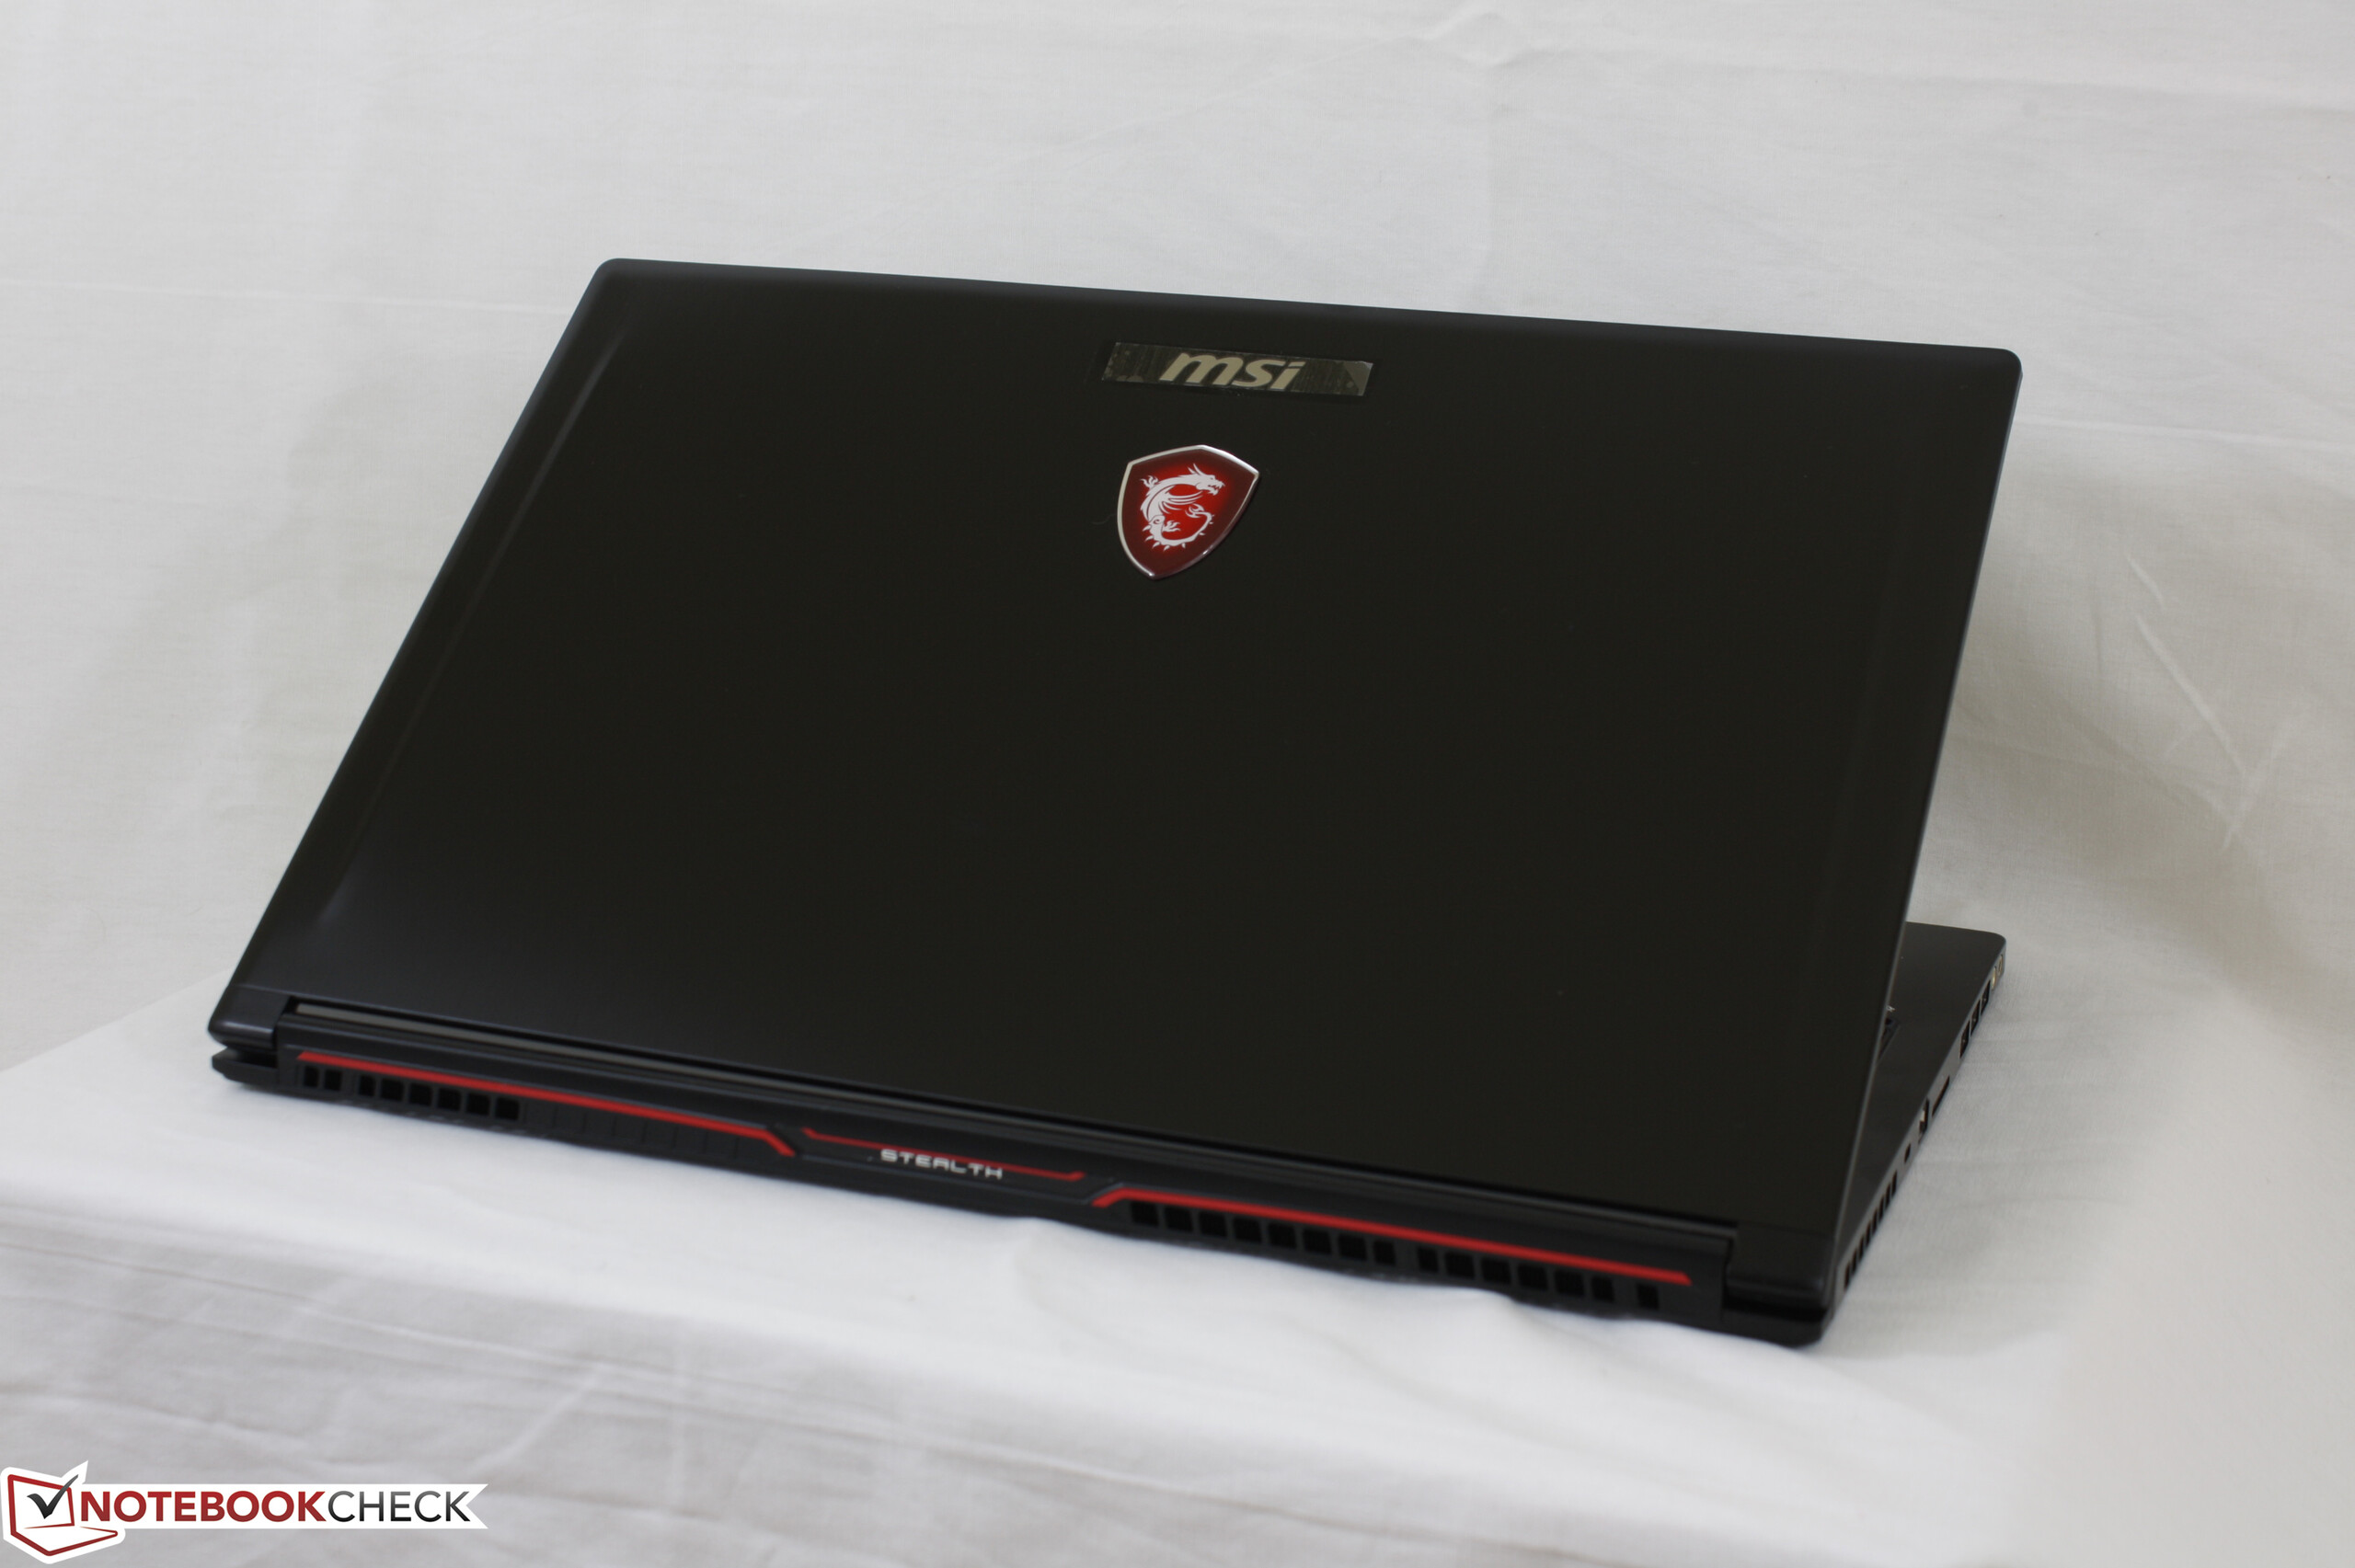
In terms of dimensions and weight, the system is just a millimeter or two thicker than both the XPS 15 and MacBook Pro 15 while being much more powerful than both. It has a larger footprint than either model and is also lighter than the Dell by about 200 g, so the MSI definitely doesn't feel as dense. Nonetheless, the system is surprisingly portable at under 2 kg compared to the significantly heavier Alienware 15 and Asus FX502VM.
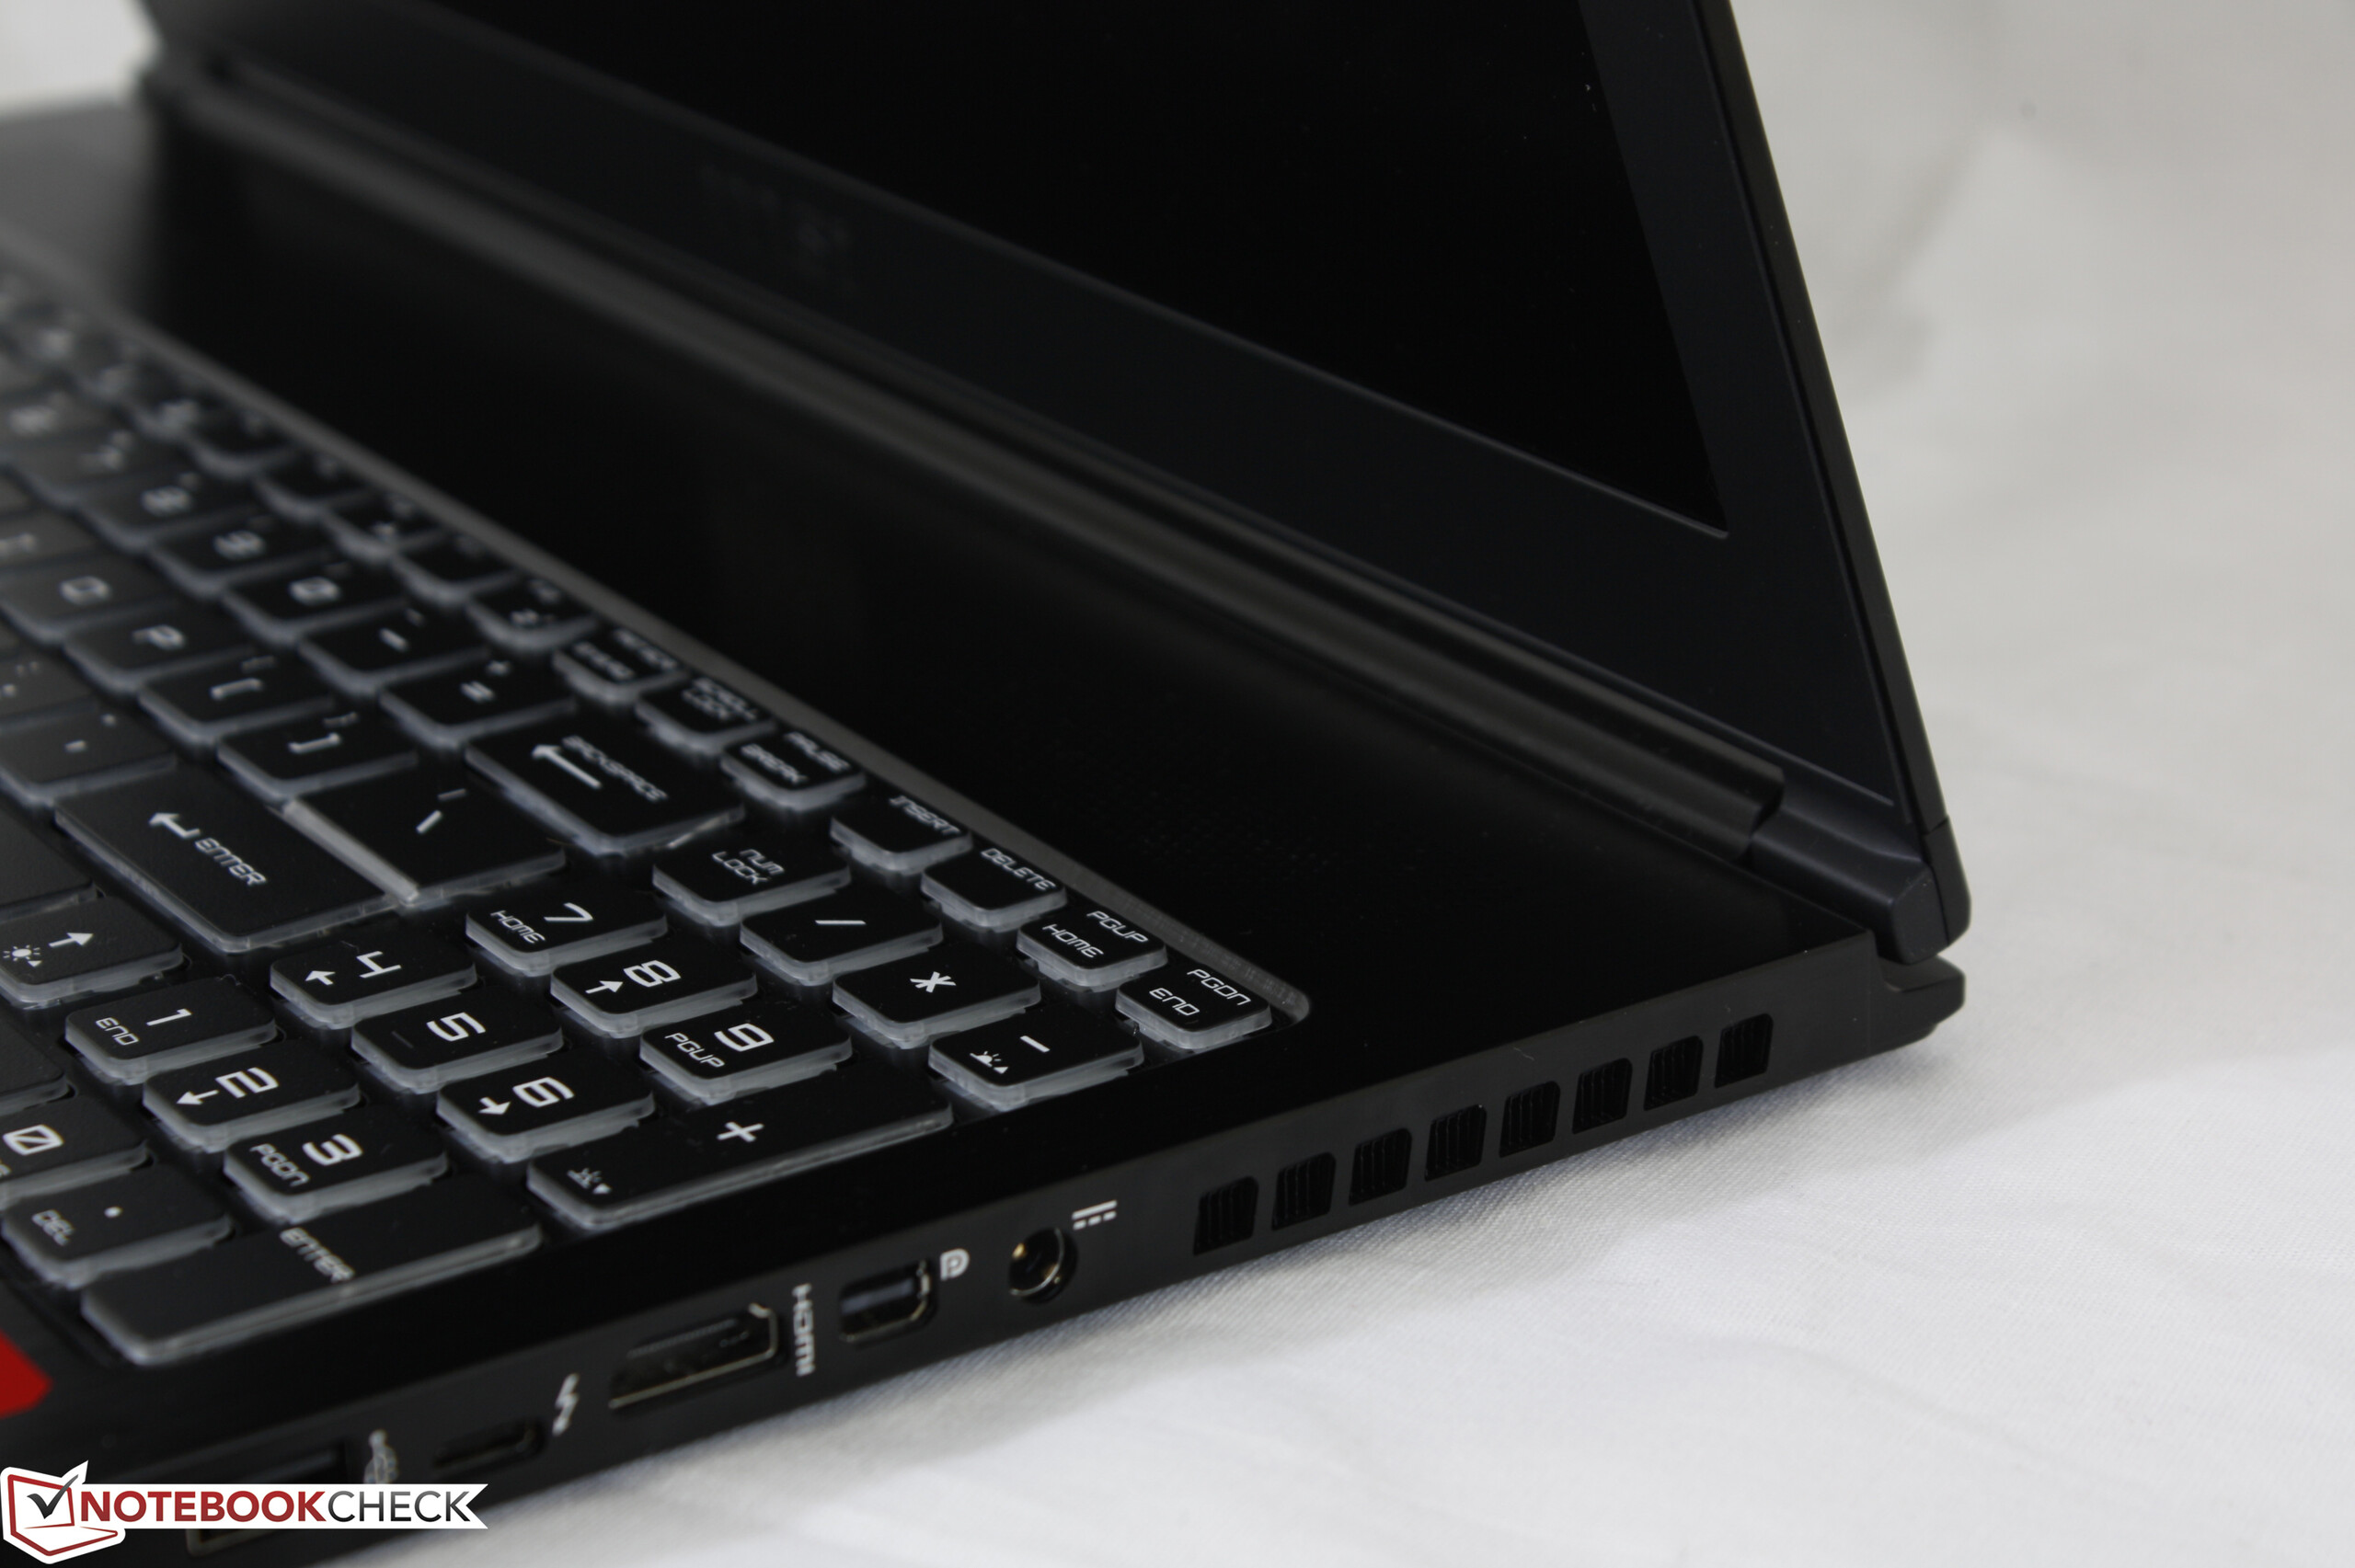
Connectivity
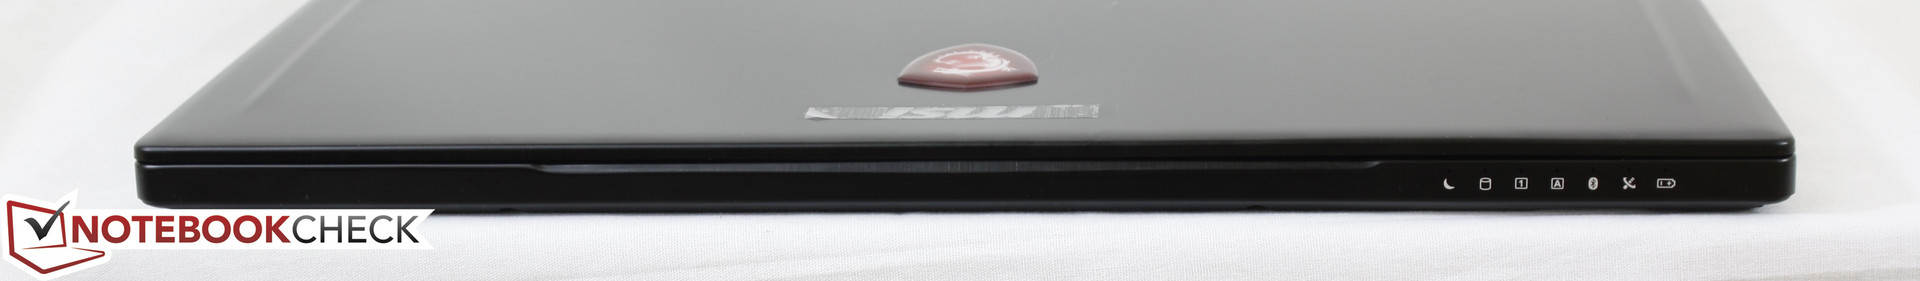
Available ports are plentiful and easy to reach since none are on the rear of the unit. In fact, every option from the larger GS73VR has carried over to the GS63VR untouched including the all-important Thunderbolt 3 port. The left edge is unfortunately quite crowded and ports are located closely to the front, so thicker cables like HDMI or RJ-45 can potentially get in the way. It's also somewhat disappointing that there is no HDMI 2.0 port to more easily take advantage of 4K60 external monitors.
Update: MSI has confirmed with us that the GS63VR 7RF is HDMI 2.0-ready and will output up to 4K60. However, the naming of the port is officially HDMI 1.4 due to delays in licensing.


SD Card Reader
MSI continues to integrate one of the slowest card readers ever on an otherwise high-end gaming machine. The manufacturer has confirmed with us that its card reader is limited by a USB 2.0 controller, so expect transfer rates of just 20 MB/s. Transferring 1 GB worth of photos from our Toshbia UHS-II test card to desktop will take about 43 seconds compared to 6 to 7 seconds on the Eurocom Tornado F5 and MSI GT73VR.
The card reader itself is spring loaded and a fully inserted SD card will protrude by about one-third of its length.
| SD Card Reader | |
| average JPG Copy Test (av. of 3 runs) | |
| Dell XPS 15 9560 (i7-7700HQ, UHD) | |
| Asus FX502VM-AS73 | |
| MSI GS63VR 7RF-228US | |
| maximum AS SSD Seq Read Test (1GB) | |
| Dell XPS 15 9560 (i7-7700HQ, UHD) | |
| Asus FX502VM-AS73 | |
| MSI GS63VR 7RF-228US | |
Communication
WLAN and Bluetooth are provided by a removable Killer 1535 M.2 module. We experienced no connectivity issues when connected to a Linksys EA8500 802.11ac router. Killer WLAN provides both hardware and software advantages over the more common Intel WLAN solutions as detailed in our review of the Killer 1535.
| Networking | |
| iperf3 transmit AX12 | |
| MSI GS63VR 7RF-228US | |
| Dell XPS 15 9560 (i7-7700HQ, UHD) | |
| Asus FX502VM-AS73 | |
| iperf3 receive AX12 | |
| MSI GS63VR 7RF-228US | |
| Dell XPS 15 9560 (i7-7700HQ, UHD) | |
| Asus FX502VM-AS73 | |
Accessories
Included extras are a Quick Start guide, warranty card, velvet cleaning cloth, and a drivers/utilities DVD. An external optical drive will be needed to make use of the disc. The GUS graphics dock and other generic Thunderbolt 3 add-ons should be compatible with the system as well, at least in theory.
Maintenance
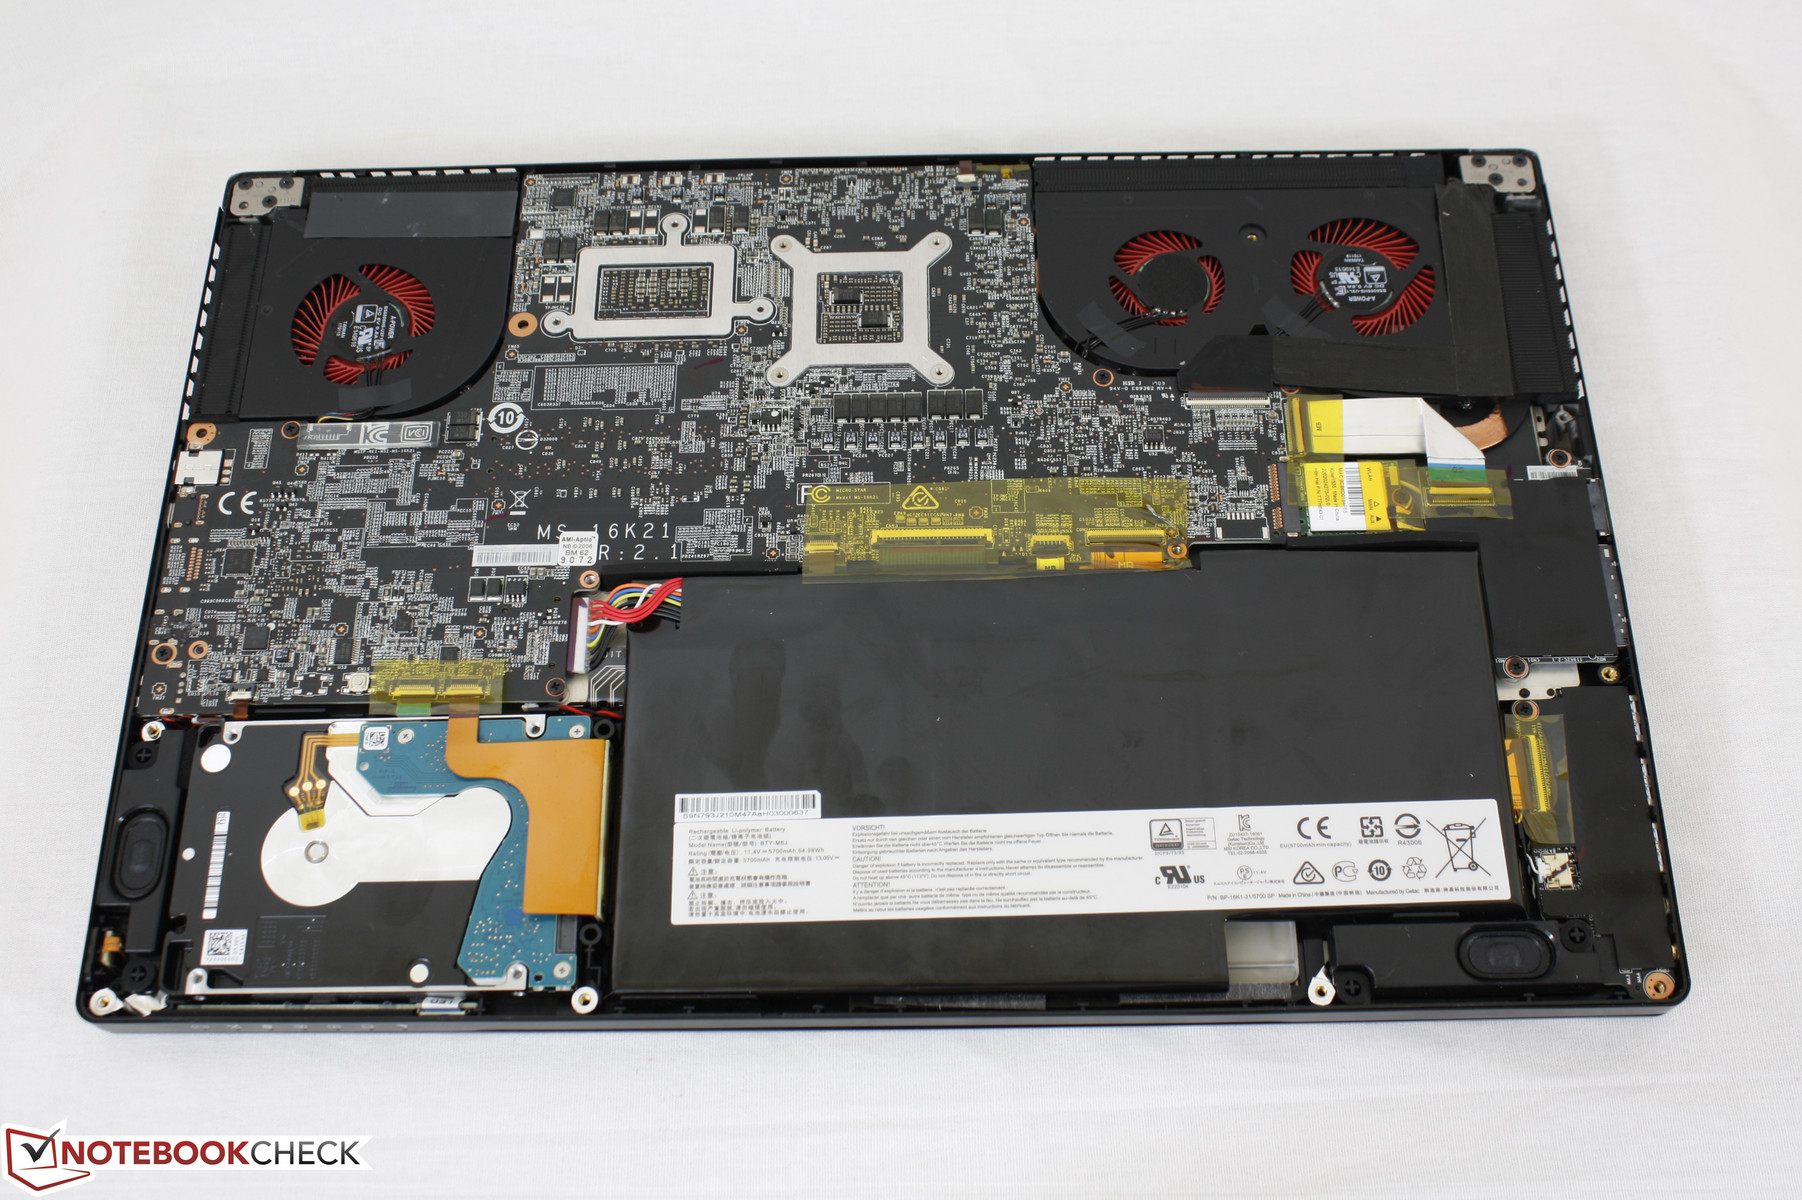
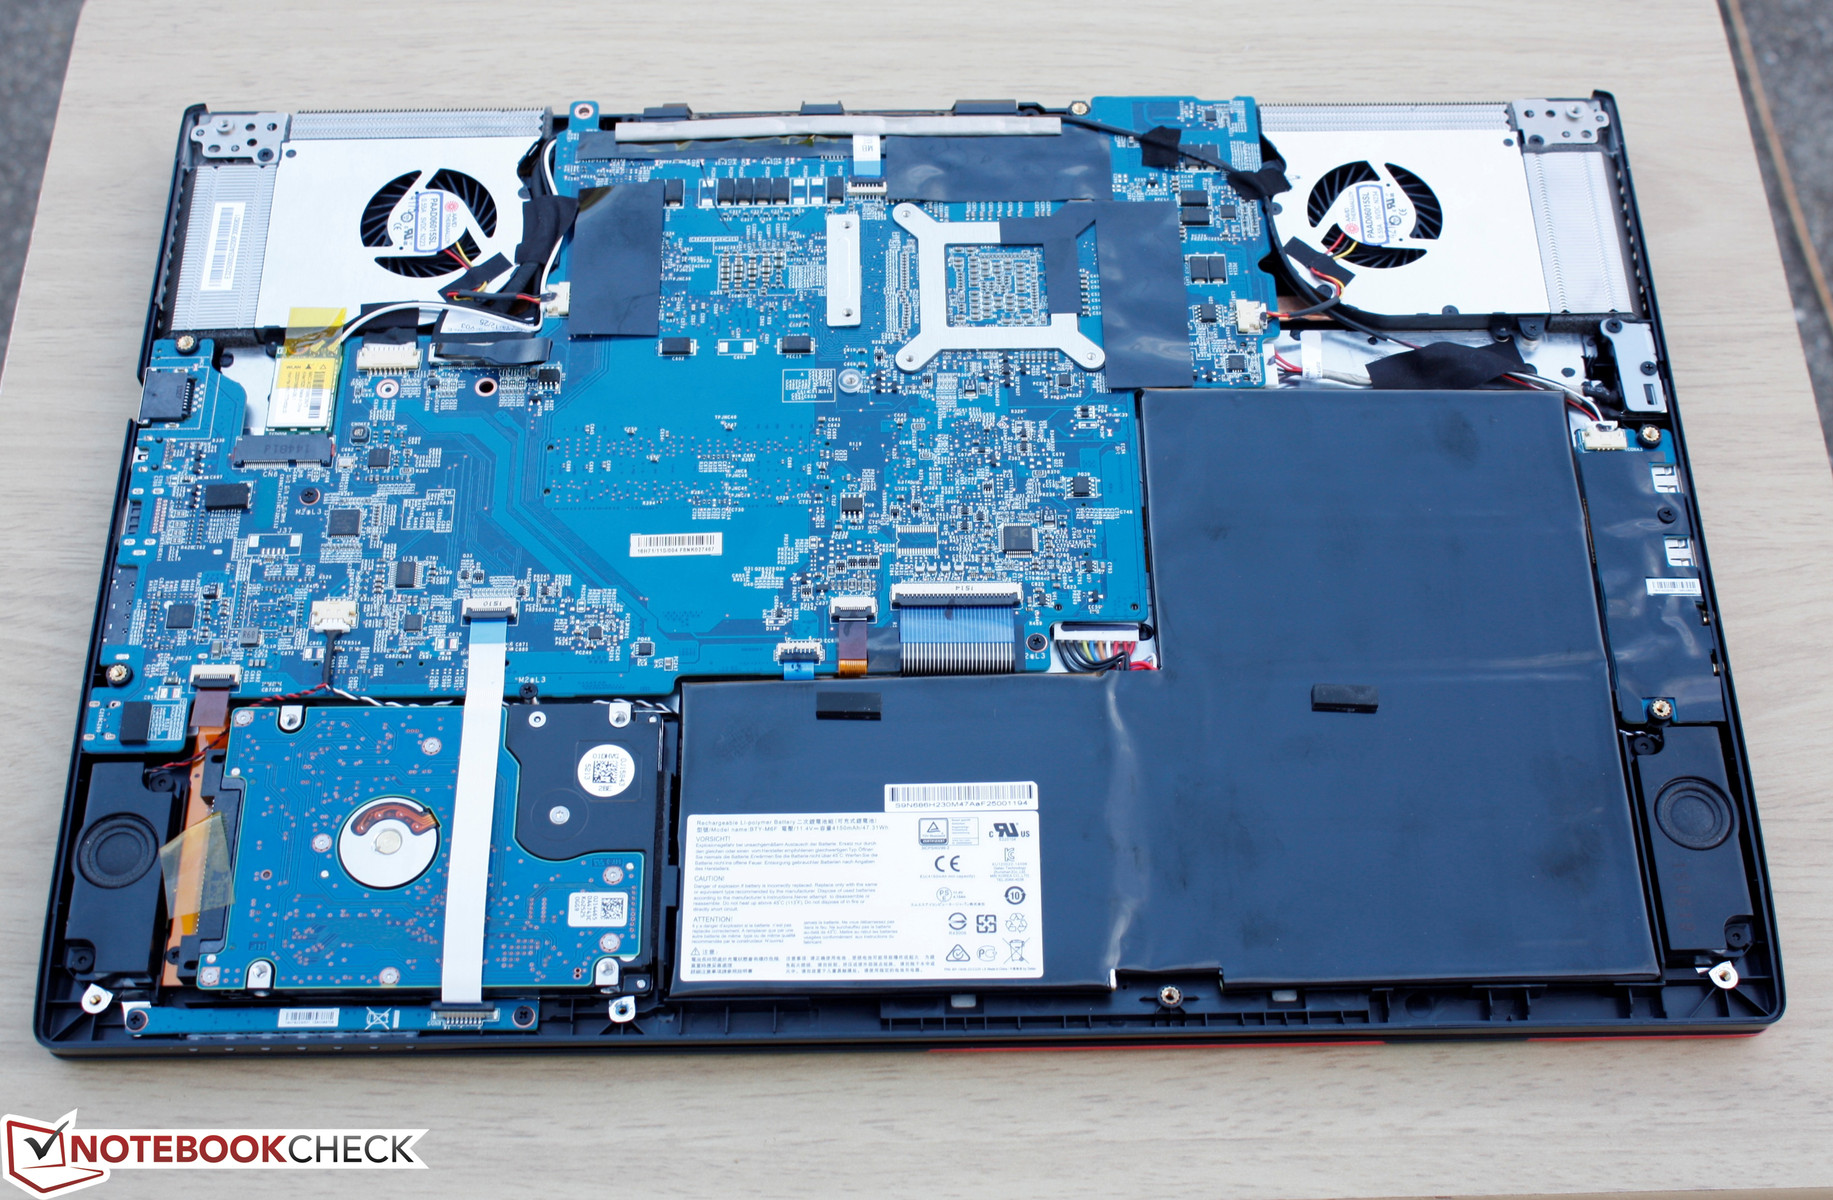
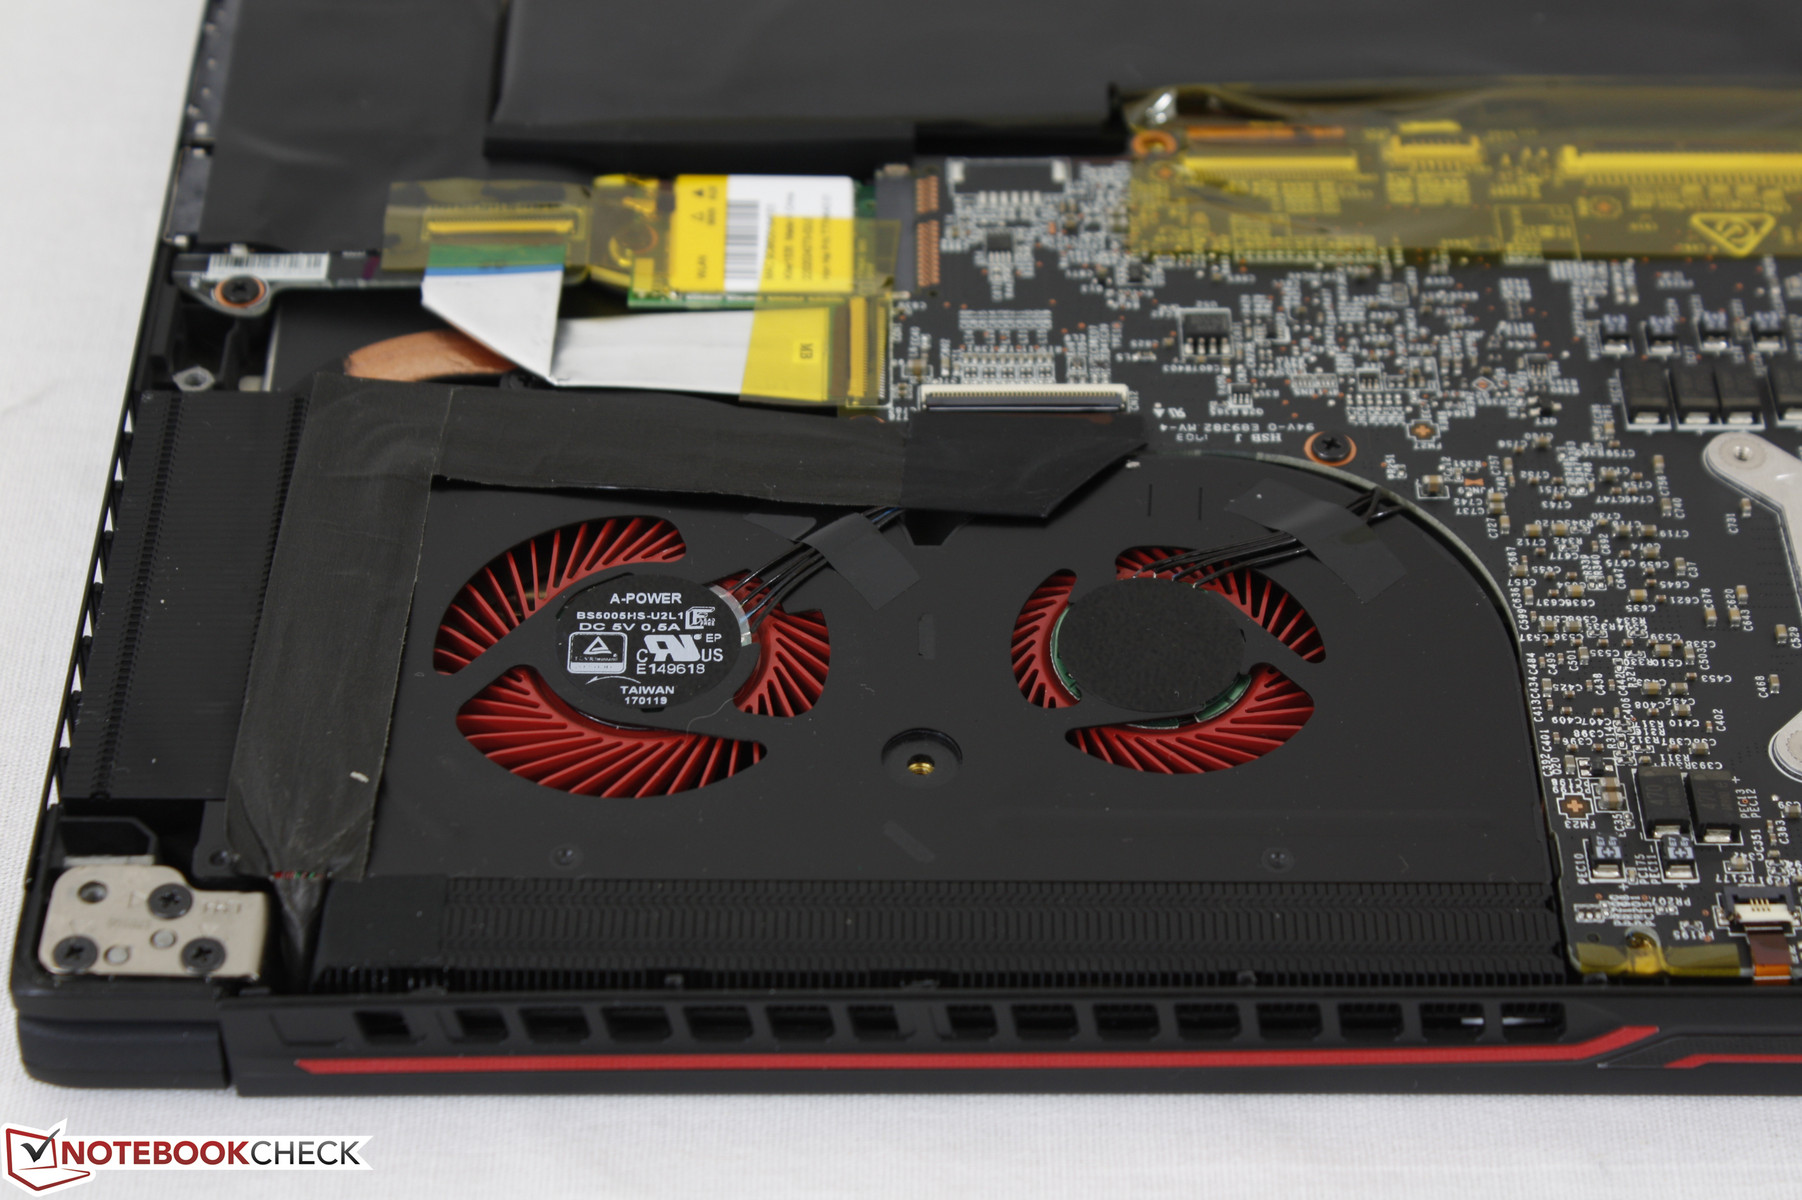
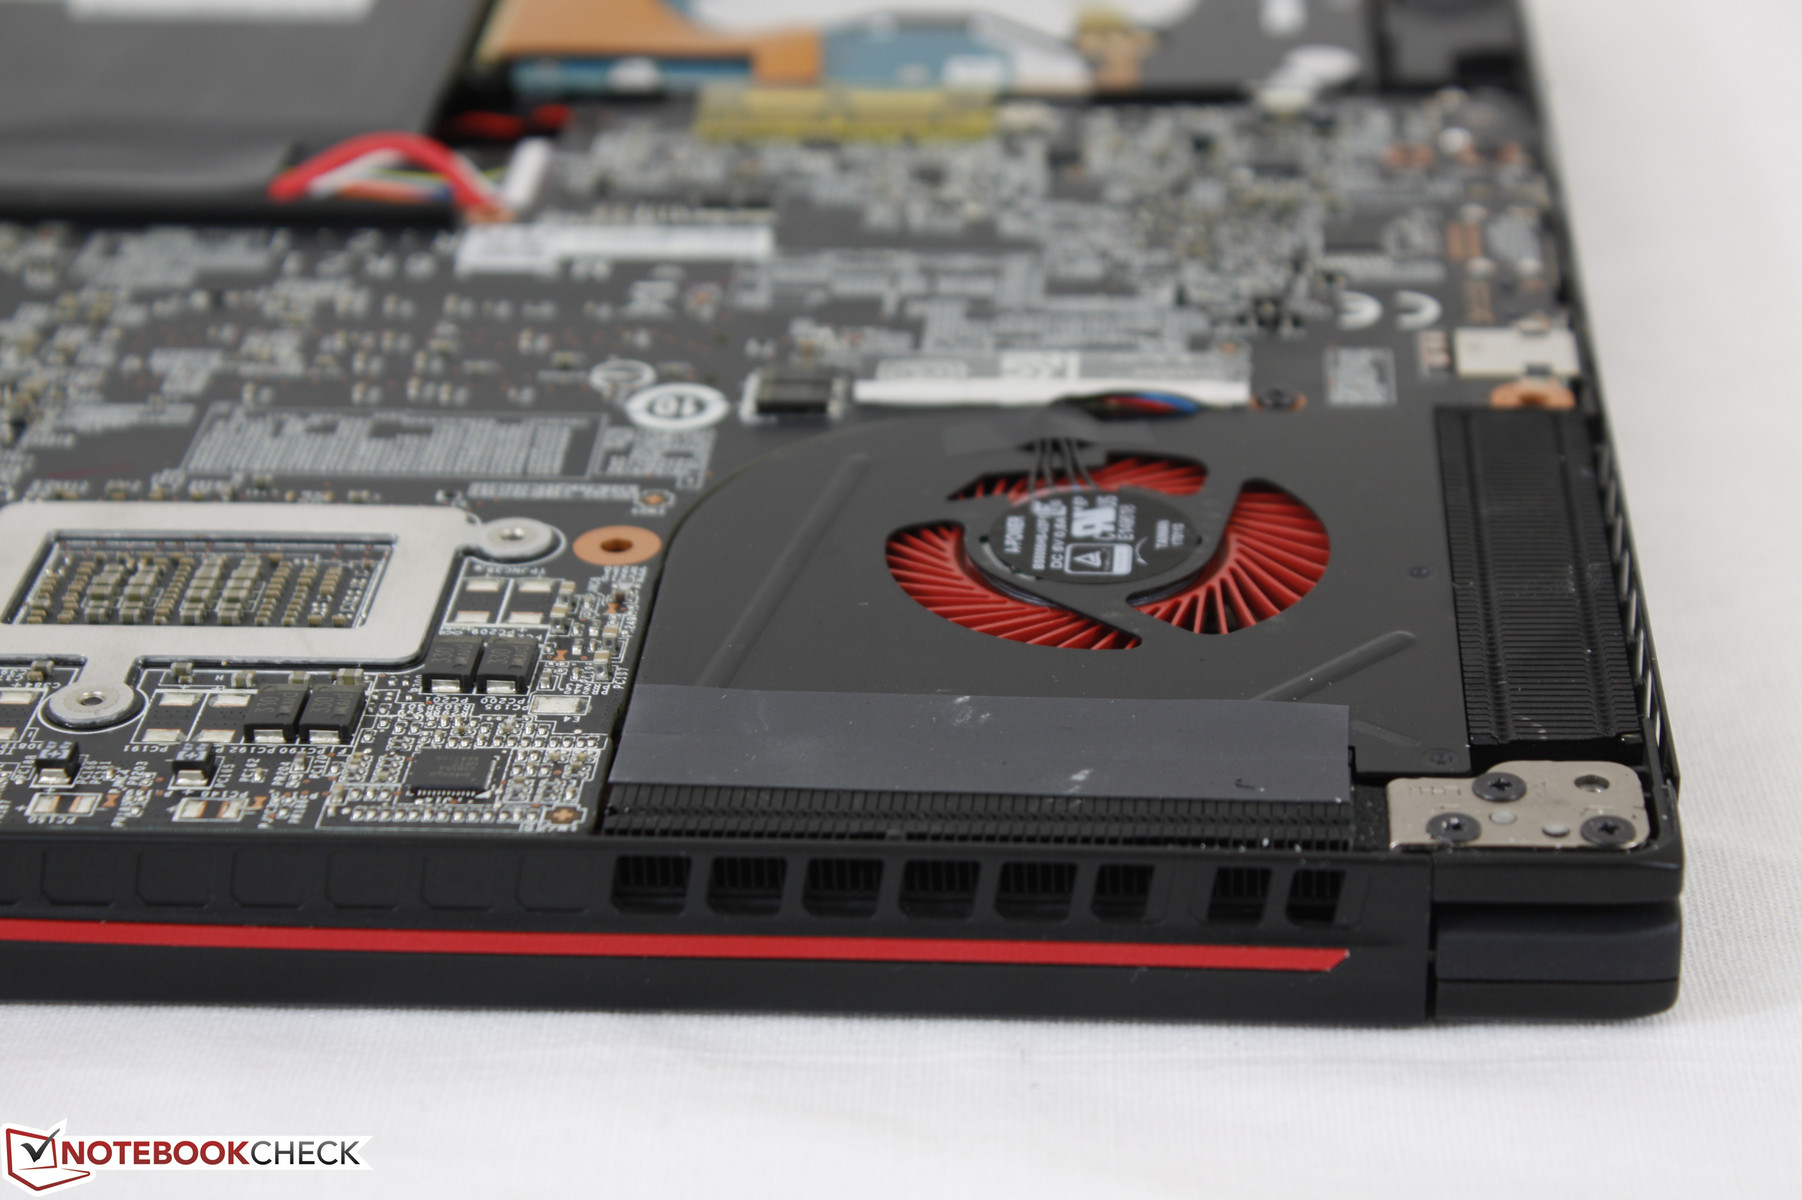
The bottom panel requires only a Philips screwdriver to remove, though users should be careful of the sharp edges and corners when prying the rear latches. Access to the main motherboard components including the heat pipes, M.2 2280 slot, and 2x DDR4 SODIMM slots require further disassembly not unlike on the original GS60 Ghost.
Note that removal of the bottom maintenance panel requires destroying a warranty sticker first. Thus, users may risk voiding the manufacturer warranty if deciding to service any components.
Warranty
MSI offers one-year limited manufacturer warranty on new laptop purchases compared to two years from Gigabyte and Aorus. CUKUSA will cover any components installed by the reseller for three years including RAM and storage drives.
Please see our Guarantees, Return Policies and Warranties FAQ for country-specific information.
Input Devices
Keyboard
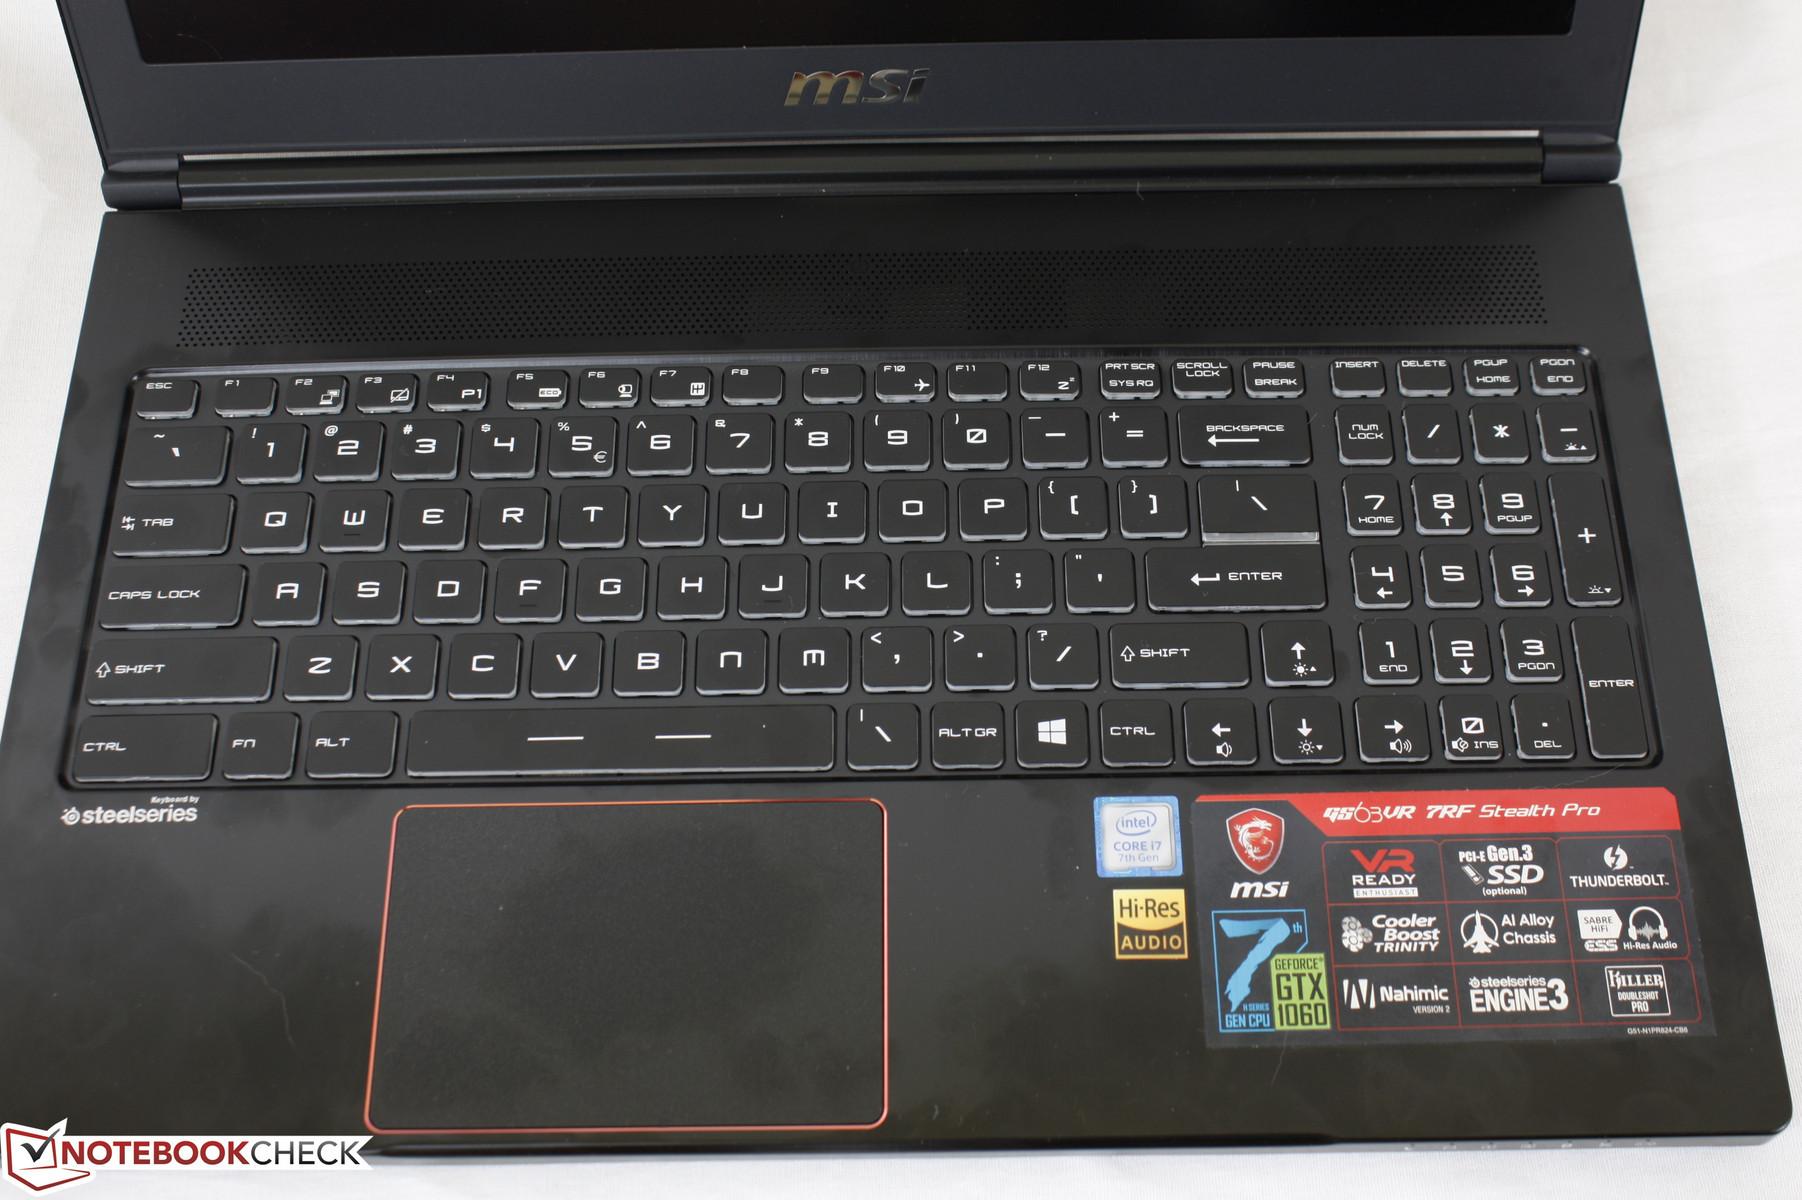
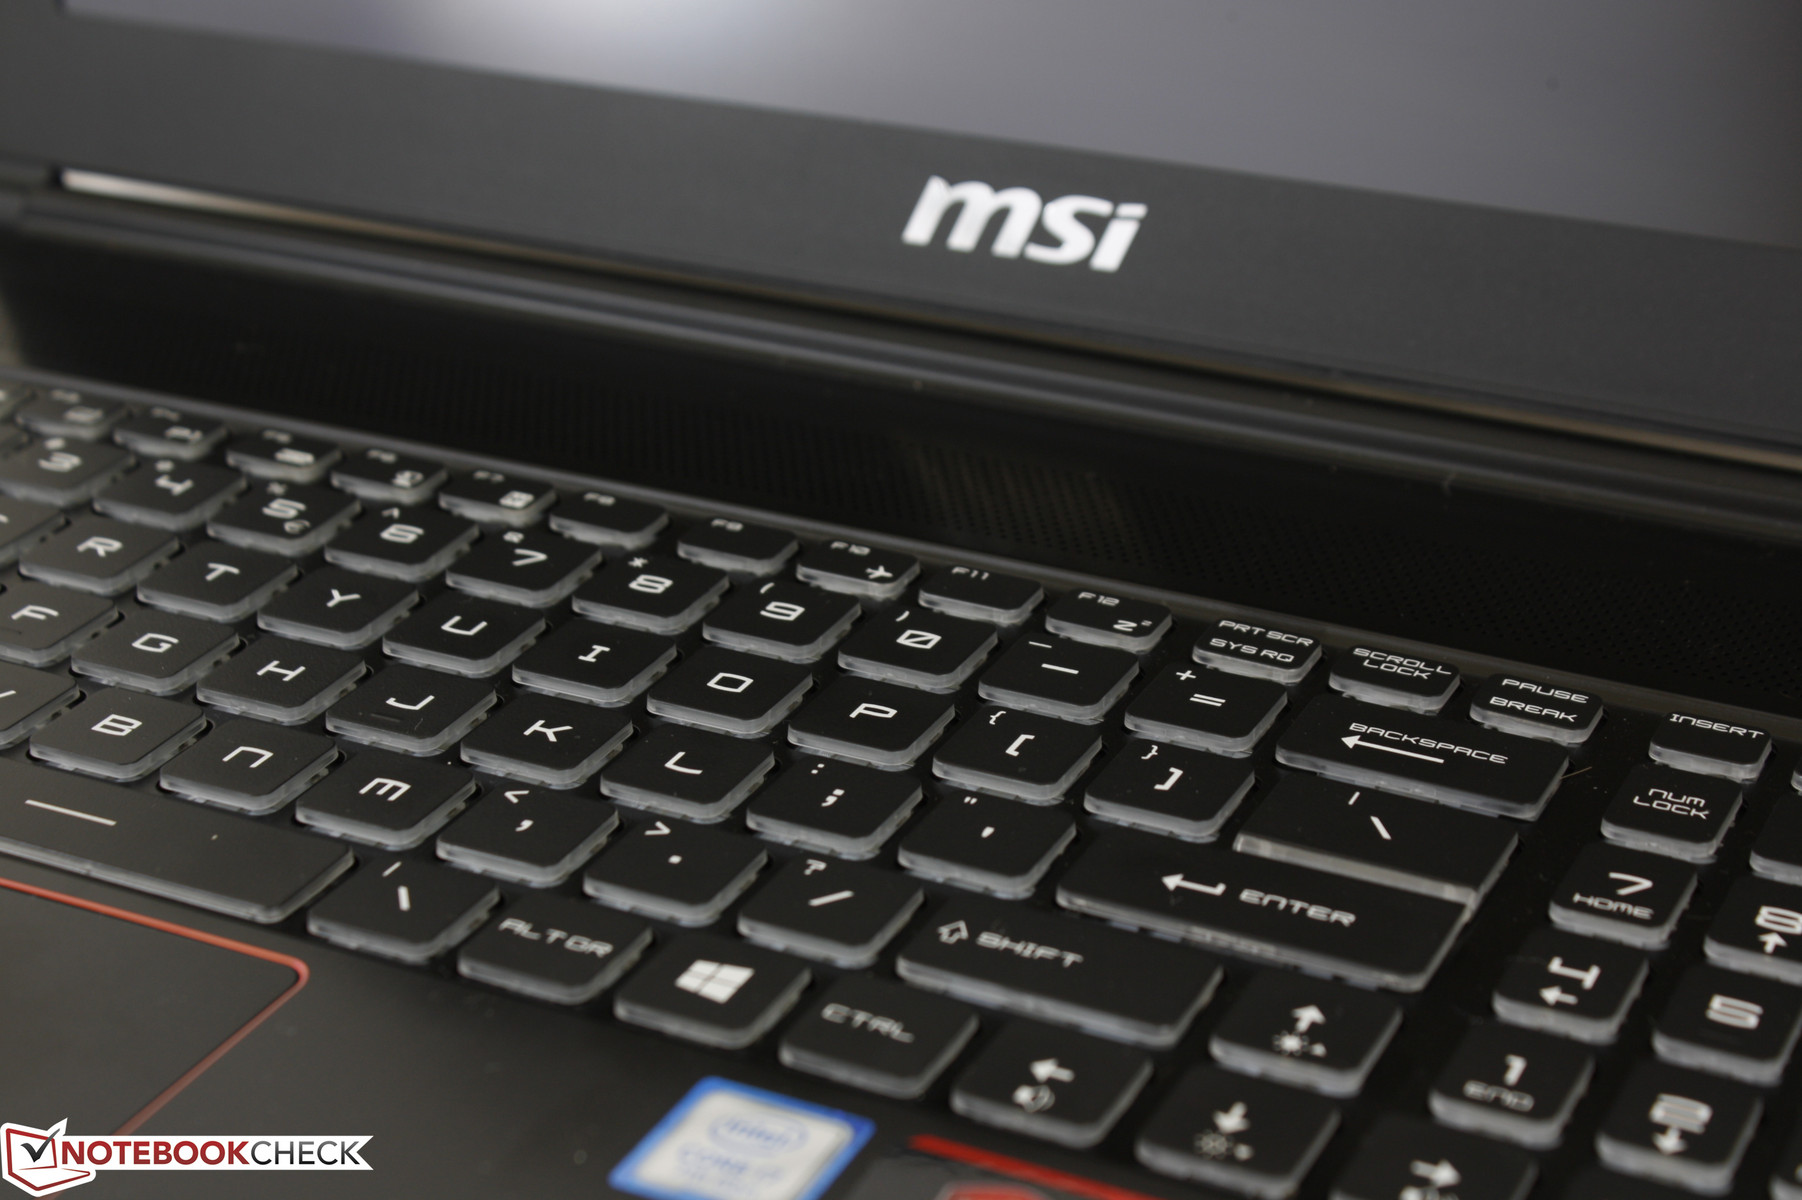
MSI uses the familiar SteelSeries keyboard across its high-end lineup of gaming notebooks and the GS series is no exception. Gamers who have played on a GT72 should feel right at home as the keys are firm in feedback, do not wiggle in place, and clatter relatively quietly. Feedback is just slightly softer than on the GT72, however, since the keyboard base of the GS63VR is not as rigid as on the larger GT series. The NumPad is smaller than the main QWERTY keys and there are no dedicated auxiliary keys for additional functions. The three-zone RGB backlight makes its return, though a small part of us is hoping that future MSI notebooks will incorporate individually-lit RGB keys not unlike the latest Aorus and Razer systems.
Touchpad
The smooth plastic trackpad works as one would expect with no noticeable cursor jitters or unreliable corners. Pushing down on its center will not significantly warp the surface and the thin red chrome lining looks much classier than the printed plastic lining on many Asus ROG units including the G753. Less impressive are the integrated keys of the touchpad as feedback is soft and shallow. A fair amount of force is required to register a click, so clicking repetitively in quick succession can become tiresome.
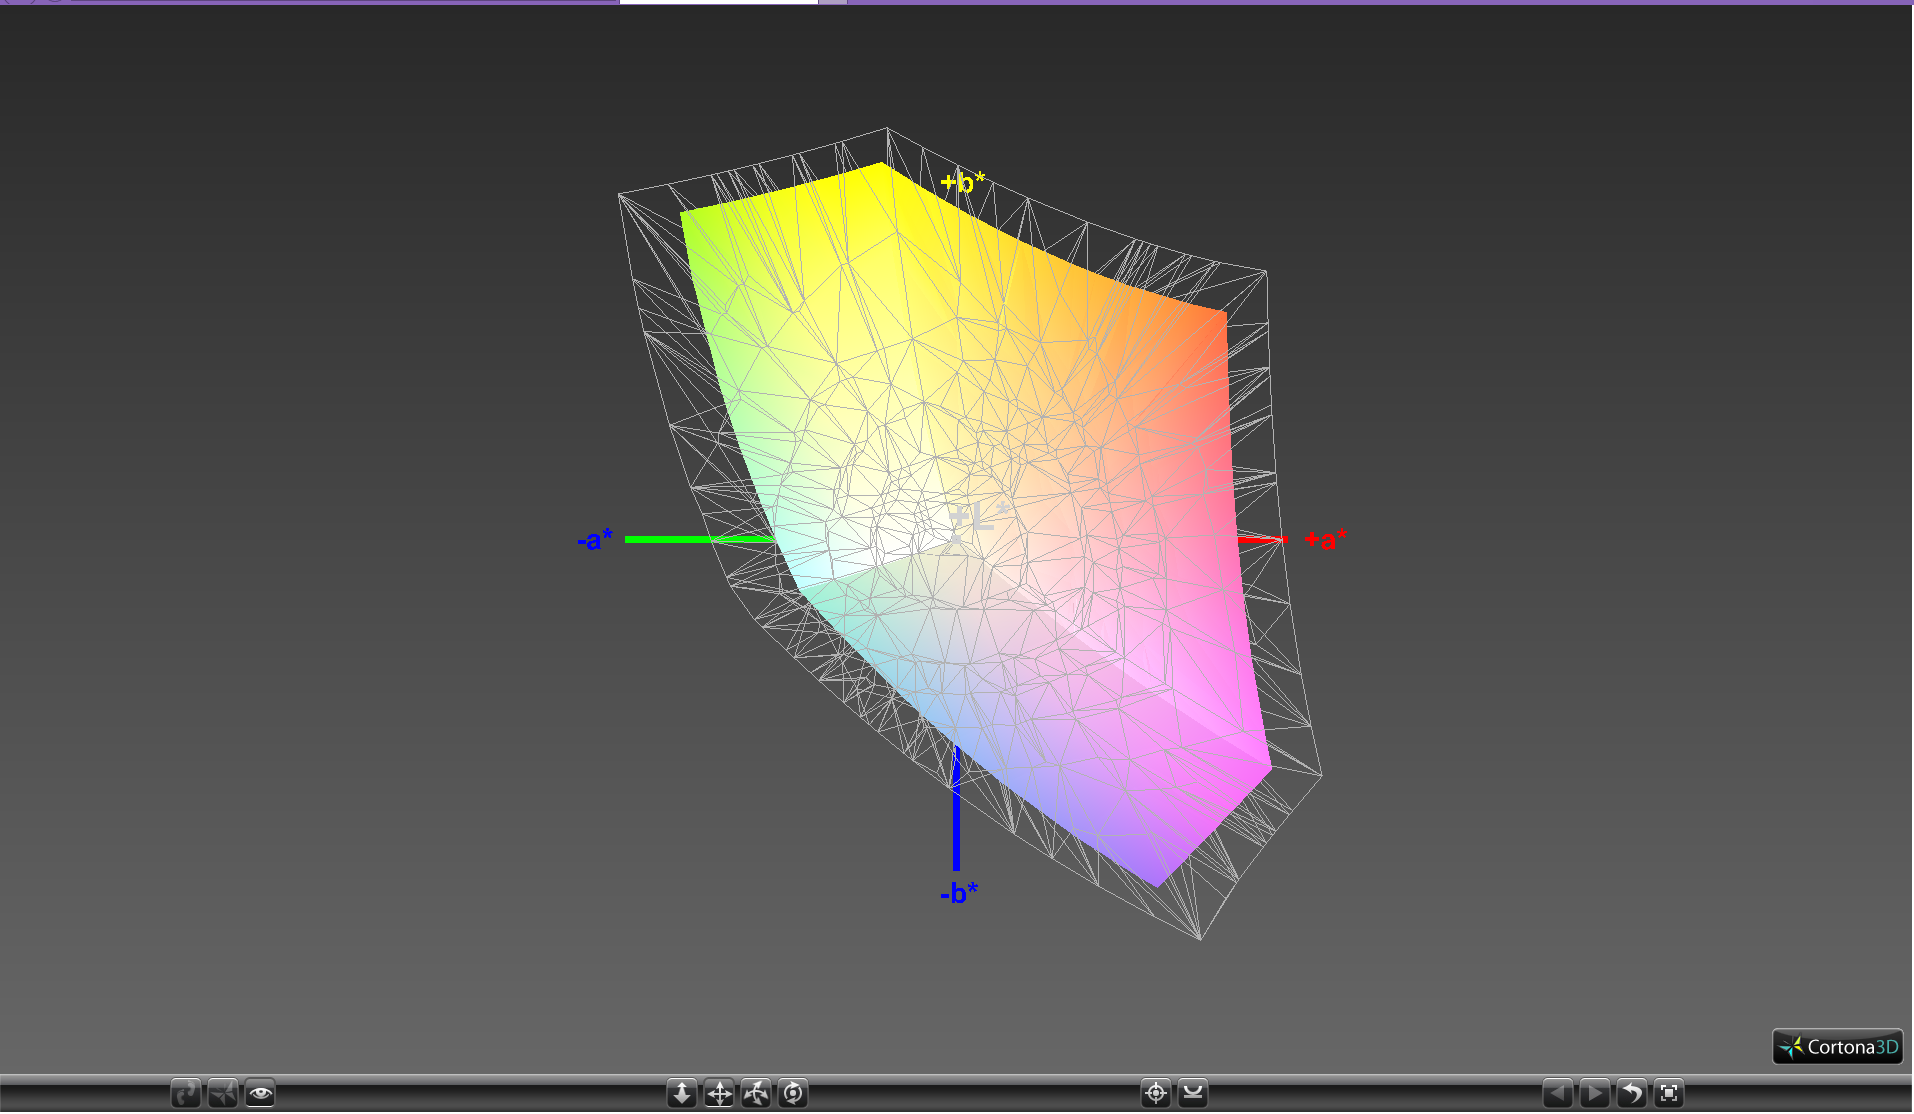
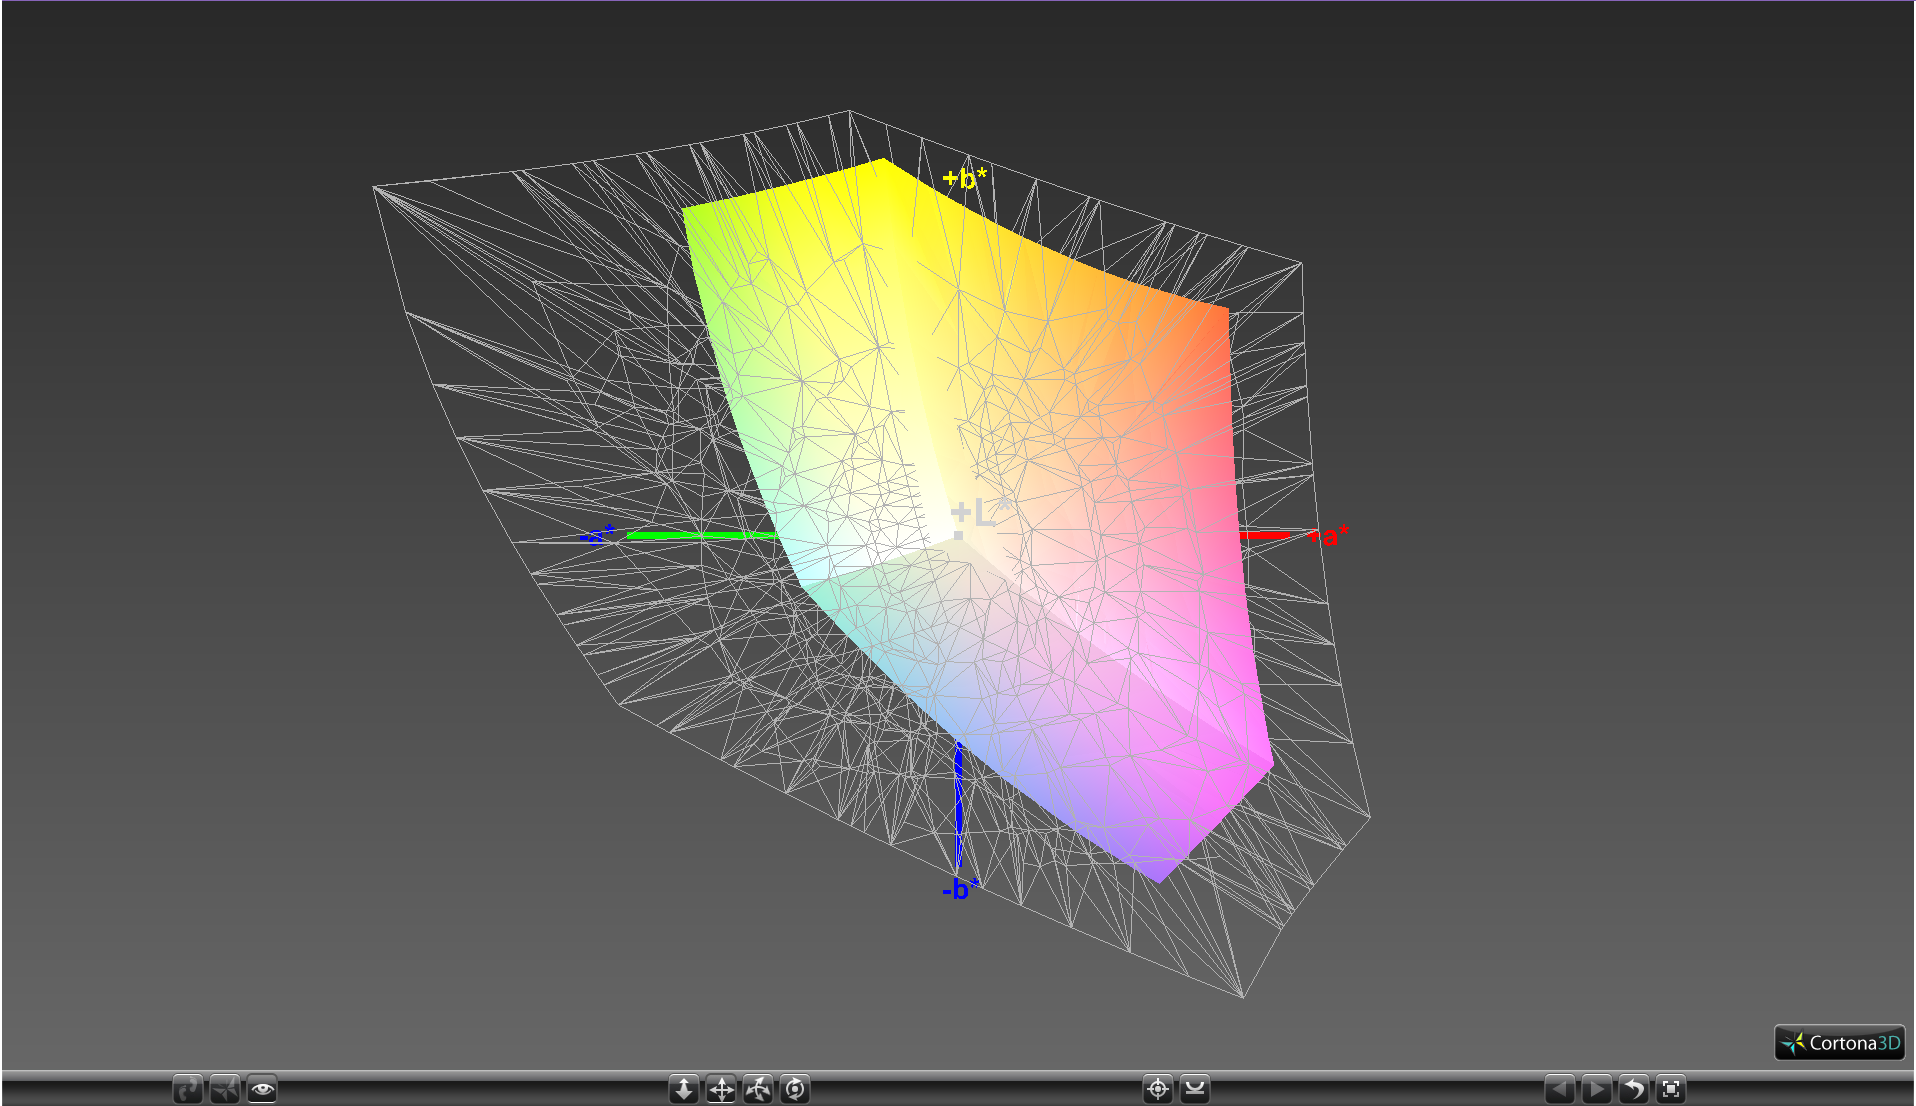
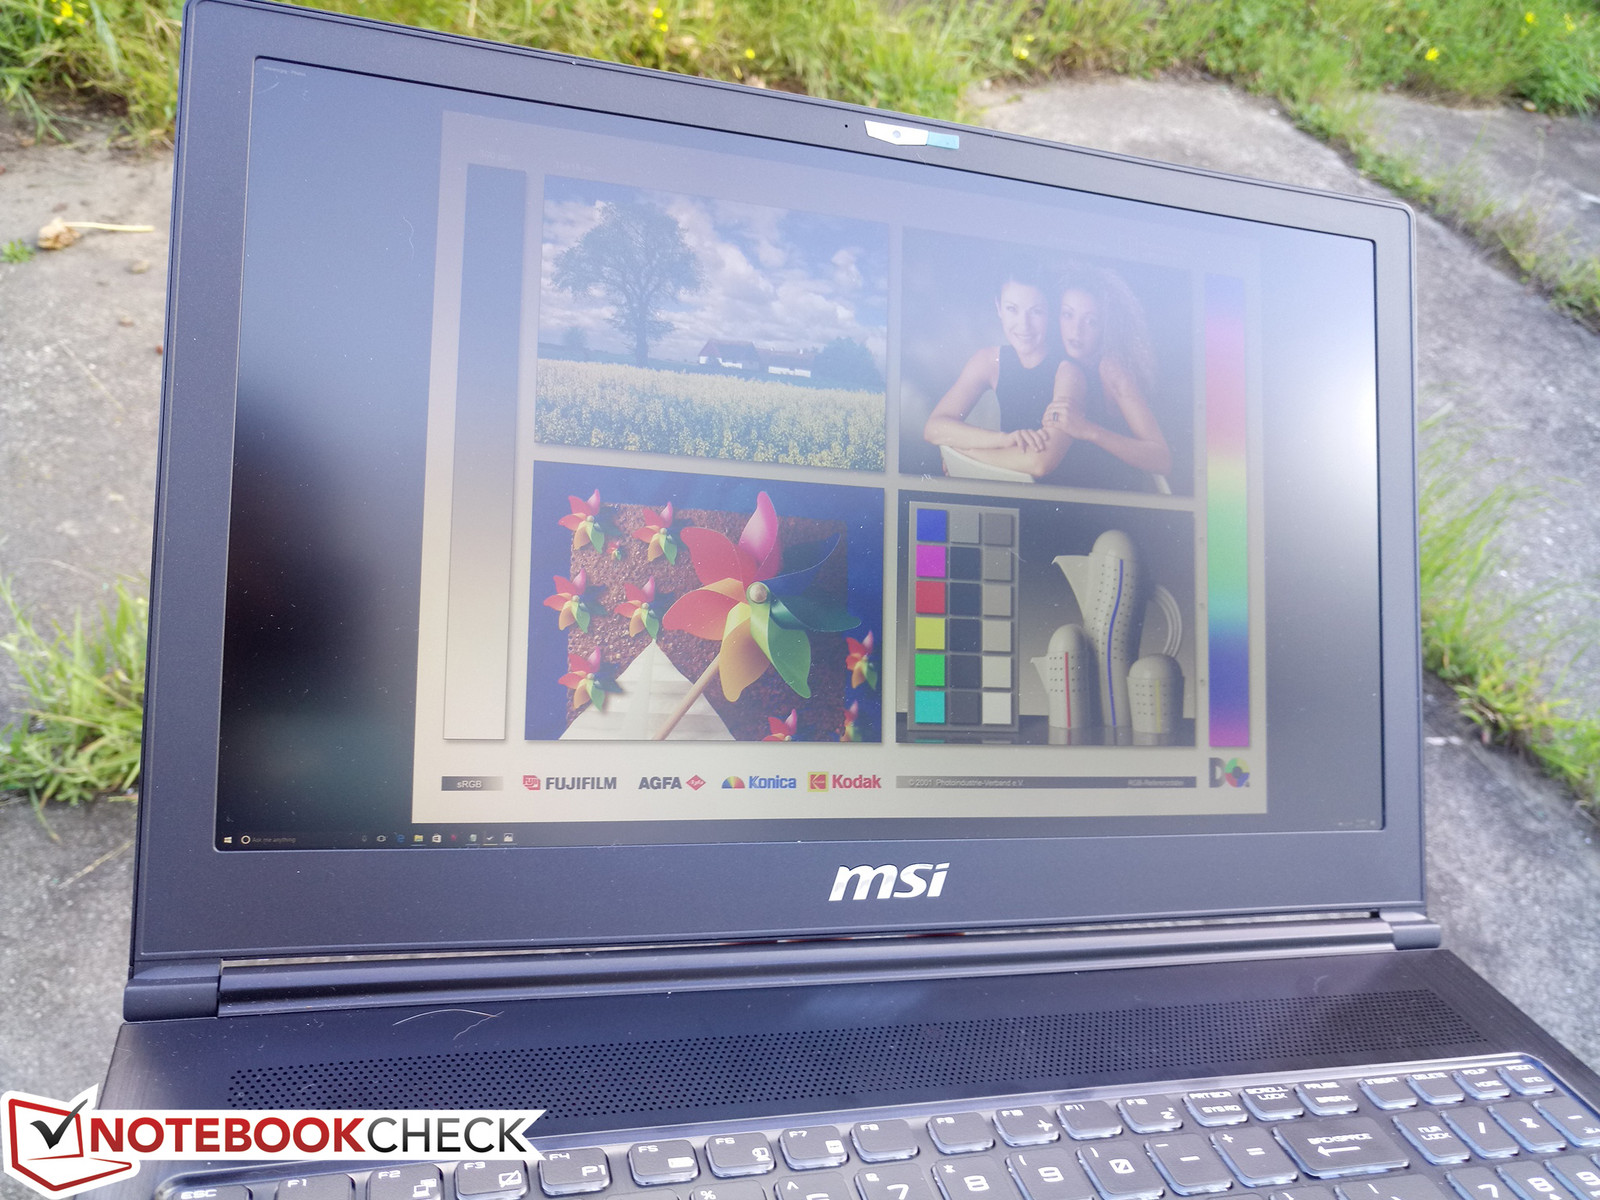
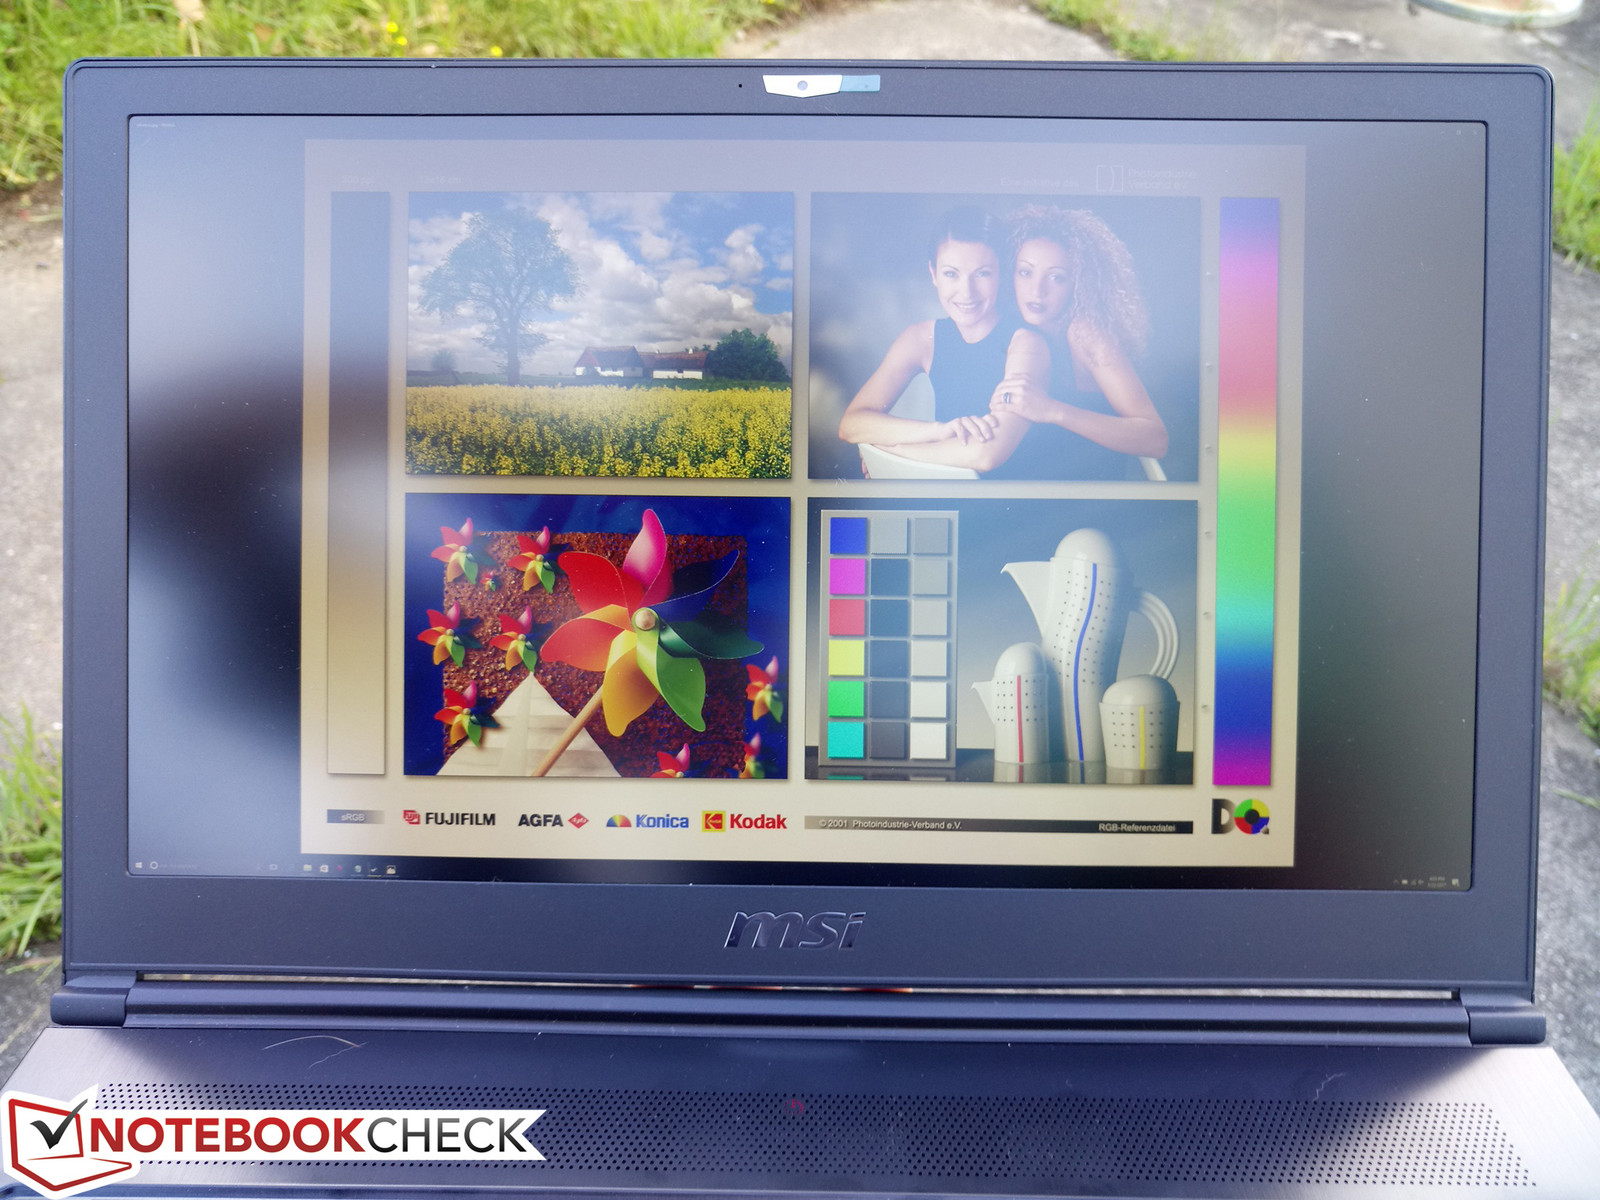
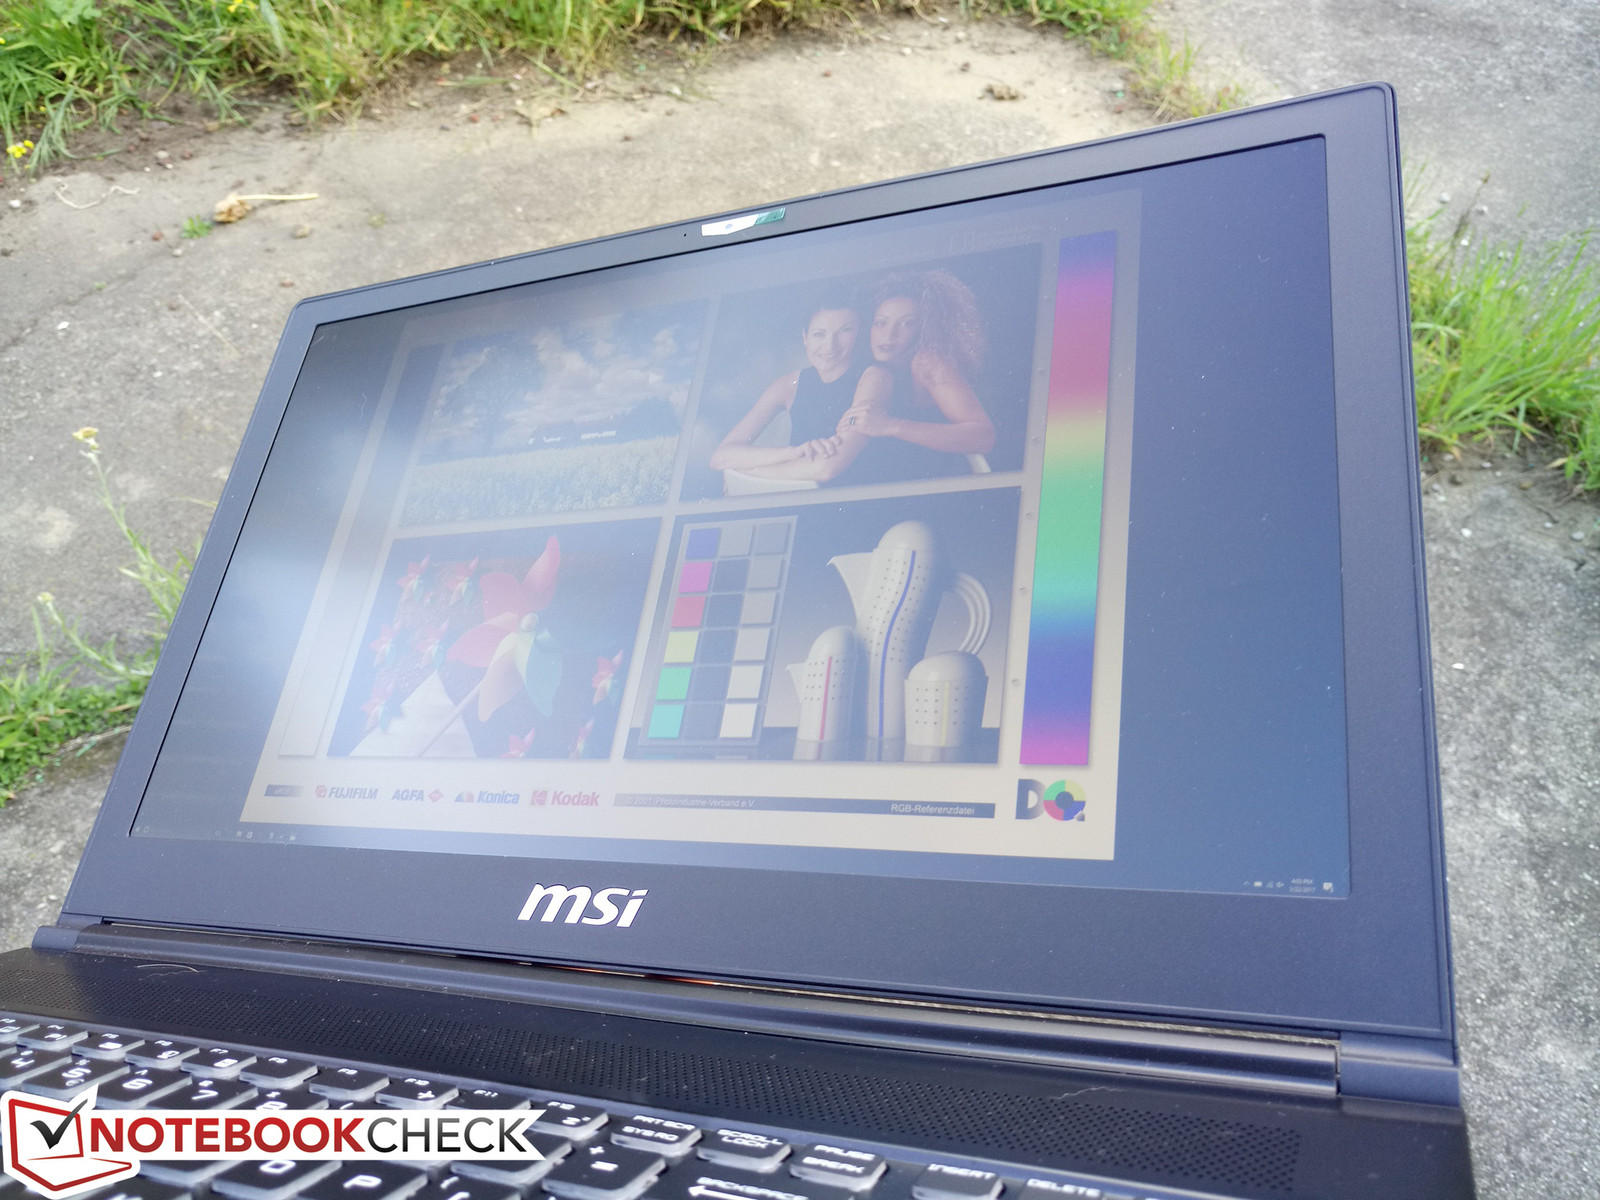
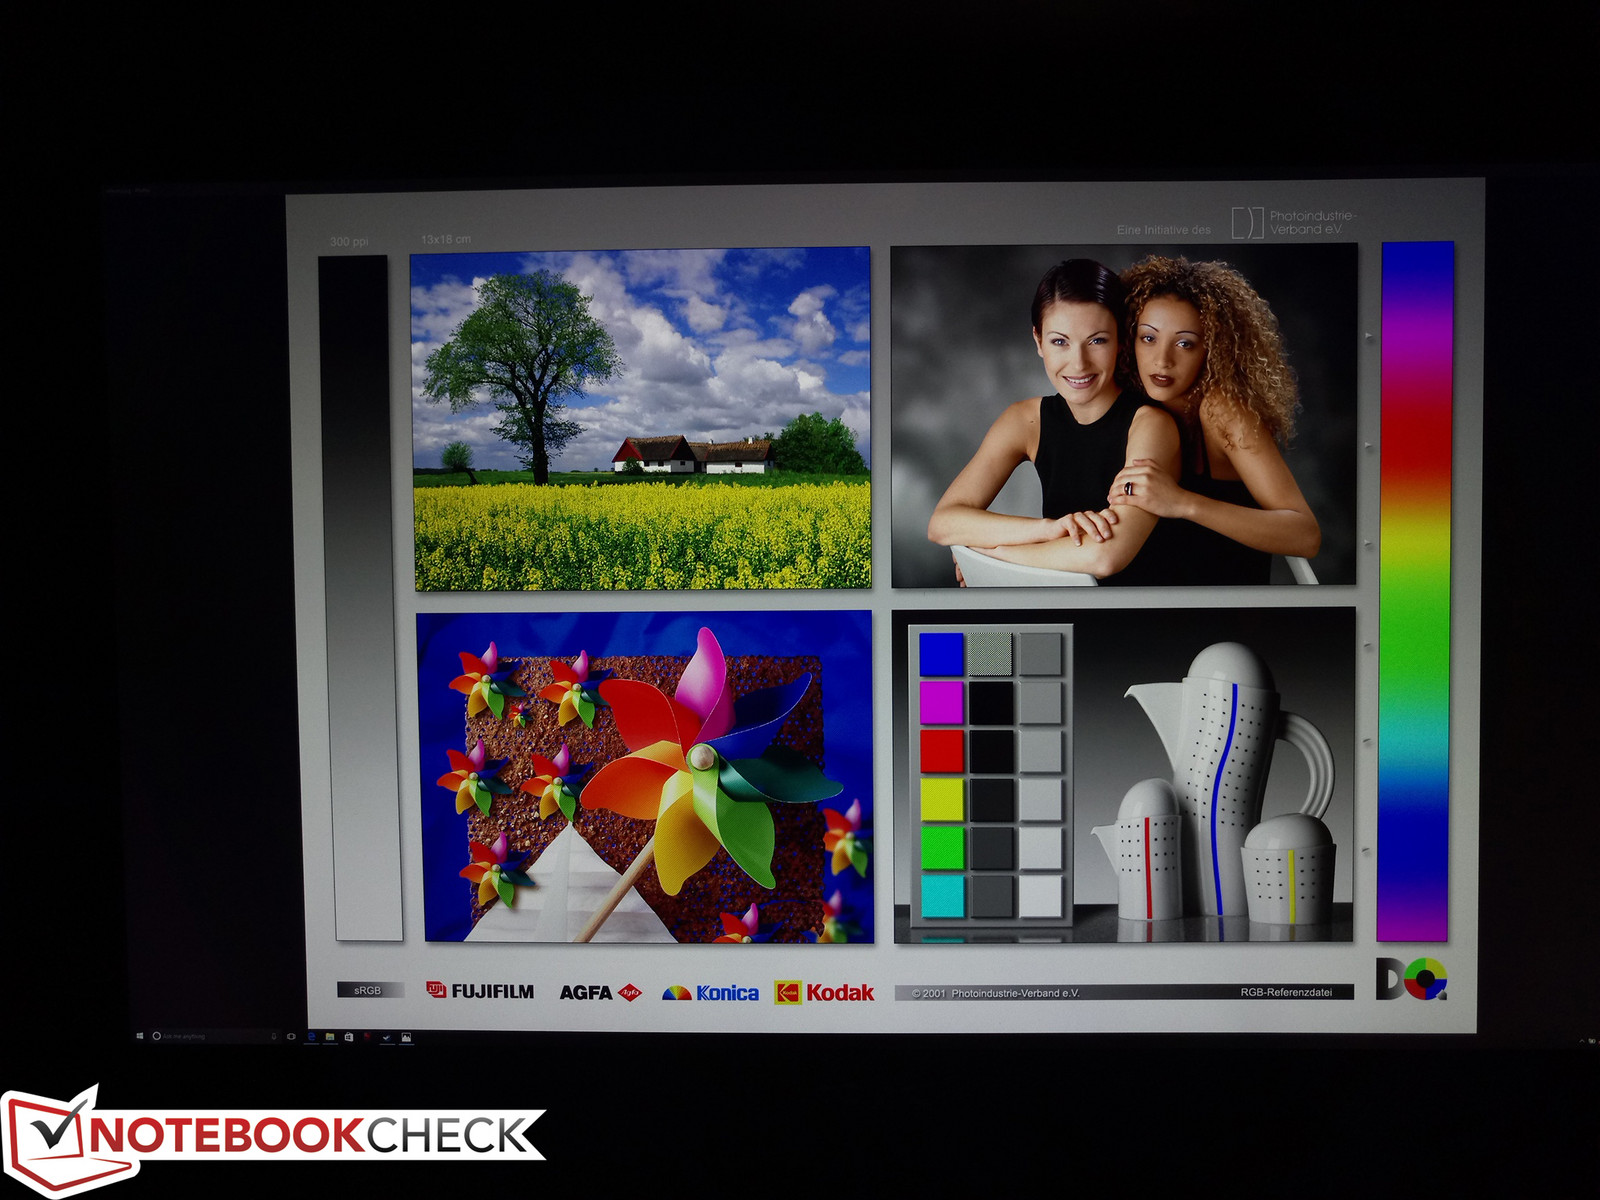
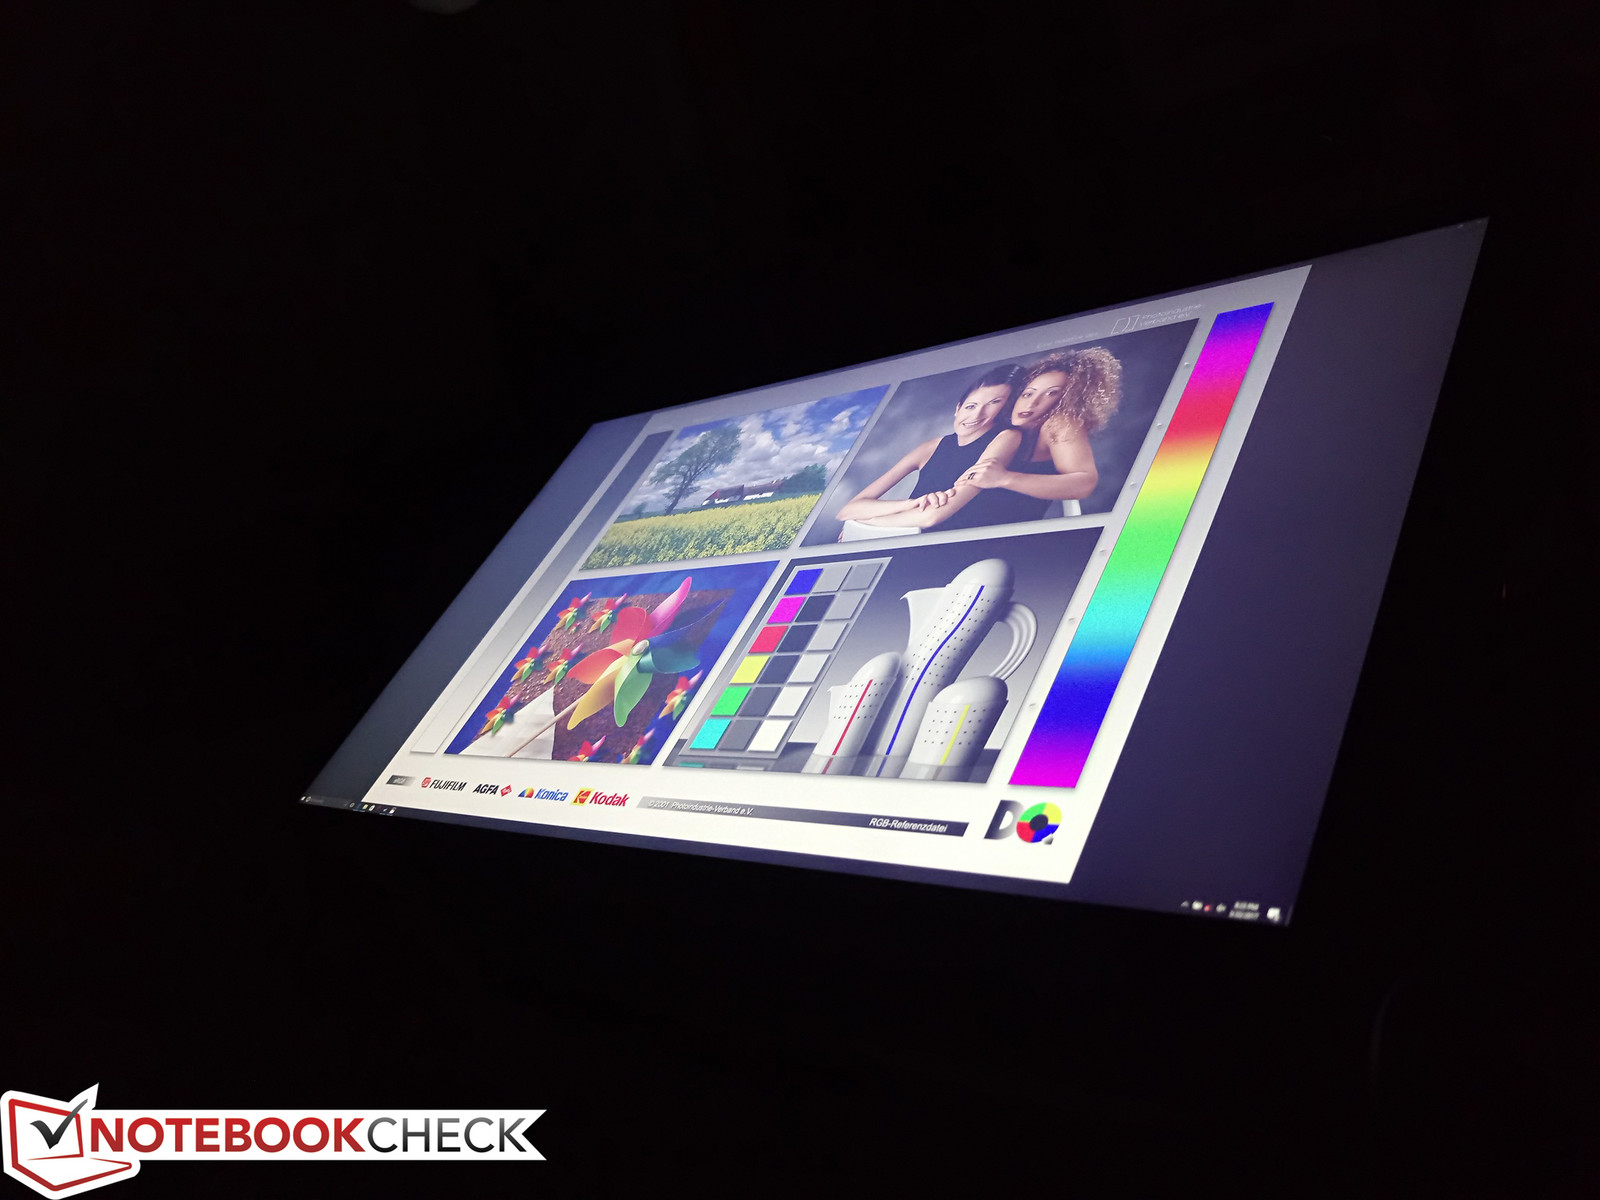
Display
Whereas our original GS63VR was equipped with a 1080p panel, our latest unit makes use of a 4K UHD panel. Unfortunately, the display is a mixed bag due in part to its RGBW pixel array. The panel is not a "true 4K" resolution and other manufacturers like Gigabyte and HP have recently dropped RGBW in favor of the more traditional RGB setup. In fact, the Samsung FL156FL02-101 panel on our GS63VR is the same panel as found on the Asus UX501JW and the recently reviewed Eurocom Tornado F5, so these three notebooks share very similar display qualities.
The high black levels lead to a middling contrast ratio of about 600:1 compared to 1000:1 or better on many enthusiast-level gaming notebooks. Backlight brightness is sufficient for indoor ambient lighting, but we were hoping for something much brighter than the recorded 274 nits as the portability of the system encourages outdoor use.
Subjectively, the matte panel is crisp with some slight color graininess that is most noticeable when displaying a white background on the maximum brightness setting. Our test unit also exhibits slight backlight bleeding around the bottom edge that is unnoticeable during day-to-day use.

| |||||||||||||||||||||||||
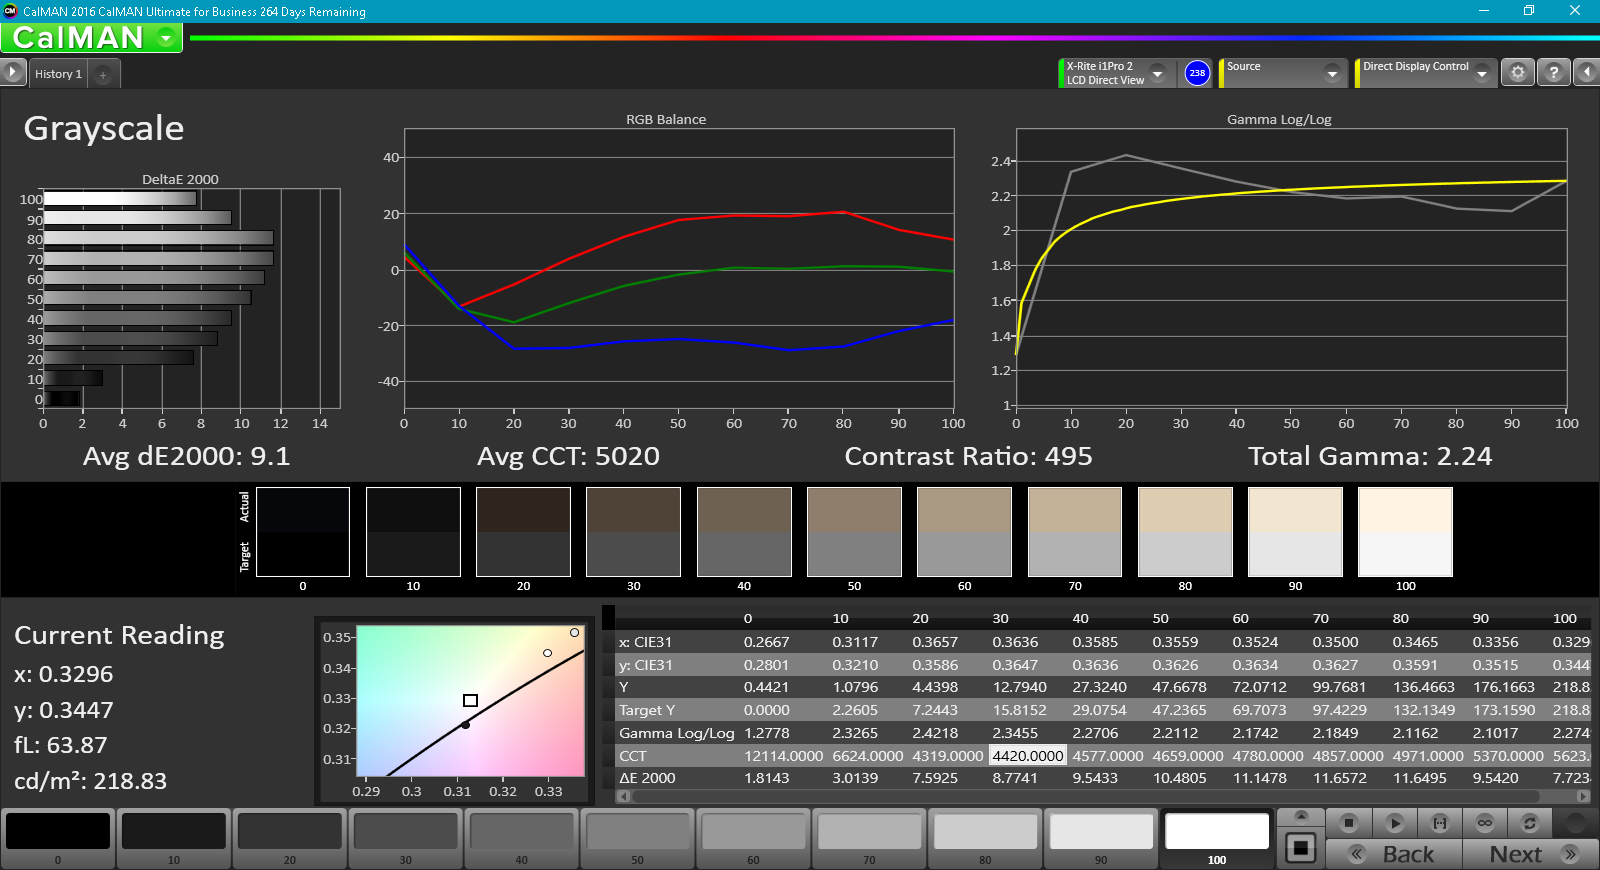
Brightness Distribution: 92 %
Center on Battery: 274.2 cd/m²
Contrast: 623:1 (Black: 0.44 cd/m²)
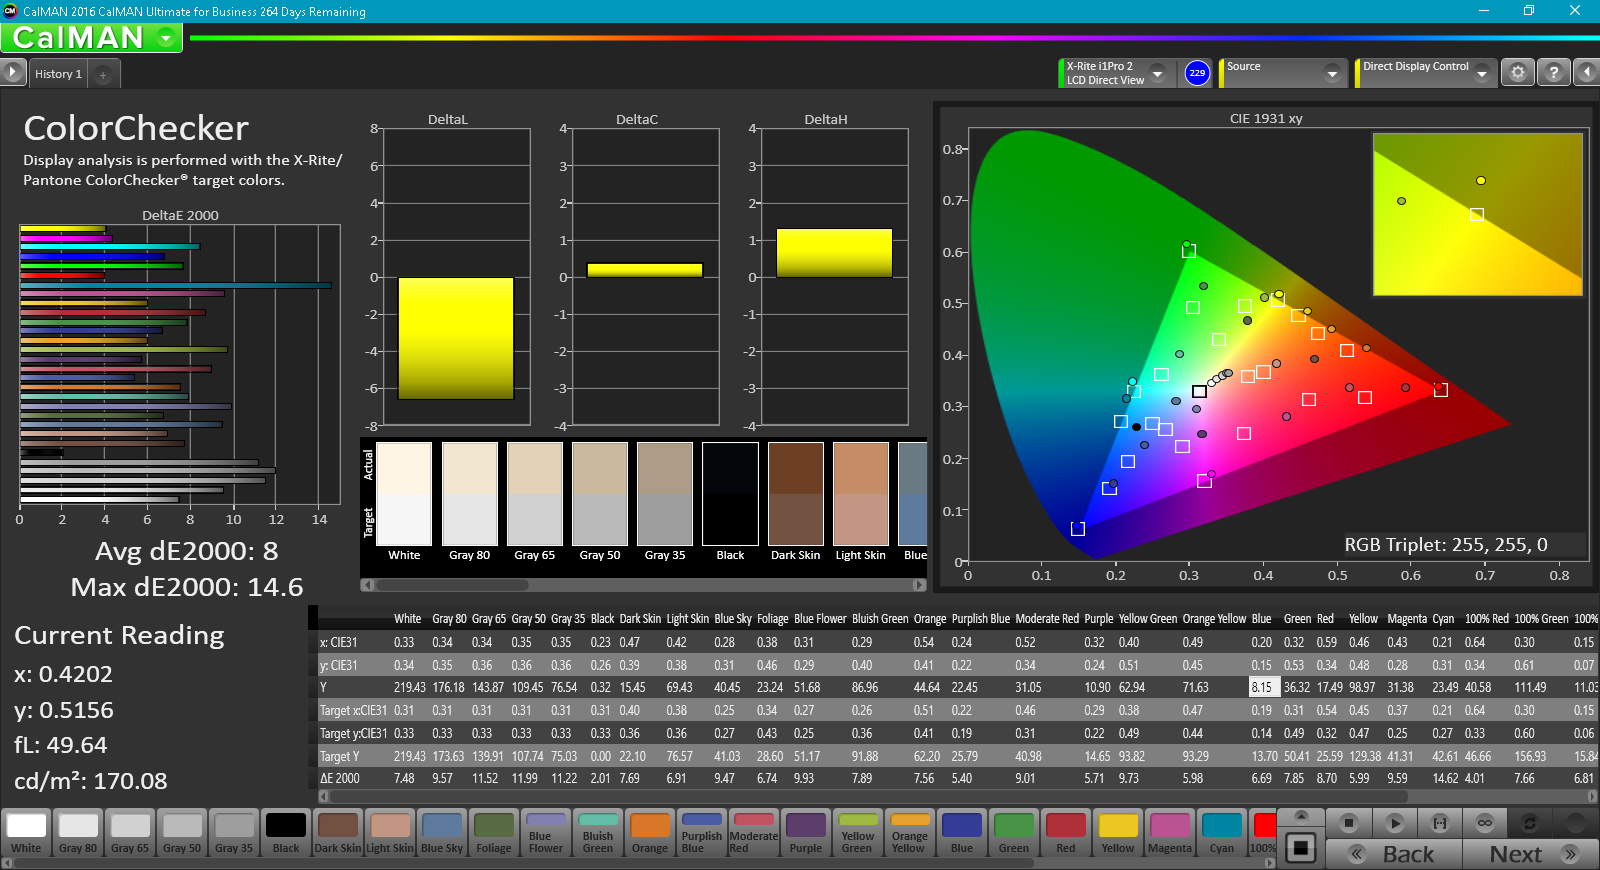
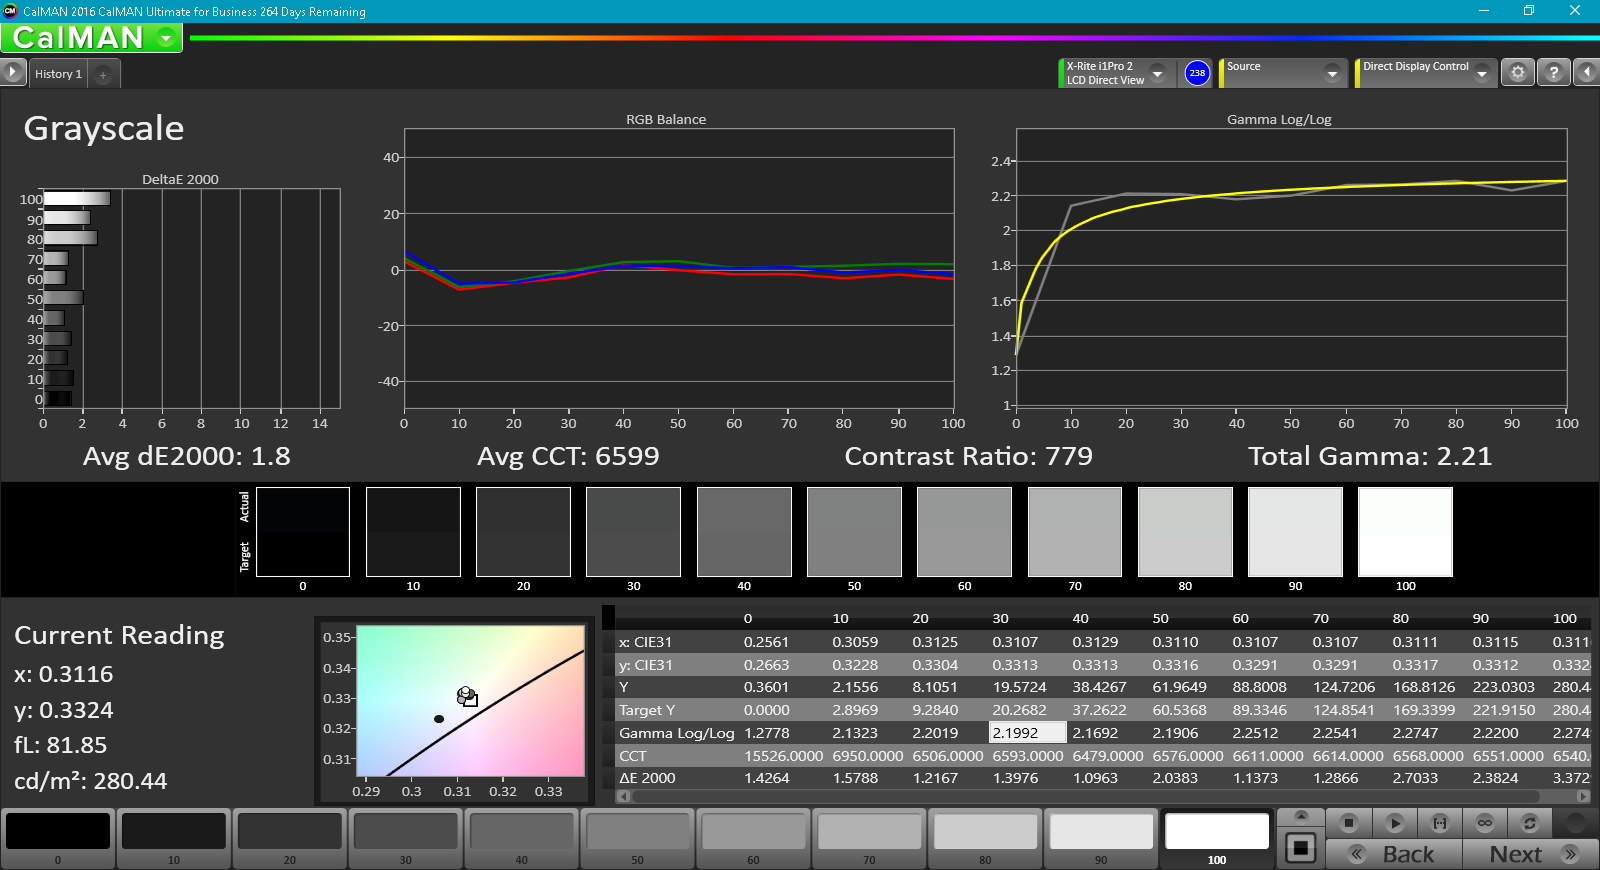
ΔE ColorChecker Calman: 8 | ∀{0.5-29.43 Ø4.73}
ΔE Greyscale Calman: 9.1 | ∀{0.09-98 Ø4.97}
72.1% sRGB (Argyll 1.6.3 3D)
45.7% AdobeRGB 1998 (Argyll 1.6.3 3D)
49.81% AdobeRGB 1998 (Argyll 3D)
72.6% sRGB (Argyll 3D)
48.21% Display P3 (Argyll 3D)
Gamma: 2.24
CCT: 5020 K
| MSI GS63VR 7RF-228US IPS, 15.6", 3840x2160 | Dell XPS 15 9560 (i7-7700HQ, UHD) IGZO IPS, 15.6", 3840x2160 | Asus FX502VM-AS73 TN LED, 15.6", 1920x1080 | Alienware 15 R3 HPJGK_B156HTN (AUO51ED), TN, 15.6", 1920x1080 | Apple MacBook Pro 15 2016 (2.9 GHz, 460) Apple APPA030, IPS, 15.4", 2880x1800 | |
|---|---|---|---|---|---|
| Display | 75% | -21% | 32% | 73% | |
| Display P3 Coverage (%) | 48.21 | 89.7 86% | 38.28 -21% | 66 37% | 99 105% |
| sRGB Coverage (%) | 72.6 | 100 38% | 56.9 -22% | 90.5 25% | 100 38% |
| AdobeRGB 1998 Coverage (%) | 49.81 | 100 101% | 39.47 -21% | 66.2 33% | 87.3 75% |
| Response Times | -85% | 2% | 30% | -101% | |
| Response Time Grey 50% / Grey 80% * (ms) | 28 ? | 57.2 ? -104% | 28.4 ? -1% | 25 ? 11% | 46 ? -64% |
| Response Time Black / White * (ms) | 23.6 ? | 39.2 ? -66% | 22.4 ? 5% | 12 ? 49% | 56 ? -137% |
| PWM Frequency (Hz) | 1351 ? | 962 | 119000 ? | ||
| Screen | 39% | -11% | 15% | 56% | |
| Brightness middle (cd/m²) | 274.2 | 370.1 35% | 209.5 -24% | 386 41% | 420 53% |
| Brightness (cd/m²) | 263 | 356 35% | 205 -22% | 382 45% | 401 52% |
| Brightness Distribution (%) | 92 | 87 -5% | 92 0% | 93 1% | 90 -2% |
| Black Level * (cd/m²) | 0.44 | 0.37 16% | 0.69 -57% | 0.39 11% | 0.3 32% |
| Contrast (:1) | 623 | 1000 61% | 304 -51% | 990 59% | 1400 125% |
| Colorchecker dE 2000 * | 8 | 5.3 34% | 4.7 41% | 10.2 -27% | 3.33 58% |
| Colorchecker dE 2000 max. * | 14.6 | 9.9 32% | 19.7 -35% | 15.81 -8% | 5.11 65% |
| Greyscale dE 2000 * | 9.1 | 4.6 49% | 1.8 80% | 11.28 -24% | 2.73 70% |
| Gamma | 2.24 98% | 2.31 95% | 2.23 99% | 2.23 99% | 2.48 89% |
| CCT | 5020 129% | 6284 103% | 6975 93% | 11383 57% | 6457 101% |
| Color Space (Percent of AdobeRGB 1998) (%) | 45.7 | 88.3 93% | 36.2 -21% | 59 29% | 78.09 71% |
| Color Space (Percent of sRGB) (%) | 72.1 | 100 39% | 56.6 -21% | 90 25% | 99.97 39% |
| Total Average (Program / Settings) | 10% /
30% | -10% /
-11% | 26% /
20% | 9% /
39% |
* ... smaller is better
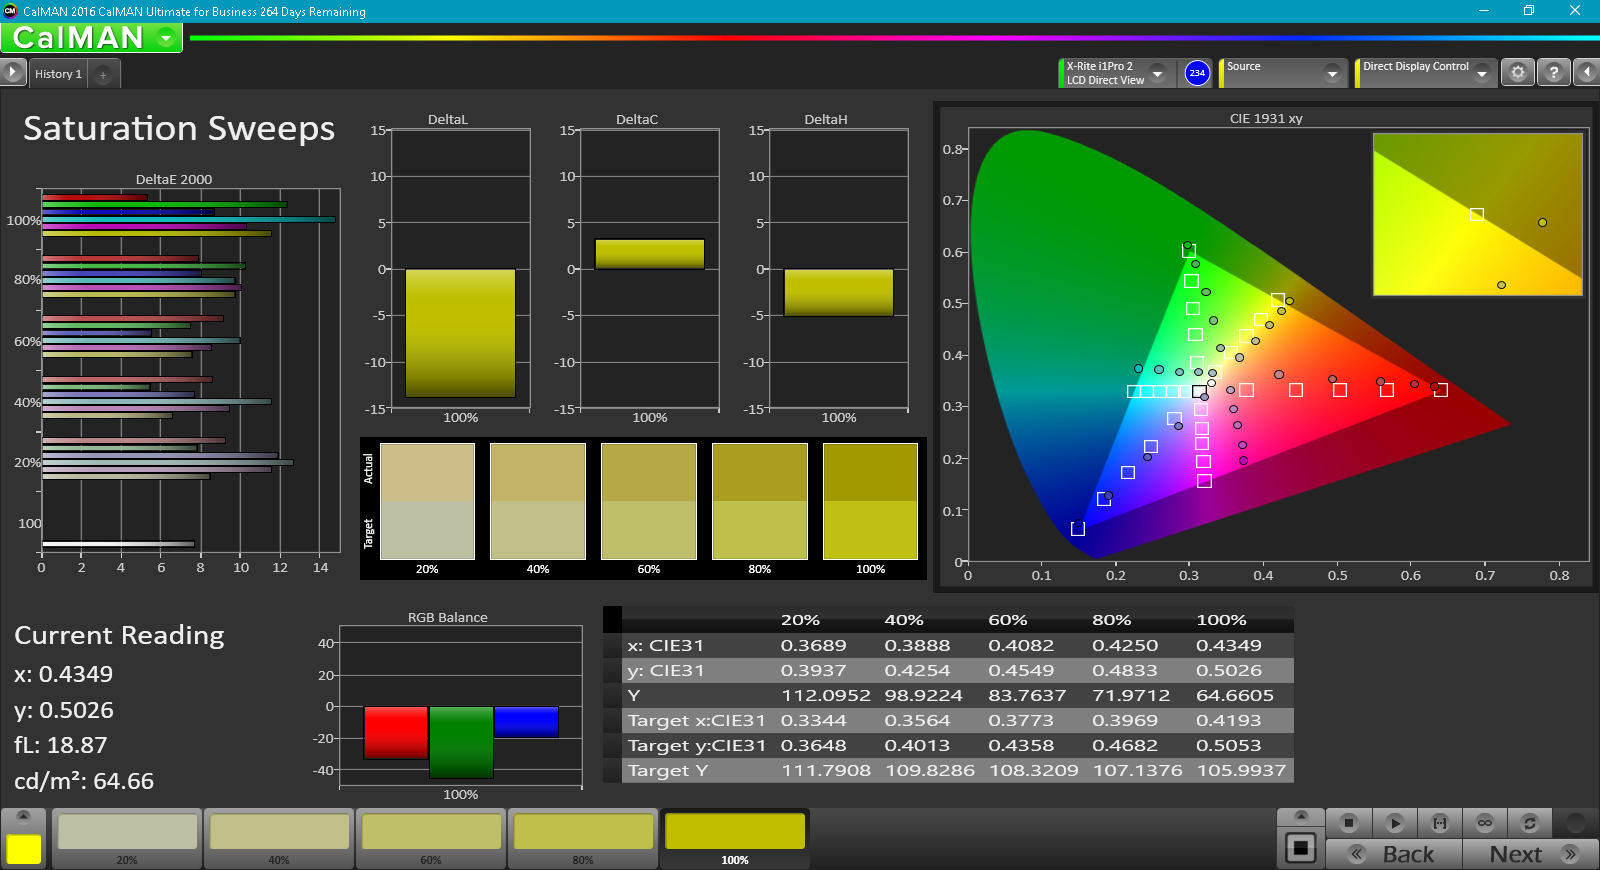
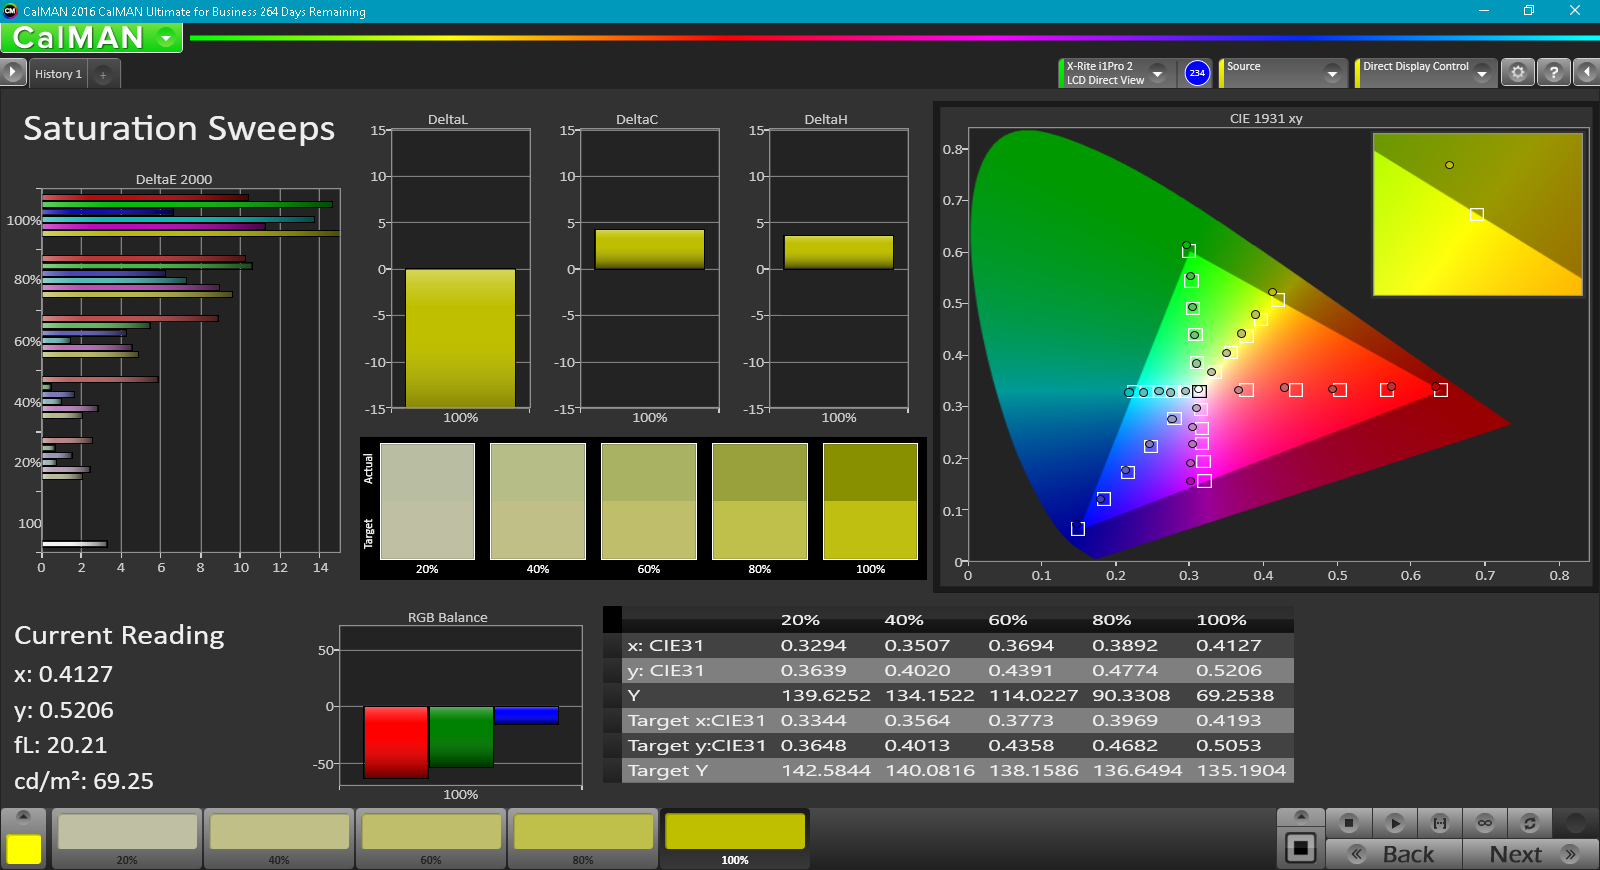
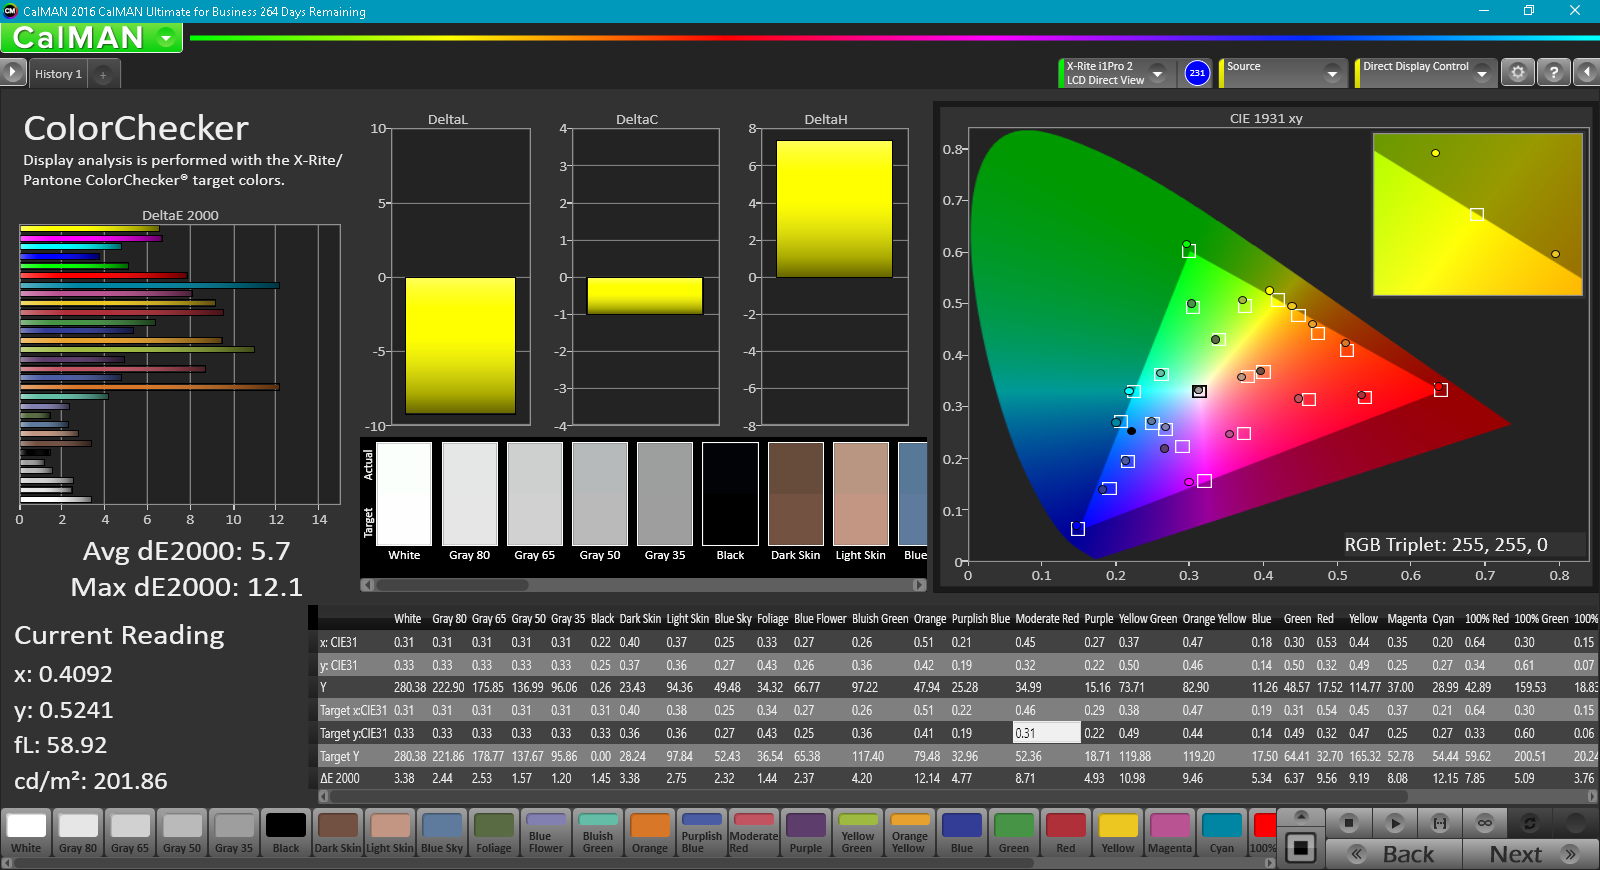
Color space covers approximately 72 percent and 46 percent of the sRGB and AdobeRGB standards, respectively. This pales in comparison to the wider gamuts of the XPS 15 and MacBook Pro 15. The narrower gamut should have little impact on the target gaming audience as extreme color accuracy is typically reserved for digital artists. Nonetheless, certain gaming notebooks offer complete sRGB coverage including the Razer Blade series. It's also worth noting that the base 1080p option for the GS63VR has a wider color gamut than the 4K UHD configuration, so some users may prefer the lower-cost 1080p panel.

Colors and grayscale are inaccurate out of the box even with the MSI True Color software set to the preset sRGB option. Our own calibration efforts improve grayscale and colors dramatically by increasing color temperature and flattening the RGB balance curve. Colors still become more inaccurate the higher the saturation level due to the panel's imperfect sRGB coverage.
Display Response Times
| ↔ Response Time Black to White | ||
|---|---|---|
| 23.6 ms ... rise ↗ and fall ↘ combined | ↗ 15.2 ms rise | 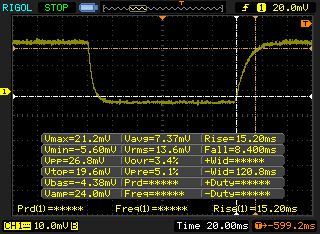 |
| ↘ 8.4 ms fall | ||
| The screen shows good response rates in our tests, but may be too slow for competitive gamers. In comparison, all tested devices range from 0.1 (minimum) to 240 (maximum) ms. » 54 % of all devices are better. This means that the measured response time is worse than the average of all tested devices (19.9 ms). | ||
| ↔ Response Time 50% Grey to 80% Grey | ||
| 28 ms ... rise ↗ and fall ↘ combined | ↗ 15.6 ms rise | 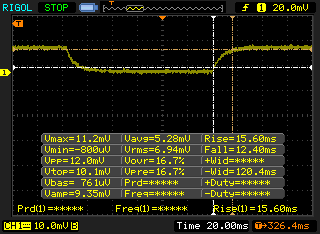 |
| ↘ 12.4 ms fall | ||
| The screen shows relatively slow response rates in our tests and may be too slow for gamers. In comparison, all tested devices range from 0.165 (minimum) to 636 (maximum) ms. » 38 % of all devices are better. This means that the measured response time is similar to the average of all tested devices (31.1 ms). | ||
Screen Flickering / PWM (Pulse-Width Modulation)
| Screen flickering / PWM detected | 1351 Hz | ≤ 39 % brightness setting | 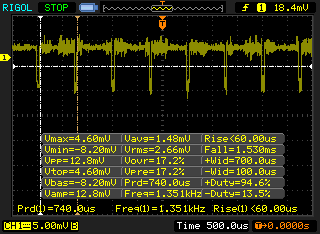 |
The display backlight flickers at 1351 Hz (worst case, e.g., utilizing PWM) Flickering detected at a brightness setting of 39 % and below. There should be no flickering or PWM above this brightness setting. The frequency of 1351 Hz is quite high, so most users sensitive to PWM should not notice any flickering. In comparison: 52 % of all tested devices do not use PWM to dim the display. If PWM was detected, an average of 7784 (minimum: 5 - maximum: 343500) Hz was measured. | |||
Outdoor visibility is average under shade and poor under direct sunlight. The display can be opened all the way up to 180 degrees to help reduce glare as much as possible, which is uncommon on most gaming notebooks. The wide IPS viewing angles also make the notebook easier to use outdoors than other gaming systems with TN displays. The backlight is unfortunately the one major attribute preventing the GS63VR from being the de factor outdoor gaming notebook as it is nowhere near as bright as a MacBook Pro 15 or Alienware 15.
Viewing too far off angle will cause slight contrast shifts and lighter colors.
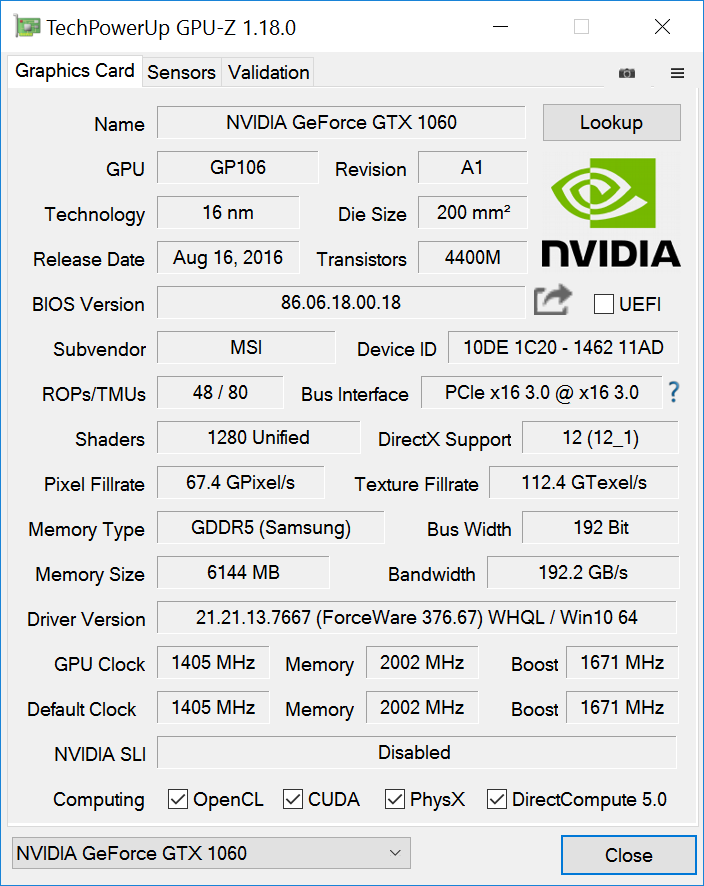
Performance
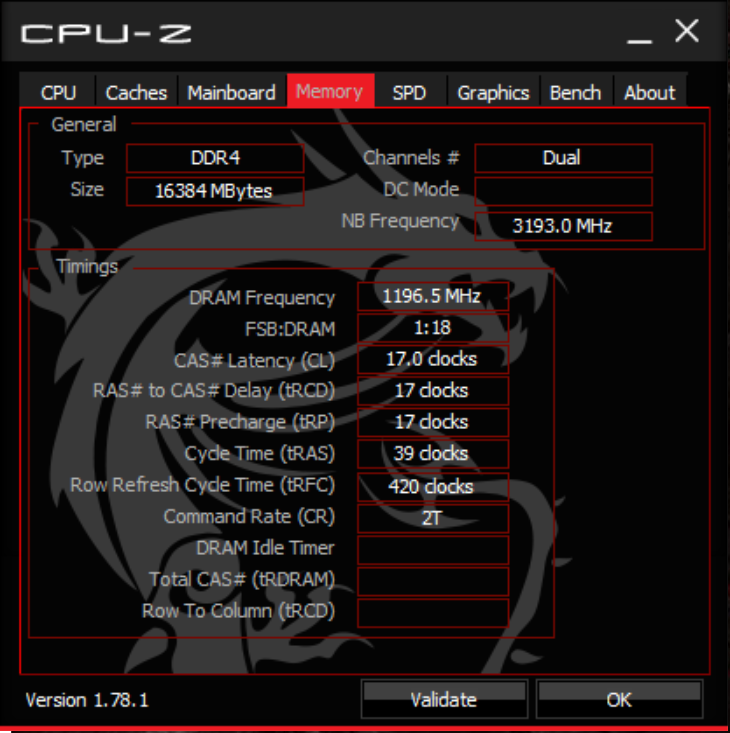
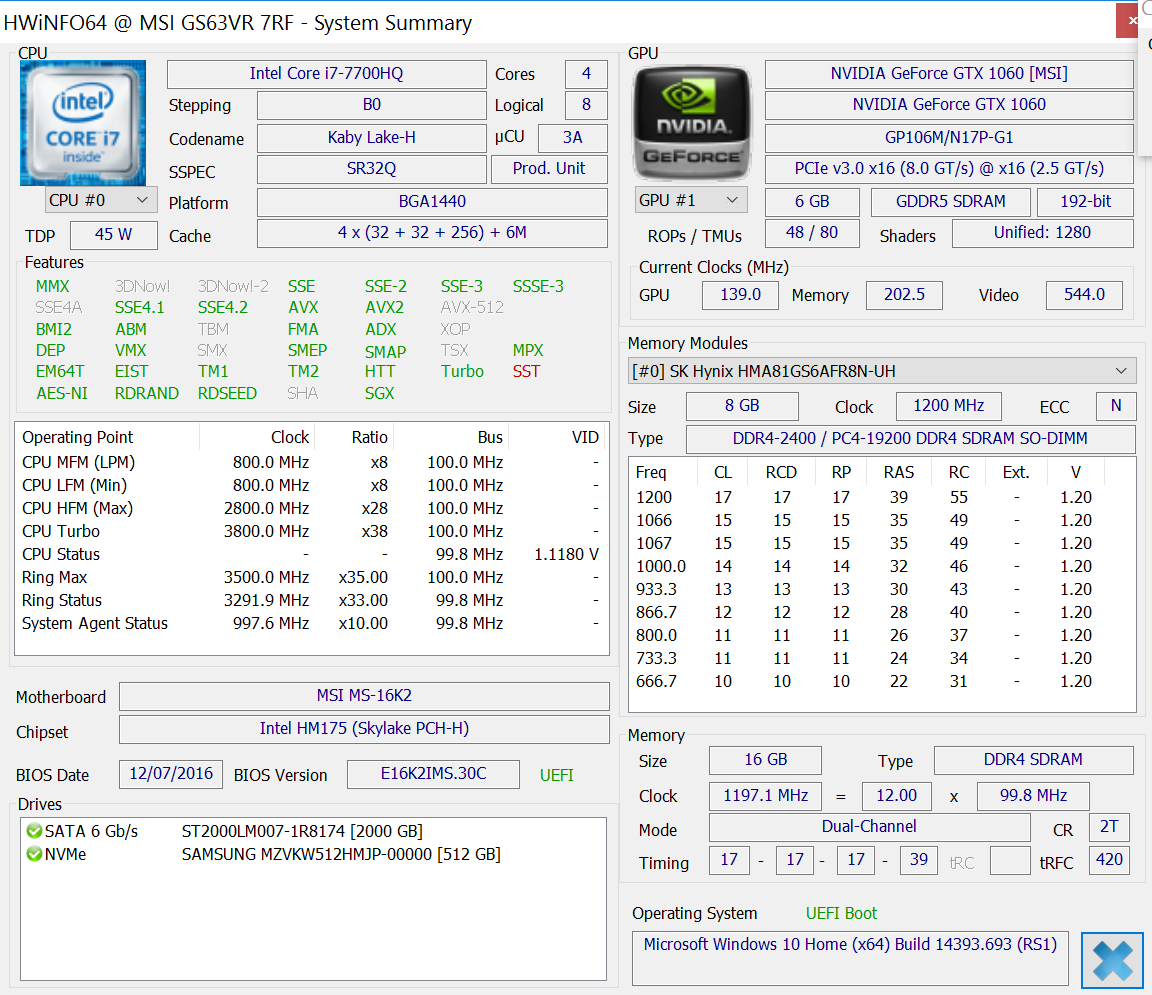
The GS63VR is available with the i7-7700HQ CPU and a full-fledged 6 GB GTX 1060 GPU like the one we have on hand. A separate SKU with a 3 GB GTX 1060 is also an option according to MSI, but we can find no such configuration for the US market at the time or writing. Surprisingly, RAM is not soldered onto the board and can be upgraded despite the thin-and-light build.
Optimus is standard for graphics switching to the integrated HD 630 GPU. There are consequently no G-Sync options as both features continue to be mutually exclusive.
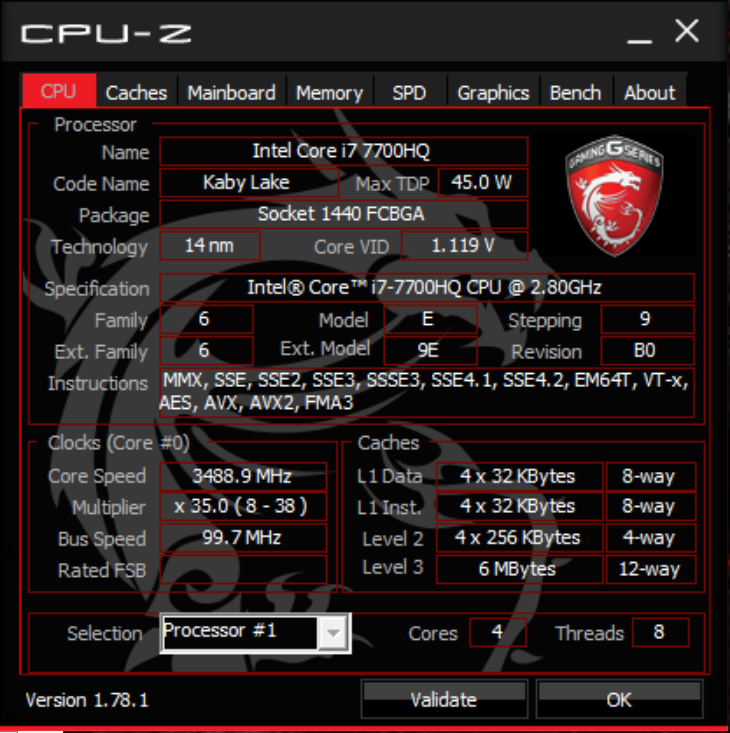
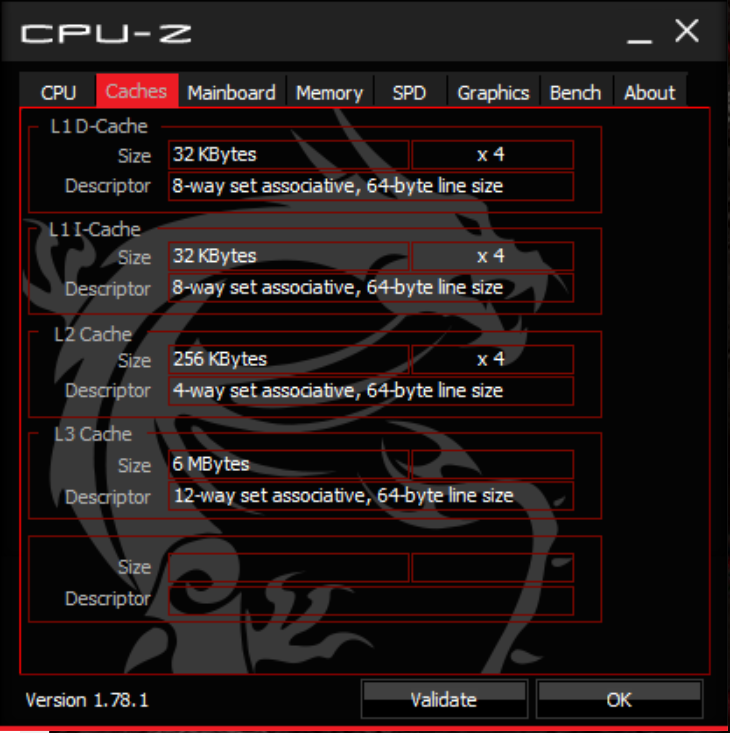
Processor
Raw performance from the i7-7700HQ is only marginally better than the previous Skylake i7-6700HQ in multi-threaded workloads. The boost in single-threaded performance is higher and on par with the desktop i7-6700K. This is particularly notable as the i7-6700K is rated for almost twice the TDP as our mobile i7-7700HQ.
See our dedicated CPU page on the i7-7700HQ for more technical information and benchmark comparisons.
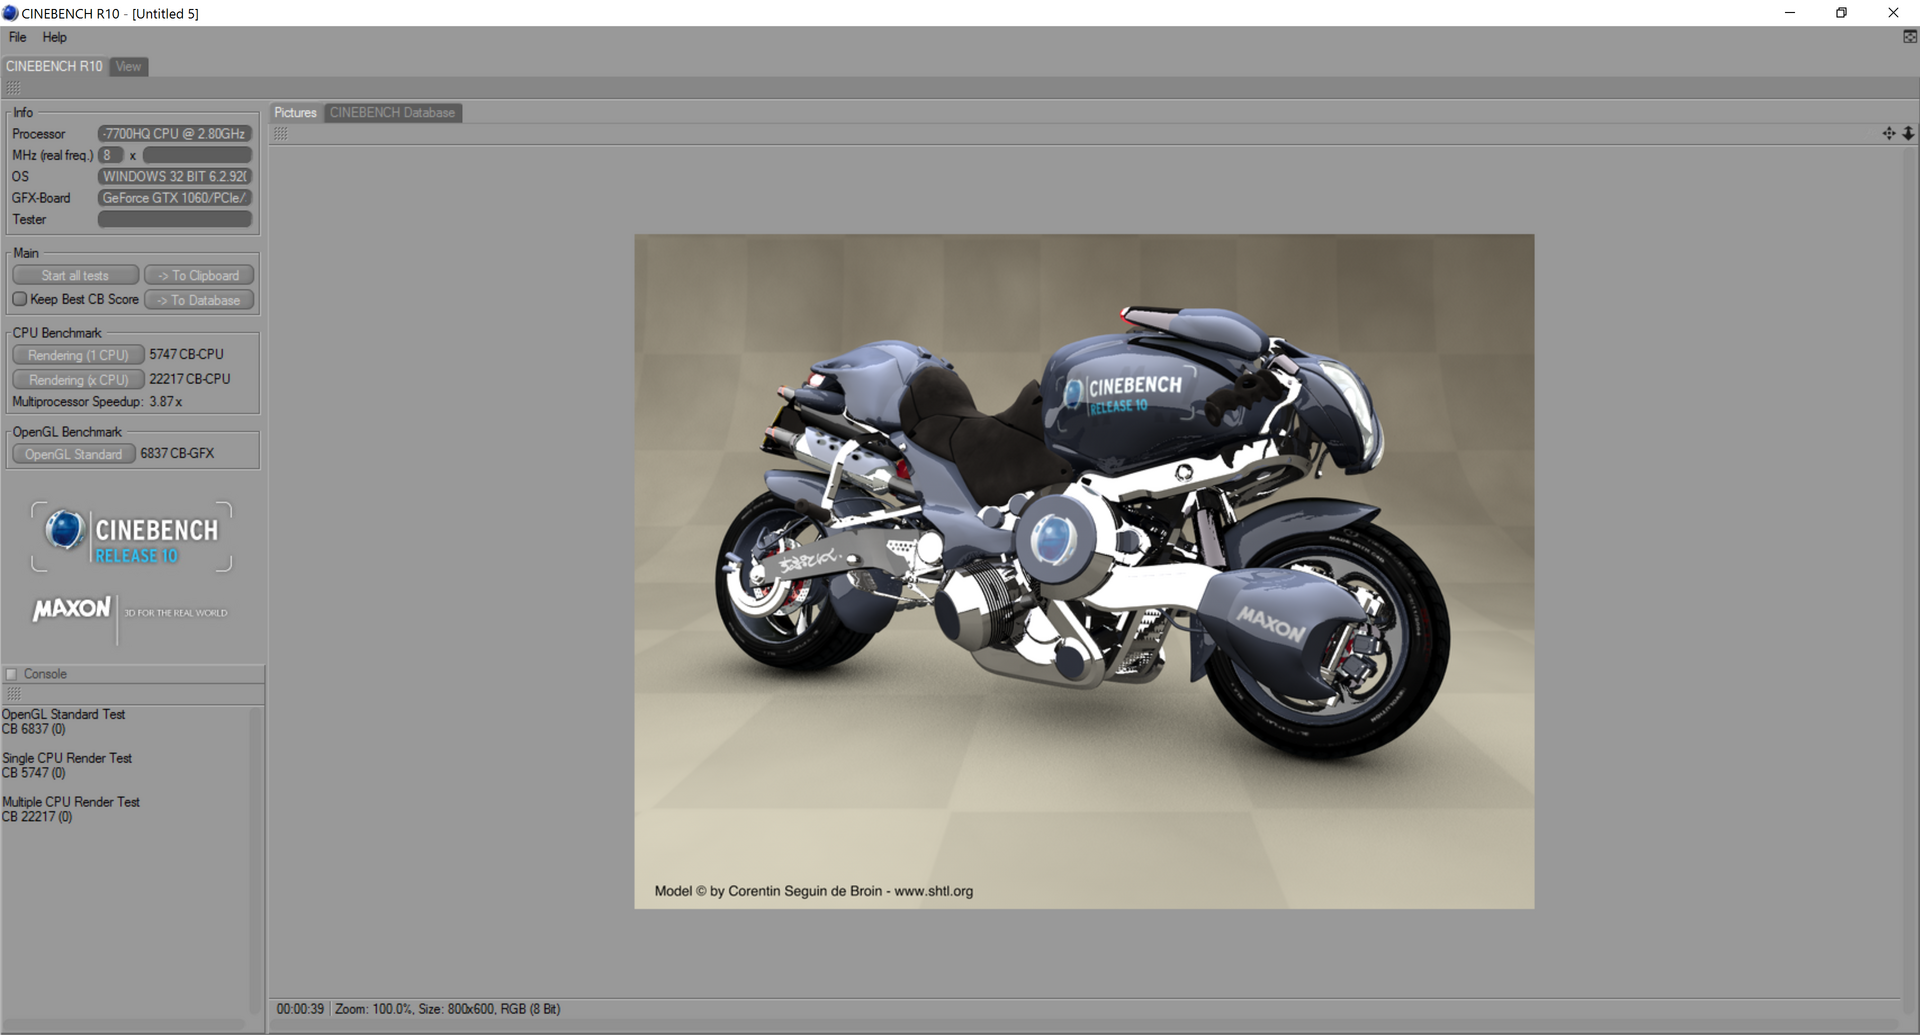
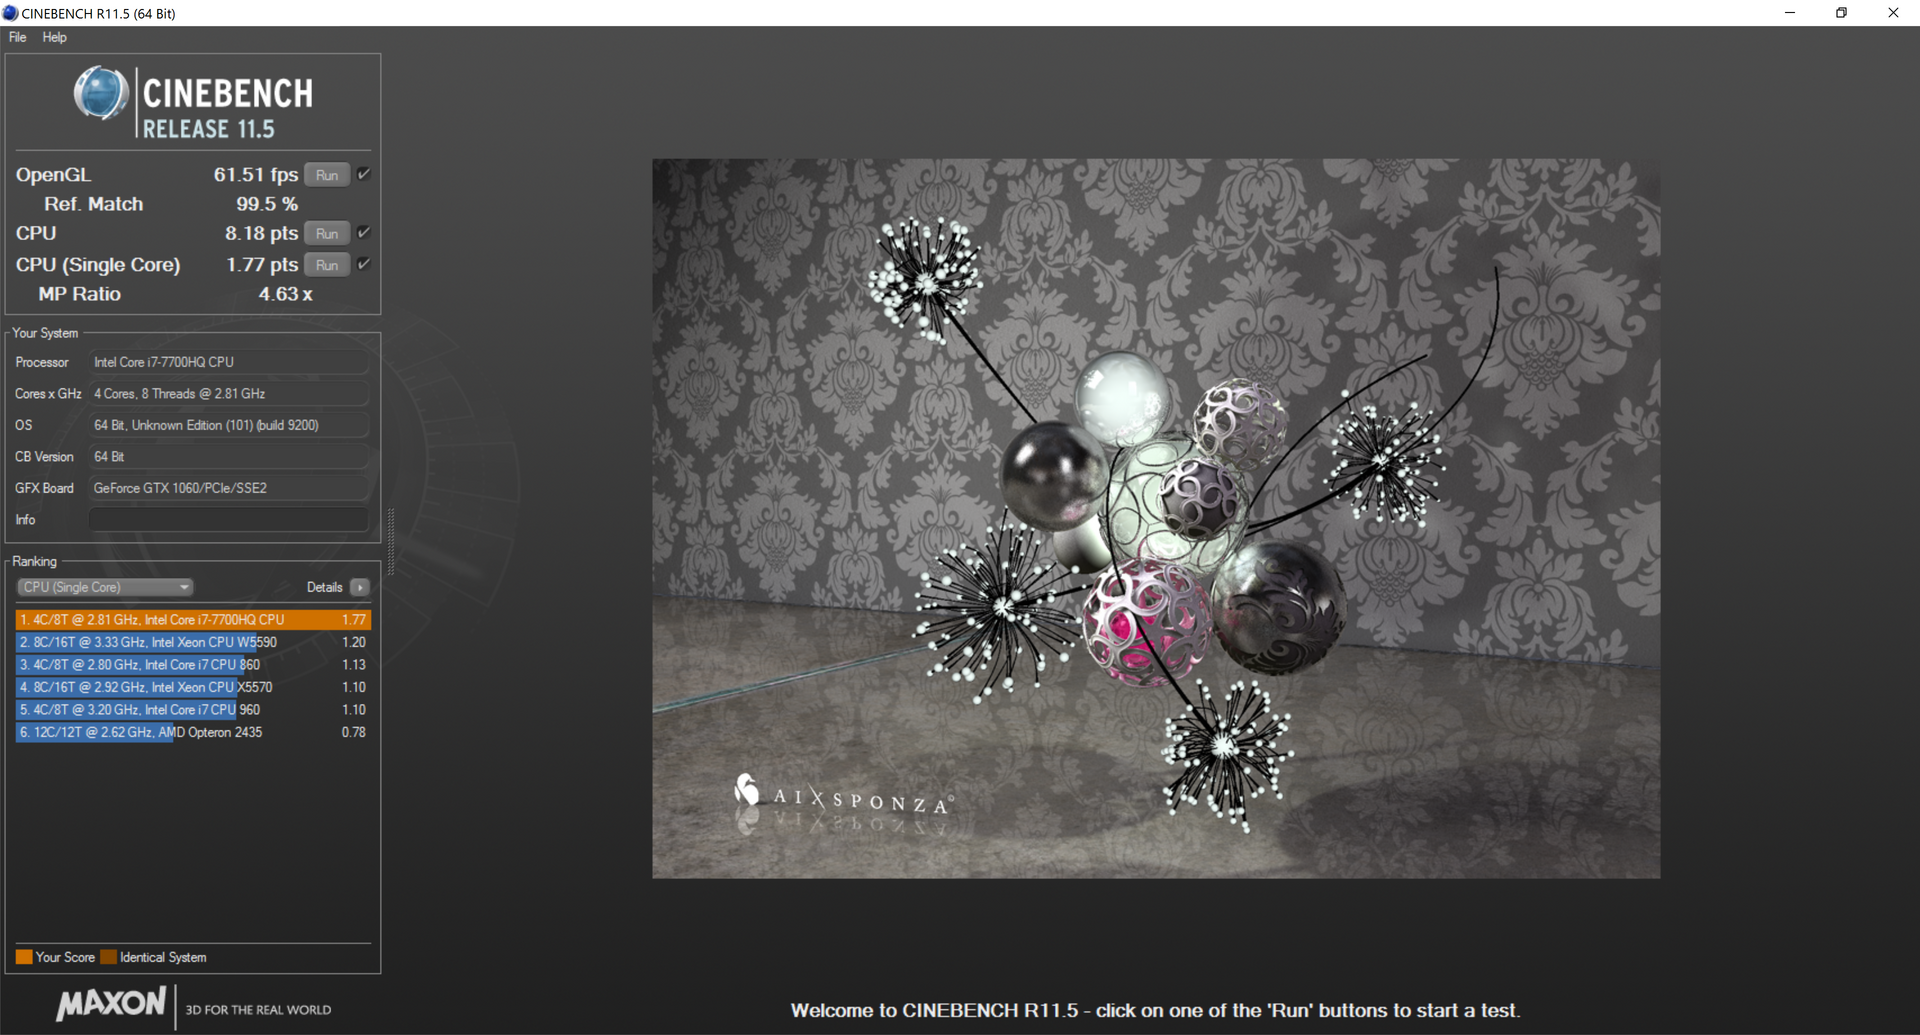
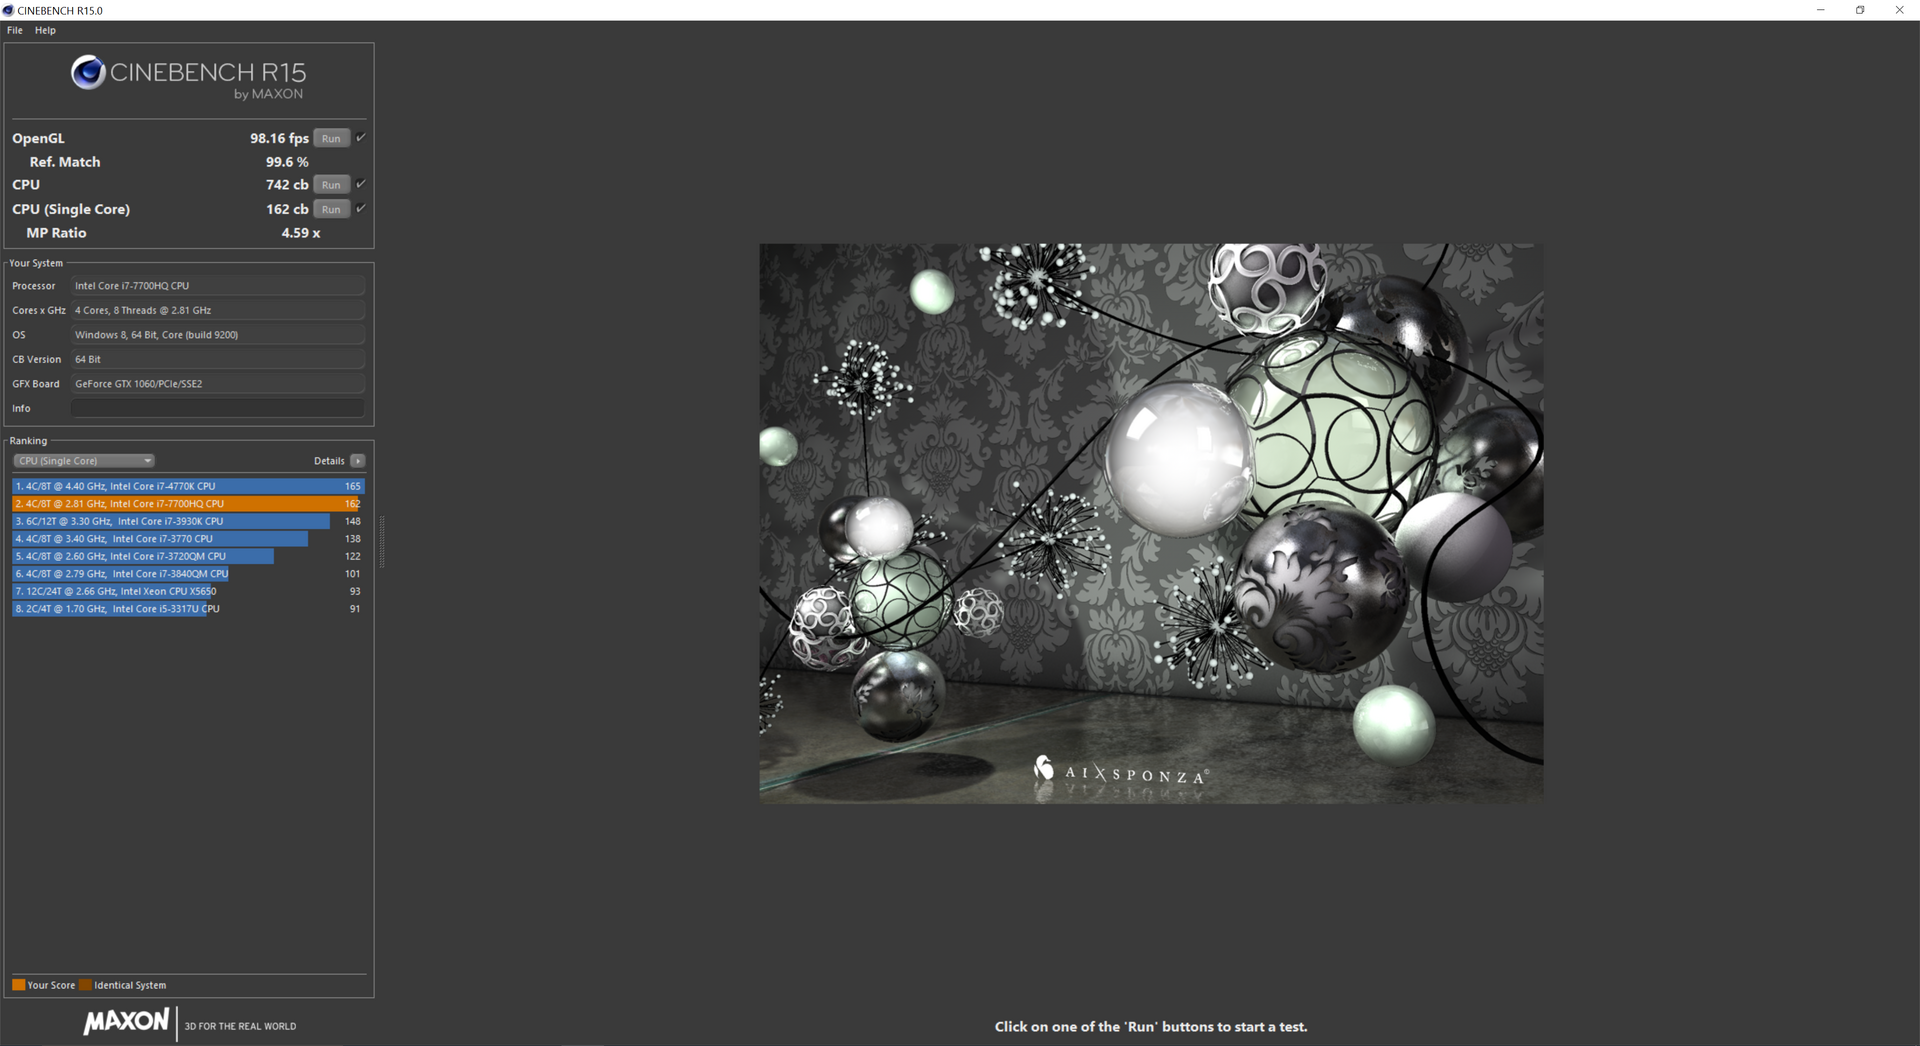
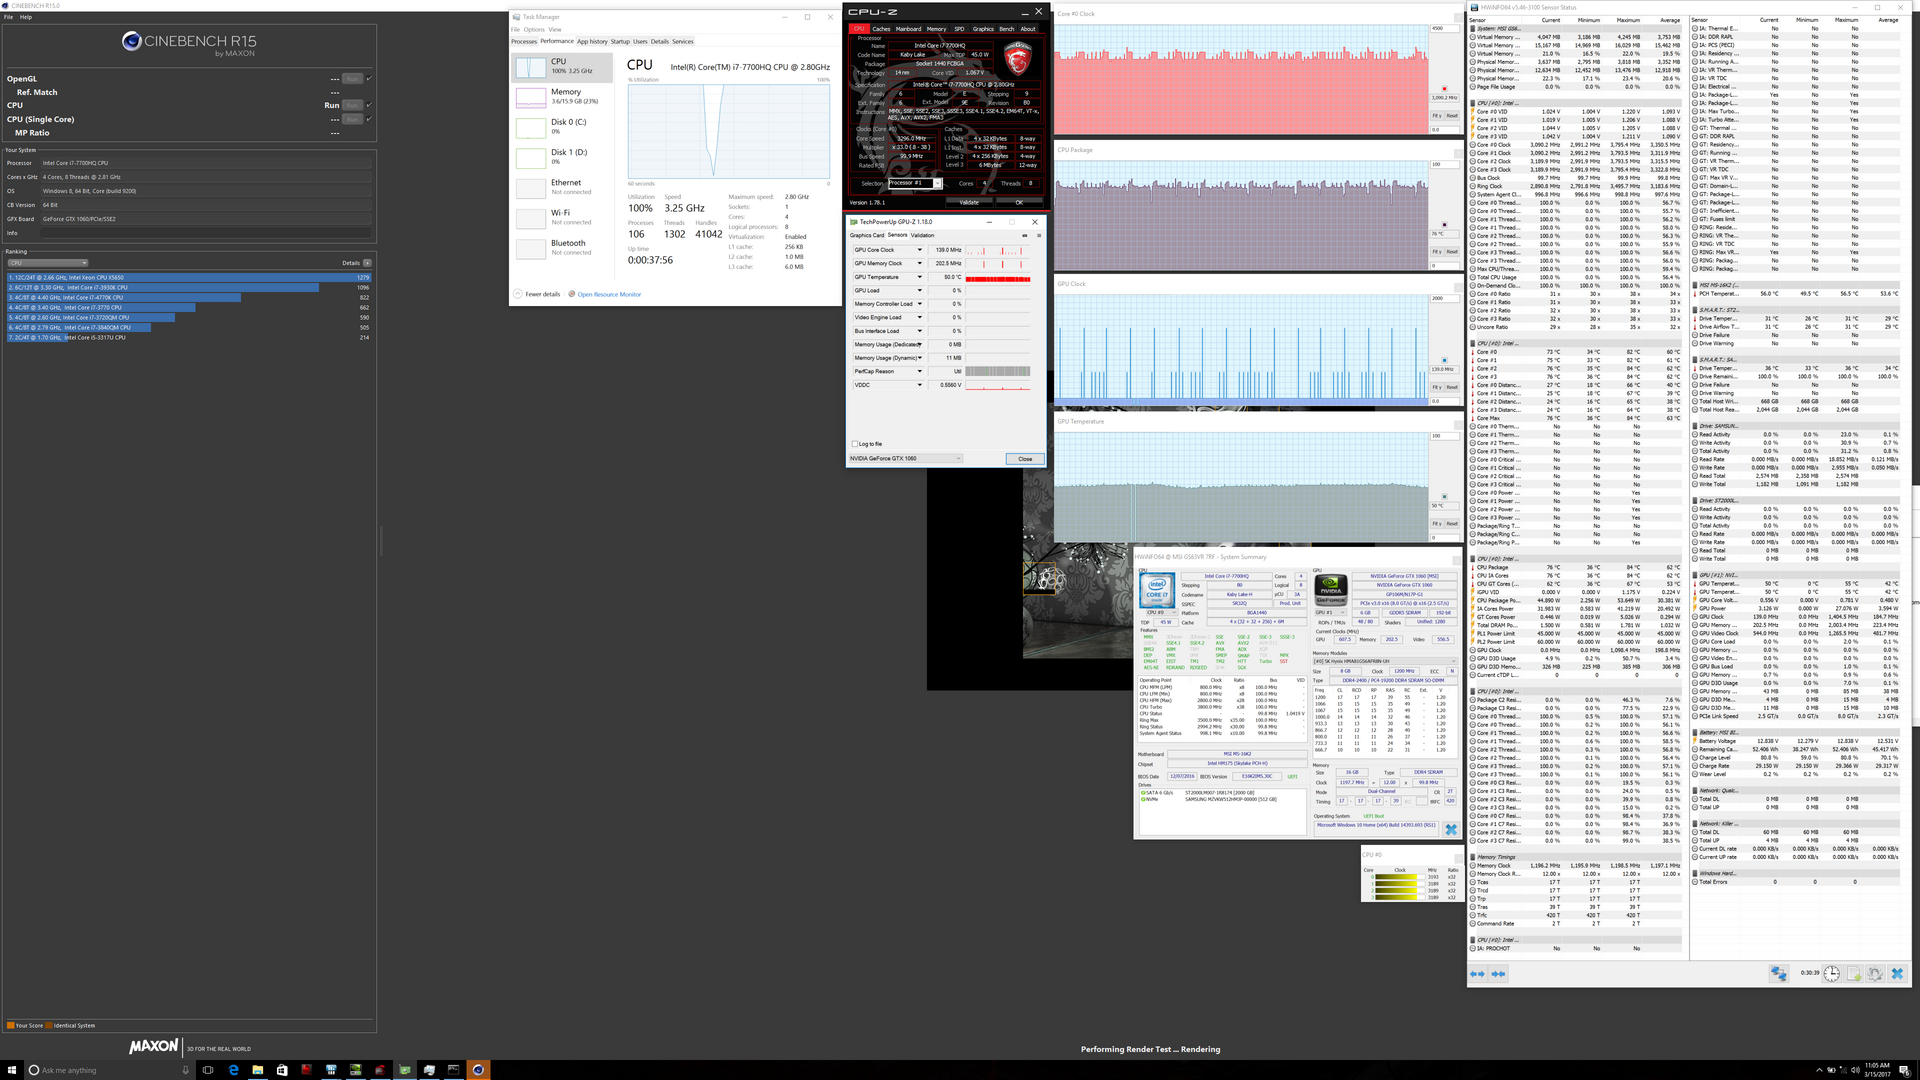
Running CineBench R15 Multi-Thread in a loop results in steadily decreasing scores. The initial score of 742 points drops to 658 points by the third run as illustrated by the graph below. This represents a performance drop of about 10 percent just from a few minutes of CineBench stress testing.
The larger Asus GL702VSK with the same i7-7700HQ CPU is able to sustain higher clock rates than our GS63VR. Fire Strike Physics scores, for example, are consistently 10 percent higher on the Asus than on the MSI.
| Cinebench R15 | |
| CPU Single 64Bit | |
| i7-7700K Gigabyte Z270-Gaming K3 | |
| MSI GS63VR 7RF-228US | |
| Eurocom Sky X7E2 | |
| Asus Strix GL702VSK | |
| EVGA SC17 GTX 1070 | |
| MSI GP62-2QEi781FD | |
| Asus GL702VM-GC102D | |
| Lenovo IdeaPad Y50 | |
| CPU Multi 64Bit | |
| i7-7700K Gigabyte Z270-Gaming K3 | |
| Eurocom Sky X7E2 | |
| MSI GS63VR 7RF-228US | |
| Asus Strix GL702VSK | |
| EVGA SC17 GTX 1070 | |
| MSI GP62-2QEi781FD | |
| Asus GL702VM-GC102D | |
| Lenovo IdeaPad Y50 | |
| Cinebench R11.5 | |
| CPU Single 64Bit | |
| i7-7700K Gigabyte Z270-Gaming K3 | |
| Asus Strix GL702VSK | |
| MSI GS63VR 7RF-228US | |
| Eurocom Sky X7E2 | |
| EVGA SC17 GTX 1070 | |
| MSI GP62-2QEi781FD | |
| Asus GL702VM-GC102D | |
| Lenovo IdeaPad Y50 | |
| CPU Multi 64Bit | |
| i7-7700K Gigabyte Z270-Gaming K3 | |
| Eurocom Sky X7E2 | |
| MSI GS63VR 7RF-228US | |
| Asus Strix GL702VSK | |
| EVGA SC17 GTX 1070 | |
| MSI GP62-2QEi781FD | |
| Asus GL702VM-GC102D | |
| Lenovo IdeaPad Y50 | |
| Cinebench R10 | |
| Rendering Multiple CPUs 32Bit | |
| i7-7700K Gigabyte Z270-Gaming K3 | |
| Eurocom Sky X7E2 | |
| MSI GS63VR 7RF-228US | |
| Asus Strix GL702VSK | |
| EVGA SC17 GTX 1070 | |
| Asus GL702VM-GC102D | |
| MSI GP62-2QEi781FD | |
| Lenovo IdeaPad Y50 | |
| Rendering Single 32Bit | |
| i7-7700K Gigabyte Z270-Gaming K3 | |
| Eurocom Sky X7E2 | |
| Asus Strix GL702VSK | |
| MSI GS63VR 7RF-228US | |
| EVGA SC17 GTX 1070 | |
| MSI GP62-2QEi781FD | |
| Asus GL702VM-GC102D | |
| Lenovo IdeaPad Y50 | |
| wPrime 2.10 - 1024m | |
| Lenovo IdeaPad Y50 | |
| MSI GS63VR 7RF-228US | |
| Asus Strix GL702VSK | |
| EVGA SC17 GTX 1070 | |
| MSI GP62-2QEi781FD | |
| Eurocom Sky X7E2 | |
| i7-7700K Gigabyte Z270-Gaming K3 | |
| 3DMark | |
| 3840x2160 Fire Strike Ultra Physics | |
| Eurocom Sky X7E2 | |
| EVGA SC17 GTX 1070 | |
| MSI GS63VR 7RF-228US | |
| Asus GL702VM-GC102D | |
| Fire Strike Extreme Physics | |
| Eurocom Sky X7E2 | |
| MSI GP62-2QEi781FD | |
| Asus Strix GL702VSK | |
| EVGA SC17 GTX 1070 | |
| MSI GS63VR 7RF-228US | |
| Asus GL702VM-GC102D | |
| Lenovo IdeaPad Y50 | |
| 1920x1080 Fire Strike Physics | |
| i7-7700K Gigabyte Z270-Gaming K3 | |
| Eurocom Sky X7E2 | |
| MSI GP62-2QEi781FD | |
| Asus Strix GL702VSK | |
| EVGA SC17 GTX 1070 | |
| MSI GS63VR 7RF-228US | |
| Asus GL702VM-GC102D | |
| Lenovo IdeaPad Y50 | |
* ... smaller is better
System Performance
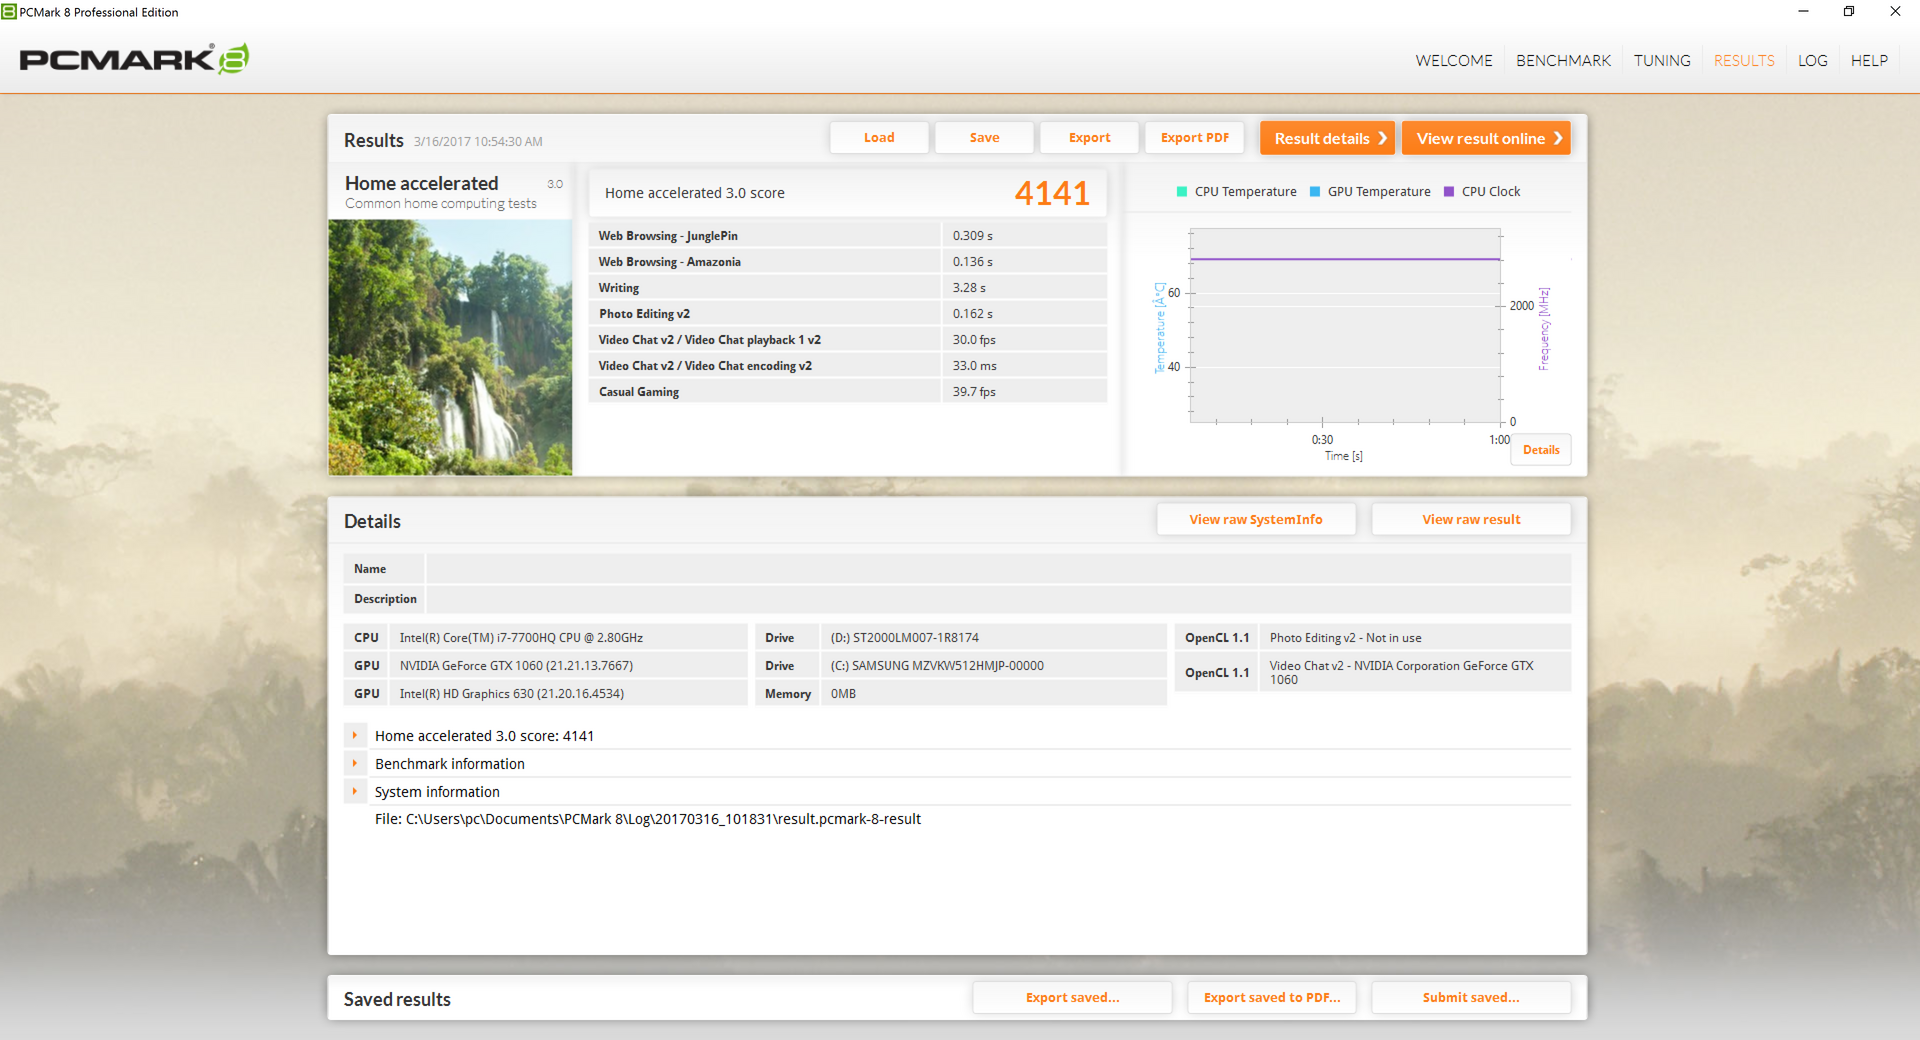
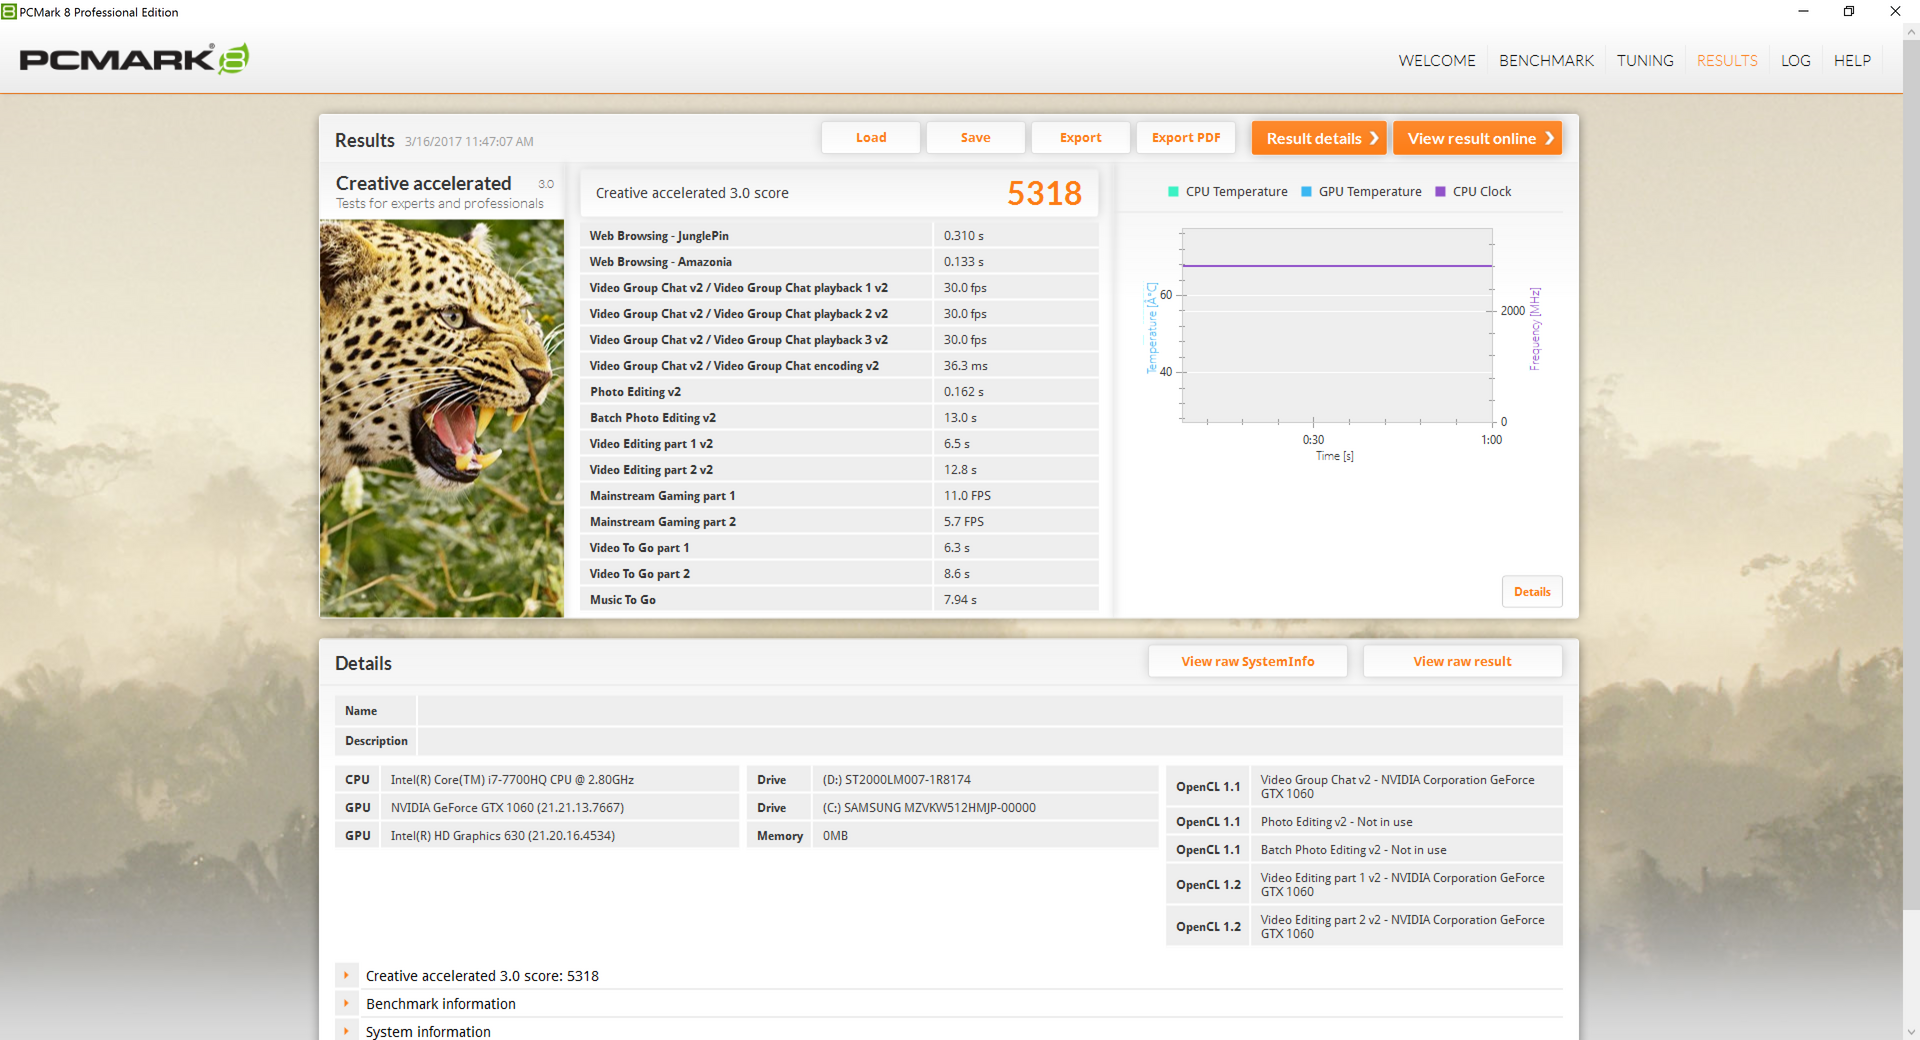
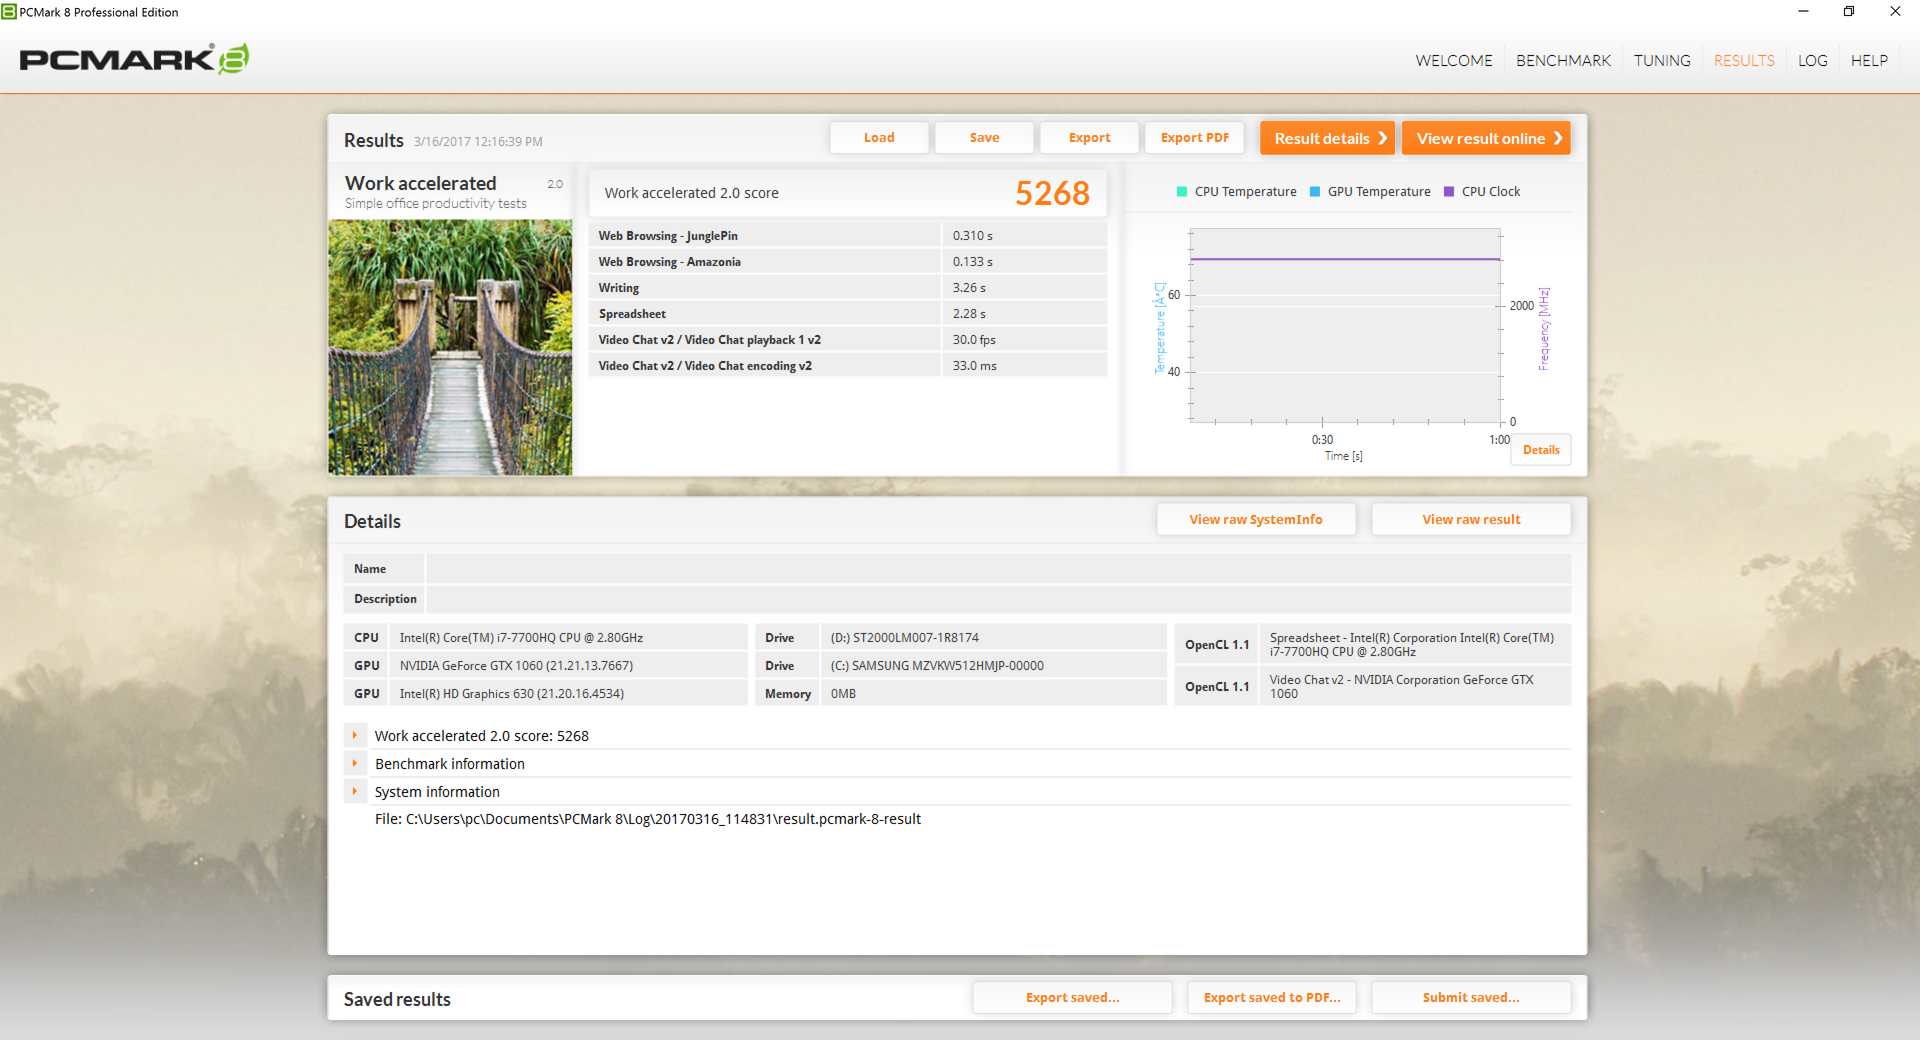
PCMark 8 ranks our GS63VR similarly to other gaming notebooks of its class. Its PCMark Creative score, however, is notably worse than the similarly equipped FX502VM.
Subjectively, we experienced no software or hardware issues during regular use and gaming loads. Unfortunately, extreme benchmark loads with Prime95 and FurMark would consistently crash our test unit after half a minute or so of running. As such, we are unable to provide our usual fan noise, temperature, and power consumption measurements when subjected to both Prime95 and FurMark loads. Otherwise, games appear to run normally and we will provide Witcher 3 measurements instead as a replacement. We recommend that new owners of the GS63VR run benchmark checks and RAM diagnostic tools to make sure that the system behaves as it should when under extreme loads.
| PCMark 8 | |
| Home Score Accelerated v2 | |
| Alienware 15 R3 | |
| Asus FX502VM-AS73 | |
| MSI GS63VR 7RF-228US | |
| Gigabyte P55W v7 | |
| Dell XPS 15 9560 (i7-7700HQ, UHD) | |
| Work Score Accelerated v2 | |
| Gigabyte P55W v7 | |
| Alienware 15 R3 | |
| MSI GS63VR 7RF-228US | |
| Dell XPS 15 9560 (i7-7700HQ, UHD) | |
| Asus FX502VM-AS73 | |
| Creative Score Accelerated v2 | |
| Alienware 15 R3 | |
| Asus FX502VM-AS73 | |
| MSI GS63VR 7RF-228US | |
| Dell XPS 15 9560 (i7-7700HQ, UHD) | |
| PCMark 8 Home Score Accelerated v2 | 4141 points | |
| PCMark 8 Creative Score Accelerated v2 | 5318 points | |
| PCMark 8 Work Score Accelerated v2 | 5268 points | |
Help | ||
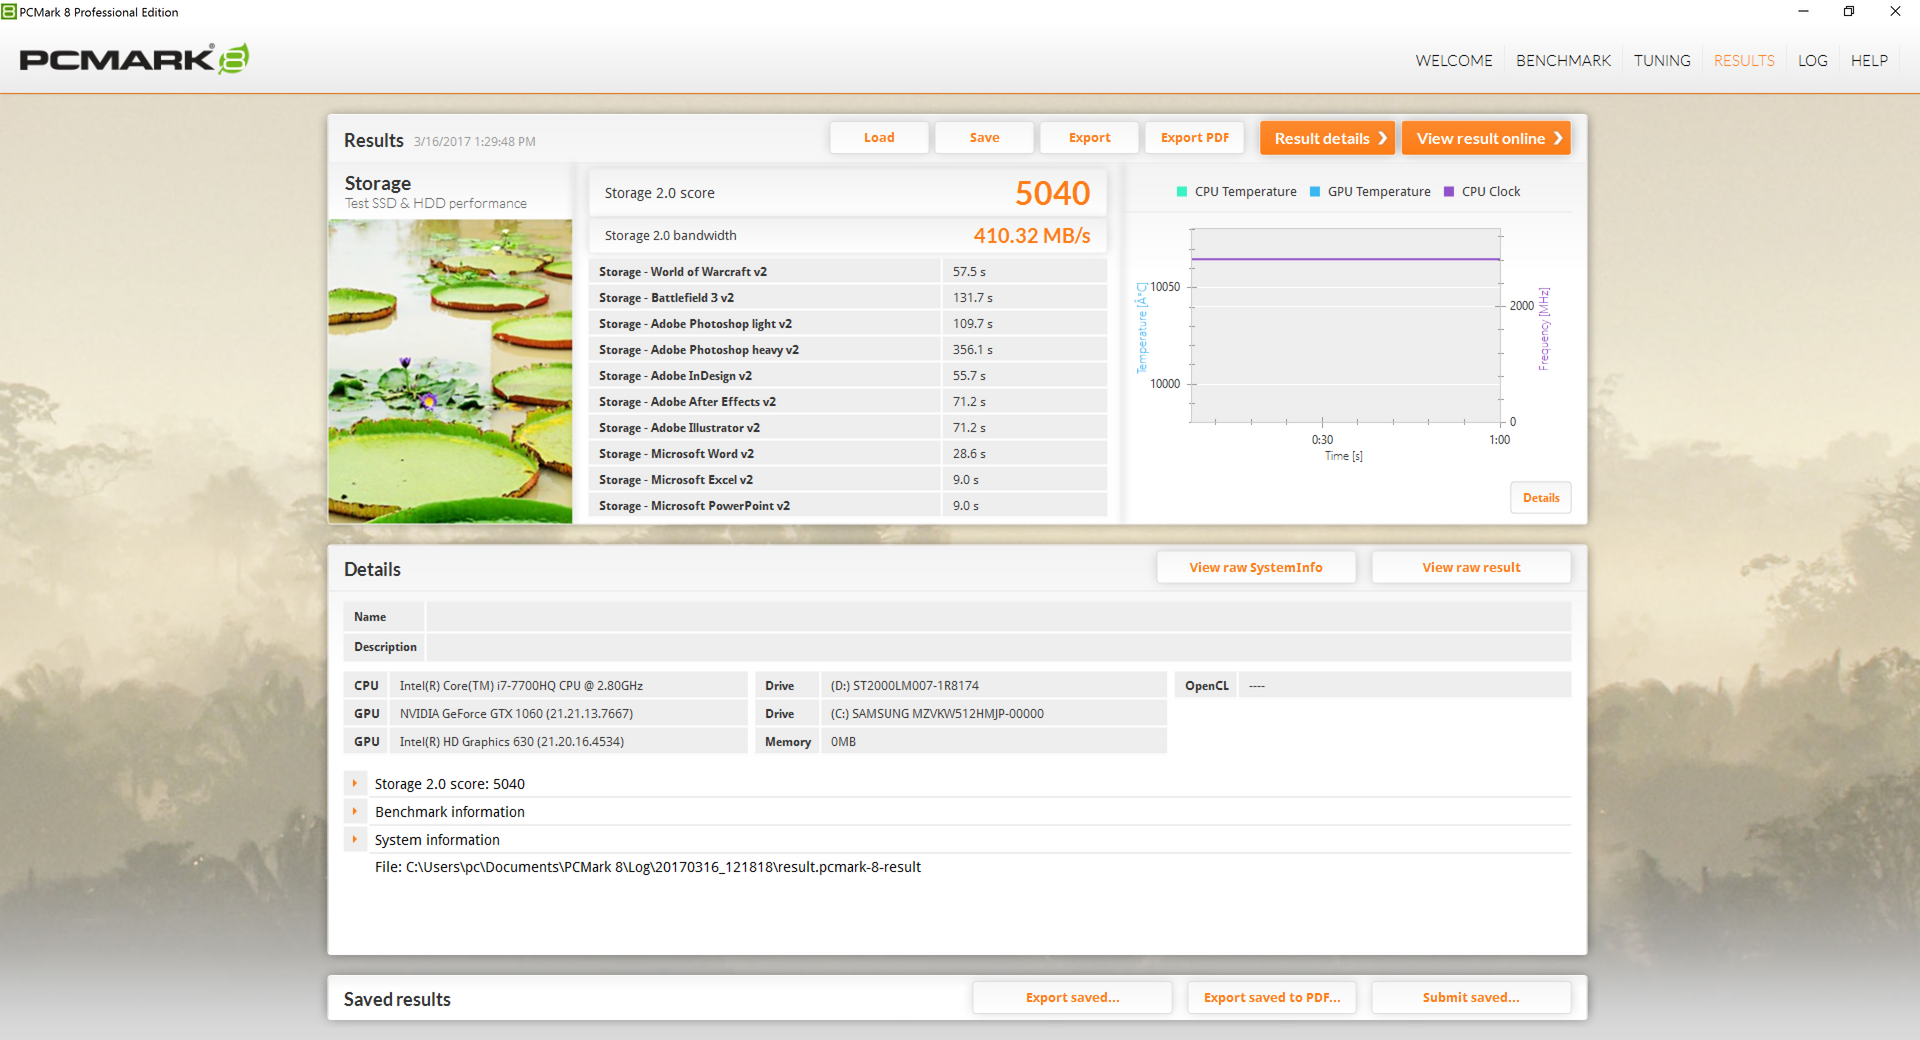
Storage Devices
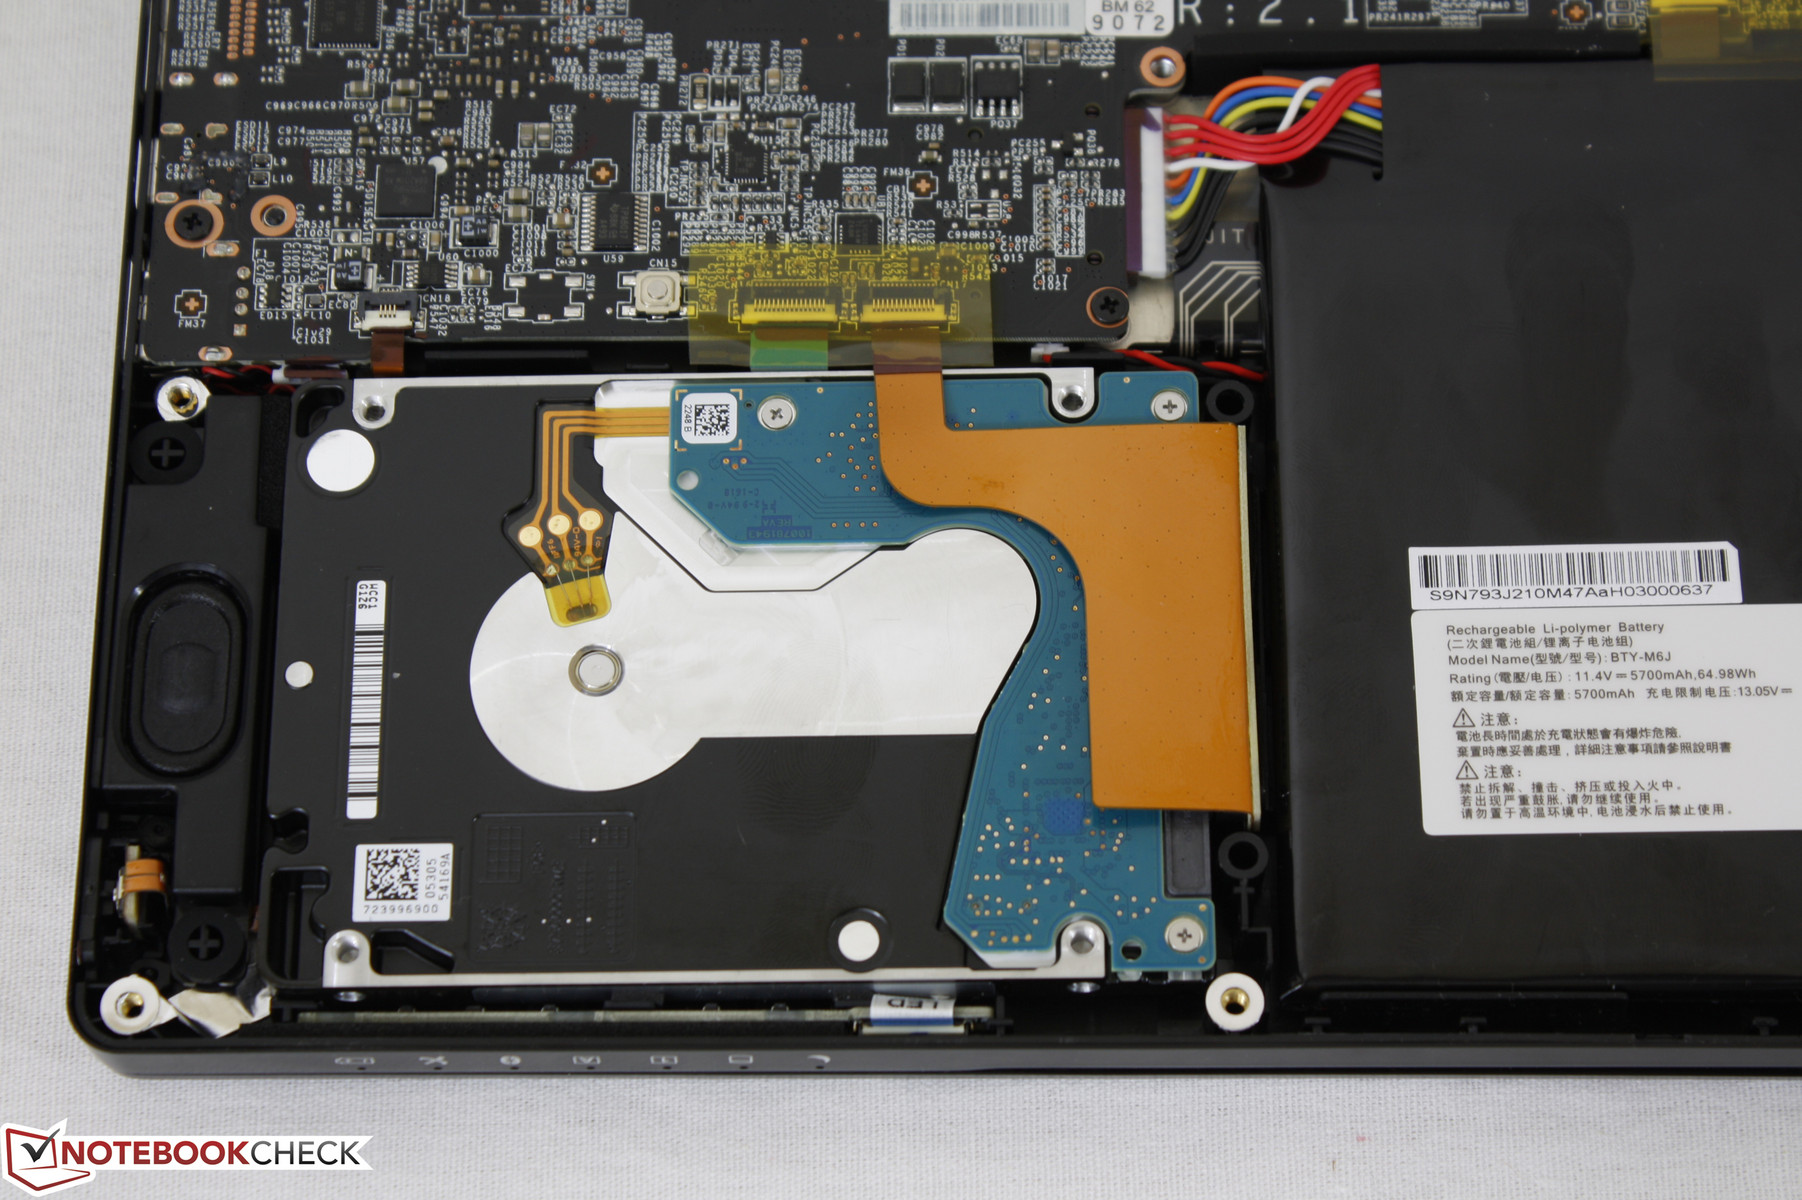
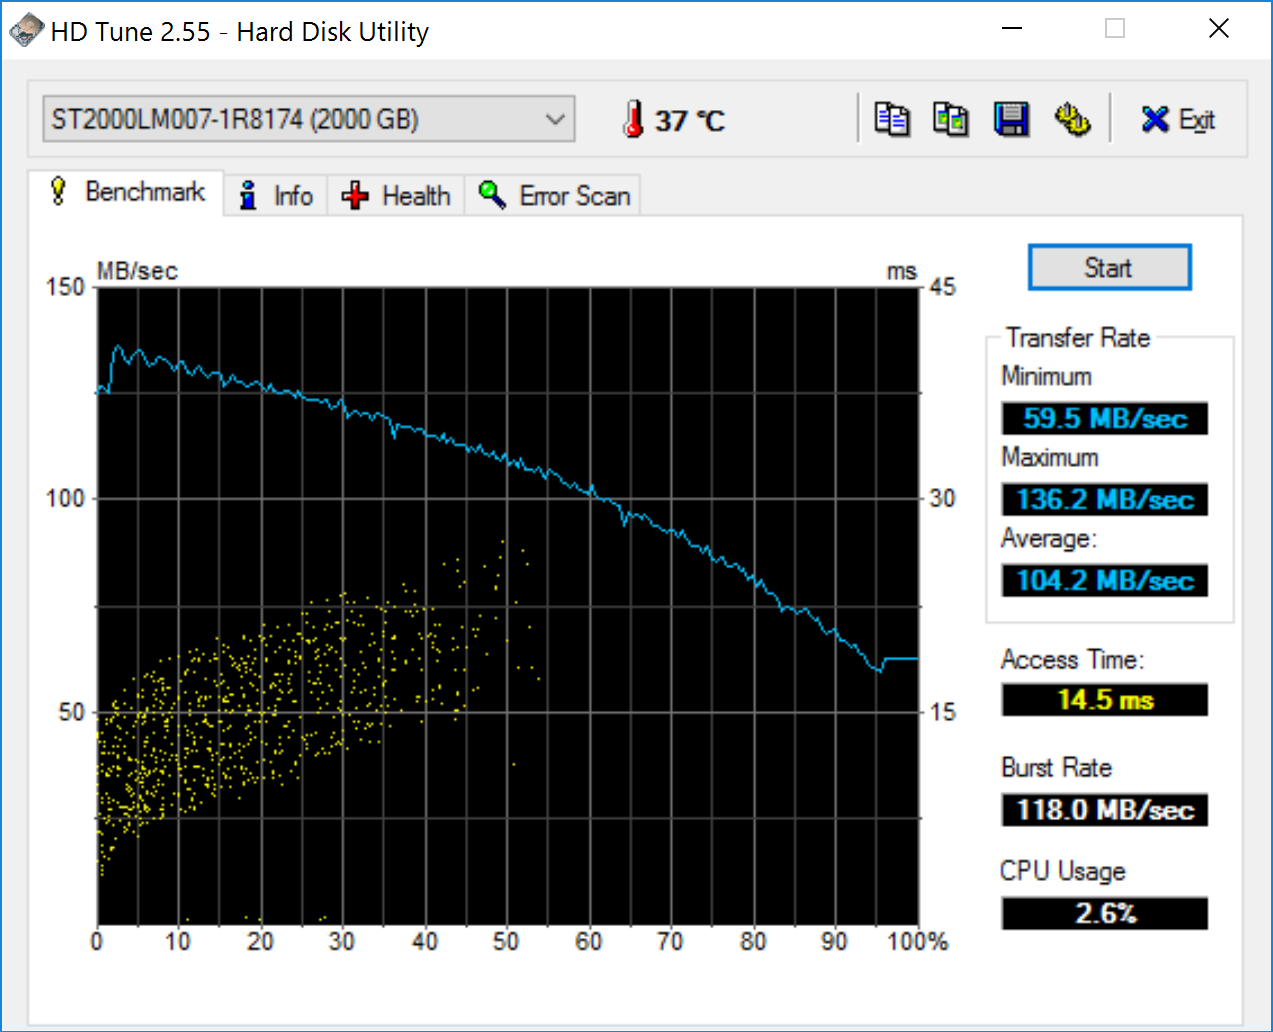
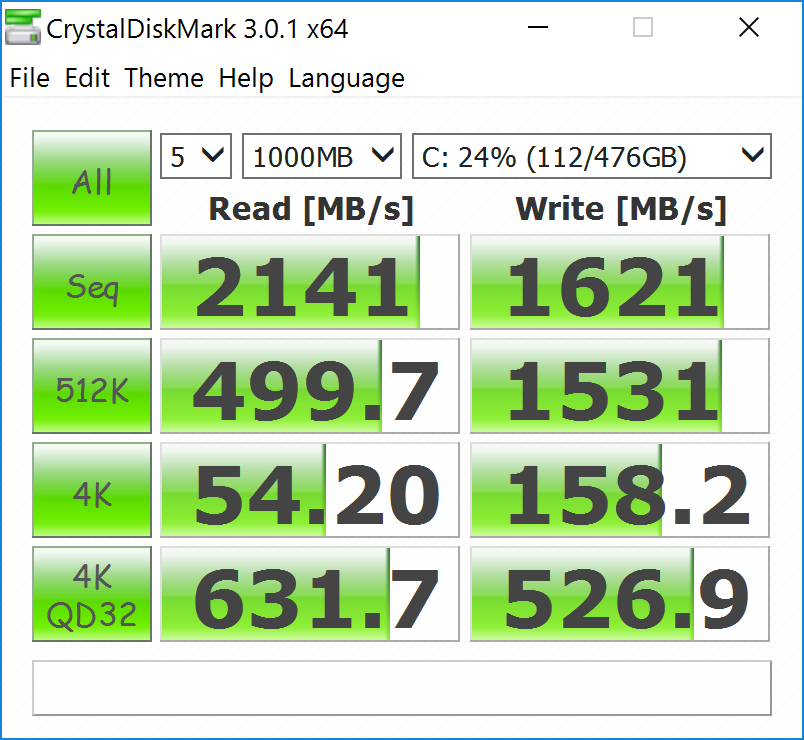
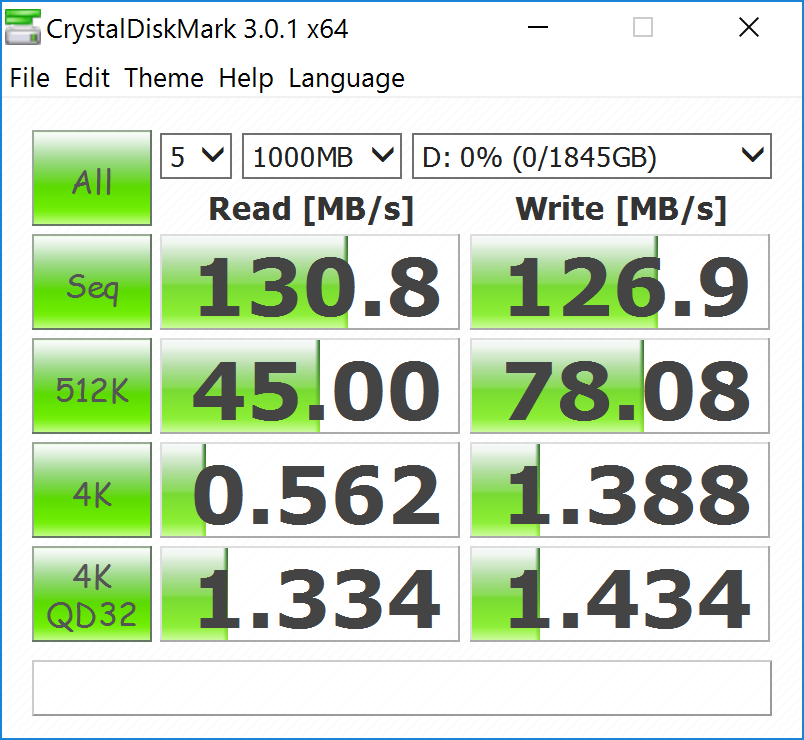
Our MSI configuration is equipped with a primary Samsung SM961 M.2 NVMe SSD and a secondary 2 TB Seagate ST2000LM007-1R8174 HDD. Transfer rates from the primary SSD outpace even the Apple SM1024L SSD as found on the new MacBook Pro 15 according to CDM. Sequential read rates are very fast at over 2100 MB/s compared to about 1600 MB/s on the latest XPS 15 9560. Meanwhile, the Seagate HDD returns an average transfer rate of about 104 MB/s according to HD Tune, which is about average for a 7200 RPM drive. A 7 mm HDD or SSD is recommended as the tight space may not accommodate a 9.5 mm drive.
See our growing benchmark list of HDDs and SSDs for more comparisons.
| MSI GS63VR 7RF-228US Samsung SM961 MZVKW512HMJP m.2 PCI-e | Dell XPS 15 9560 (i7-7700HQ, UHD) Lite-On CX2-8B512-Q11 | Asus FX502VM-AS73 SK Hynix HFS256G39TND-N210A | Alienware 15 R3 | Apple MacBook Pro 15 2016 (2.9 GHz, 460) Apple SSD SM1024L | |
|---|---|---|---|---|---|
| CrystalDiskMark 3.0 | -7% | -64% | -26% | -19% | |
| Read Seq (MB/s) | 2141 | 1684 -21% | 503 -77% | 1123 -48% | 1458 -32% |
| Write Seq (MB/s) | 1621 | 1106 -32% | 138.2 -91% | 429.2 -74% | 1440 -11% |
| Read 512 (MB/s) | 499.7 | 977 96% | 343.5 -31% | 833 67% | 914 83% |
| Write 512 (MB/s) | 1531 | 1119 -27% | 137.8 -91% | 428.1 -72% | 1058 -31% |
| Read 4k (MB/s) | 54.2 | 45.14 -17% | 29.36 -46% | 37.8 -30% | 9.786 -82% |
| Write 4k (MB/s) | 158.2 | 134.1 -15% | 70.9 -55% | 122.9 -22% | 10.9 -93% |
| Read 4k QD32 (MB/s) | 632 | 509 -19% | 369.9 -41% | 542 -14% | 679 7% |
| Write 4k QD32 (MB/s) | 527 | 398.1 -24% | 99.7 -81% | 429.8 -18% | 562 7% |

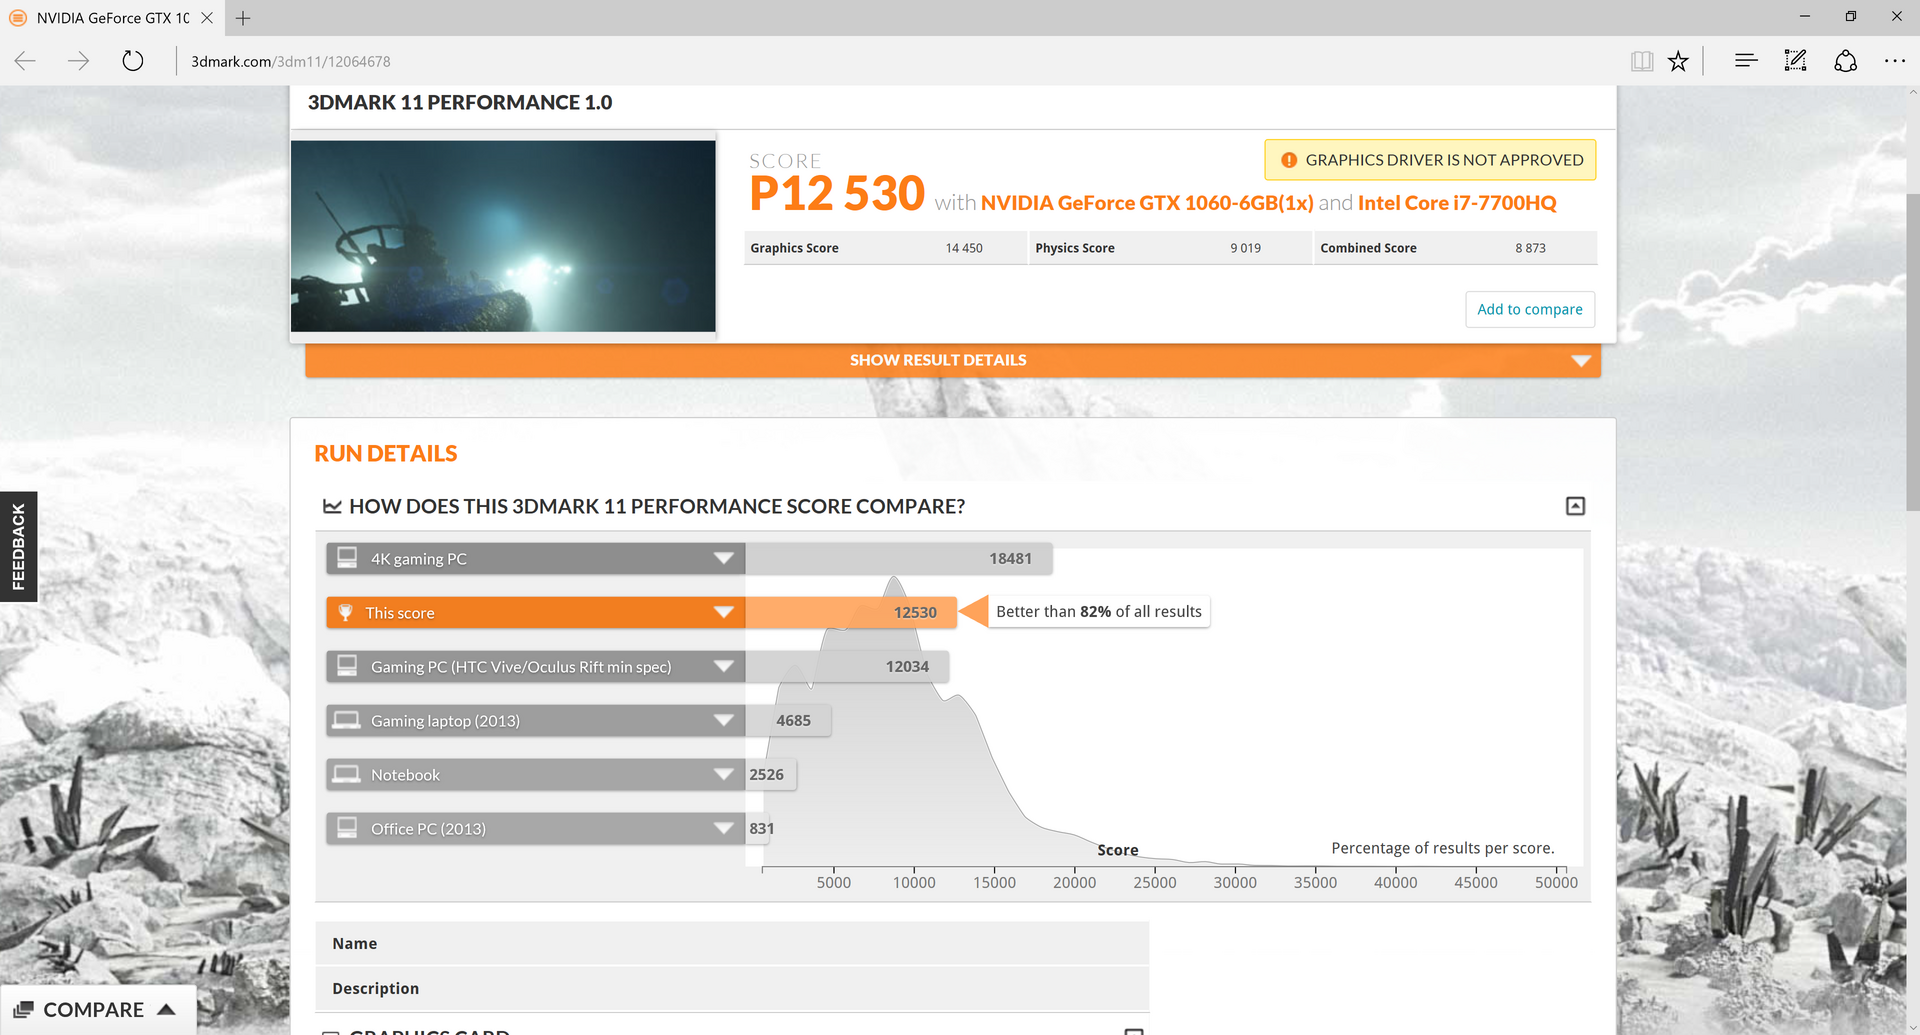
GPU Performance
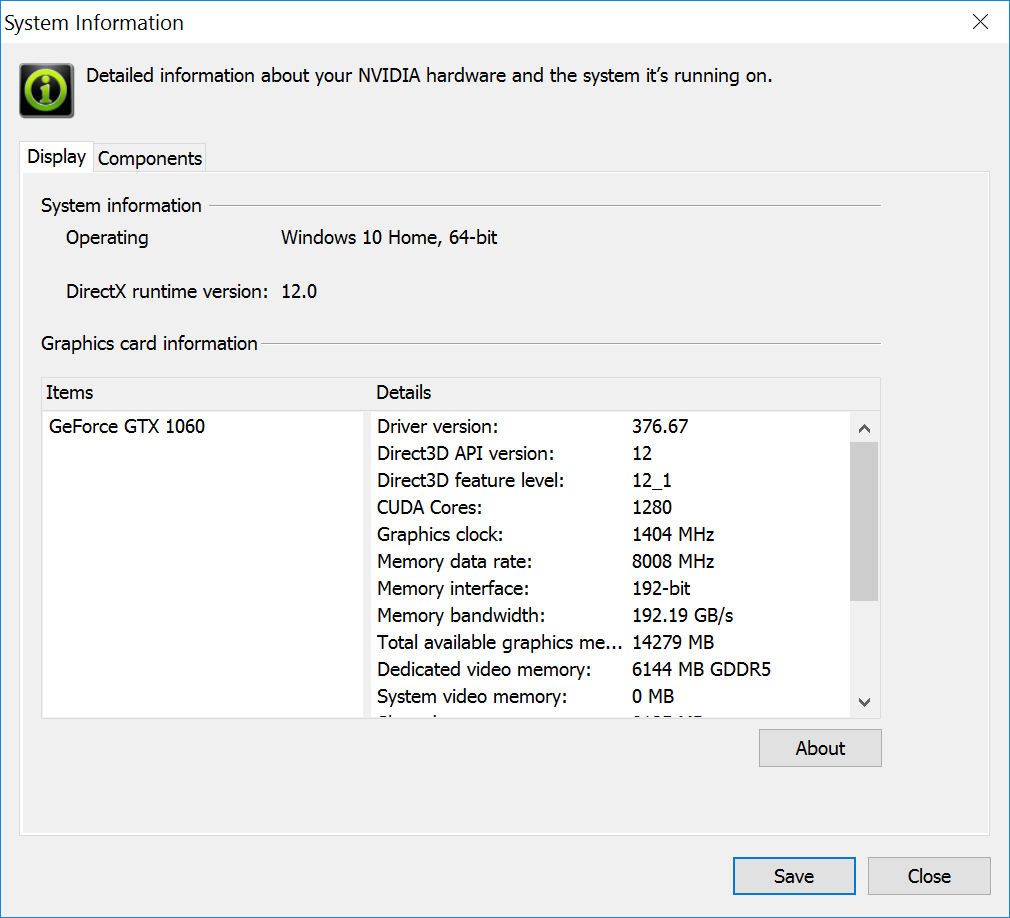
When testing high-performance thin gaming notebooks like the GS63VR, we're always on the lookout for potential GPU throttling or small cut corners that could negatively impact gaming performance. Fortunately, we can find no such drawbacks on the MSI notebook as GPU performance is essentially on par with the similarly equipped Asus FX502VM according to 3DMark benchmarks. Our desktop GeForce GTX 1060 reference card, however, is about 15 percent faster than the mobile GTX 1060 found on the MSI. Even so, raw graphics performance from the GS63VR is still about 10 to 15 percent faster than the GTX 980M.
See our review on the GTX 1060 for more technical information on the Pascal series.
| 3DMark | |
| 1920x1080 Fire Strike Graphics | |
| Asus Strix GL702VSK | |
| Asus Strix GTX 980 Ti Desktop PC | |
| Nvidia GeForce GTX 1060 Founders Edition 6 GB | |
| Asus FX502VM-AS73 | |
| MSI GS63VR 7RF-228US | |
| Razer Blade (2016) FHD | |
| Asus Strix GL502VY-DS71 | |
| Schenker XMG P407 | |
| 3840x2160 Fire Strike Ultra Graphics | |
| Asus Strix GTX 980 Ti Desktop PC | |
| Nvidia GeForce GTX 1060 Founders Edition 6 GB | |
| Asus FX502VM-AS73 | |
| MSI GS63VR 7RF-228US | |
| Razer Blade (2016) FHD | |
| Asus Strix GL502VY-DS71 | |
| Schenker XMG P407 | |
| Fire Strike Extreme Graphics | |
| Asus Strix GL702VSK | |
| Asus Strix GTX 980 Ti Desktop PC | |
| Asus FX502VM-AS73 | |
| MSI GS63VR 7RF-228US | |
| Razer Blade (2016) FHD | |
| Asus Strix GL502VY-DS71 | |
| Schenker XMG P407 | |
| 3DMark 11 | |
| 1280x720 Performance GPU | |
| Asus Strix GTX 980 Ti Desktop PC | |
| Asus Strix GL702VSK | |
| Nvidia GeForce GTX 1060 Founders Edition 6 GB | |
| Asus FX502VM-AS73 | |
| MSI GS63VR 7RF-228US | |
| Razer Blade (2016) FHD | |
| Asus Strix GL502VY-DS71 | |
| Schenker XMG P407 | |
| 1280x720 Performance Combined | |
| Asus Strix GTX 980 Ti Desktop PC | |
| Nvidia GeForce GTX 1060 Founders Edition 6 GB | |
| Asus FX502VM-AS73 | |
| MSI GS63VR 7RF-228US | |
| Asus Strix GL502VY-DS71 | |
| Razer Blade (2016) FHD | |
| Schenker XMG P407 | |
| Asus Strix GL702VSK | |
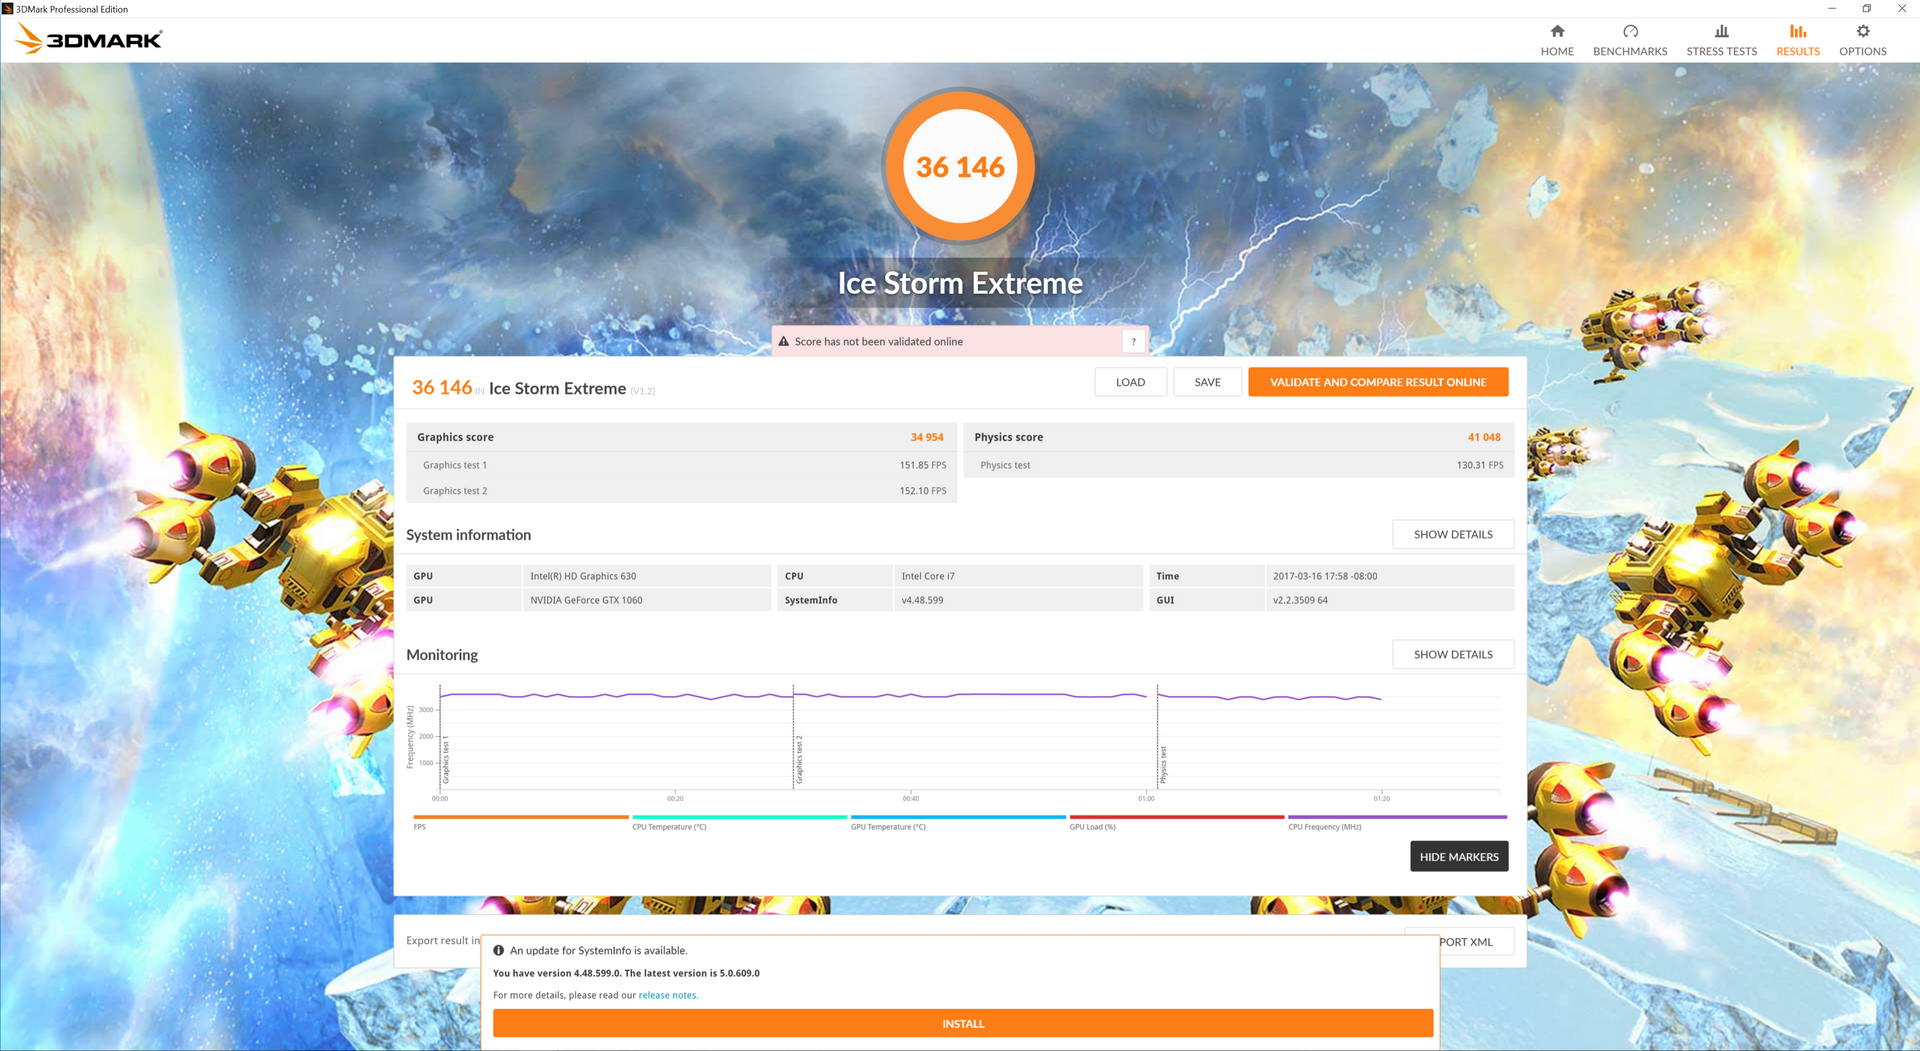
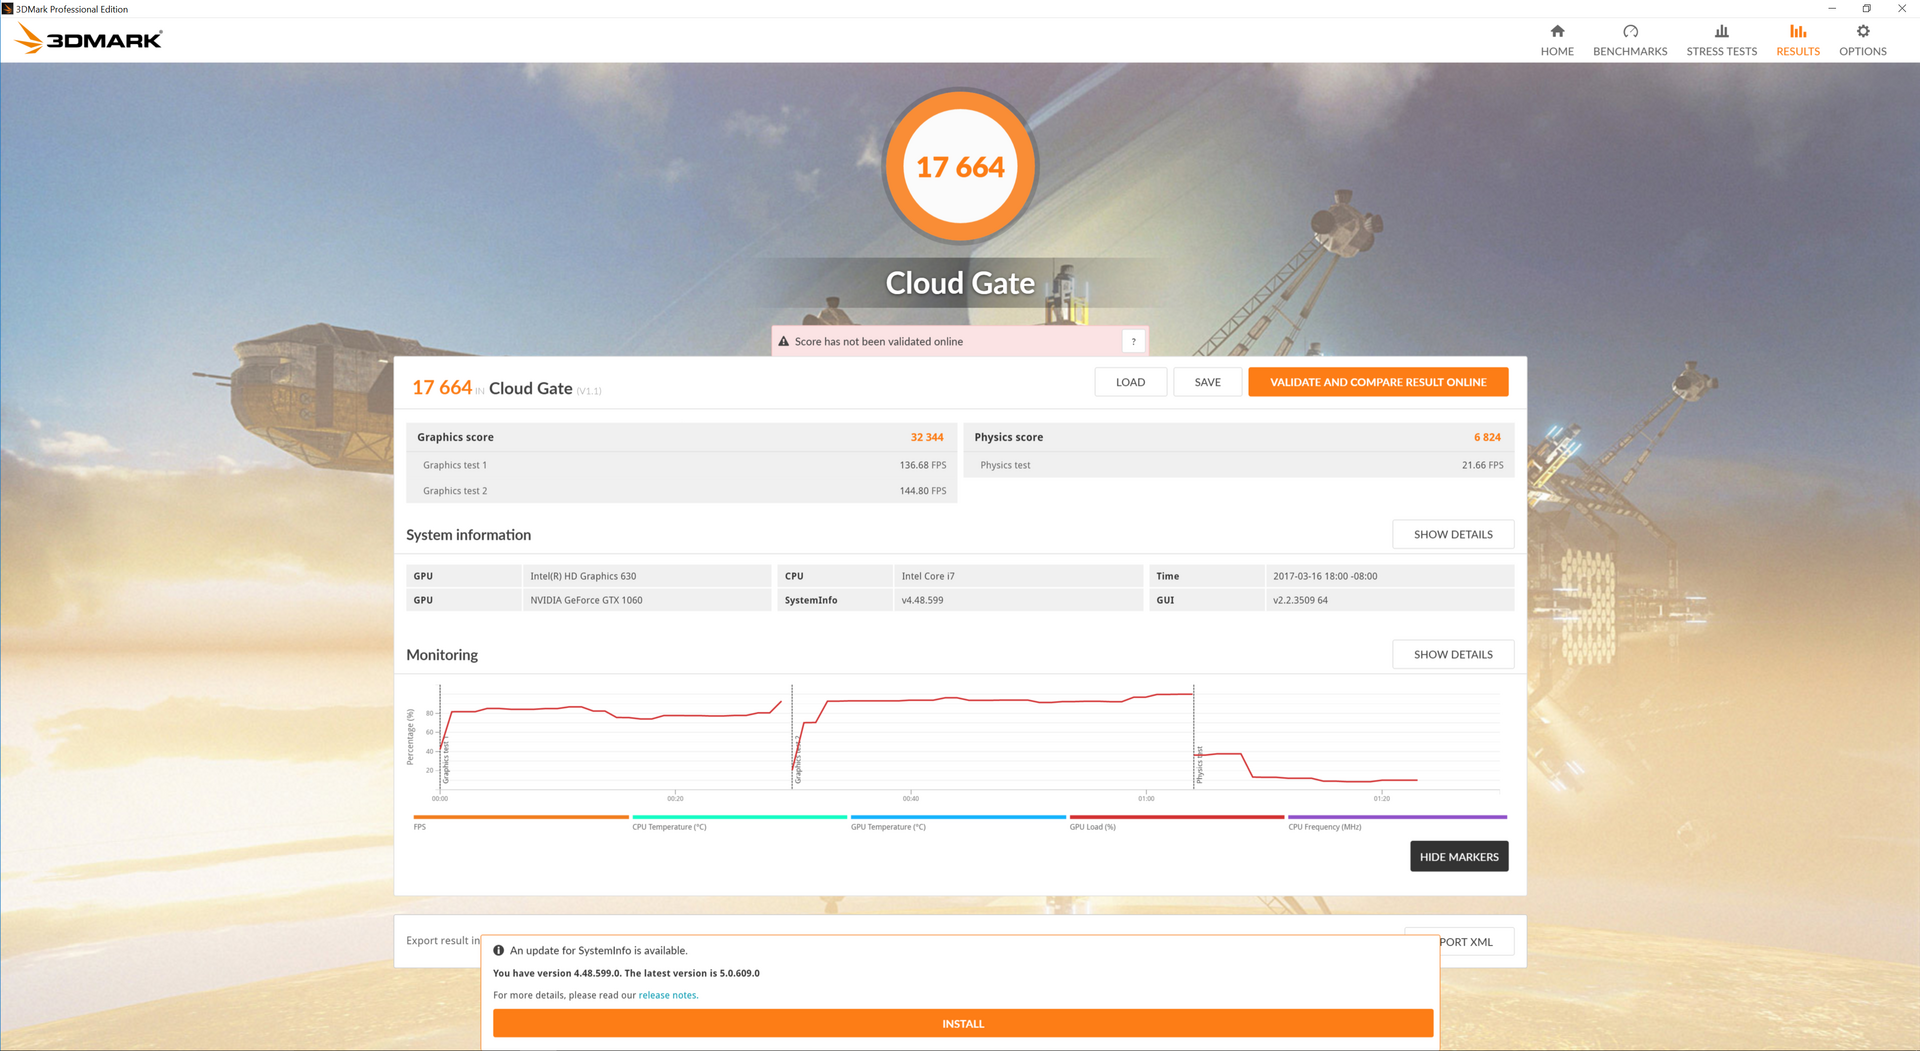
| 3DMark 11 Performance | 12530 points | |
| 3DMark Cloud Gate Standard Score | 17664 points | |
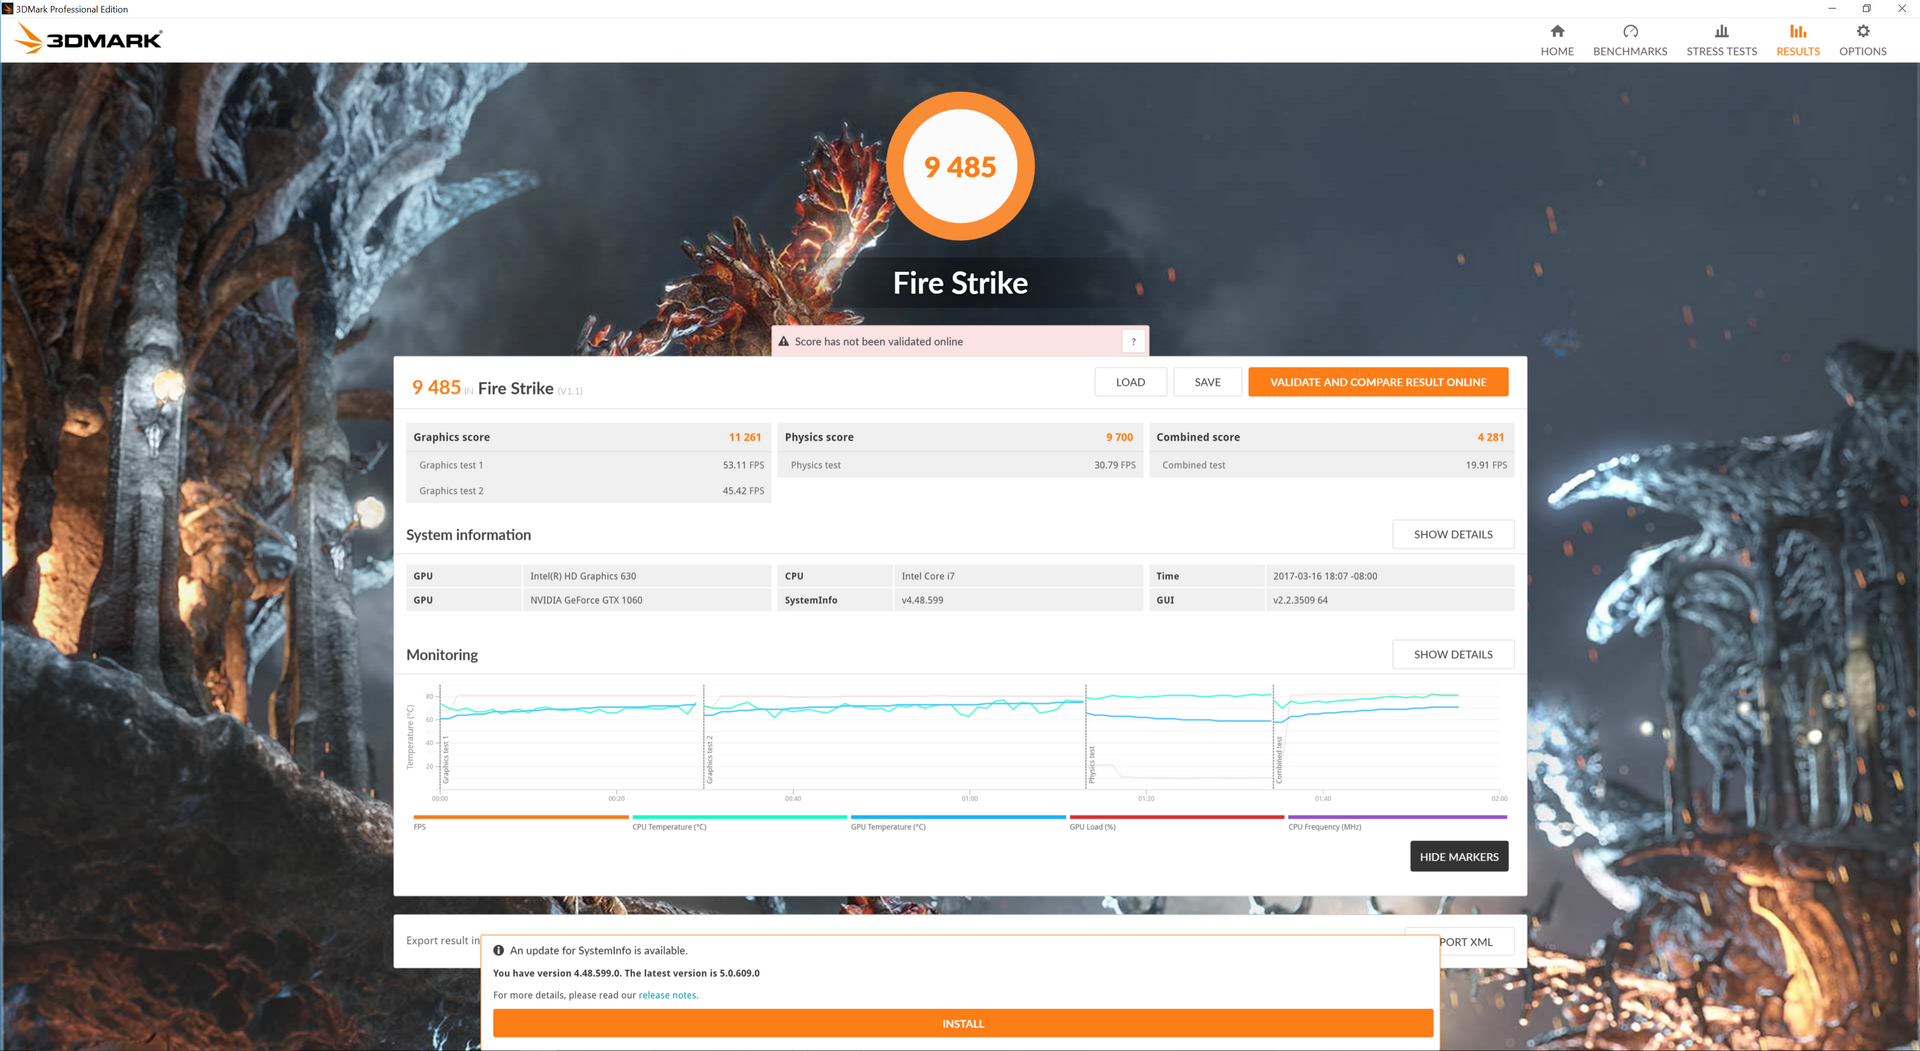
| 3DMark Fire Strike Score | 9485 points | |
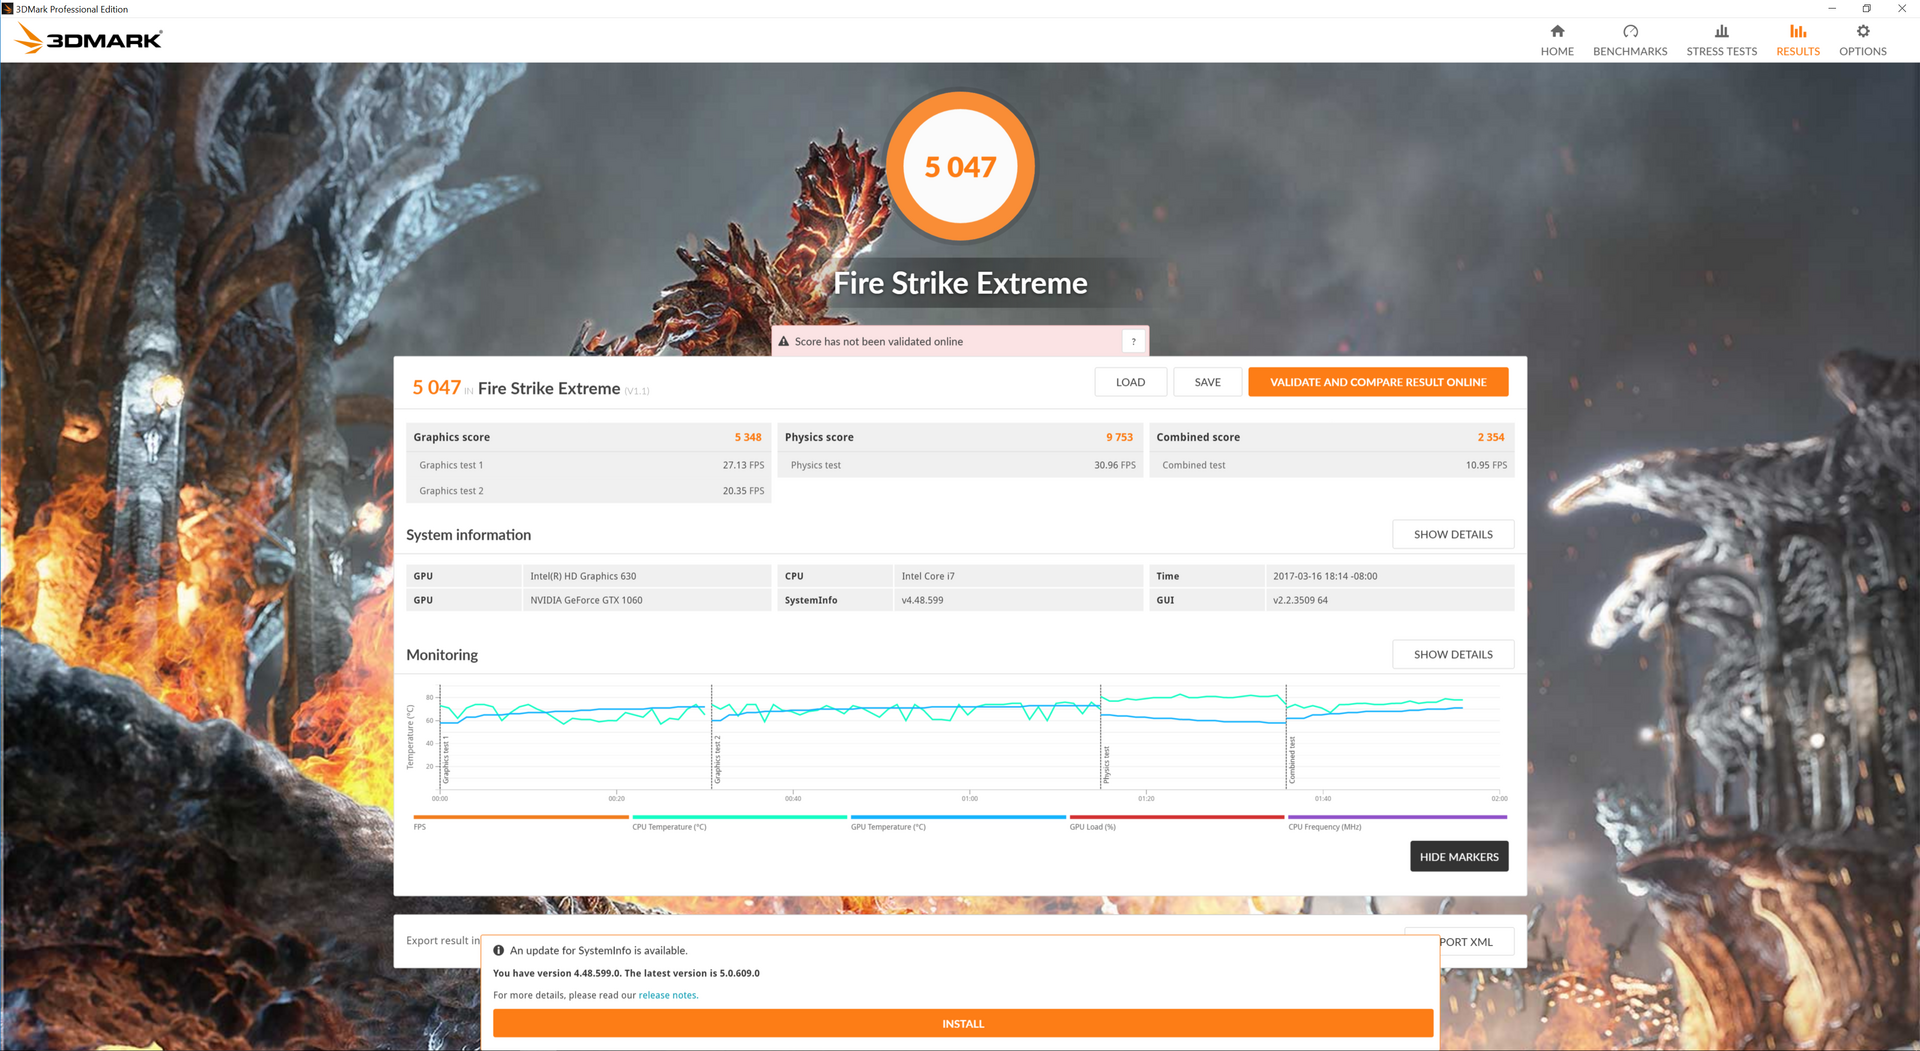
| 3DMark Fire Strike Extreme Score | 5047 points | |
Help | ||
Gaming Performance
Nvidia designed the GTX 1060 for 1080p gaming and the proof is in the benchmarks. The MSI struggles to run most games at the native 4K UHD resolution with many titles averaging below 30 FPS. Turning settings down to the low-medium range should do the trick if players desire sharpness over graphical features. Even so, G-Sync would have been a good addition to the system as it works best when frame rates are between the 30 and 60 FPS range. Most titles will otherwise run at 60 FPS or higher when gaming at 1080p with all settings set to High or Maximum. The desktop GTX 1060 edges out the mobile GTX 1060 by 10 to 15 percent in most games with Fallout 4 being a notable exception at almost 25 percent over the MSI notebook.
See our dedicated GPU page on the GTX 1060 for more benchmark comparisons.
| low | med. | high | ultra | 4K | |
|---|---|---|---|---|---|
| BioShock Infinite (2013) | 100.6 | ||||
| Metro: Last Light (2013) | 78.1 | ||||
| Thief (2014) | 74.9 | ||||
| The Witcher 3 (2015) | 76 | 39.4 | 26.3 | ||
| Batman: Arkham Knight (2015) | 58 | 29 | |||
| Metal Gear Solid V (2015) | 60 | 40.8 | |||
| Fallout 4 (2015) | 64 | 26.2 | |||
| Rise of the Tomb Raider (2016) | 64.1 | 25.5 | |||
| Doom (2016) | 92.3 | 30.5 | |||
| Overwatch (2016) | 104.6 | 54.5 | |||
| Mafia 3 (2016) | 43.6 | 13.1 |
| Fallout 4 - 3840x2160 High Preset AA:T AF:16x | |
| Eurocom Tornado F5 Killer Edition | |
| Gigabyte P57X v7 | |
| Nvidia GeForce GTX 1060 Founders Edition 6 GB | |
| MSI GS63VR 7RF-228US | |
| MSI GE72 7RE-046 | |
| Dell XPS 15 9560 (i7-7700HQ, UHD) | |
| The Witcher 3 - 3840x2160 High Graphics & Postprocessing (Nvidia HairWorks Off) | |
| Eurocom Tornado F5 Killer Edition | |
| Nvidia GeForce GTX 1060 Founders Edition 6 GB | |
| MSI GS63VR 7RF-228US | |
| MSI GE72 7RE-046 | |
| Batman: Arkham Knight - 3840x2160 High / On (Interactive Smoke & Paper Debris Off) AA:SM AF:8x | |
| Eurocom Tornado F5 Killer Edition | |
| Gigabyte P57X v7 | |
| Nvidia GeForce GTX 1060 Founders Edition 6 GB | |
| MSI GS63VR 7RF-228US | |
| MSI GE72 7RE-046 | |
| Dell XPS 15 9560 (i7-7700HQ, UHD) | |
| Rise of the Tomb Raider - 3840x2160 High Preset AA:FX AF:4x | |
| Eurocom Tornado F5 Killer Edition | |
| Gigabyte P57X v7 | |
| Nvidia GeForce GTX 1060 Founders Edition 6 GB | |
| Nvidia GeForce GTX 1060 Founders Edition 6 GB | |
| MSI GS63VR 7RF-228US | |
| MSI GE72 7RE-046 | |
| Dell XPS 15 9560 (i7-7700HQ, UHD) | |
| Doom - 3840x2160 High Preset AA:FX | |
| Eurocom Tornado F5 Killer Edition | |
| Nvidia GeForce GTX 1060 Founders Edition 6 GB | |
| MSI GS63VR 7RF-228US | |
| MSI GE72 7RE-046 | |
| Dell XPS 15 9560 (i7-7700HQ, UHD) | |
| Overwatch - 3840x2160 High (Render Scale 100 %) AA:SM AF:4x | |
| Eurocom Tornado F5 Killer Edition | |
| Nvidia GeForce GTX 1060 Founders Edition 6 GB | |
| MSI GS63VR 7RF-228US | |
| MSI GE72 7RE-046 | |
| Dell XPS 15 9560 (i7-7700HQ, UHD) | |
| Mafia 3 - 3840x2160 High Preset | |
| Eurocom Tornado F5 Killer Edition | |
| MSI GS63VR 7RF-228US | |
| MSI GE72 7RE-046 | |
Stress Test
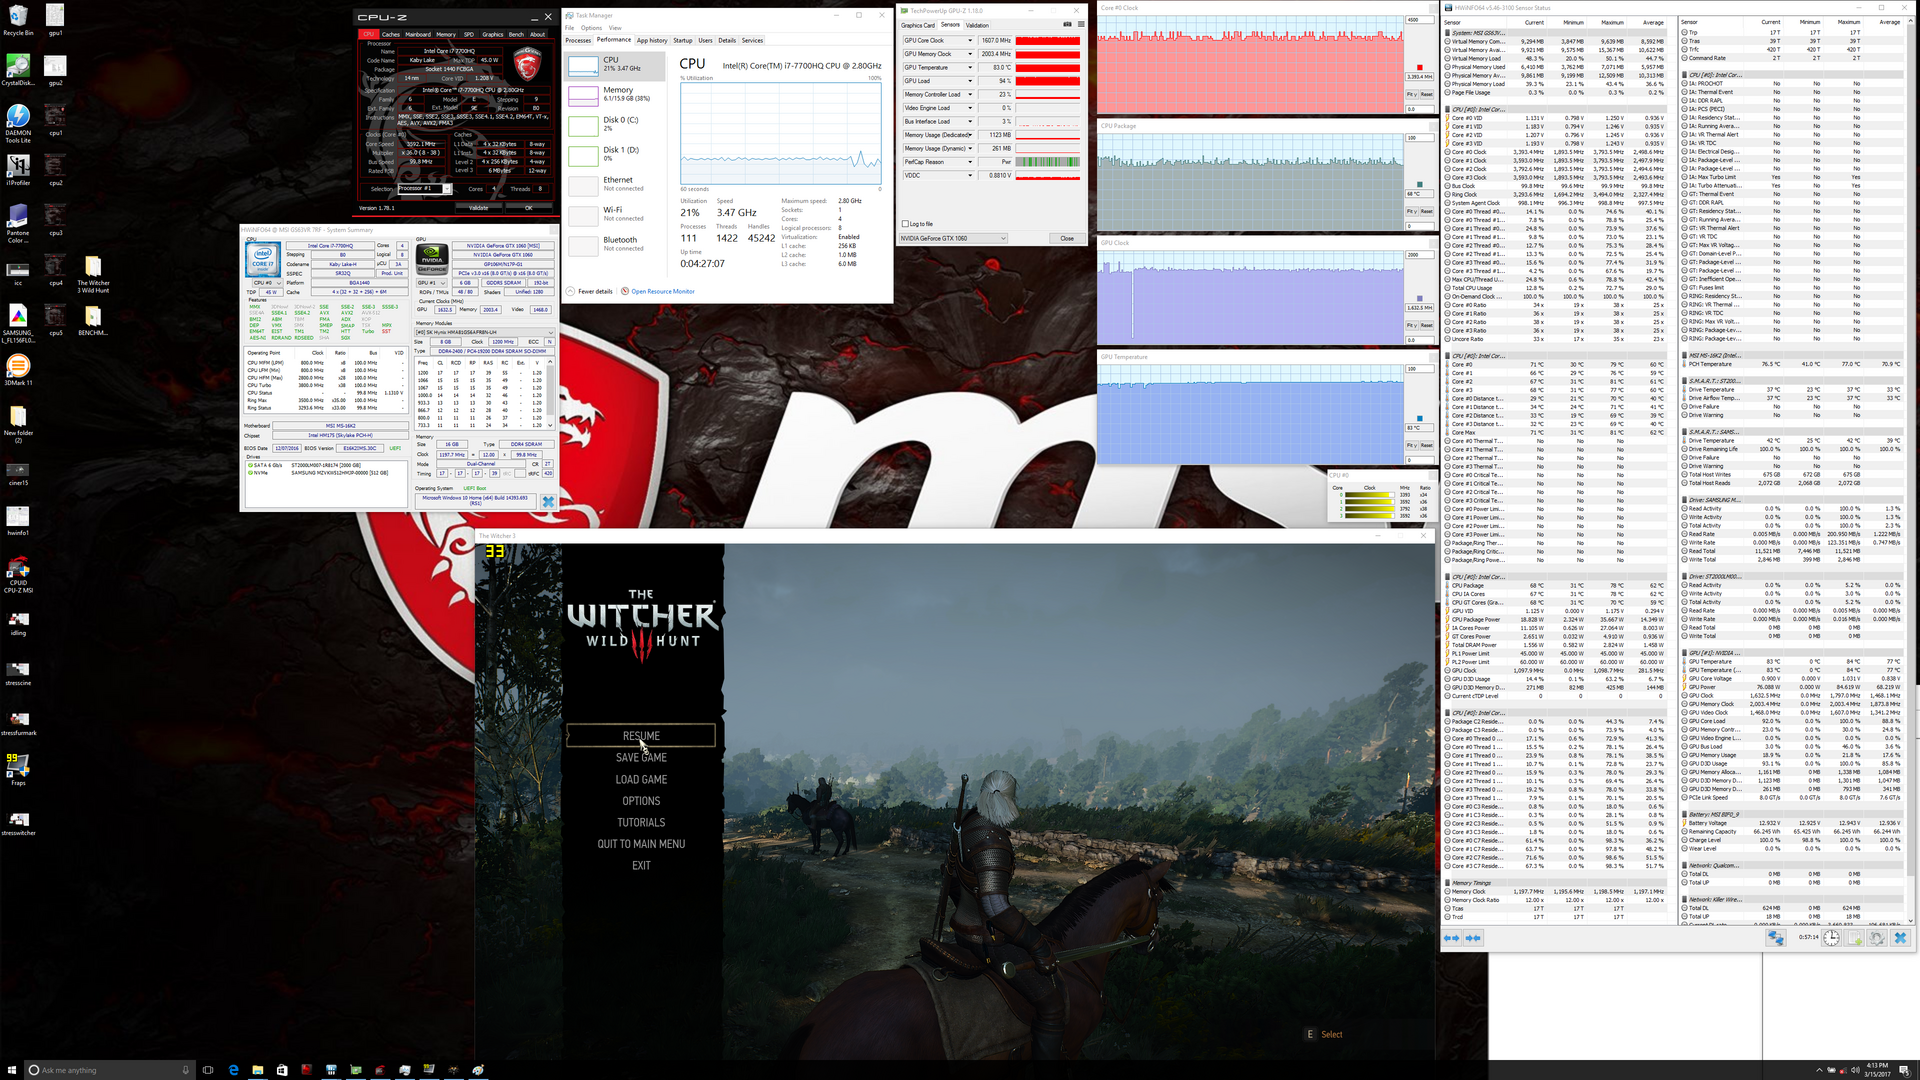
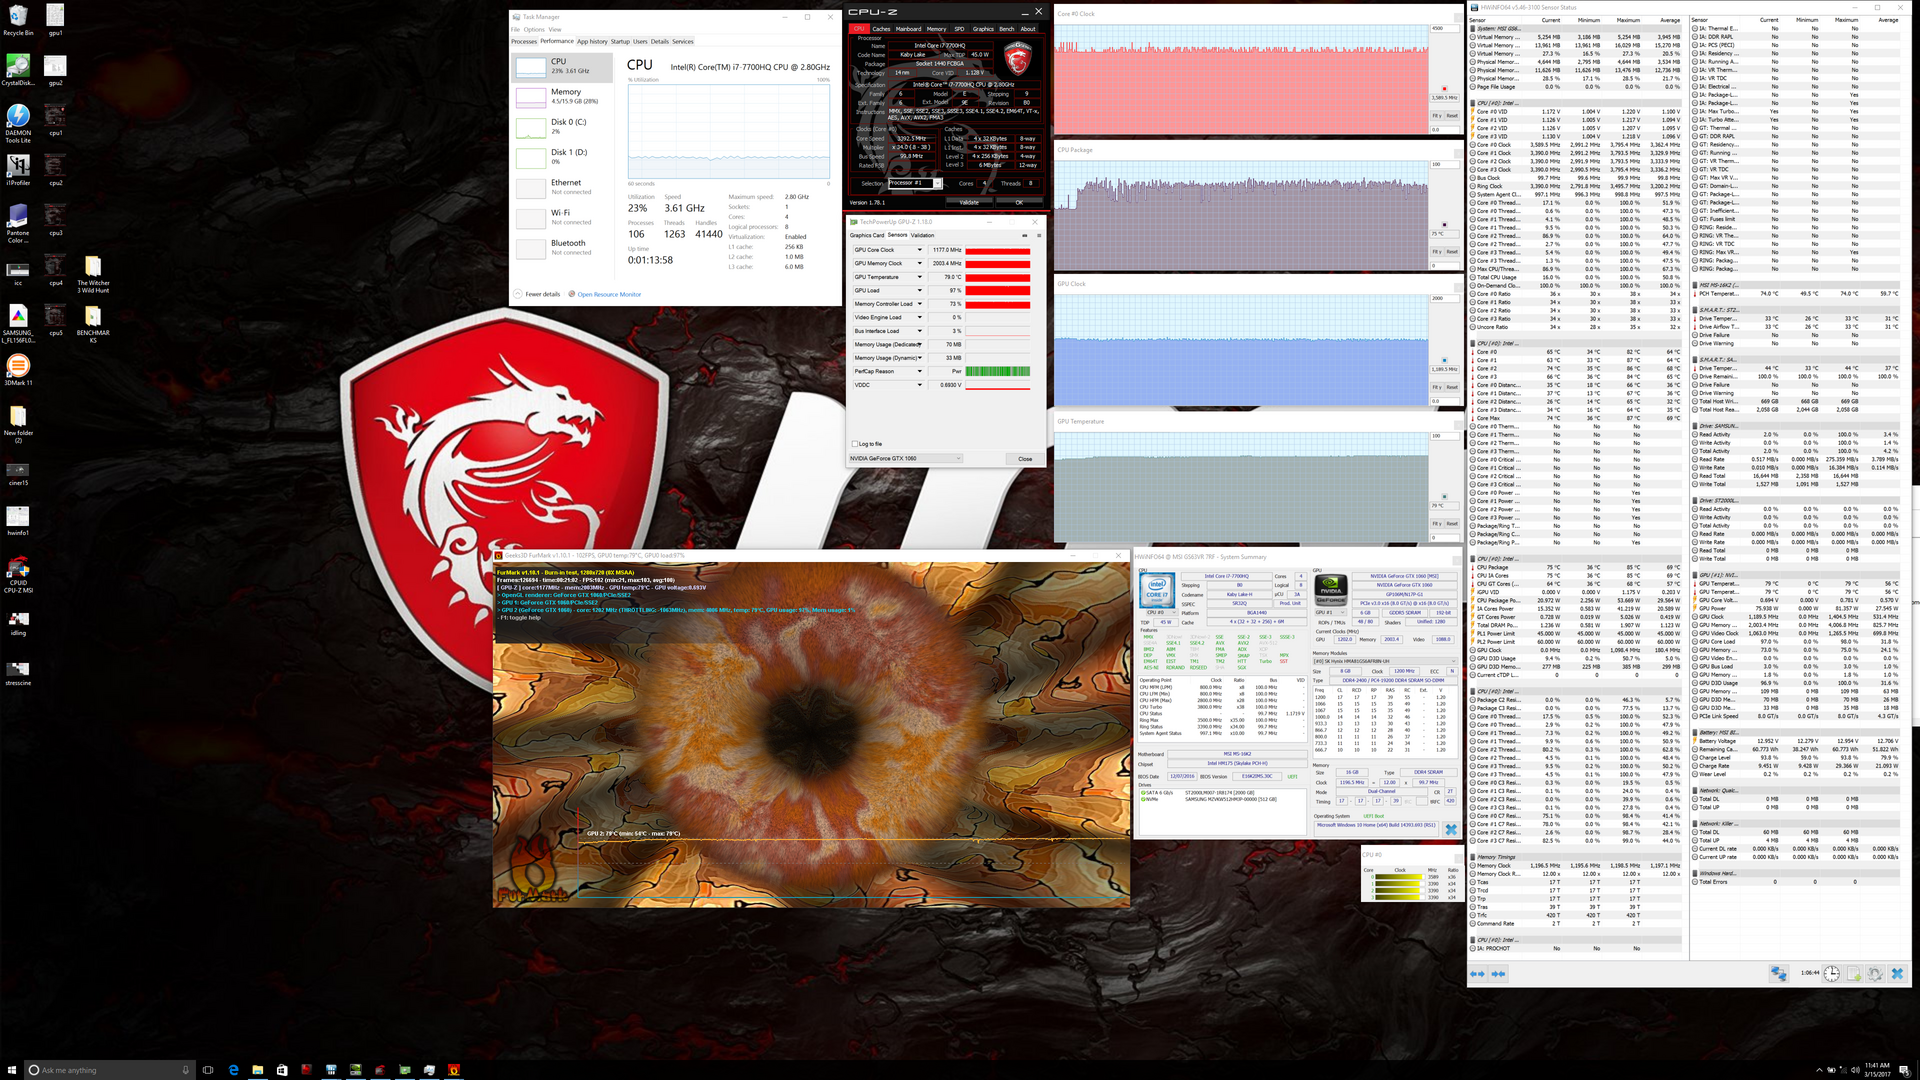
Our usual stress tests involve running Prime95 and FurMark and then recording the core temperatures that the system will stabilize at. Since our specific test unit appears to crash when running Prime95 or when being heavily taxed to an unrealistic 100 percent load, we decided to run CineBench R15 Multi-Thread in a loop and have recorded the results below. The CPU stabilizes at an acceptable 76 C with consistent 3.1 to 3.3 GHz Turbo Boost clock rates compared to its base clock rate of 2.8 GHz and a maximum Turbo Boost clock rate of 3.8 GHz. Meanwhile, the GPU is able to maintain Boost clock rates in the 1600 MHz range when running Witcher 3 compared to its base clock rate of 1404 MHz. The fact that such a thin system can maintain clock rates above their advertised base rates is impressive on its own right. The drawback is a high GPU temperature of 83 C compared to larger systems like the GT72 or GT73VR where core temperatures are usually in the cooler 70 C ranged.
Running Witcher 3 for over an hour results in no steadily declining frame rates or throttling issues. Average frame rates are stable at about 39 FPS throughout our entire test run as recorded below. Running on batteries will automatically limit frame rates to 30 FPS to save power.
| CPU Clock (GHz) | GPU Clock (MHz) | Average CPU Temperature (°C) | Average GPU Temperature (°C) | |
| CineBench Loop Stress | 3.1 - 3.3 | -- | 76 | 51 |
| FurMark Stress | -- | 1190 | 75 | 79 |
| Witcher 3 Stress | 3.4 - 3.7 | 1633 | 68 | 83 |
Emissions
System Noise
Do more fans really make for a quieter experience? System noise is indeed measurably quieter than the outgoing GS60, but not by as much as one would hope. The fans are still always active on the GS63VR even when on Power Saver mode with fan speed set to Basic. Idling on desktop is already louder than most gaming or multimedia notebooks including the Asus FX502VM and XPS 15. Keep in mind that the fans are much more sensitive to RPM changes when the notebook is set to Balanced or High Performance modes, so Power Saver mode is recommended when working in classrooms or libraries.
Running 3DMark 06 and 3DMark 11 will bump fan noise slightly to 37.2 dB(A) and 45.5 dB(A), respectively. In comparison, the FX502VM and XPS 15 9560 will be at 46.2 dB(A) and 47.1 dB(A), respectively, when running 3DMark 11. While the GS63VR is a bit quieter, it also suffers from higher-pitched fans not unlike what we recorded on the larger GS73VR. For example, our microphone measurements below show a narrower peak at a higher frequency range compared to the broader peak of the Asus FX502VM. This is likely due to the addition of the smaller ~40 mm fan, so quieter fan noise comes at the cost of a slightly higher-pitched system. Earphones are recommend when gaming as we can record a fan noise of 47 dB(A) when playing Witcher 3.
Note that our Load Average measurements below for the XPS 15 and FX502VM were recorded while running 3DMark 11 while our Load Average measurement for the GS63VR was recorded while running 3DMark 06, so these values are not directly comparable with the MSI.
Outside of the fans, we can notice no coil whine on our test unit.
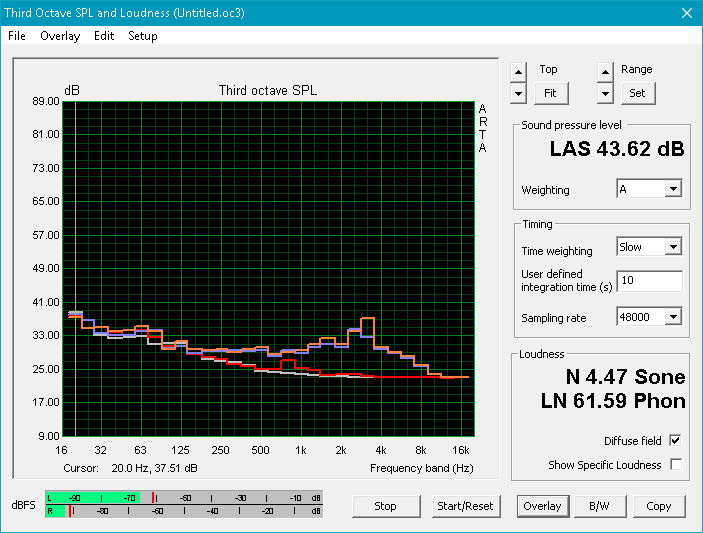
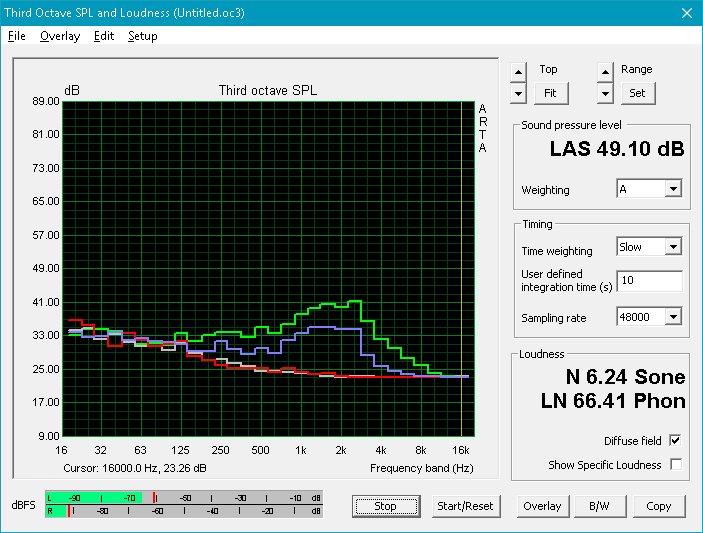
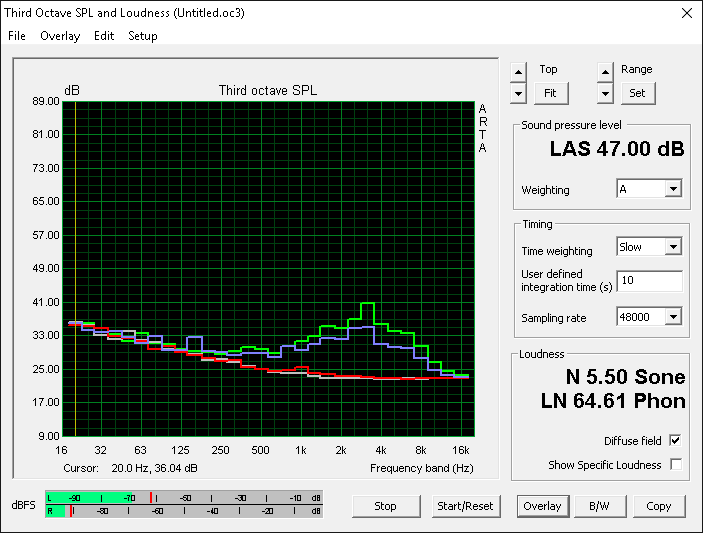
Noise level
| Idle |
| 33.1 / 33.1 / 34 dB(A) |
| Load |
| 37.2 / 47.1 dB(A) |
 | ||
30 dB silent 40 dB(A) audible 50 dB(A) loud |
||
min: | ||
| MSI GS63VR 7RF-228US GeForce GTX 1060 Mobile, i7-7700HQ, Samsung SM961 MZVKW512HMJP m.2 PCI-e | Dell XPS 15 9560 (i7-7700HQ, UHD) GeForce GTX 1050 Mobile, i7-7700HQ, Lite-On CX2-8B512-Q11 | Asus FX502VM-AS73 GeForce GTX 1060 Mobile, i7-7700HQ, SK Hynix HFS256G39TND-N210A | Alienware 15 R3 GeForce GTX 1070 Mobile, i7-7700HQ | Apple MacBook Pro 15 2016 (2.9 GHz, 460) Radeon Pro 460, 6920HQ, Apple SSD SM1024L | MSI GS60 6QE-002US GeForce GTX 970M, 6700HQ, Samsung SM951 MZHPV128 m.2 PCI-e | |
|---|---|---|---|---|---|---|
| Noise | -1% | -2% | -10% | 6% | -5% | |
| off / environment * (dB) | 28.8 | 28.4 1% | 28.7 -0% | 30 -4% | 29 -1% | |
| Idle Minimum * (dB) | 33.1 | 29 12% | 30.6 8% | 31 6% | 30.3 8% | 35.2 -6% |
| Idle Average * (dB) | 33.1 | 29 12% | 30.6 8% | 32 3% | 30.3 8% | 35.3 -7% |
| Idle Maximum * (dB) | 34 | 32.2 5% | 31 9% | 42 -24% | 30.3 11% | 35.5 -4% |
| Load Average * (dB) | 37.2 | 47.1 -27% | 46.2 -24% | 49 -32% | 35.1 6% | 40.4 -9% |
| Witcher 3 ultra * (dB) | 46.1 | 52 -13% | ||||
| Load Maximum * (dB) | 47.1 | 47.1 -0% | 52.3 -11% | 50 -6% | 46 2% | 47.2 -0% |
* ... smaller is better
Temperature
Surface temperatures are rather warm at almost 30 C even when idling on desktop and on the Power Saver mode. Running Witcher 3 for one hour will result in a warm keyboard and an even warmer underside as shown by our temperature maps below. While the palm rests and WASD keys remain relatively cool, we wouldn't recommend using the notebook on one's lap if running demanding applications. Similar hot spots can be observed on the Razer Blade and the XPS 15 9560, both of which are also very thin notebooks with dedicated Pascal GPUs.
Heat it expelled through the ventilation grilles on the left and right edges of the notebook. Thus, expect warm hands when gaming with an external mouse.
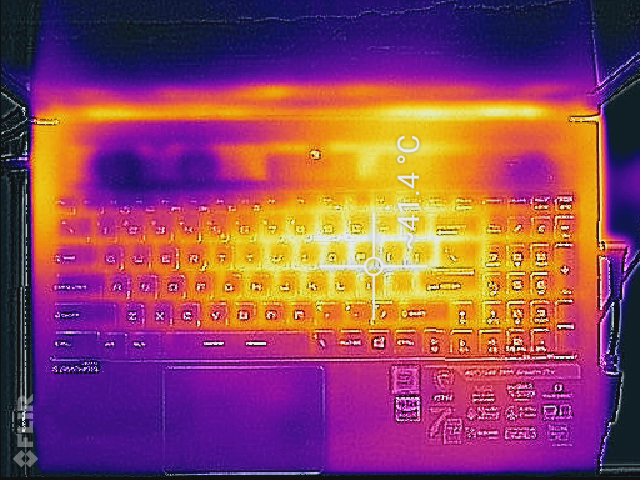
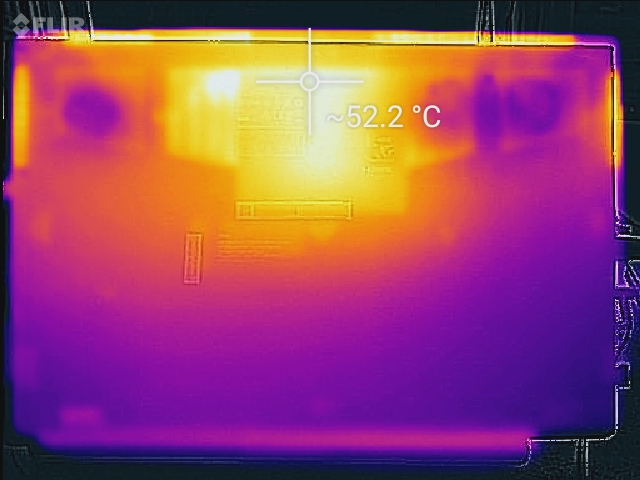
(±) Playing The Witcher 3, the average temperature for the upper side is 35.1 °C / 95 F, compared to the device average of 33.9 °C / 93 F.
(+) The palmrests and touchpad are reaching skin temperature as a maximum (32.4 °C / 90.3 F) and are therefore not hot.
(-) The average temperature of the palmrest area of similar devices was 28.8 °C / 83.8 F (-3.6 °C / -6.5 F).
Speakers
Sound quality is average due to poor bass. We set Bass Boost to its maximum through the included Nahimic software and music playback is still lacking in oomph. Larger gaming notebooks like the GT73VR or even multimedia notebooks like the Asus N55x series include dedicated subwoofers for a wider range of reproducible frequencies. Nonetheless, maximum volume is sufficiently loud with no static or major reverberations. Users with high-end headphones can take advantage of the gold-plated Hi-Fi audio jack and dedicated Sabre DAC for a better sound experience.
")


MSI GS63VR 7RF-228US audio analysis
(±) | speaker loudness is average but good (75 dB)
Bass 100 - 315 Hz
(-) | nearly no bass - on average 25.3% lower than median
(±) | linearity of bass is average (12.4% delta to prev. frequency)
Mids 400 - 2000 Hz
(+) | balanced mids - only 3.3% away from median
(±) | linearity of mids is average (7% delta to prev. frequency)
Highs 2 - 16 kHz
(±) | higher highs - on average 8.1% higher than median
(±) | linearity of highs is average (8.6% delta to prev. frequency)
Overall 100 - 16.000 Hz
(±) | linearity of overall sound is average (28.4% difference to median)
Compared to same class
» 94% of all tested devices in this class were better, 1% similar, 5% worse
» The best had a delta of 6%, average was 18%, worst was 132%
Compared to all devices tested
» 86% of all tested devices were better, 3% similar, 12% worse
» The best had a delta of 4%, average was 24%, worst was 134%
Apple MacBook 12 (Early 2016) 1.1 GHz audio analysis
(+) | speakers can play relatively loud (83.6 dB)
Bass 100 - 315 Hz
(±) | reduced bass - on average 11.3% lower than median
(±) | linearity of bass is average (14.2% delta to prev. frequency)
Mids 400 - 2000 Hz
(+) | balanced mids - only 2.4% away from median
(+) | mids are linear (5.5% delta to prev. frequency)
Highs 2 - 16 kHz
(+) | balanced highs - only 2% away from median
(+) | highs are linear (4.5% delta to prev. frequency)
Overall 100 - 16.000 Hz
(+) | overall sound is linear (10.2% difference to median)
Compared to same class
» 7% of all tested devices in this class were better, 2% similar, 91% worse
» The best had a delta of 5%, average was 18%, worst was 53%
Compared to all devices tested
» 5% of all tested devices were better, 1% similar, 94% worse
» The best had a delta of 4%, average was 24%, worst was 134%
Frequency Comparison (Checkbox selectable!)
Graph 1: Pink Noise 100% Vol.; Graph 2: Audio off
Energy Management
Power Consumption
Idling on desktop will draw about 14 W to 17 W compared to 19 W to 29 W on the Alienware 15. Running 3DMark 06 and 3DMark 11 will demand about 93 W and 110 W, respectively, which is higher than many competitors with the same GTX 1060 GPU. Running Witcher 3 will demand even more out of the system at a recorded 128.8 W.
We are unable to reliably provide power consumption measurements when running both Prime95 and FurMark simultaneously due to the aforementioned crashing issues. Based on our our previous GS63VR test unit, however, we can expect the system to draw about 165 W from the small (~15.5 x 7.5 x 3 cm) 180 W AC adapter.
| Off / Standby | |
| Idle | |
| Load |
|
Key:
min: | |
| MSI GS63VR 7RF-228US i7-7700HQ, GeForce GTX 1060 Mobile, Samsung SM961 MZVKW512HMJP m.2 PCI-e, IPS, 3840x2160, 15.6" | Dell XPS 15 9560 (i7-7700HQ, UHD) i7-7700HQ, GeForce GTX 1050 Mobile, Lite-On CX2-8B512-Q11, IGZO IPS, 3840x2160, 15.6" | Asus FX502VM-AS73 i7-7700HQ, GeForce GTX 1060 Mobile, SK Hynix HFS256G39TND-N210A, TN LED, 1920x1080, 15.6" | Alienware 15 R3 i7-7700HQ, GeForce GTX 1070 Mobile, , TN, 1920x1080, 15.6" | Gigabyte P55W v7 i7-7700HQ, GeForce GTX 1060 Mobile, Liteonit CV3-8D256, IPS, 1920x1080, 15.6" | MSI GS63VR-6RF16H22 Stealth Pro 6700HQ, GeForce GTX 1060 Mobile, Samsung SM951 MZVPV256HDGL m.2 PCI-e, IPS, 1920x1080, 15.6" | |
|---|---|---|---|---|---|---|
| Power Consumption | 7% | 2% | -31% | 21% | -27% | |
| Idle Minimum * (Watt) | 14.5 | 11.9 18% | 14.9 -3% | 19 -31% | 8 45% | 18 -24% |
| Idle Average * (Watt) | 17.3 | 17.1 1% | 15.1 13% | 23 -33% | 13 25% | 22 -27% |
| Idle Maximum * (Watt) | 17.4 | 17.3 1% | 15.2 13% | 29 -67% | 18 -3% | 30 -72% |
| Load Average * (Watt) | 93 | 94.7 -2% | 105.8 -14% | 85 9% | 76 18% | 77 17% |
| Witcher 3 ultra * (Watt) | 128.8 | 104.8 19% | ||||
| Load Maximum * (Watt) | 122 | 148.8 | 192 | 143 | 165 |
* ... smaller is better
Battery Life
The internal battery is average in capacity at 65 Wh compared to 97 Wh and 99 Wh in in the XPS 15 9560 and Alienware 15 R3, respectively. It is, however, an upgrade from the 47 Wh battery in the older GS60. Runtimes are average at just under 4 hours of real-world WLAN use. At best, users can expect 6.5 hours of runtime when idling on Power Saver mode and on the lowest brightness setting.
Charging from near empty to full capacity will take about 2 to 2.5 hours.
| MSI GS63VR 7RF-228US i7-7700HQ, GeForce GTX 1060 Mobile, 65 Wh | Dell XPS 15 9560 (i7-7700HQ, UHD) i7-7700HQ, GeForce GTX 1050 Mobile, 97 Wh | Asus FX502VM-AS73 i7-7700HQ, GeForce GTX 1060 Mobile, 64 Wh | Alienware 15 R3 i7-7700HQ, GeForce GTX 1070 Mobile, 99 Wh | Apple MacBook Pro 15 2016 (2.9 GHz, 460) 6920HQ, Radeon Pro 460, 76 Wh | |
|---|---|---|---|---|---|
| Battery runtime | 78% | -1% | 15% | 67% | |
| Reader / Idle (h) | 6.4 | 13.9 117% | 6.1 -5% | 6.4 0% | |
| WiFi v1.3 (h) | 3.9 | 7.2 85% | 4.6 18% | 4.4 13% | 10.3 164% |
| Load (h) | 1.3 | 1.7 31% | 1.1 -15% | 1.7 31% | 0.9 -31% |
Pros
Cons
Verdict

The original GS60 was ahead of its time. The super-thin chassis design and 4K UHD options paired very poorly with Broadwell and Maxwell processors even if said chassis was visually appealing. Fortunately, Intel and Nvidia hardware are finally catching up to MSI's original vision of providing enthusiast-level gaming performance in a super-thin MacBook Pro-size notebook. Kaby Lake and Pascal perform admirably with no major throttling issues during our time with the unit. Combine this with the surprising portability of the system and you have a notebook that is seemingly perfect for both schoolwork and serious play.
Drawbacks are noticeable and varied. Yes, the GS63VR can replace and outperform the XPS 15, MacBook Pro 15, and even that large ROG G752 laying around, but expect a more flexible chassis with higher-pitched fan noise during use. Battery life, sound quality, and backlight brightness could have been better and a true "silent mode" for low-power word processing use would have been a neat addition. Furthermore, diving deeper into its performance will show that the CPU is unable to maintain maximum Turbo Boost clock rates and that core GPU temperature will be warmer than on larger gaming notebooks.
The base 1080p SKU is an easier recommendation over the 4K UHD option. Unless if gaming at native 4K UHD on low-medium settings with no G-Sync sounds appealing, the GTX 1060 still pairs best with a 1080p display. Furthermore, the 1080p panel offers higher contrast and wider colors than the 4K UHD panel for a cheaper price, so 4K UHD users are essentially giving up display quality for those denser pixels.
The GS63VR runs a bit quieter than the GS60 while offering massive boosts in performance. Though its gaming prowess shouldn't be underestimated, its display, battery life, and chassis rigidity haven't improved as much as the hardware inside.
MSI GS63VR 7RF-228US
- 03/24/2017 v6 (old)
Allen Ngo
Price comparison
