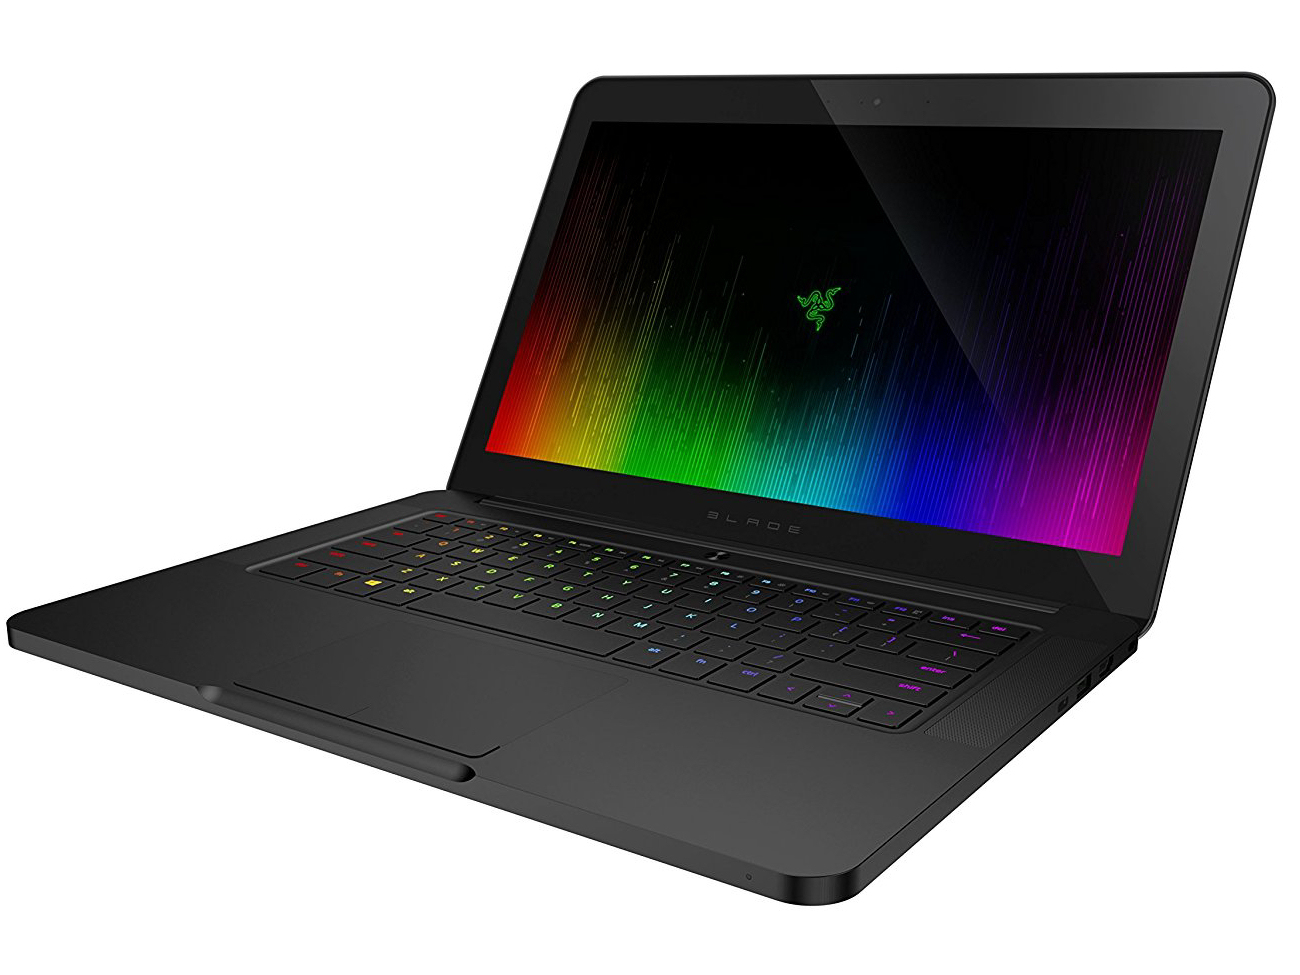
Razer Blade (2016) FHD Notebook Review

For the original German review, see here.
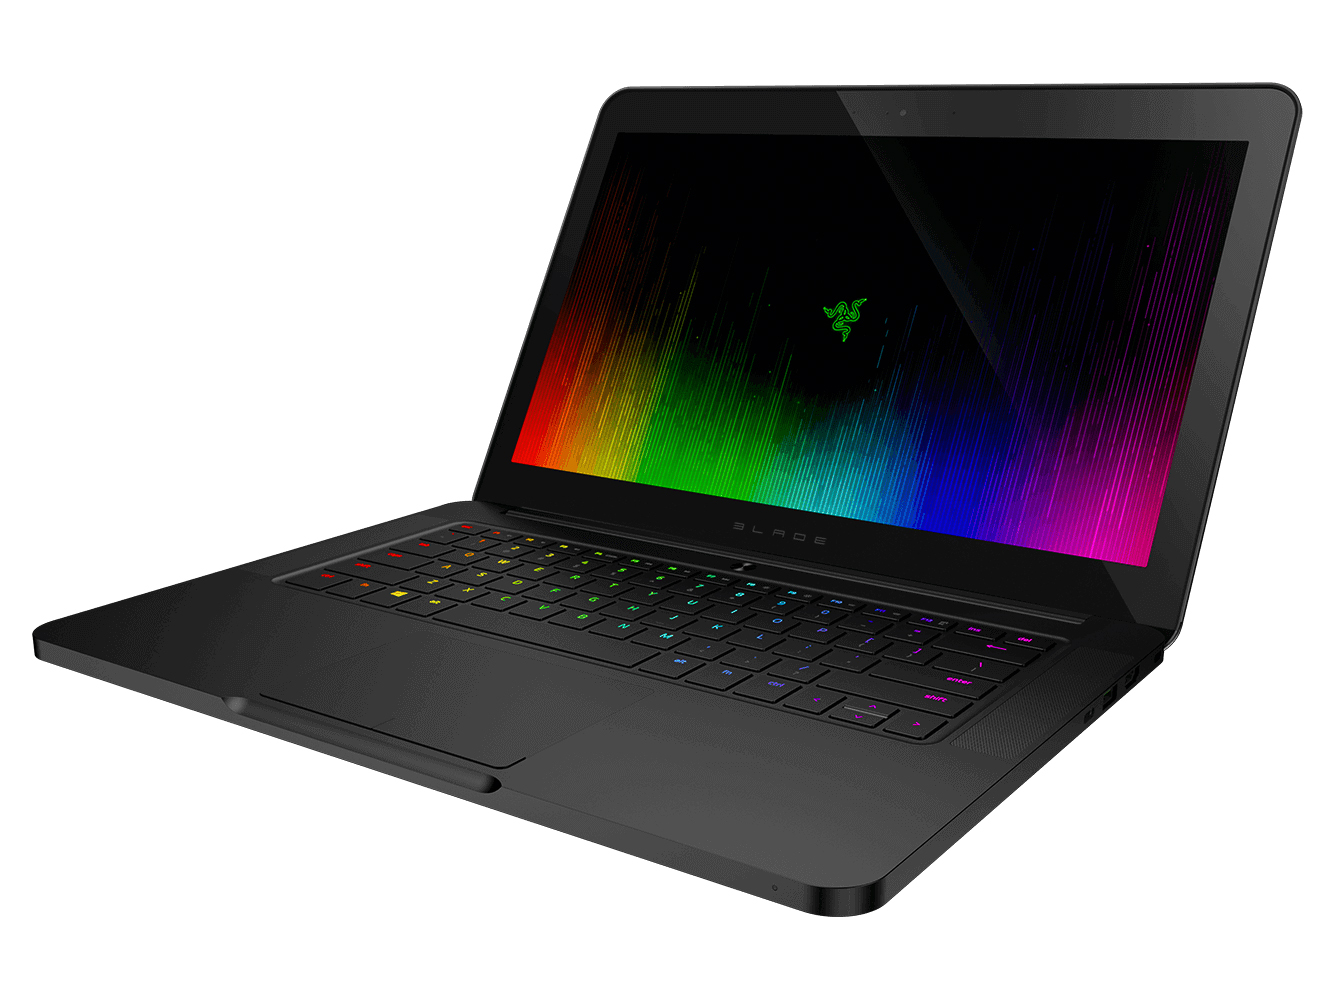
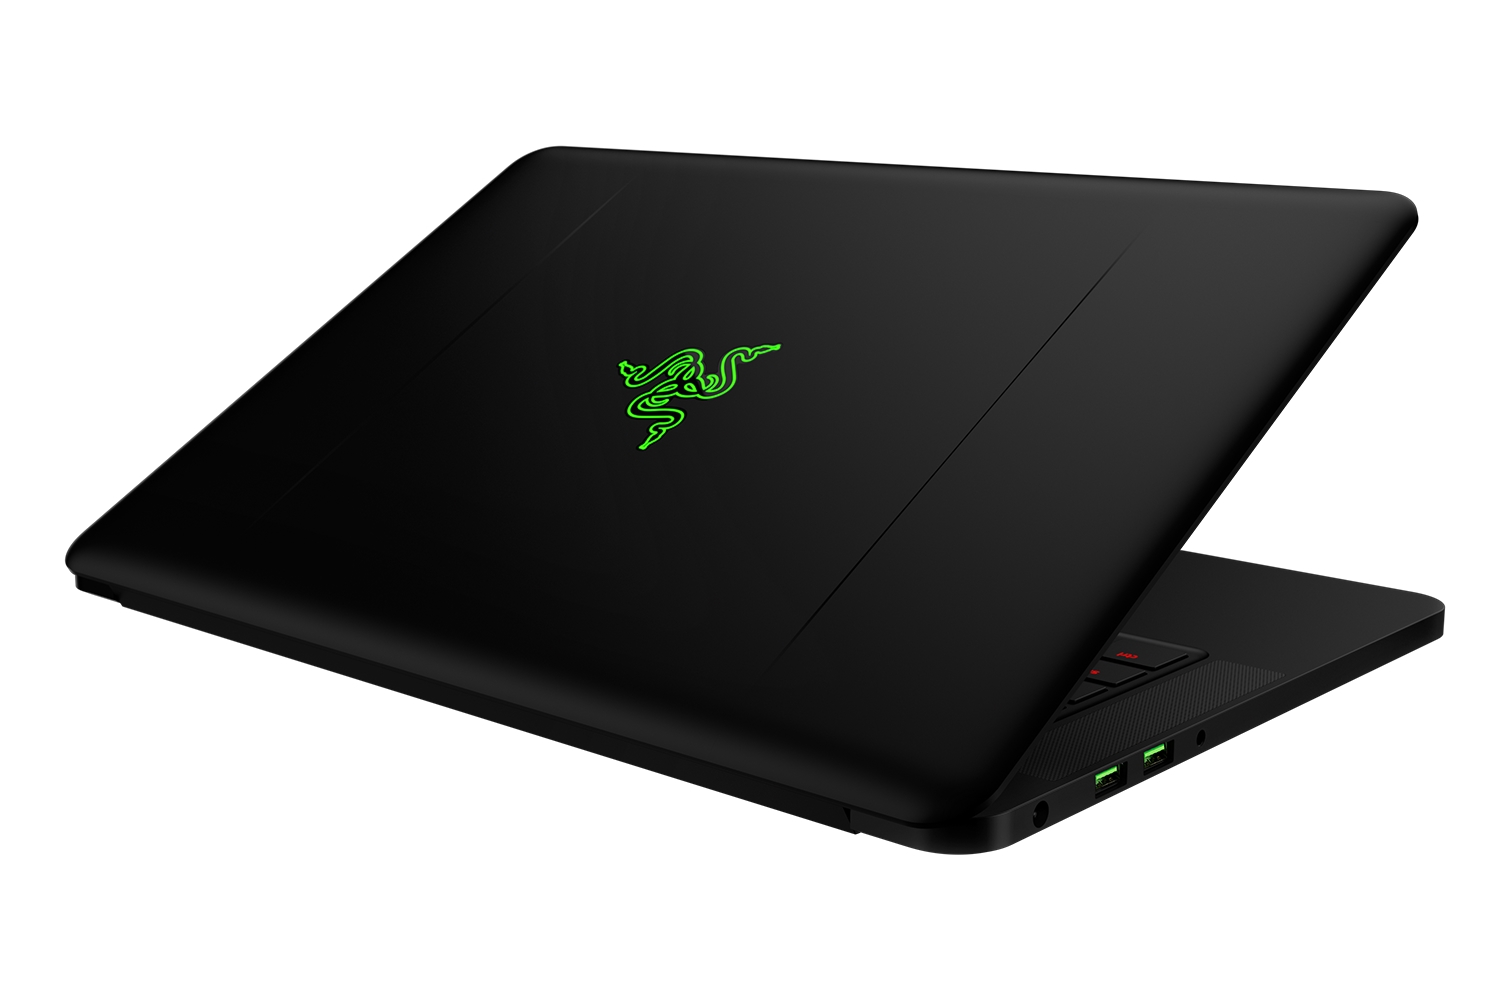
Having already reviewed the QHD+ model of the Blade a few weeks ago, we now have a look at the Full HD model. The QHD+ panel is a touchscreen with a glossy surface, while the FHD display of our current test model has a matte surface without touch functionality. The list of rivals includes systems like the Schenker XMG P406, MSI GS43VR, and Asus Strix GL502VM.
Both systems share the same construction, so we will not cover the sections Case, Connectivity, Input Devices and Speakers in this article. The corresponding information is available in the review of the QHD+ model.
Note: Our current model was immediately updated to EC version 4.0, so there is no CPU throttling in normal 3D workloads. The system noise is higher in return, so the measurements of the two reviews cannot really be compared.
| Networking | |
| iperf3 transmit AX12 | |
| Razer Blade (2016) | |
| Razer Blade (2016) FHD | |
| Asus Strix GL502VM-FY039T | |
| iperf3 receive AX12 | |
| Asus Strix GL502VM-FY039T | |
| Razer Blade (2016) | |
| Razer Blade (2016) FHD | |
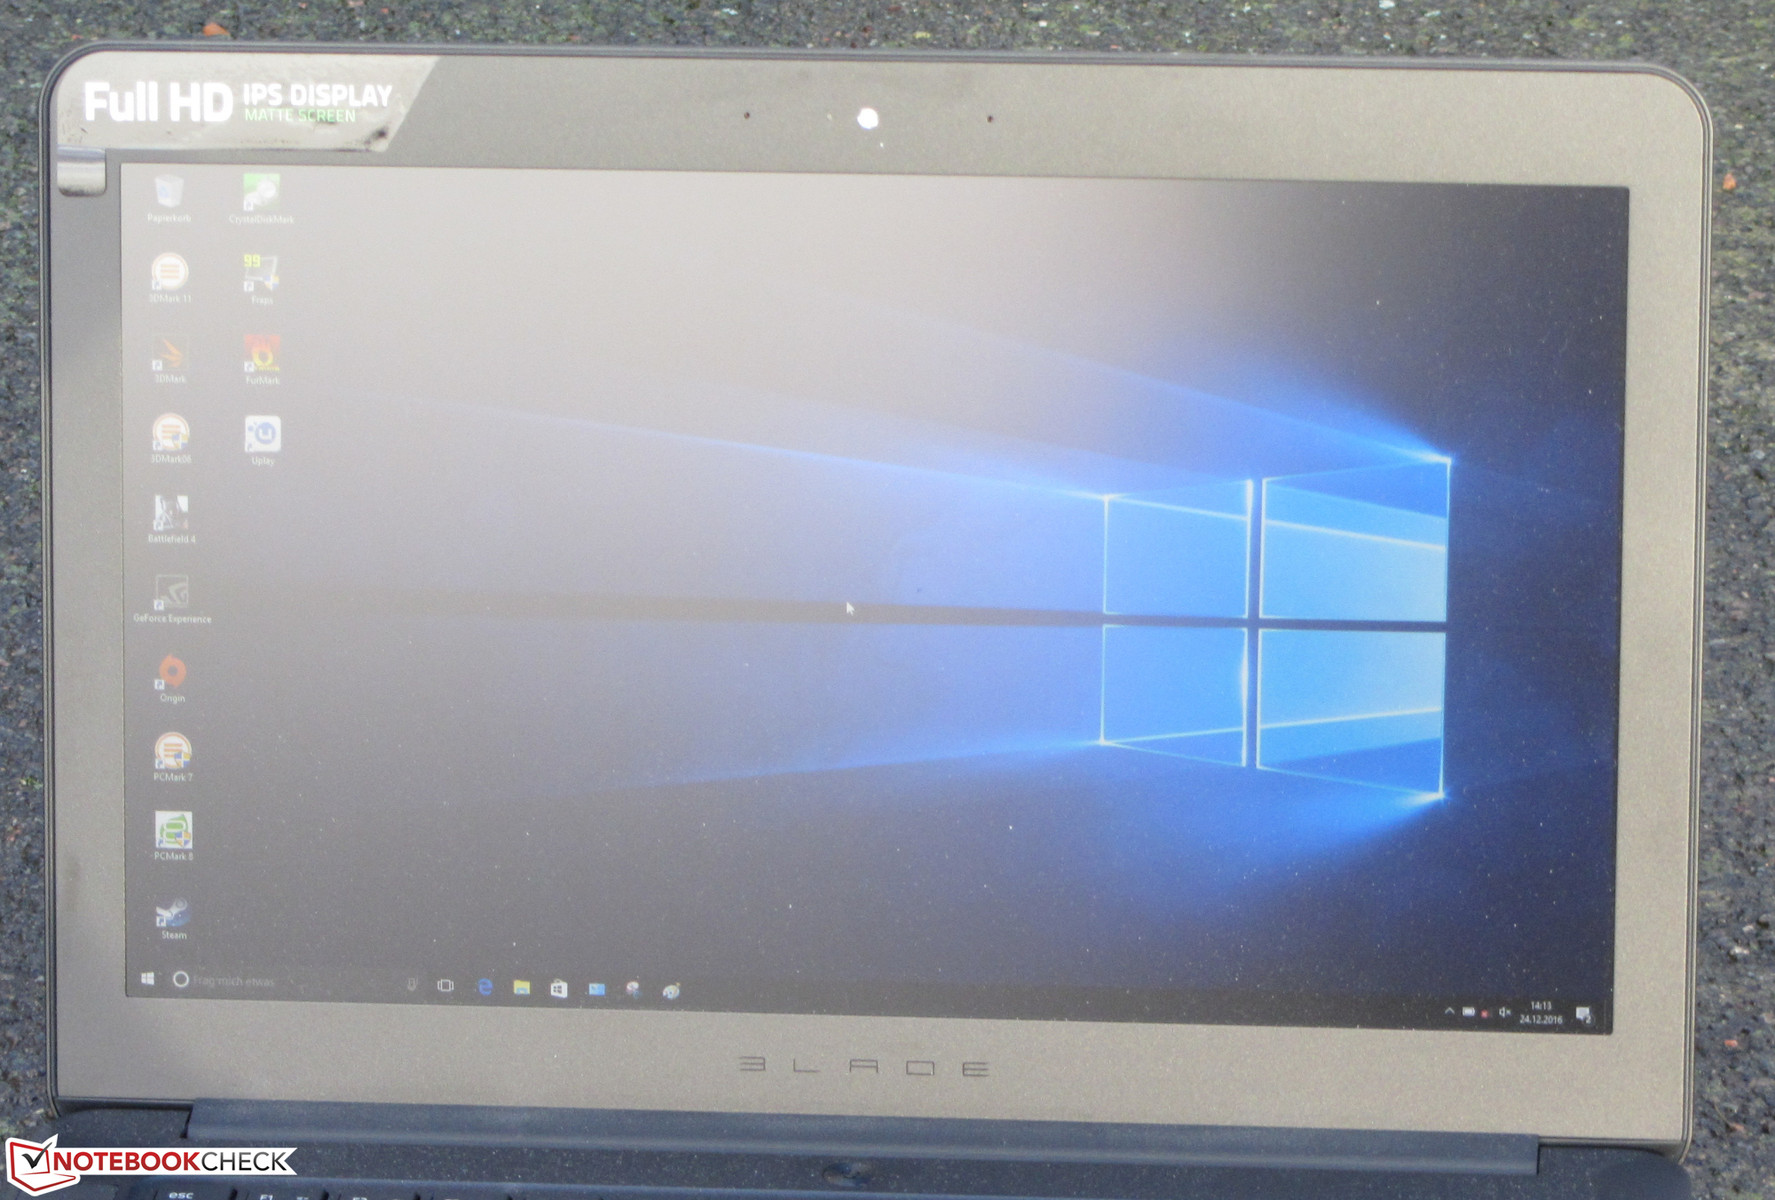
Display
The matte Full HD screen has a native resolution of 1920x1080 pixels. Luminance (277 nits) and contrast (1046:1) are generally lower compared to the optional QHD+ display. We would have expected more, especially when you consider the hefty price of 2,700 Euros (~$2825). One positive aspect compared to the QHD+ screen is the lack of PWM flickering.
| |||||||||||||||||||||||||
Brightness Distribution: 84 %
Center on Battery: 272 cd/m²
Contrast: 1046:1 (Black: 0.26 cd/m²)
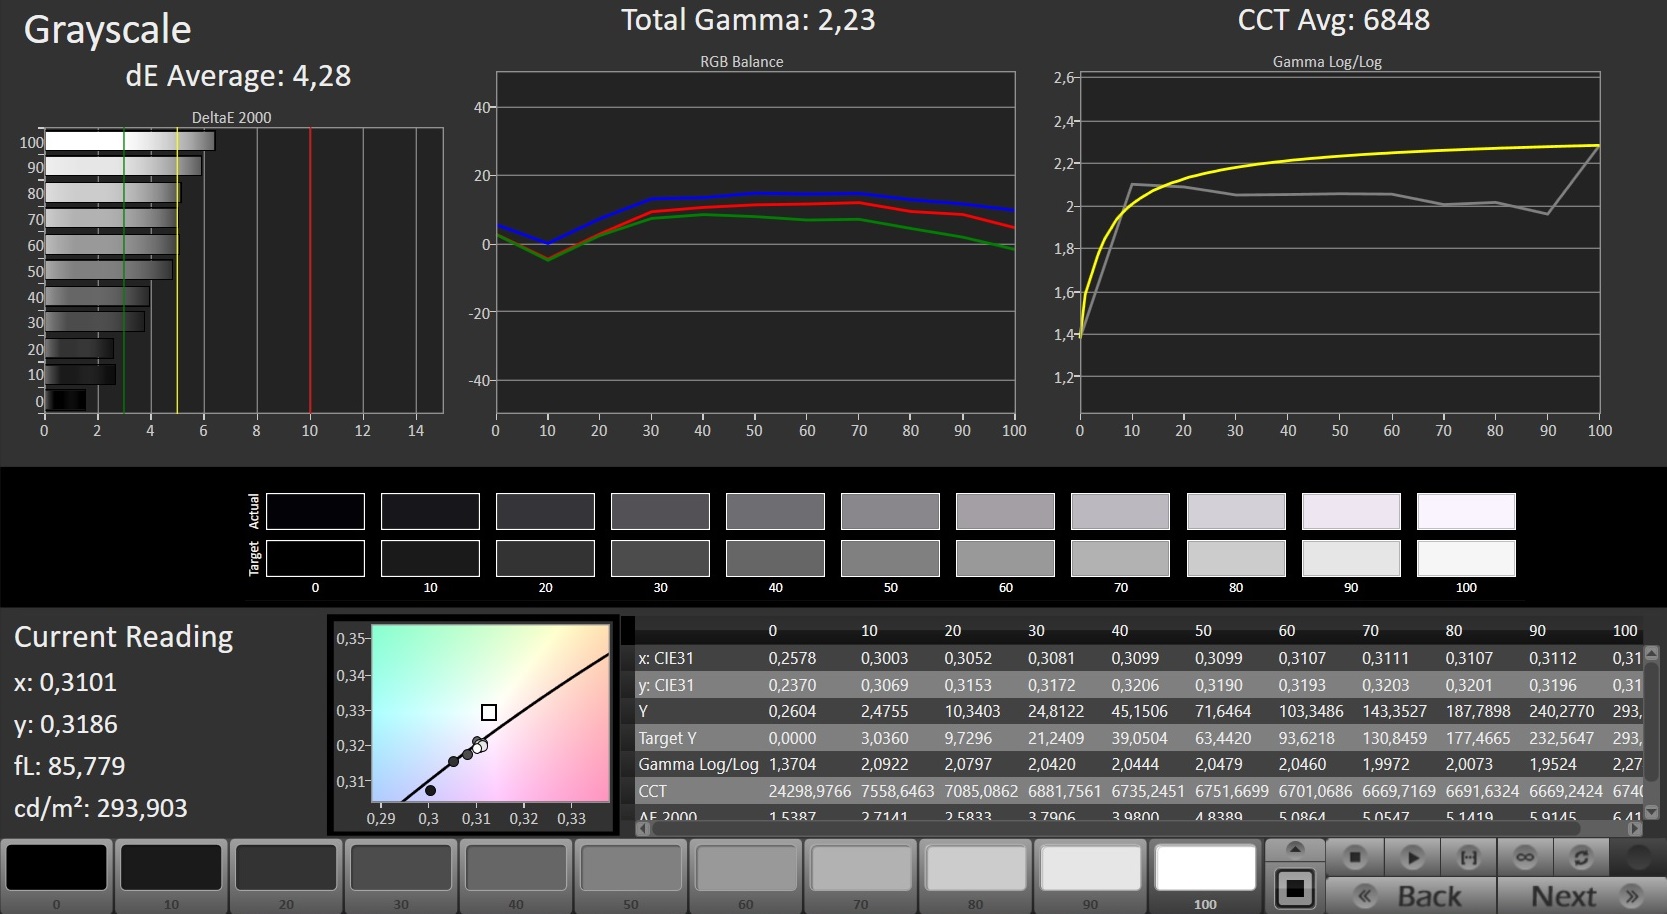
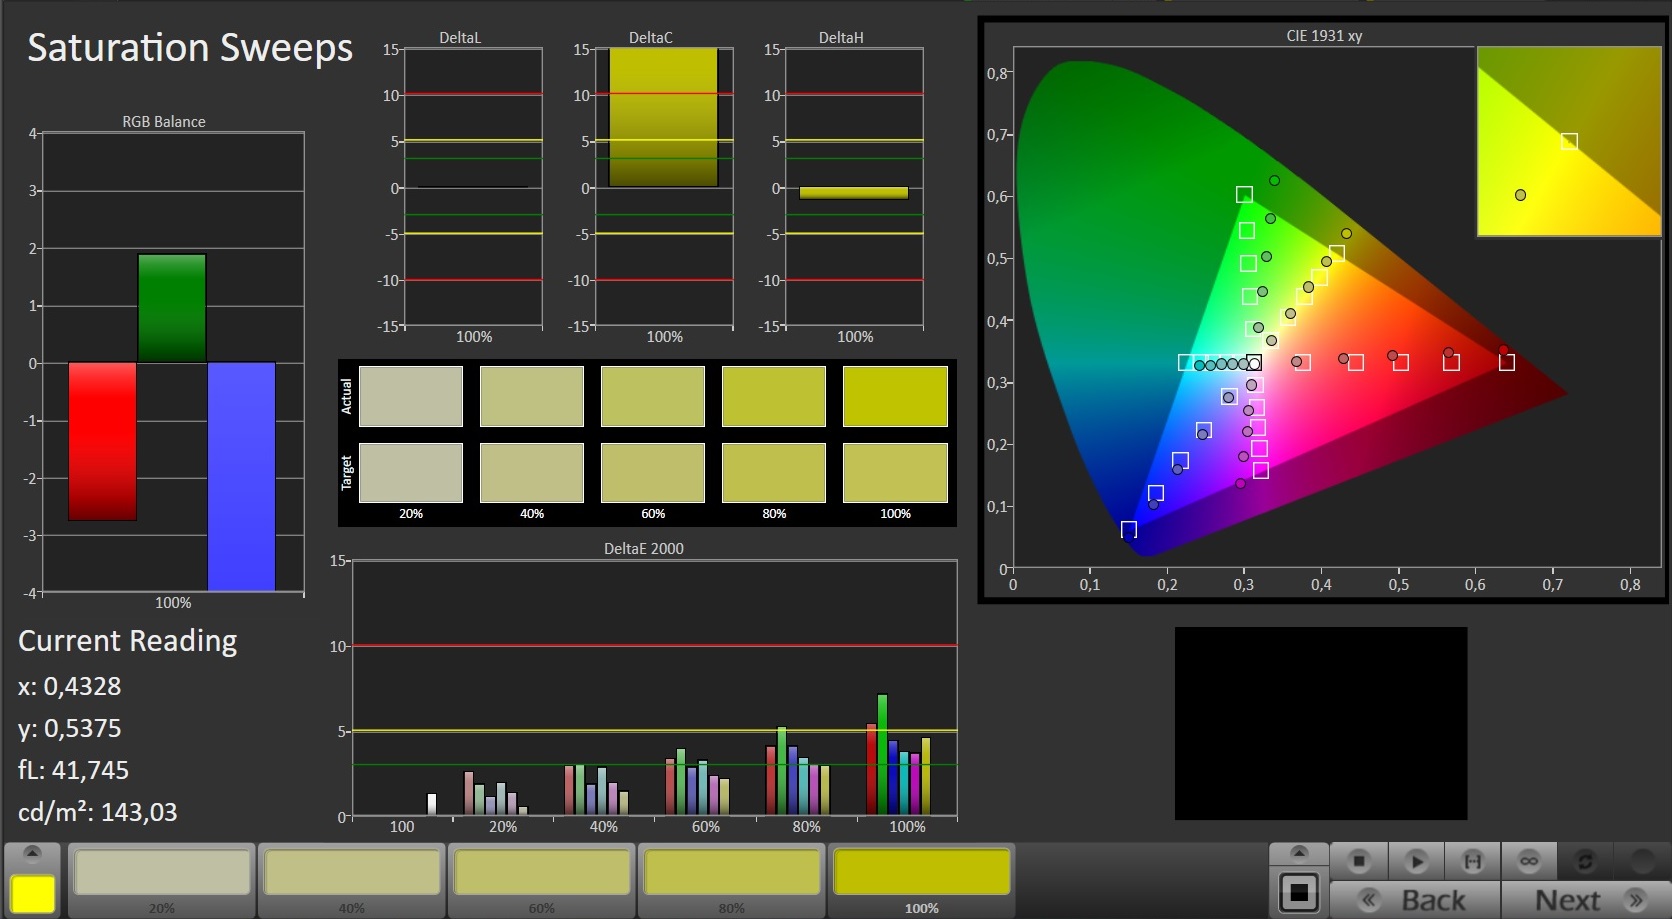
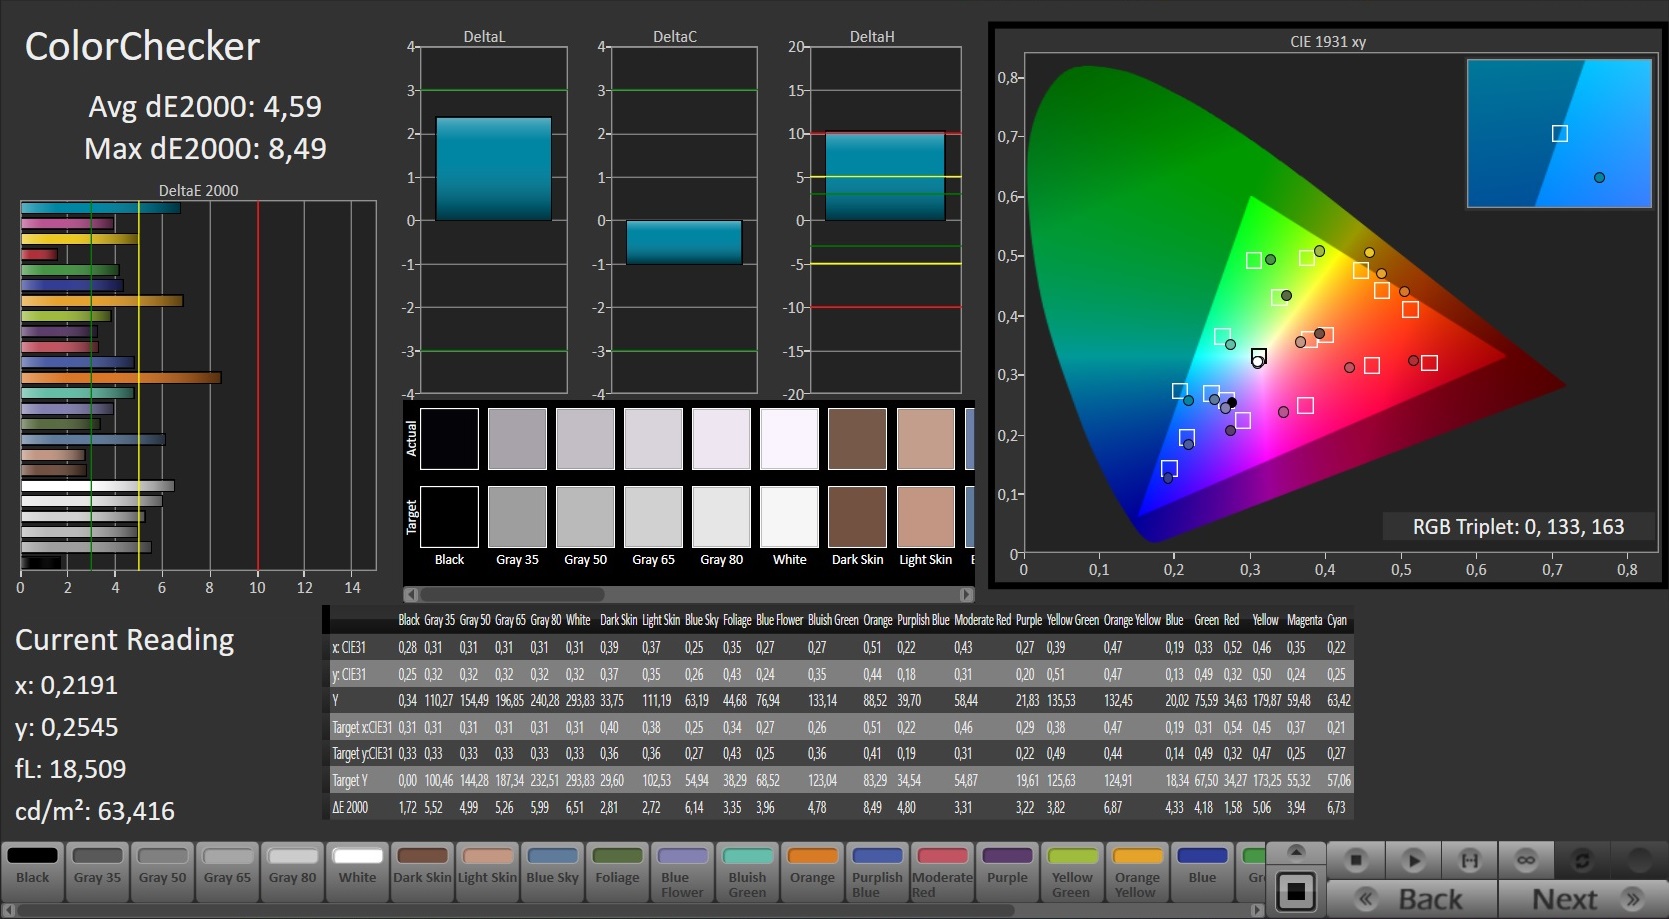
ΔE ColorChecker Calman: 4.59 | ∀{0.5-29.43 Ø4.73}
ΔE Greyscale Calman: 4.28 | ∀{0.09-98 Ø4.97}
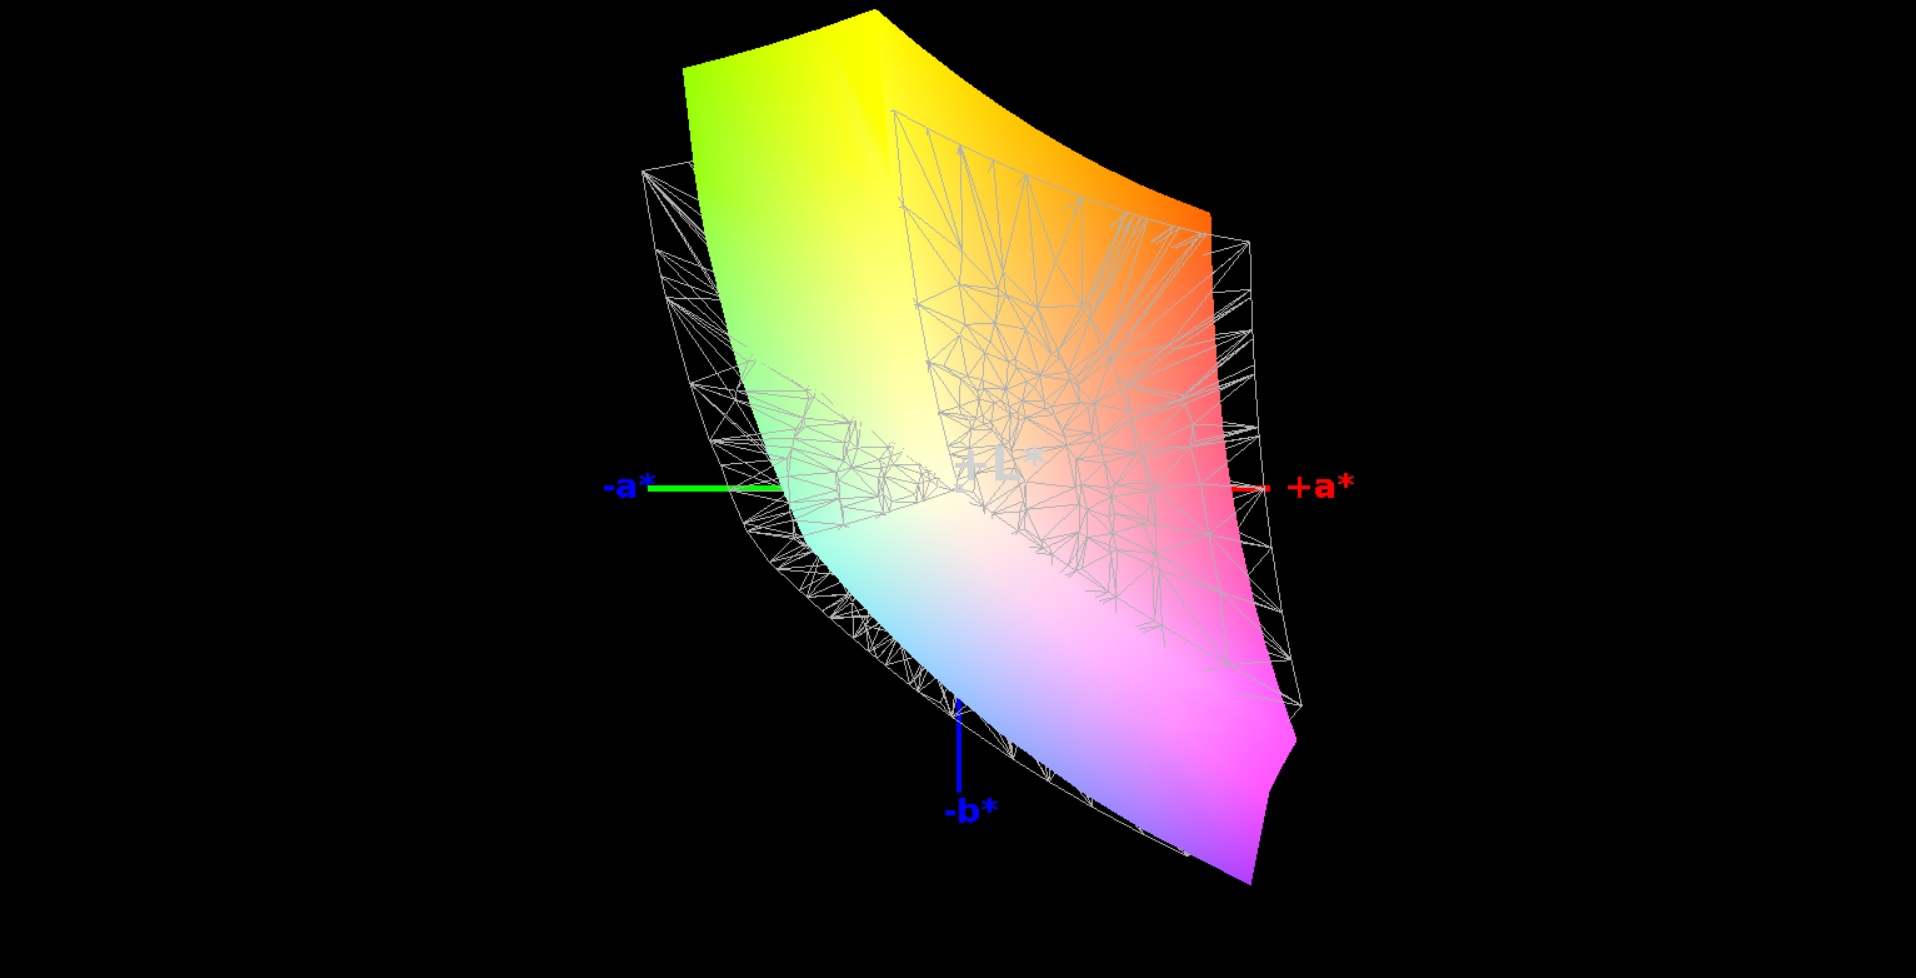
83% sRGB (Argyll 1.6.3 3D)
55% AdobeRGB 1998 (Argyll 1.6.3 3D)
60.9% AdobeRGB 1998 (Argyll 3D)
83.4% sRGB (Argyll 3D)
65.2% Display P3 (Argyll 3D)
Gamma: 2.23
CCT: 6848 K
| Razer Blade (2016) FHD LG Philips LP140WF3-SPD1 (LGD046D), 1920x1080 | Razer Blade (2016) Sharp LQ140Z1JW01 (SHP1401), 3200x1800 | MSI GS43VR 6RE-006US Name: LG Philips LP140WF3-SPD1, ID: LGD046D, 1920x1080 | Gigabyte P34W v5 2560x1440 | Schenker XMG P406 LG Philips 140WF1 (LGD040A), 1920x1080 | Asus Strix GL502VM-FY039T LG Philips LP156WF6-SPB6 (LGD046F), 1920x1080 | |
|---|---|---|---|---|---|---|
| Display | 10% | 3% | -14% | 0% | -0% | |
| Display P3 Coverage (%) | 65.2 | 66.9 3% | 65.5 0% | 51.4 -21% | 66.2 2% | 64.5 -1% |
| sRGB Coverage (%) | 83.4 | 96.8 16% | 86.4 4% | 76.6 -8% | 82.8 -1% | 83.4 0% |
| AdobeRGB 1998 Coverage (%) | 60.9 | 68.2 12% | 63.1 4% | 52.8 -13% | 60.5 -1% | 60.9 0% |
| Response Times | -15% | 20% | 7% | -17% | 10% | |
| Response Time Grey 50% / Grey 80% * (ms) | 47 ? | 41 ? 13% | 31.6 ? 33% | 41.2 ? 12% | 56 ? -19% | 40 ? 15% |
| Response Time Black / White * (ms) | 26 ? | 37 ? -42% | 24.4 ? 6% | 25.4 ? 2% | 30 ? -15% | 25 ? 4% |
| PWM Frequency (Hz) | 200 ? | |||||
| Screen | 29% | 9% | 3% | 1% | 1% | |
| Brightness middle (cd/m²) | 272 | 328 21% | 288.4 6% | 277.8 2% | 282 4% | 321 18% |
| Brightness (cd/m²) | 277 | 328 18% | 282 2% | 270 -3% | 266 -4% | 296 7% |
| Brightness Distribution (%) | 84 | 69 -18% | 83 -1% | 83 -1% | 81 -4% | 88 5% |
| Black Level * (cd/m²) | 0.26 | 0.22 15% | 0.35 -35% | 0.38 -46% | 0.22 15% | 0.33 -27% |
| Contrast (:1) | 1046 | 1491 43% | 824 -21% | 731 -30% | 1282 23% | 973 -7% |
| Colorchecker dE 2000 * | 4.59 | 1.91 58% | 2.61 43% | 2.71 41% | 4.98 -8% | 4.42 4% |
| Colorchecker dE 2000 max. * | 8.49 | 3.23 62% | 7.34 14% | 5.47 36% | 10.2 -20% | 9.78 -15% |
| Greyscale dE 2000 * | 4.28 | 1.69 61% | 1.18 72% | 2.11 51% | 4.08 5% | 3.34 22% |
| Gamma | 2.23 99% | 2.3 96% | 2.24 98% | 2.19 100% | 2.51 88% | 2.4 92% |
| CCT | 6848 95% | 6418 101% | 6506 100% | 6314 103% | 5877 111% | 6213 105% |
| Color Space (Percent of AdobeRGB 1998) (%) | 55 | 63 15% | 56.4 3% | 48.5 -12% | 54 -2% | 55 0% |
| Color Space (Percent of sRGB) (%) | 83 | 97 17% | 86.4 4% | 76.9 -7% | 83 0% | 83 0% |
| Total Average (Program / Settings) | 8% /
20% | 11% /
9% | -1% /
0% | -5% /
-2% | 4% /
2% |
* ... smaller is better
Screen Flickering / PWM (Pulse-Width Modulation)
| Screen flickering / PWM not detected |  | ||
In comparison: 52 % of all tested devices do not use PWM to dim the display. If PWM was detected, an average of 7798 (minimum: 5 - maximum: 343500) Hz was measured. | |||
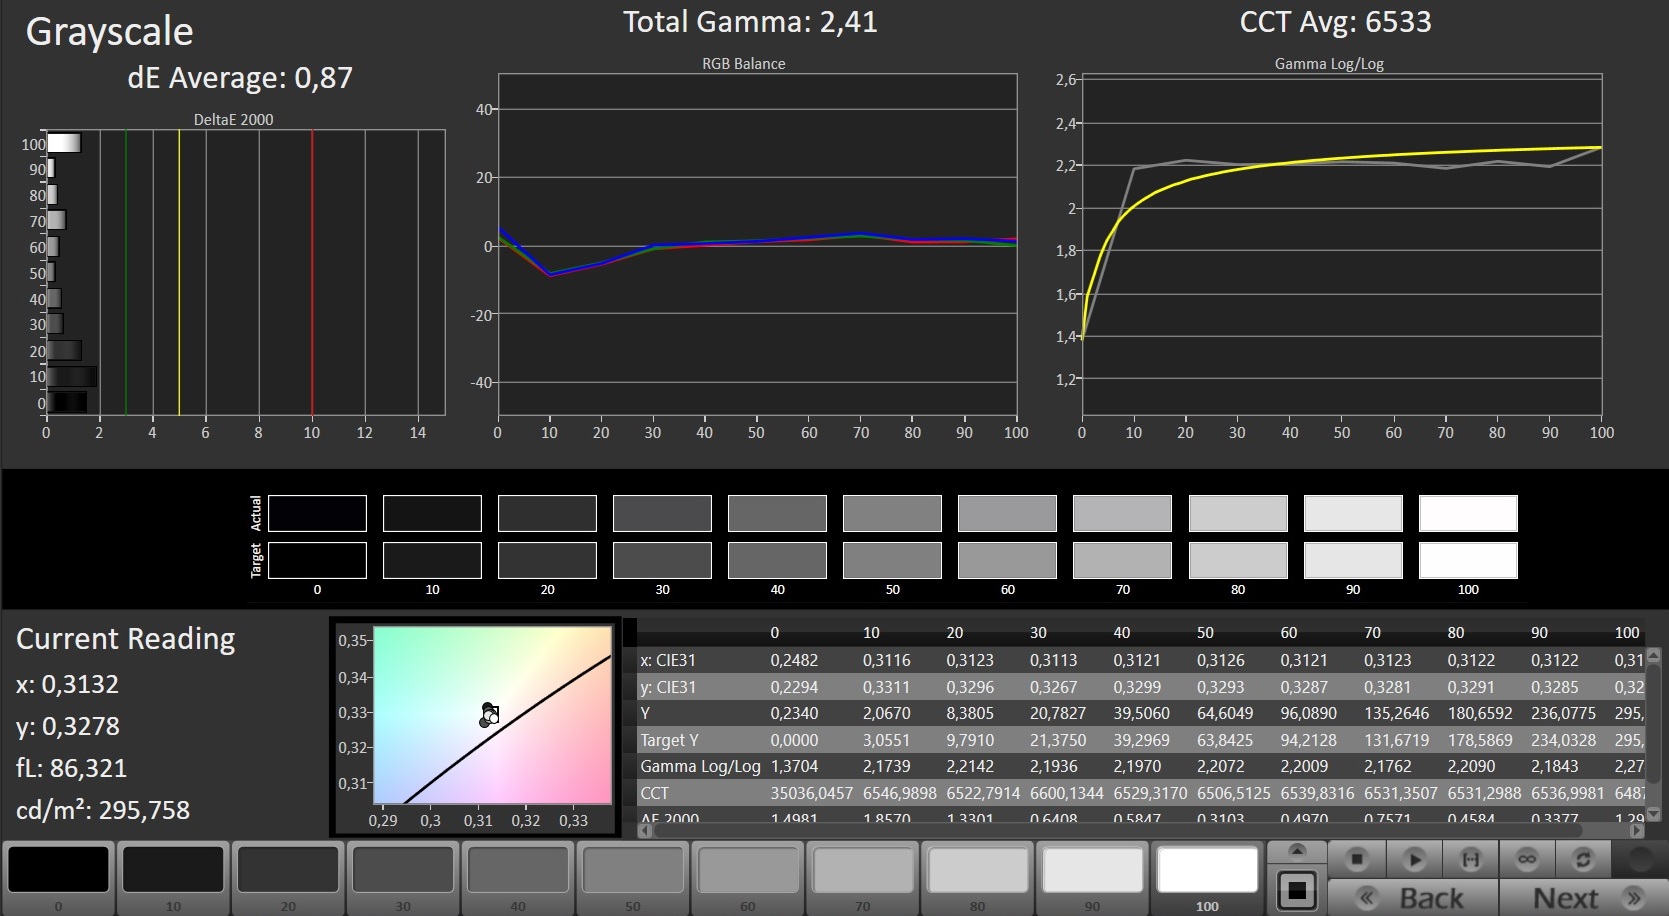
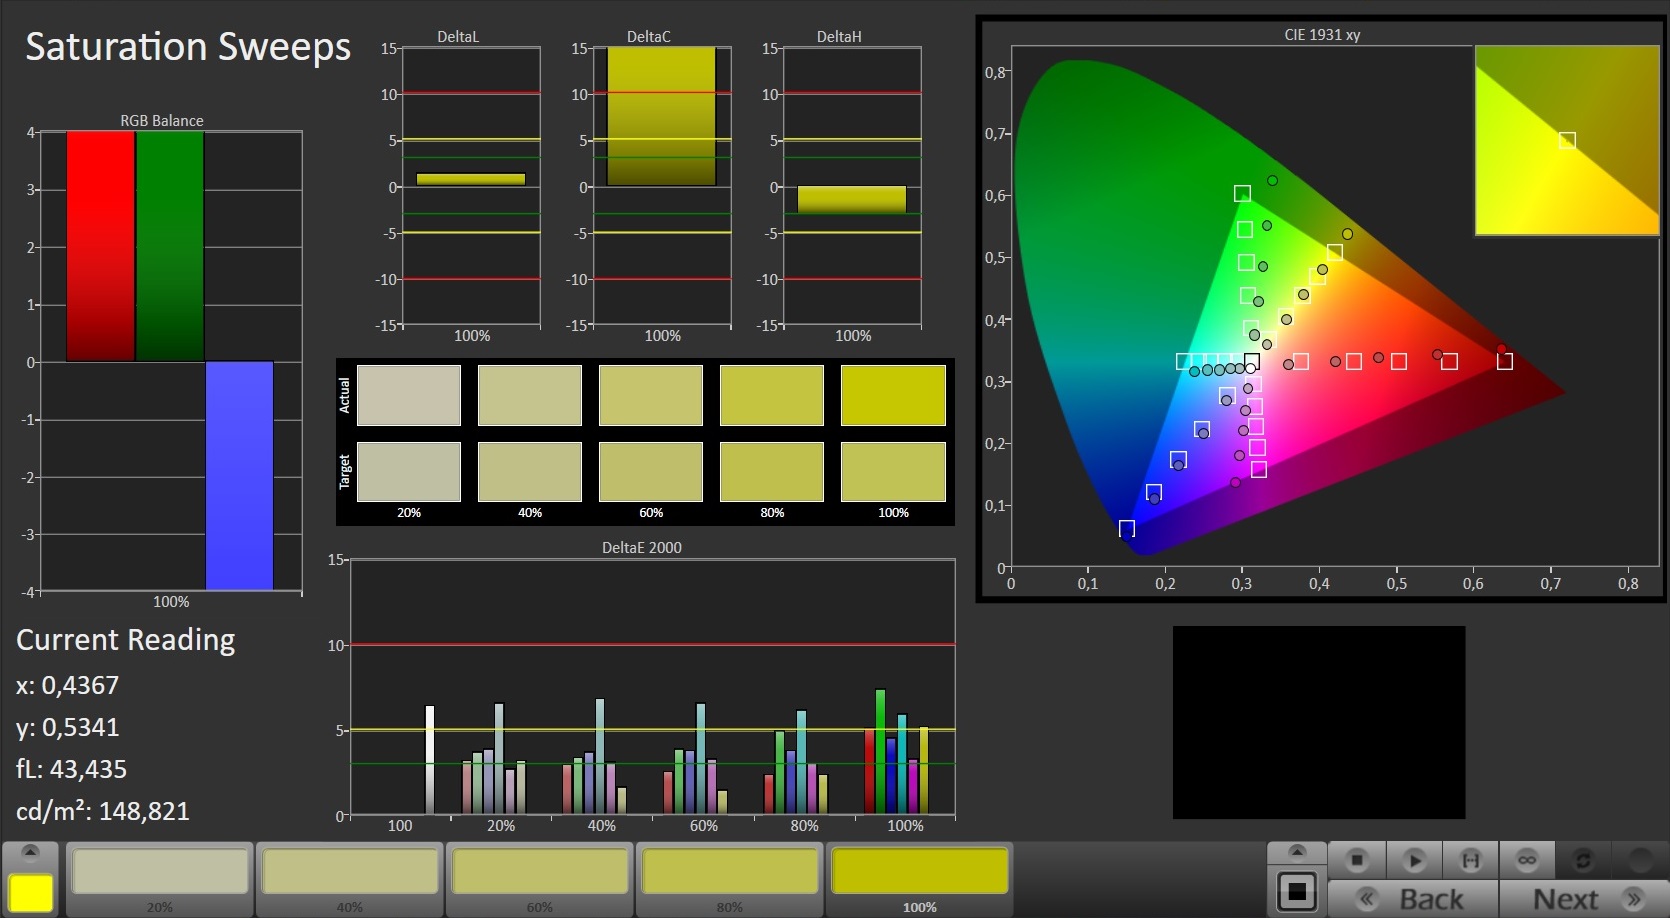
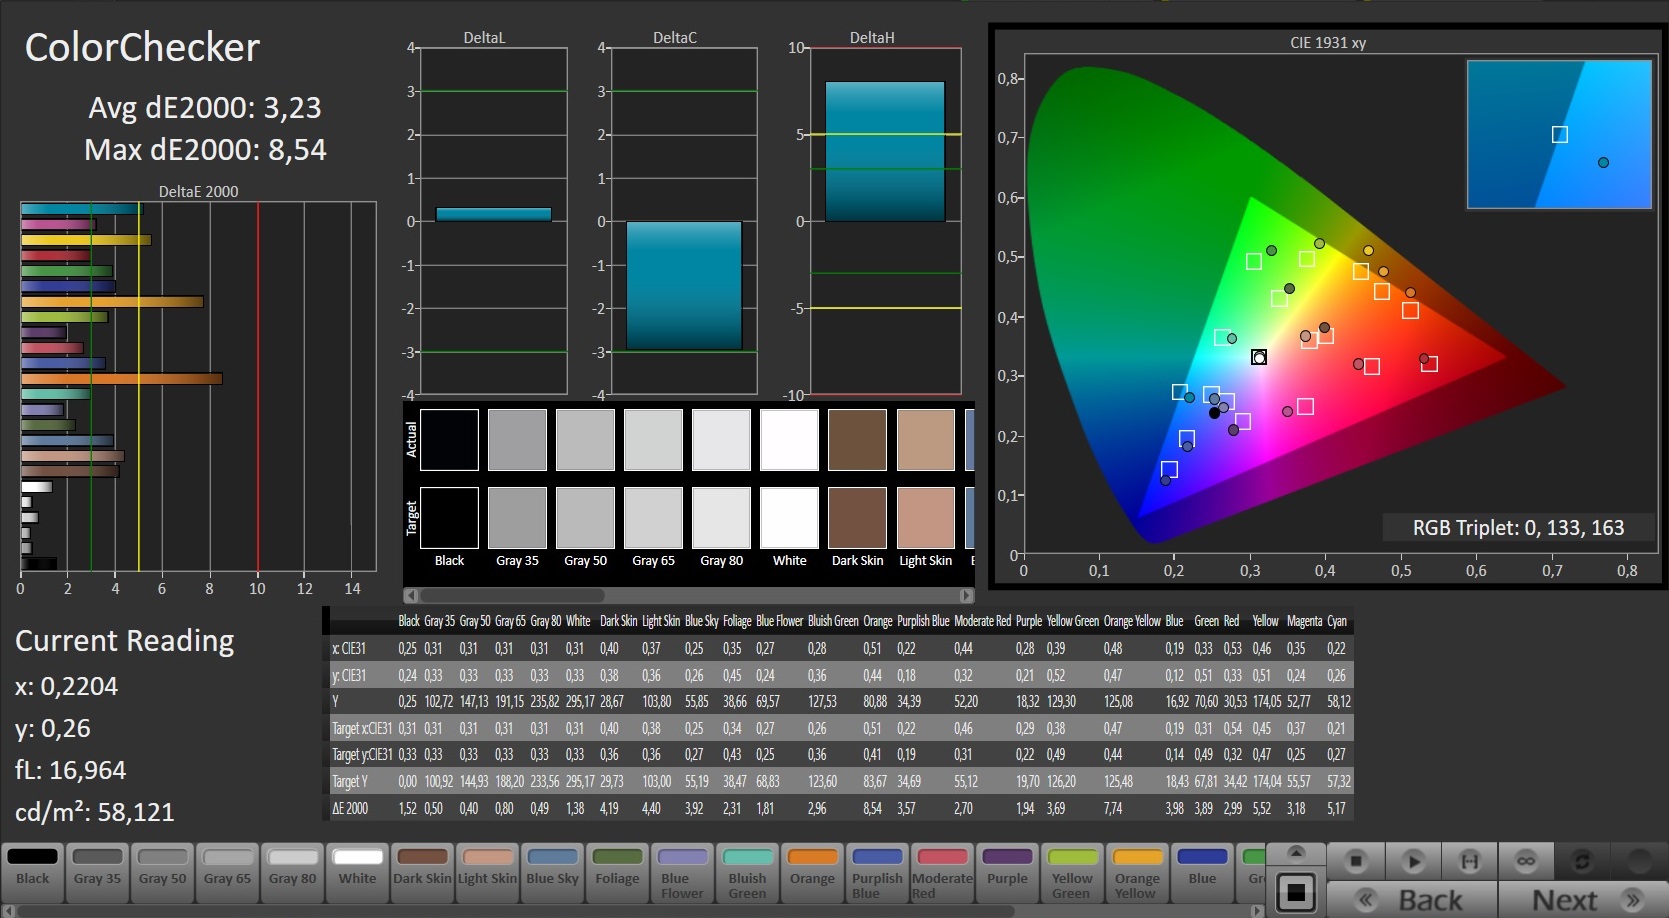
The color accuracy is actually not bad ex-works. We can measure a DeltaE-2000 deviation of 4.59, while the target value would be smaller than 3. The display does not suffer from a blue cast, either. It is possible to improve the performance with a calibration. The color deviation drops to 3.23 and the grayscale performance is much more balanced. The panel does not cover the reference color spaces AdobeRGB and sRGB; we can only determine 55% (AdobeRGB) and 83% (sRGB), respectively.

Display Response Times
| ↔ Response Time Black to White | ||
|---|---|---|
| 26 ms ... rise ↗ and fall ↘ combined | ↗ 6 ms rise | 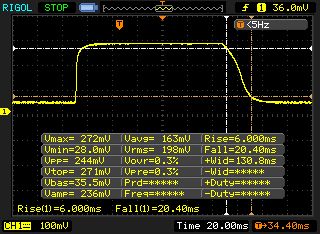 |
| ↘ 20 ms fall | ||
| The screen shows relatively slow response rates in our tests and may be too slow for gamers. In comparison, all tested devices range from 0.1 (minimum) to 240 (maximum) ms. » 62 % of all devices are better. This means that the measured response time is worse than the average of all tested devices (19.9 ms). | ||
| ↔ Response Time 50% Grey to 80% Grey | ||
| 47 ms ... rise ↗ and fall ↘ combined | ↗ 14 ms rise | 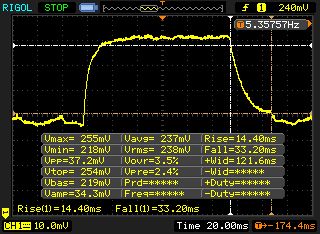 |
| ↘ 33 ms fall | ||
| The screen shows slow response rates in our tests and will be unsatisfactory for gamers. In comparison, all tested devices range from 0.165 (minimum) to 636 (maximum) ms. » 81 % of all devices are better. This means that the measured response time is worse than the average of all tested devices (31.1 ms). | ||
Razer equips the Blade with an IPS panel, which provides wide viewing angles. This means you can see the display content from every position. It is actually possible to use the system outdoors, but the sun should not be too bright.

Performance
The Blade is a 14-inch gaming notebook. The performance of the hardware is also sufficient for any applications beyond gaming. Our test model retails for about 2,700 Euros (~$2825). Razer offers a total of six SKUs, but the differences are limited to the display and the storage capacity of the SSD. The least expensive model is available for about 2,000 Euros (~$2093).


Processor
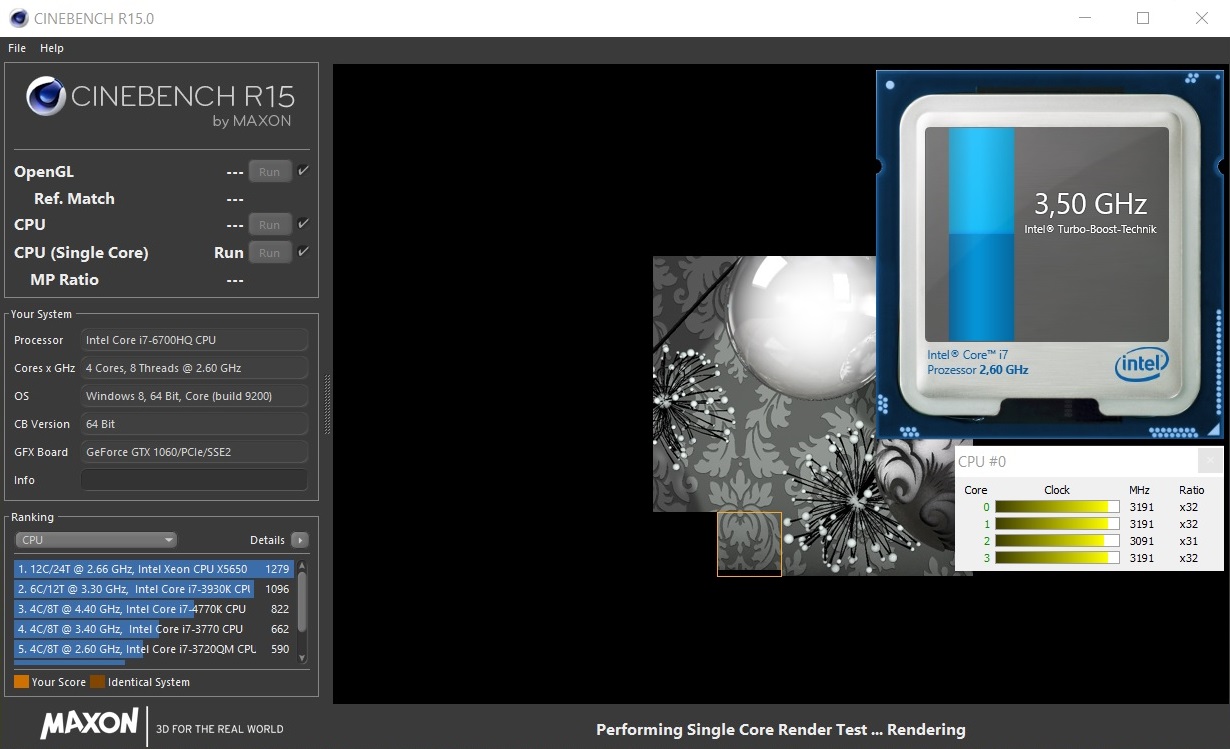
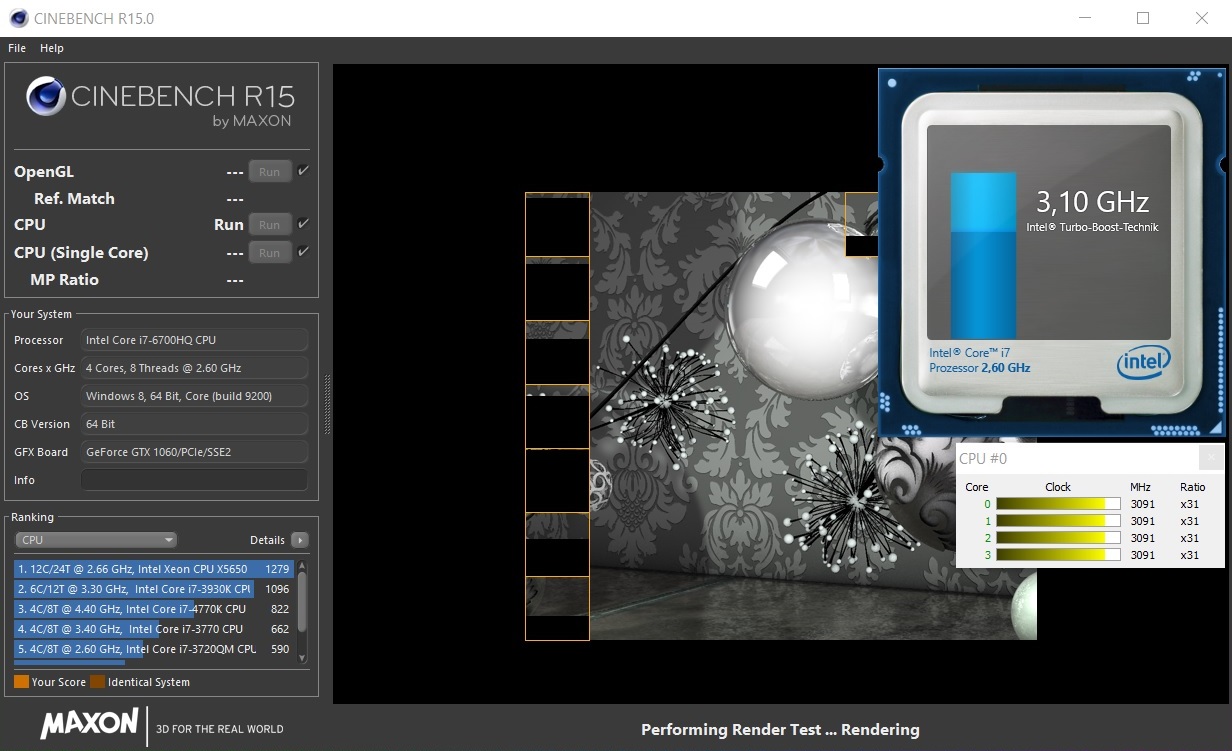
Similar to the previously reviewed QHD+ model of the Blade, the current test model is also powered by the Core i7-6700HQ (Skylake) quad-core processor. It is a high-end CPU and we can find it in many gaming notebooks. It is not a frugal ULV processor (TDP 15 watts) with a TDP of 45 watts. The nominal clock is 2.6 GHz, which can be raised to 3.1 GHz (four cores), 3.3 GHz (two cores) and 3.5 GHz (one core). There are no problems with the performance since the processor can utilize its full Turbo both on mains and on battery power. Our comparison table below shows that the Blade is on par with the competition in the CPU tests.
| Cinebench R10 | |
| Rendering Multiple CPUs 32Bit | |
| Razer Blade (2016) FHD | |
| Asus Strix GL502VM-FY039T | |
| Schenker XMG P406 | |
| Gigabyte P34W v5 | |
| MSI GS43VR 6RE-006US | |
| Rendering Single 32Bit | |
| Razer Blade (2016) FHD | |
| Asus Strix GL502VM-FY039T | |
| Gigabyte P34W v5 | |
| Schenker XMG P406 | |
| MSI GS43VR 6RE-006US | |
| Geekbench 3 | |
| 32 Bit Single-Core Score | |
| Razer Blade (2016) FHD | |
| Asus Strix GL502VM-FY039T | |
| 32 Bit Multi-Core Score | |
| Razer Blade (2016) FHD | |
| Asus Strix GL502VM-FY039T | |
| Geekbench 4.0 | |
| 64 Bit Single-Core Score | |
| Razer Blade (2016) FHD | |
| Asus Strix GL502VM-FY039T | |
| 64 Bit Multi-Core Score | |
| Razer Blade (2016) FHD | |
| Asus Strix GL502VM-FY039T | |
| JetStream 1.1 - 1.1 Total | |
| Asus Strix GL502VM-FY039T | |
| Razer Blade (2016) FHD | |
| MSI GS43VR 6RE-006US | |
System Performance
A blazing-fast Solid State Drive and a powerful processor ensure a smooth system, and we did not encounter any problems. The synthetic PCMarks determine a very high system performance, so the notebook leaves a good impression outside the gaming arena as well. It is not possible to increase the system performance even further; Razer already maxed it out.
| PCMark 7 Score | 5874 points | |
| PCMark 8 Home Score Accelerated v2 | 4010 points | |
| PCMark 8 Creative Score Accelerated v2 | 4942 points | |
| PCMark 8 Work Score Accelerated v2 | 4920 points | |
Help | ||
| PCMark 8 | |
| Home Score Accelerated v2 | |
| Asus Strix GL502VM-FY039T | |
| MSI GS43VR 6RE-006US | |
| Razer Blade (2016) FHD | |
| Gigabyte P34W v5 | |
| Razer Blade (2016) | |
| Schenker XMG P406 | |
| Work Score Accelerated v2 | |
| Asus Strix GL502VM-FY039T | |
| Schenker XMG P406 | |
| Razer Blade (2016) FHD | |
| MSI GS43VR 6RE-006US | |
| Gigabyte P34W v5 | |
| Razer Blade (2016) | |
Storage Devices
Razer equips our system with a very fast Solid State Drive from Samsung with a capacity of 1 TB. It is an NVMe model with excellent transfer rates. Sequential results of 2000-2500 MB/s ensures short loading times in games.

| Razer Blade (2016) FHD | Razer Blade (2016) Samsung PM951 NVMe MZVLV512 | MSI GS43VR 6RE-006US SanDisk SD8SN8U1T001122 | Gigabyte P34W v5 Samsung SSD 950 Pro 512GB m.2 NVMe | Schenker XMG P406 Samsung SM951 MZHPV256HDGL m.2 PCI-e | Asus Strix GL502VM-FY039T Micron SSD 1100 (MTFDDAV256TBN) | |
|---|---|---|---|---|---|---|
| CrystalDiskMark 3.0 | -25% | -73% | 8% | -14% | -58% | |
| Read Seq (MB/s) | 1977 | 1296 -34% | 335.3 -83% | 2269 15% | 1634 -17% | 462.5 -77% |
| Write Seq (MB/s) | 1668 | 603 -64% | 299 -82% | 1524 -9% | 1290 -23% | 462.7 -72% |
| Read 512 (MB/s) | 800 | 655 -18% | 223 -72% | 937 17% | 1149 44% | 335 -58% |
| Write 512 (MB/s) | 1030 | 604 -41% | 246.7 -76% | 1483 44% | 1285 25% | 407.1 -60% |
| Read 4k (MB/s) | 58.1 | 42.22 -27% | 17.68 -70% | 53.8 -7% | 43.82 -25% | 25.61 -56% |
| Write 4k (MB/s) | 145.6 | 139.6 -4% | 35.31 -76% | 167.3 15% | 110.3 -24% | 86.3 -41% |
| Read 4k QD32 (MB/s) | 592 | 573 -3% | 247.4 -58% | 622 5% | 320.5 -46% | 246.7 -58% |
| Write 4k QD32 (MB/s) | 508 | 480 -6% | 156.3 -69% | 418.9 -18% | 287.3 -43% | 301.5 -41% |
GPU Performance
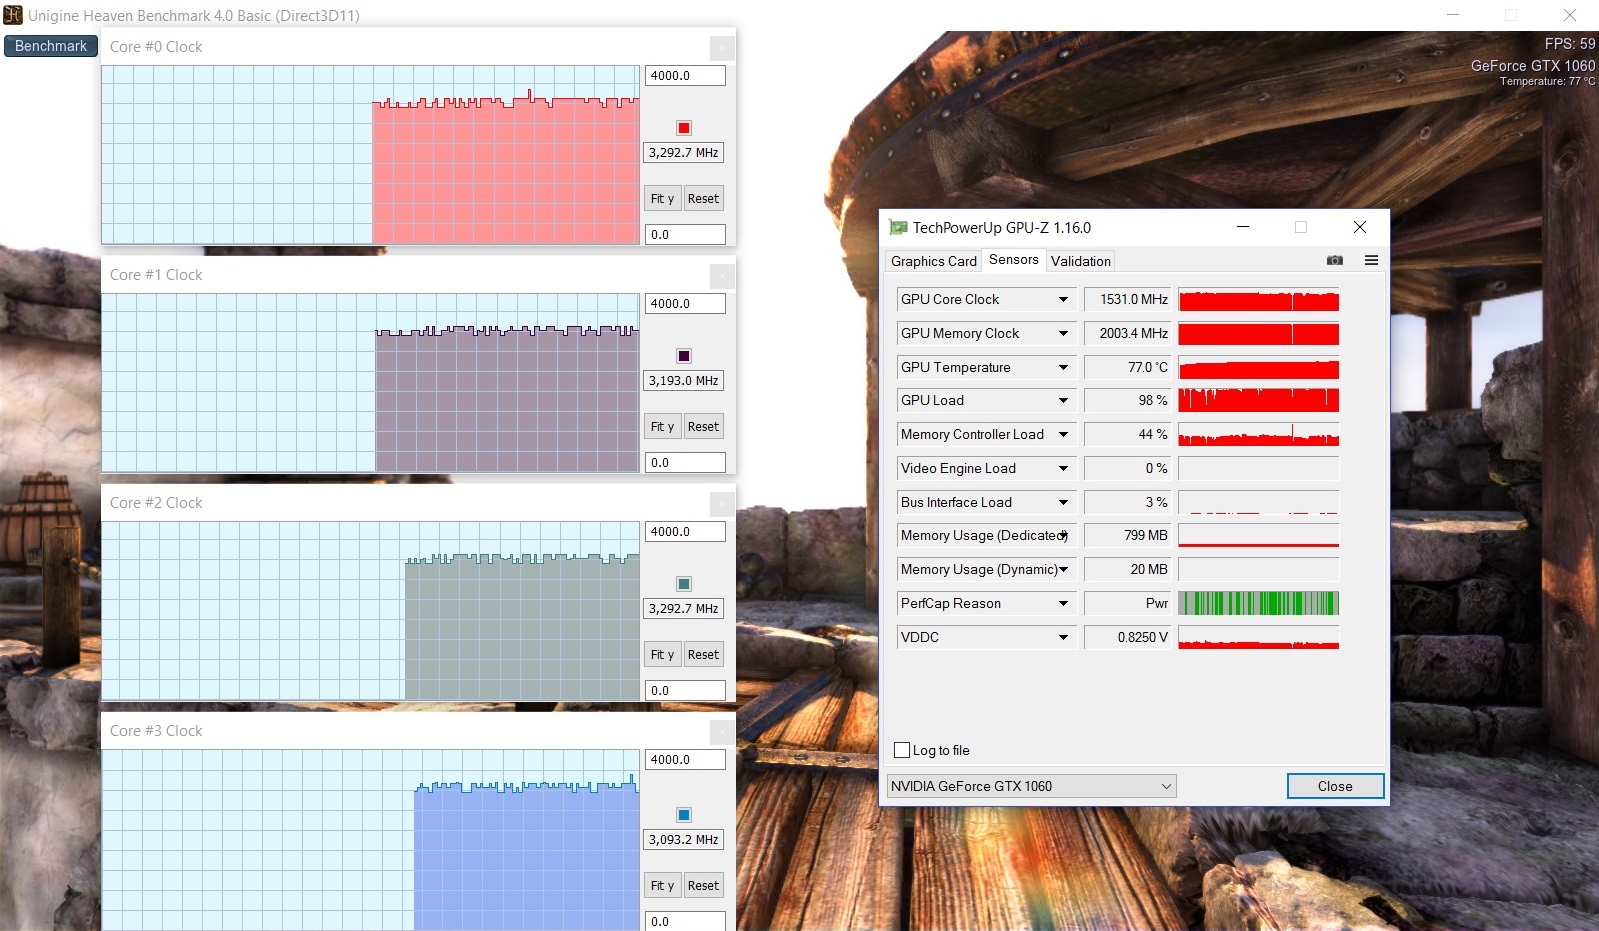
Razer not only found room for a quad-core processor inside the thin case, but also for Nvidia's GeForce GTX 1060. The GPU is based on the current Pascal architecture and is Nvidia's entry-level high-end chip. It supports DirectX 12 and has 6144 MB GDDR5 video memory. The maximum core clock of the GTX 1060 is 1671 MHz according to the specs. We were able to determine an average clock of about 1550 MHz during our 3D tests.
| 3DMark 06 Standard Score | 25367 points | |
| 3DMark 11 Performance | 11616 points | |
| 3DMark Ice Storm Standard Score | 78946 points | |
| 3DMark Cloud Gate Standard Score | 21402 points | |
| 3DMark Fire Strike Score | 9117 points | |
| 3DMark Fire Strike Extreme Score | 4873 points | |
| 3DMark Time Spy Score | 3443 points | |
Help | ||
| 3DMark | |
| 2560x1440 Time Spy Graphics | |
| Asus Strix GL502VM-FY039T | |
| Razer Blade (2016) FHD | |
| 1920x1080 Fire Strike Graphics | |
| MSI GS43VR 6RE-006US | |
| Asus Strix GL502VM-FY039T | |
| Razer Blade (2016) | |
| Razer Blade (2016) FHD | |
| Gigabyte P34W v5 | |
| Schenker XMG P406 | |
| 3DMark 11 - 1280x720 Performance GPU | |
| Asus Strix GL502VM-FY039T | |
| MSI GS43VR 6RE-006US | |
| Razer Blade (2016) | |
| Razer Blade (2016) FHD | |
| Gigabyte P34W v5 | |
| Schenker XMG P406 | |
Gaming Performance
The hardware of the 14-inch laptop can handle most games smoothly in Full HD with high up to maximum details. From all the games we have ever tested with the GTX 1060, only X-Plane required lower settings/resolutions. All in all, the frame rates of the Blade fall a bit short of comparable rivals. Because of the thin chassis and therefore limited cooling capabilities, the Blade is a bit slower than similarly equipped competitors.
| BioShock Infinite - 1920x1080 Ultra Preset, DX11 (DDOF) | |
| Asus Strix GL502VM-FY039T | |
| MSI GS43VR 6RE-006US | |
| Razer Blade (2016) FHD | |
| Gigabyte P34W v5 | |
| Battlefield 4 - 1920x1080 Ultra Preset AA:4x MS | |
| Asus Strix GL502VM-FY039T | |
| Razer Blade (2016) FHD | |
| Schenker XMG P406 | |
| low | med. | high | ultra | |
|---|---|---|---|---|
| Tomb Raider (2013) | 347.4 | 312.1 | 261.9 | 131.7 |
| BioShock Infinite (2013) | 184.5 | 164.6 | 148.3 | 94 |
| Battlefield 4 (2013) | 168.1 | 167.8 | 154.1 | 94 |
| Anno 2205 (2015) | 110.4 | 103.3 | 79.2 | 28.6 |
| XCOM 2 (2016) | 85.5 | 62.8 | 52.8 | 27.8 |
| The Division (2016) | 184.6 | 120.7 | 61.2 | 48.2 |
| Ashes of the Singularity (2016) | 67.9 | 54.8 | 49.4 | |
| Deus Ex Mankind Divided (2016) | 114.4 | 93.8 | 52.4 | 28.1 |
Emissions
System Noise
Users of a small laptop will have to live with permanently spinning fans. We can measure idle values between 35-37 dB(A) caused by a steady fan murmur, which is quite tolerable. Our measurement device shows up to 57 dB(A) during the stress test. This is a situation where you definitely want to use headphones. The gaming noise is lower at 43 dB(A) on average (38 up to 50 dB(A)). You can also hear an electronic humming from time to time.
Noise level
| Idle |
| 35 / 36 / 37 dB(A) |
| Load |
| 43 / 57 dB(A) |
 | ||
30 dB silent 40 dB(A) audible 50 dB(A) loud |
||
min: | ||
| Razer Blade (2016) FHD 6700HQ, GeForce GTX 1060 Mobile | Razer Blade (2016) 6700HQ, GeForce GTX 1060 Mobile | MSI GS43VR 6RE-006US 6700HQ, GeForce GTX 1060 Mobile | Gigabyte P34W v5 6700HQ, GeForce GTX 970M | Schenker XMG P406 6700HQ, GeForce GTX 970M | Asus Strix GL502VM-FY039T 6700HQ, GeForce GTX 1060 Mobile | |
|---|---|---|---|---|---|---|
| Noise | 8% | 5% | 7% | 4% | 5% | |
| off / environment * (dB) | 31 | 30 3% | 29.1 6% | 31 -0% | ||
| Idle Minimum * (dB) | 35 | 31 11% | 32 9% | 31.6 10% | 30 14% | 32 9% |
| Idle Average * (dB) | 36 | 33 8% | 32 11% | 31.6 12% | 32 11% | 33 8% |
| Idle Maximum * (dB) | 37 | 35 5% | 33.5 9% | 32.5 12% | 40 -8% | 34 8% |
| Load Average * (dB) | 43 | 39 9% | 50 -16% | 46.5 -8% | 47 -9% | 44 -2% |
| Load Maximum * (dB) | 57 | 51 11% | 51.5 10% | 52.5 8% | 51 11% | 53 7% |
* ... smaller is better
Temperature
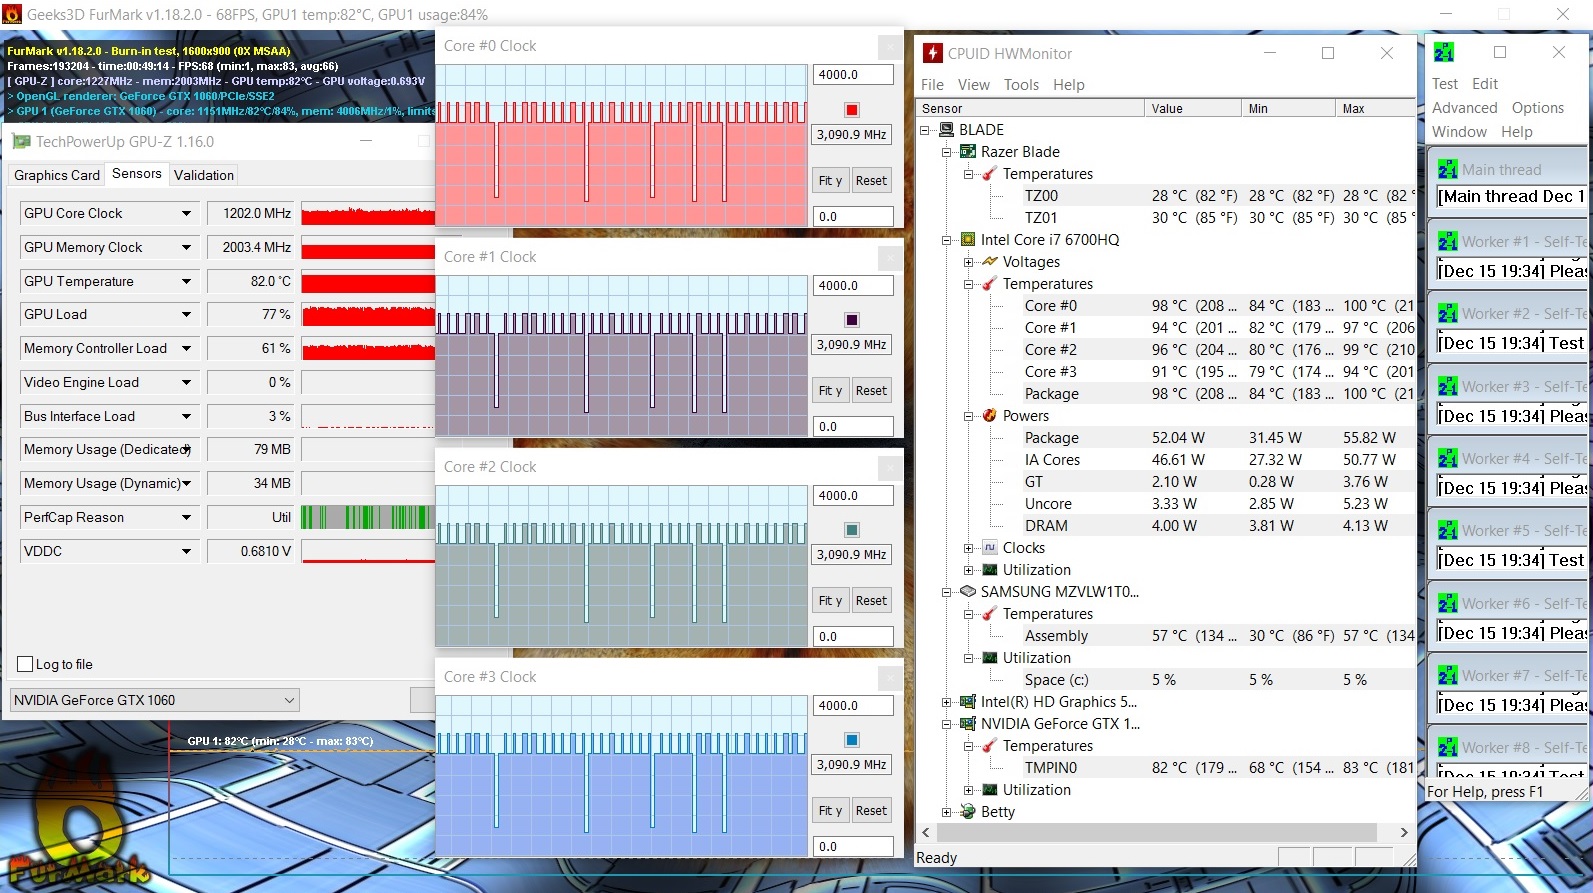
Our stress test (Prime95 and FurMark) shows some differences between mains and battery power for the Blade. The processor usually runs with clocks between 2.6 and 3.1 GHz on mains with occasional drops to 800 MHz, while the GPU fluctuates between 1100-1200 MHz. It is similar on battery power, but the CPU drops to 800 MHz are more common, while the GPU levels off at around 1000 MHz. The small Blade got really warm during the stress test, and we were able to measure around 50 °C (122 °F) at multiple spots. The temperatures will not be that high during gaming, but you should still avoid playing games while the system is sitting on your lap.
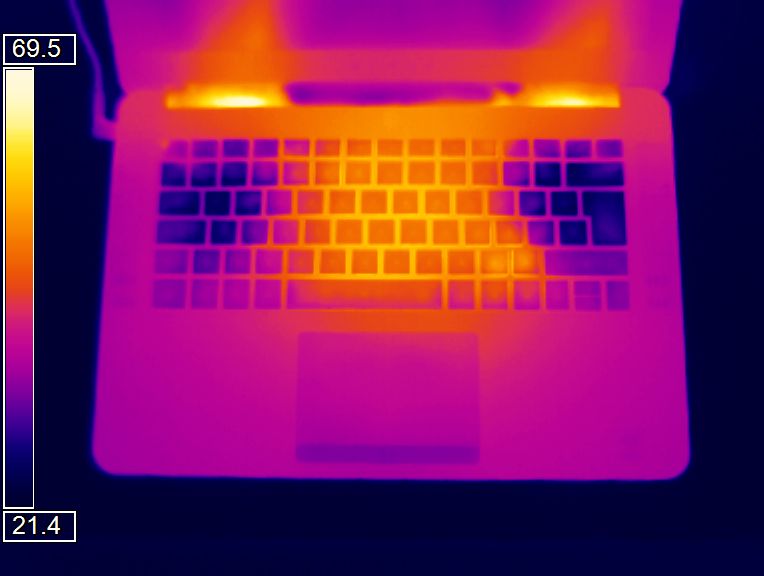
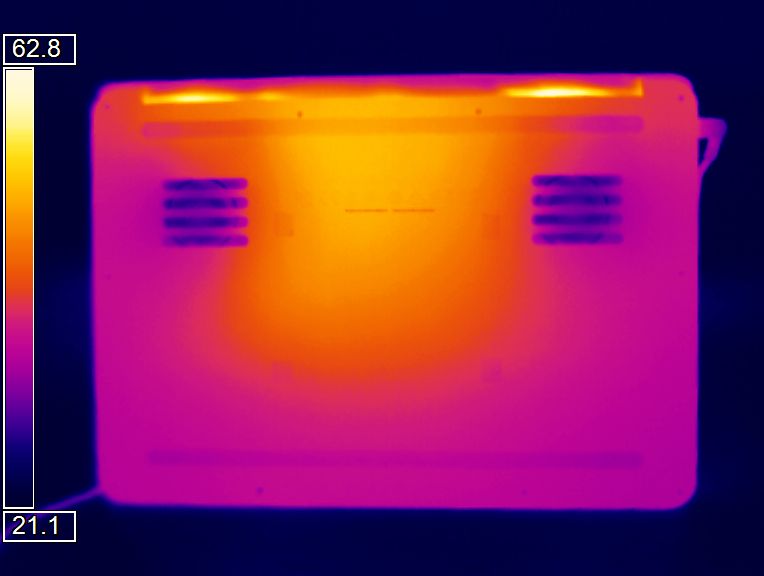
(-) The maximum temperature on the upper side is 54 °C / 129 F, compared to the average of 40.4 °C / 105 F, ranging from 21.2 to 68.8 °C for the class Gaming.
(-) The bottom heats up to a maximum of 49.4 °C / 121 F, compared to the average of 43.2 °C / 110 F
(+) In idle usage, the average temperature for the upper side is 26.3 °C / 79 F, compared to the device average of 33.9 °C / 93 F.
(±) The palmrests and touchpad can get very hot to the touch with a maximum of 39.9 °C / 103.8 F.
(-) The average temperature of the palmrest area of similar devices was 28.8 °C / 83.8 F (-11.1 °C / -20 F).
| Razer Blade (2016) FHD 6700HQ, GeForce GTX 1060 Mobile | Razer Blade (2016) 6700HQ, GeForce GTX 1060 Mobile | MSI GS43VR 6RE-006US 6700HQ, GeForce GTX 1060 Mobile | Gigabyte P34W v5 6700HQ, GeForce GTX 970M | Schenker XMG P406 6700HQ, GeForce GTX 970M | Asus Strix GL502VM-FY039T 6700HQ, GeForce GTX 1060 Mobile | |
|---|---|---|---|---|---|---|
| Heat | -2% | -22% | -11% | -27% | -24% | |
| Maximum Upper Side * (°C) | 54 | 52.7 2% | 55.6 -3% | 59.3 -10% | 55 -2% | 65.3 -21% |
| Maximum Bottom * (°C) | 49.4 | 48.4 2% | 62.4 -26% | 56.5 -14% | 58.7 -19% | 64.4 -30% |
| Idle Upper Side * (°C) | 28 | 29.3 -5% | 33.2 -19% | 27.8 1% | 36.9 -32% | 35.4 -26% |
| Idle Bottom * (°C) | 26.8 | 28.4 -6% | 37.2 -39% | 31.8 -19% | 41.7 -56% | 31.6 -18% |
* ... smaller is better
Speakers
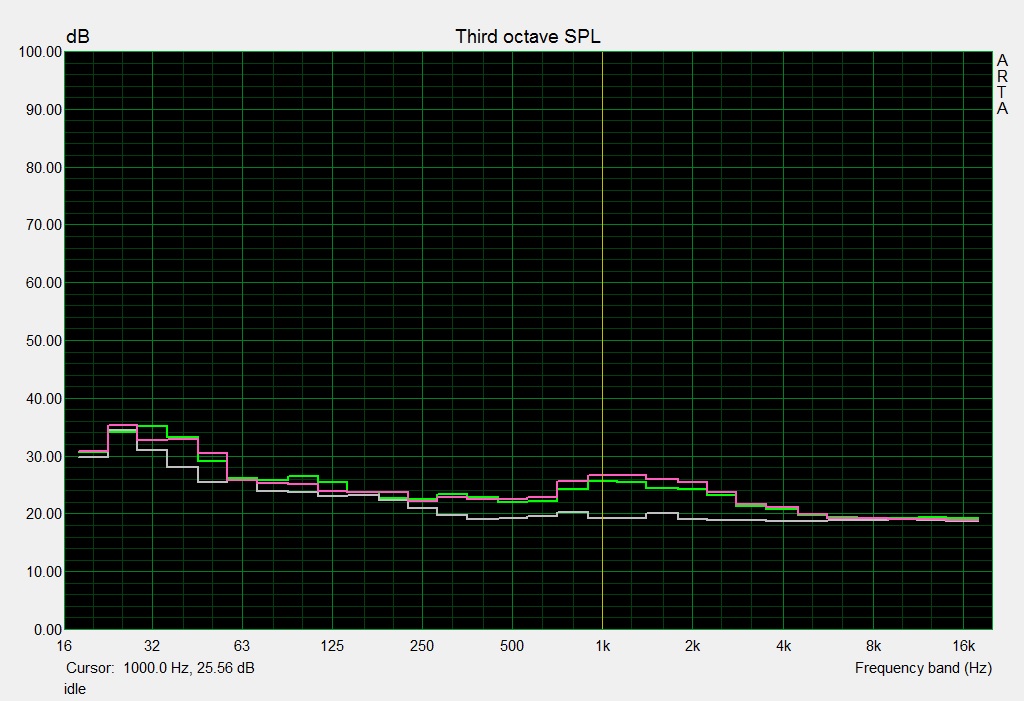
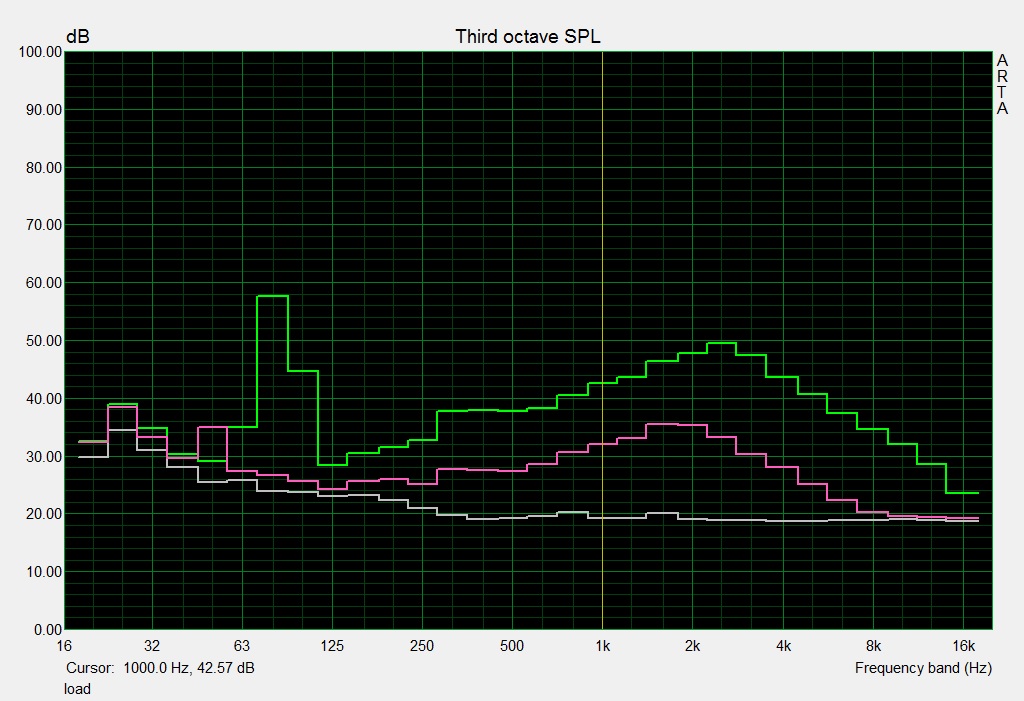
Razer Blade (2016) FHD audio analysis
(±) | speaker loudness is average but good (79 dB)
Bass 100 - 315 Hz
(±) | reduced bass - on average 10.6% lower than median
(±) | linearity of bass is average (12.4% delta to prev. frequency)
Mids 400 - 2000 Hz
(+) | balanced mids - only 4.3% away from median
(+) | mids are linear (3.9% delta to prev. frequency)
Highs 2 - 16 kHz
(+) | balanced highs - only 3.4% away from median
(+) | highs are linear (5.7% delta to prev. frequency)
Overall 100 - 16.000 Hz
(±) | linearity of overall sound is average (17.3% difference to median)
Compared to same class
» 47% of all tested devices in this class were better, 12% similar, 41% worse
» The best had a delta of 6%, average was 18%, worst was 132%
Compared to all devices tested
» 32% of all tested devices were better, 8% similar, 59% worse
» The best had a delta of 4%, average was 24%, worst was 134%
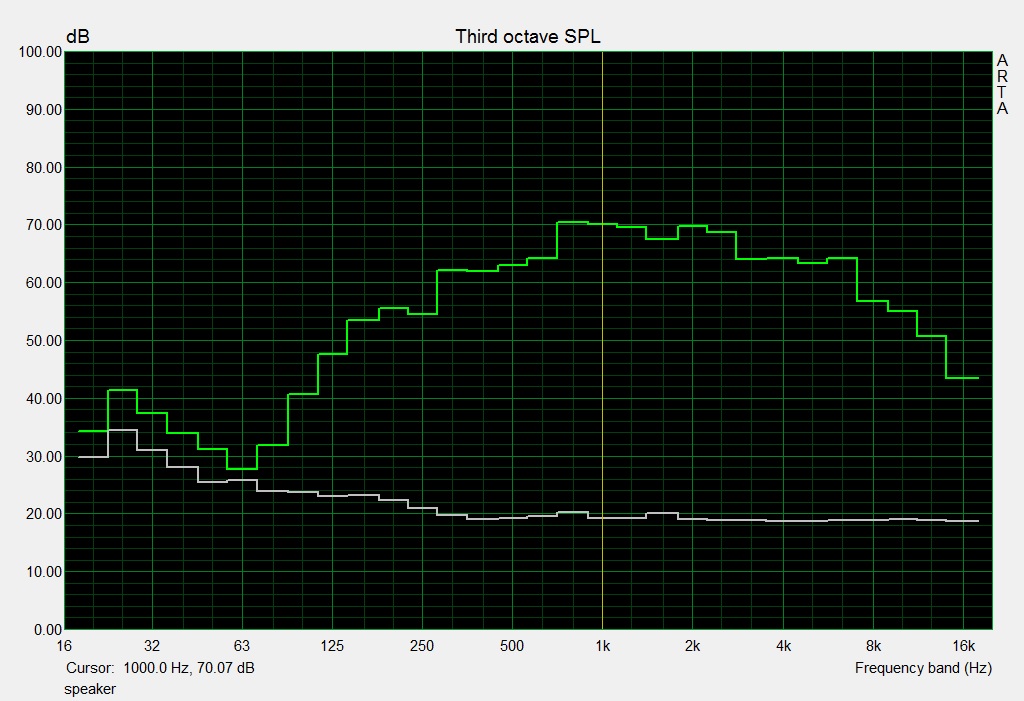
MSI GS43VR 6RE-006US audio analysis
(±) | speaker loudness is average but good (76.7 dB)
Bass 100 - 315 Hz
(-) | nearly no bass - on average 17.5% lower than median
(±) | linearity of bass is average (12% delta to prev. frequency)
Mids 400 - 2000 Hz
(+) | balanced mids - only 3.9% away from median
(±) | linearity of mids is average (9.5% delta to prev. frequency)
Highs 2 - 16 kHz
(±) | higher highs - on average 6.4% higher than median
(±) | linearity of highs is average (8.5% delta to prev. frequency)
Overall 100 - 16.000 Hz
(±) | linearity of overall sound is average (28.9% difference to median)
Compared to same class
» 94% of all tested devices in this class were better, 2% similar, 4% worse
» The best had a delta of 6%, average was 18%, worst was 132%
Compared to all devices tested
» 87% of all tested devices were better, 2% similar, 11% worse
» The best had a delta of 4%, average was 24%, worst was 134%
Frequency Comparison (Checkboxes select/deselectable!)
Energy Management
Power Consumption
Razer ships the Blade with a 165-watt power adapter, which is sufficient for the power consumption. We can measure up to 146 watts during the stress test. The battery is still slightly drained under maximum load. The average should be around 70 watts (65-78 watts) during gaming. Overall, the Blade does not show any unusual results and is on par with its rivals.
| Off / Standby | |
| Idle | |
| Load |
|
Key:
min: | |
| Razer Blade (2016) FHD 6700HQ, GeForce GTX 1060 Mobile | Razer Blade (2016) 6700HQ, GeForce GTX 1060 Mobile | MSI GS43VR 6RE-006US 6700HQ, GeForce GTX 1060 Mobile | Schenker XMG P406 6700HQ, GeForce GTX 970M | Asus Strix GL502VM-FY039T 6700HQ, GeForce GTX 1060 Mobile | |
|---|---|---|---|---|---|
| Power Consumption | 13% | -9% | -5% | -7% | |
| Idle Minimum * (Watt) | 14 | 9 36% | 12.1 14% | 12 14% | 16 -14% |
| Idle Average * (Watt) | 18 | 14 22% | 19 -6% | 16 11% | 19 -6% |
| Idle Maximum * (Watt) | 21 | 22 -5% | 19.5 7% | 22 -5% | 23 -10% |
| Load Average * (Watt) | 70 | 72 -3% | 106.7 -52% | 90 -29% | 68 3% |
| Load Maximum * (Watt) | 146 | 124 15% | 159 -9% | 170 -16% | 157 -8% |
* ... smaller is better
Battery Runtime
The 14-inch system turned out to be quite enduring. Our practical WLAN test determines a runtime of 7:07 hours–the QHD+ model had to be recharged after 4:03 hours. We use a script to simulate web browsing while the Windows power plan is set to Balanced and the brightness is adjusted to around 150 nits. A video does not run quite as long, our test resulting in 5:12 hours. We use a loop of the short movie Big Buck Bunny (H.264, 1920x1080 pixels). The wireless modules are turned off, the energy-saving features are active, and the display brightness is once again adjusted to around 150 nits.
| Razer Blade (2016) FHD 6700HQ, GeForce GTX 1060 Mobile, 70 Wh | Razer Blade (2016) 6700HQ, GeForce GTX 1060 Mobile, 70 Wh | MSI GS43VR 6RE-006US 6700HQ, GeForce GTX 1060 Mobile, 61 Wh | Gigabyte P34W v5 6700HQ, GeForce GTX 970M, 61 Wh | Schenker XMG P406 6700HQ, GeForce GTX 970M, 45 Wh | Asus Strix GL502VM-FY039T 6700HQ, GeForce GTX 1060 Mobile, 64 Wh | |
|---|---|---|---|---|---|---|
| Battery runtime | -42% | -11% | -38% | -33% | -20% | |
| Reader / Idle (h) | 12.7 | 9.6 -24% | 6.5 -49% | 4.6 -64% | 5.3 -58% | |
| H.264 (h) | 5.2 | 3.9 -25% | ||||
| WiFi v1.3 (h) | 7.1 | 4.1 -42% | 4.4 -38% | 3.9 -45% | 3.3 -54% | 3.7 -48% |
| Load (h) | 1 | 1.3 30% | 0.8 -20% | 1.2 20% | 1.5 50% |
Pros
Cons
Verdict
Razer puts a lot of performance into a thin and very appealing chassis. The system can handle all modern games, but the frame rates are a bit lower compared to larger rivals. The cooling performance is limited because of the small chassis volume, so the GPU clock suffers a bit as a result. It is never a very quiet notebook – but we did not expect that. You can still live with the idle noise though. A blazing-fast SSD ensures a responsive system. It is no problem to remove the bottom panel, and the laptop is pretty future-proof with its ports. Only a Gigabit-Ethernet port is missing, which has to realized via a USB adapter if necessary.
The Full HD Blade is the better overall package.
The biggest difference to the previously reviewed model of the Blade is the display. The wide viewing angle IPS Full HD screen manages decent luminance results and a good contrast ratio. Positive: Compared to the QHD+ display of the sibling, we cannot determine any PWM flickering on the Full HD display. The latter is also more efficient compared to the QHD+ touchscreen and manages much longer battery runtimes as a result.
Razer Blade (2016) FHD
- 12/25/2016 v6 (old)
Sascha Mölck
Price comparison

