Reviews for the Intel Core i7-7700HQ processor
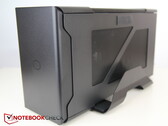
Cooler Master MasterCase EG200 in hands-on test: Does an external GPU via Thunderbolt case make sense?
Destop-level gaming performance is certainly what many gamers who have sworn off the clunky tower want. The Mastercase EG200 accommodates full-length desktop graphics cards, supplies them with power and connects them to the laptop via Thunderbolt 3. Besides that, there are interesting extras like an additional hard drive bay, more USB ports or an integrated laptop holder. We check how a dGPU in the case performs against full-fledged desktop PCs.
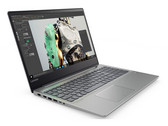
Intel Core i7-7700HQ, NVIDIA GeForce RTX 3070Lenovo Ideapad 720S-15IKB (i7-7700HQ, GTX 1050 Ti Max-Q, SSD 512 GB) Laptop Review
Multimedia oddball. Lenovo has outfitted the first 15-inch laptop in its 700 series with exotic hardware, including an i7-7700HQ with a TDP reduced to 35 watts and a 1050 Ti Max-Q. The contender has a lot to offer—a great display, long battery life—but the proverbial fly in the ointment could be a no-go for some people.
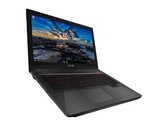
Intel Core i7-7700HQ, NVIDIA GeForce GTX 1050 Ti Max-Q, 15.6", 1.9 kgAsus FX503VM (7700HQ, GTX 1060, FHD) Laptop Review
Plastic, pragmatic. The Asus FX503VM is a mid-tier gaming laptop at a budget-minded price. Although there are some cut corners, the overall package is capable, competent, and attractive.
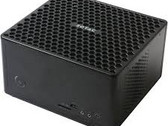
Intel Core i7-7700HQ, NVIDIA GeForce GTX 1060 Mobile, 15.6", 2.2 kgZotac ZBOX Magnus EK71080 (i7-7700HQ, GTX 1080) Mini PC Review
Bigger, faster, better value? The Zotac ZBOX Magnus EK71080 is one of the most powerful small form factor desktops on the market. While relatively small compared to traditional desktops, it is twice as large as other Zotac ZBOX devices. Zotac puts this extra space to good use by packing in a full desktop Nvidia GeForce GTX 1080 graphics card.
Intel Core i7-7700HQ, NVIDIA GeForce GTX 1080 (Desktop), 3.3 kgAsus ROG Strix GL703VM Scar Edition (7700HQ, GTX 1060, FHD 120 Hz) Laptop Review
Hotter, Louder, Faster, Stronger. The Asus ROG Strix GL703VM is a more powerful version of the GL703VD, which we reviewed back in October. In addition to a faster GPU, the GL703VM brings a 120 Hz display, but fan noise and temperatures leave room for improvement.
Intel Core i7-7700HQ, NVIDIA GeForce GTX 1060 Mobile, 17.3", 2.7 kgDell Inspiron 15 7000 7577 4K: NVIDIA GeForce GTX 1060 Max-Q, 15.60", 2.9 kg
Review » Dell Inspiron 15 7000 7577 (i7-7700HQ, GTX 1060 Max-Q, 4K UHD) Laptop Review
Schenker XMG Pro 17: NVIDIA GeForce GTX 1070 Mobile, 17.30", 3.1 kg
Review » Schenker Technologies XMG Pro 17 (Clevo PA71HS-G) Laptop Review
Schenker Key 15: NVIDIA GeForce GTX 1060 Mobile, 15.60", 2.2 kg
Review » Schenker Technologies Key 15 (Clevo P955HP6) Laptop Review
Asus ROG Strix GL702VI-WB74: NVIDIA GeForce GTX 1080 Mobile, 17.30", 3.2 kg
Review » Asus ROG Strix GL702VI (i7-7700HQ, GTX 1080) Laptop Review
PC Zentrum Defiance IV: NVIDIA GeForce GTX 1060 Mobile, 17.30", 3 kg
Review » PC Specialist Defiance IV (i7-7700HQ, GTX 1060, Full HD) Laptop Review
PC Zentrum Proteus V: NVIDIA GeForce GTX 1060 Mobile, 15.60", 2.6 kg
Review » PC Specialist Proteus V (i7-7700HQ, GTX 1060, Full HD) Laptop Review
Schenker Media 15: NVIDIA GeForce MX150, 15.60", 2.1 kg
Review » Schenker Media 15 (i7-7700HQ, MX150) Laptop Review
Razer Blade (2017) UHD: NVIDIA GeForce GTX 1060 Mobile, 14.00", 1.9 kg
Review » Razer Blade (2017) UHD Laptop Review
HP Omen 15t-ce000: NVIDIA GeForce GTX 1060 Max-Q, 15.60", 2.6 kg
Review » HP Omen 15t-ce000 (7700HQ, GTX 1060 Max-Q, UHD) Laptop Review
MSI GS63VR 7RG-005: NVIDIA GeForce GTX 1070 Max-Q, 15.60", 1.9 kg
Review » MSI GS63VR 7RG Stealth Pro (i7-7700HQ, GTX 1070 Max-Q, Full HD) Laptop Review
Asus Zenbook Pro UX550VE-DB71T: NVIDIA GeForce GTX 1050 Ti Mobile, 15.60", 1.9 kg
Review » Asus Zenbook Pro UX550VE (i7-7700HQ, GTX 1050 Ti) Laptop Review
MSI GF62VR 7RF-877: NVIDIA GeForce GTX 1060 Mobile, 15.60", 2.2 kg
Review » MSI GF62VR 7RF (7700HQ, GTX 1060, FHD 60 Hz) Laptop Review
Schenker XMG Core 15: NVIDIA GeForce GTX 1060 Mobile, 15.60", 2.6 kg
Review » Schenker Technologies XMG Core 15 (i7-7700HQ, GTX 1060, Full HD) Laptop Review
Gigabyte Aero 15X: NVIDIA GeForce GTX 1070 Max-Q, 15.60", 2.2 kg
Review » Gigabyte Aero 15X (i7-7700HQ, GTX 1070 Max-Q, FHD) Laptop Review
MSI GE63VR 7RF Raider: NVIDIA GeForce GTX 1070 Mobile, 15.60", 2.4 kg
Review » MSI GE63VR Raider-075 (i7-7700HQ, GTX 1070, Full HD) Laptop Review
Asus GL503VD-DB74: NVIDIA GeForce GTX 1050 Mobile, 15.60", 2.2 kg
Review » Asus ROG GL503VD-DB74 (7700HQ, GTX 1050) Laptop Review
Razer Blade Pro RZ09-0220: NVIDIA GeForce GTX 1060 Mobile, 17.30", 3.1 kg
Review » Razer Blade Pro 2017 (i7-7700HQ, GTX 1060, FHD) Laptop Review
MSI GF72VR 7RF: NVIDIA GeForce GTX 1060 Mobile, 17.30", 2.7 kg
Review » MSI GF72VR 7RF (7700HQ, GTX 1060, 120 Hz) Laptop Review
MSI GS73VR 7RG: NVIDIA GeForce GTX 1070 Max-Q, 17.30", 2.4 kg
Review » MSI GS73VR 7RG (i7-7700HQ, GTX 1070 Max-Q, FHD) Laptop Review
Asus ROG Strix GL703VD-DB74: NVIDIA GeForce GTX 1050 Mobile, 17.30", 3 kg
Review » Asus ROG Strix GL703VD-DB74 (7700HQ, GTX 1050, FHD) Laptop Review
Gigabyte Aero 14-K7: NVIDIA GeForce GTX 1050 Ti Mobile, 14.00", 1.9 kg
Review » Gigabyte Aero 14K (i7-7700HQ, GTX 1050 Ti, QHD) Laptop Review
MSI GE73VR 7RF Raider: NVIDIA GeForce GTX 1070 Mobile, 17.30", 2.9 kg
Review » MSI GE73VR 7RF Raider (i7-7700HQ, GTX 1070, Full HD) Laptop Review
Asus VivoBook Pro 15 N580VD-DM028T: NVIDIA GeForce GTX 1050 Mobile, 15.60", 2 kg
Review » Asus VivoBook Pro 15 (i7-7700HQ, GTX 1050) Laptop Review
MSI GP72VR 7RFX: NVIDIA GeForce GTX 1060 Mobile, 17.30", 2.8 kg
Review » MSI GP72VR 7RFX (i7-7700HQ, GTX 1060) Laptop Review
Guru Fire KS: NVIDIA GeForce GTX 1060 Mobile, 15.60", 2.2 kg
Review » Guru Fire KS (Clevo P950HP6) Laptop Review
Acer Nitro 5 AN515-51-788E: NVIDIA GeForce GTX 1050 Ti Mobile, 15.60", 2.7 kg
Review » Acer Nitro 5 (7700HQ, GTX 1050 Ti) Laptop Review
Acer Predator Triton 700: NVIDIA GeForce GTX 1080 Max-Q, 15.60", 2.4 kg
Review » Acer Predator Triton 700 (i7-7700HQ, GTX 1080 Max-Q, Full-HD) Laptop Review
Sager NP5852: NVIDIA GeForce MX150, 15.60", 2.5 kg
Review » Sager NP5852 (Clevo N850HL, i7-7700HQ, MX150) Laptop Review
MSI WS63VR 7RL-023US: NVIDIA Quadro P4000 Max-Q, 15.60", 1.9 kg
Review » MSI WS63VR (i7-7700HQ, 4K, Quadro P4000 Max-Q) Laptop Review
Eurocom Q5: NVIDIA GeForce GTX 1070 Max-Q, 15.60", 2.2 kg
Review » Eurocom Q5 (Clevo P957HR, i7-7700HQ, GTX 1070 Max-Q) Laptop Review
Asus ZenBook Pro UX550VD: NVIDIA GeForce GTX 1050 Mobile, 15.60", 1.9 kg
Review » Asus ZenBook Pro UX550VD (i7, GTX 1050, Full HD) Laptop Review
Acer Aspire 7 A717-71G-72VY: NVIDIA GeForce GTX 1060 Mobile, 17.30", 2.9 kg
Review » Acer Aspire 7 (Core i7, GTX 1060) Laptop Review
Acer Predator Helios 300: NVIDIA GeForce GTX 1060 Mobile, 17.30", 2.9 kg
Review » Acer Predator Helios 300 (7700HQ, GTX 1060, Full HD) Laptop Review
Asus Zephyrus GX501VS: NVIDIA GeForce GTX 1070 Max-Q, 15.60", 2.3 kg
Review » Asus Zephyrus GX501VS (i7-7700HQ, GTX 1070 Max-Q) Laptop Review
HP Omen 17-an014ng: NVIDIA GeForce GTX 1070 Mobile, 17.30", 3.8 kg
Review » HP Omen 17 (7700HQ, GTX 1070, Full-HD) Laptop Review
Gigabyte P56XT: NVIDIA GeForce GTX 1070 Mobile, 15.60", 2.7 kg
Review » Gigabyte P56XT (7700HQ, GTX 1070, Full HD) Laptop
MSI GS43VR 7RE-069US: NVIDIA GeForce GTX 1060 Mobile, 14.00", 1.9 kg
Review » MSI GS43VR 7RE (i7-7700HQ, GTX 1060) Laptop Review
MSI GP62 7REX-1045US: NVIDIA GeForce GTX 1050 Ti Mobile, 15.60", 2.5 kg
Review » MSI GP62 7REX (i7-7700HQ, GTX 1050 Ti) Xotic PC Edition Laptop Review
Gigabyte Sabre 15G: NVIDIA GeForce GTX 1050 Mobile, 15.60", 2.5 kg
Review » Gigabyte Sabre 15 (i7-7700HQ, GTX 1050) Laptop Review
HP Omen 15-ce002ng: NVIDIA GeForce GTX 1060 Max-Q, 15.60", 2.6 kg
Review » HP Omen 15 (7700HQ, GTX 1060 Max-Q, Full-HD) Laptop Review
HP Pavilion Power 15t-cb2000: AMD Radeon RX 550 (Laptop), 15.60", 2.3 kg
Review » HP Pavilion Power 15t-cb2000 (i7-7700HQ, Radeon RX 550) Laptop Review
Schenker XMG A517: NVIDIA GeForce GTX 1060 Mobile, 15.60", 2.4 kg
Review » Schenker Technologies XMG A517 (Clevo N850HP6) Laptop Review
Apple MacBook Pro 15 2017 (2.8 GHz, 555): AMD Radeon Pro 555, 15.40", 1.8 kg
Review » Apple MacBook Pro 15 2017 (2.8 GHz, 555) Laptop Review
MSI WS63 7RF-290US: NVIDIA Quadro P3000, 15.60", 1.9 kg
Review » MSI WS63 7RF (i7-7700HQ, FHD, P3000) Workstation Review
HP Omen 15-ax213ng: NVIDIA GeForce GTX 1050 Ti Mobile, 15.60", 2.3 kg
Review » HP Omen 15t 2017 (7700HQ, GTX 1050 Ti, Full HD) Laptop Review
EVGA SC15: NVIDIA GeForce GTX 1060 Mobile, 15.60", 2.9 kg
Review » EVGA SC15 (i7-7700HQ, GTX 1060) Laptop Review
HP Omen 17-w206ng: NVIDIA GeForce GTX 1050 Ti Mobile, 17.30", 2.9 kg
Review » HP Omen 17 (7700HQ, GTX 1050 Ti, FHD) Laptop Review
HP Pavilion 15 Power 1GK62AV: NVIDIA GeForce GTX 1050 Mobile, 15.60", 2.4 kg
Review » HP Pavilion 15 Power (i7-7700HQ, GTX 1050) Laptop Review
Acer Aspire VN7-593G-73HP V15 Nitro BE: NVIDIA GeForce GTX 1060 Mobile, 15.60", 2.5 kg
Review » Acer Aspire V15 Nitro BE VN7-593G (7700HQ, GTX 1060) Laptop Review
Asus Zephyrus GX501: NVIDIA GeForce GTX 1080 Max-Q, 15.60", 2.3 kg
Review » Asus ROG Zephyrus GX501 Laptop Review
MSI GL72 7RDX-602: NVIDIA GeForce GTX 1050 Mobile, 17.30", 3 kg
Review » MSI GL72 7RD-028 Laptop (Core i7, Full HD) Review
Lenovo Yoga 720-15IKB-80X7: NVIDIA GeForce GTX 1050 Mobile, 15.60", 2 kg
Review » Lenovo Yoga 720-15IKB (7700HQ, FHD, GTX 1050) Laptop Review
Acer Aspire V17 Nitro BE VN7-793-738J: NVIDIA GeForce GTX 1060 Mobile, 17.30", 3.1 kg
Review » Acer Aspire V17 Nitro BE (7700HQ, GTX 1060, 4k) Laptop Review
MSI GS73VR 7RF: NVIDIA GeForce GTX 1060 Mobile, 17.30", 2.4 kg
Review » MSI GS73VR 7RF (7700HQ, GTX 1060, 4K) Laptop Review
Lenovo ThinkPad T470p-20J7S00000 : NVIDIA GeForce 940MX, 14.00", 1.9 kg
Review » Lenovo ThinkPad T470p (Core i7, GeForce 940MX) Laptop Review
Asus G752VS-BA338T: NVIDIA GeForce GTX 1070 Mobile, 17.30", 4.5 kg
Review » Asus ROG G752VS (7700HQ, GTX 1070, FHD) Laptop Review
Acer Predator 15 G9-593-751X: NVIDIA GeForce GTX 1070 Mobile, 15.60", 3.7 kg
Review » Acer Predator 15 (7700HQ, GTX 1070, Full HD) Laptop Review
Asus GL753VE-DS74: NVIDIA GeForce GTX 1050 Ti Mobile, 17.30", 3 kg
Review » Asus ROG GL753VE (7700HQ, 1050 Ti) Laptop Review
Lenovo Legion Y520-15IKBN-80WK001KUS: NVIDIA GeForce GTX 1050 Ti Mobile, 15.60", 2.5 kg
Review » Lenovo Legion Y520 15IKBN (7700HQ, FHD, GTX 1050 Ti) Laptop Review
Acer Predator 17 G9-793-70PJ: NVIDIA GeForce GTX 1070 Mobile, 17.30", 4.3 kg
Review » Acer Predator 17 (7700HQ, GTX 1070, UHD) Laptop Review
MSI WE72 7RJ: NVIDIA Quadro M2200, 17.30", 2.9 kg
Review » MSI WE72 7RJ (7700HQ, FHD, M2200) Workstation Review
Gigabyte Aero 15: NVIDIA GeForce GTX 1060 Mobile, 15.60", 2.1 kg
Review » Gigabyte Aero 15 (7700HQ, GTX 1060, FHD) Laptop Review
Lenovo Legion Y720 80VR002XGE: NVIDIA GeForce GTX 1060 Mobile, 15.60", 3.1 kg
Review » Lenovo Legion Y720 (7700HQ, Full-HD, GTX 1060) Laptop Review
Samsung Odyssey NP800G5M-X01US: NVIDIA GeForce GTX 1050 Mobile, 15.60", 2.5 kg
Review » Samsung Odyssey NP800G5M (7700HQ, FHD, GTX 1050) Laptop Review
Asus FX553VD-DM249T: NVIDIA GeForce GTX 1050 Mobile, 15.60", 2.4 kg
Review » Asus FX553VD (7700HQ, GTX 1050) Laptop Review
HP Pavilion 15t-bc200 X7P44AV: NVIDIA GeForce GTX 1050 Mobile, 15.60", 2.3 kg
Review » HP Pavilion 15t-bc200 X7P44AV (7700HQ, UHD, GTX 1050) Laptop Review
Acer Aspire VX5-591G-75C4 VX15: NVIDIA GeForce GTX 1050 Ti Mobile, 15.60", 2.5 kg
Review » Acer Aspire VX5-591G (7700HQ, FHD, GTX 1050 Ti) Laptop Review
Razer Blade (2017): NVIDIA GeForce GTX 1060 Mobile, 14.00", 1.8 kg
Review » Razer Blade 2017 (GTX 1060, 7700HQ, Full-HD) Laptop Review
Nexoc G739: NVIDIA GeForce GTX 1050 Ti Mobile, 17.30", 2.9 kg
Review » Nexoc G739 (Clevo N870HK1) Laptop Review
Gigabyte Aero 14: NVIDIA GeForce GTX 1060 Mobile, 14.00", 1.9 kg
Review » Gigabyte Aero 14 (7700HQ, GTX 1060) Laptop Review
HP Pavilion 17t-ab200 UHD: NVIDIA GeForce GTX 1050 Mobile, 17.30", 3 kg
Review » HP Pavilion 17t (7700HQ, UHD, GTX 1050) Laptop Review
MSI GS63VR 7RF-228US: NVIDIA GeForce GTX 1060 Mobile, 15.60", 1.9 kg
Review » MSI GS63VR 7RF (7700HQ, 4K UHD, GTX 1060) Laptop Review
HP Pavilion 15t-X7P42AV: NVIDIA GeForce GTX 1050 Mobile, 15.60", 2.3 kg
Review » HP Pavilion 15t X7P44AV (7700HQ, FHD, GTX 1050) Laptop Review
Asus Strix GL702VSK: NVIDIA GeForce GTX 1070 Mobile, 17.30", 2.9 kg
Review » Asus Strix GL702VS (7700HQ, FHD, GTX 1070) Xotic PC Edition Notebook Review
Schenker XMG P407: NVIDIA GeForce GTX 1050 Ti Mobile, 14.00", 2.1 kg
Review » Schenker Technologies XMG P407 (Clevo P641HK1) Notebook Review
Asus ROG Strix GL553VD-DS71: NVIDIA GeForce GTX 1050 Mobile, 15.60", 2.5 kg
Review » Asus ROG Strix GL553VD (7700HQ, FHD, GTX 1050) Laptop Review
Dell XPS 15 9560 (i7-7700HQ, UHD): NVIDIA GeForce GTX 1050 Mobile, 15.60", 2.1 kg
Review » Dell XPS 15 9560 (i7-7700HQ, UHD) Laptop Review
Asus FX502VM-AS73: NVIDIA GeForce GTX 1060 Mobile, 15.60", 2.6 kg
Review » Asus FX502VM-AS73 Notebook Review
Gigabyte P55W v7: NVIDIA GeForce GTX 1060 Mobile, 15.60", 2.6 kg
Review » Gigabyte P55W v7 Notebook Review
HP Pavilion 17t-ab200: NVIDIA GeForce GTX 1050 Mobile, 17.30", 3 kg
Review » HP Pavilion 17t-ab200 Notebook Review
Alienware 13 R3: NVIDIA GeForce GTX 1060 Mobile, 13.30", 2.5 kg
Review » Alienware 13 R3 Notebook Review
Nexoc G734IV: NVIDIA GeForce GTX 1070 Mobile, 17.30", 3.3 kg
Review » Nexoc G734IV (Clevo P670HS-G) Notebook Review
Alienware 15 R3: NVIDIA GeForce GTX 1070 Mobile, 15.60", 3.5 kg
Review » Alienware 15 R3 Notebook Review
MSI GT62VR 7RE-223: NVIDIA GeForce GTX 1070 Mobile, 15.60", 2.9 kg
Review » MSI GT62VR 7RE Dominator Pro Notebook Review
Dell Inspiron 15 7000 7567: NVIDIA GeForce GTX 1050 Ti Mobile, 15.60", 2.8 kg
Review » Dell Inspiron 15 7000 7567 Gaming Notebook Review
MSI GL62M 7RD-077: NVIDIA GeForce GTX 1050 Mobile, 15.60", 2.4 kg
Review » MSI GL62M 7RD-077 Notebook Review
Gigabyte P57X v7: NVIDIA GeForce GTX 1070 Mobile, 17.30", 3.4 kg
Review » Gigabyte P57X v7 Gaming Notebook Review
Acer Aspire V17 Nitro BE VN7-793G-706L: NVIDIA GeForce GTX 1060 Mobile, 17.30", 3.1 kg
Review » Acer Aspire V17 Nitro BE VN7-793G Notebook (GTX 1060 Black Edition) Review
Asus Strix GL502VM-DS74: NVIDIA GeForce GTX 1060 Mobile, 15.60", 2.5 kg
Review » Asus Strix GL502VM-DS74 Xotic PC Edition Notebook Review
Schenker XMG P507 PRO: NVIDIA GeForce GTX 1070 Mobile, 15.60", 2.9 kg
Review » Schenker XMG P507 (Clevo P651HS-G) Notebook Review
MSI GT72VR 7RE-433: NVIDIA GeForce GTX 1070 Mobile, 17.30", 3.8 kg
Review » MSI GT72VR 7RE Dominator Pro Notebook Review
MSI GE72 7RE-046: NVIDIA GeForce GTX 1050 Ti Mobile, 17.30", 3 kg
Review » MSI GE72 7RE Apache Pro Notebook Review
Acer Aspire VX5-591G-D0DD: NVIDIA GeForce GTX 1050 Ti Mobile, 15.60", 2.6 kg
Review » Acer Aspire VX5-591G (VX 15) Notebook Preview
Asus Strix GL753VD-GC045T: NVIDIA GeForce GTX 1050 Mobile, 17.30", 2.9 kg
Review » Asus ROG Strix GL753VD Notebook Review
MSI GS73VR 7RF-217BE: NVIDIA GeForce GTX 1060 Mobile, 17.30", 2.5 kg
External Review » MSI GS73VR 7RF-217BE
BTO Notebooks X-Book 14CL77: NVIDIA GeForce GTX 1050 Mobile, 14.00", 2 kg
External Review » BTO Notebooks X-Book 14CL77
Dell XPS 15 9560-3PHNV: NVIDIA GeForce GTX 1050 Mobile, 15.60", 1.9 kg
External Review » Dell XPS 15 9560-3PHNV
HP OMEN 15-ce016ns: NVIDIA GeForce GTX 1050 Mobile, 15.60", 2.6 kg
External Review » HP OMEN 15-ce016ns
Asus GL753VD-GC184T: NVIDIA GeForce GTX 1050 Mobile, 17.30", 2.8 kg
External Review » Asus GL753VD-GC184T
HP Omen 15-ax201ns: NVIDIA GeForce GTX 1050 Mobile, 15.60", 2.2 kg
External Review » HP OMEN 15-ax201ns
Medion Erazer X7851-MD60706: NVIDIA GeForce GTX 1060 Mobile, 17.30", 3.5 kg
External Review » Medion Erazer X7851-MD60706
Medion Erazer X7853-MD60707: NVIDIA GeForce GTX 1070 Mobile, 17.30", 3.8 kg
External Review » Medion Erazer X7853-MD60707
Acer Nitro 5 AN515-51-76BD: NVIDIA GeForce GTX 1050 Ti Mobile, 15.60", 2.7 kg
External Review » Acer Nitro 5 AN515-51-76BD
HP Omen 15-ce083ns: NVIDIA GeForce GTX 1060 Mobile, 15.60", 2.6 kg
External Review » HP Omen 15-ce083ns
MSI GE62VR-7RF 651NE Camo Edition: NVIDIA GeForce GTX 1060 Mobile, 15.60", 2.4 kg
External Review » MSI GE62VR-7RF 651NE Camo Edition
MSI GL72M 7RDX-1006XES: NVIDIA GeForce GTX 1050 Mobile, 17.30", 2.7 kg
External Review » MSI GL72M 7RDX-1006XES
MSI GT62VR 7RE-456XES: NVIDIA GeForce GTX 1070 Mobile, 15.60", 2.9 kg
External Review » MSI GT62VR 7RE-456XES
Lenovo Ideapad Y520-15IKBN-80WK016RSP: NVIDIA GeForce GTX 1050 Mobile, 15.60", 2.5 kg
External Review » Lenovo Ideapad Y520-15IKBN-80WK016RSP
MSI Raider GE73VR 7RF-258XES: NVIDIA GeForce GTX 1070 Mobile, 17.30", 2.8 kg
External Review » MSI Raider GE73VR 7RF-258XES
MSI Raider GE63VR 7RF-227XES: NVIDIA GeForce GTX 1070 Mobile, 15.60", 2 kg
External Review » MSI Raider GE63VR 7RF-227XES
MSI Leopard GP72M 7RDX-1493ES: NVIDIA GeForce GTX 1050 Mobile, 17.30", 2.7 kg
External Review » MSI Leopard GP72M 7RDX-1493ES
MSI Stealth Pro GS63 7RE-095XES: NVIDIA GeForce GTX 1050 Ti Mobile, 15.60", 1.8 kg
External Review » MSI Stealth Pro GS63 7RE-095XES
MSI GS63VR 7RG-084XES: NVIDIA GeForce GTX 1070 Mobile, 15.60", 1.8 kg
External Review » MSI GS63VR 7RG-084XES
MSI Stealth Pro GS63VR 7RF-634XES: NVIDIA GeForce GTX 1060 Mobile, 15.60", 1.8 kg
External Review » MSI Stealth Pro GS63VR 7RF-634XES
Acer Aspire VX5-591G-73J6: NVIDIA GeForce GTX 1050 Mobile, 15.60", 2.5 kg
External Review » Acer Aspire VX5-591G-73J6
Lenovo Yoga 720-15IKB-80X7006VSP: NVIDIA GeForce GTX 1050 Mobile, 15.60", 2 kg
External Review » Lenovo Yoga 720-15IKB-80X7006VSP
Acer Aspire 7 A717-71G-73EB: NVIDIA GeForce GTX 1050 Mobile, 17.30", 2.9 kg
External Review » Acer Aspire 7 A717-71G-73EB
EVGA SC15: NVIDIA GeForce GTX 1060 Mobile, 15.60", 2.9 kg
External Review » EVGA SC15
MSI GF62 7RE-1808XES: NVIDIA GeForce GTX 1050 Ti Mobile, 15.60", 2.2 kg
External Review » MSI GF62 7RE-1808XES
Lenovo IdeaPad Y520-15IKB-80WK00YYSP: NVIDIA GeForce GTX 1050 Mobile, 15.60", 2.5 kg
External Review » Lenovo IdeaPad Y520-15IKB-80WK00YYSP
HP Pavilion Power 15-cb005ns : NVIDIA GeForce GTX 1050 Mobile, 15.60", 2.2 kg
External Review » HP Pavilion Power 15-cb005ns
HP Omen 17-an026ns: NVIDIA GeForce GTX 1050 Mobile, 17.30", 3.8 kg
External Review » HP Omen 17-an026ns
Acer Predator Helios 300 PH317-51-76Y2: NVIDIA GeForce GTX 1050 Ti Mobile, 17.30", 3 kg
External Review » Acer Predator Helios 300 PH317-51-76Y2
MSI PE62 7RD-1814XES: NVIDIA GeForce GTX 1050 Mobile, 15.60", 2.2 kg
External Review » MSI PE62 7RD-1814XES
MSI GF72 7RE-1055XES: NVIDIA GeForce GTX 1070 Mobile, 17.30", 2.7 kg
External Review » MSI GF72 7RE-1055XES
MSI GE63 Raider 7RD-021XES: NVIDIA GeForce GTX 1050 Ti Mobile, 15.60", 2.4 kg
External Review » MSI GE63 Raider 7RD-021XES
Asus GL502VS-GZ226T: NVIDIA GeForce GTX 1070 Mobile, 15.60", 2.3 kg
External Review » Asus GL502VS-GZ226T
MSI GL62MVR 7RFX-1272XES: NVIDIA GeForce GTX 1060 Mobile, 15.60", 2.2 kg
External Review » MSI GL62MVR 7RFX-1272XES
MSI GL72MVR 7RFX-864XES: NVIDIA GeForce GTX 1060 Mobile, 17.30", 2.7 kg
External Review » MSI GL72MVR 7RFX-864XES
MSI GL62M 7REX-2201XES: NVIDIA GeForce GTX 1050 Ti Mobile, 15.60", 2.2 kg
External Review » MSI GL62M 7REX-2201XES
MSI GP62M Leopard 7RDX-1809ES: NVIDIA GeForce GTX 1050 Mobile, 15.60", 2.2 kg
External Review » MSI GP62M Leopard 7RDX-1809ES
HP Pavilion 17-ab309ng: NVIDIA GeForce GTX 1050 Ti Mobile, 17.30", 2.9 kg
External Review » HP Pavilion 17-ab309ng
Xiaomi Mi Gaming Laptop 7700HQ 1060: NVIDIA GeForce GTX 1060 Mobile, 15.60", 2.7 kg
External Review » Xiaomi Mi Gaming Laptop 7700HQ 1060
MSI GP72M 7REX-1245NL Leopard Pro: NVIDIA GeForce GTX 1050 Ti Mobile, 17.30", 2.7 kg
External Review » MSI GP72M 7REX-1245NL Leopard Pro
Asus ZenBook Pro UX550VE-E3130T: NVIDIA GeForce GTX 1050 Ti Mobile, 15.60", 1.8 kg
External Review » Asus ZenBook Pro UX550VE-E3130T
Acer Aspire 7 A715-71G-71Q5: NVIDIA GeForce GTX 1050 Ti Mobile, 15.60", 2.4 kg
External Review » Acer Aspire 7 A715-71G-71Q5
MSI GL62M 7REX-2281NL: NVIDIA GeForce GTX 1050 Ti Mobile, 15.60", 2.2 kg
External Review » MSI GL62M 7REX-2281NL
MSI PE62 7RE-2494IT: NVIDIA GeForce GTX 1050 Ti Mobile, 15.60", 2.3 kg
External Review » MSI PE62 7RE-2494IT
Acer Predator Helios 300 G3-572-7056: NVIDIA GeForce GTX 1050 Ti Mobile, 15.60", 2.7 kg
External Review » Acer Predator Helios 300 G3-572-7056
Acer Aspire VX5-591G-70AD: NVIDIA GeForce GTX 1050 Mobile, 15.60", 2.5 kg
External Review » Acer Aspire VX5-591G-70AD
Dell Vostro 15 7570: NVIDIA GeForce GTX 1050 Ti Mobile, 15.60", 2.7 kg
External Review » Dell Vostro 15 7570
Acer Nitro 5 AN515-51-788E: NVIDIA GeForce GTX 1050 Ti Mobile, 15.60", 2.7 kg
External Review » Acer Nitro 5 AN515-51-788E
HP OMEN 15-ce006ns: NVIDIA GeForce GTX 1060 Mobile, 15.60", 2.6 kg
External Review » HP OMEN 15-ce006ns
Asus G752VS-GC310T: NVIDIA GeForce GTX 1070 Mobile, 17.30", 4.3 kg
External Review » Asus G752VS-GC310T
Acer Aspire Nitro VN7-793G-77RA: NVIDIA GeForce GTX 1050 Ti Mobile, 17.30", 3.1 kg
External Review » Acer Aspire Nitro VN7-793G-77RA
Dell XPS 15 9560-F5WWG: NVIDIA GeForce GTX 1050 Mobile, 15.60", 1.9 kg
External Review » Dell XPS 15 9560-F5WWG
Asus FX503VD-E4082T: NVIDIA GeForce GTX 1050 Mobile, 15.60", 2.6 kg
External Review » Asus FX503VD-E4082T
MSI GE63VR 7RF-252XES: NVIDIA GeForce GTX 1070 Mobile, 15.60", 2.4 kg
External Review » MSI GE63VR 7RF-252XES
HP Omen 15-cn018ns: NVIDIA GeForce GTX 1060 Mobile, 15.60", 2.6 kg
External Review » HP Omen 15-cn018ns
Acer Aspire 7 A717-71G-74LF: NVIDIA GeForce GTX 1050 Ti Mobile, 17.30", 3 kg
External Review » Acer Aspire 7 A717-71G-74LF
Asus GL503VM-GZ098T Strix Hero Edition: NVIDIA GeForce GTX 1060 Mobile, 15.60", 2.6 kg
External Review » Asus GL503VM-GZ098T Strix Hero Edition
Razer Blade (2017) UHD: NVIDIA GeForce GTX 1060 Mobile, 14.00", 1.9 kg
External Review » Razer Blade (2017) UHD
MSI GP62M 7REX-2621MY: NVIDIA GeForce GTX 1050 Ti Mobile, 15.60", 2.2 kg
External Review » MSI GP62M 7REX-2621MY
Asus FX503VM-EH73: NVIDIA GeForce GTX 1060 Mobile, 15.60", 2.2 kg
External Review » Asus FX503VM-EH73
Asus FX503VD-E4035T: NVIDIA GeForce GTX 1050 Mobile, 15.60", 2.2 kg
External Review » Asus FX503VD-E4035T
Asus Strix GL702VI-BA036T: NVIDIA GeForce GTX 1080 Mobile, 17.30", 3.2 kg
External Review » Asus Strix GL702VI-BA036T
Acer Nitro 5 AN515-51-79N0: NVIDIA GeForce GTX 1050 Ti Mobile, 15.60", 2.7 kg
External Review » Acer Nitro 5 AN515-51-79N0
HP Omen 17-an014ng: NVIDIA GeForce GTX 1070 Mobile, 17.30", 3.8 kg
External Review » HP Omen 17-an014ng
Acer Nitro 5 AN515-51-75FR: NVIDIA GeForce GTX 1050 Mobile, 15.60", 2.7 kg
External Review » Acer Nitro 5 AN515-51-75FR
MSI GL62M 7RD-223CN: NVIDIA GeForce GTX 1050 Mobile, 15.60", 2.3 kg
External Review » MSI GL62M 7RD-223CN
MSI GS63 7RE-052IT Stealth Pro: NVIDIA GeForce GTX 1050 Ti Mobile, 15.60", 1.8 kg
External Review » MSI GS63 7RE-052IT Stealth Pro
Asus GL753VD-GC011: NVIDIA GeForce GTX 1050 Mobile, 17.30", 3 kg
External Review » Asus GL753VD-GC011
Acer Predator Helios 300 G3-572-74QP: NVIDIA GeForce GTX 1060 Mobile, 15.60", 2.7 kg
External Review » Acer Predator Helios 300 G3-572-74QP
MSI GS63 7RD-076NL: NVIDIA GeForce GTX 1050 Mobile, 15.60", 1.8 kg
External Review » MSI GS63 7RD-076NL
MSI GF62VR 7RF-1013NL: NVIDIA GeForce GTX 1060 Mobile, 15.60", 2.2 kg
External Review » MSI GF62VR 7RF-1013NL
MSI GE63VR Raider 4K-212: NVIDIA GeForce GTX 1070 Mobile, 15.60", 2.4 kg
External Review » MSI GE63VR Raider 4K-212
MSI GE63VR Raider-213: NVIDIA GeForce GTX 1070 Mobile, 15.60", 2.4 kg
External Review » MSI GE63VR Raider-213
Asus GL703VD-WB71: NVIDIA GeForce GTX 1050 Mobile, 17.30", 3 kg
External Review » Asus GL703VD-WB71
Asus GL503VS-EI011T Strix Scar Edition: NVIDIA GeForce GTX 1070 Mobile, 15.60", 2.5 kg
External Review » Asus GL503VS-EI011T Strix Scar Edition
Asus GL503VM-ED091T Strix Scar Edition: NVIDIA GeForce GTX 1060 Mobile, 15.60", 2.5 kg
External Review » Asus GL503VM-ED091T Strix Scar Edition
Asus Strix GL703VM-DB74: NVIDIA GeForce GTX 1060 Mobile, 17.30", 2.7 kg
External Review » Asus Strix GL703VM-DB74
HP Omen 17-an090nz: NVIDIA GeForce GTX 1070 Mobile, 17.30", 3.8 kg
External Review » HP Omen 17-an090nz
Lenovo Ideapad Y520-15IKBN-80WK00TBSP: NVIDIA GeForce GTX 1050 Ti Mobile, 15.60", 2.5 kg
External Review » Lenovo Ideapad Y520-15IKBN-80WK00TBSP
Acer Predator Helios 300 G3-572-77XZ: NVIDIA GeForce GTX 1060 Mobile, 15.60", 2.7 kg
External Review » Acer Predator Helios 300 G3-572-77XZ
Acer Nitro 5 AN515-51-76CN: NVIDIA GeForce GTX 1050 Ti Mobile, 15.60", 2.7 kg
External Review » Acer Nitro 5 AN515-51-76CN
Asus Zenbook Pro UX550VE-BO104T: NVIDIA GeForce GTX 1050 Ti Mobile, 15.60", 1.8 kg
External Review » Asus Zenbook Pro UX550VE-BO104T
Dell Inspiron 15 7577-0074: NVIDIA GeForce GTX 1050 Ti Mobile, 15.60", 2.7 kg
External Review » Dell Inspiron 15 7577-0074
HP Omen 15-ce003nl: NVIDIA GeForce GTX 1050 Mobile, 15.60", 2.6 kg
External Review » HP Omen 15-ce003nl
Lenovo Legion Y720-15IKB-80VR002MFR: NVIDIA GeForce GTX 1060 Mobile, 15.60", 3.1 kg
External Review » Lenovo Legion Y720-15IKB-80VR002MFR
Asus Strix GL503VS-DH74 Scar Edition: NVIDIA GeForce GTX 1070 Mobile, 15.60", 2.4 kg
External Review » Asus Strix GL503VS-DH74 Scar Edition
Gigabyte Sabre 17W-DE022T: NVIDIA GeForce GTX 1060 Mobile, 17.30", 2.5 kg
External Review » Gigabyte Sabre 17W-DE022T
MSI PE72 7RD-1040XES: NVIDIA GeForce GTX 1050 Mobile, 17.30", 2.7 kg
External Review » MSI PE72 7RD-1040XES
MSI GV62 7RD-1811ES: NVIDIA GeForce GTX 1050 Mobile, 15.60", 2.2 kg
External Review » MSI GV62 7RD-1811ES
HP Pavilion Power 15-cb012ns: NVIDIA GeForce GTX 1050 Mobile, 15.60", 2.2 kg
External Review » HP Pavilion Power 15-cb012ns
MSI GS63VR 7RD-092NL: NVIDIA GeForce GTX 1050 Mobile, 15.60", 1.8 kg
External Review » MSI GS63VR 7RD-092NL
MSI GE62VR 7RF-298NL Apache Pro: NVIDIA GeForce GTX 1060 Mobile, 15.60", 2.4 kg
External Review » MSI GE62VR 7RF-298NL Apache Pro
Asus GL553VD-DM067T: NVIDIA GeForce GTX 1050 Mobile, 15.60", 2.5 kg
External Review » Asus GL553VD-DM067T
Lenovo Ideapad Y520-15IKBN-80WK00GXSP: NVIDIA GeForce GTX 1050 Mobile, 15.60", 2.5 kg
External Review » Lenovo Ideapad Y520-15IKBN-80WK00GXSP
Lenovo Legion Y720-15IKB-80VR007USP: NVIDIA GeForce GTX 1060 Mobile, 15.60", 3.2 kg
External Review » Lenovo Legion Y720-15IKB-80VR007USP
HP Omen 15-CE086TX: NVIDIA GeForce GTX 1050 Ti Mobile, 15.60", 2.6 kg
External Review » HP Omen 15-CE086TX
HP Omen 15-ce085tx: NVIDIA GeForce GTX 1050 Mobile, 15.60", 2.6 kg
External Review » HP Omen 15-ce085tx
Asus VivoBook Pro 15 N580VD-DM028T: NVIDIA GeForce GTX 1050 Mobile, 15.60", 2 kg
External Review » Asus VivoBook Pro 15 N580VD-DM028T
Asus GL503VD Hero Edition: NVIDIA GeForce GTX 1050 Mobile, 15.60", 2.3 kg
External Review » Asus GL503VD Hero Edition
Schenker Key 15: NVIDIA GeForce GTX 1060 Mobile, 15.60", 2.2 kg
External Review » Schenker Key 15
MSI GE62VR 7RF-652 Camo Squad Limited Edition: NVIDIA GeForce GTX 1060 Mobile, 15.60", 2.4 kg
External Review » MSI GE62VR 7RF-652 Camo Squad Limited Edition
Lenovo Legion Y520-15IKBN-255: NVIDIA GeForce GTX 1050 Ti Mobile, 15.60", 2.4 kg
External Review » Lenovo Legion Y520-15IKBN-255
Acer Aspire Nitro 5 AN515-51-720N: NVIDIA GeForce GTX 1050 Ti Mobile, 15.60", 2 kg
External Review » Acer Aspire Nitro 5 AN515-51-720N
HP Omen 17-an010ns: NVIDIA GeForce GTX 1070 Mobile, 17.30", 3.8 kg
External Review » HP OMEN 17-an010ns
HP Omen 15-CE007NT: NVIDIA GeForce GTX 1060 Mobile, 15.60", 2.6 kg
External Review » HP Omen 15-CE007NT
Asus ZX53VD7700-158BSHQ2X11: NVIDIA GeForce GTX 1050 Mobile, 15.60", 2.5 kg
External Review » Asus ZX53VD7700-158BSHQ2X11
HP Omen 17-an009tx: NVIDIA GeForce GTX 1070 Mobile, 17.30", 3.8 kg
External Review » HP Omen 17-an009tx
MSI GT75VR Titan Pro-215: NVIDIA GeForce GTX 1080 Mobile, 17.30", 4.1 kg
External Review » MSI GT75VR Titan Pro-215
MSI GS63VR Stealth Pro-078: NVIDIA GeForce GTX 1070 Mobile, 15.60", 1.8 kg
External Review » MSI GS63VR Stealth Pro-078
Asus Strix GL503VD-FY126T: NVIDIA GeForce GTX 1050 Mobile, 15.60", 2.5 kg
External Review » Asus Strix GL503VD-FY126T
Asus FX503VD-EH73: NVIDIA GeForce GTX 1050 Mobile, 15.60", 2.2 kg
External Review » Asus FX503VD-EH73
Asus Zenbook Pro UX550VE-DB71T: NVIDIA GeForce GTX 1050 Ti Mobile, 15.60", 1.9 kg
External Review » Asus Zenbook Pro UX550VE-DB71T
MSI GS73VR 7RG-003 Stealth Pro: NVIDIA GeForce GTX 1070 Max-Q, 17.30", 2.4 kg
External Review » MSI GS73VR 7RG-003 Stealth Pro
MSI GE63VR 7RF-039 Raider: NVIDIA GeForce GTX 1070 Mobile, 15.60", 2.2 kg
External Review » MSI GE63VR 7RF-039 Raider
Acer Nitro 5 AN515-51-71B5: NVIDIA GeForce GTX 1050 Ti Mobile, 15.60", 2.7 kg
External Review » Acer Nitro 5 AN515-51-71B5
Acer Aspire 7 A715-71G-70FK: NVIDIA GeForce GTX 1050 Ti Mobile, 15.60", 2.4 kg
External Review » Acer Aspire 7 A715-71G-70FK
Acer Predator Helios 300 G3-572-763V: NVIDIA GeForce GTX 1060 Mobile, 15.60", 2.7 kg
External Review » Acer Predator Helios 300 G3-572-763V
HP OMEN 15-ce002ns: NVIDIA GeForce GTX 1060 Mobile, 15.60", 2.6 kg
External Review » HP OMEN 15-ce002ns
Acer Aspire VX5-591G-77SQ: NVIDIA GeForce GTX 1050 Ti Mobile, 15.60", 2.5 kg
External Review » Acer Aspire VX5-591G-77SQ
Asus GL553VD-DM078T: NVIDIA GeForce GTX 1050 Mobile, 15.60", 2.5 kg
External Review » Asus GL553VD-DM078T
Asus Strix GL753VD-GC387T: NVIDIA GeForce GTX 1050 Mobile, 17.30", 2.8 kg
External Review » Asus Strix GL753VD-GC387T
Acer Aspire 7 A715-71G-79BN: NVIDIA GeForce GTX 1050 Mobile, 15.60", 2.4 kg
External Review » Acer Aspire 7 A715-71G-79BN
Asus GL503VD-DB74: NVIDIA GeForce GTX 1050 Mobile, 15.60", 2.2 kg
External Review » Asus GL503VD-DB74
Dell Inspiron 15 7577-0098: NVIDIA GeForce GTX 1060 Max-Q, 15.60", 2.7 kg
External Review » Dell Inspiron 15 7577-0098
MSI GT72VR 7RD-441BE: NVIDIA GeForce GTX 1060 Mobile, 17.30", 3.8 kg
External Review » MSI GT72VR 7RD-441BE
MSI GV72 7RE-862RU: NVIDIA GeForce GTX 1050 Ti Mobile, 17.30", 2.7 kg
External Review » MSI GV72 7RE-862RU
HP Omen 17-an008ur: NVIDIA GeForce GTX 1050 Ti Mobile, 17.30", 3.8 kg
External Review » HP Omen 17-an008ur
Asus Strix GL503VS-EI012T: NVIDIA GeForce GTX 1070 Mobile, 15.60", 2.5 kg
External Review » Asus Strix GL503VS-EI012T
Acer Aspire 7 A717-71G-72VY: NVIDIA GeForce GTX 1060 Mobile, 17.30", 2.9 kg
External Review » Acer Aspire 7 A717-71G-72VY
Acer Aspire V17 Nitro BE VN7-793-738J: NVIDIA GeForce GTX 1060 Mobile, 17.30", 3.1 kg
External Review » Acer Aspire V17 Nitro BE VN7-793-738J
MSI GT72VR 7RE-629XES Dominator Pro: NVIDIA GeForce GTX 1070 Mobile, 17.30", 3.8 kg
External Review » MSI GT72VR 7RE-629XES Dominator Pro
Gigabyte Aero 15W-CF2 : NVIDIA GeForce GTX 1060 Mobile, 15.60", 2.1 kg
External Review » Gigabyte Aero 15W-CF2
Asus Strix GL503VM-DB74 Hero Edition: NVIDIA GeForce GTX 1060 Mobile, 15.60", 2.5 kg
External Review » Asus Strix GL503VM-DB74 Hero Edition
HP Pavilion Power 15-cb012na: NVIDIA GeForce GTX 1050 Mobile, 15.60", 2.4 kg
External Review » HP Pavilion Power 15-cb012na
MSI WE72 7RJ-1067RU: NVIDIA Quadro M2200, 17.30", 2.7 kg
External Review » MSI WE72 7RJ-1067RU
MSI WE62 7RI-1880RU: NVIDIA Quadro M1200, 15.60", 2.4 kg
External Review » MSI WE62 7RI-1880RU
Asus ZenBook Pro UX550VD-BN032T: NVIDIA GeForce GTX 1050 Mobile, 15.60", 1.8 kg
External Review » Asus ZenBook Pro UX550VD-BN032T
Acer Aspire 7 A715-71G-72WV: NVIDIA GeForce GTX 1050 Ti Mobile, 15.60", 2.4 kg
External Review » Acer Aspire 7 A715-71G-72WV
Asus Zenbook Pro UX550VE-BN072R: NVIDIA GeForce GTX 1050 Ti Mobile, 15.60", 1.8 kg
External Review » Asus Zenbook Pro UX550VE-BN072R
Alienware 17 R4-A17-0289: NVIDIA GeForce GTX 1070 Mobile, 17.30", 4.4 kg
External Review » Alienware 17 R4-A17-0289
Lenovo Yoga 720-15IKB-80X7001WUS: NVIDIA GeForce GTX 1050 Mobile, 15.60", 2 kg
External Review » Lenovo Yoga 720-15IKB-80X7001WUS
Lenovo Ideapad Y520-15IKBN-80WK00WNSP: NVIDIA GeForce GTX 1050 Mobile, 15.60", 2.5 kg
External Review » Lenovo Ideapad Y520-15IKBN-80WK00WNSP
MSI GE63VR 7RE-093XES Raider: NVIDIA GeForce GTX 1060 Mobile, 15.60", 2.4 kg
External Review » MSI GE63VR 7RE-093XES Raider
MSI GE72 7RE-668XES: NVIDIA GeForce GTX 1050 Ti Mobile, 17.30", 2.7 kg
External Review » MSI GE72 7RE-668XES
Asus Vivobook Pro N580VD-DM471T: NVIDIA GeForce GTX 1050 Mobile, 15.60", 2 kg
External Review » Asus Vivobook Pro N580VD-DM471T
Asus Strix GL503VD-DB71: NVIDIA GeForce GTX 1050 Mobile, 15.60", 2.2 kg
External Review » Asus Strix GL503VD-DB71
Asus VivoBook Pro 15 N580VD-DB74T: NVIDIA GeForce GTX 1050 Mobile, 15.60", 2 kg
External Review » Asus VivoBook Pro 15 N580VD-DB74T
MSI GT75VR 7RE Titan-018AU: NVIDIA GeForce GTX 1070 Mobile, 17.30", 4.5 kg
External Review » MSI GT75VR 7RE Titan-018AU
MSI GE63VR-001 Raider: NVIDIA GeForce GTX 1070 Mobile, 15.60", 2.4 kg
External Review » MSI GE63VR-001 Raider
MSI GS63VR 7RG-229: NVIDIA GeForce GTX 1060 Mobile, 15.60", 1.9 kg
External Review » MSI GS63VR 7RG-229
HP Pavilion Power 15-cb052tx: NVIDIA GeForce GTX 1050 Mobile, 15.60", 2.2 kg
External Review » HP Pavilion Power 15-cb052tx
Asus Strix Scar Edition GL703VM-EE129T: NVIDIA GeForce GTX 1060 Mobile, 17.30", 3 kg
External Review » Asus Strix Scar Edition GL703VM-EE129T
Asus Strix GL702VM-BA323T: NVIDIA GeForce GTX 1060 Mobile, 17.30", 2.7 kg
External Review » Asus Strix GL702VM-BA323T
Schenker XMG A707-nyd: NVIDIA GeForce GTX 1050 Ti Mobile, 17.30", 2.9 kg
External Review » Schenker XMG A707-nyd
HP OMEN 15-ce015ns: NVIDIA GeForce GTX 1050 Mobile, 15.60", 2.6 kg
External Review » HP OMEN 15-ce015ns
MSI GL72VR 7RF-632XES: NVIDIA GeForce GTX 1060 Mobile, 17.30", 2.7 kg
External Review » MSI GL72VR 7RF-632XES
MSI GL62MVR 7RFX-1046XES: NVIDIA GeForce GTX 1060 Mobile, 15.60", 2.7 kg
External Review » MSI GL62MVR 7RFX-1046XES
MSI GP62M 7RDX-1263NL: NVIDIA GeForce GTX 1050 Mobile, 15.60", 2.2 kg
External Review » MSI GP62M 7RDX-1263NL
Acer Predator Helios 300 PH317-51-71FF: NVIDIA GeForce GTX 1060 Mobile, 17.30", 3 kg
External Review » Acer Predator Helios 300 PH317-51-71FF
Asus GL502VS-FY313T: NVIDIA GeForce GTX 1070 Mobile, 15.60", 2.3 kg
External Review » Asus GL502VS-FY313T
Acer Predator Triton 700 PT715-51-71PP: NVIDIA GeForce GTX 1080 Mobile, 15.60", 2.4 kg
External Review » Acer Predator Triton 700 PT715-51-71PP
HP Omen 15-ce087tx: NVIDIA GeForce GTX 1060 Mobile, 15.60", 2.6 kg
External Review » HP Omen 15-ce087tx
Acer Predator Helios 300 PH317-51-78H7: NVIDIA GeForce GTX 1050 Ti Mobile, 15.60", 2.6 kg
External Review » Acer Predator Helios 300 PH317-51-78H7
Asus GL553VE-FY101T: NVIDIA GeForce GTX 1050 Ti Mobile, 15.60", 2.5 kg
External Review » Asus GL553VE-FY101T
Razer Blade Pro RZ09-0220: NVIDIA GeForce GTX 1060 Mobile, 17.30", 3.1 kg
External Review » Razer Blade Pro RZ09-0220
Acer Aspire 7 A717-71G-721V: NVIDIA GeForce GTX 1060 Mobile, 17.30", 2.9 kg
External Review » Acer Aspire 7 A717-71G-721V
HP Pavilion Power 15-CB018UR: NVIDIA GeForce GTX 1050 Mobile, 15.60", 2.2 kg
External Review » HP Pavilion Power 15-CB018UR
Asus GL502VM-FY377T: NVIDIA GeForce GTX 1060 Mobile, 15.60", 2.2 kg
External Review » Asus GL502VM-FY377T
MSI GE72MVR 7RG-050XES: NVIDIA GeForce GTX 1070 Mobile, 17.30", 2.9 kg
External Review » MSI GE72MVR 7RG-050XES
MSI GE73VR 7RF-031ES: NVIDIA GeForce GTX 1070 Mobile, 17.30", 2.8 kg
External Review » MSI GE73VR 7RF-031ES
HP Pavilion Power 15-cb091nd: NVIDIA GeForce GTX 1050 Mobile, 15.60", 2.2 kg
External Review » HP Pavilion Power 15-cb091nd
MSI GP62M 7REX-1289NL: NVIDIA GeForce GTX 1050 Ti Mobile, 15.60", 2.2 kg
External Review » MSI GP62M 7REX-1289NL
MSI GE63VR 7RF-005NL: NVIDIA GeForce GTX 1070 Mobile, 15.60", 2.2 kg
External Review » MSI GE63VR 7RF-005NL
Asus Strix GL703VD-GC029T: NVIDIA GeForce GTX 1050 Mobile, 17.30", 2.9 kg
External Review » Asus Strix GL703VD-GC029T
Medion Erazer X7853: NVIDIA GeForce GTX 1070 Mobile, 17.30", 3.5 kg
External Review » Medion Erazer X7853
Acer Aspire 7 A715-71G-76Z5: NVIDIA GeForce GTX 1050 Mobile, 15.60", 2.4 kg
External Review » Acer Aspire 7 A715-71G-76Z5
HP Pavilion Power 15-cb012no: NVIDIA GeForce GTX 1050 Mobile, 15.60", 2.2 kg
External Review » HP Pavilion Power 15-cb012no
MSI GV62 7RE-1810XES: NVIDIA GeForce GTX 1050 Ti Mobile, 15.60", 2.2 kg
External Review » MSI GV62 7RE-1810XES
MSI GE73VR 7RE-203XES Raider : NVIDIA GeForce GTX 1060 Mobile, 17.30", 2.8 kg
External Review » MSI GE73VR 7RE-203XES Raider
HP ZBook 17 G4-Y6K23E: NVIDIA Quadro M2200, 17.30", 3.1 kg
External Review » HP ZBook 17 G4-Y6K23E
Dell Inspiron 15 7567-716K: NVIDIA GeForce GTX 1050 Ti Mobile, 15.60", 2.6 kg
External Review » Dell Inspiron 15 7567-716K
Asus Zephyrus GX501VIK: NVIDIA GeForce GTX 1080 Max-Q, 15.60", 2.3 kg
External Review » Asus Zephyrus GX501VIK
Asus Zephyrus GX501VI-GZ021T: NVIDIA GeForce GTX 1080 Mobile, 15.60", 2.3 kg
External Review » Asus Zephyrus GX501VI-GZ021T
HP Pavilion Power 15-cb036ns: NVIDIA GeForce GTX 1050 Mobile, 15.60", 2.2 kg
External Review » HP Pavilion Power 15-cb036ns
HP OMEN 15-ce020ns: NVIDIA GeForce GTX 1050 Mobile, 15.60", 2.6 kg
External Review » HP OMEN 15-ce020ns
Lenovo Ideapad Y520-15IKBN-80WK00EXSP: NVIDIA GeForce GTX 1050 Ti Mobile, 15.60", 2.5 kg
External Review » Lenovo Ideapad Y520-15IKBN-80WK00EXSP
MSI GE62 7RE-094NL: NVIDIA GeForce GTX 1050 Ti Mobile, 15.60", 2.4 kg
External Review » MSI GE62 7RE-094NL
MSI GL62M 7REX-1448NL: NVIDIA GeForce GTX 1050 Ti Mobile, 15.60", 2.7 kg
External Review » MSI GL62M 7REX-1448NL
Acer Aspire V Nitro VN7-793G-74NP: NVIDIA GeForce GTX 1050 Ti Mobile, 17.30", 3.2 kg
External Review » Acer Aspire V Nitro VN7-793G-74NP
Asus Zenbook Pro UX550VD-BN073T: NVIDIA GeForce GTX 1050 Mobile, 15.60", 1.8 kg
External Review » Asus Zenbook Pro UX550VD-BN073T
Asus ZenBook Pro UX550VE-BN050T: NVIDIA GeForce GTX 1050 Ti Mobile, 15.60", 1.8 kg
External Review » Asus ZenBook Pro UX550VE-BN050T
Lenovo Legion Y920-17IKB 80YW0009RK: NVIDIA GeForce GTX 1070 Mobile, 17.30", 4.4 kg
External Review » Lenovo Legion Y920-17IKB 80YW0009RK
Asus Zephyrus GX501VI-GZ025T: NVIDIA GeForce GTX 1080 Mobile, 15.60", 2.3 kg
External Review » Asus Zephyrus GX501VI-GZ025T
Asus G752VS-BA263T: NVIDIA GeForce GTX 1070 Mobile, 17.30", 4.4 kg
External Review » Asus G752VS-BA263T
Gigabyte Aero 14-K7: NVIDIA GeForce GTX 1050 Ti Mobile, 14.00", 1.9 kg
External Review » Gigabyte Aero 14-K7
MSI GE73VR 7RF-039 Raider: NVIDIA GeForce GTX 1070 Mobile, 17.30", 2.8 kg
External Review » MSI GE73VR 7RF-039 Raider
HP Omen 17-an011ng: NVIDIA GeForce GTX 1050 Ti Mobile, 17.30", 3.8 kg
External Review » HP Omen 17-an011ng
MSI GL62M 7RDX-1655XES: NVIDIA GeForce GTX 1050 Mobile, 15.60", 2.2 kg
External Review » MSI GL62M 7RDX-1655XES
MSI GE62MVR 7RG-033XES: NVIDIA GeForce GTX 1070 Mobile, 15.60", 2.3 kg
External Review » MSI GE62MVR 7RG-033XES
MSI GP72M 7REX-687NL: NVIDIA GeForce GTX 1050 Ti Mobile, 17.30", 2.7 kg
External Review » MSI GP72M 7REX-687NL
Dell XPS 15 9560-15187550: NVIDIA GeForce GTX 1050 Mobile, 15.60", 2 kg
External Review » Dell XPS 15 9560-15187550
Gigabyte SabrePro 15W-KB3: NVIDIA GeForce GTX 1060 Mobile, 15.60", 2.5 kg
External Review » Gigabyte SabrePro 15W-KB3
Asus ZenBook Pro UX550VD-BN0: NVIDIA GeForce GTX 1050 Mobile, 15.60", 1.8 kg
External Review » Asus ZenBook Pro UX550VD-BN0
Asus ZenBook Pro UX550VD-BN005T: NVIDIA GeForce GTX 1050 Mobile, 15.60", 1.8 kg
External Review » Asus ZenBook Pro UX550VD-BN005T
Asus Strix GL553VD-DM535T: NVIDIA GeForce GTX 1050 Mobile, 15.60", 2.5 kg
External Review » Asus Strix GL553VD-DM535T
Asus R510VX-DM533T: NVIDIA GeForce GTX 1050 Mobile, 15.60", 2.5 kg
External Review » Asus R510VX-DM533T
MSI GE73VR 7RE Raider-042: NVIDIA GeForce GTX 1070 Mobile, 17.30", 2.8 kg
External Review » MSI GE73VR 7RE Raider-042
MSI GE72MVR 7RE Apache Pro-044: NVIDIA GeForce GTX 1070 Mobile, 17.30", 2.7 kg
External Review » MSI GE72MVR 7RE Apache Pro-044
MSI GP62X Leopard Pro-1045: NVIDIA GeForce GTX 1050 Ti Mobile, 15.60", 2.2 kg
External Review » MSI GP62X Leopard Pro-1045
MSI GE63VR 7RF-014CZ: NVIDIA GeForce GTX 1070 Mobile, 15.60", 2.4 kg
External Review » MSI GE63VR 7RF-014CZ
Hyperbook SL950VR : NVIDIA GeForce GTX 1060 Mobile, 15.60", 1.9 kg
External Review » Hyperbook SL950VR
HP Omen 17-w200nu: NVIDIA GeForce GTX 1070 Mobile, 17.30", 3.4 kg
External Review » HP Omen 17-w200nu
HP OMEN 15-ce099nf: NVIDIA GeForce GTX 1060 Mobile, 15.60", 2.6 kg
External Review » HP OMEN 15-ce099nf
Asus Strix GL502VMK: NVIDIA GeForce GTX 1060 Mobile, 15.60", 2.2 kg
External Review » Asus Strix GL502VMK
Gigabyte Sabre 17K-CF1: NVIDIA GeForce GTX 1050 Ti Mobile, 17.30", 2.5 kg
External Review » Gigabyte Sabre 17K-CF1
HP Omen X: NVIDIA GeForce GTX 1080 Mobile, 17.30", 4.9 kg
External Review » HP Omen X
Gigabyte SabrePro 15W-DE022T: NVIDIA GeForce GTX 1060 Mobile, 15.60", 2.5 kg
External Review » Gigabyte SabrePro 15W-DE022T
MSI WS63VR 7RL-023US: NVIDIA Quadro P4000 Max-Q, 15.60", 1.9 kg
External Review » MSI WS63VR 7RL-023US
MSI GS63VR 7RG: NVIDIA GeForce GTX 1070 Max-Q, 15.60", 1.9 kg
External Review » MSI GS63VR 7RG
Lenovo Legion Y720-80VR002HUS: NVIDIA GeForce GTX 1060 Mobile, 15.60", 3.1 kg
External Review » Lenovo Legion Y720-80VR002HUS
MSI GE63VR 7RE Raider-036: NVIDIA GeForce GTX 1060 Mobile, 15.60", 2.3 kg
External Review » MSI GE63VR 7RE Raider-036
Asus UX550VE (HID Edition): NVIDIA GeForce GTX 1050 Ti Mobile, 15.60", 1.9 kg
External Review » Asus UX550VE (HID Edition)
Asus ZenBook Pro UX550VD-BN020T: NVIDIA GeForce GTX 1050 Mobile, 15.60", 1.9 kg
External Review » Asus ZenBook Pro UX550VD-BN020T
MSI GS63VR Stealth Pro-002: NVIDIA GeForce GTX 1070 Max-Q, 15.60", 1.8 kg
External Review » MSI GS63VR Stealth Pro-002
Gigabyte Aero 15X: NVIDIA GeForce GTX 1070 Max-Q, 15.60", 2.2 kg
External Review » Gigabyte Aero 15X
Acer Predator Helios 300 PH317-51-78SZ: NVIDIA GeForce GTX 1060 Mobile, 17.30", 3 kg
External Review » Acer Predator Helios 300 PH317-51-78SZ
Gigabyte P56XT: NVIDIA GeForce GTX 1070 Mobile, 15.60", 2.7 kg
External Review » Gigabyte P56XT
MSI GE63VR 7RF Raider: NVIDIA GeForce GTX 1070 Mobile, 15.60", 2.4 kg
External Review » MSI GE63VR 7RF Raider
Acer Predator 17 G9-793-718K: NVIDIA GeForce GTX 1070 Mobile, 17.30", 3.9 kg
External Review » Acer Predator 17 G9-793-718K
MSI GP62MVR 7RF-400DE Leopard Pro: NVIDIA GeForce GTX 1060 Mobile, 15.60", 2.2 kg
External Review » MSI GP62MVR 7RF-400DE Leopard Pro
MSI GS73 7RE-017XES: NVIDIA GeForce GTX 1050 Mobile, 17.30", 2.4 kg
External Review » MSI GS73 7RE-017XES
MSI GS43VR 7RE-203XES: NVIDIA GeForce GTX 1060 Mobile, 14.00", 1.8 kg
External Review » MSI GS43VR 7RE-203XES
HP Pavilion Power 15-cb009ns: NVIDIA GeForce GTX 1050 Mobile, 15.60", 2.2 kg
External Review » HP Pavilion Power 15-cb009ns
MSI GE62 7RE-213ES: NVIDIA GeForce GTX 1050 Mobile, 15.60", 2.4 kg
External Review » MSI GE62 7RE-213ES
Schenker XMG A517: NVIDIA GeForce GTX 1060 Mobile, 15.60", 2.4 kg
External Review » Schenker XMG A517
HP Omen 15-ce002no: NVIDIA GeForce GTX 1060 Mobile, 15.60", 2.6 kg
External Review » HP Omen 15-ce002no
Asus FX553VD-90NB0DW4-M05730: NVIDIA GeForce GTX 1050 Mobile, 15.60", 2.5 kg
External Review » Asus FX553VD-90NB0DW4-M05730
Asus Zephyrus GX501VI-XS74: NVIDIA GeForce GTX 1080 Max-Q, 15.60", 2.3 kg
External Review » Asus Zephyrus GX501VI-XS74
HP Omen 15-ce013nu: NVIDIA GeForce GTX 1050 Ti Mobile, 15.60", 2.6 kg
External Review » HP Omen 15-ce013nu
Acer Predator Helios 300 PH317-51-720W: NVIDIA GeForce GTX 1060 Mobile, 17.30", 3 kg
External Review » Acer Predator Helios 300 PH317-51-720W
MSI PL62 7RC-051XES: NVIDIA GeForce MX150, 15.60", 2.2 kg
External Review » MSI PL62 7RC-051XES
MSI GP62 7RE-281XES: NVIDIA GeForce GTX 1050 Ti Mobile, 15.60", 2.4 kg
External Review » MSI GP62 7RE-281XES
Asus GL553VD-DM468T: NVIDIA GeForce GTX 1050 Mobile, 15.60", 2.5 kg
External Review » Asus GL553VD-DM468T
Asus Strix GL753VD-GC041T: NVIDIA GeForce GTX 1050 Mobile, 17.30", 2.8 kg
External Review » Asus Strix GL753VD-GC041T
HP Omen 15-ce008ns : NVIDIA GeForce GTX 1050 Mobile, 15.60", 2.6 kg
External Review » HP Omen 15-ce008ns
MSI GL62M 7REX-1252CN: NVIDIA GeForce GTX 1050 Ti Mobile, 15.60", 2.3 kg
External Review » MSI GL62M 7REX-1252CN
HP ZBook Studio G4-Y6K15EA: NVIDIA Quadro M1200, 15.60", 2.1 kg
External Review » HP ZBook Studio G4-Y6K15EA
HP Pavilion 17-ab203ur: NVIDIA GeForce GTX 1050 Mobile, 17.30", 2.9 kg
External Review » HP Pavilion 17-ab203ur
HP Pavilion Power 15-cb061nd: NVIDIA GeForce GTX 1050 Mobile, 15.60", 2.2 kg
External Review » HP Pavilion Power 15-cb061nd
MSI GP62 7REX-1045US: NVIDIA GeForce GTX 1050 Ti Mobile, 15.60", 2.5 kg
External Review » MSI GP62 7REX-1045US
Acer Aspire 7 A717-71G-58R1: NVIDIA GeForce GTX 1050 Ti Mobile, 17.30", 2.9 kg
External Review » Acer Aspire 7 A717-71G-58R1
Asus GL553VD-DM666T: NVIDIA GeForce GTX 1050 Mobile, 15.60", 2.5 kg
External Review » Asus GL553VD-DM666T
Lenovo R720-15IKB: NVIDIA GeForce GTX 1060 Mobile, 15.60", 2.4 kg
External Review » Lenovo R720-15IKB
Asus NX580VD: NVIDIA GeForce GTX 1050 Mobile, 15.60", 2.2 kg
External Review » Asus NX580VD
Schenker XMG A507: NVIDIA GeForce GTX 1050 Ti Mobile, 15.60", 2.4 kg
External Review » Schenker XMG A507
HP Omen 17-an016ng: NVIDIA GeForce GTX 1070 Mobile, 17.30", 3.8 kg
External Review » HP Omen 17-an016ng
HP Omen 17-w202ng: NVIDIA GeForce GTX 1060 Mobile, 17.30", 3.4 kg
External Review » HP Omen 17-w202ng
Medion Erazer X6603: NVIDIA GeForce GTX 1050 Ti Mobile, 15.60", 2.6 kg
External Review » Medion Erazer X6603
MSI GL72M 7RDX-680XES: NVIDIA GeForce GTX 1050 Mobile, 17.30", 2.7 kg
External Review » MSI GL72M 7RDX-680XES
MSI GS63 7RE-025ES Stealth Pro: NVIDIA GeForce GTX 1050 Ti Mobile, 15.60", 1.8 kg
External Review » MSI GS63 7RE-025ES Stealth Pro
Gigabyte Sabre 15G: NVIDIA GeForce GTX 1050 Mobile, 15.60", 2.5 kg
External Review » Gigabyte Sabre 15G
Acer Aspire VX5-591G-78F: NVIDIA GeForce GTX 1050 Mobile, 15.60", 2.5 kg
External Review » Acer Aspire VX5-591G-78F
HP Pavilion Power 15-cb033ns: NVIDIA GeForce GTX 1050 Mobile, 15.60", 2.2 kg
External Review » HP Pavilion Power 15-cb033ns
HP Pavilion Power 15-cb032ns: NVIDIA GeForce GTX 1050 Mobile, 15.60", 2.2 kg
External Review » HP Pavilion Power 15-cb032ns
HP OMEN 17-w204ur: NVIDIA GeForce GTX 1050 Ti Mobile, 17.30", 2.9 kg
External Review » HP OMEN 17-w204ur
MSI GE73VR 7RF Raider: NVIDIA GeForce GTX 1070 Mobile, 17.30", 2.9 kg
External Review » MSI GE73VR 7RF Raider
MSI GL62M 7RD-204NL: NVIDIA GeForce GTX 1050 Mobile, 15.60", 2.2 kg
External Review » MSI GL62M 7RD-204NL
Dell XPS 15 9560-NGG9X: NVIDIA GeForce GTX 1050 Mobile, 15.60", 1.8 kg
External Review » Dell XPS 15 9560-NGG9X
Lenovo Legion Y520-15-80WK005QMH: NVIDIA GeForce GTX 1050 Mobile, 15.60", 2.4 kg
External Review » Lenovo Legion Y520-15-80WK005QMH
Lenovo ThinkPad T470p-20J60018MH: NVIDIA GeForce 940MX, 14.00", 2 kg
External Review » Lenovo ThinkPad T470p-20J60018MH
Acer Aspire VX5-591G-7502: NVIDIA GeForce GTX 1050 Mobile, 15.60", 2.5 kg
External Review » Acer Aspire VX5-591G-7502
Lenovo Legion Y520-15IKBN-80WK001KUS: NVIDIA GeForce GTX 1050 Ti Mobile, 15.60", 2.5 kg
External Review » Lenovo Legion Y520-15IKBN-80WK001KUS
HP Omen 17-w202nu: NVIDIA GeForce GTX 1060 Mobile, 17.30", 3.4 kg
External Review » HP Omen 17-w202nu
Acer Aspire V15 Nitro BE VN7-593G-742C: NVIDIA GeForce GTX 1060 Mobile, 15.60"
External Review » Acer Aspire V15 Nitro BE VN7-593G-742C
Asus GL702VS-GC095T: NVIDIA GeForce GTX 1070 Mobile, 17.30", 2.9 kg
External Review » Asus GL702VS-GC095T
HP Omen 17-an015ng: NVIDIA GeForce GTX 1070 Mobile, 17.30", 3.8 kg
External Review » HP Omen 17-an015ng
MSI GP62 7RDX Leopard: NVIDIA GeForce GTX 1050 Mobile, 15.60", 2.4 kg
External Review » MSI GP62 7RDX Leopard
MSI WE72 7RJ-1040XES: NVIDIA Quadro M2200, 17.30", 2.7 kg
External Review » MSI WE72 7RJ-1040XES
MSI GL62M 7REX-1601XES: NVIDIA GeForce GTX 1050 Ti Mobile, 15.60", 2.2 kg
External Review » MSI GL62M 7REX-1601XES
MSI GE72VR 7RF-273NL Apache Pro: NVIDIA GeForce GTX 1060 Mobile, 17.30", 2.7 kg
External Review » MSI GE72VR 7RF-273NL Apache Pro
HP Pavilion Power 15-cb040nd: NVIDIA GeForce GTX 1050 Mobile, 15.60", 2.2 kg
External Review » HP Pavilion Power 15-cb040nd
MSI GP62M 7RD-014NL: NVIDIA GeForce GTX 1050 Mobile, 15.60", 2.2 kg
External Review » MSI GP62M 7RD-014NL
MSI WS63 7RK-429GB: NVIDIA Quadro P3000, 15.60", 1.8 kg
External Review » MSI WS63 7RK-429GB
Lenovo Ideapad Y520-15IKBN-80WK00FXSP: NVIDIA GeForce GTX 1050 Mobile, 15.60", 2.5 kg
External Review » Lenovo Ideapad Y520-15IKBN-80WK00FXSP
Asus Strix GL702VM-GC128T: NVIDIA GeForce GTX 1060 Mobile, 17.30", 2.7 kg
External Review » Asus Strix GL702VM-GC128T
HP Omen 15-ce002ng: NVIDIA GeForce GTX 1060 Max-Q, 15.60", 2.6 kg
External Review » HP Omen 15-ce002ng
MSI GP62M 7RDX (WOT Edition) -1276GB: NVIDIA GeForce GTX 1050 Mobile, 15.60", 2.2 kg
External Review » MSI GP62M 7RDX (WOT Edition) -1276GB
Acer Aspire 7 A715-71G-74QK: NVIDIA GeForce GTX 1050 Mobile, 15.60", 2.4 kg
External Review » Acer Aspire 7 A715-71G-74QK
Lenovo Yoga 720-15IKB-80X70043GE: NVIDIA GeForce GTX 1050 Mobile, 15.60", 2 kg
External Review » Lenovo Yoga 720-15IKB-80X70043GE
Gigabyte P34G v7: NVIDIA GeForce GTX 1050 Mobile, 14.00", 1.7 kg
External Review » Gigabyte P34G v7
Acer Predator Helios 300-G3-571: NVIDIA GeForce GTX 1060 Mobile, 15.60", 2.7 kg
External Review » Acer Predator Helios 300-G3-571
HP Pavilion Power 15-cb075tx: NVIDIA GeForce GTX 1050 Mobile, 15.60", 2.2 kg
External Review » HP Pavilion Power 15-cb075tx
MSI PL62 7RC-001: NVIDIA GeForce MX150, 15.60", 2.2 kg
External Review » MSI PL62 7RC-001
MSI GP72 7REX-612XES Leopard Pro: NVIDIA GeForce GTX 1050 Ti Mobile, 17.30", 2.7 kg
External Review » MSI GP72 7REX-612XES Leopard Pro
MSI PE70 7RD-644XES: NVIDIA GeForce GTX 1050 Mobile, 17.30", 2.7 kg
External Review » MSI PE70 7RD-644XES
MSI GS63 7RE-026XES: NVIDIA GeForce GTX 1050 Ti Mobile, 15.60", 1.8 kg
External Review » MSI GS63 7RE-026XES
MSI GT72VR 7RD-462XES: NVIDIA GeForce GTX 1060 Mobile, 17.30", 3.8 kg
External Review » MSI GT72VR 7RD-462XES
MSI GP72 7RDX-488XRU Leopard: NVIDIA GeForce GTX 1050 Mobile, 17.30", 2.7 kg
External Review » MSI GP72 7RDX-488XRU Leopard
HP Omen 17-w200ns: NVIDIA GeForce GTX 1060 Mobile, 17.30", 3.4 kg
External Review » HP Omen 17-w200ns
Lenovo Legion Y520-15IKBN-80WK00J0SP: NVIDIA GeForce GTX 1050 Ti Mobile, 15.60", 2.4 kg
External Review » Lenovo Legion Y520-15IKBN-80WK00J0SP
MSI GS73VR-7RF-273TR: NVIDIA GeForce GTX 1060 Mobile, 17.30", 2.4 kg
External Review » MSI GS73VR-7RF-273TR
Dell Inspiron 15 7567-9323: NVIDIA GeForce GTX 1050 Ti Mobile, 15.60", 2.7 kg
External Review » Dell Inspiron 15 7567-9323
MSI GP62M 7RD Leopard - 7RD-076DE: NVIDIA GeForce GTX 1050 Mobile, 15.60", 2.2 kg
External Review » MSI GP62M 7RD Leopard - 7RD-076DE
Asus Strix GL502VM-FY198T: NVIDIA GeForce GTX 1060 Mobile, 15.60", 2.2 kg
External Review » Asus Strix GL502VM-FY198T
MSI GE72MVR 7RG-046: NVIDIA GeForce GTX 1070 Mobile, 17.30", 2.7 kg
External Review » MSI GE72MVR 7RG-046
LG 15GD870-XX70K: NVIDIA GeForce GTX 1060 Mobile, 15.60", 2.5 kg
External Review » LG 15GD870-XX70K
MSI GS63VR 7RG-006DE: NVIDIA GeForce GTX 1070 Mobile, 15.60", 1.8 kg
External Review » MSI GS63VR 7RG-006DE
Origin PC Eon15-S 2017: NVIDIA GeForce GTX 1050 Ti Mobile, 15.60", 2.3 kg
External Review » Origin PC Eon15-S 2017
Asus VivoBook Pro 15 N580VD: NVIDIA GeForce GTX 1050 Mobile, 15.60", 2 kg
External Review » Asus VivoBook Pro 15 N580VD
Asus ZenBook Pro UX550VE: NVIDIA GeForce GTX 1050 Ti Mobile, 15.60", 1.9 kg
External Review » Asus ZenBook Pro UX550VE
MSI GS63 7RE-011 Stealth Pro: NVIDIA GeForce GTX 1050 Ti Mobile, 15.60", 1.8 kg
External Review » MSI GS63 7RE-011 Stealth Pro
HP Omen 15-ax204ng: NVIDIA GeForce GTX 1050 Ti Mobile, 15.60", 2.2 kg
External Review » HP Omen 15-ax204ng
Apple MacBook Pro 15 2017 (2.8 GHz, 555): AMD Radeon Pro 555, 15.40", 1.8 kg
External Review » Apple MacBook Pro 15 2017 (2.8 GHz, 555)
Asus Strix ZX753VD-GC266T: NVIDIA GeForce GTX 1050 Mobile, 17.30", 3 kg
External Review » Asus Strix ZX753VD-GC266T
HP Omen 17-w216ng: NVIDIA GeForce GTX 1070 Mobile, 17.30", 3.4 kg
External Review » HP Omen 17-w216ng
MSI WE62 7RJ-1833US: NVIDIA Quadro M2200, 15.60", 2.4 kg
External Review » MSI WE62 7RJ-1833US
Acer Aspire VX5-591G-74CU: NVIDIA GeForce GTX 1050 Mobile, 15.60", 2.6 kg
External Review » Acer Aspire VX5-591G-74CU
HP Omen 17-w270nd: NVIDIA GeForce GTX 1070 Mobile, 17.30", 3.4 kg
External Review » HP Omen 17-w270nd
BTO Notebooks X-Book 17CL79: NVIDIA GeForce GTX 1080 Mobile, 17.30", 3.9 kg
External Review » BTO Notebooks X-Book 17CL79
Asus Zephyrus GX501: NVIDIA GeForce GTX 1080 Max-Q, 15.60", 2.3 kg
External Review » Asus Zephyrus GX501
MSI GL62M 7RDX-1096: NVIDIA GeForce GTX 1050 Mobile, 15.60", 2.4 kg
External Review » MSI GL62M 7RDX-1096
MSI PE70 7RD-086ES: NVIDIA GeForce GTX 1050 Mobile, 17.30", 2.7 kg
External Review » MSI PE70 7RD-086ES
MSI GP62 7RE-431XES: NVIDIA GeForce GTX 1050 Ti Mobile, 15.60", 2.4 kg
External Review » MSI GP62 7RE-431XES
Lenovo Legion Y520-15-80WK004TMH: NVIDIA GeForce GTX 1050 Mobile, 15.60", 2.4 kg
External Review » Lenovo Legion Y520-15-80WK004TMH
Lenovo Yoga 720-15IKB: NVIDIA GeForce GTX 1050 Mobile, 15.60", 2 kg
External Review » Lenovo Yoga 720-15IKB
Acer Aspire VX5-591G-73FR: NVIDIA GeForce GTX 1050 Mobile, 15.60", 2.5 kg
External Review » Acer Aspire VX5-591G-73FR
HP Omen 17-w201ns: NVIDIA GeForce GTX 1070 Mobile, 17.30", 3.4 kg
External Review » HP Omen 17-w201ns
HP Omen 17-w203ns: NVIDIA GeForce GTX 1050 Mobile, 17.30", 3.4 kg
External Review » HP Omen 17-w203ns
MSI GE62MVR 7RG-012 Apache Pro: NVIDIA GeForce GTX 1070 Mobile, 15.60", 2.4 kg
External Review » MSI GE62MVR 7RG-012 Apache Pro
Gigabyte P57W V7 : NVIDIA GeForce GTX 1060 Mobile, 17.30", 4 kg
External Review » Gigabyte P57W V7
Asus GL553VE-FY022T: NVIDIA GeForce GTX 1050 Ti Mobile, 15.60", 2.5 kg
External Review » Asus GL553VE-FY022T
Gigabyte Sabre 15K-DE022T: NVIDIA GeForce GTX 1050 Ti Mobile, 15.60", 2.5 kg
External Review » Gigabyte Sabre 15K-DE022T
Asus Strix GL702VSK: NVIDIA GeForce GTX 1070 Mobile, 17.30", 2.9 kg
External Review » Asus Strix GL702VSK
Lenovo Legion Y720 80VR002XGE: NVIDIA GeForce GTX 1060 Mobile, 15.60", 3.1 kg
External Review » Lenovo Lenovo Legion Y720 80VR002XGE
HP Omen 17-w203no: NVIDIA GeForce GTX 1070 Mobile, 17.30", 3.4 kg
External Review » HP Omen 17-w203no
MSI GP62MVR 7RF-477XES: NVIDIA GeForce GTX 1060 Mobile, 15.60", 2.2 kg
External Review » MSI GP62MVR 7RF-477XES
MSI GT62VR 7RE-246XES: NVIDIA GeForce GTX 1070 Mobile, 15.60", 2.9 kg
External Review » MSI GT62VR 7RE-246XES
BTO Notebooks X-Book 15CL77: NVIDIA GeForce GTX 1060 Mobile, 15.60", 2.6 kg
External Review » BTO Notebooks X-Book 15CL77
MSI GE72VR 7RF-439RU Apache Pro: NVIDIA GeForce GTX 1060 Mobile, 17.30", 2.7 kg
External Review » MSI GE72VR 7RF-439RU Apache Pro
Asus Strix GL753VD-GC042T: NVIDIA GeForce GTX 1050 Mobile, 17.30", 3 kg
External Review » Asus Strix GL753VD-GC042T
Asus Strix GL502VM-FY163T: NVIDIA GeForce GTX 1060 Mobile, 15.60", 2.2 kg
External Review » Asus Strix GL502VM-FY163T
HP Omen 15-ax208ns : NVIDIA GeForce GTX 1050 Mobile, 15.60", 2.2 kg
External Review » HP Omen 15-ax208ns
Acer Predator Helios 300: NVIDIA GeForce GTX 1060 Mobile, 17.30", 2.9 kg
External Review » Acer Predator Helios 300
MSI GP72VR 7RFX: NVIDIA GeForce GTX 1060 Mobile, 17.30", 2.8 kg
External Review » MSI GP72VR 7RFX
Samsung Odyssey NP800G5M-X01US: NVIDIA GeForce GTX 1050 Mobile, 15.60", 2.5 kg
External Review » Samsung Odyssey NP800G5M-X01US
Asus G752VSK-77B07SB1: NVIDIA GeForce GTX 1070 Mobile, 17.30", 3.9 kg
External Review » Asus G752VSK-77B07SB1
MSI GT72VR 7RE-469XTR Dominator Pro: NVIDIA GeForce GTX 1070 Mobile, 17.30", 3.8 kg
External Review » MSI GT72VR 7RE-469XTR Dominator Pro
Lenovo Legion Y520-15IKB-80WK00BTCK: NVIDIA GeForce GTX 1050 Ti Mobile, 15.60", 2.4 kg
External Review » Lenovo Legion Y520-15IKB-80WK00BTCK
Razer Blade (2017): NVIDIA GeForce GTX 1060 Mobile, 14.00", 1.8 kg
External Review » Razer Blade (2017)
Asus GL553VD-FY025T: NVIDIA GeForce GTX 1050 Mobile, 15.60", 2.5 kg
External Review » Asus GL553VD-FY025T
Acer Aspire VN7-593G-73KV: NVIDIA GeForce GTX 1060 Mobile, 15.60", 2.6 kg
External Review » Acer Aspire VN7-593G-73KV
MSI GP72 7RE Leopard Pro: NVIDIA GeForce GTX 1050 Ti Mobile, 17.30", 2.7 kg
External Review » MSI GP72 7RE Leopard Pro
Razer Blade 2017 UHD, Kaby Lake: NVIDIA GeForce GTX 1060 Mobile, 14.00", 2 kg
External Review » Razer Blade 2017 UHD, Kaby Lake
MSI GS73 Stealth Pro-009: NVIDIA GeForce GTX 1050 Ti Mobile, 17.30", 2.4 kg
External Review » MSI GS73 Stealth Pro-009
Lenovo Legion Y520-15IKBN-80WK00F7GE: NVIDIA GeForce GTX 1050 Ti Mobile, 15.60", 2.4 kg
External Review » Lenovo Legion Y520-15IKBN-80WK00F7GE
MSI WE72 7RJ: NVIDIA Quadro M2200, 17.30", 2.9 kg
External Review » MSI WE72 7RJ
MSI GL62 7QF-1660: NVIDIA GeForce GTX 960M, 15.60", 2.4 kg
External Review » MSI GL62 7QF-1660
MSI GT62VR Dominator Pro-238: NVIDIA GeForce GTX 1070 Mobile, 15.60", 2.9 kg
External Review » MSI GT62VR Dominator Pro-238
MSI GS63VR 7RF-211UK Stealth Pro: NVIDIA GeForce GTX 1060 Mobile, 15.60", 1.9 kg
External Review » MSI GS63VR 7RF-211UK Stealth Pro
MSI GL62M 7RD-077: NVIDIA GeForce GTX 1050 Mobile, 15.60", 2.4 kg
External Review » MSI GL62M 7RD-077
Acer Predator Triton 700: NVIDIA GeForce GTX 1080 Max-Q, 15.60", 2.4 kg
External Review » Acer Predator Triton 700
Gigabyte Aero 14-W7-002ID: NVIDIA GeForce GTX 1060 Mobile, 14.00", 1.9 kg
External Review » Gigabyte Aero 14-W7-002ID
Clevo N850: NVIDIA GeForce GTX 1050 Mobile, 15.60", 2.5 kg
External Review » Clevo N850
HP Omen 17-w250tx: NVIDIA GeForce GTX 1070 Mobile, 17.30", 3.4 kg
External Review » HP Omen 17-w250tx
Dell XPS 15 9560-1C32-33Y: NVIDIA GeForce GTX 1050 Mobile, 15.60", 2.1 kg
External Review » Dell XPS 15 9560-1C32-33Y
Asus GL702VM-DS74: NVIDIA GeForce GTX 1060 Mobile, 17.30", 2.7 kg
External Review » Asus GL702VM-DS74
MSI GL72 7RD-028: NVIDIA GeForce GTX 1050 Ti Mobile, 17.30", 2.7 kg
External Review » MSI GL72 7RD-028
Asus Strix GL702VM-GC194T: NVIDIA GeForce GTX 1060 Mobile, 17.30", 2.7 kg
External Review » Asus Strix GL702VM-GC194T
Gigabyte Aero 15: NVIDIA GeForce GTX 1060 Mobile, 15.60", 2.1 kg
External Review » Gigabyte Aero 15
MSI GE72MVR 7RG-008: NVIDIA GeForce GTX 1070 Mobile, 17.30", 2.7 kg
External Review » MSI GE72MVR 7RG-008
Acer Aspire V17 Nitro BE VN7-793G-767M: NVIDIA GeForce GTX 1060 Mobile, 17.30", 3.1 kg
External Review » Acer Aspire V17 Nitro BE VN7-793G-767M
Acer Aspire VN7-593G-73HP V15 Nitro BE: NVIDIA GeForce GTX 1060 Mobile, 15.60", 2.5 kg
External Review » Acer Aspire VN7-593G-73HP V15 Nitro BE
HP Omen 17-w212ng: NVIDIA GeForce GTX 1070 Mobile, 17.30", 3.4 kg
External Review » HP Omen 17-w212ng
MSI GS73VR 7RF-215NE: NVIDIA GeForce GTX 1060 Mobile, 17.30", 2.4 kg
External Review » MSI GS73VR 7RF-215NE
MSI WS63 7RK-280US: NVIDIA Quadro P3000, 15.60", 1.8 kg
External Review » MSI WS63 7RK-280US
MSI GT72VR 7RE Dominator Pro 483RU: NVIDIA GeForce GTX 1070 Mobile, 17.30", 3.8 kg
External Review » MSI GT72VR 7RE Dominator Pro 483RU
MSI GS73VR 7RF-212NE: NVIDIA GeForce GTX 1050 Mobile, 17.30", 2.4 kg
External Review » MSI GS73VR 7RF-212NE
Asus Strix GL753VD-GC009: NVIDIA GeForce GTX 1050 Mobile, 17.30", 3 kg
External Review » Asus Strix GL753VD-GC009
MSI PE60 7RD-282ES: NVIDIA GeForce GTX 1050 Mobile, 15.60", 2.2 kg
External Review » MSI PE60 7RD-282ES
MSI GL62M 7RD-835XES: NVIDIA GeForce GTX 1050 Mobile, 15.60", 2.2 kg
External Review » MSI GL62M 7RD-835XES
HP Omen 15-ax209ns: NVIDIA GeForce GTX 1050 Mobile, 15.60", 2.2 kg
External Review » HP Omen 15-ax209ns
Asus Strix GL502VS-GZ120T: NVIDIA GeForce GTX 1070 Mobile, 15.60", 2.3 kg
External Review » Asus Strix GL502VS-GZ120T
HP Omen 17-w209ns: NVIDIA GeForce GTX 1050 Mobile, 17.30", 2.8 kg
External Review » HP Omen 17-w209ns
Acer Predator 17X GX-792-713B: NVIDIA GeForce GTX 1080 Mobile, 17.30", 4.6 kg
External Review » Acer Predator 17X GX-792-713B
MSI GP62M 7RD Leopard-660RU: NVIDIA GeForce GTX 1050 Mobile, 15.60", 2.2 kg
External Review » MSI GP62M 7RD Leopard-660RU
Asus FX553VD-DM249T: NVIDIA GeForce GTX 1050 Mobile, 15.60", 2.4 kg
External Review » Asus FX553VD-DM249T
Schenker XMG P407: NVIDIA GeForce GTX 1050 Ti Mobile, 14.00", 2.1 kg
External Review » Schenker XMG P407
MSI GE72 7RE-084XES Apache Pro: NVIDIA GeForce GTX 1050 Ti Mobile, 17.30", 2.9 kg
External Review » MSI GE72 7RE-084XES Apache Pro
MSI GE62 7RE-216XES: NVIDIA GeForce GTX 1050 Ti Mobile, 15.60", 2.4 kg
External Review » MSI GE62 7RE-216XES
MSI GP62VR 7RF-453XES: NVIDIA GeForce GTX 1060 Mobile, 15.60", 2.4 kg
External Review » MSI GP62VR 7RF-453XES
HP Pavilion 17-ab200ns: NVIDIA GeForce GTX 1050 Mobile, 17.30", 2.9 kg
External Review » HP Pavilion 17-ab200ns
Asus GL553VD-FY026T: NVIDIA GeForce GTX 1050 Mobile, 15.60", 2.5 kg
External Review » Asus GL553VD-FY026T
Dell Inspiron 15 7567-9316: NVIDIA GeForce GTX 1050 Ti Mobile, 15.60", 2.6 kg
External Review » Dell Inspiron 15 7567-9316
Alienware 13 R3: NVIDIA GeForce GTX 1060 Mobile, 13.30", 2.5 kg
External Review » Alienware 13 R3
MSI GE62 7RD-219XES: NVIDIA GeForce GTX 1050 Mobile, 15.60", 2.4 kg
External Review » MSI GE62 7RD-219XES
MSI GE72 7RD-085XES: NVIDIA GeForce GTX 1050 Mobile, 17.30", 2.9 kg
External Review » MSI GE72 7RD-085XES
Asus GL553VD-FY040T: NVIDIA GeForce GTX 1050 Mobile, 15.60", 2.5 kg
External Review » Asus GL553VD-FY040T
HP Omen 15-ax200ns: NVIDIA GeForce GTX 1050 Mobile, 15.60", 2.2 kg
External Review » HP Omen 15-ax200ns
HP Pavilion 15-bc202nc: NVIDIA GeForce GTX 1050 Mobile, 15.60", 2.2 kg
External Review » HP Pavilion 15-bc202nc
Alienware 15 R3: NVIDIA GeForce GTX 1070 Mobile, 15.60", 3.5 kg
External Review » Alienware 15 R3
Dell Inspiron 15 7000 7567: NVIDIA GeForce GTX 1050 Ti Mobile, 15.60", 2.8 kg
External Review » Dell Inspiron 15 7000 7567
Gigabyte P57X v7: NVIDIA GeForce GTX 1070 Mobile, 17.30", 3.4 kg
External Review » Gigabyte P57X v7
MSI GL62M 7RD-077: Intel HD Graphics 630, 15.60"
External Review » MSI GL62M 7RD-077
Acer Aspire VX5-591G-71EF: NVIDIA GeForce GTX 1050 Ti Mobile, 15.60", 2.6 kg
External Review » Acer Aspire VX5-591G-71EF
MSI GE72 7RE-050NL Apache Pro: NVIDIA GeForce GTX 1050 Ti Mobile, 17.30", 2.7 kg
External Review » MSI GE72 7RE-050NL Apache Pro
MSI GE72VR 7RF-278CZ: NVIDIA GeForce GTX 1060 Mobile, 17.30", 2.7 kg
External Review » MSI GE72VR 7RF-278CZ
MSI GS43VR 7RE Phantom Pro - 7RE-064DE: NVIDIA GeForce GTX 1060 Mobile, 14.00", 1.6 kg
External Review » MSI GS43VR 7RE Phantom Pro - 7RE-064DE
Asus ROG Strix GL553VD-DS71: NVIDIA GeForce GTX 1050 Mobile, 15.60", 2.5 kg
External Review » Asus ROG Strix GL553VD-DS71
Gigabyte Aero 14: NVIDIA GeForce GTX 1060 Mobile, 14.00", 1.9 kg
External Review » Gigabyte Aero 14
MSI GL72 7RD-075XES: NVIDIA GeForce GTX 1050 Ti Mobile, 17.30", 2.7 kg
External Review » MSI GL72 7RD-075XES
MSI GE72 7RE Apache Pro 212RU: NVIDIA GeForce GTX 1050 Ti Mobile, 17.30", 2.7 kg
External Review » MSI GE72 7RE Apache Pro 212RU
BTO Notebooks X-Book 15CL71: NVIDIA GeForce GTX 1050 Ti Mobile, 15.60", 2.3 kg
External Review » BTO Notebooks X-Book 15CL71
Acer Aspire VX5-591G-75C4 VX15: NVIDIA GeForce GTX 1050 Ti Mobile, 15.60", 2.5 kg
External Review » Acer Aspire VX5-591G-78HD VX15
Acer Aspire VX5-591G-78J8: NVIDIA GeForce GTX 1050 Mobile, 15.60", 2.5 kg
External Review » Acer Aspire VX5-591G-78J8
Asus GL553VD-FY072T: NVIDIA GeForce GTX 1050 Mobile, 15.60", 2.5 kg
External Review » Asus GL553VD-FY072T
Asus GL553VE-FY003T: NVIDIA GeForce GTX 1050 Ti Mobile, 15.60", 2.5 kg
External Review » Asus GL553VE-FY003T
MSI PE60 7RD-059 Prestige: NVIDIA GeForce GTX 1050 Mobile, 15.60", 2.4 kg
External Review » MSI PE60 7RD-059 Prestige
MSI GE62 7RD Apache: NVIDIA GeForce GTX 1050 Ti Mobile, 15.60", 2.4 kg
External Review » MSI GE62 7RD Apache
Acer Aspire VX5-591G-75RM: NVIDIA GeForce GTX 1050 Ti Mobile, 15.60", 2.6 kg
External Review » Acer Aspire VX5-591G-75RM
MSI GP62MVR-406 Leopard Pro: NVIDIA GeForce GTX 1060 (Desktop), 15.60", 2.2 kg
External Review » MSI GP62MVR-406 Leopard Pro
Asus GL502VS-DS71: NVIDIA GeForce GTX 1070 Mobile, 15.60", 2.2 kg
External Review » Asus GL502VS-DS71
Asus GL753VE-DS74: NVIDIA GeForce GTX 1050 Ti Mobile, 17.30", 3 kg
External Review » Asus GL753VE-DS74
Razer Blade FHD Matte, Kaby Lake: NVIDIA GeForce GTX 1060 Mobile, 14.00", 1.9 kg
External Review » Razer Blade FHD Matte, Kaby Lake
Dell XPS 15 9560 (i7-7700HQ, FHD): NVIDIA GeForce GTX 1050 Mobile, 15.60", 2.1 kg
External Review » Dell XPS 15 9560 (i7-7700HQ, FHD)
MSI GP62 7RD-090DE Leopard: NVIDIA GeForce GTX 1050 Mobile, 15.60", 2.4 kg
External Review » MSI GP62 7RD-090DE Leopard
MSI GE62 7RE-027UK Apache Pro: NVIDIA GeForce GTX 1050 Ti Mobile, 15.60", 2.4 kg
External Review » MSI GE62 7RE-027UK Apache Pro
Lenovo Legion Y520-80WK004XGE: NVIDIA GeForce GTX 1050 Mobile, 15.60", 2.4 kg
External Review » Lenovo Legion Y520-80WK004XGE
Dell XPS 15 9560 (i7-7700HQ, UHD): NVIDIA GeForce GTX 1050 Mobile, 15.60", 2.1 kg
External Review » Dell XPS 15 9560 (i7-7700HQ, UHD)
Alienware 13 OLED 2017: NVIDIA GeForce GTX 1060 Mobile, 13.30", 2.6 kg
External Review » Alienware 13 OLED 2017
Asus FX502VM-AS73: NVIDIA GeForce GTX 1060 Mobile, 15.60", 2.6 kg
External Review » Asus FX502VM-AS73
Gigabyte Aero 14 P64Wv7-De325Tb: NVIDIA GeForce GTX 1060 Mobile, 14.00", 1.9 kg
External Review » Gigabyte Aero 14 P64Wv7-De325Tb
MSI GL62M 7RD-429XES: NVIDIA GeForce GTX 1050 Mobile, 15.60", 2.2 kg
External Review » MSI GL62M 7RD-429XES
HP Omen 15-ax204ns: NVIDIA GeForce GTX 1050 Mobile, 15.60", 2.2 kg
External Review » HP OMEN 15-ax204ns
HP Pavilion 15-bc235nd: NVIDIA GeForce GTX 1050 Mobile, 15.60", 2.2 kg
External Review » HP Pavilion 15-bc235nd
Acer Aspire VX5-591G-75C4: NVIDIA GeForce GTX 1050 Ti Mobile, 15.60", 2.6 kg
External Review » Acer Aspire VX5-591G-75C4
Asus GL553VE-DS74: NVIDIA GeForce GTX 1050 Ti Mobile, 15.60", 2.5 kg
External Review » Asus GL553VE-DS74
Acer Predator 15 G9-593-71EB: NVIDIA GeForce GTX 1070 Mobile, 15.60", 3.6 kg
External Review » Acer Predator 15 G9-593-71EB
Acer Aspire V17 Nitro BE VN7-793G-706L: NVIDIA GeForce GTX 1060 Mobile, 17.30", 3.1 kg
External Review » Acer Aspire V17 Nitro BE VN7-793G-706L
MSI GS73VR 7RF-210: NVIDIA GeForce GTX 1060 Mobile, 17.30", 2.4 kg
External Review » MSI GS73VR 7RF-210
MSI GE72 7RE-006PL: NVIDIA GeForce GTX 1050 Ti Mobile, 17.30", 2.9 kg
External Review » MSI GE72 7RE-006PL
MSI GS43VR 7RE-062: NVIDIA GeForce GTX 1060 Mobile, 14.00", 1.6 kg
External Review » MSI GS43VR 7RE-062
MSI GE72 7RE-045CZ: NVIDIA GeForce GTX 1050 Ti Mobile, 17.30", 2.7 kg
External Review » MSI GE72 7RE-045CZ
MSI GS63VR 7RF-219NL: NVIDIA GeForce GTX 1060 Mobile, 15.60", 1.8 kg
External Review » MSI GS63VR 7RF-219NL
MSI GT62VR 7RE-261RU Dominator Pro: NVIDIA GeForce GTX 1070 Mobile, 15.60", 2.9 kg
External Review » MSI GT62VR 7RE-261RU Dominator Pro
MSI GE62VR 7RF-417ES: NVIDIA GeForce GTX 1060 Mobile, 15.60", 2.4 kg
External Review » MSI GE62VR 7RF-417ES
MSI GS73VR 7RF-216NL: NVIDIA GeForce GTX 1060 Mobile, 17.30", 2.4 kg
External Review » MSI GS73VR 7RF-216NL
Acer Aspire VX5-591G-711J: NVIDIA GeForce GTX 1050 Mobile, 15.60", 2.5 kg
External Review » Acer Aspire VX5-591G-711J
Asus G752VS (KBL)-BA326T: NVIDIA GeForce GTX 1070 Mobile, 17.30", 4.3 kg
External Review » Asus G752VS (KBL)-BA326T
Asus Strix GL753VD-GC044T: NVIDIA GeForce GTX 1050 Mobile, 17.30", 2.9 kg
External Review » Asus Strix GL753VD-GC044T
HP Omen 17-w240ng: NVIDIA GeForce GTX 1070 Mobile, 17.30", 3.4 kg
External Review » HP Omen 17-w240ng
MSI GL62 7RD-083: NVIDIA GeForce GTX 1050 Mobile, 15.60", 2.4 kg
External Review » MSI GL62 7RD-083
MSI GT72VR 7RE-461XES: NVIDIA GeForce GTX 1070 Mobile, 17.30", 3.8 kg
External Review » MSI GT72VR 7RE-461XES
Acer Aspire VX5-591G-D0DD: NVIDIA GeForce GTX 1050 Ti Mobile, 15.60", 2.6 kg
External Review » Acer Aspire VX5-591G-D0DD
External Review » Acer Aspire VX5-591G-D0DD
Lenovo Legion Y520-15IKB-80WK004RGE: NVIDIA GeForce GTX 1050 Mobile, 15.60", 2.5 kg
External Review » Lenovo Legion Y520-15IKB-80WK004RGE
MSI GE72VR-7RF-267: NVIDIA GeForce GTX 1060 Mobile, 17.30", 2.9 kg
External Review » MSI GE72VR-7RF-267
MSI GT72VR 7RE-433: NVIDIA GeForce GTX 1070 Mobile, 17.30", 3.8 kg
External Review » MSI GT72VR 7RE-433
Lenovo Legion Y720-15IKB: NVIDIA GeForce GTX 1060 Mobile, 15.60", 3.2 kg
External Review » Lenovo Legion Y720-15IKB
Asus Strix GL553VD-FY075T: NVIDIA GeForce GTX 1050 Mobile, 15.60", 2.5 kg
External Review » Asus Strix GL553VD-FY075T
MSI GE62 7RE Apache Pro - 7RE-088: NVIDIA GeForce GTX 1050 Ti Mobile, 15.60", 2.4 kg
External Review » MSI GE62 7RE Apache Pro - 7RE-088
MSI GT62VR 7RE Dominator Pro - 7RE-223: NVIDIA GeForce GTX 1070 Mobile, 15.60", 2.9 kg
External Review » MSI GT62VR 7RE Dominator Pro - 7RE-223
Asus Strix GL753VD-GC045T: NVIDIA GeForce GTX 1050 Mobile, 17.30", 2.9 kg
External Review » Asus Strix GL753VD-GC045T
MSI GS63VR 7RF Stealth Pro: NVIDIA GeForce GTX 1060 Mobile, 15.60", 2.9 kg
External Review » MSI GS63VR 7RF Stealth Pro
MSI GE72 7RE-046: NVIDIA GeForce GTX 1050 Ti Mobile, 17.30", 3 kg
External Review » MSI GE72 7RE-046
Lenovo ThinkPad T470p-20J7S00000 : NVIDIA GeForce 940MX, 14.00", 1.9 kg
Article » Comparison: NVIDIA GeForce MX150 vs NVIDIA GeForce 940MX
MSI PL62 MX150 7700HQ: NVIDIA GeForce MX150
Article » Comparison: NVIDIA GeForce MX150 vs NVIDIA GeForce 940MX
Dell XPS 15 9560 (i7-7700HQ, UHD): NVIDIA GeForce GTX 1050 Mobile, 15.60", 2.1 kg
» The XPS 15 9570 with i7-8750H CPU is almost twice as fast as its predecessor
HP Omen 15-ce002ng: NVIDIA GeForce GTX 1060 Max-Q, 15.60", 2.6 kg
» Nvidia GTX 1060 Max-Q: almost as fast as a real GTX 1060
» Nvidia GTX 1060 Max-Q: Gaming-Performance almost on par with GTX 1060