Sager NP5852 (Clevo N850HL, i7-7700HQ, MX150) Laptop Review
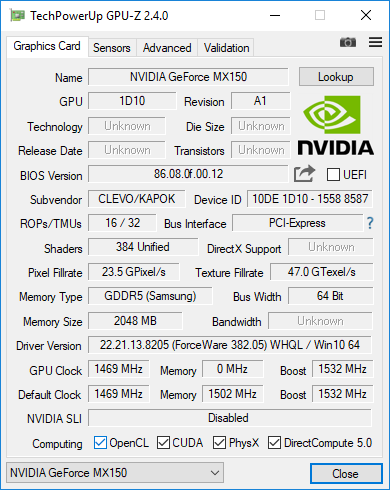
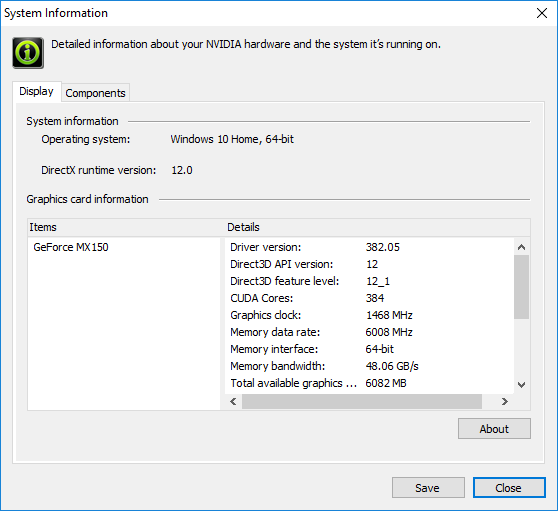
Nvidia Pascal became widely available for notebooks in mid-2016 and it wasn't until a full year later that a proper entry-level Pascal GPU would begin shipping to customers. Called the GeForce MX150, the new GPU is essentially a GT 1030 as both share the same 64-bit memory bus, 384 CUDA cores, and even a base clock rate of 1468 MHz. It effectively replaces the aging GeForce 940MX that is still shipping on several new Ultrabooks and multimedia notebooks today.
The 15.6-inch Sager NP5852 is one of the first to pair the MX150 GPU with the Core i7-7700HQ CPU and is aimed at entry-level gamers for a base price of $800 USD (or about $950 as configured). A quick glance at its Clevo chassis reveals that it is essentially identical to the costlier Gigabyte Sabre 15 with very small adjustments to battery capacity, thickness, and port selection. Otherwise, everything from the 1080p IPS display, chassis quality, and keyboard remain identical. We recommend checking out our existing review on the Sabre 15 for more information on the hardware and its features. Our NP5852 review will instead focus on performance and how it compares to other mainstream 15.6-inch gaming notebooks with the GTX 1050 and older Maxwell GPUs.
Case
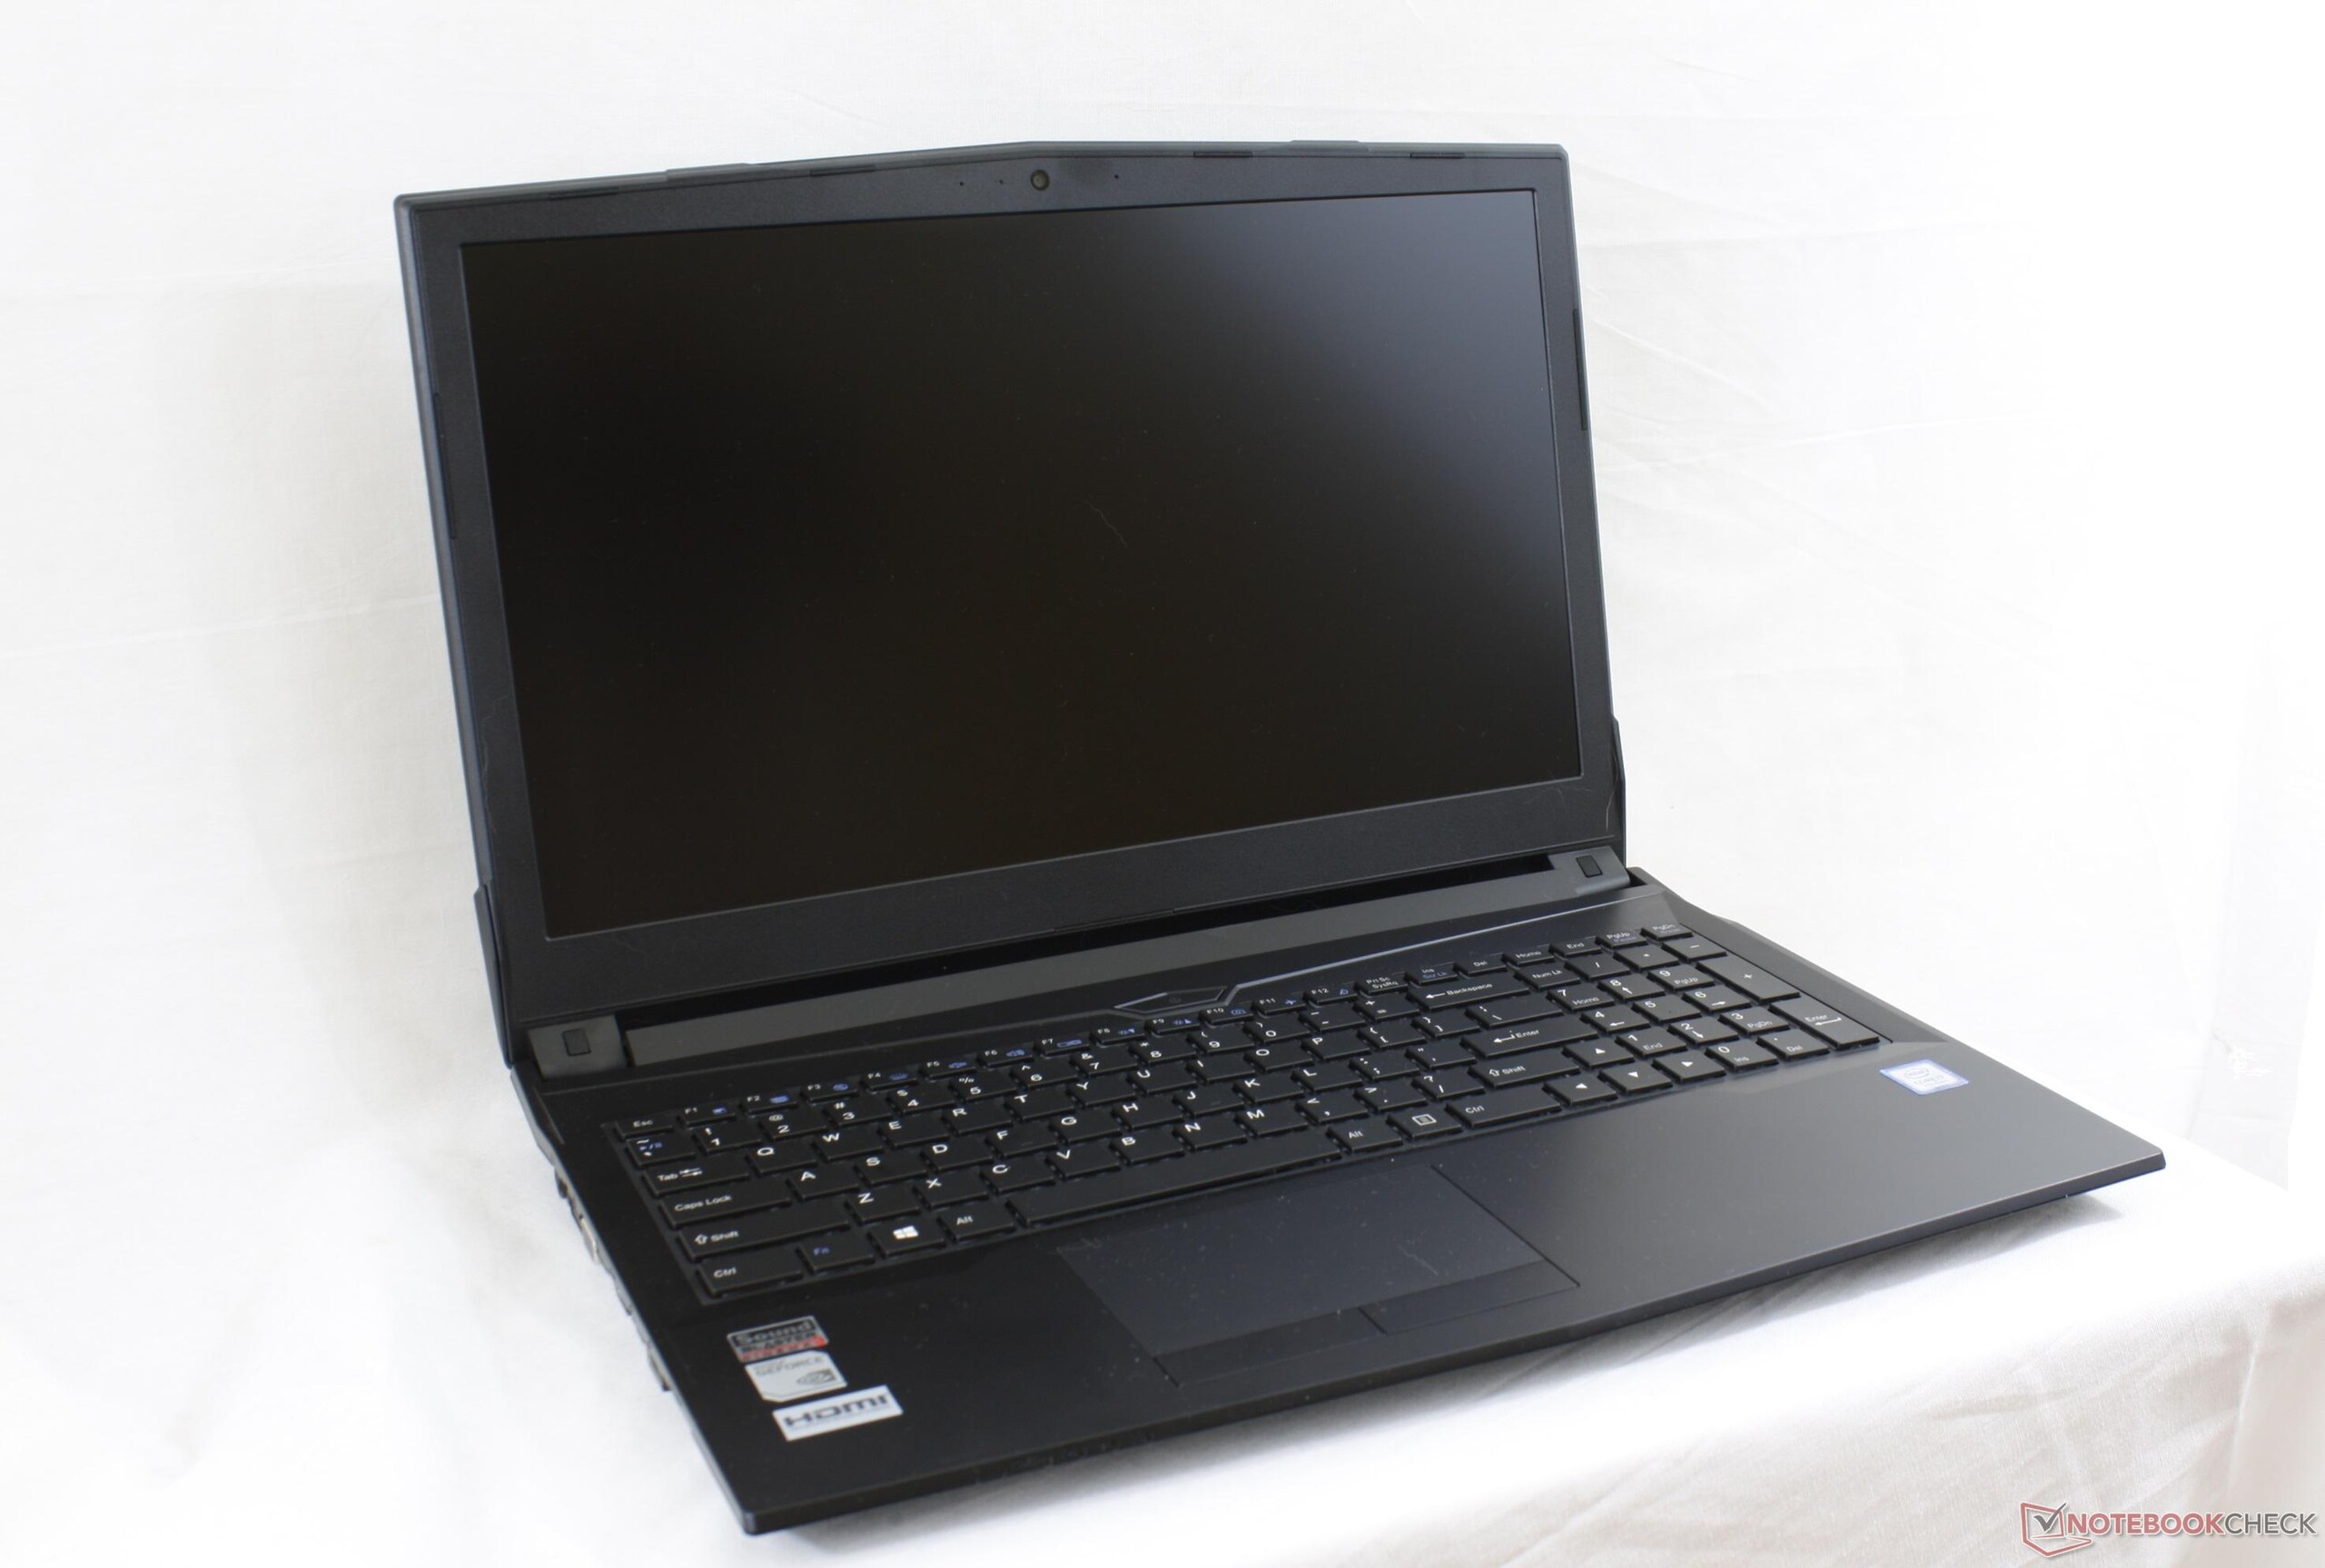
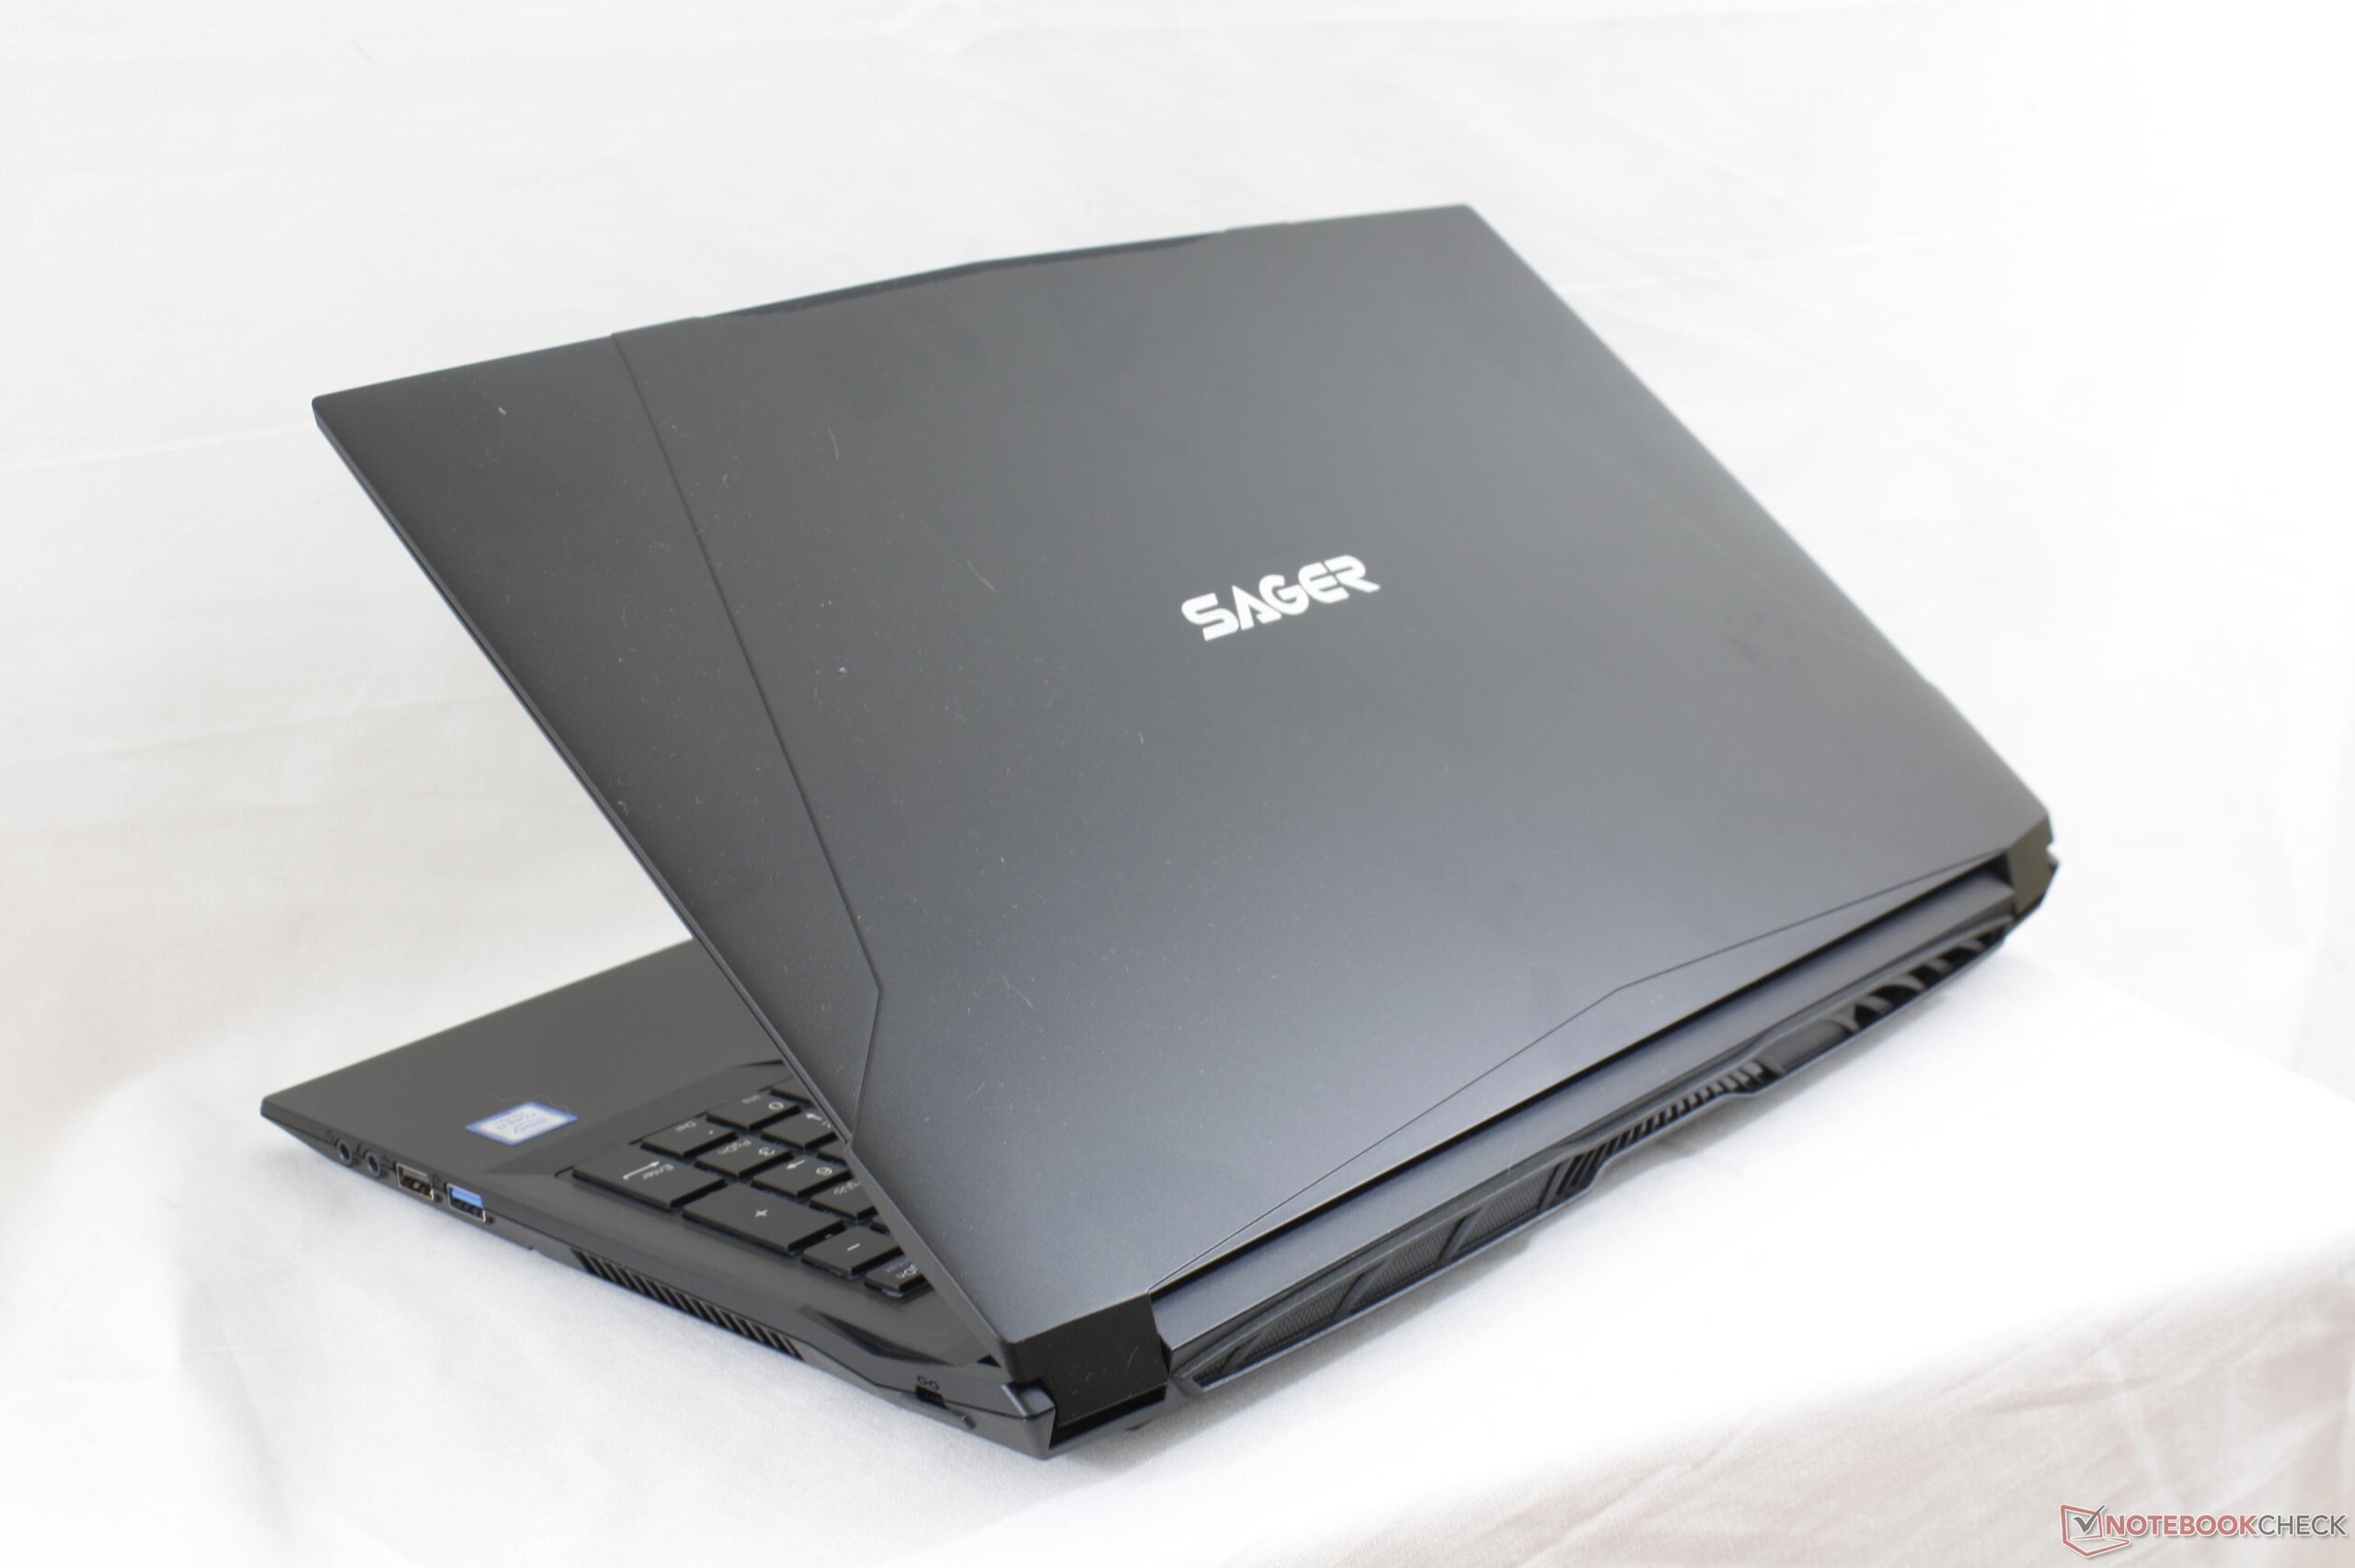
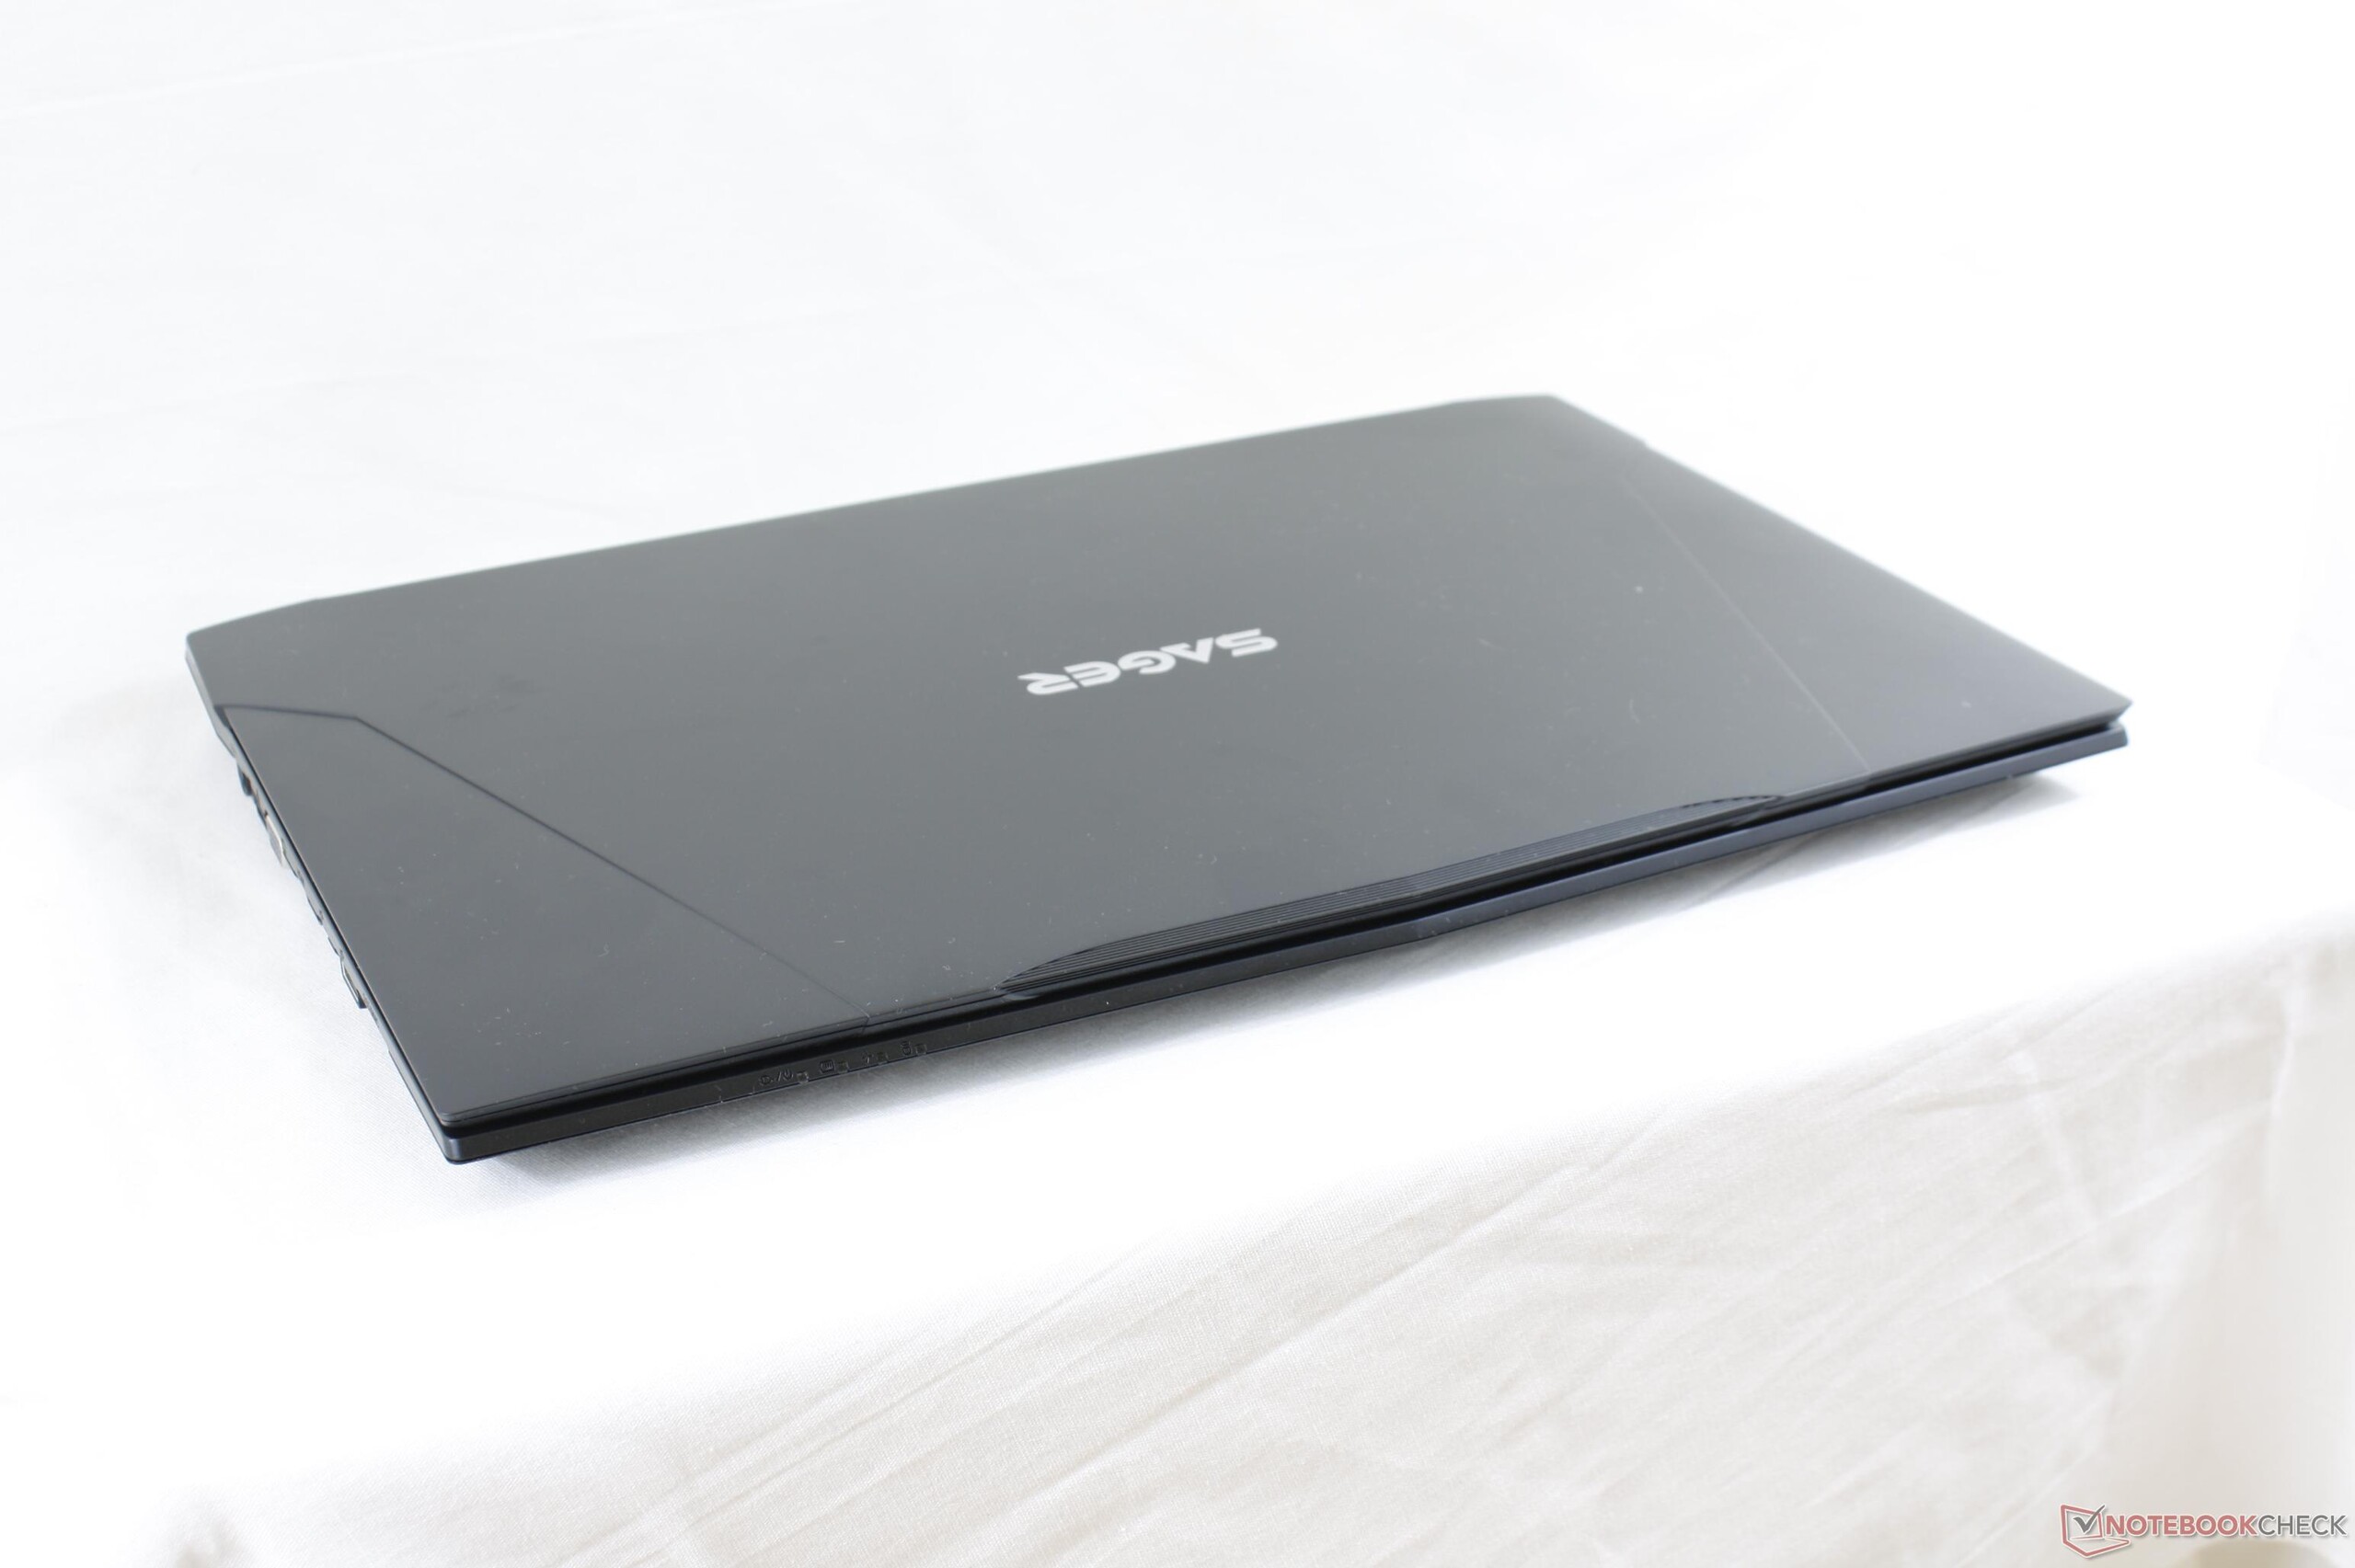
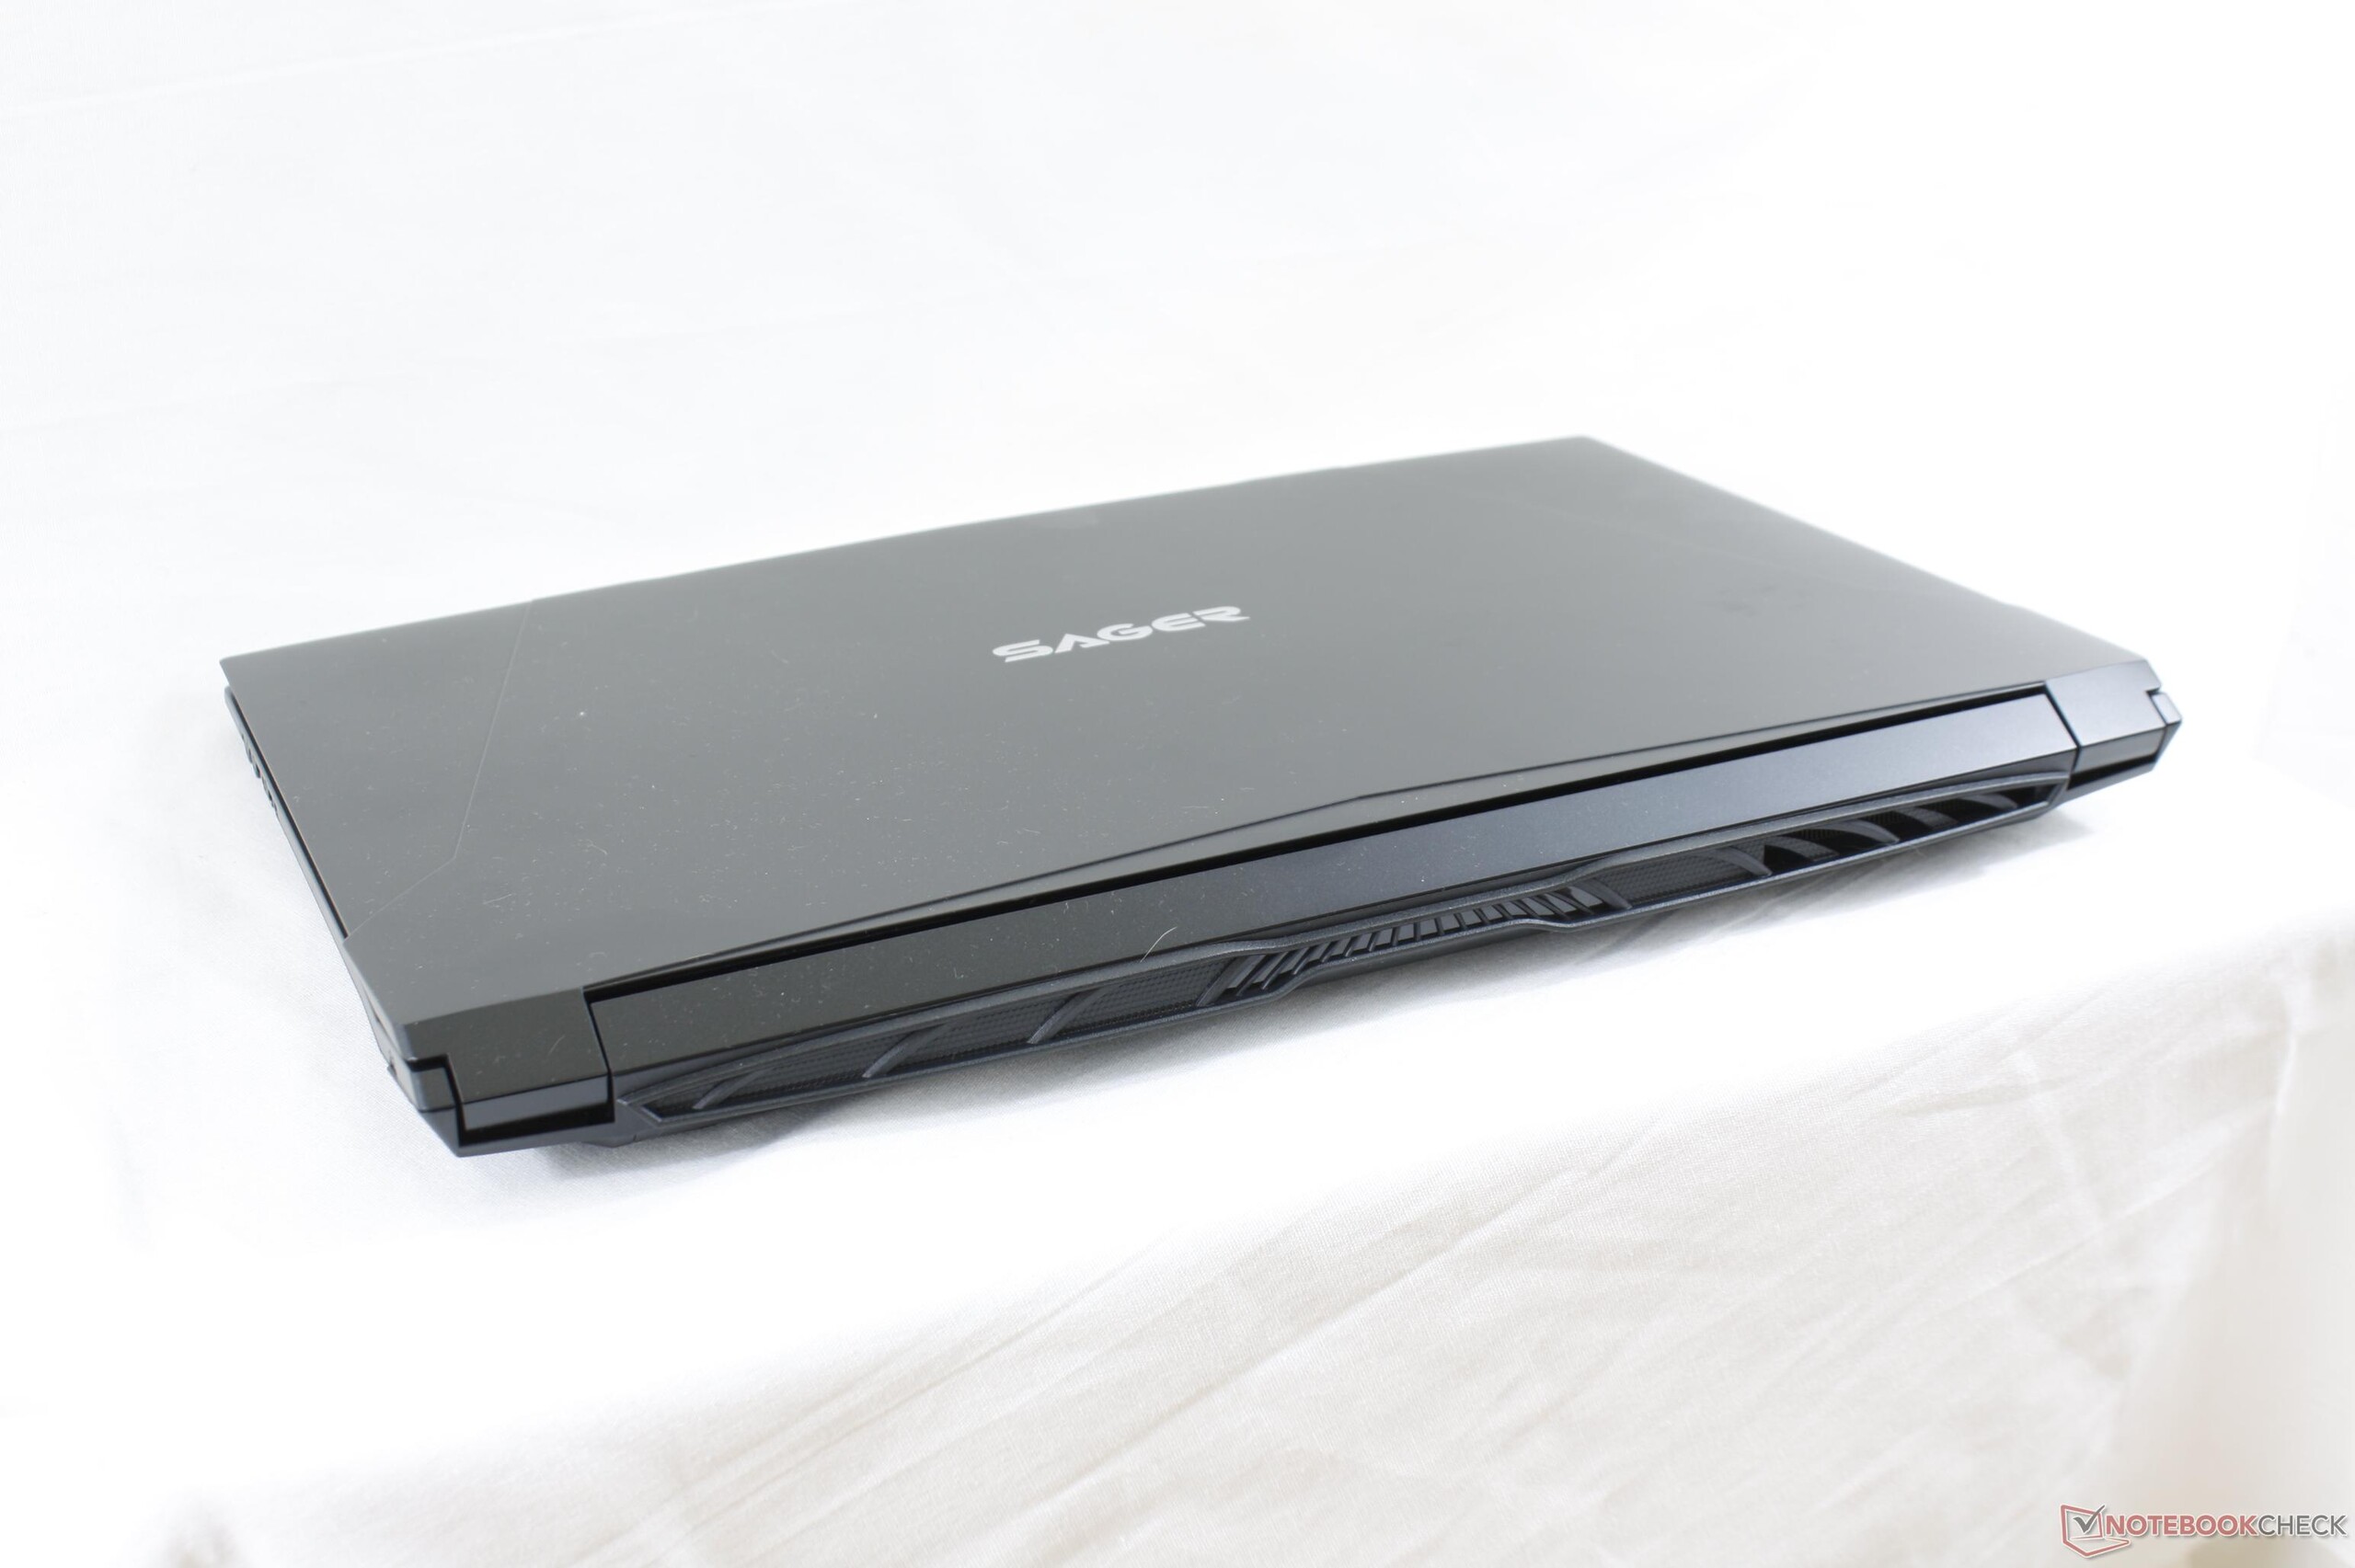
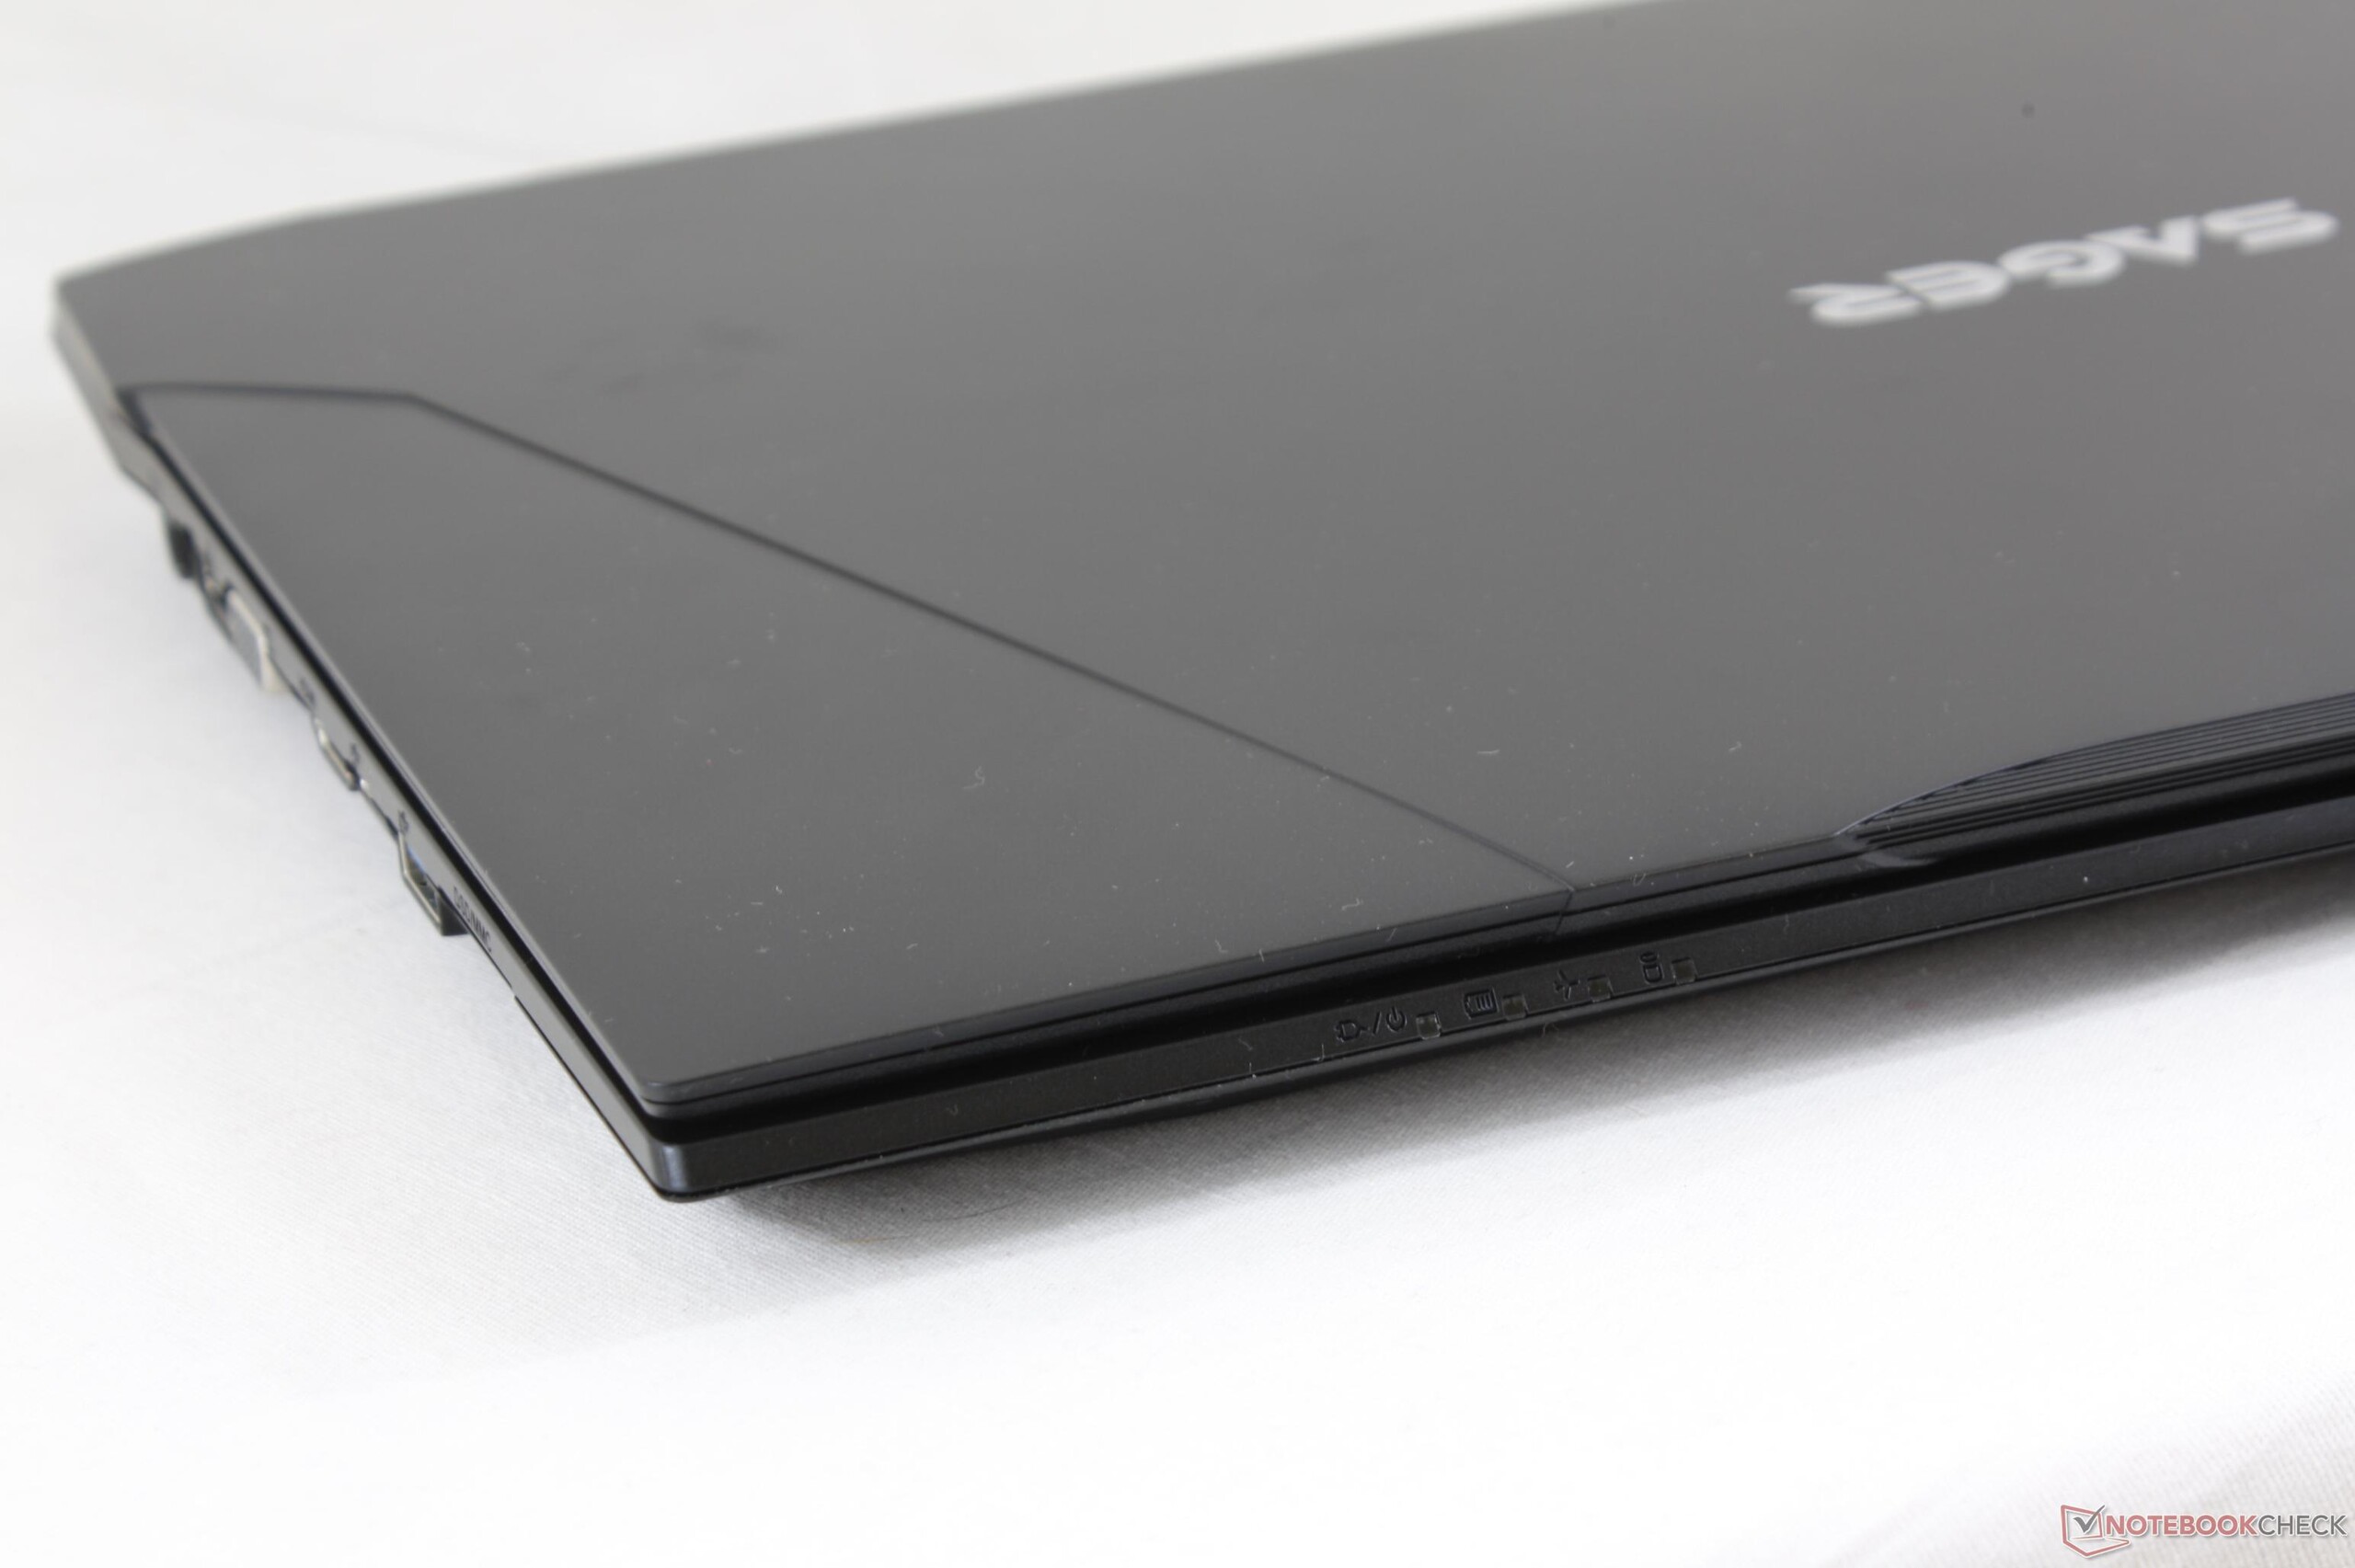
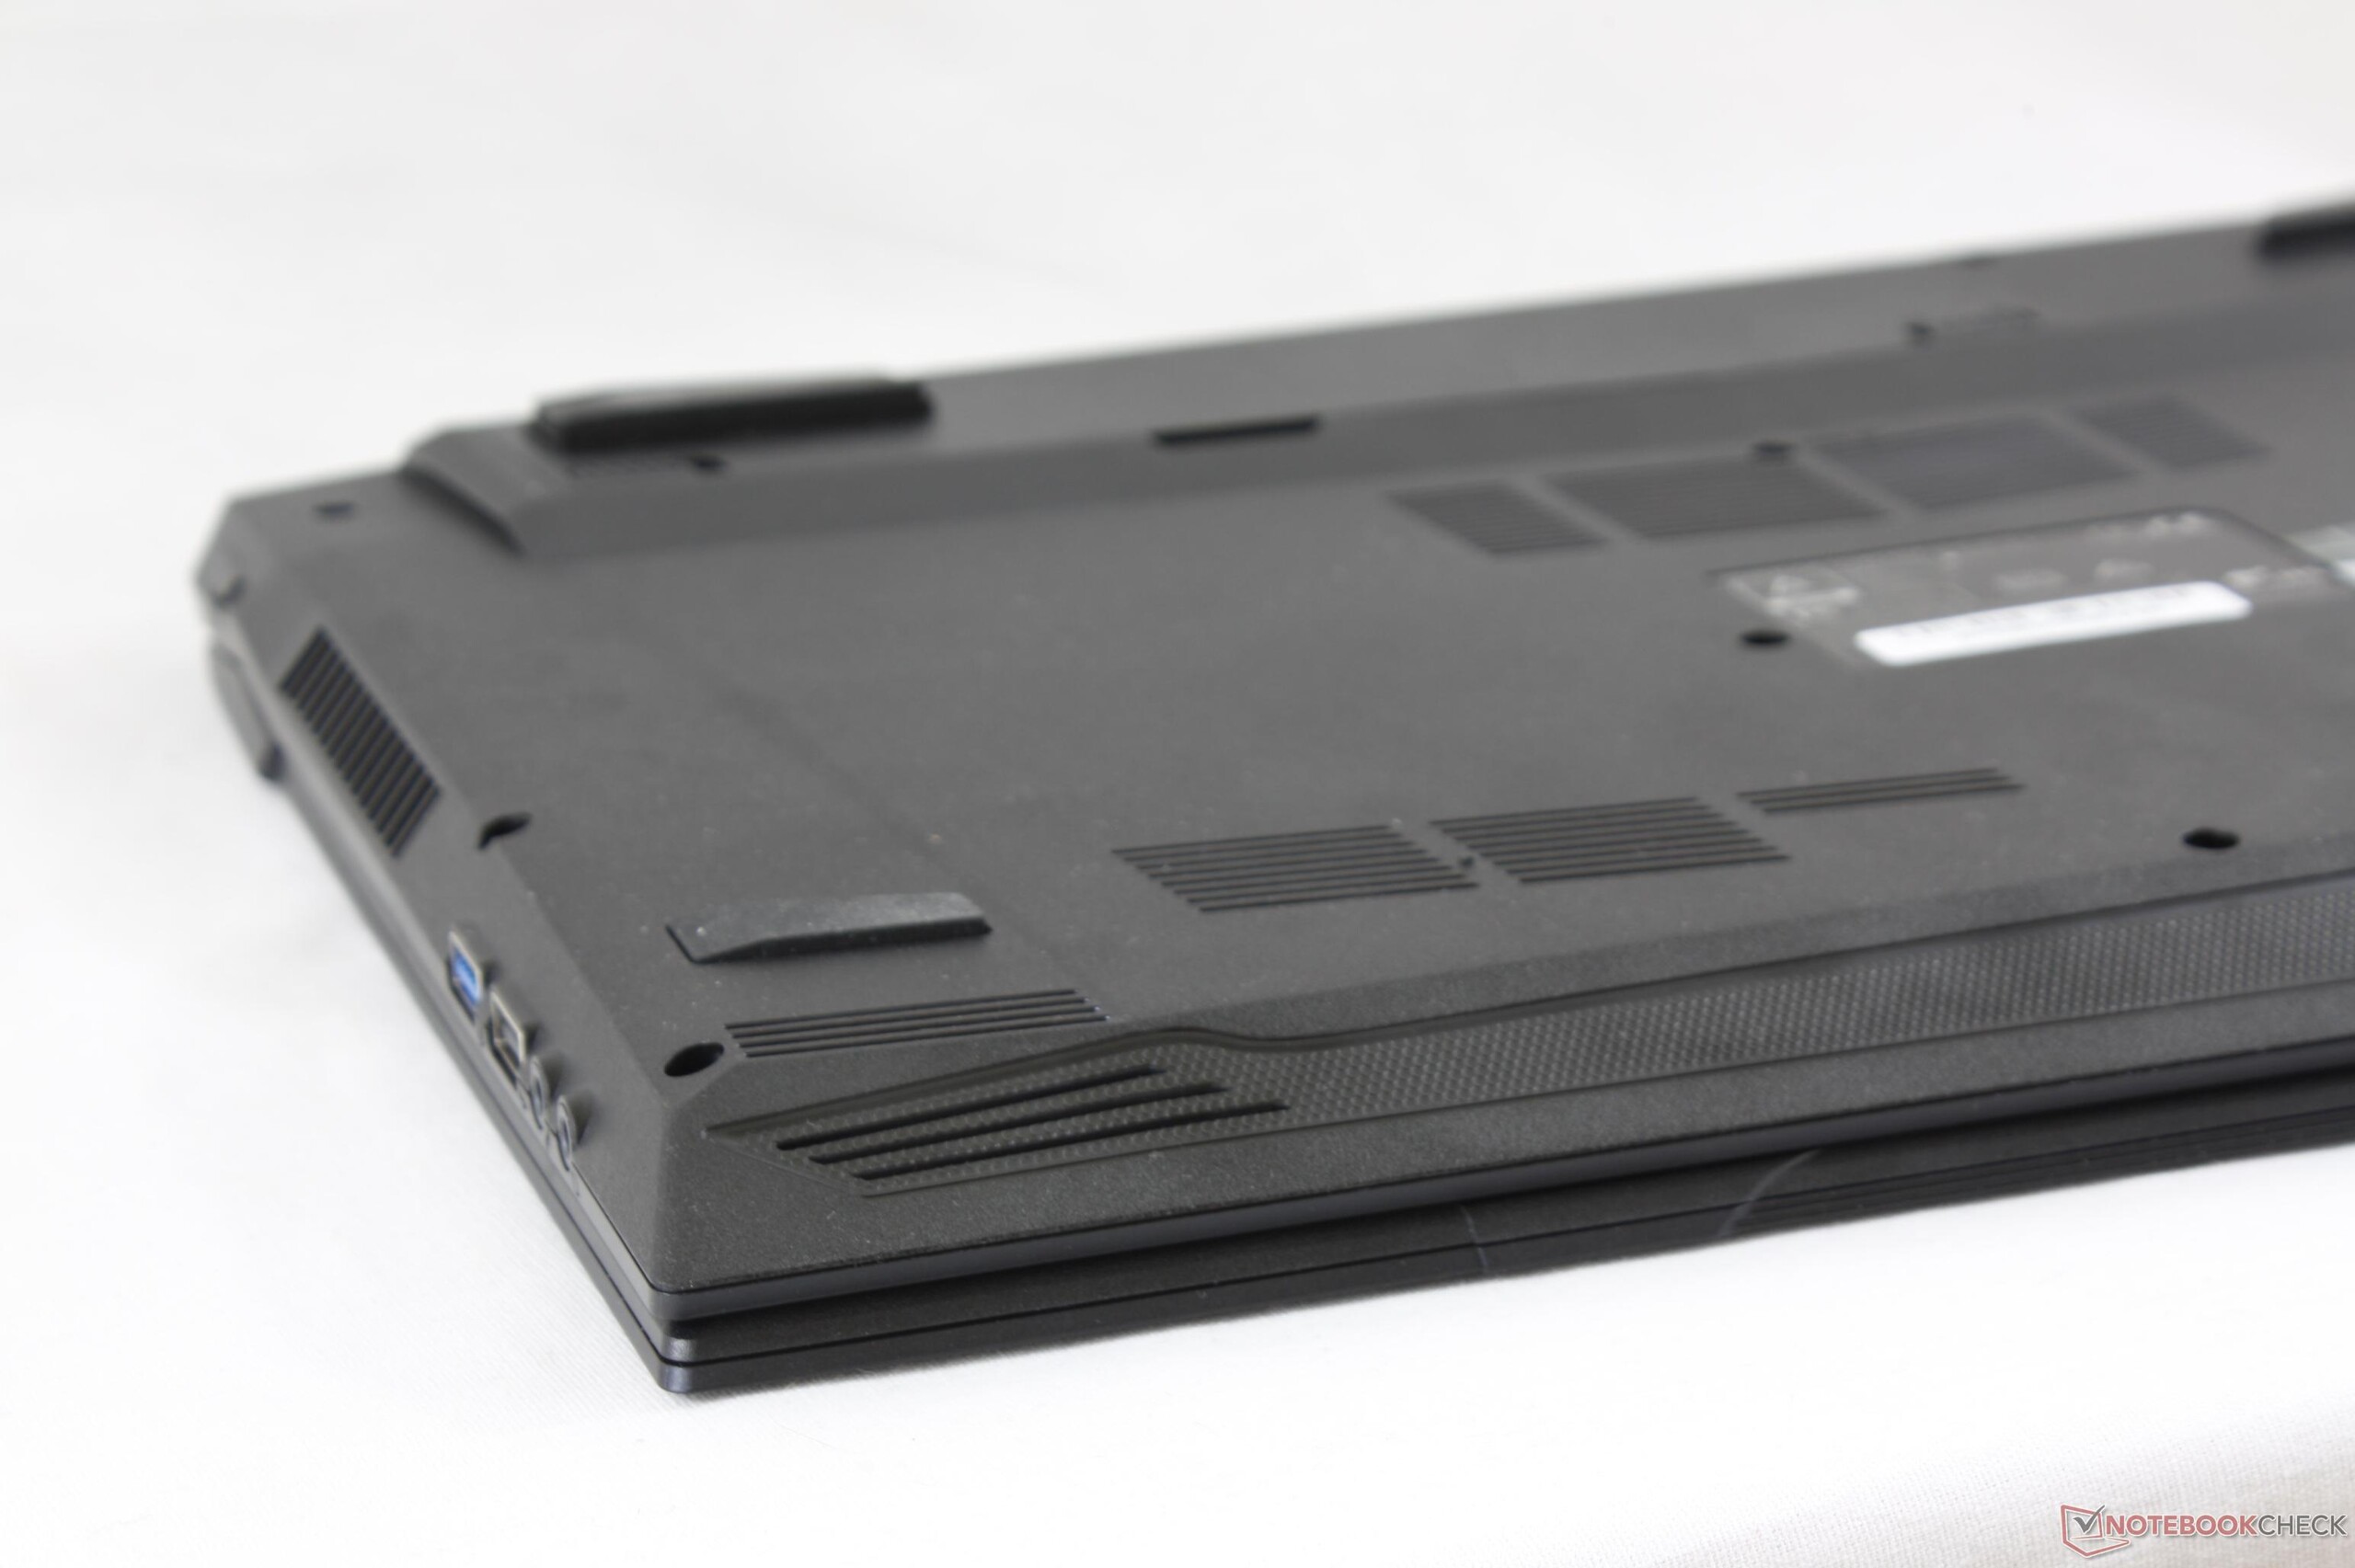
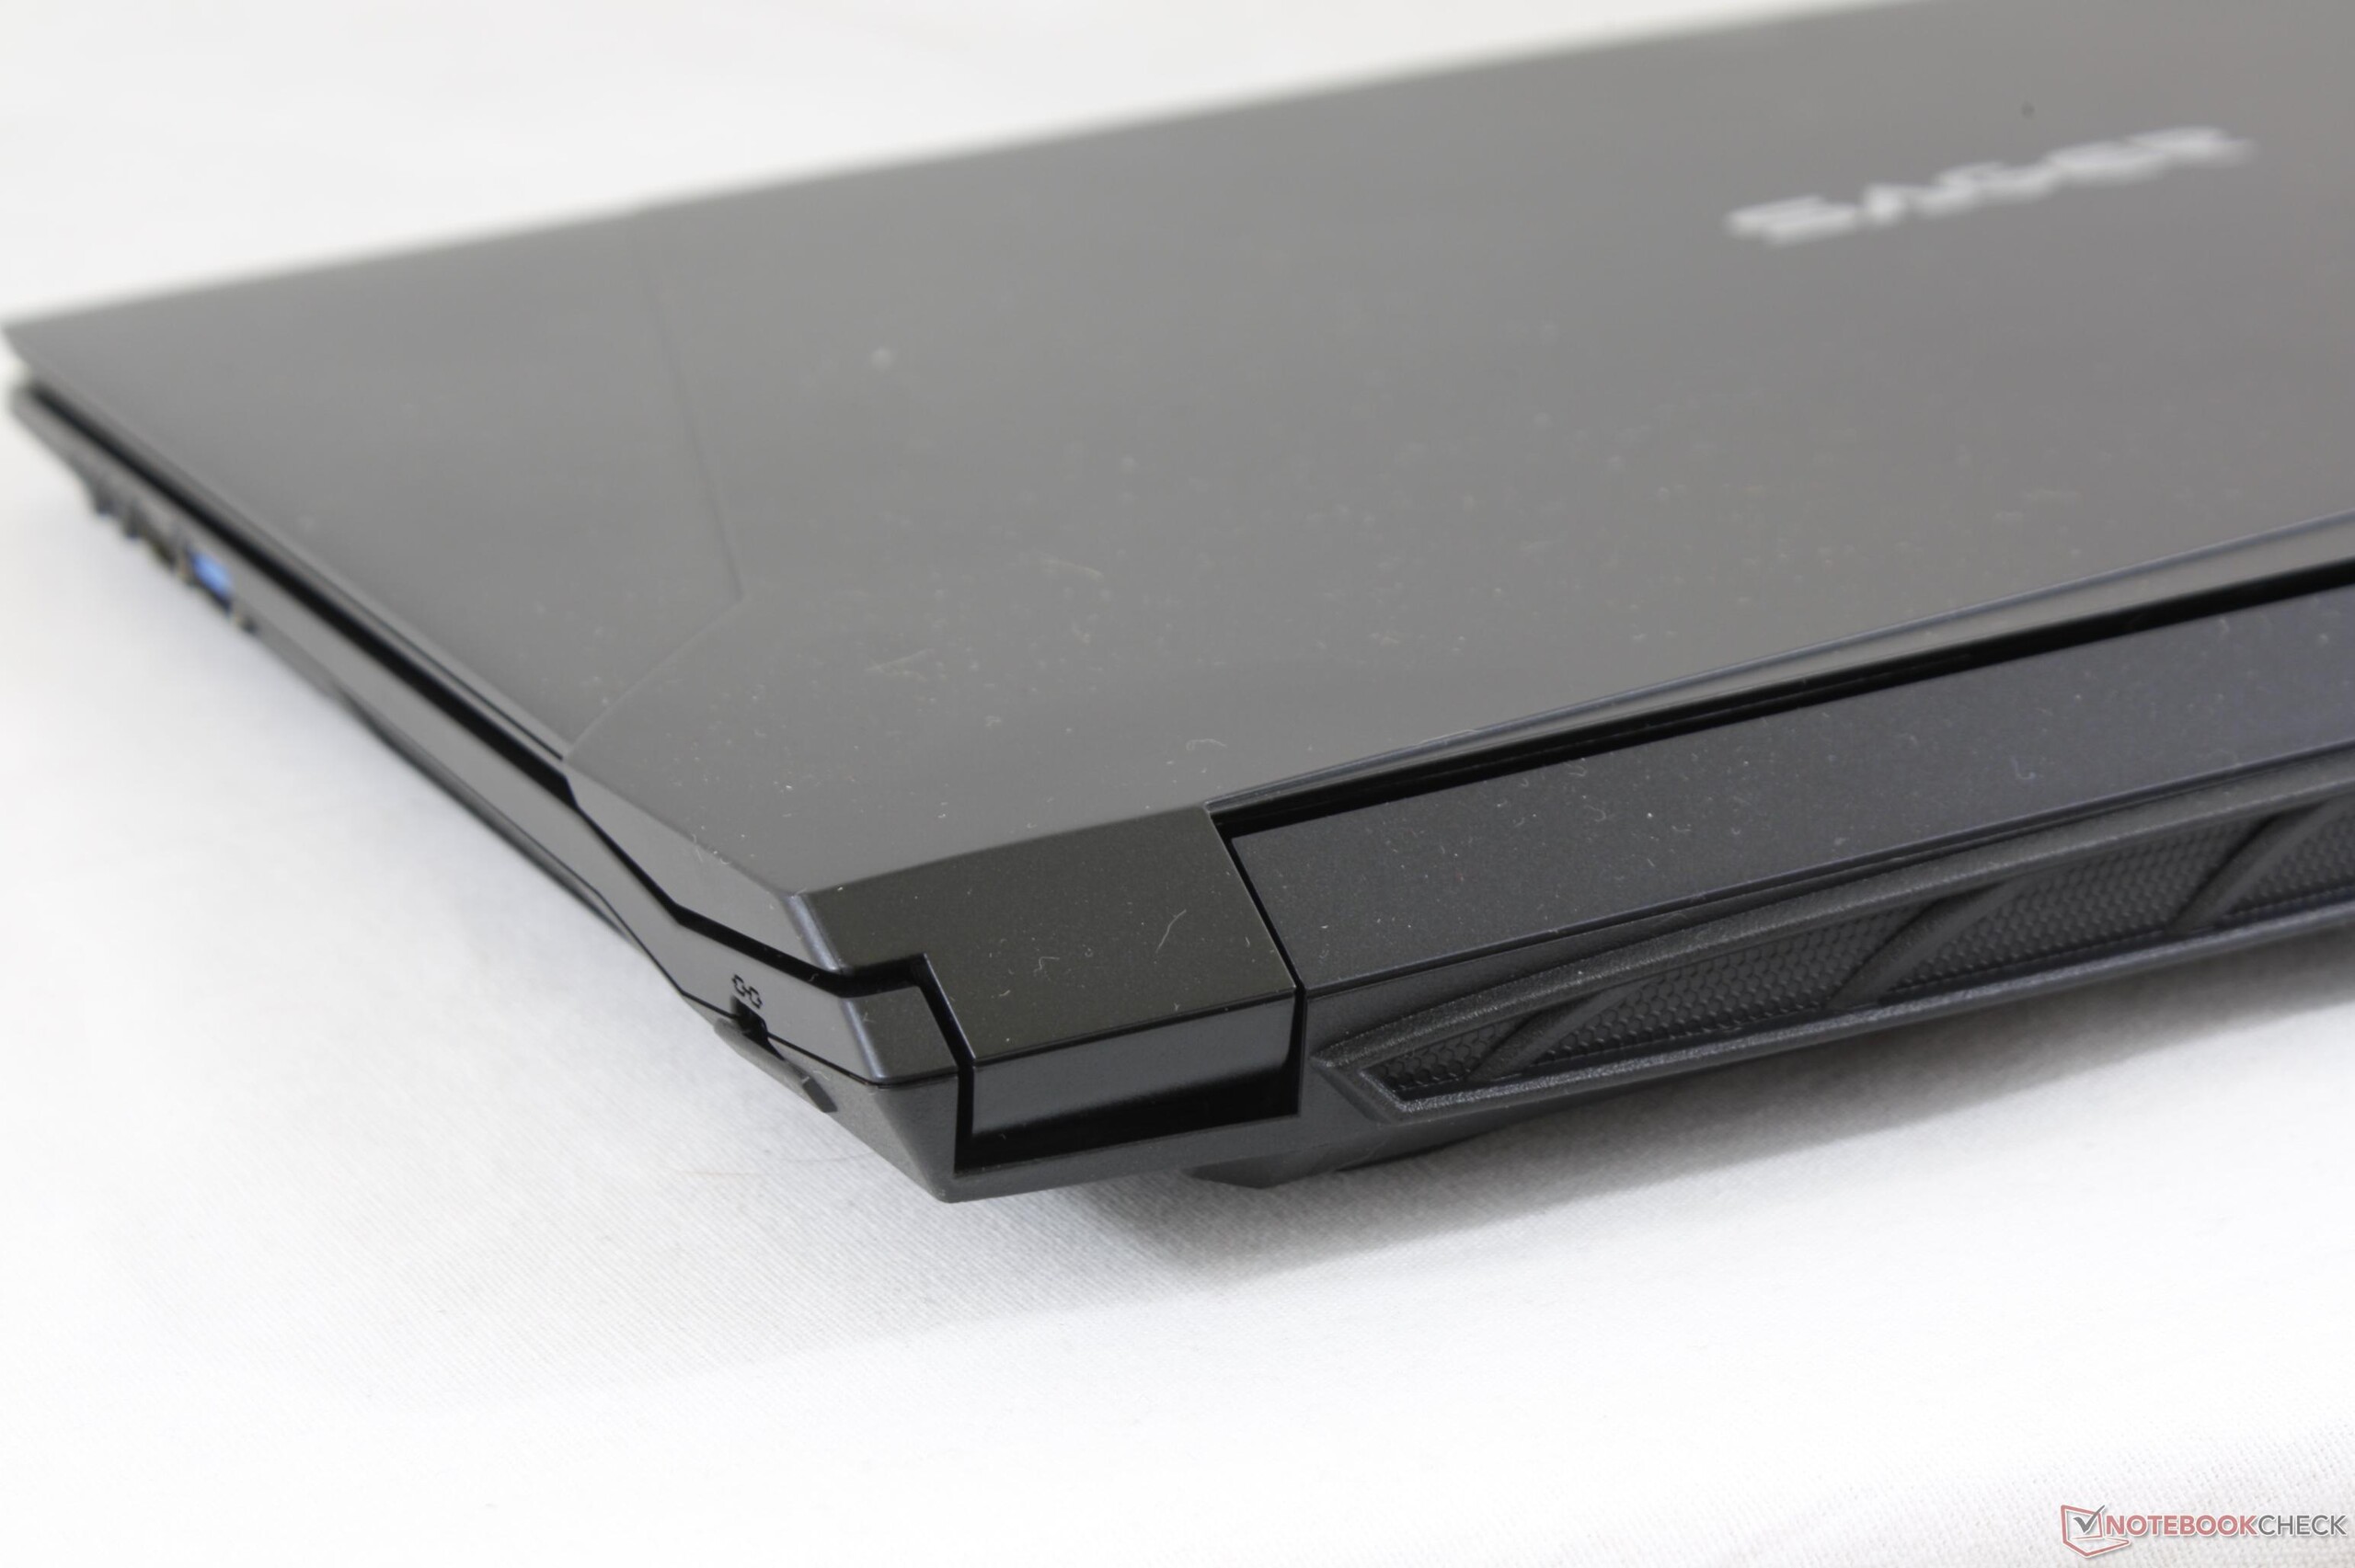
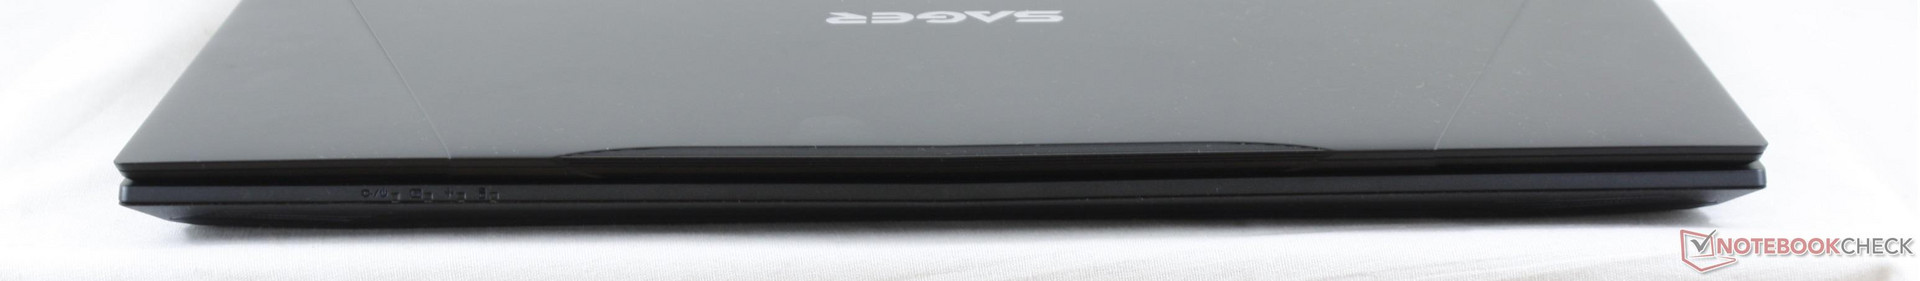
As mentioned on our Sabre 15 page, the chassis design is smaller and more angular than the clunky Clevo barebones we've come to known in the past. It's obvious that the manufacturer made it a priority to create something sharper and less boxy to better appeal to mainstream gamers. It still lacks color and sheen when compared to the brighter Lenovo Y series, Gigabyte Aero series, or Asus ROG GL series since the chassis retains the familiar monotonous black matte color scheme, but this style is down to personal preference.
Case quality is otherwise above average around the base. Attempting to flex the palm rests or center of the keyboard will result in slight depressions and creaking, but not by any worrisome degree. The lid is noticeably more prone to flexing especially down its outer center where rigidity is weakest. Denser notebooks like the XPS 15 9560 have stiffer displays that feel much stronger than what our Sager offers. When compared to the pricier and thinner aluminum-clad Clevo P957HR, however, the NP5852 doesn't feel any cheaper or more "budget-grade" despite being much more affordable.
At 2.5 kg, our Sager weighs about the same as the AsusPro P4540UQ, Samsung Odyssey, and Asus GL553 with almost identical dimensions between them. This is rather disappointing because these systems are equipped with faster GTX 1050 GPUs and yet they are not any heavier or bigger than the NP5852. The Acer Aspire 5 A515 with the same MX150 GPU is several hundred grams lighter due in part to its slower ULV CPU.
Connectivity
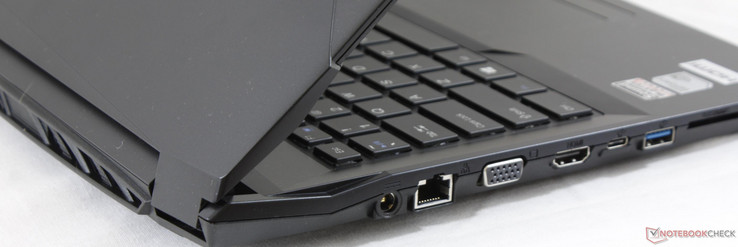
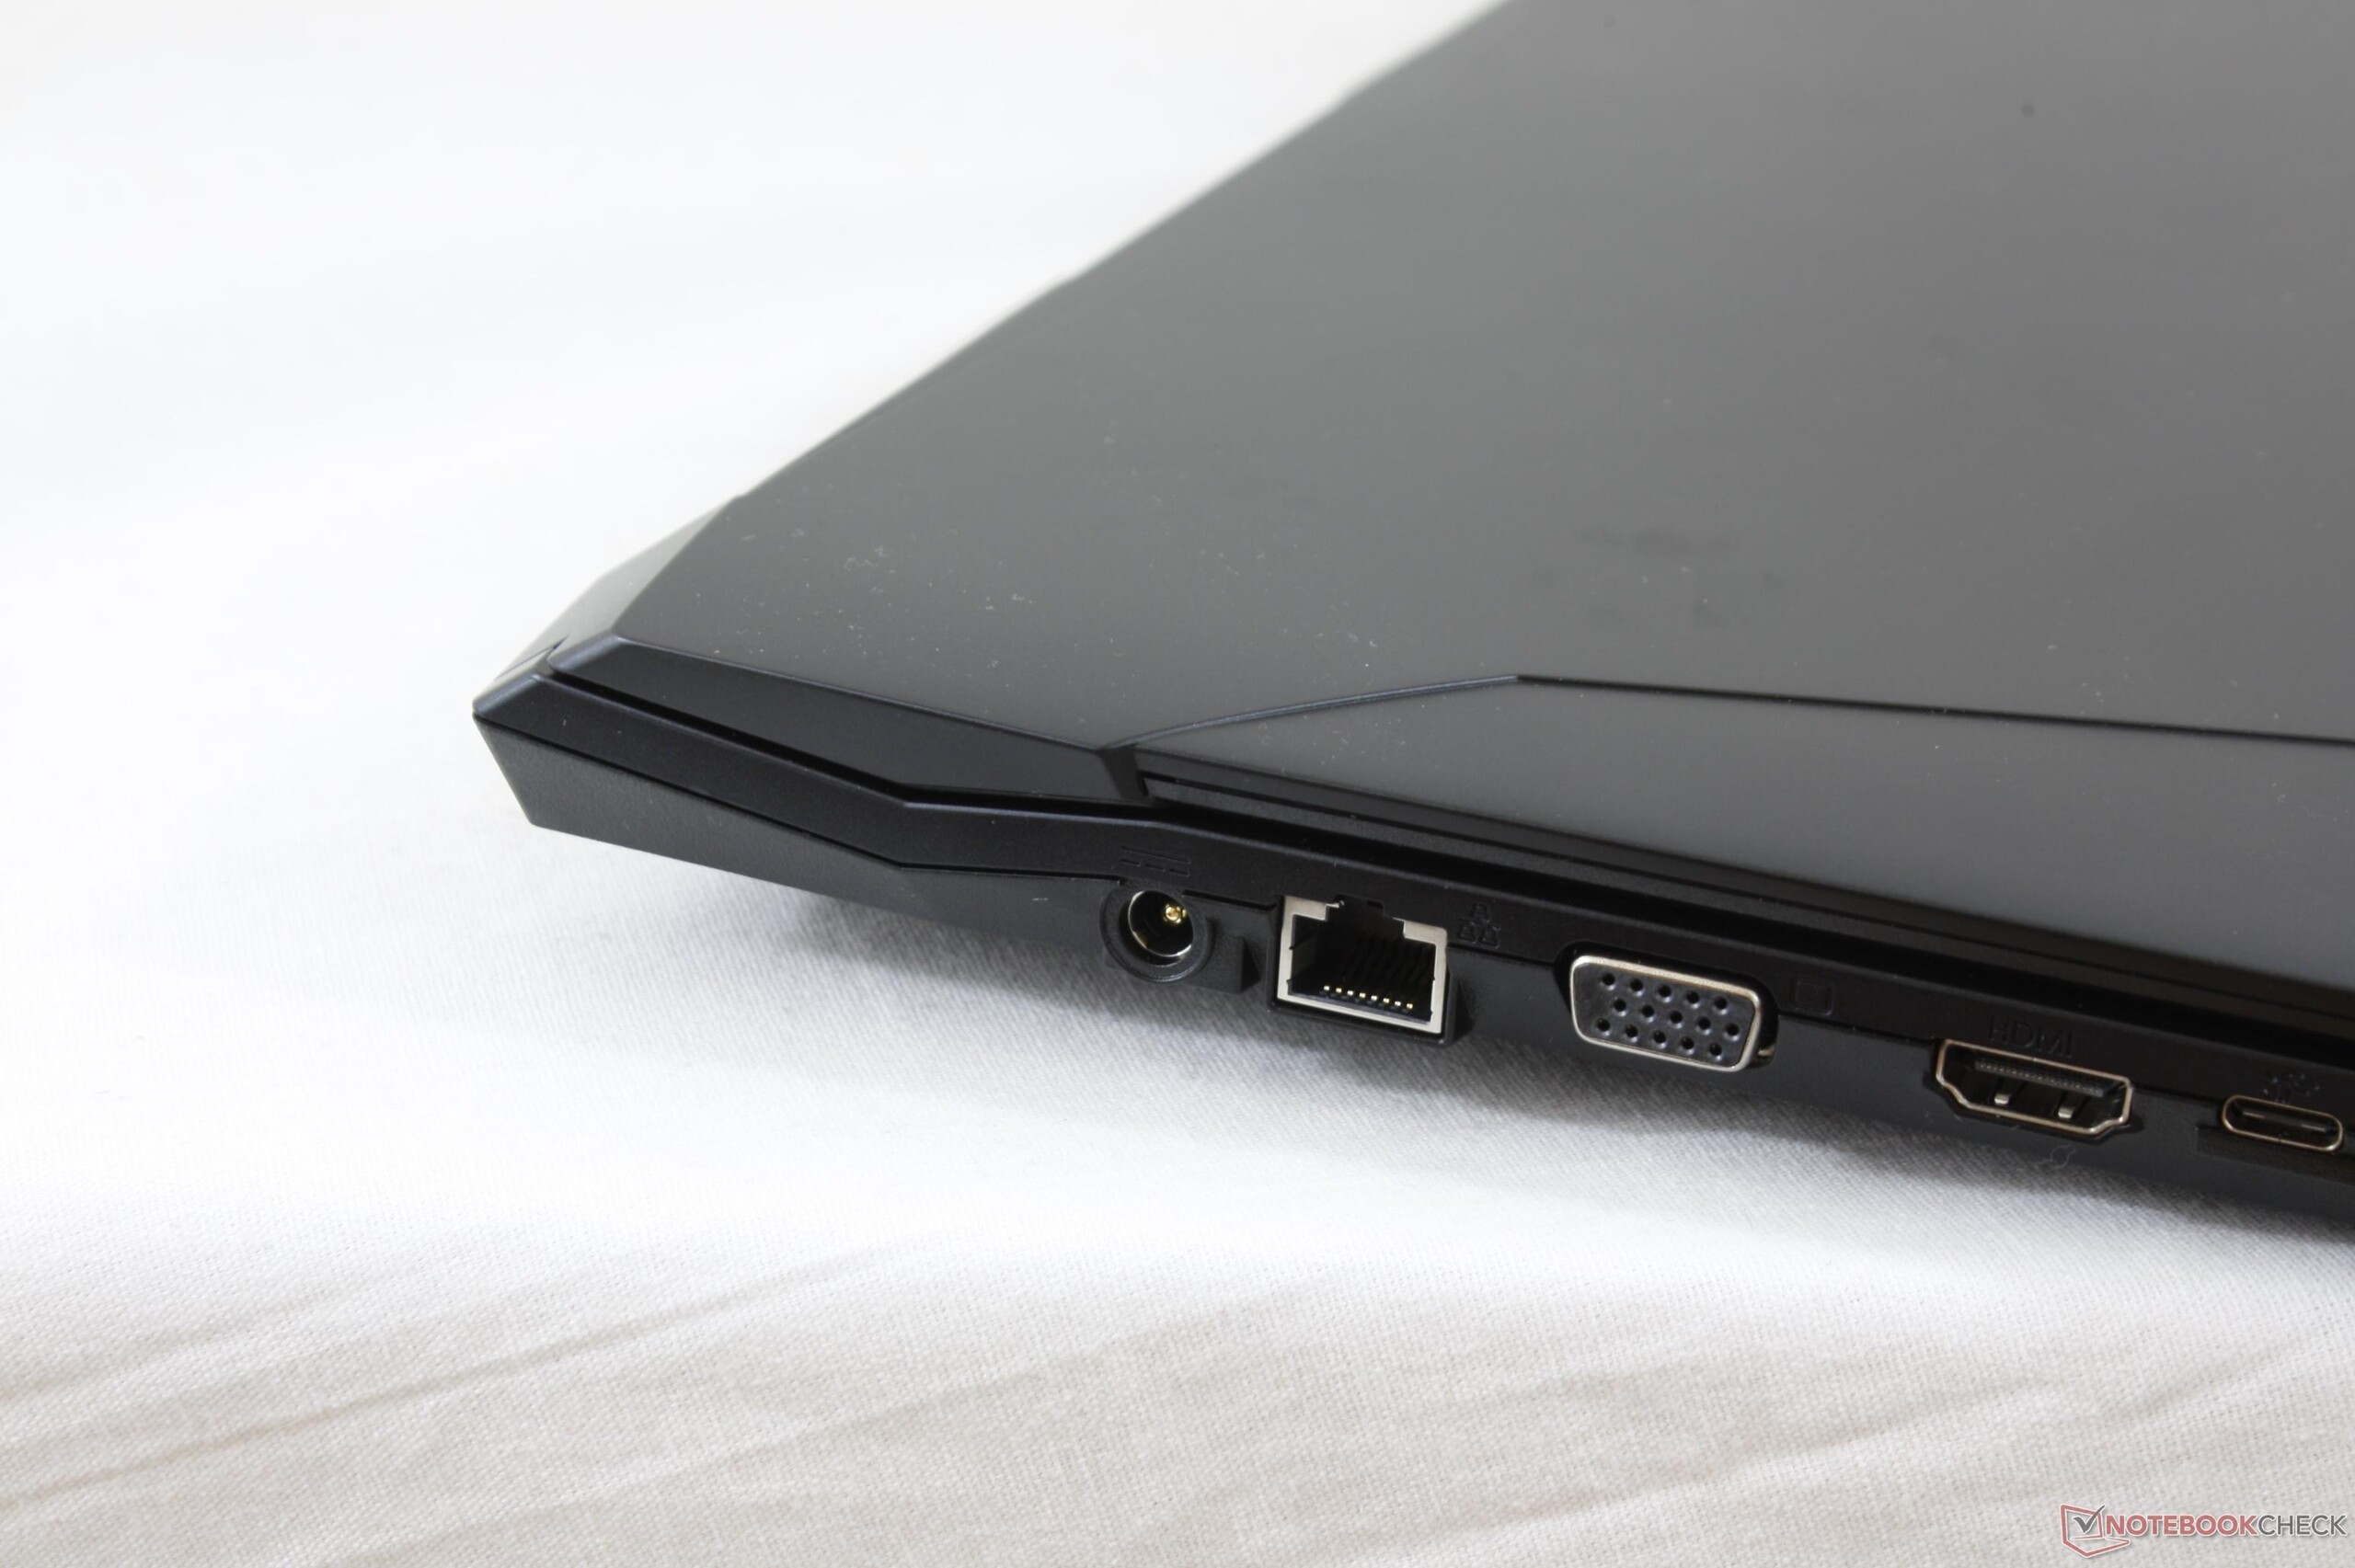
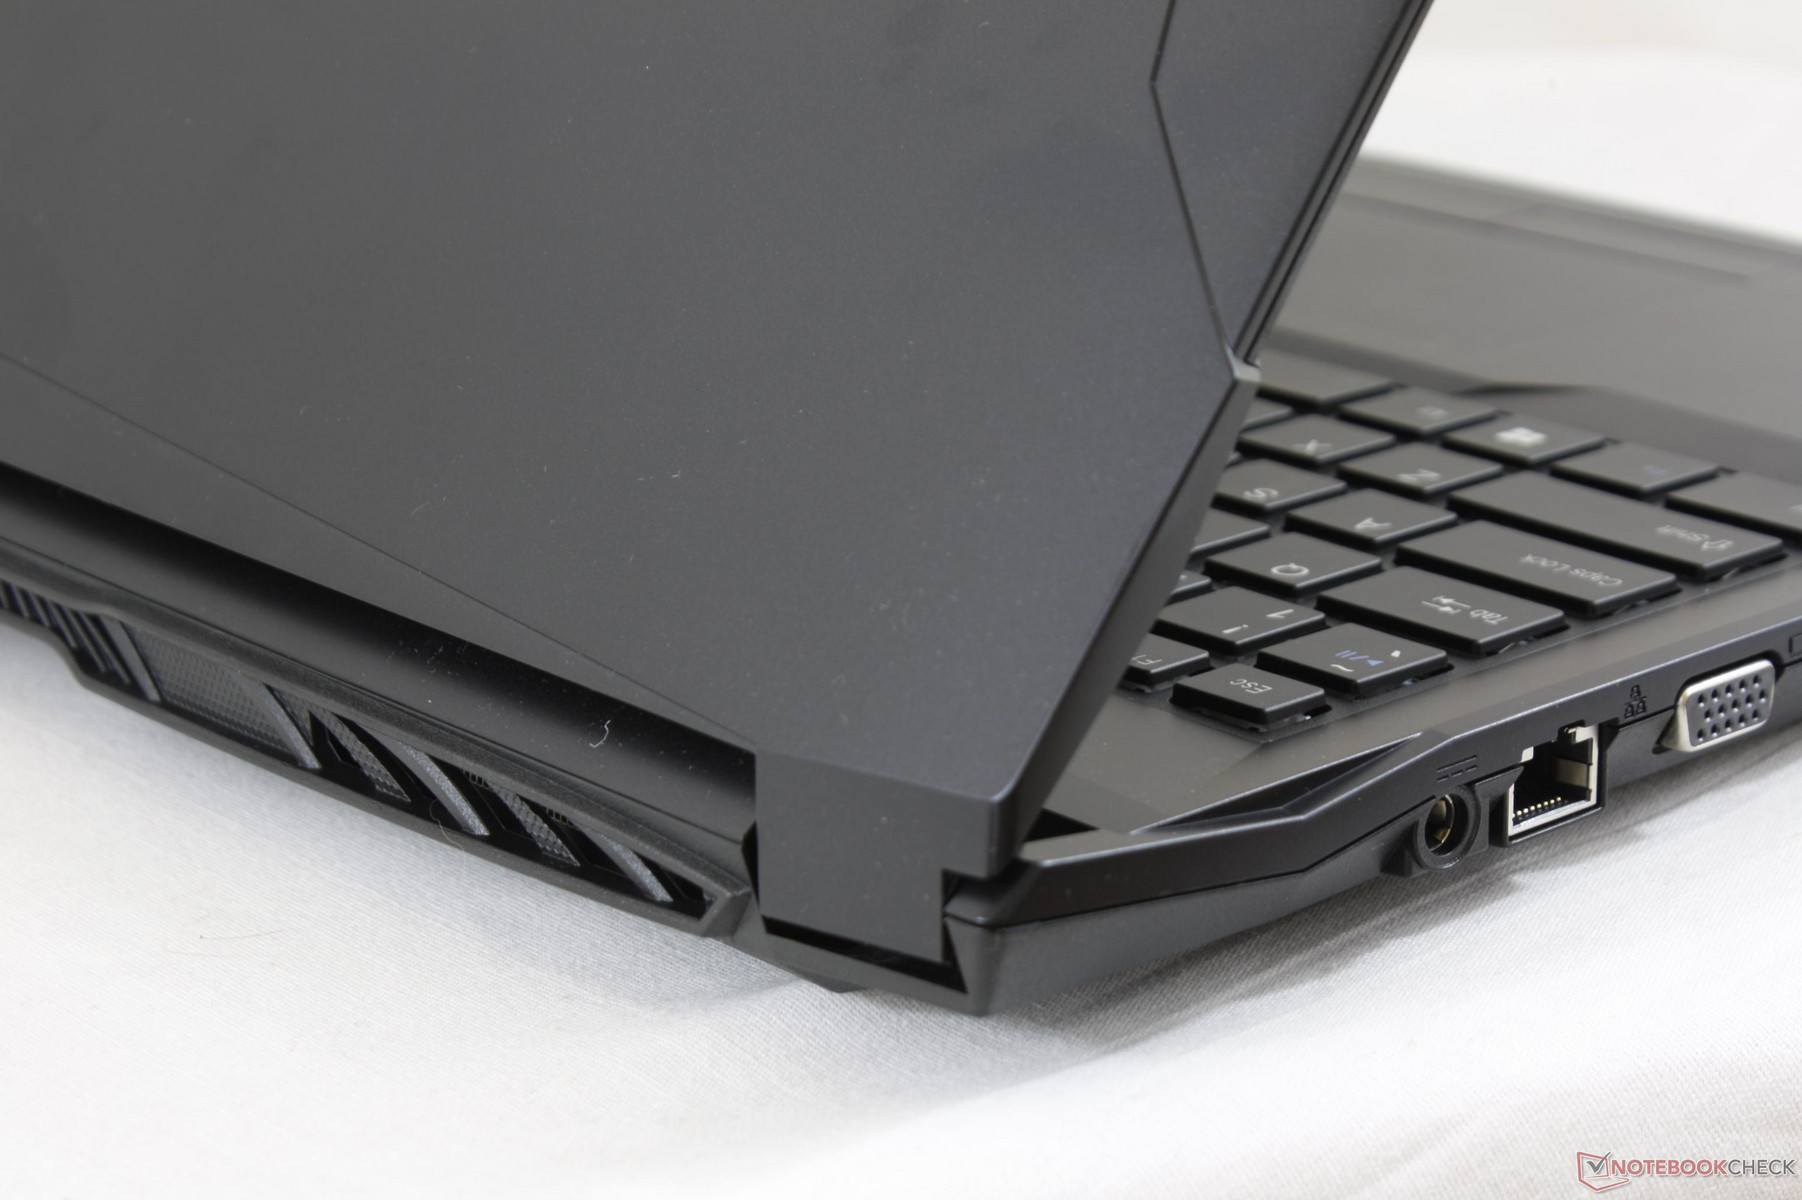
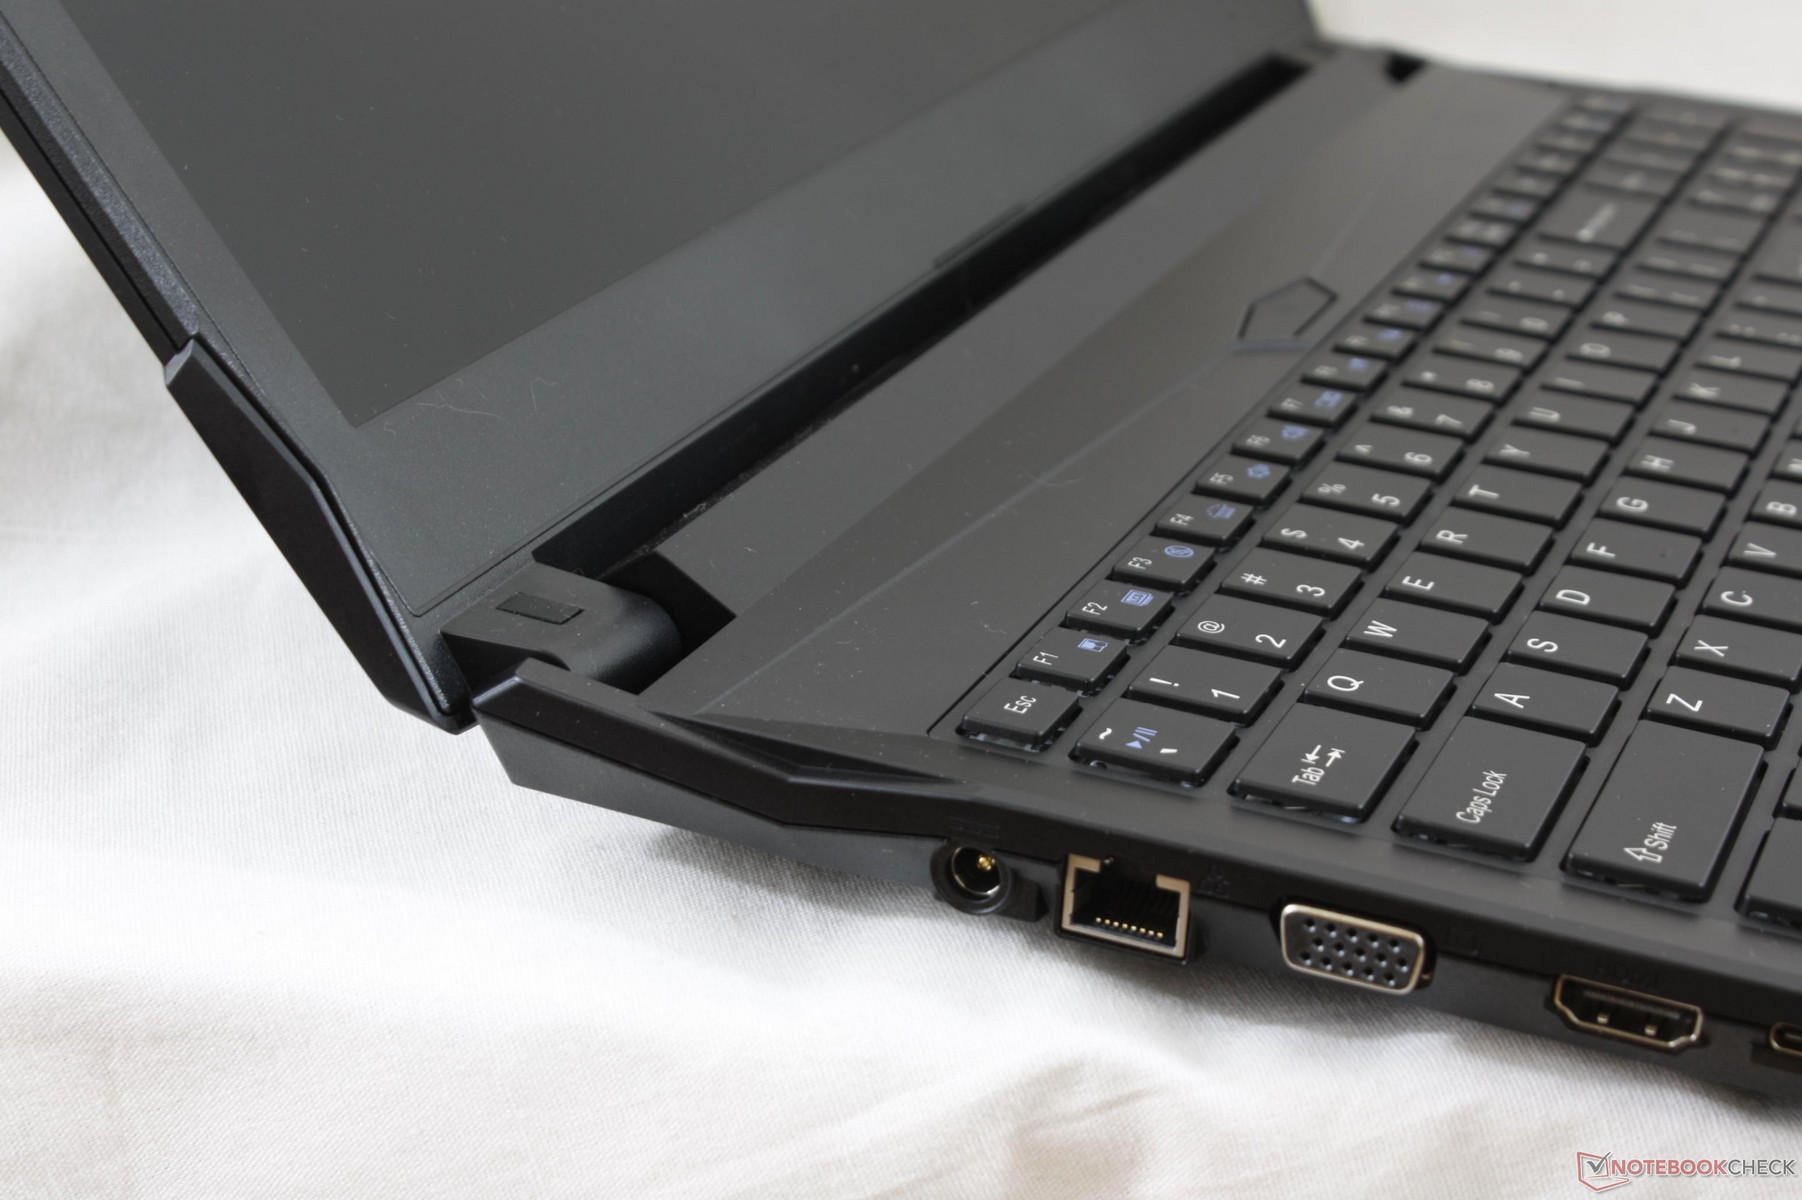
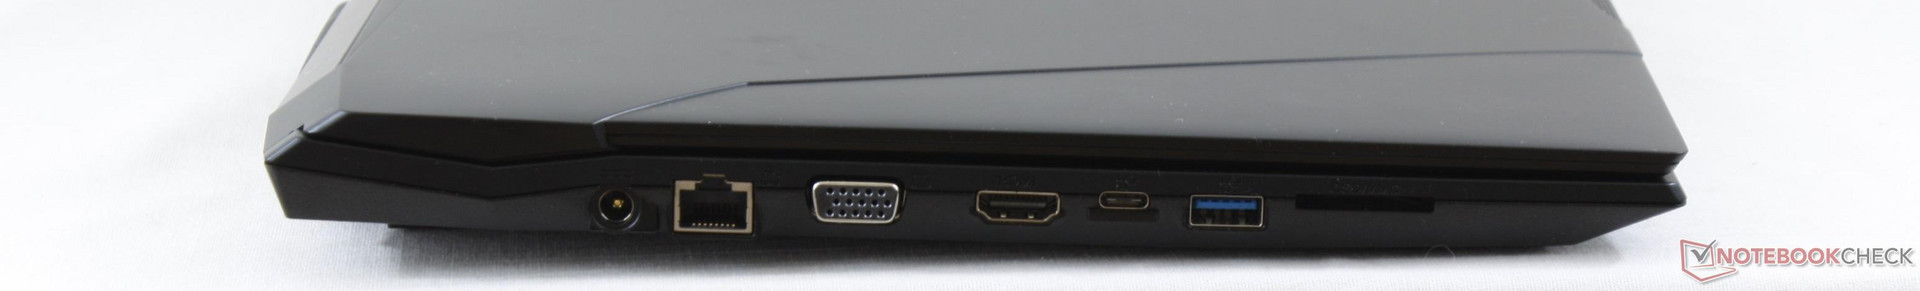
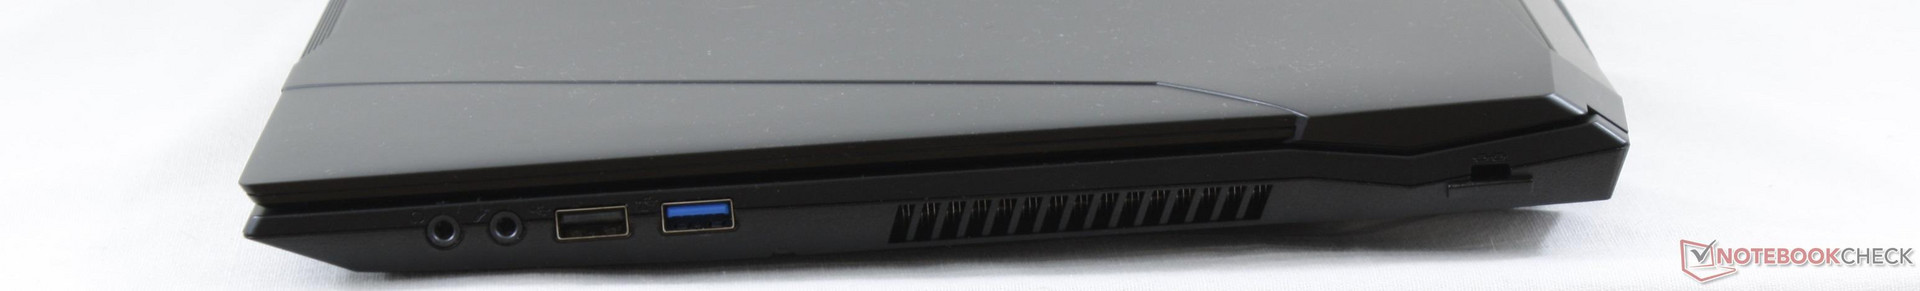
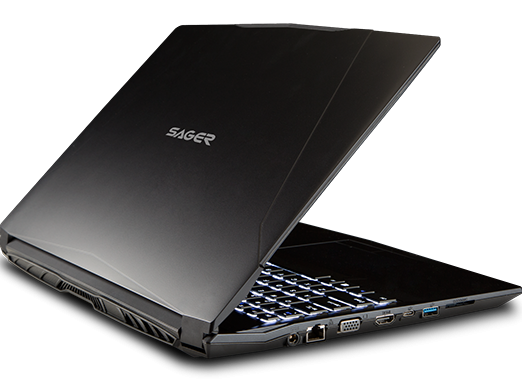
Available interfaces are identical to the Sabre 15 except that both of the mini-DisplayPort ports have been dropped in favor of a single VGA port. This was likely done to better accommodate the entry-level performance of the MX150 compared to the GTX 1050 in the Gigabyte equivalent. Unfortunately, right-handed users will lament the fact that the audio and USB ports are so close to the front edge where cables are more likely to pester when gaming.
SD Card Reader
Transfer rates from the spring-loaded card reader are average at about 86 MB/s when using our Toshiba Exceria Pro UHS-II test card. Moving 1 GB worth of images from the card to desktop will take about 14 seconds.
| SD Card Reader | |
| average JPG Copy Test (av. of 3 runs) | |
| Eurocom Tornado F5 Killer Edition | |
| Gigabyte Sabre 15G | |
| Sager NP5852 | |
| MSI GS63VR 7RF-228US | |
| maximum AS SSD Seq Read Test (1GB) | |
| Eurocom Tornado F5 Killer Edition | |
| Gigabyte Sabre 15G | |
| Sager NP5852 | |
| MSI GS63VR 7RF-228US | |
Communication
The same Intel 3168 M.2 2230 module that ships with the Sabre 15 is present here on the NP5852. This 1x1 802.11ac card promises a theoretical maximum transfer rate of 433 Mbps while our real-world test standing one meter away from our Linksys EA8500 router returns a throughput of 310 Mbps. Interestingly, client-side speeds are noticeably slower at 170 Mbps even after several retries. Users can still install 2x2 Killer 1535 or Intel 7265 M.2 cards if faster speeds are desired as Sager offers no such pre-configured options.
| Networking | |
| iperf3 transmit AX12 | |
| MSI GS63VR 7RF-228US | |
| Gigabyte Sabre 15G | |
| Sager NP5852 | |
| iperf3 receive AX12 | |
| MSI GS63VR 7RF-228US | |
| Gigabyte Sabre 15G | |
| Sager NP5852 | |
Accessories
Extras include a drivers CD, Quick Start guide, and a few HDD screws. Note that an external optical drive will be required to actual make use of the drivers disk.
Maintenance
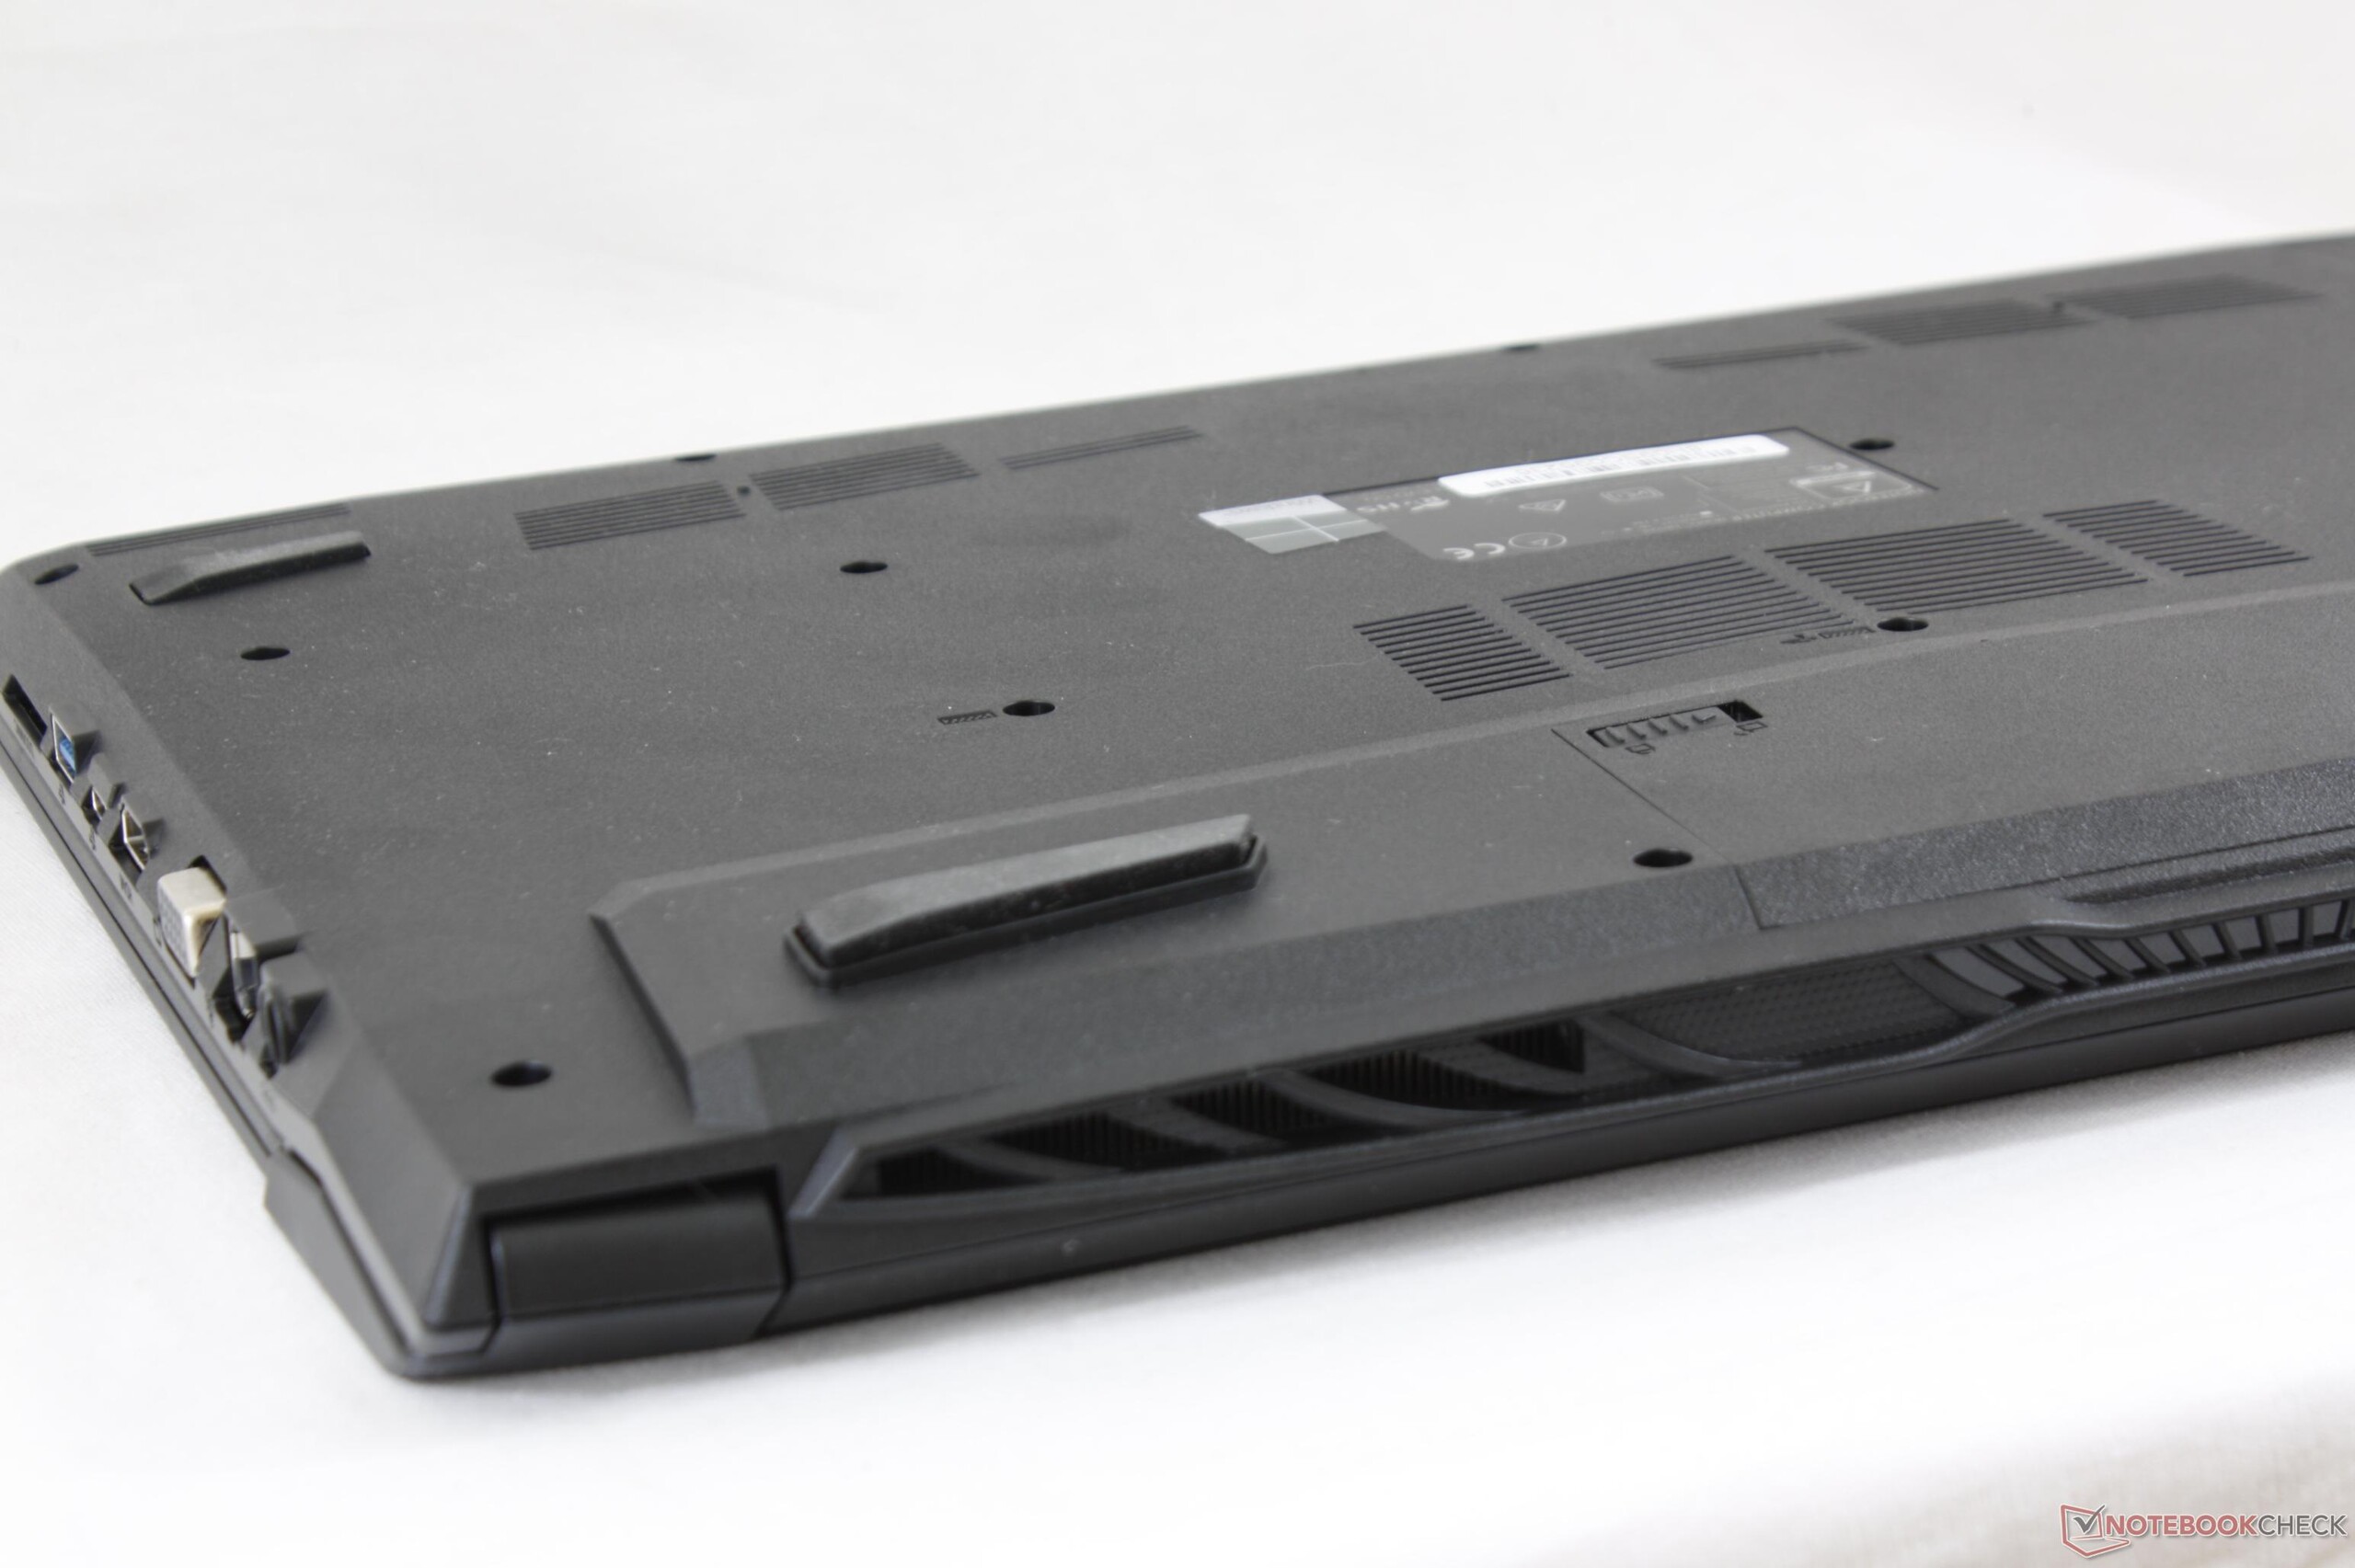
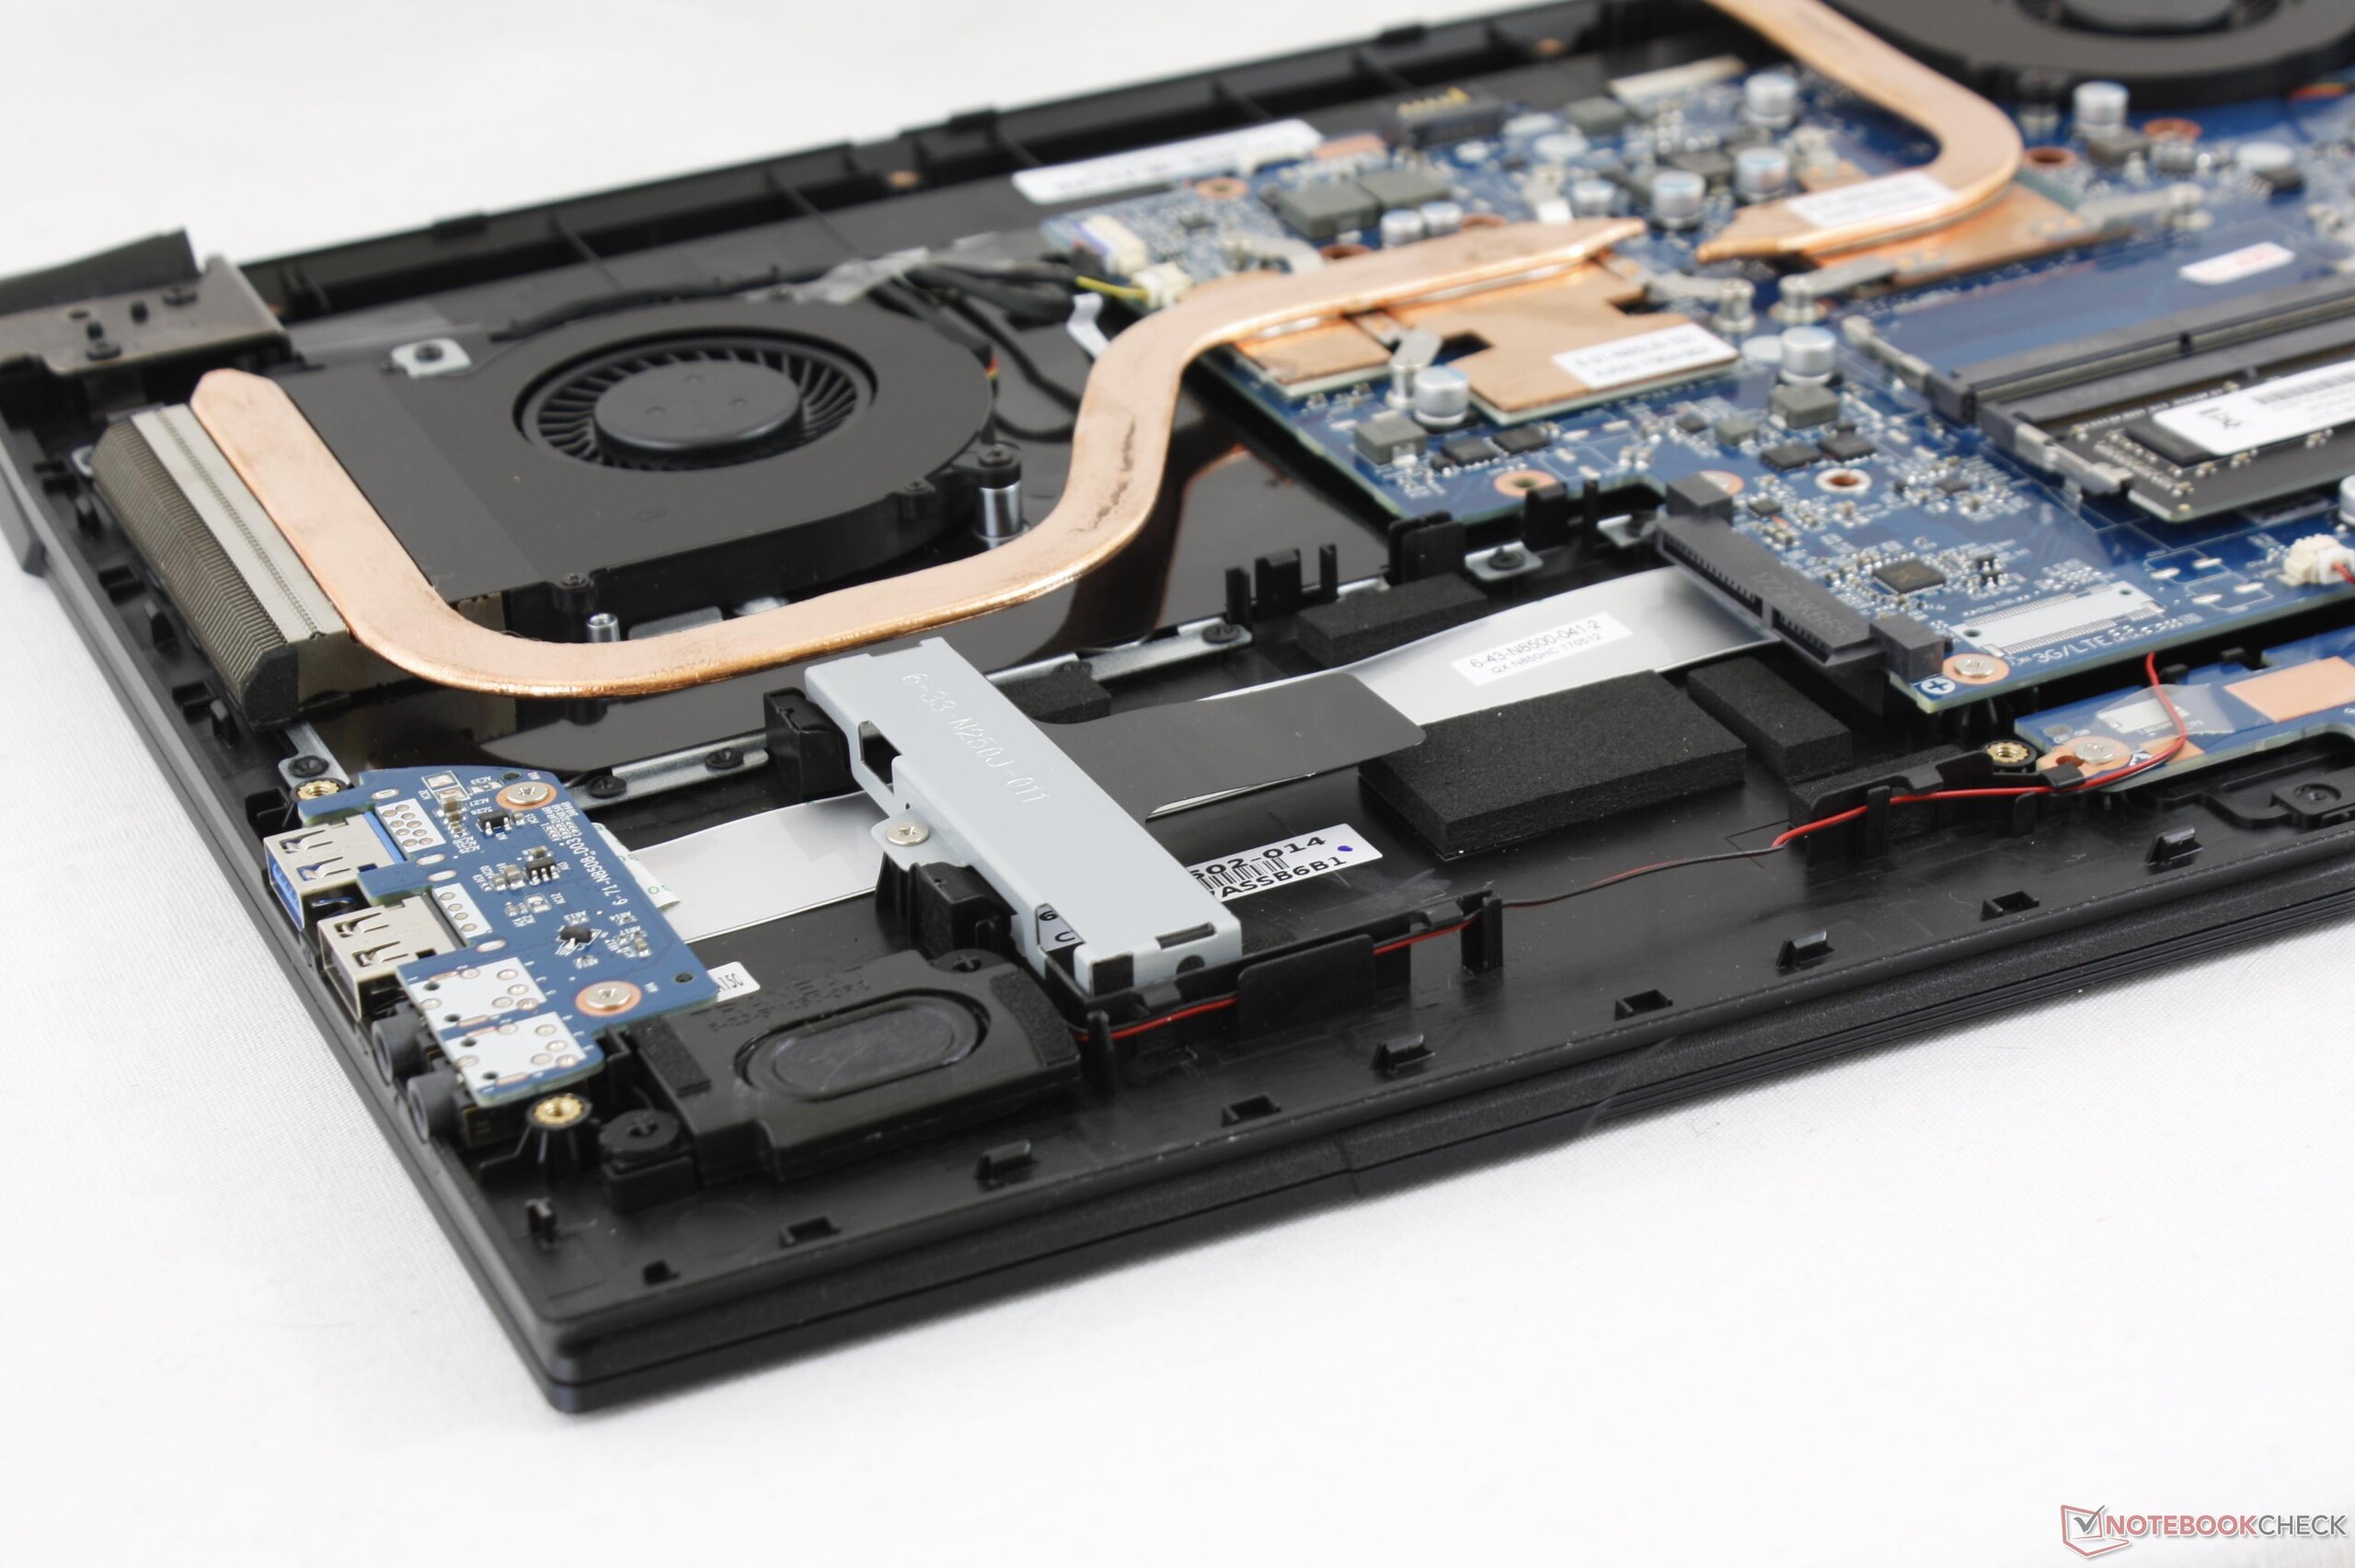
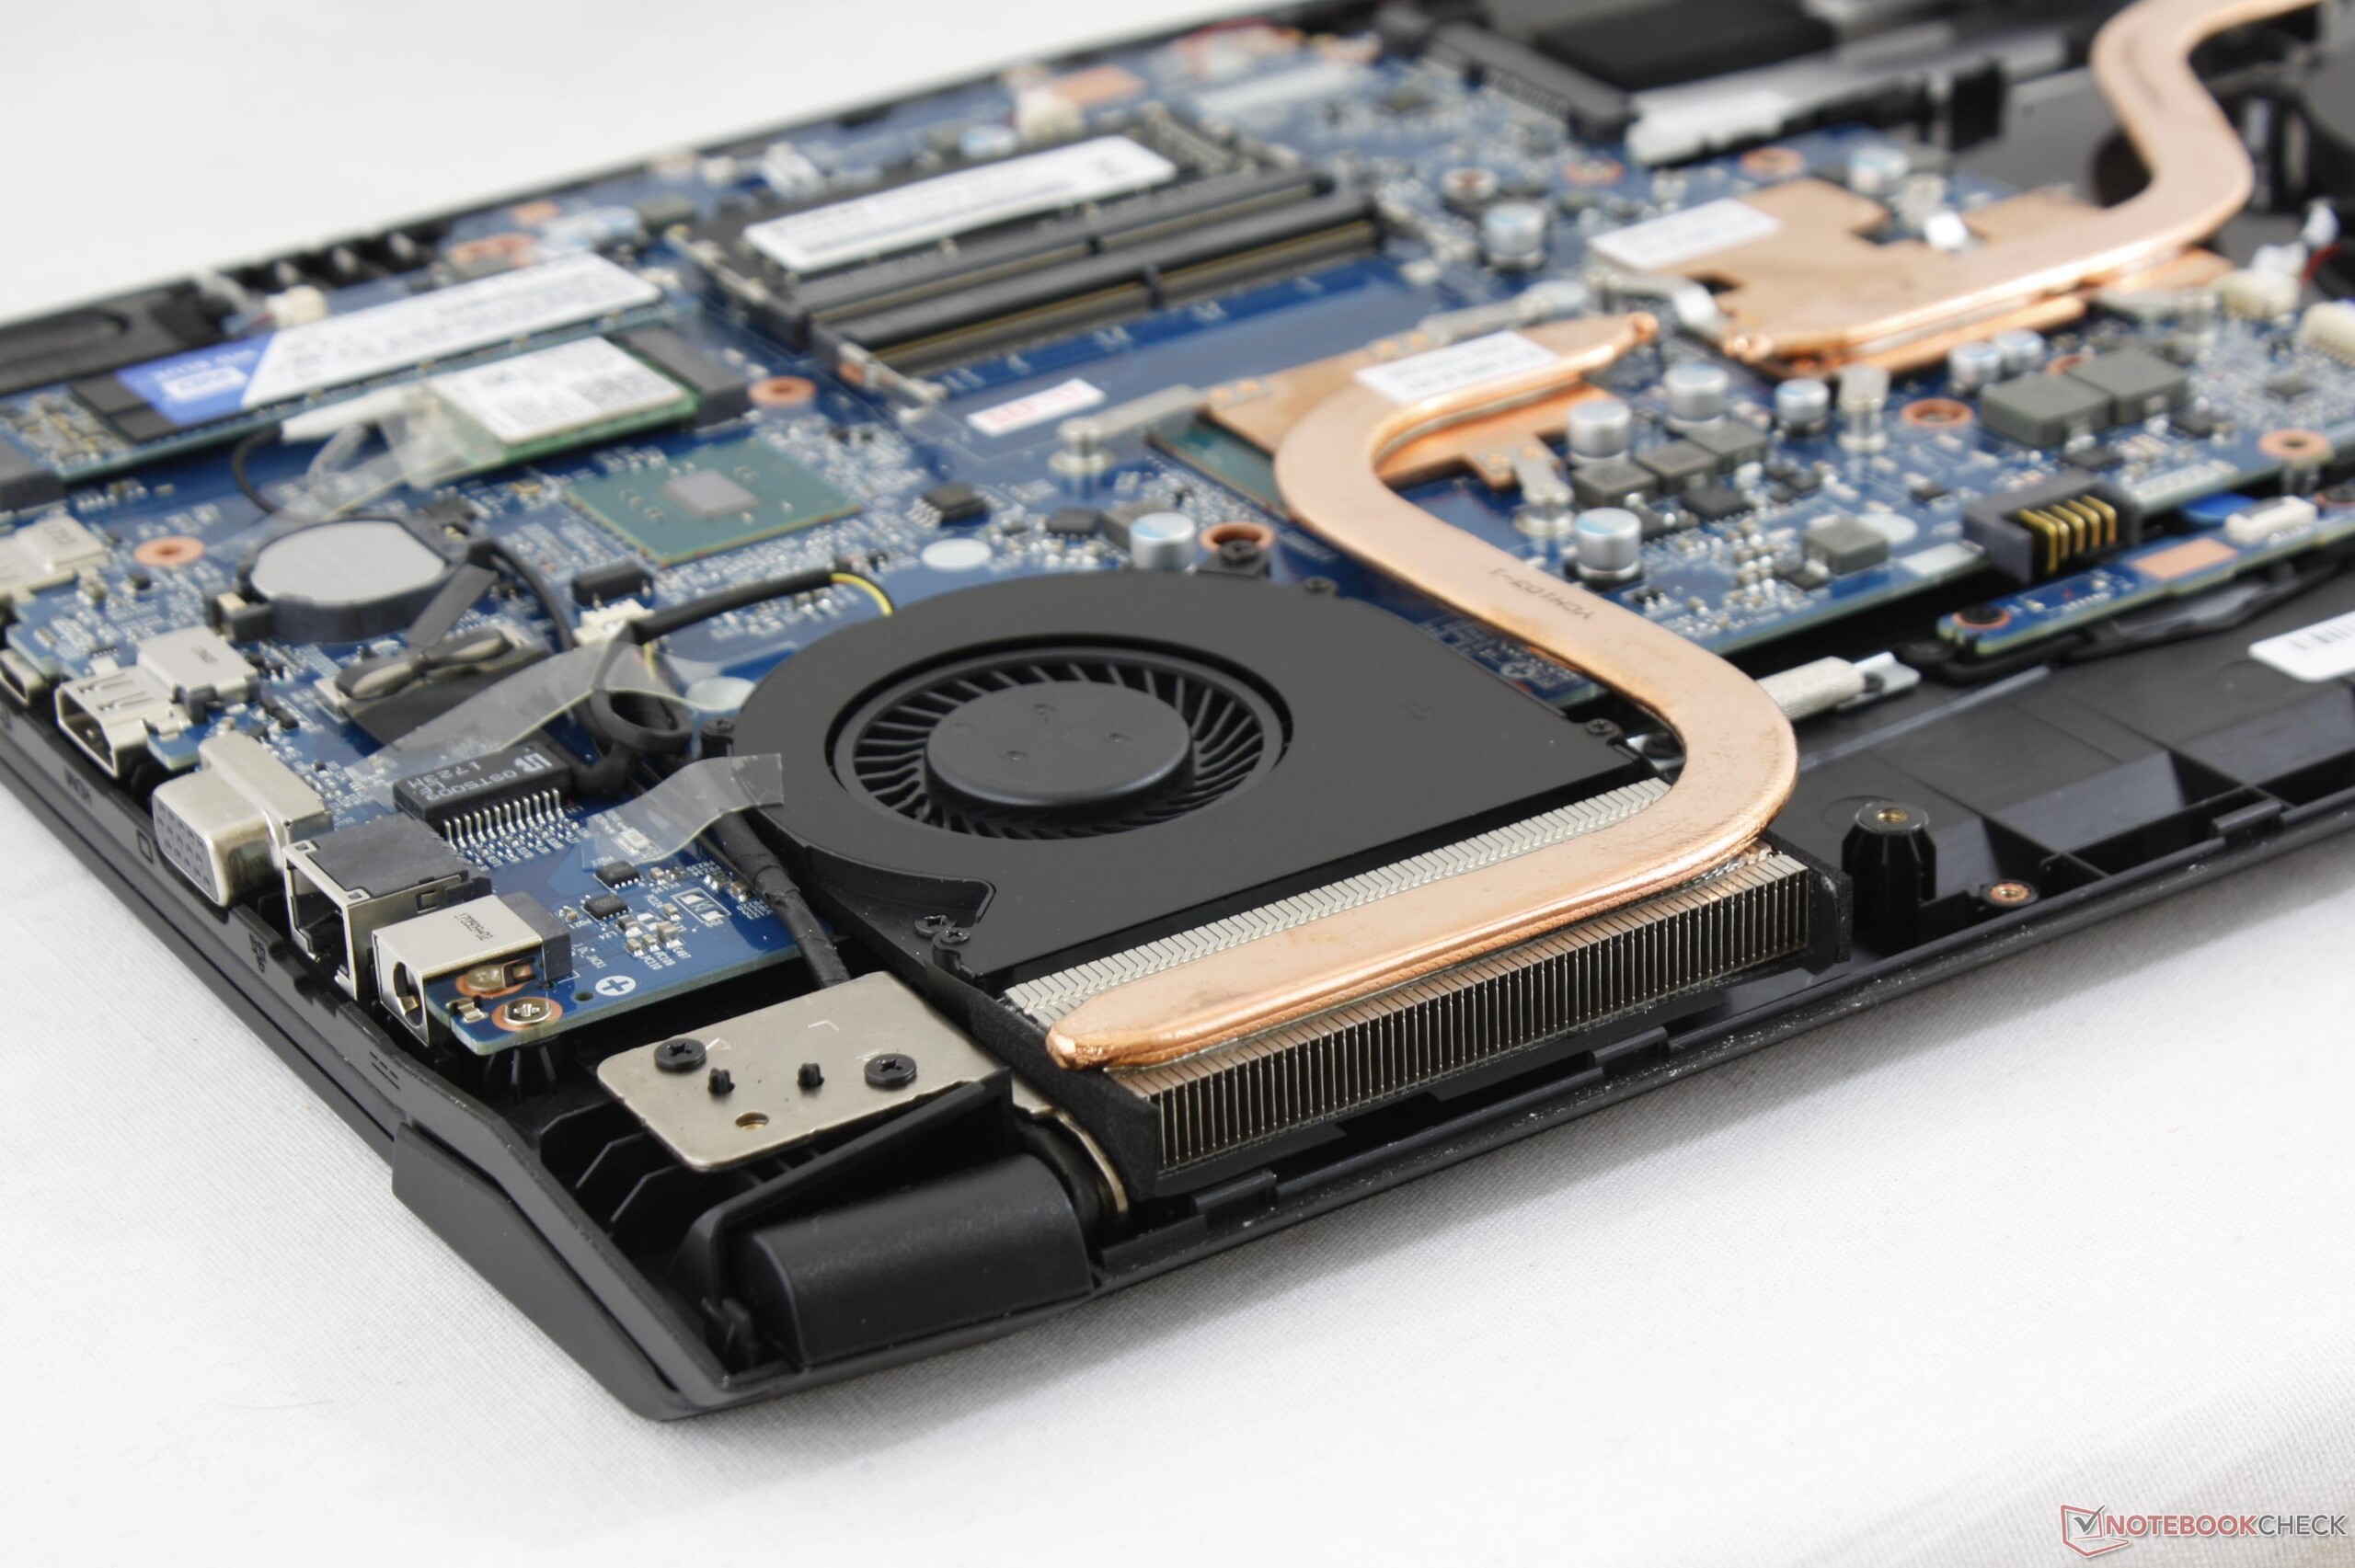
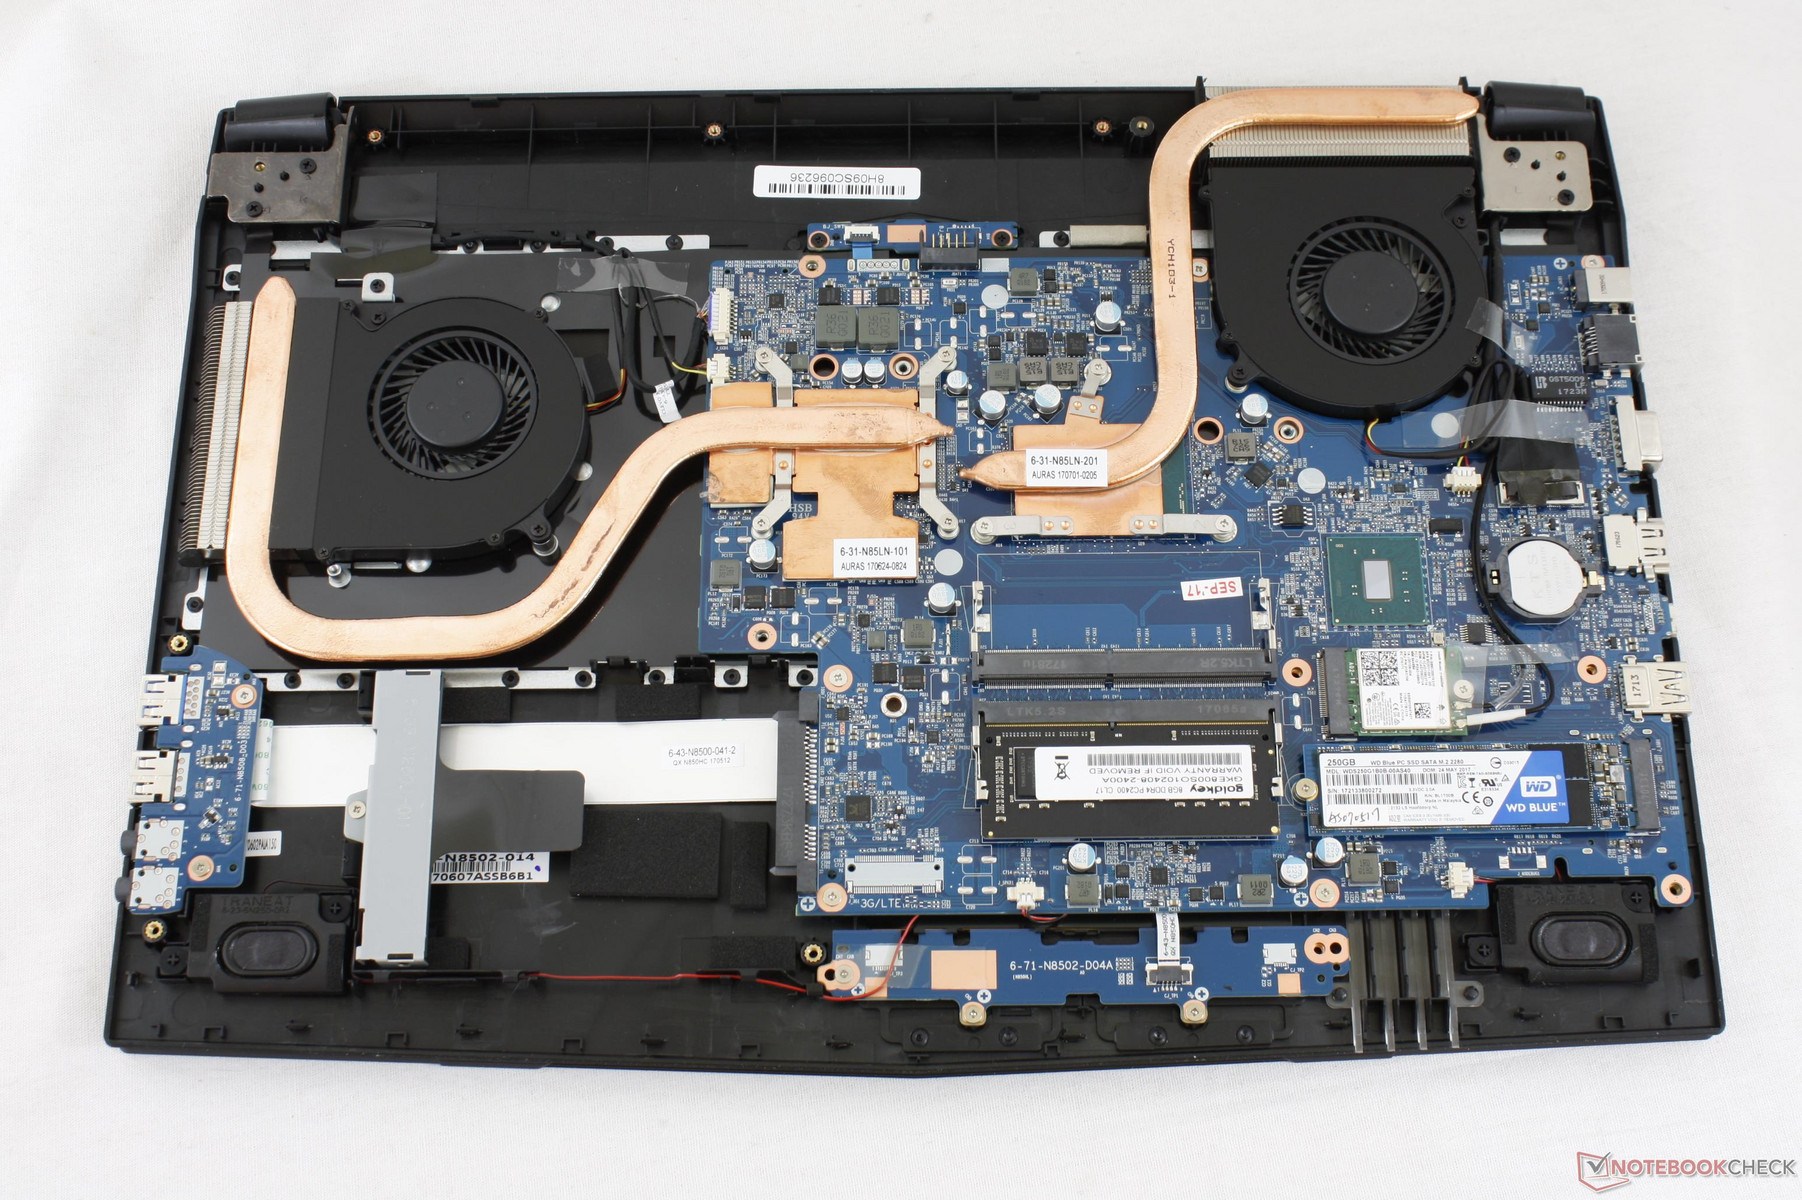
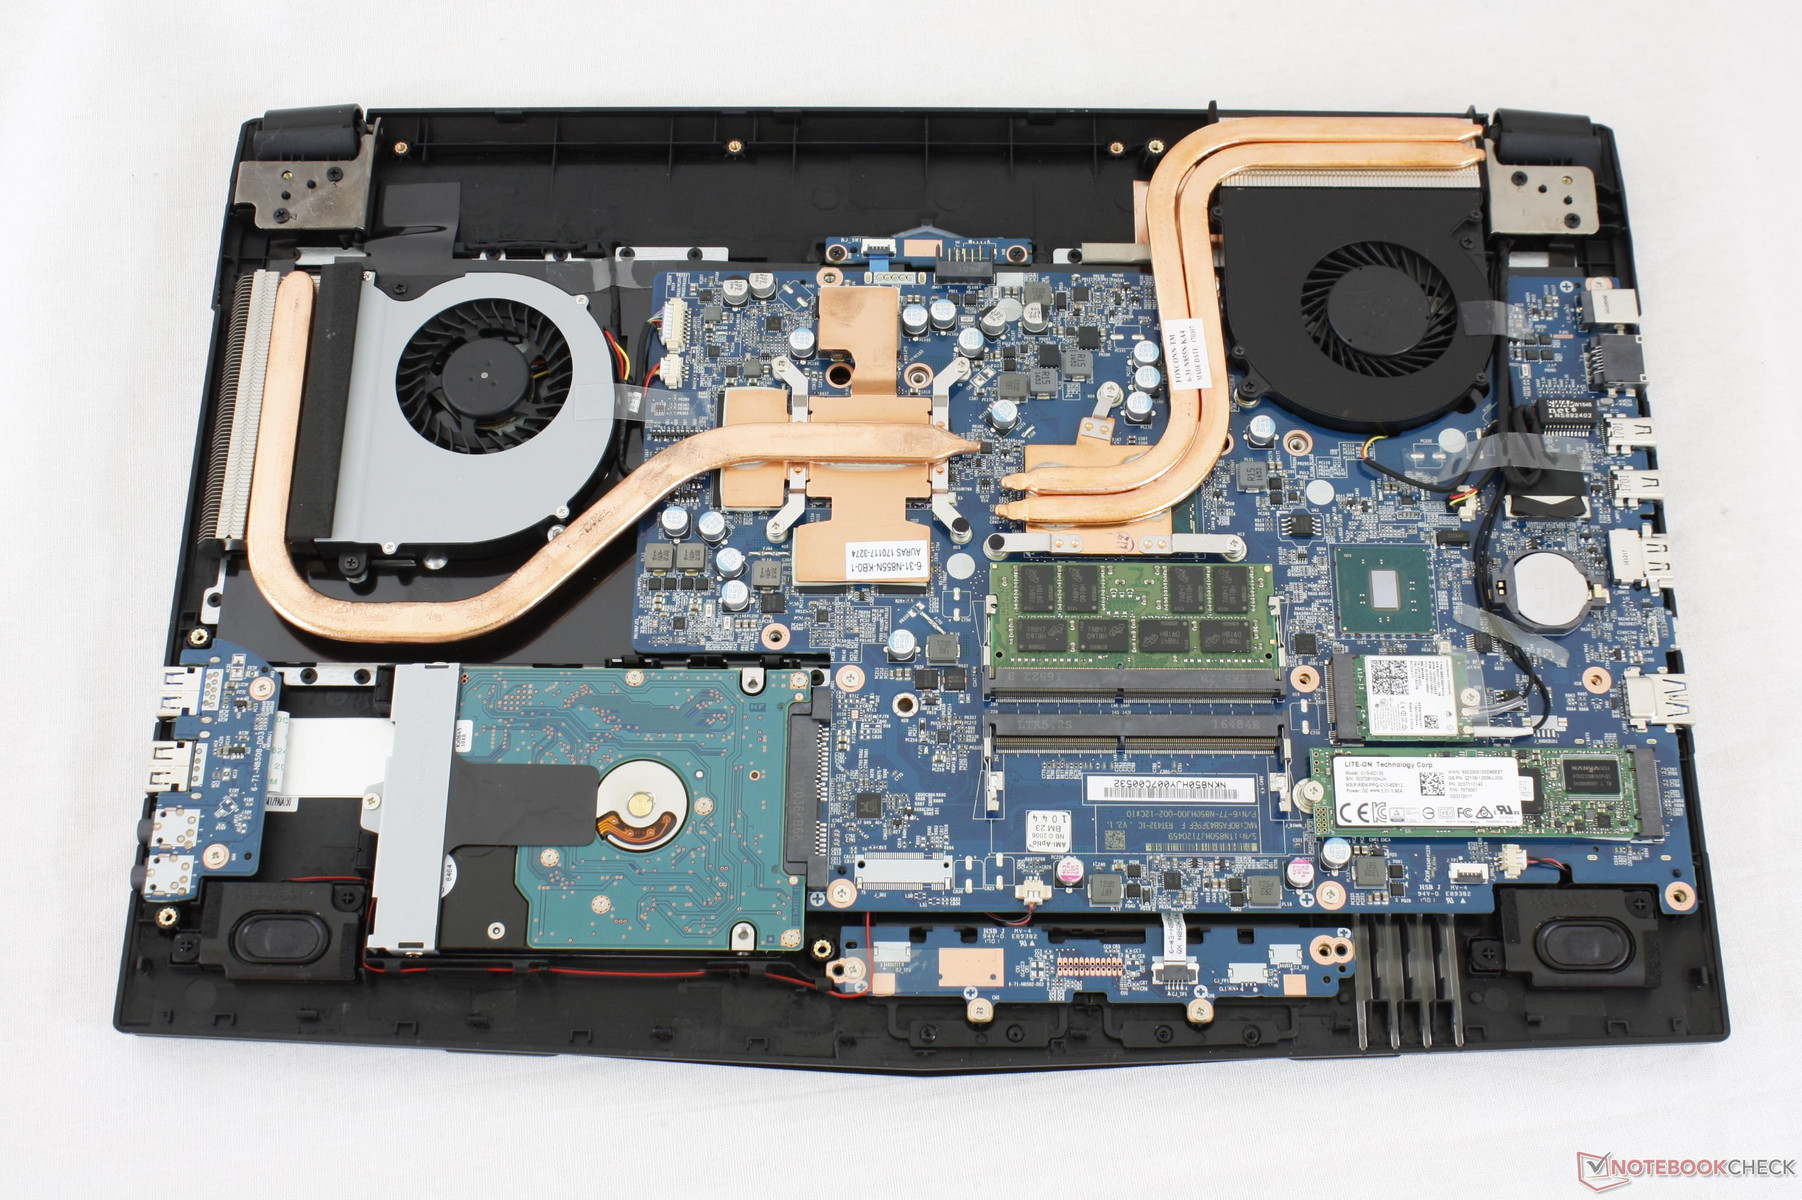
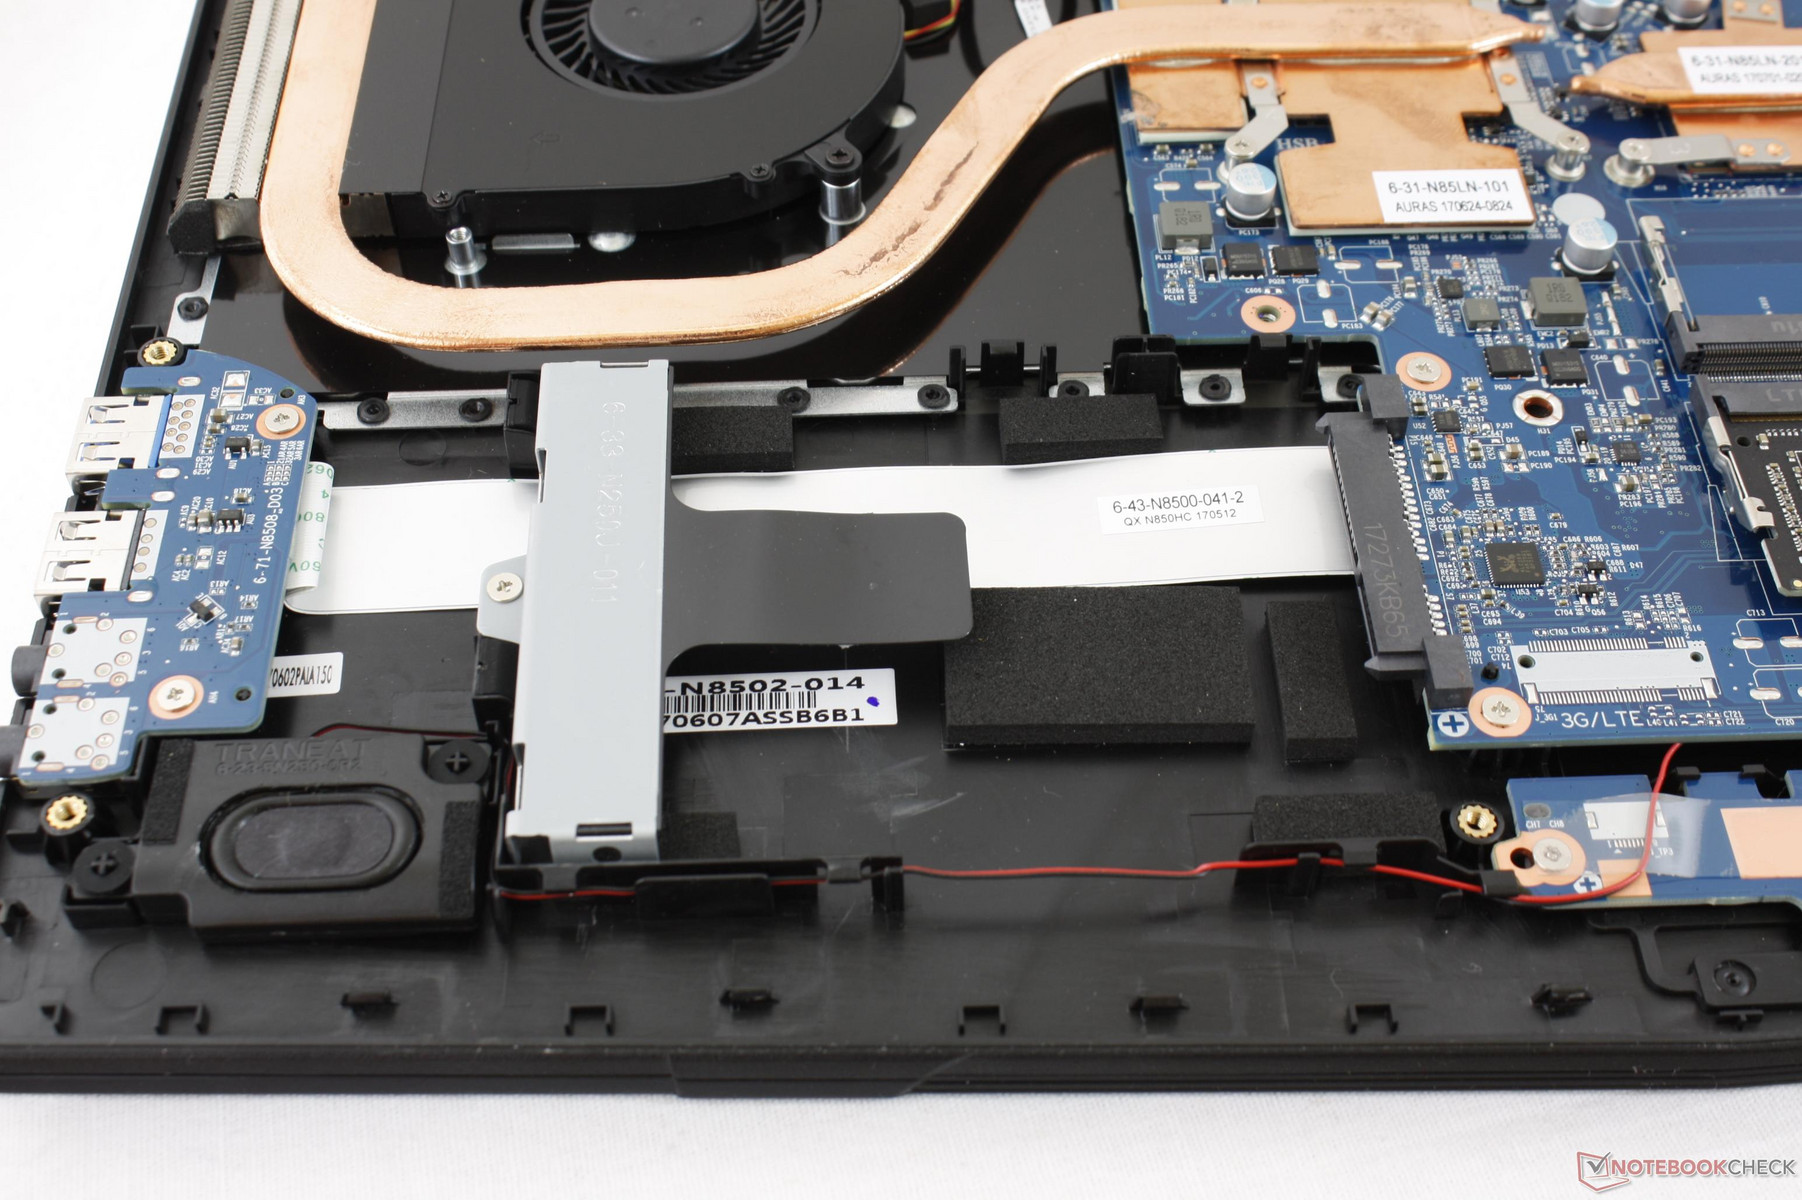
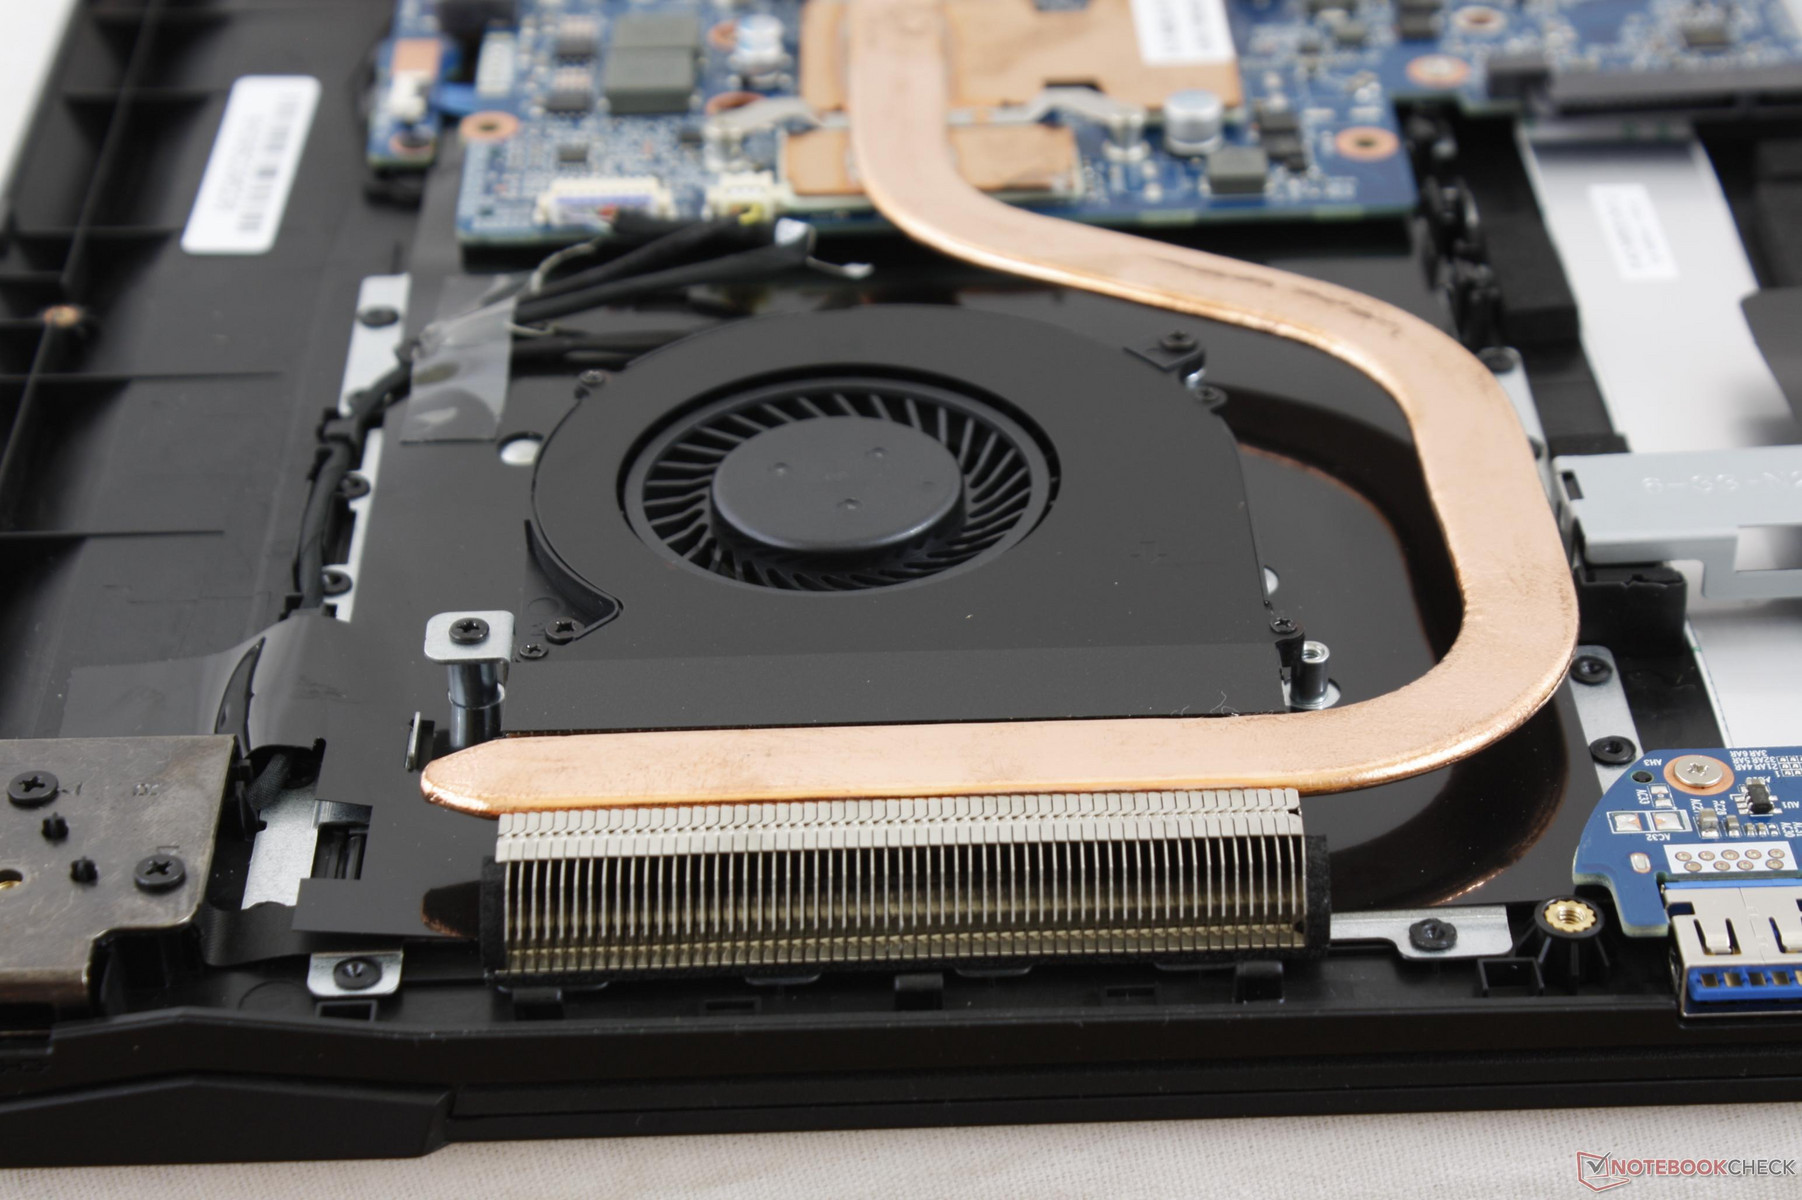
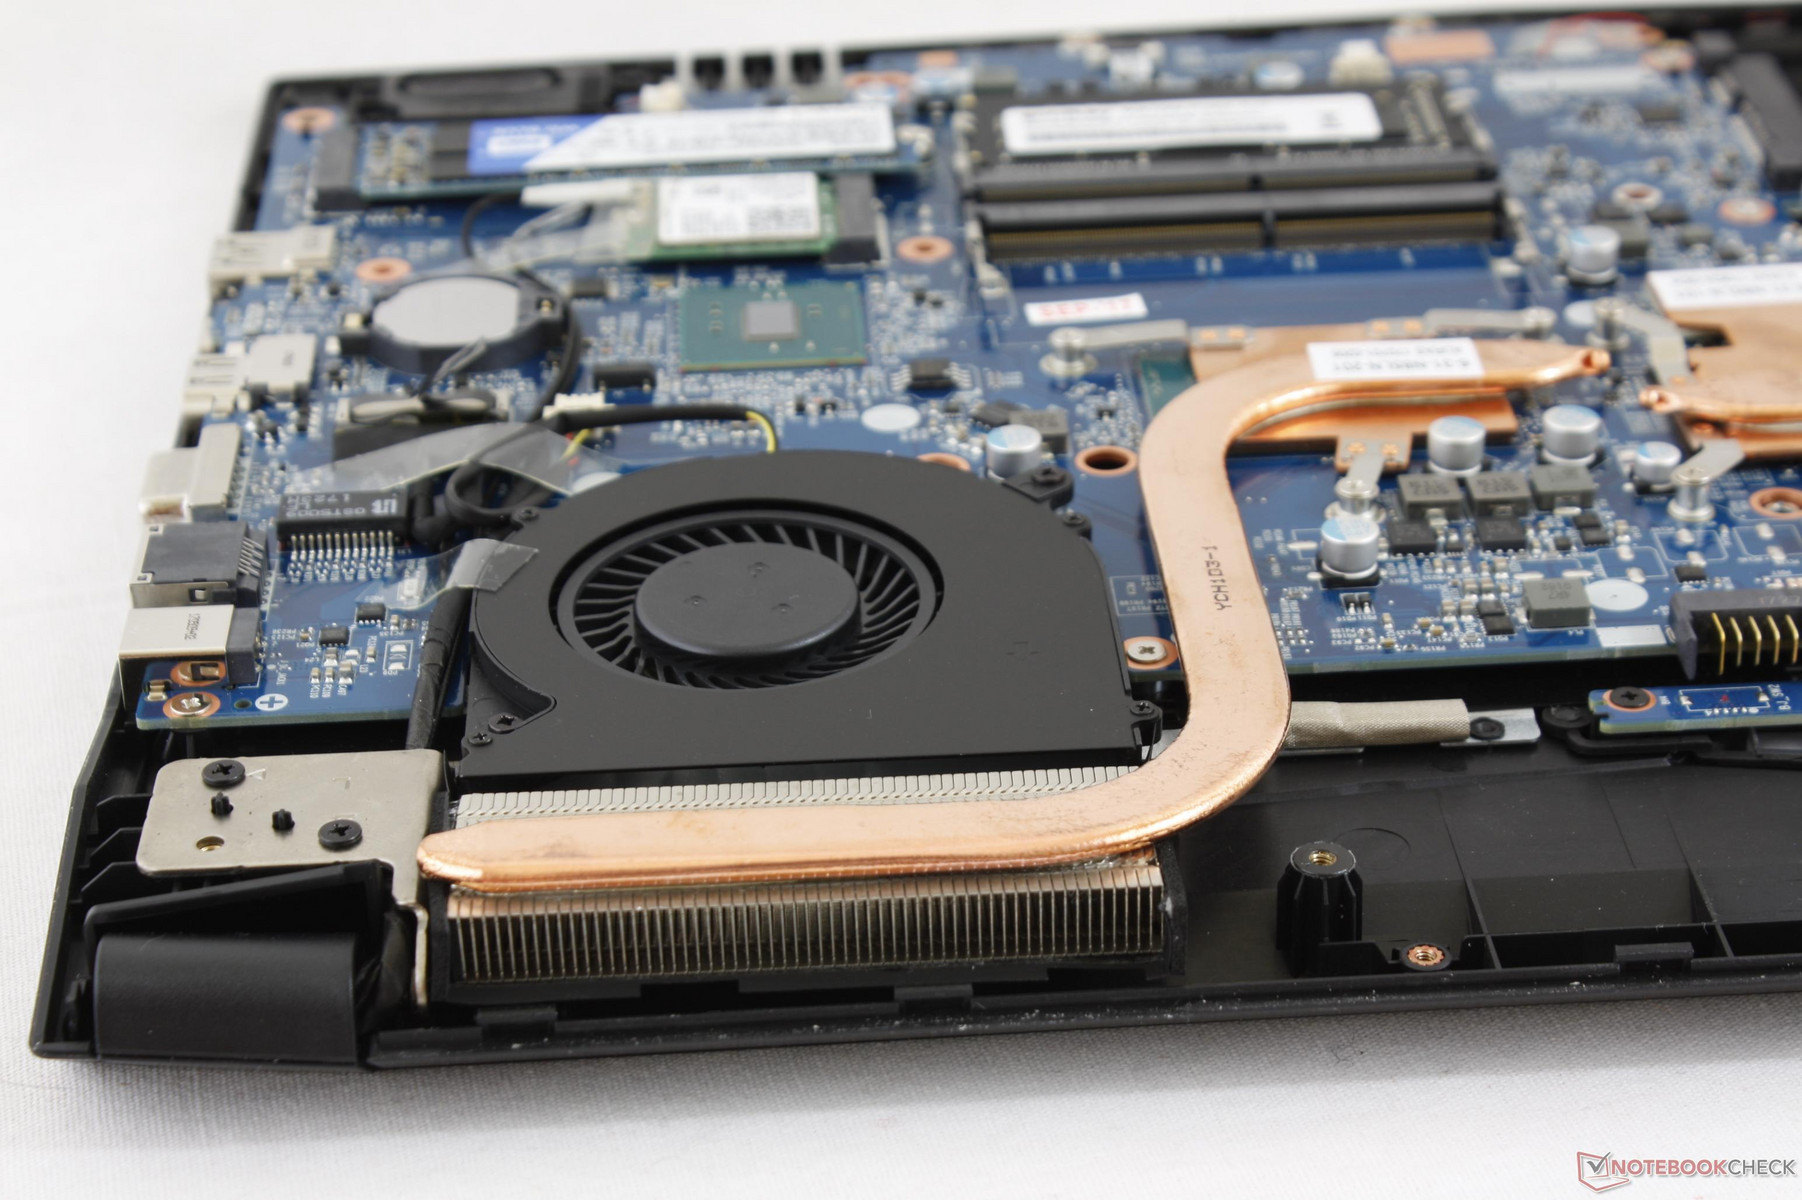
Serviceability is easy if not a bit troublesome since there are a total of 17 (!) Philips screws to remove from the bottom. Users have access to all core components including two DDR4 SODIMM slots, two storage bays, the BIOS battery, and the cooling solution. The setup is nearly identical to the Sabre 15 with the most noticeable difference being the extra heat pipe on the more powerful Gigabyte variant.
Warranty
The standard one-year limited warranty applies. Sager offers up to three years optional warranty for all of its laptops with a free 30-day return policy.
Input Devices
Keyboard & Touchpad
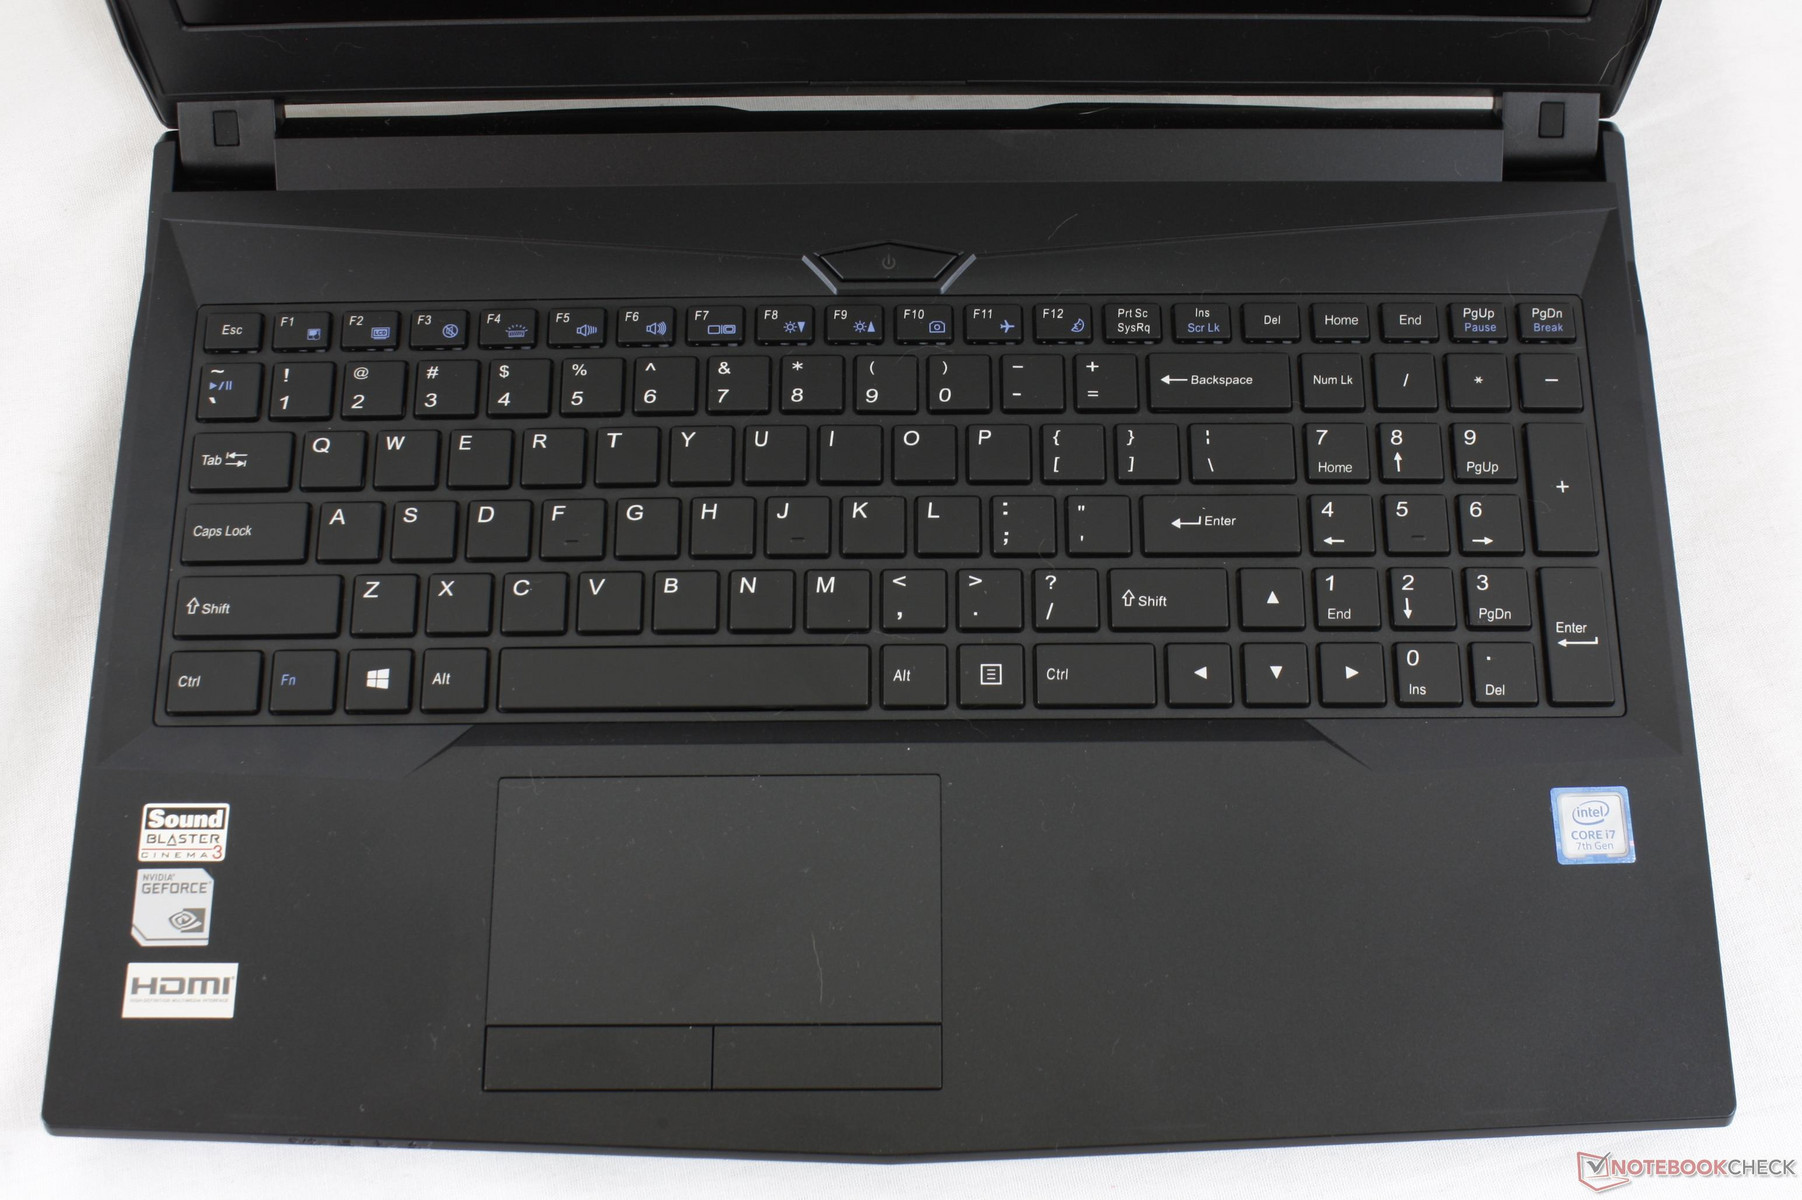
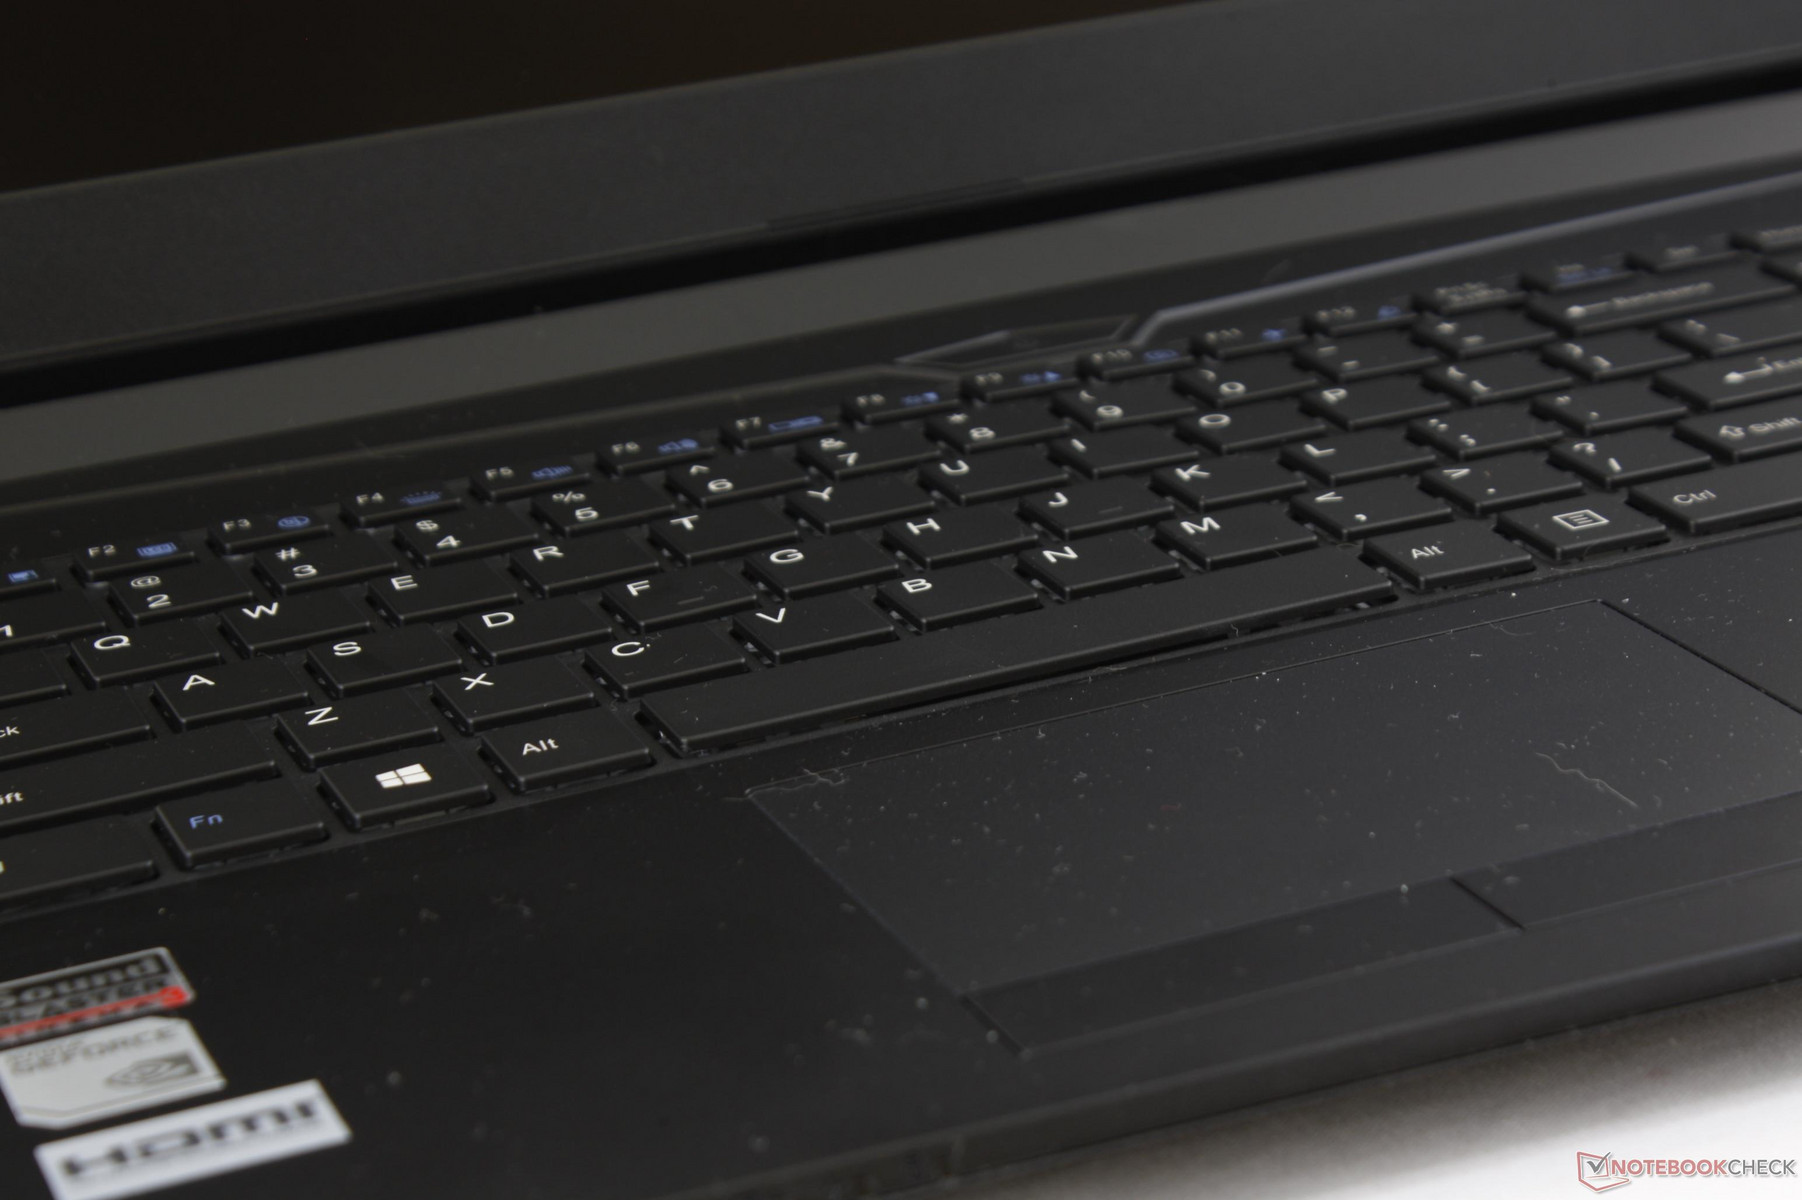
We refer to our Sabre 15 page for our thoughts on the five-level backlit Chiclet keyboard and trackpad (10.2 x 5.8 cm). In general, the keyboard keys are slightly firmer and louder than the keys on the thinner Eurocom Q5 for a comfortable typing experience. Feedback is even across all QWERTY and NumPad keys which is more than what we can say for certain budget gaming notebooks. The trackpad is also firm and responsive with no cursor jumping if gliding slowly. Its surface is slightly roughened and works well if fingers happen to be a little oily. The dedicated mouse keys are unfortunately spongier with weak feedback and feel more cheaply made compared to the mouse keys on the larger MSI GT series.
The same Flexikey, Control Center, and SoundBlaster Cinema 3 software that shipped with the Sabre 15 is present here on the NP5852.
Display
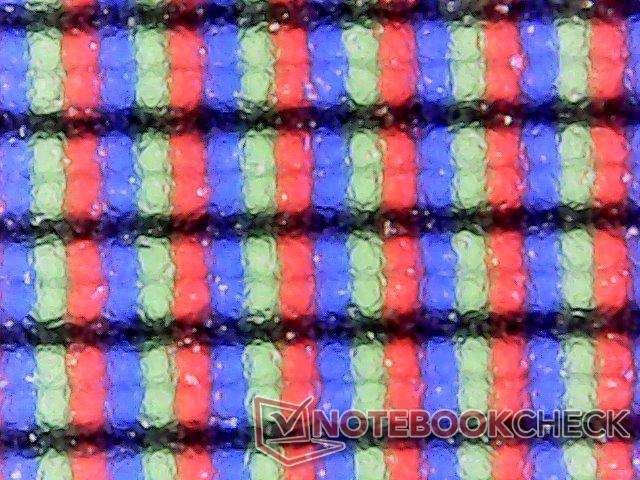
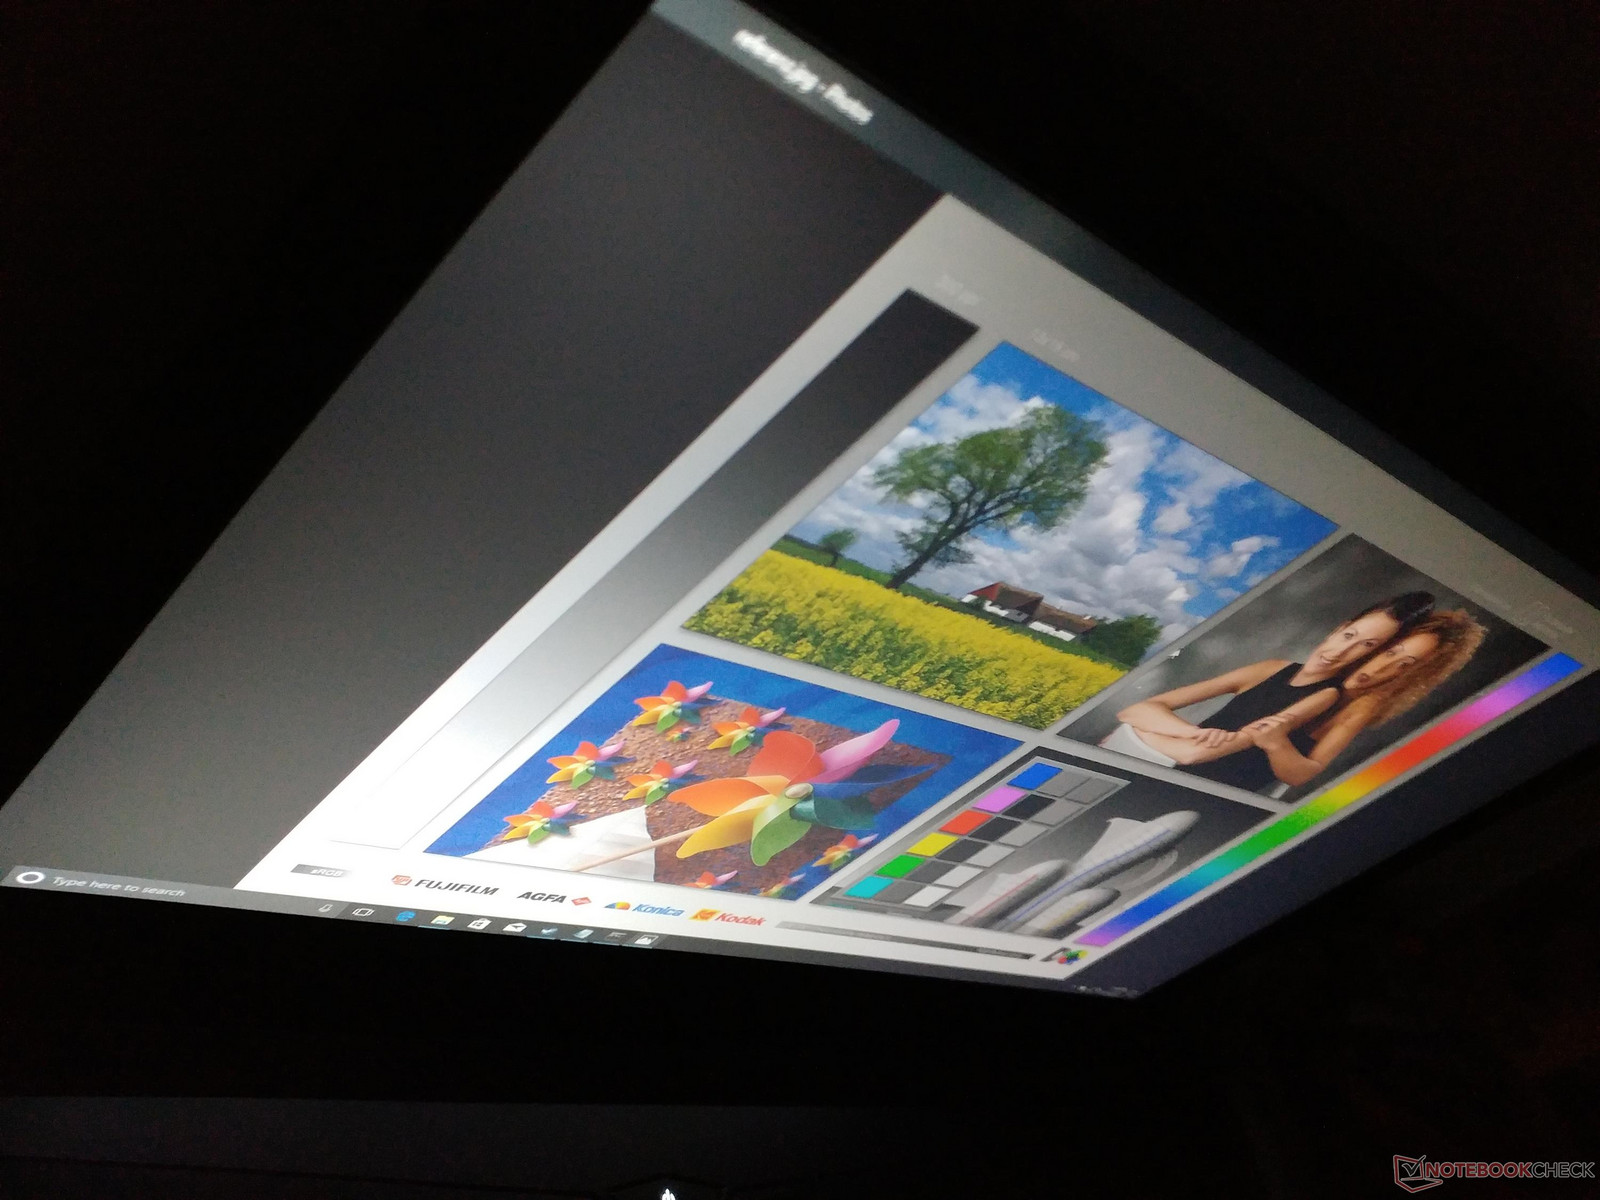
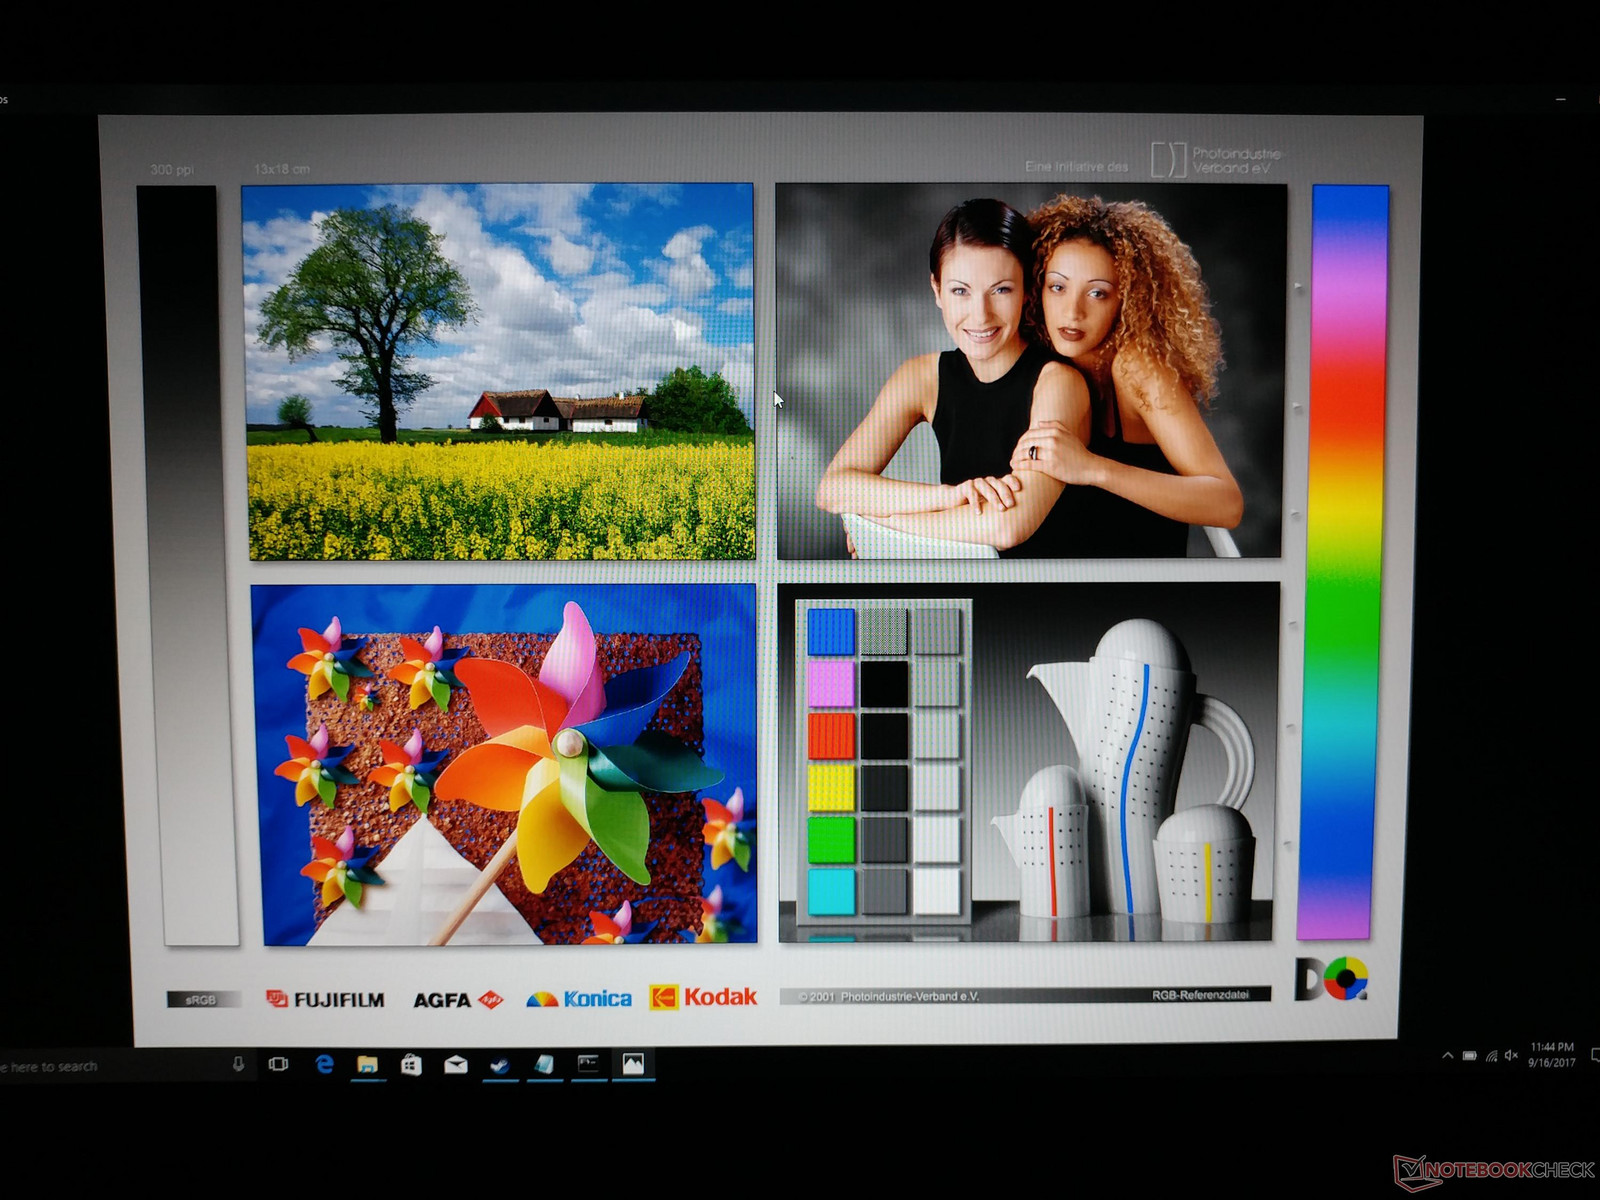
The 1080p IPS panel is run-of-the-mill with no special options for higher refresh rates, wider color gamuts, or G-Sync. Its LG Philips LP156WF6-SPK3 panel is identical to the one found on the Sabre 15 and both notebooks share very similar characteristics as a result including colors, response times, contrast, and even PWM frequency. Higher-end gaming notebooks like the Razer Blade Pro or Acer Predator 15 will have wider-reaching colors and deeper contrast levels closer to the 1000:1 mark.
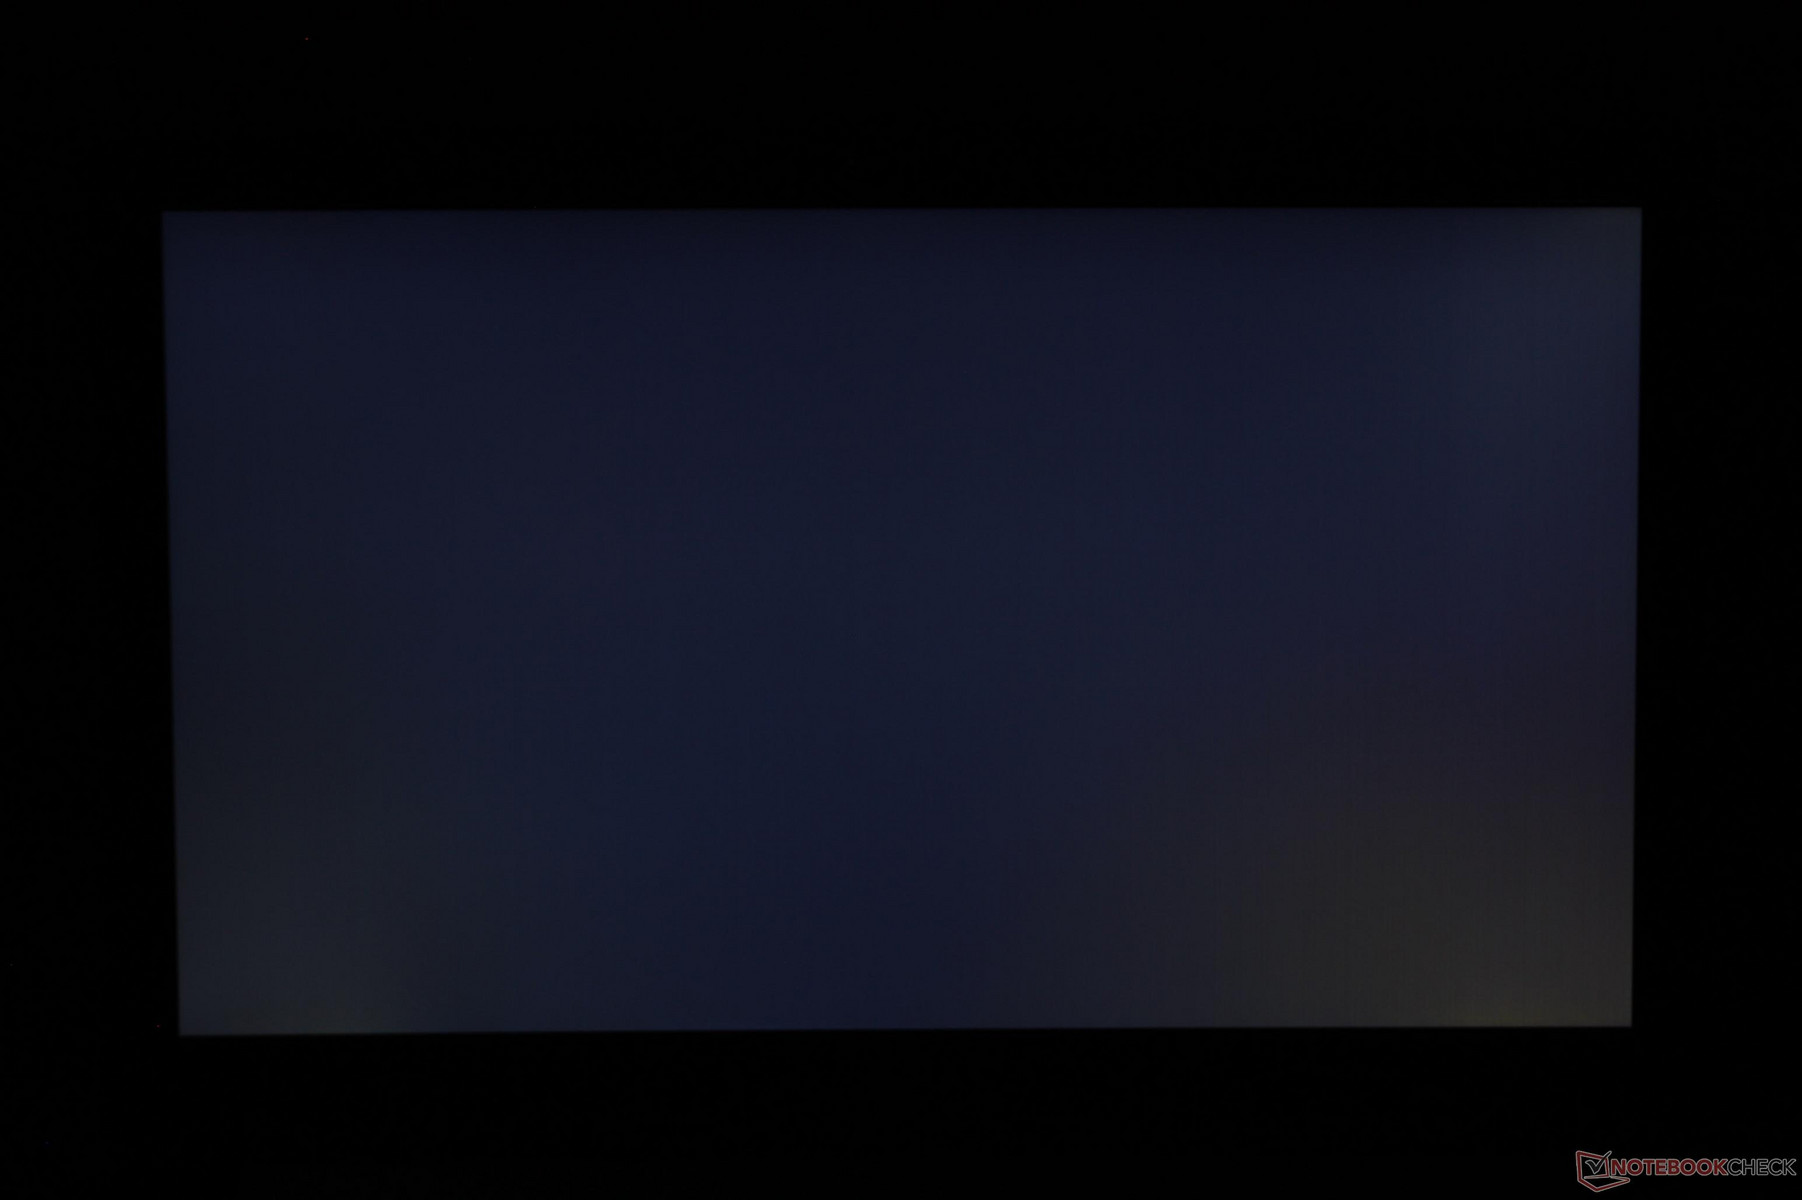
Subjectively, texts and images are crisp with no obvious color grains that are common on matte panels. There is slight backlight bleeding along the bottom edge that is only barely noticeable during movie playback with black borders.
| |||||||||||||||||||||||||
Brightness Distribution: 88 %
Center on Battery: 303.9 cd/m²
Contrast: 691:1 (Black: 0.44 cd/m²)
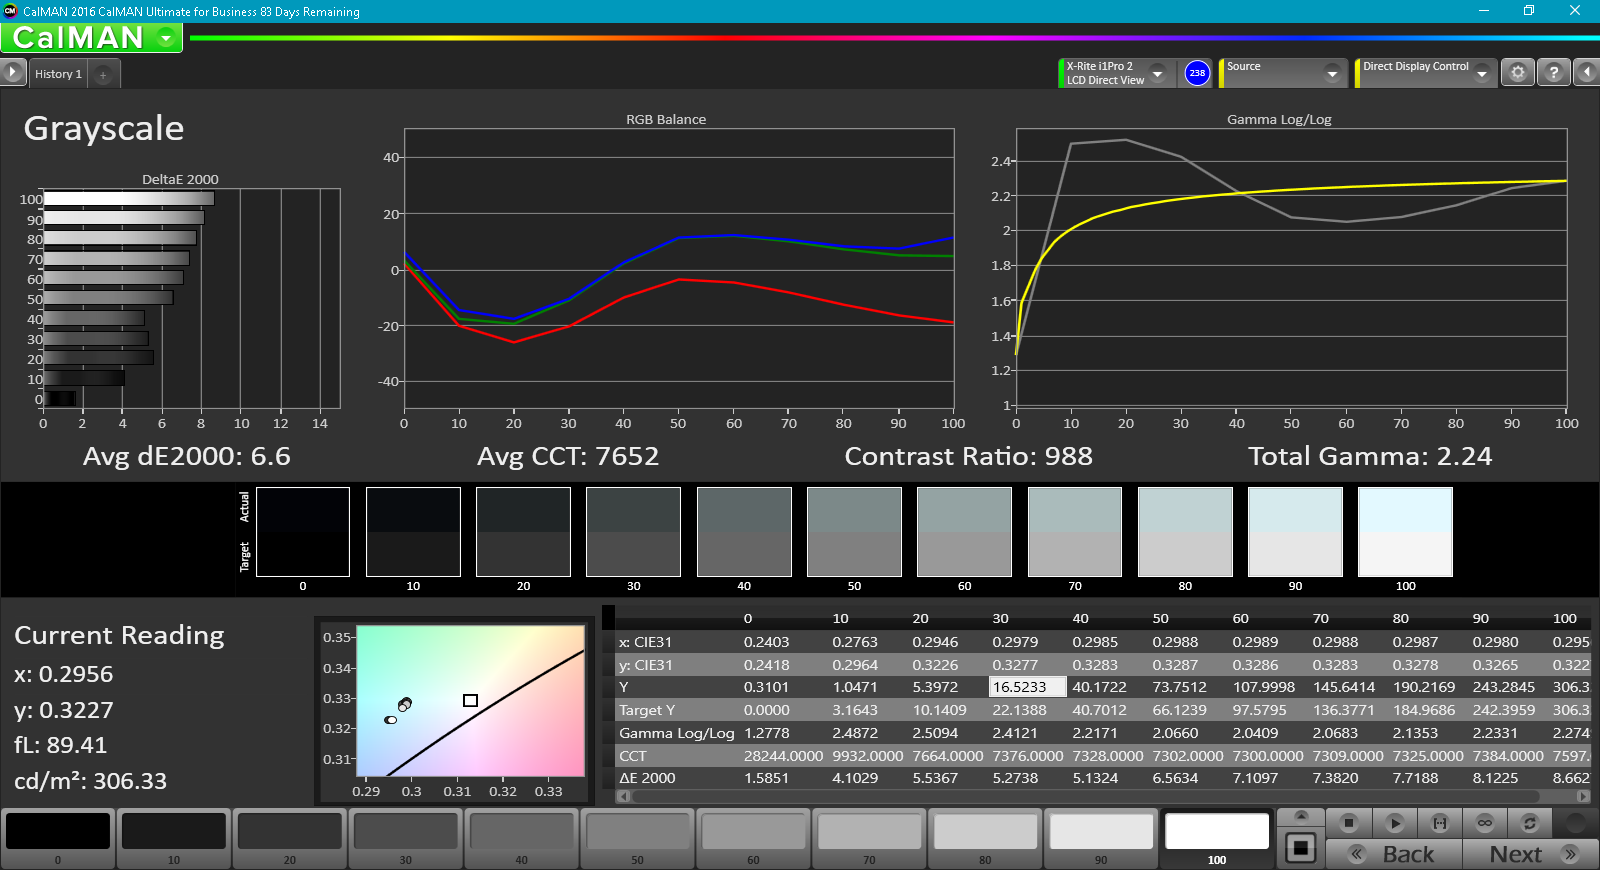
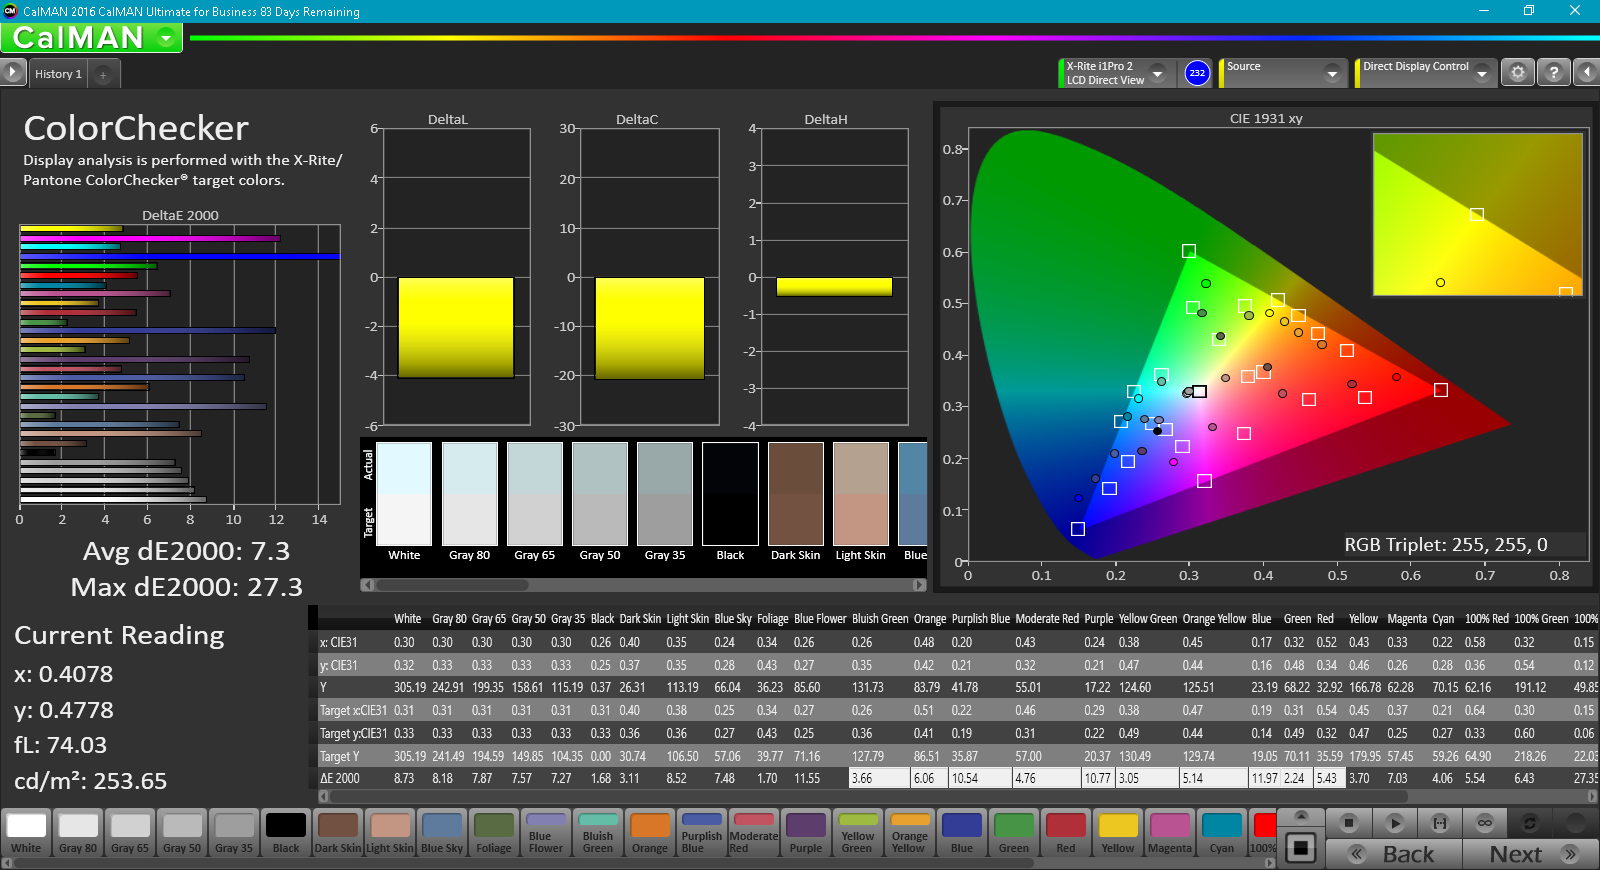
ΔE ColorChecker Calman: 7.3 | ∀{0.5-29.43 Ø4.72}
ΔE Greyscale Calman: 6.6 | ∀{0.09-98 Ø4.97}
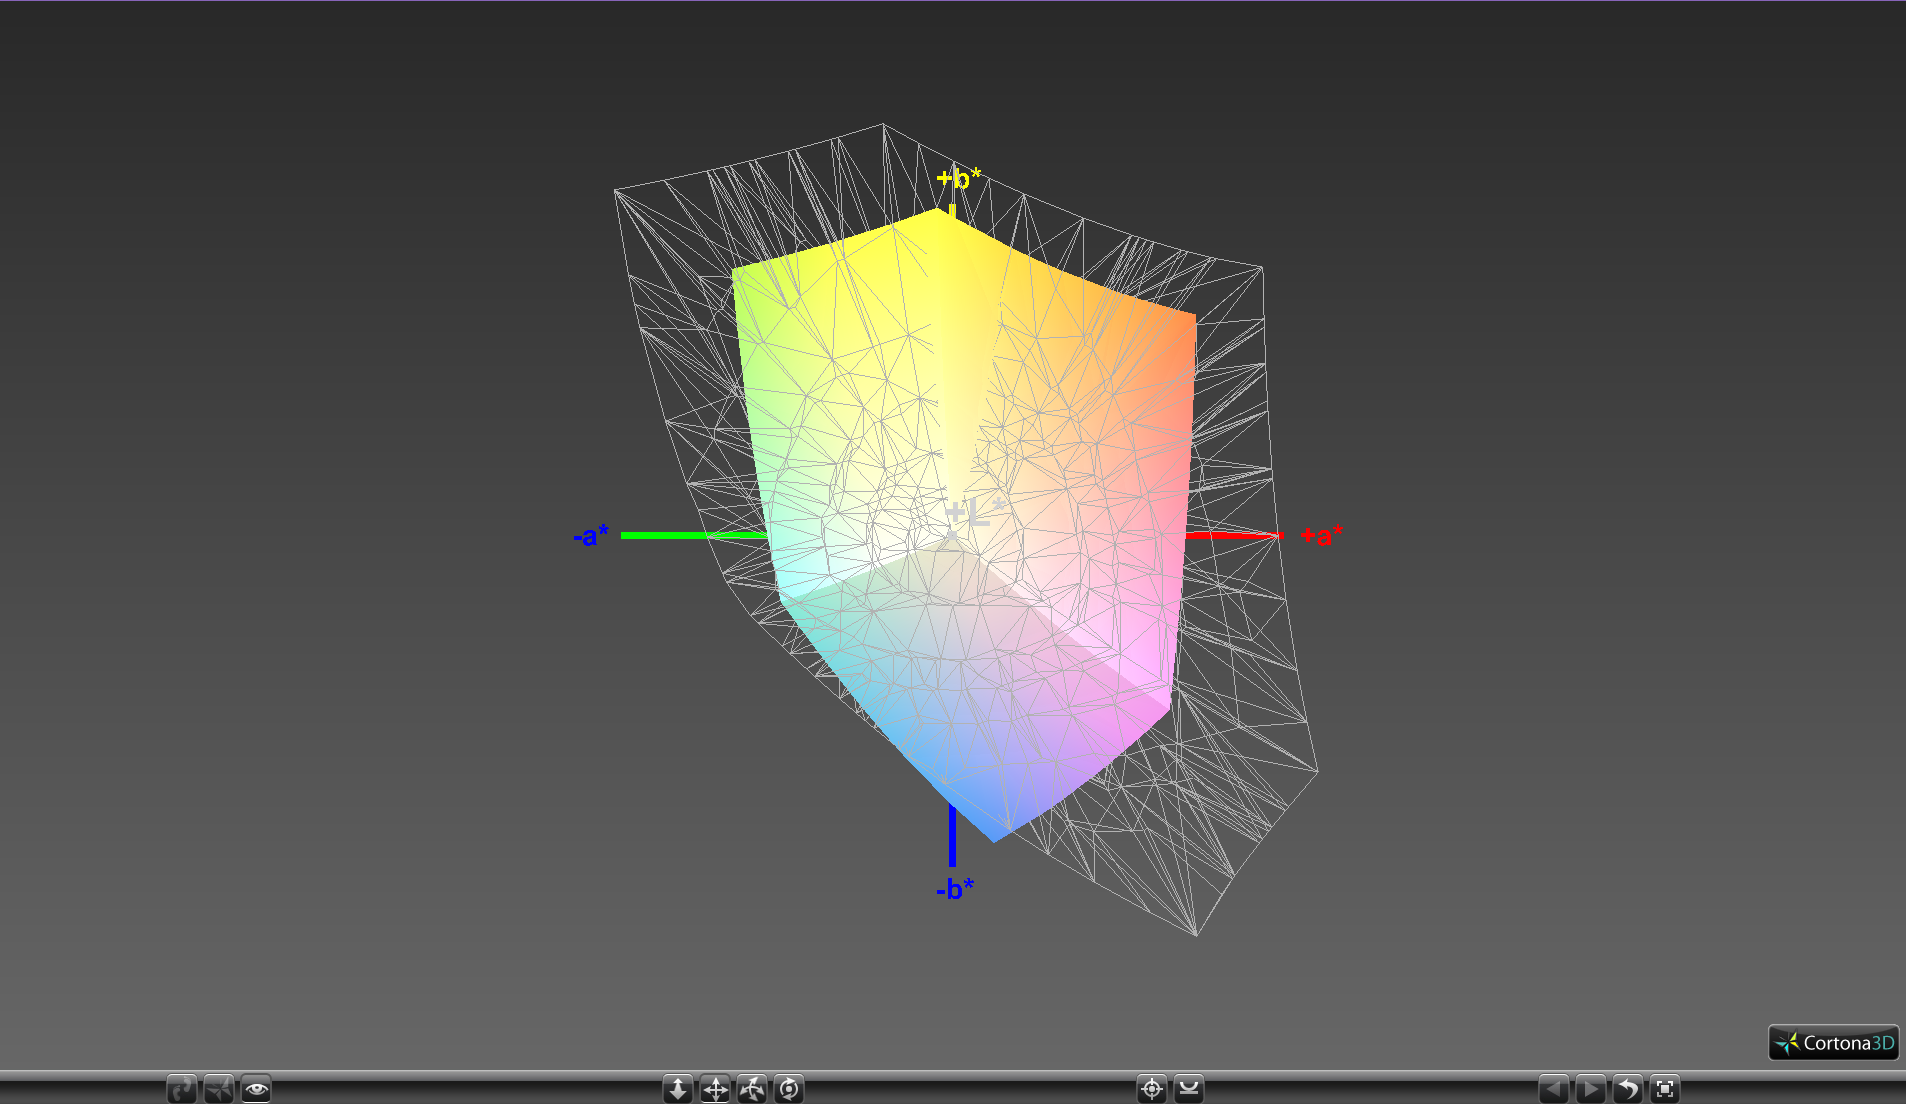
56.5% sRGB (Argyll 1.6.3 3D)
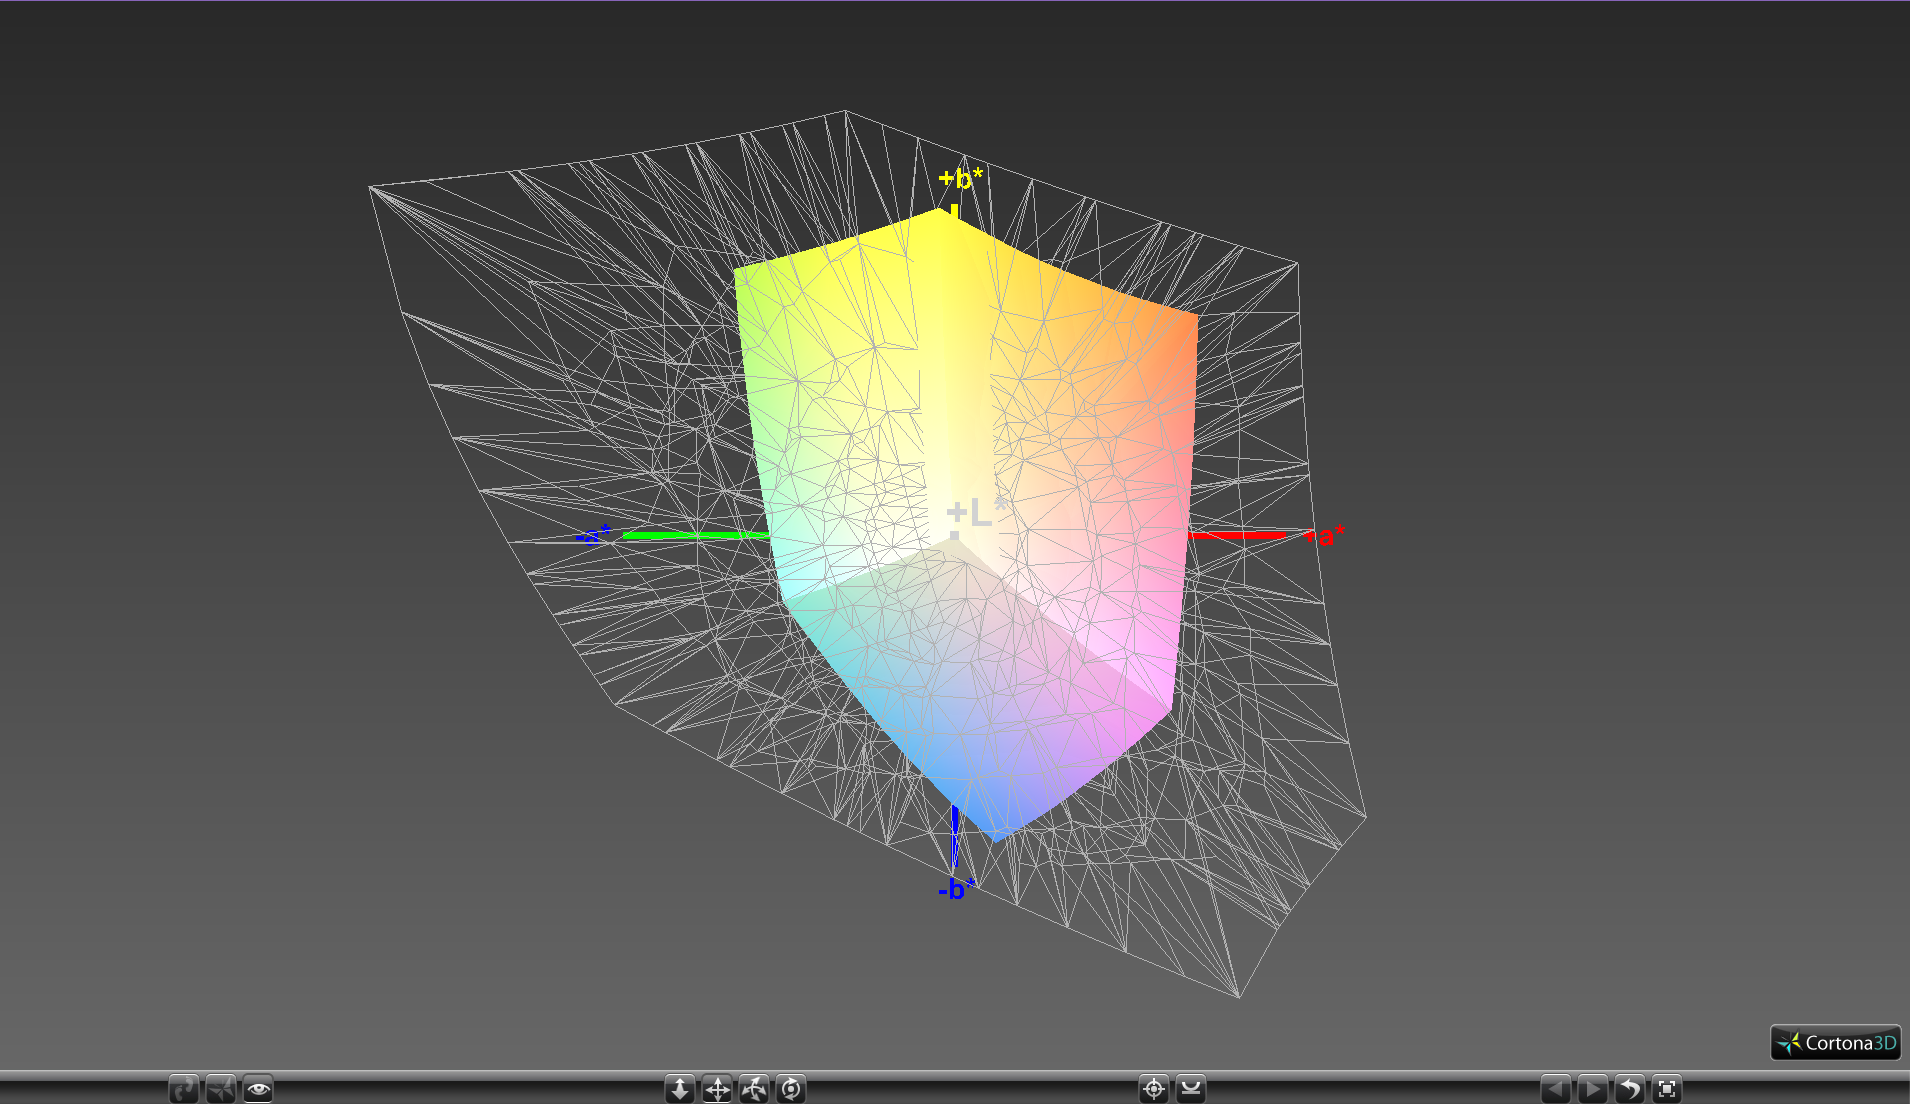
36.4% AdobeRGB 1998 (Argyll 1.6.3 3D)
39.58% AdobeRGB 1998 (Argyll 3D)
56.8% sRGB (Argyll 3D)
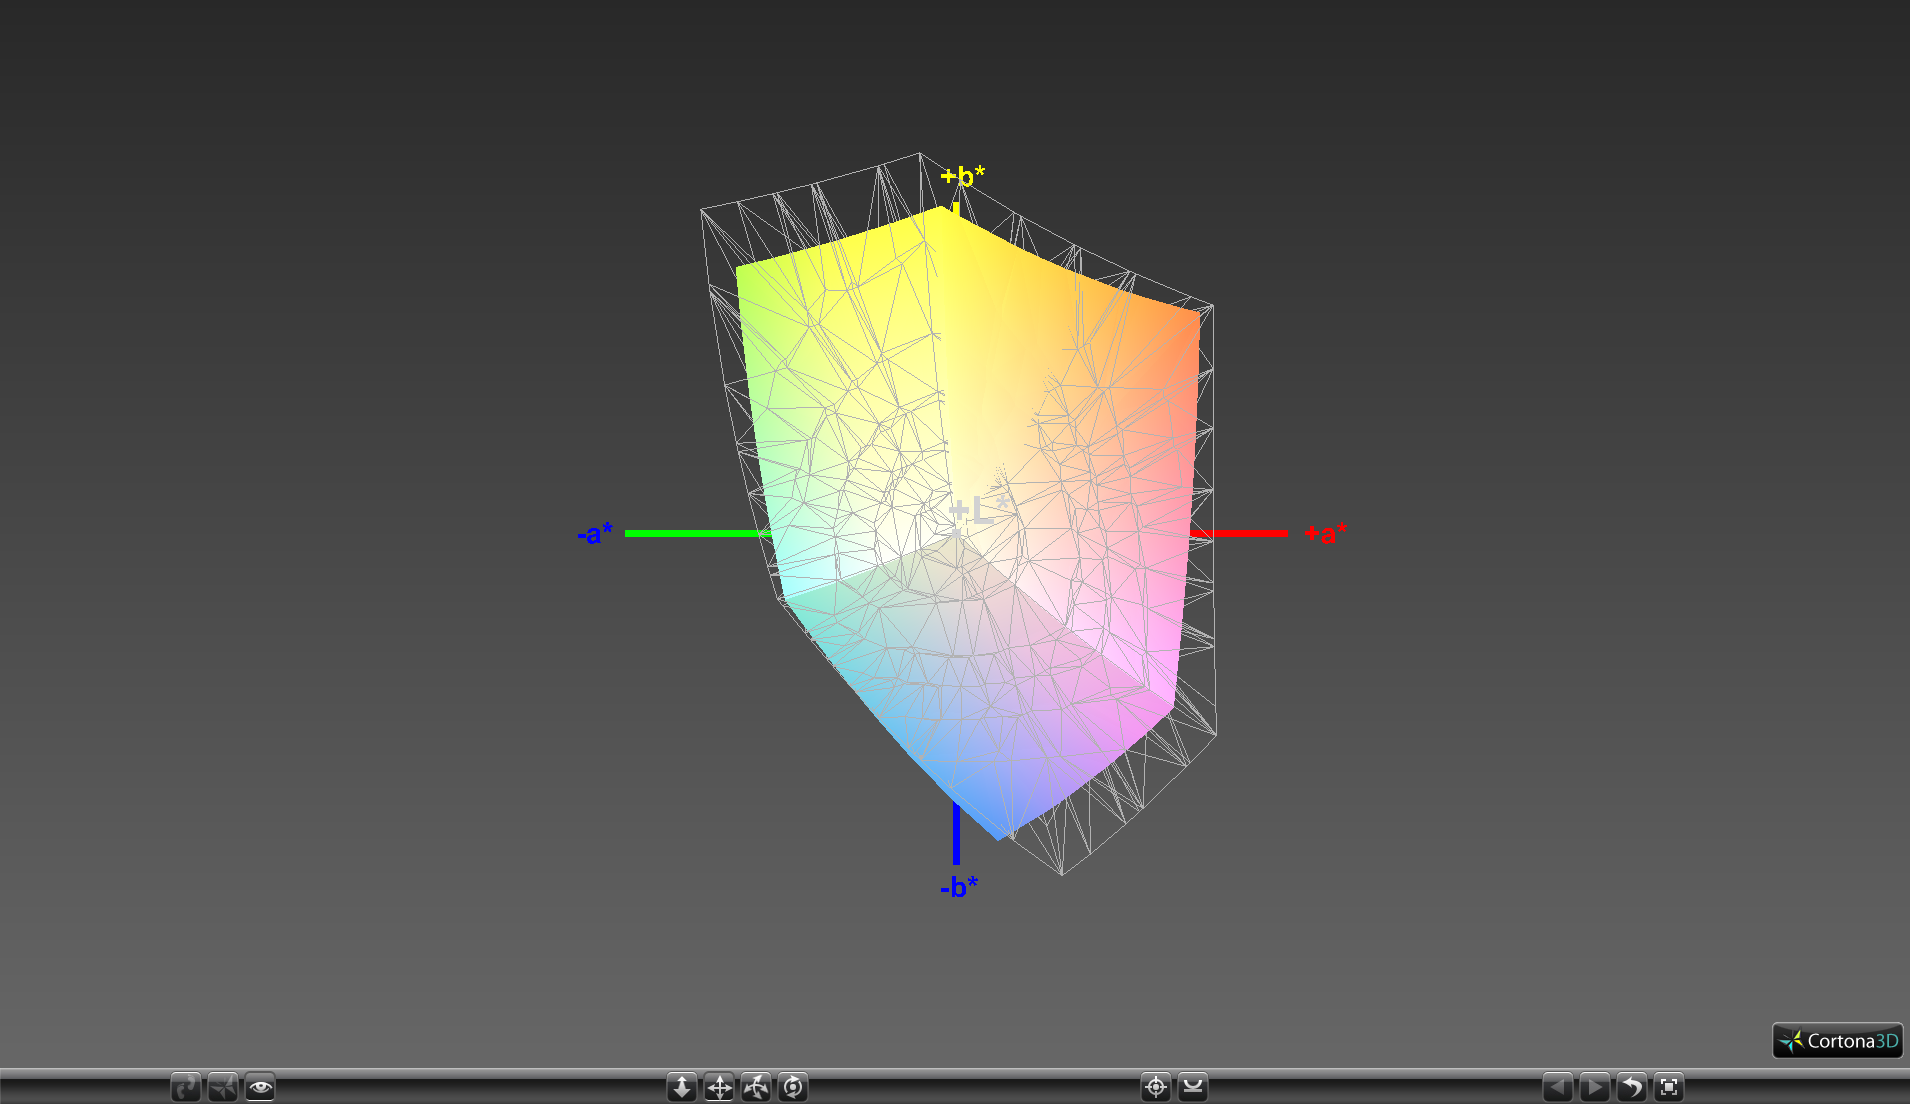
38.19% Display P3 (Argyll 3D)
Gamma: 2.24
CCT: 7652 K
| Sager NP5852 ID: LGD0533, Name: LG Philips LP156WF6-SPK3, IPS, 15.6", 1920x1080 | Gigabyte Sabre 15G ID: LGD0533, Name: LG Display LP156WF6-SPK3, IPS, 15.6", 1920x1080 | Asus ZenBook Pro UX550VD CMN15E8 (N156HCE-EN1), IPS, 15.6", 1920x1080 | Acer Aspire 5 A515-51G-51RL AU Optronics B156HAN06.1, IPS, 15.6", 1920x1080 | Acer TravelMate P658-G2-MG-7327 LG Philips LP156WF6-SPP1, IPS, 15.6", 1920x1080 | Asus AsusPro P4540UQ-FY0056R LG Philips LP156WF6-SPB6, IPS, 15.6", 1920x1080 | |
|---|---|---|---|---|---|---|
| Display | 2% | 66% | 0% | 60% | 56% | |
| Display P3 Coverage (%) | 38.19 | 38.97 2% | 65.7 72% | 38.3 0% | 64.9 70% | 63.3 66% |
| sRGB Coverage (%) | 56.8 | 58.2 2% | 90.3 59% | 57.6 1% | 85.9 51% | 83.6 47% |
| AdobeRGB 1998 Coverage (%) | 39.58 | 40.3 2% | 65.9 66% | 39.57 0% | 62.8 59% | 61.1 54% |
| Response Times | 1% | -14% | -16% | -14% | -16% | |
| Response Time Grey 50% / Grey 80% * (ms) | 29.6 ? | 32 ? -8% | 38.8 ? -31% | 41 ? -39% | 38 ? -28% | 38 ? -28% |
| Response Time Black / White * (ms) | 28 ? | 25.6 ? 9% | 27.2 ? 3% | 26 ? 7% | 28 ? -0% | 29 ? -4% |
| PWM Frequency (Hz) | 20000 ? | 20000 ? | 25910 ? | 21000 ? | 21000 ? | |
| Screen | 2% | 37% | 27% | 32% | 35% | |
| Brightness middle (cd/m²) | 303.9 | 248.4 -18% | 335 10% | 235 -23% | 284 -7% | 276 -9% |
| Brightness (cd/m²) | 286 | 241 -16% | 313 9% | 236 -17% | 276 -3% | 283 -1% |
| Brightness Distribution (%) | 88 | 84 -5% | 83 -6% | 80 -9% | 82 -7% | 85 -3% |
| Black Level * (cd/m²) | 0.44 | 0.3 32% | 0.27 39% | 0.17 61% | 0.295 33% | 0.27 39% |
| Contrast (:1) | 691 | 828 20% | 1241 80% | 1382 100% | 963 39% | 1022 48% |
| Colorchecker dE 2000 * | 7.3 | 7.5 -3% | 4.7 36% | 4.69 36% | 4.07 44% | 3.92 46% |
| Colorchecker dE 2000 max. * | 27.3 | 25.2 8% | 8.1 70% | 7.9 71% | 10.52 61% | 9.13 67% |
| Greyscale dE 2000 * | 6.6 | 6.5 2% | 5.8 12% | 3.34 49% | 3.13 53% | 2.6 61% |
| Gamma | 2.24 98% | 2.19 100% | 2.06 107% | 2.63 84% | 2.41 91% | 2.53 87% |
| CCT | 7652 85% | 7852 83% | 6518 100% | 6801 96% | 7082 92% | 6561 99% |
| Color Space (Percent of AdobeRGB 1998) (%) | 36.4 | 37 2% | 58.7 61% | 36 -1% | 56 54% | 54.5 50% |
| Color Space (Percent of sRGB) (%) | 56.5 | 57.9 2% | 90.1 59% | 57 1% | 86 52% | 83.7 48% |
| Total Average (Program / Settings) | 2% /
2% | 30% /
36% | 4% /
16% | 26% /
31% | 25% /
32% |
* ... smaller is better
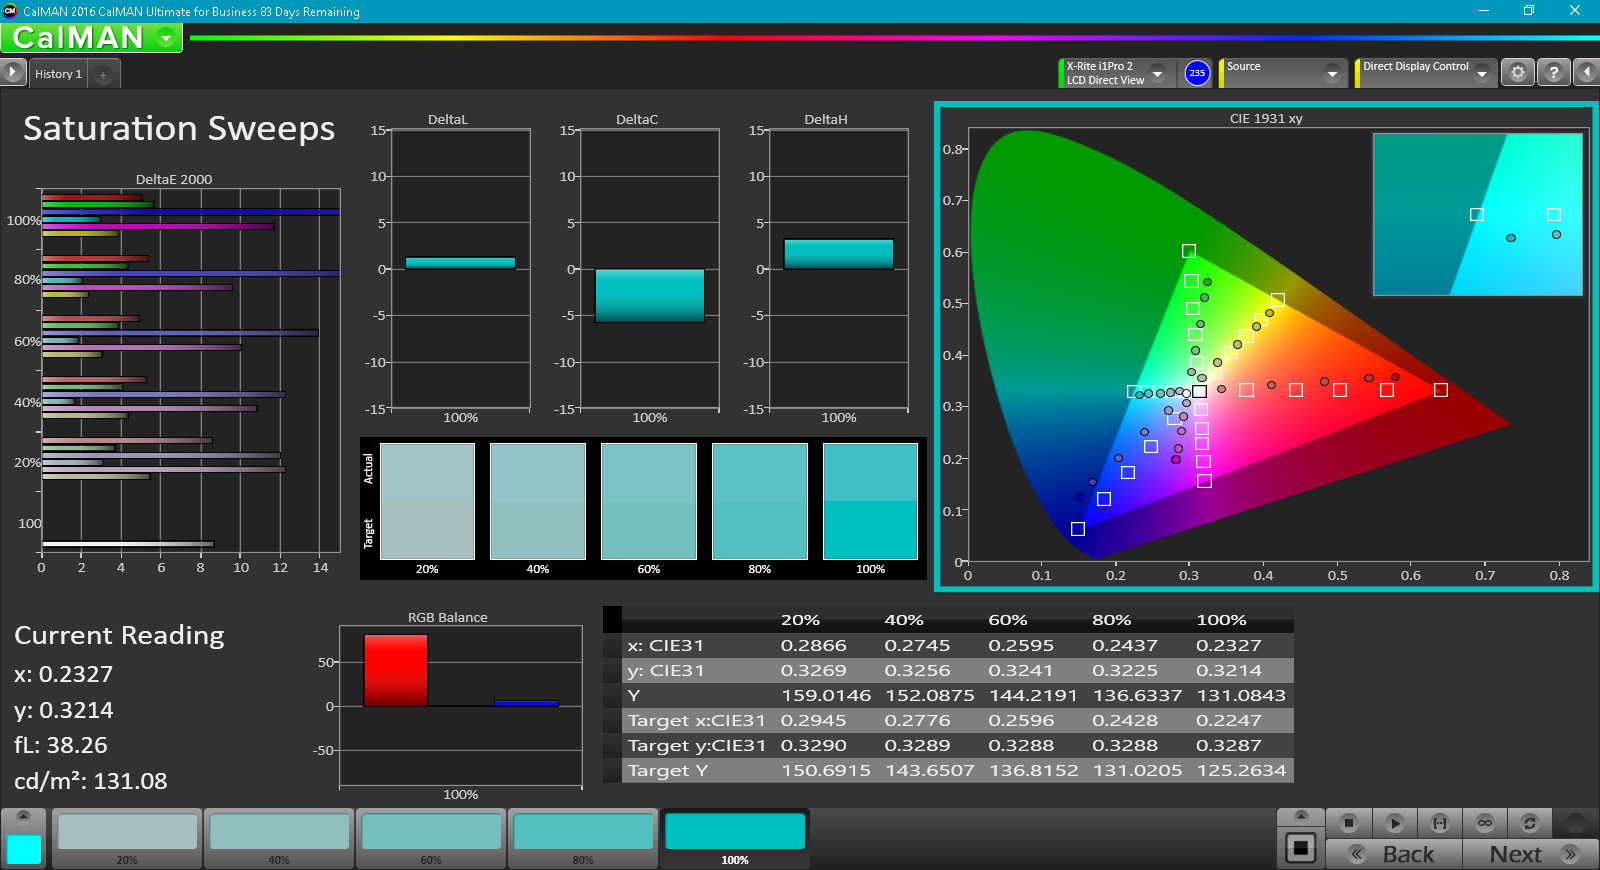
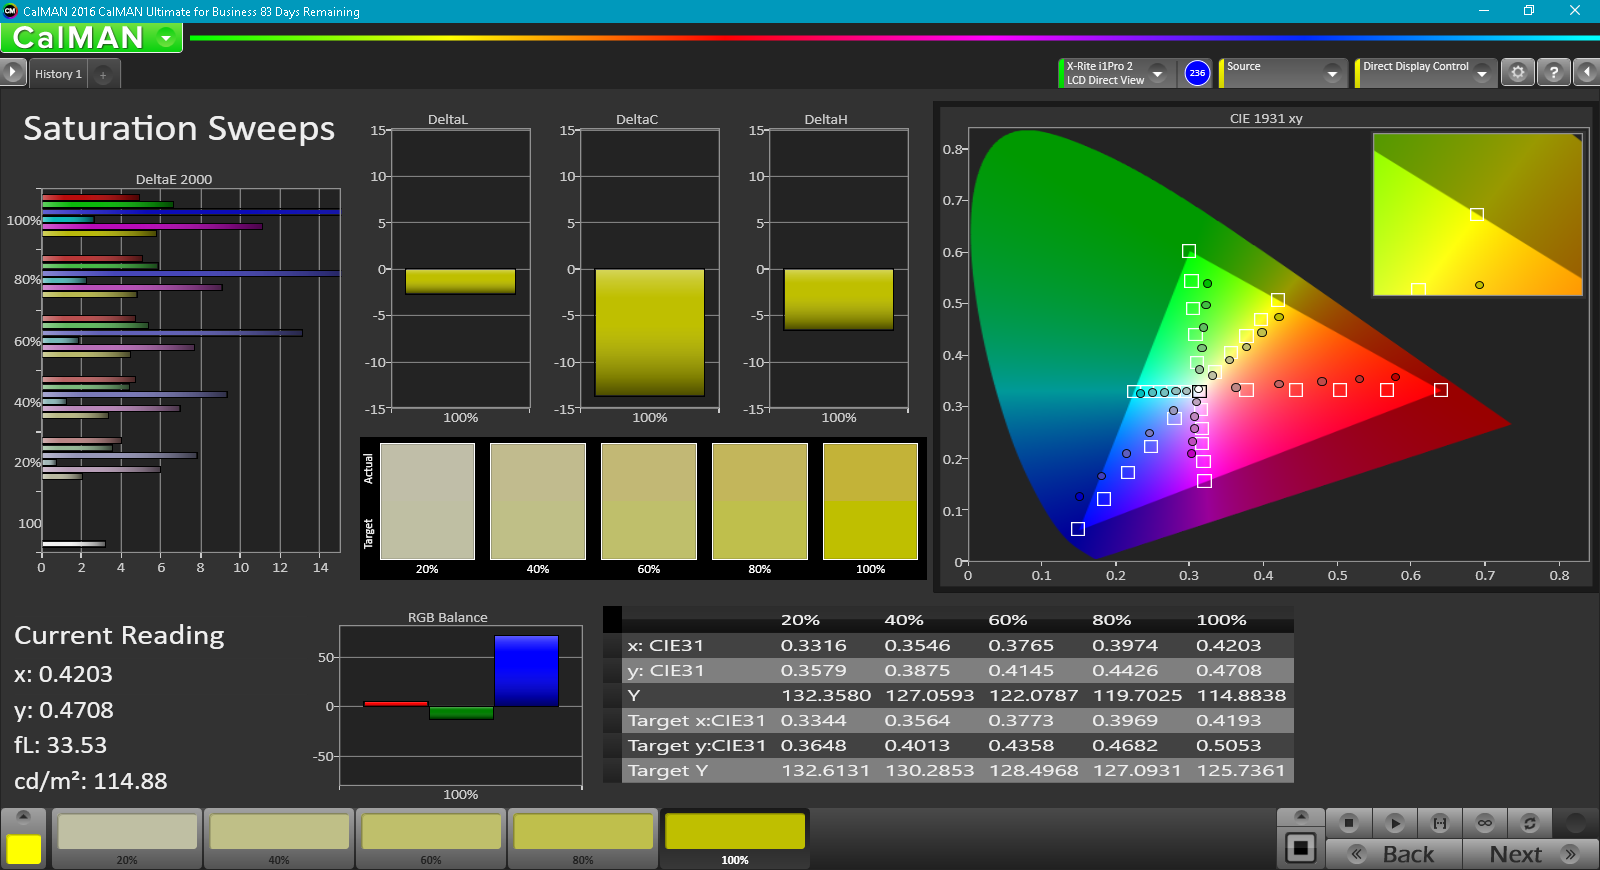
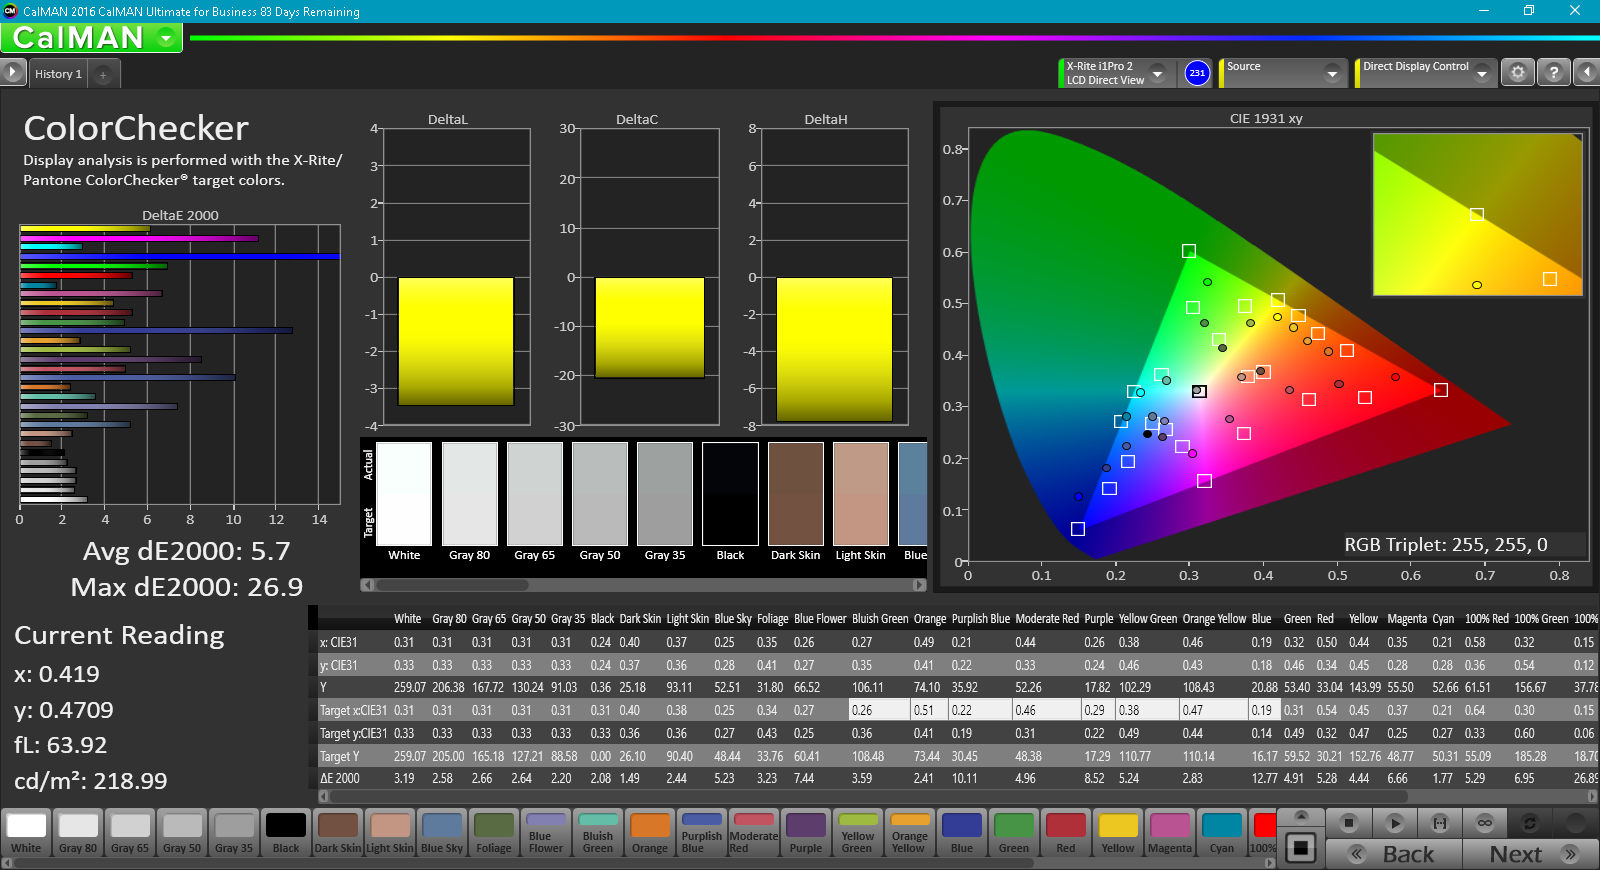
Color space is narrow at approximately 36 percent and 57 percent of the AdobeRGB and sRGB standards, respectively. Even subjectively the colors are not nearly as saturated as the displays on most Ultrabooks and some gaming notebooks that attain >80 percent sRGB coverage. While precision colors are not vital to browsing or the core gaming experience, graphics artists may want to look elsewhere.
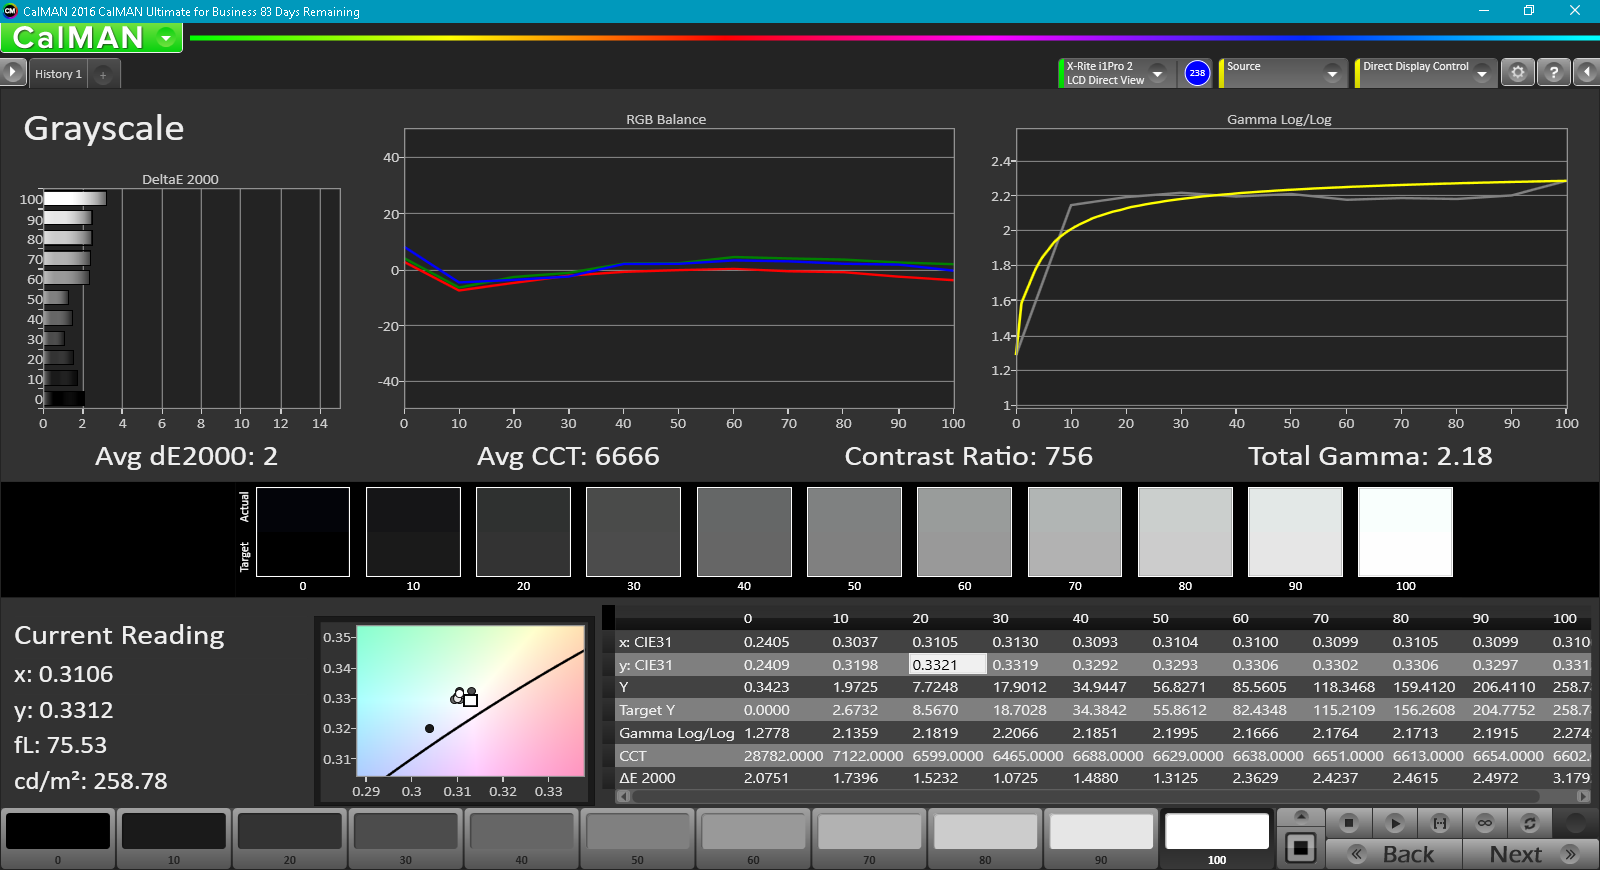
Further measurements with an X-Rite spectrophotometer reveal average grayscale and a slightly cool color temperature out of the box. Our calibration efforts improve both by a noticeable degree for a better RGB balance, but color accuracy is still average since gamut is narrow. Blue and Magenta colors in particular are represented less accurately than others.
Display Response Times
| ↔ Response Time Black to White | ||
|---|---|---|
| 28 ms ... rise ↗ and fall ↘ combined | ↗ 18 ms rise | 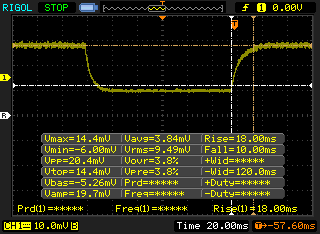 |
| ↘ 10 ms fall | ||
| The screen shows relatively slow response rates in our tests and may be too slow for gamers. In comparison, all tested devices range from 0.1 (minimum) to 240 (maximum) ms. » 71 % of all devices are better. This means that the measured response time is worse than the average of all tested devices (19.8 ms). | ||
| ↔ Response Time 50% Grey to 80% Grey | ||
| 29.6 ms ... rise ↗ and fall ↘ combined | ↗ 14.8 ms rise | 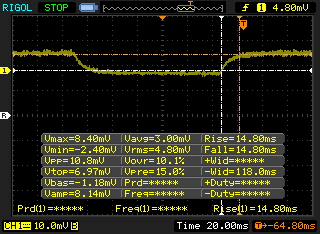 |
| ↘ 14.8 ms fall | ||
| The screen shows relatively slow response rates in our tests and may be too slow for gamers. In comparison, all tested devices range from 0.165 (minimum) to 636 (maximum) ms. » 40 % of all devices are better. This means that the measured response time is similar to the average of all tested devices (31 ms). | ||
Screen Flickering / PWM (Pulse-Width Modulation)
| Screen flickering / PWM detected | 20000 Hz | ≤ 99 % brightness setting | 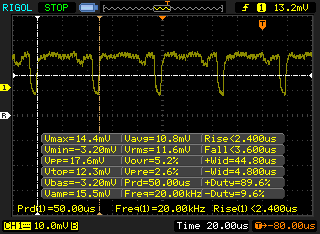 |
The display backlight flickers at 20000 Hz (worst case, e.g., utilizing PWM) Flickering detected at a brightness setting of 99 % and below. There should be no flickering or PWM above this brightness setting. The frequency of 20000 Hz is quite high, so most users sensitive to PWM should not notice any flickering. In comparison: 52 % of all tested devices do not use PWM to dim the display. If PWM was detected, an average of 7769 (minimum: 5 - maximum: 343500) Hz was measured. | |||
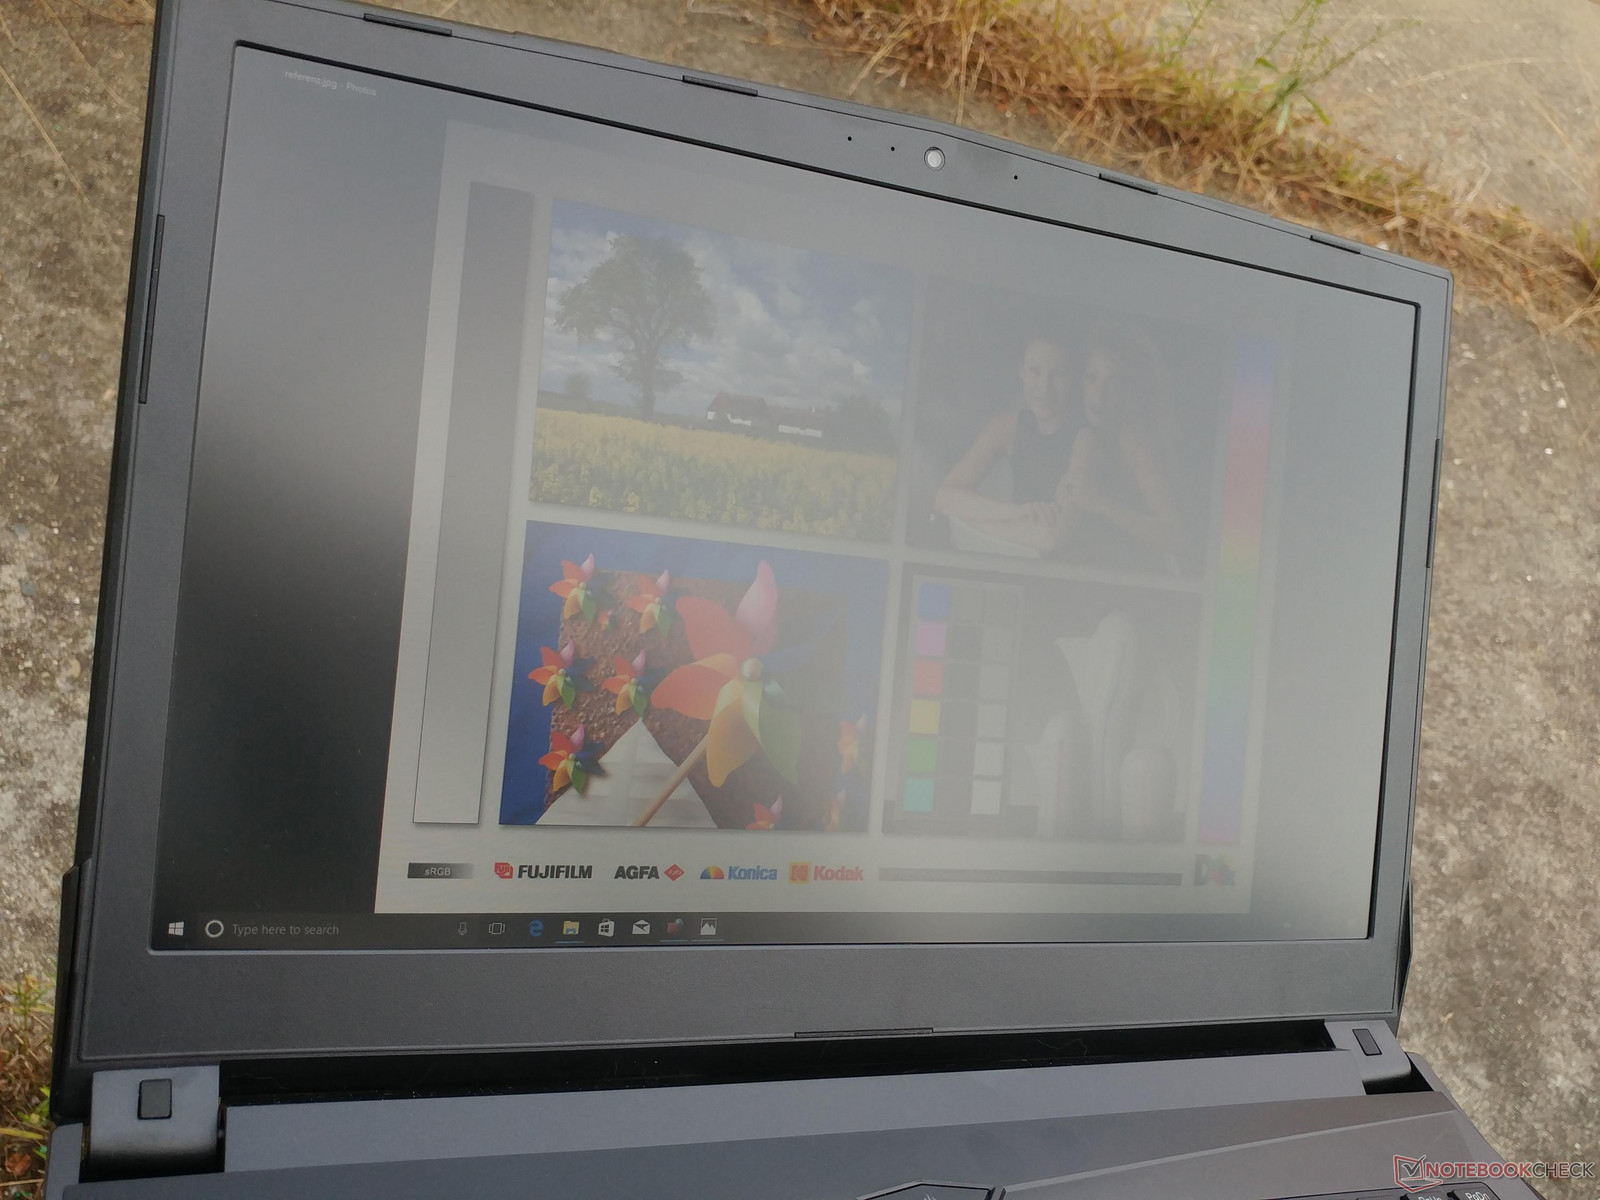
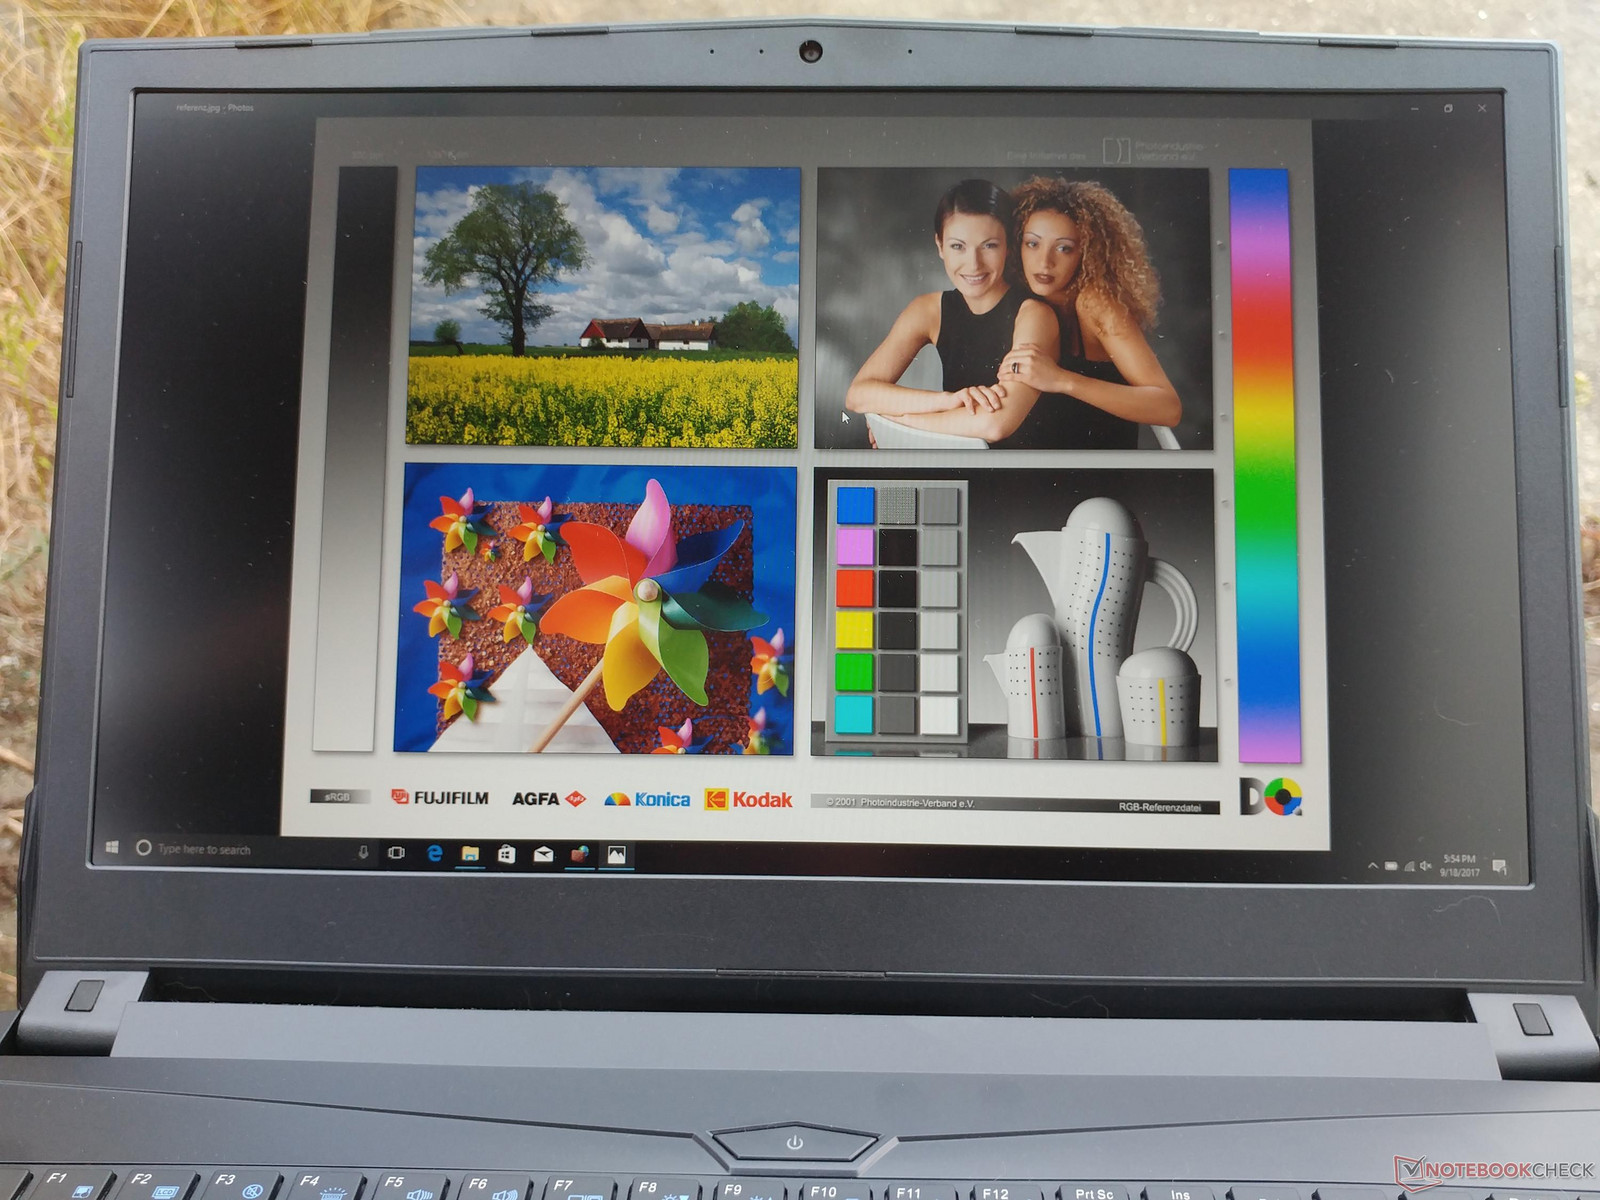
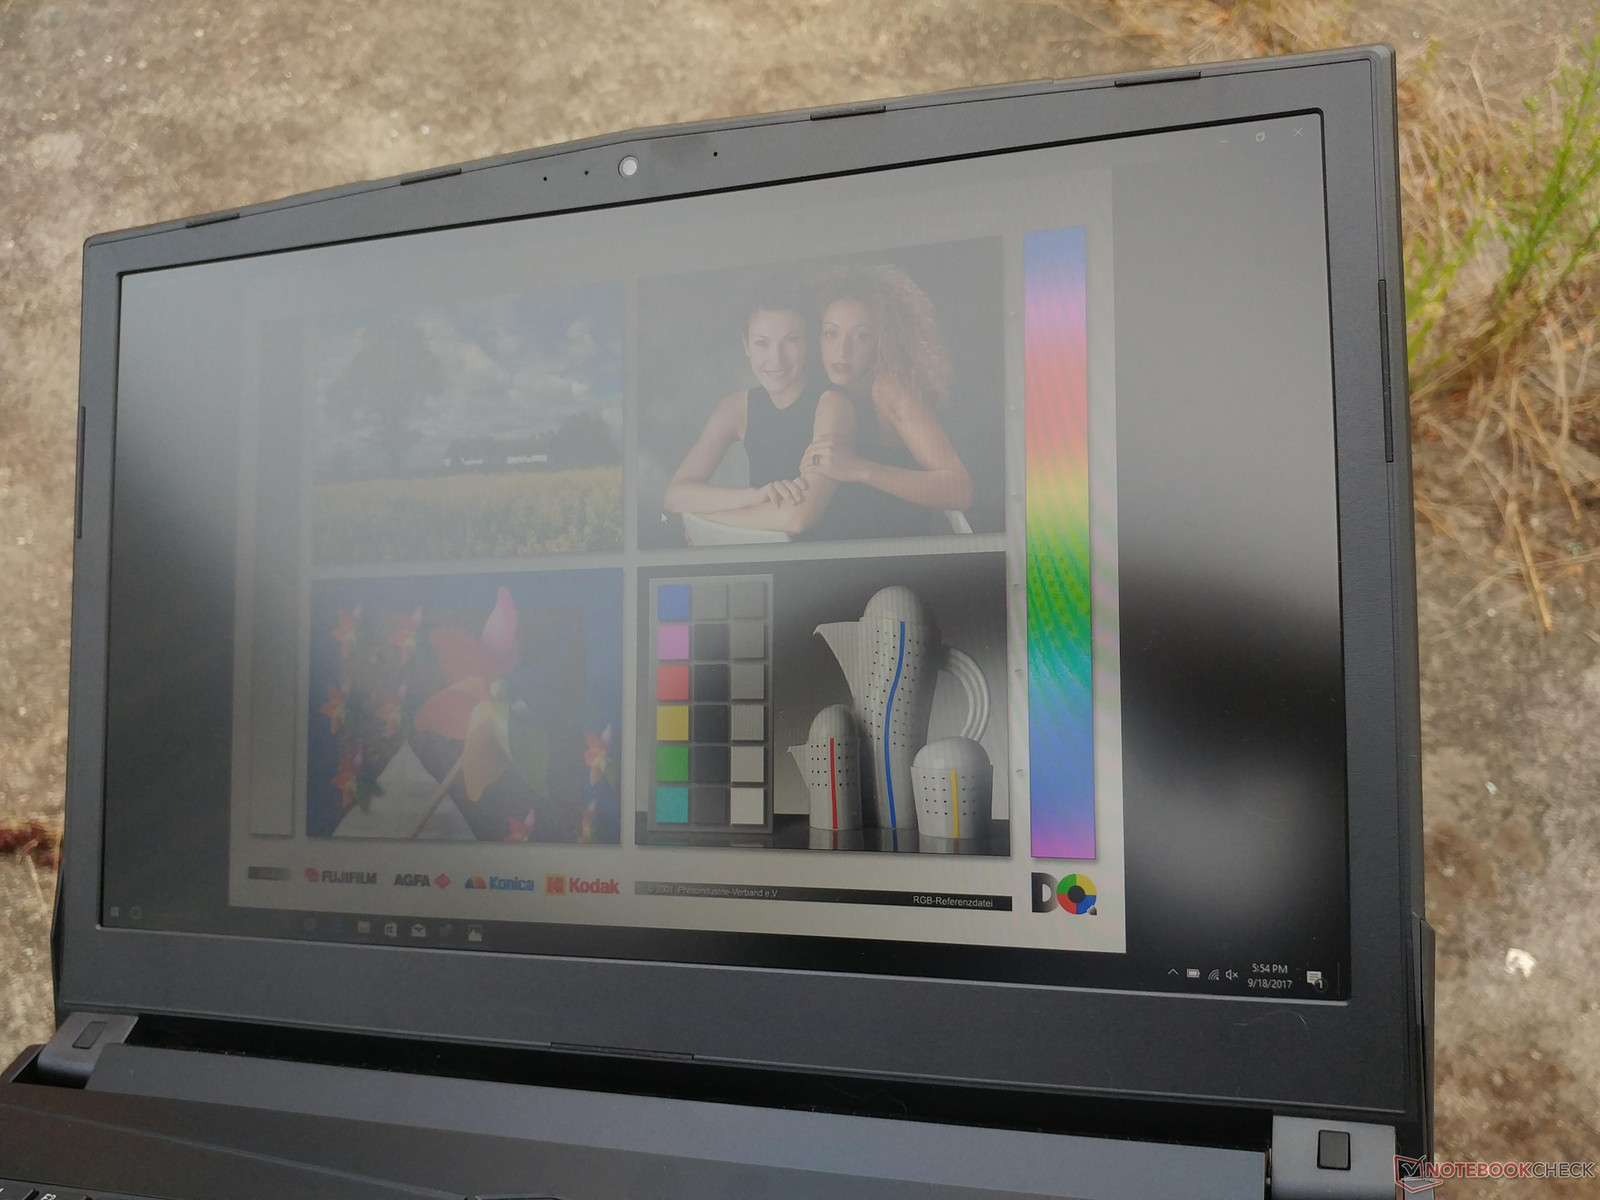
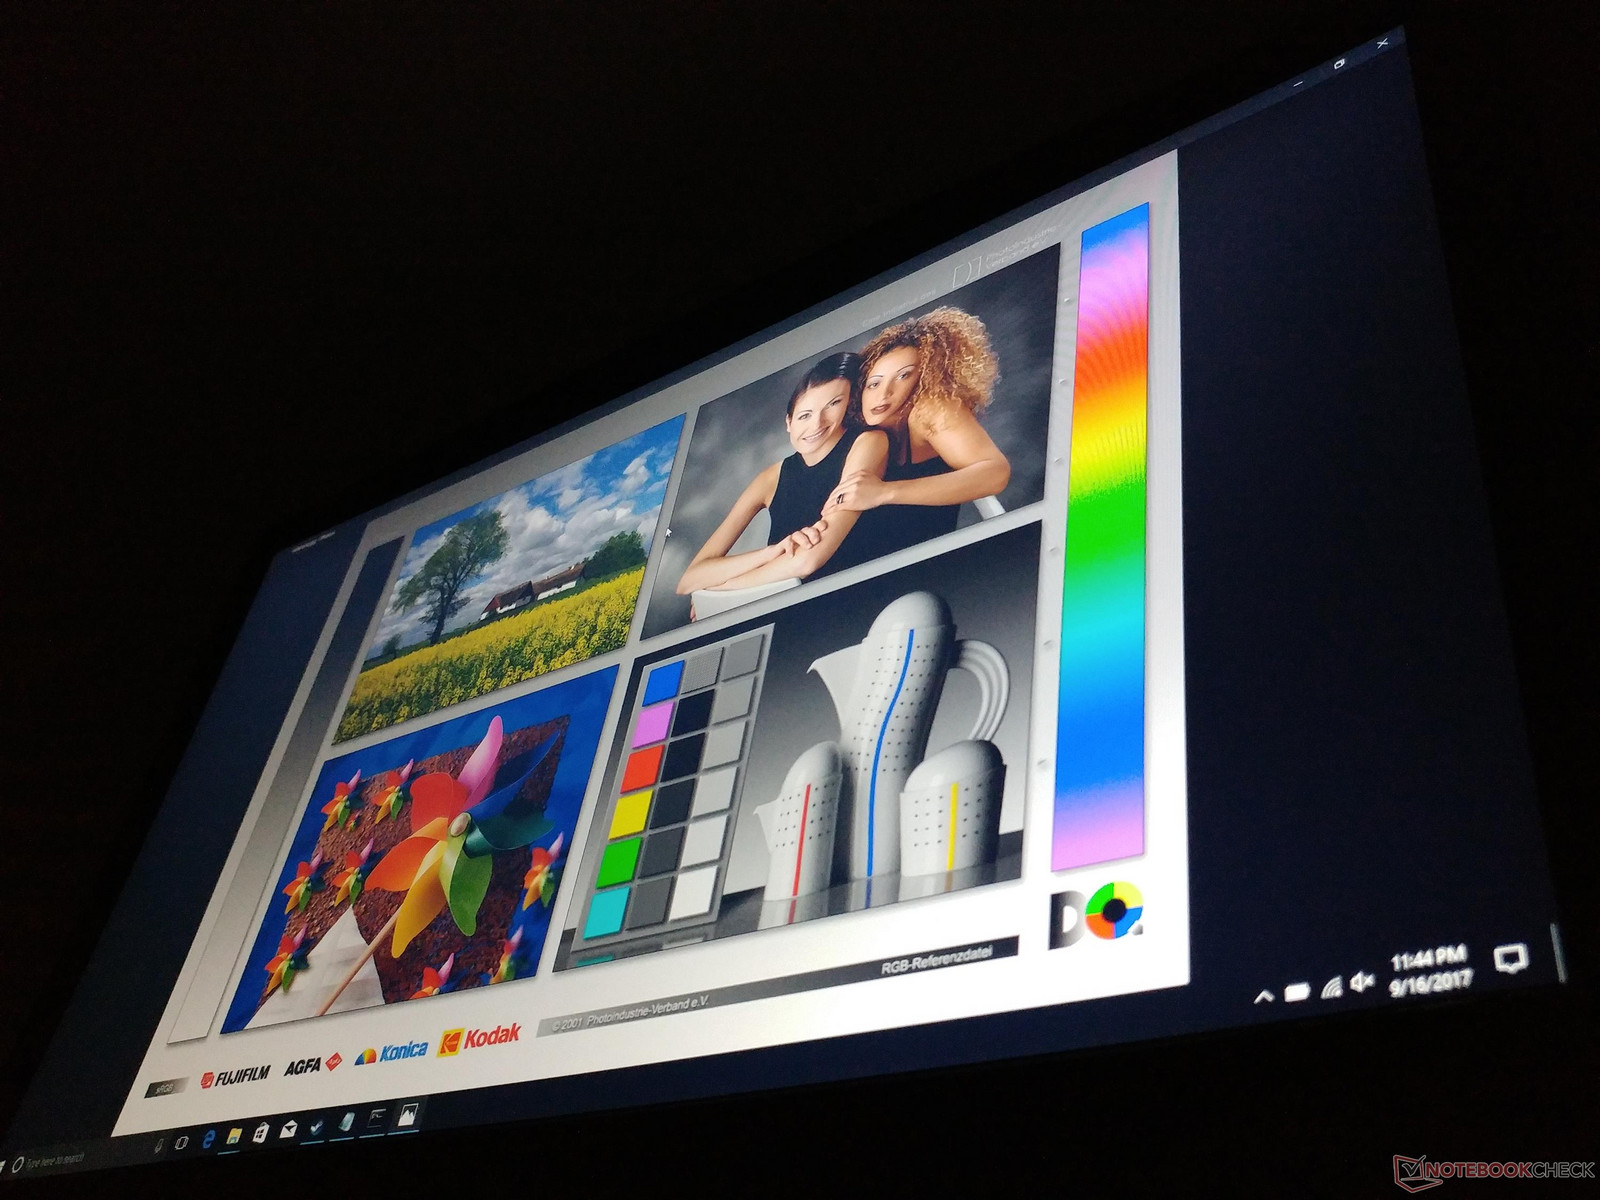
Outdoor usability is average when under shade and on the maximum brightness setting. Sunlight and slight glare will wash out colors and make viewing sessions uncomfortable after long periods. viewing angles are wide albeit limited by the ~140-degree maximum hinge angle.
Performance
Configuration options are very limited for the NP5852. Users can select between the dual-core i5-7300HQ or quad-core i7-7700HQ and integrated HD Graphics 630 or HD Graphics 630 + discrete GeForce MX150. Display options appear to be fixed at standard 1080p. This is, after all, an entry-level gaming notebook.
Optimus is included if configured with the MX150.
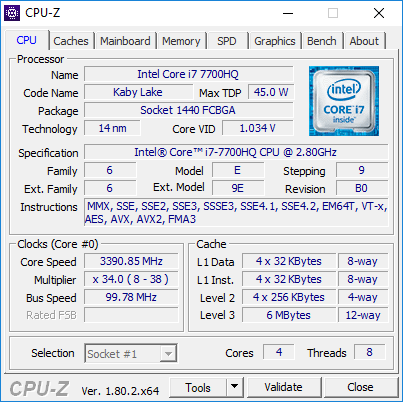
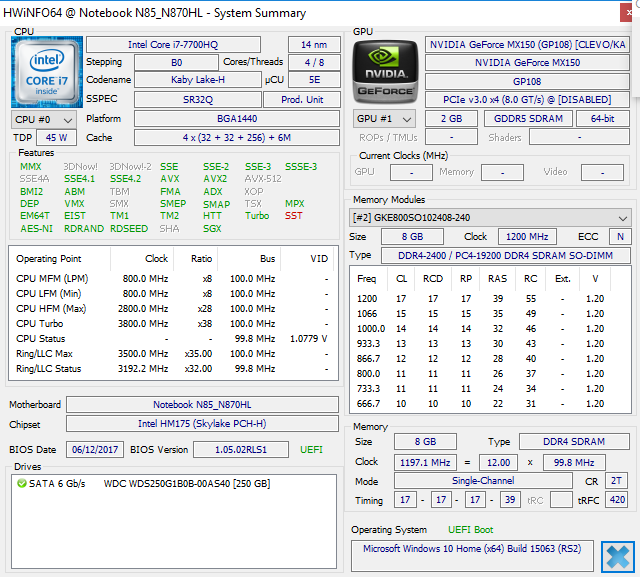
Processor
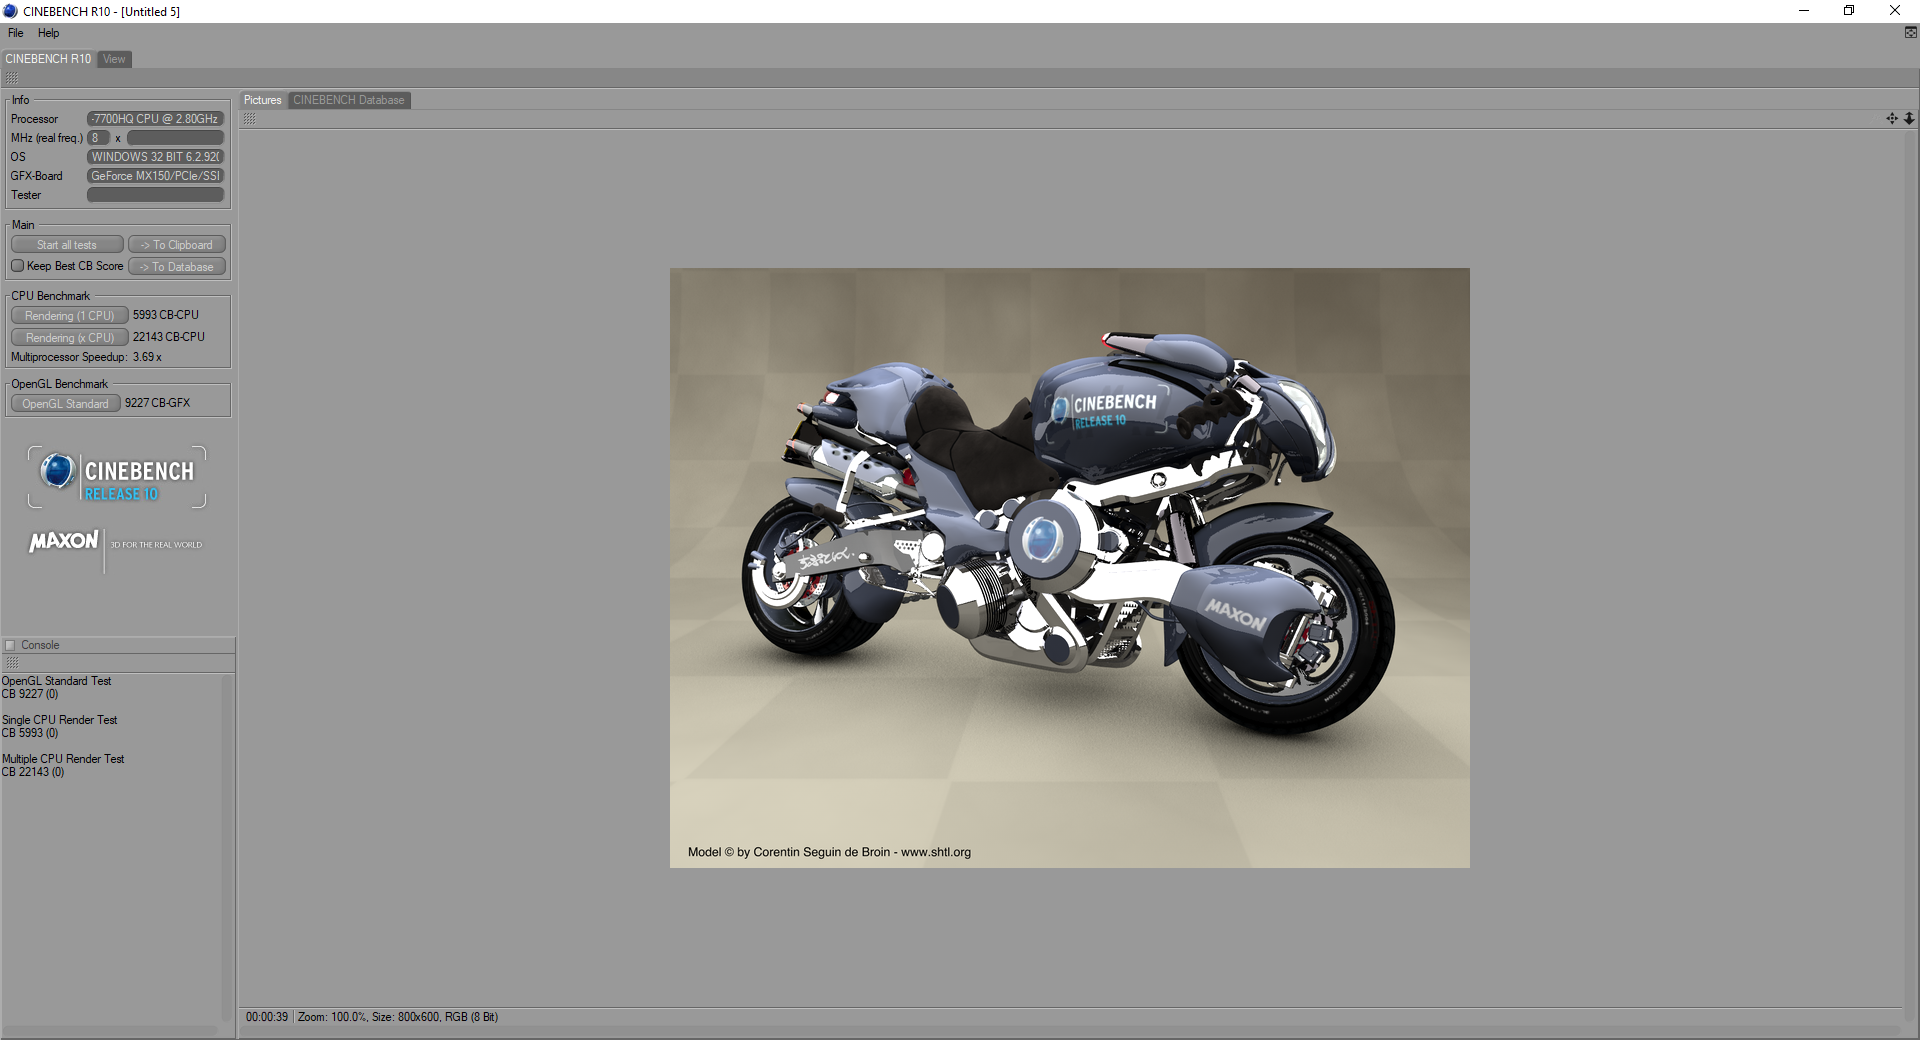
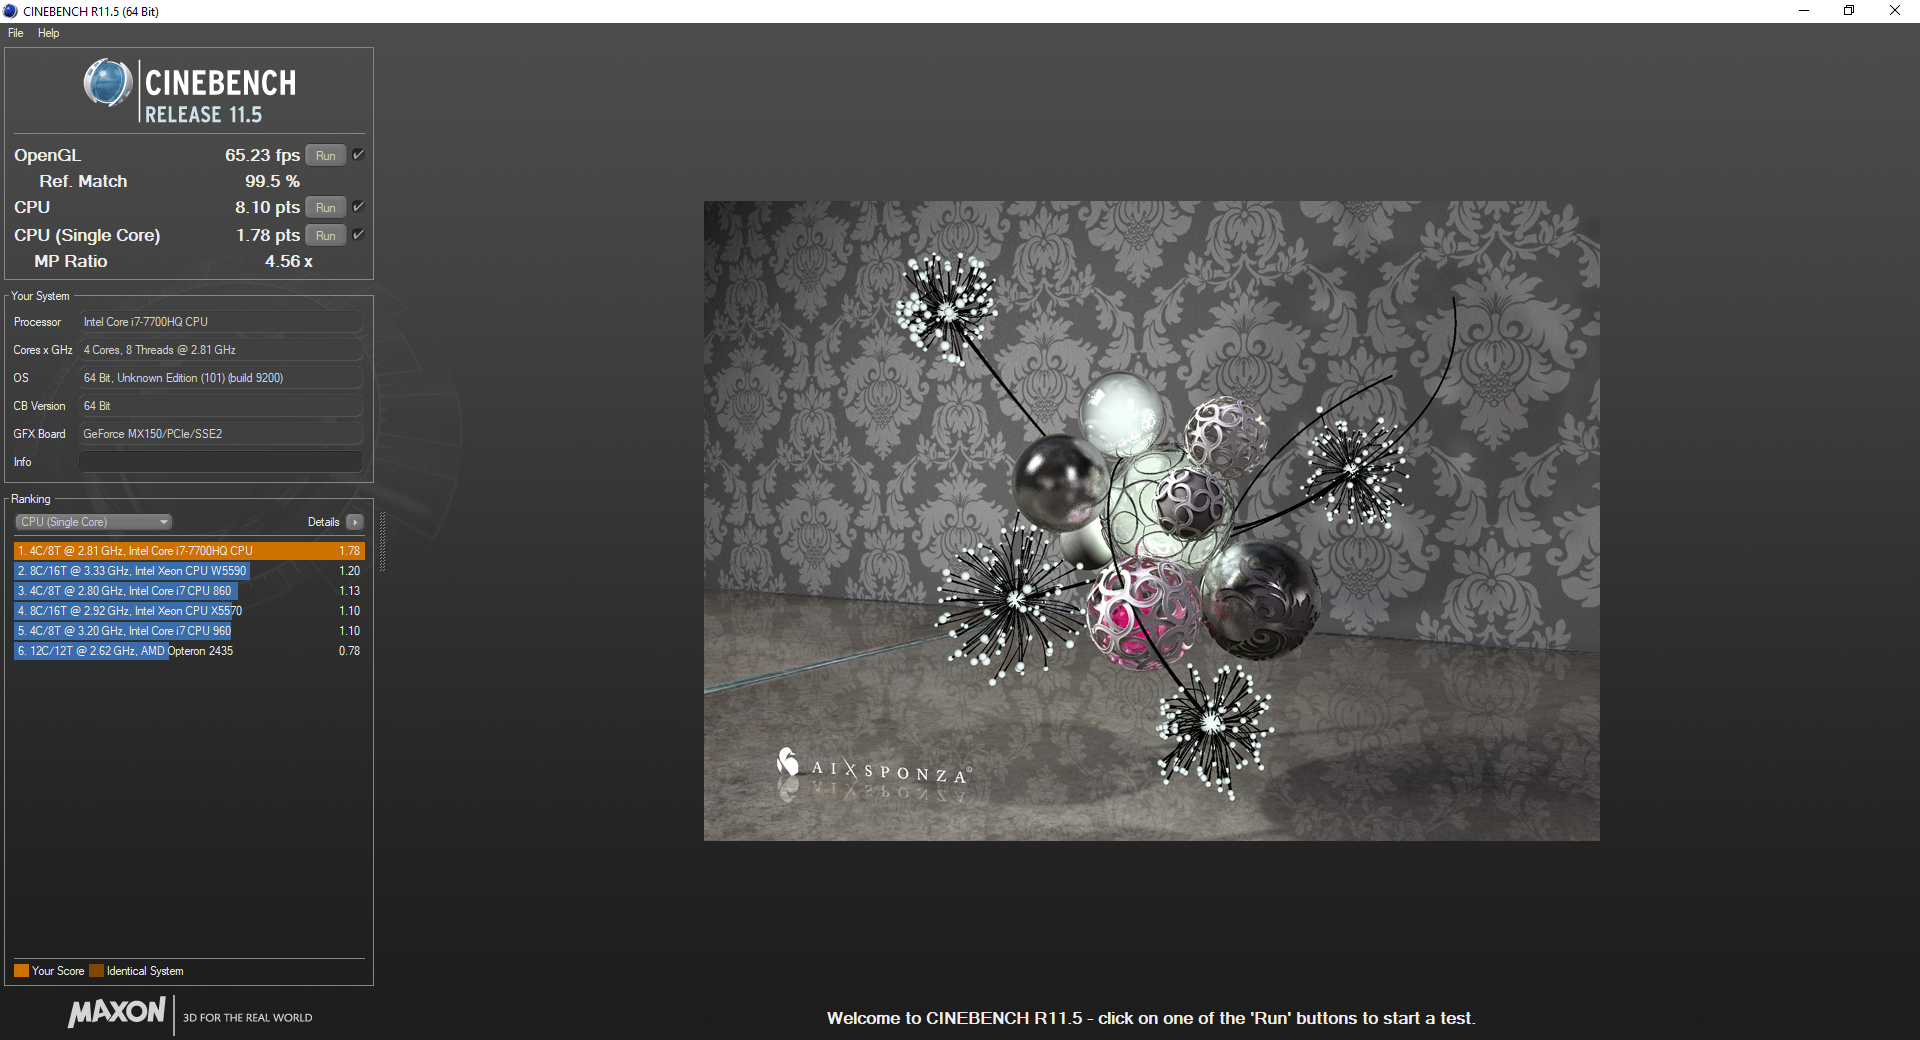
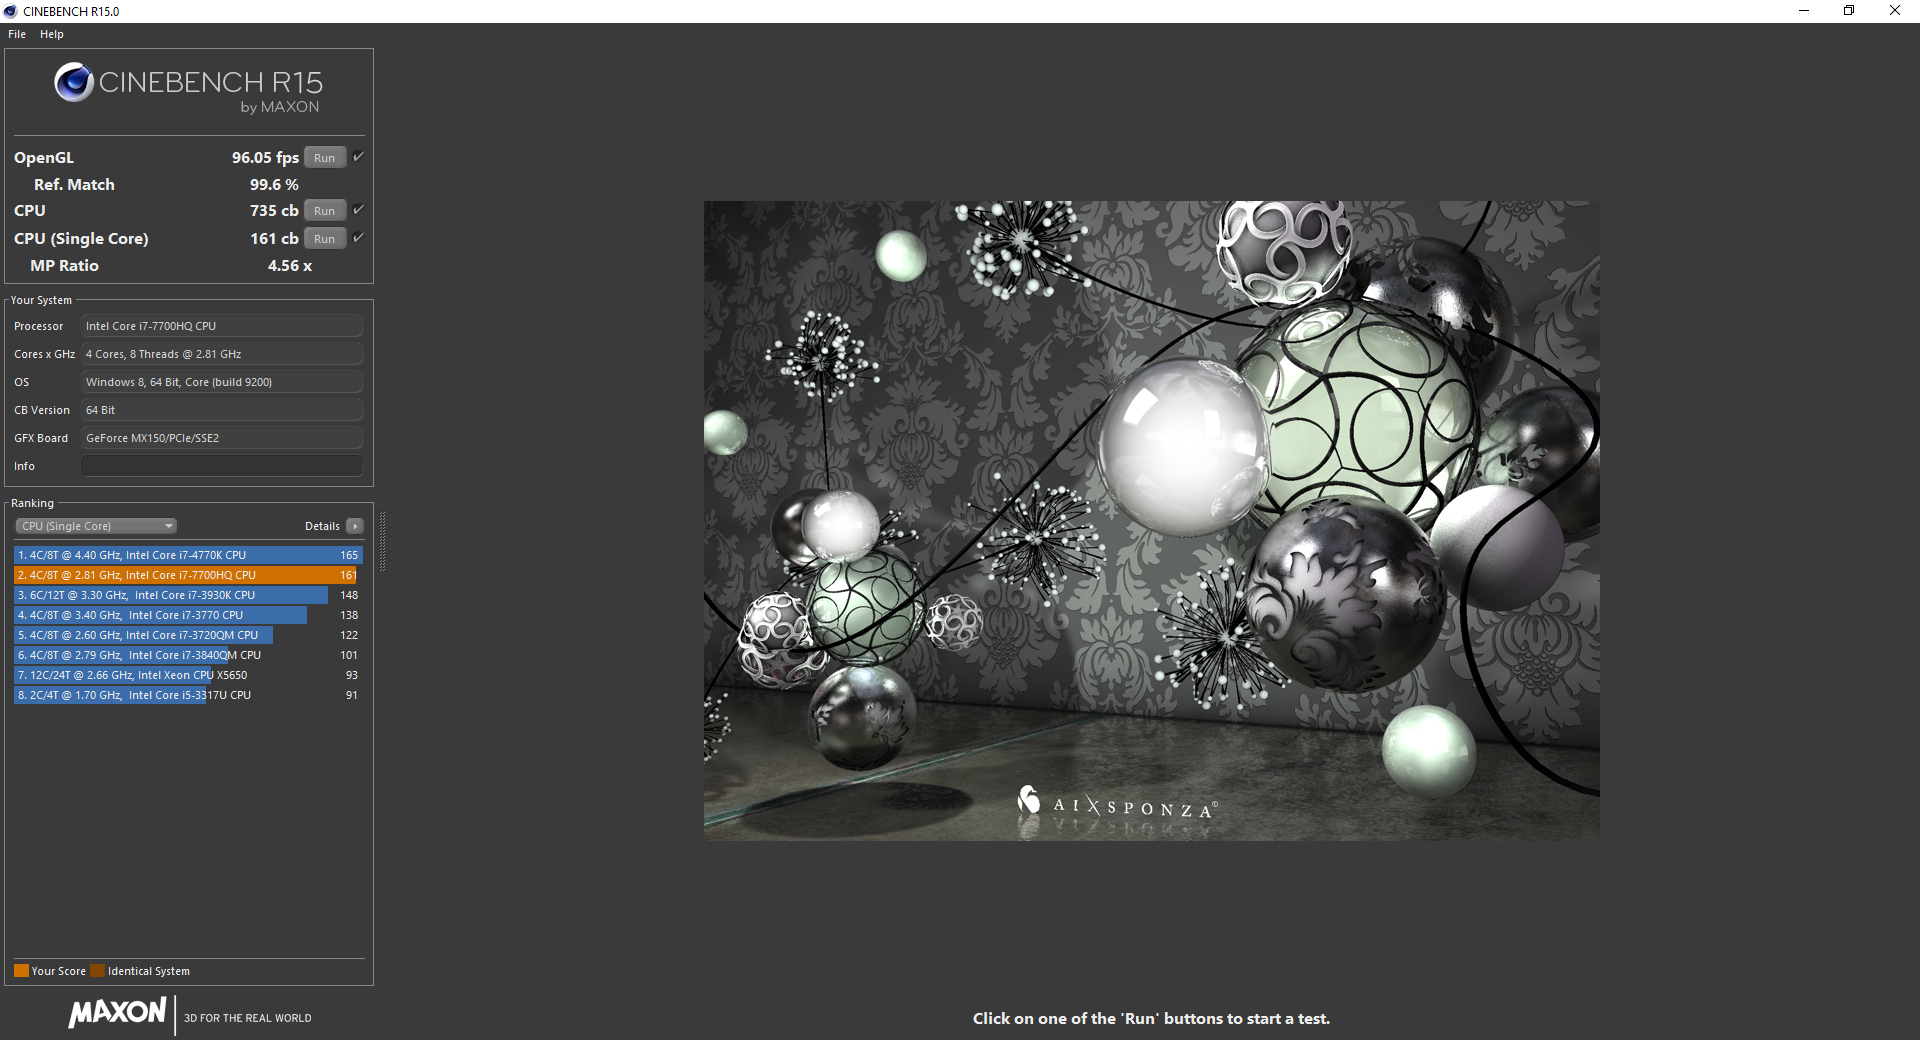
The Core i7-7700HQ has been well-documented in our database since it is the CPU of choice for most newer gaming notebooks. Raw performance is not significantly faster than the Skylake i7-6700HQ or even Broadwell i7-5700HQ in both single- and multi-core CineBench benchmarks. Upgrading from the dual-core i5-7300HQ or much older i7-4700HQ will see performance gains of about 25 to 50 percent depending on the load.
Running CineBench R15 Multi-Thread in a loop results in no significant performance drops over time. The initial score of 735 points drops by just a few points to about 719 after the 6th run or so to indicate good Turbo Boost sustainability. It's not perfect, however, as indicated by our Stress Test section, but average performance is reliably steady.
See our Core i7-7700HQ CPU page for more technical information and benchmark comparisons.
| wPrime 2.10 - 1024m | |
| Dell Inspiron 15 7000 7567 Gaming (Core i5-7300HQ, GTX 1050) | |
| Lenovo Legion Y920-17IKB | |
| Lenovo IdeaPad Y50 | |
| Eurocom Q5 | |
| Sager NP5852 | |
| Gigabyte P55 V4 | |
* ... smaller is better
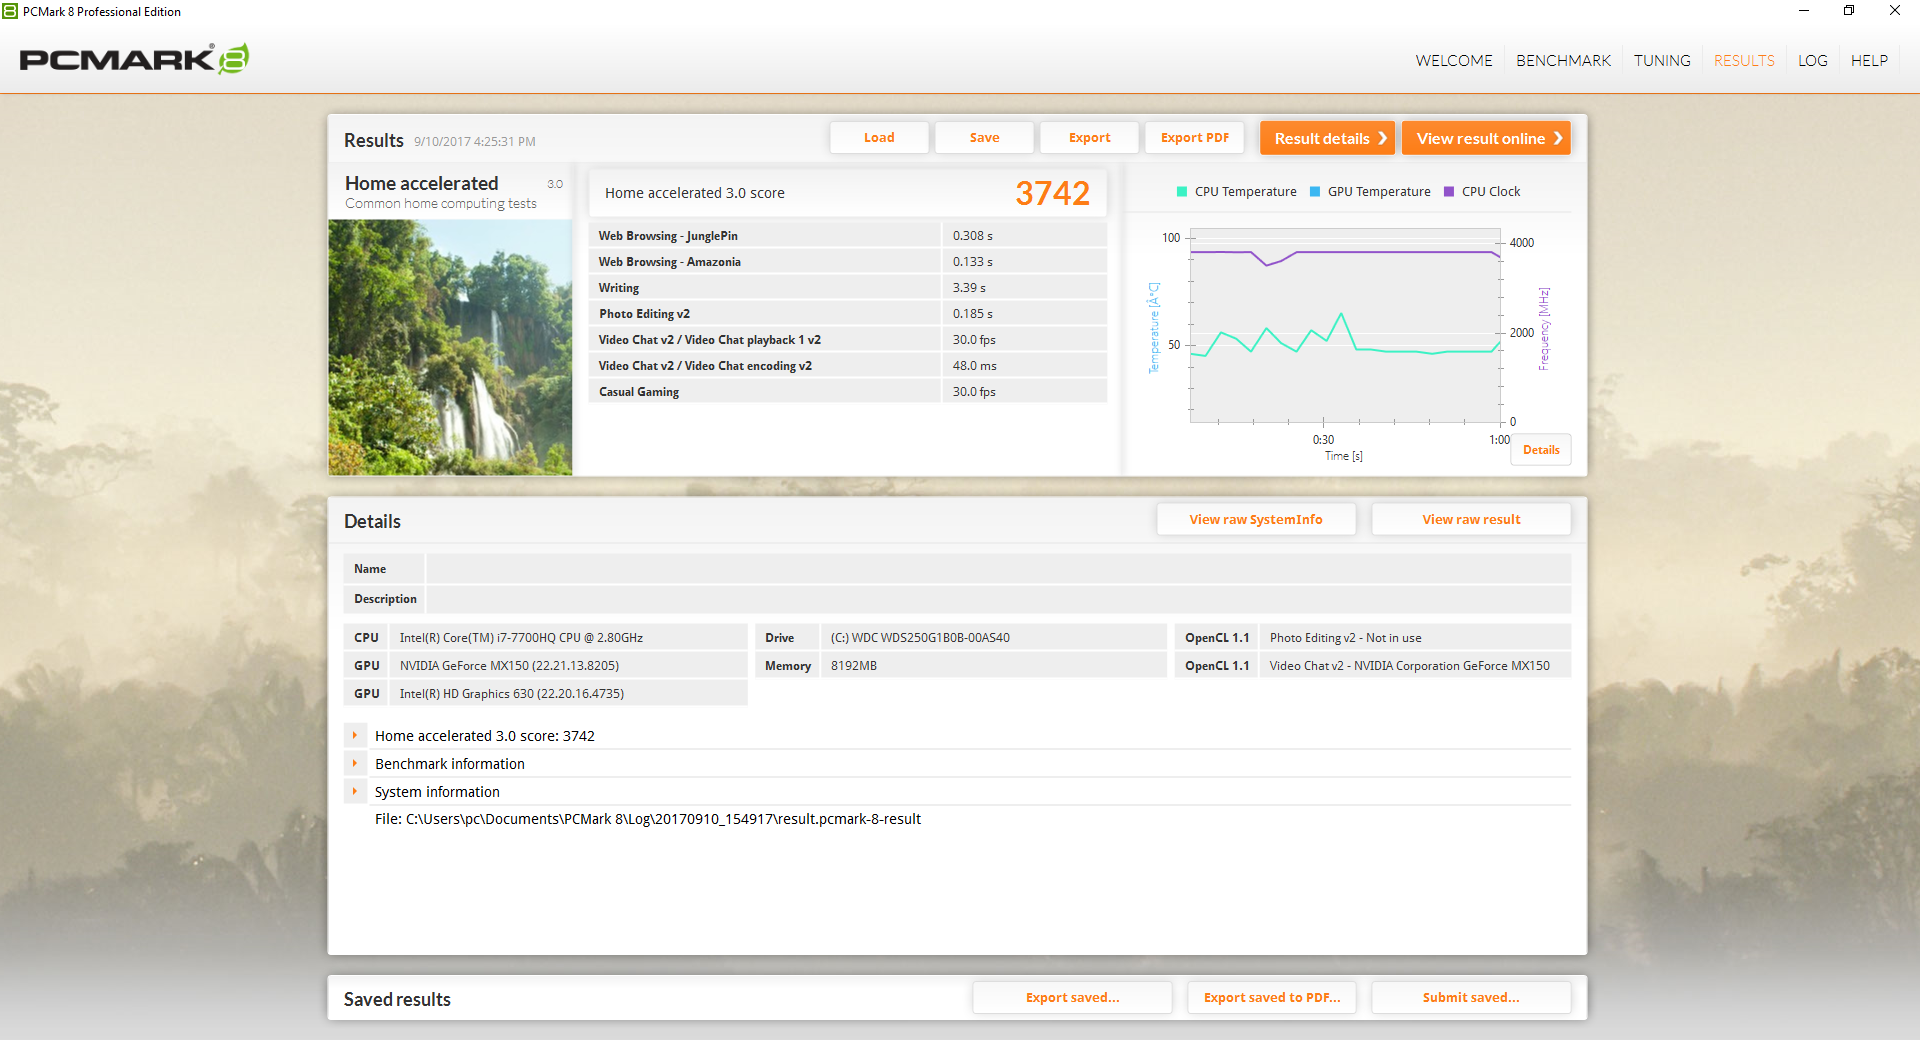
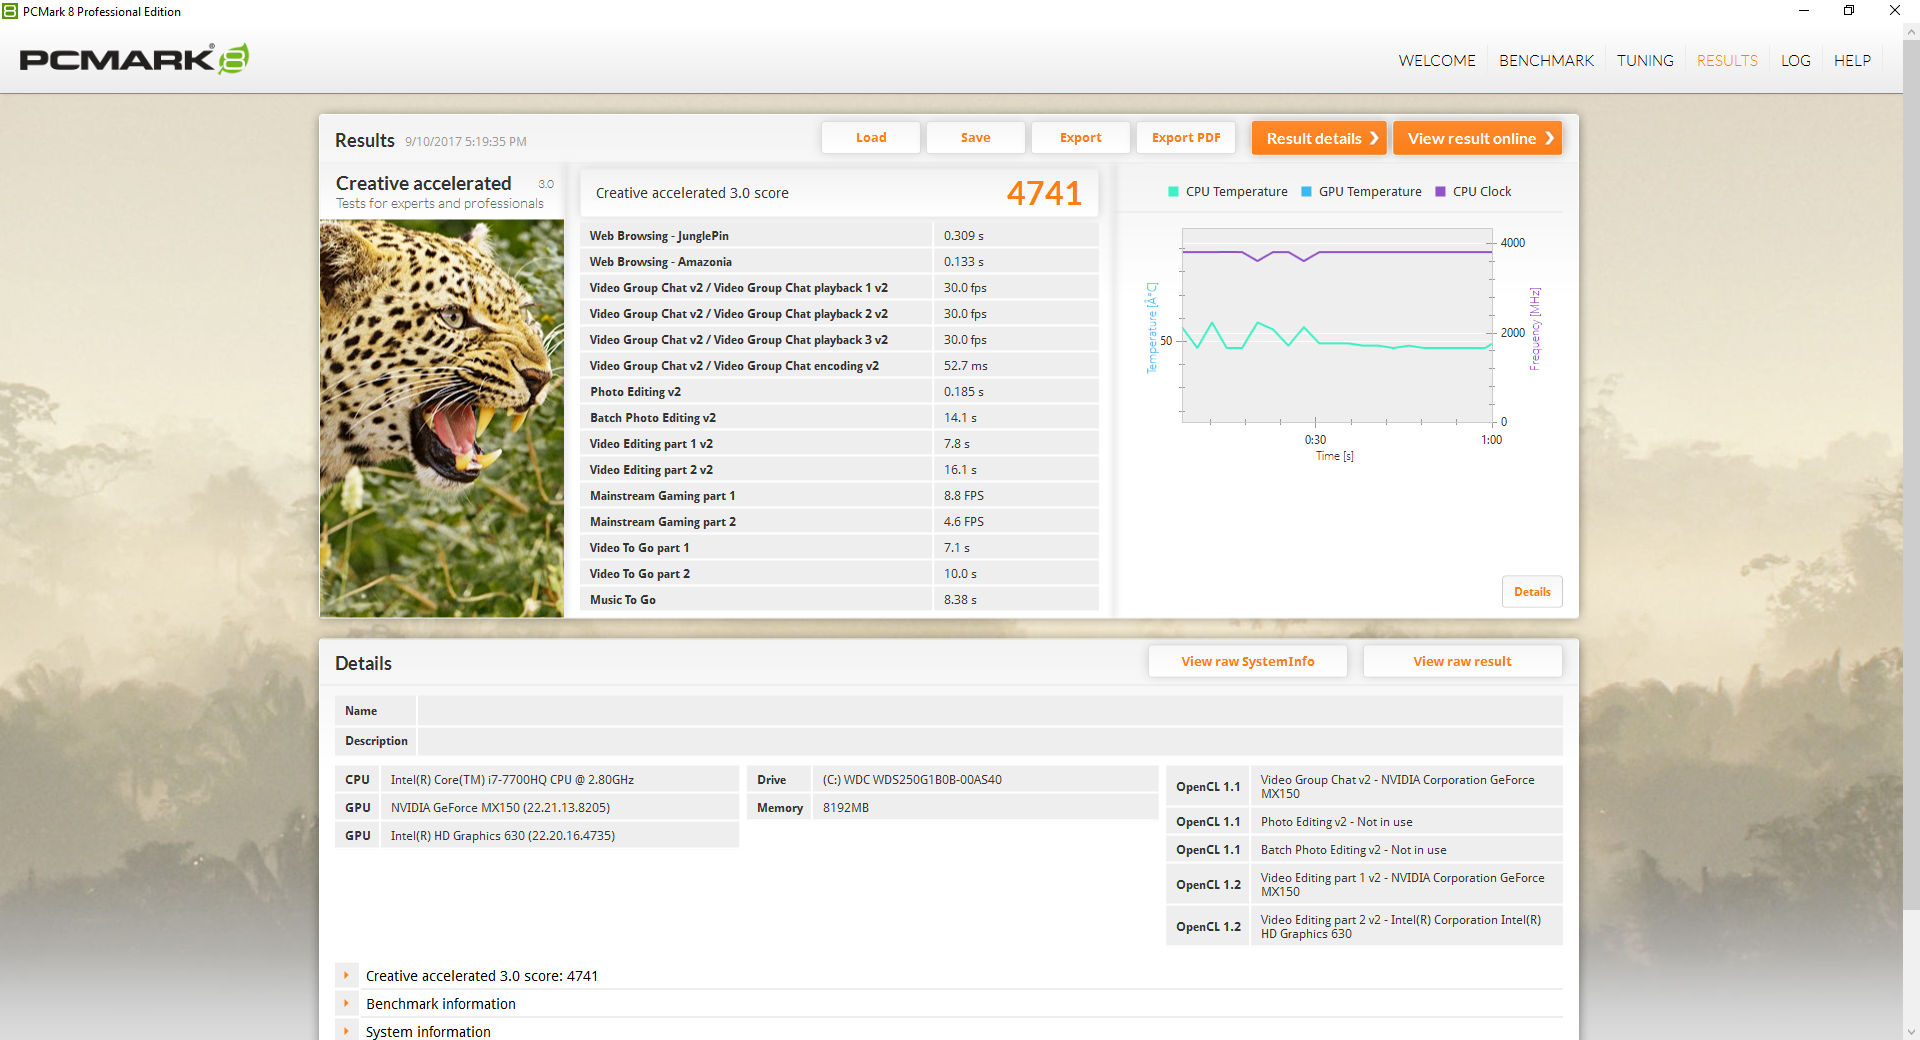
System Performance
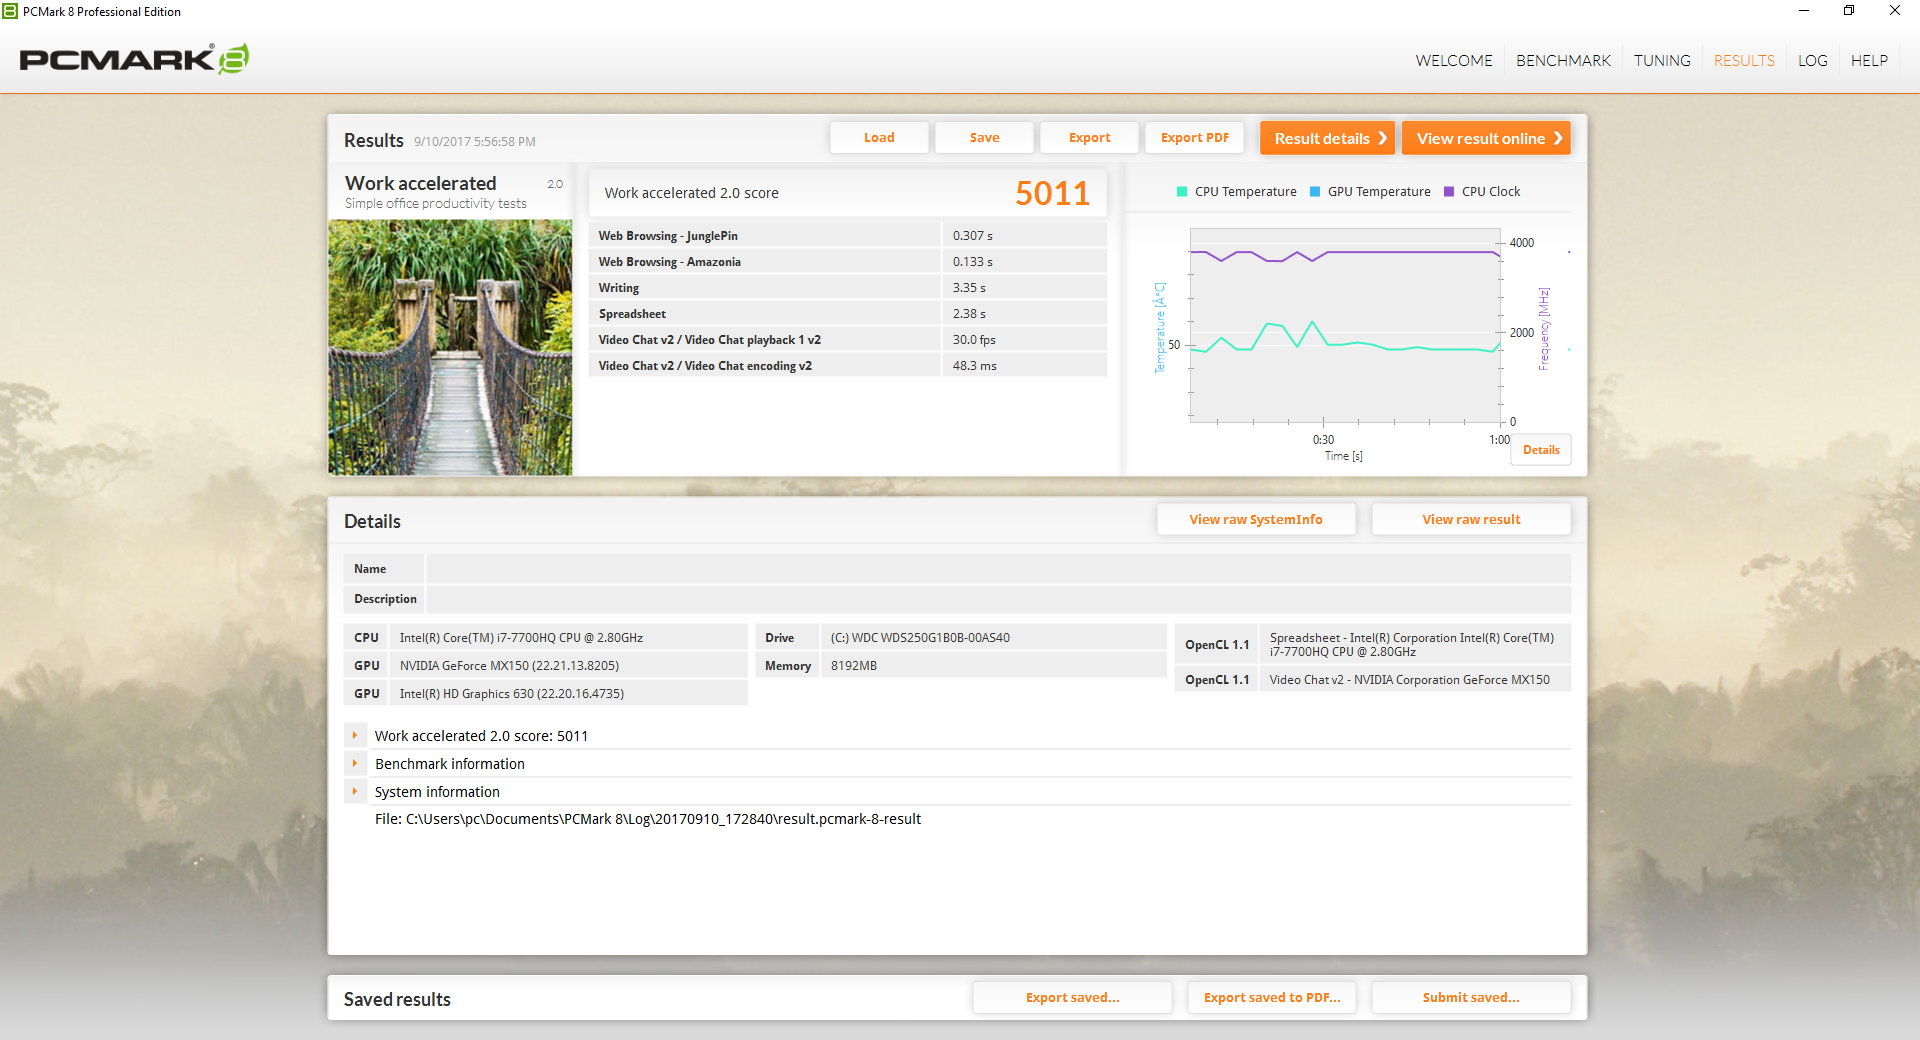
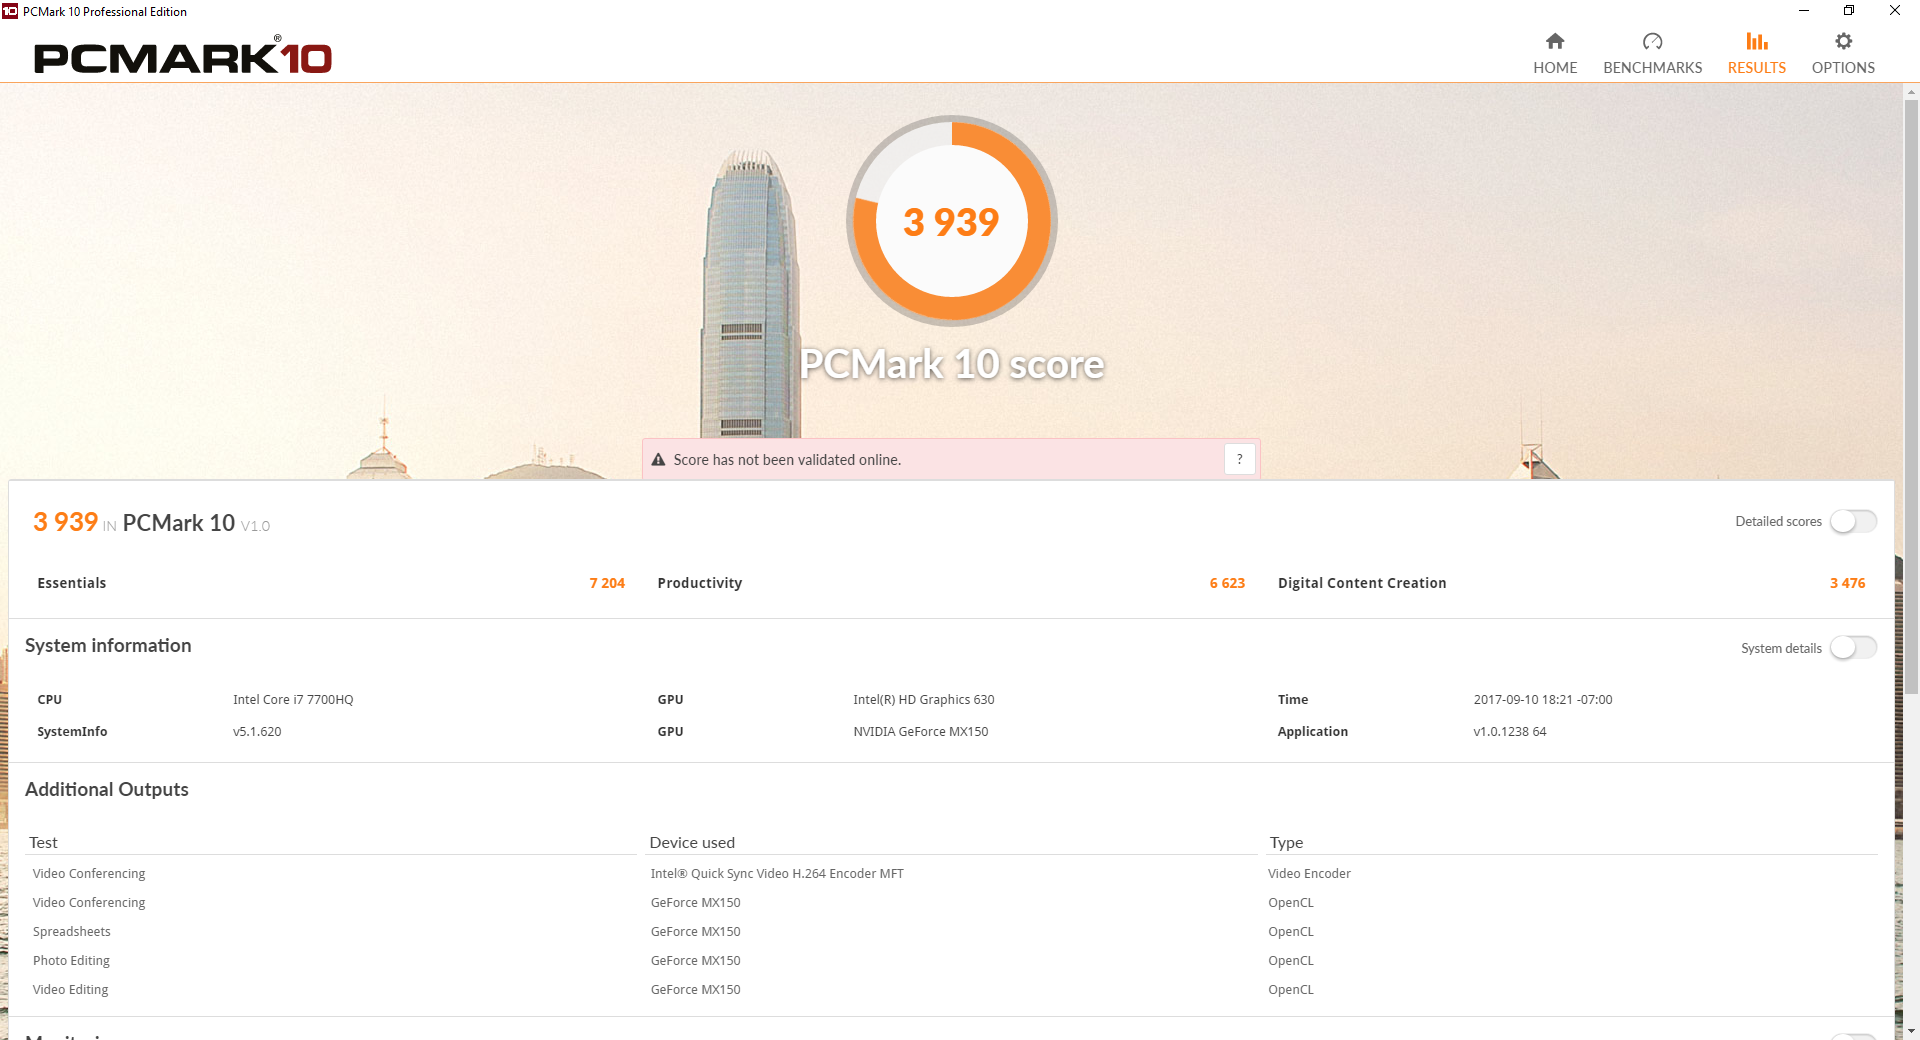
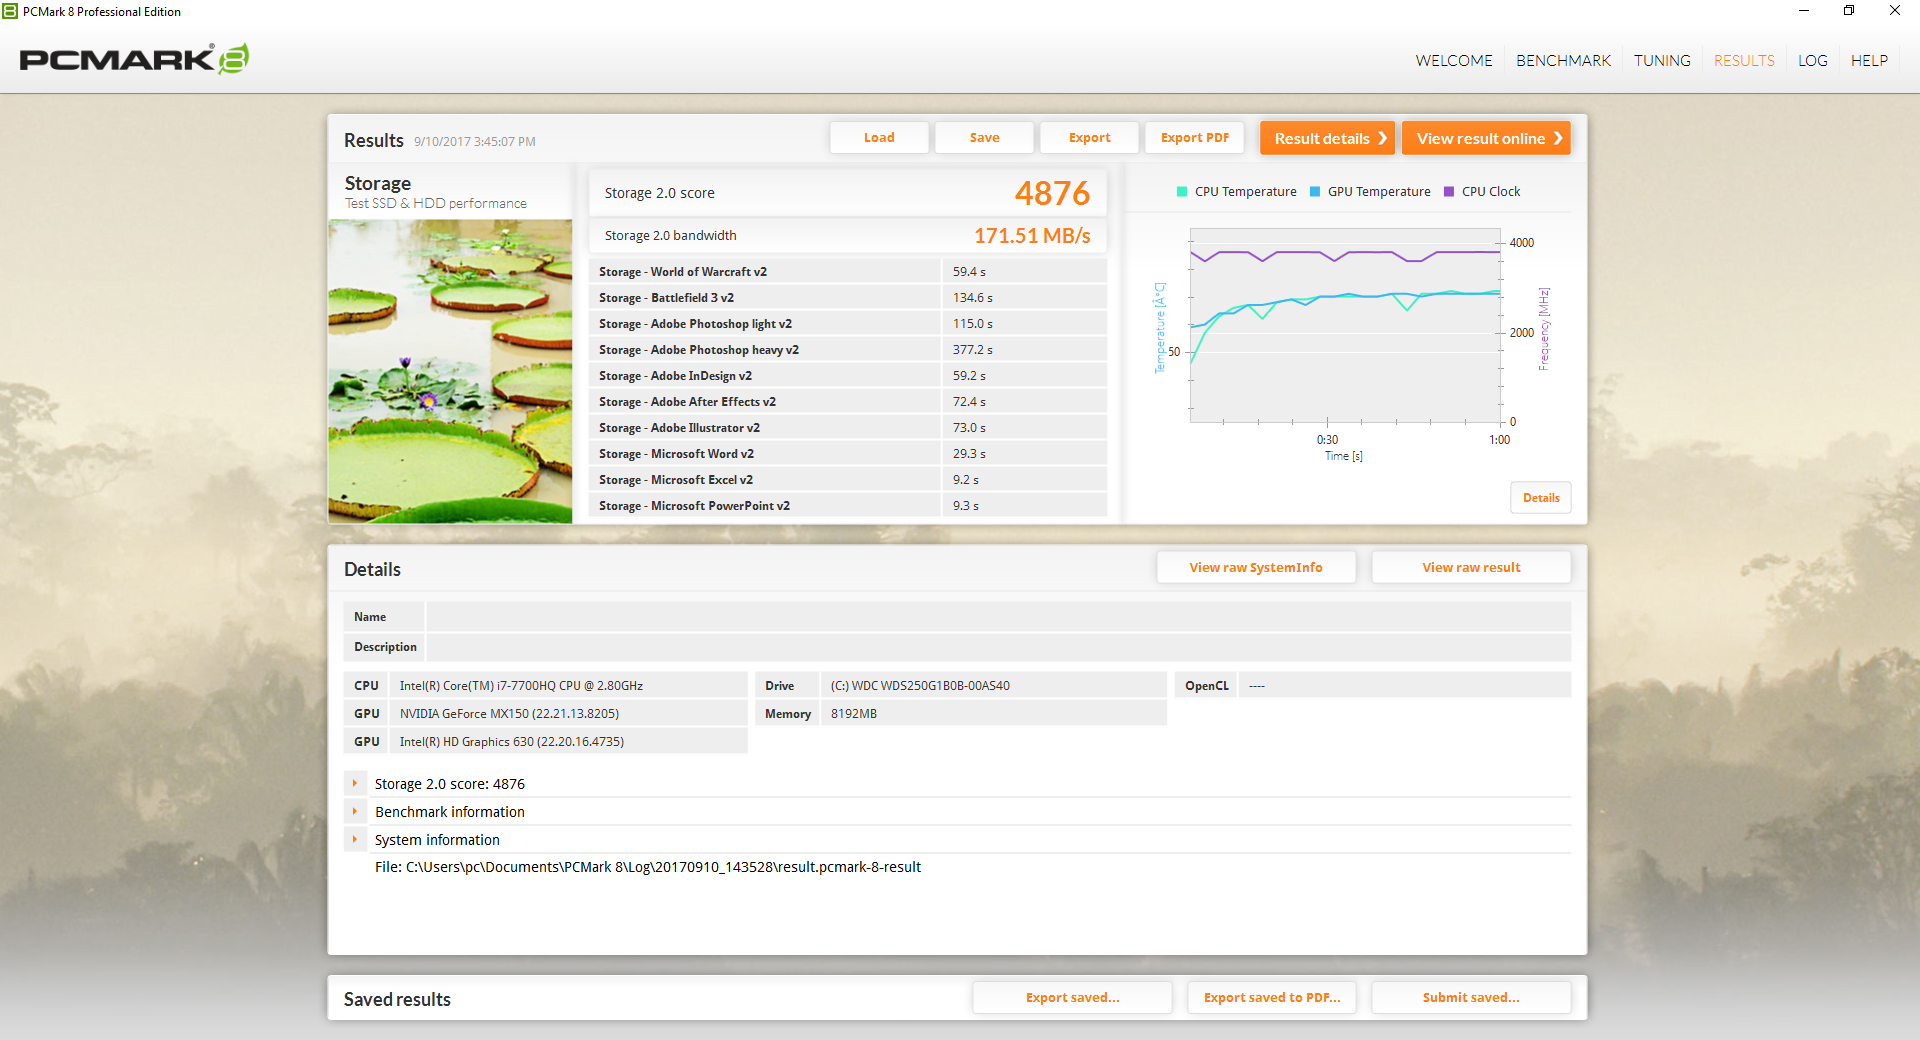
PCMark benchmarks rank the Sager in the same ballpark as current gaming notebooks equipped with the GTX 1050. The quad-core i7-7700HQ CPU puts the system well ahead of the Acer Aspire F5 with the same MX150 GPU but slower ULV i5-7200U. Subjectively, we experienced no software issues or hiccups during testing.
| PCMark 8 | |
| Home Score Accelerated v2 | |
| Lenovo Legion Y920-17IKB | |
| Sager NP5852 | |
| Acer Aspire 5 A515-51G-51RL | |
| Gigabyte Sabre 15G | |
| Acer Aspire F5-771G-50RD | |
| Work Score Accelerated v2 | |
| Lenovo Legion Y920-17IKB | |
| Gigabyte Sabre 15G | |
| Sager NP5852 | |
| Acer Aspire 5 A515-51G-51RL | |
| Acer Aspire F5-771G-50RD | |
| Creative Score Accelerated v2 | |
| Lenovo Legion Y920-17IKB | |
| Sager NP5852 | |
| Acer Aspire 5 A515-51G-51RL | |
| Gigabyte Sabre 15G | |
| PCMark 8 Home Score Accelerated v2 | 3742 points | |
| PCMark 8 Creative Score Accelerated v2 | 4741 points | |
| PCMark 8 Work Score Accelerated v2 | 5011 points | |
| PCMark 10 Score | 3939 points | |
Help | ||
Storage Devices
Two internal storage bays are available in the form of M.2 2280 with NVMe support and 2.5-inch SATA III for up to 9.5 mm-thick drives.
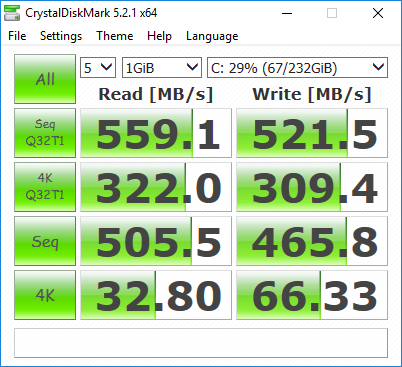
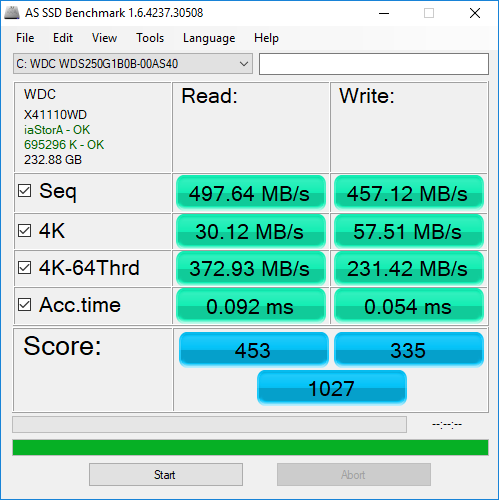
The sole Western Digital Blue 250 GB M.2 SSD returns respectable transfer rates for a SATA III drive. Sequential read and write rates are just under 500 MB/s each (or slightly faster according to CDM 5) to be similar to the Lite-On CV3 SSDs found on the Sabre 15 and TravelMate P658. Users intending to install more than just a handful of games will have to invest in a secondary HDD or a larger primary SSD for additional storage.
See our table of SSDs and HDDs for more benchmark comparisons.
| Sager NP5852 Western Digital WD Blue PC SSD WDS250G1B0B | Gigabyte Sabre 15G Liteonit CV3-8D128 | Asus ZenBook Pro UX550VD Samsung PM961 NVMe MZVLW512HMJP | Acer Aspire 5 A515-51G-51RL Kingston RBUSNS8180DS3128GH | Acer TravelMate P658-G2-MG-7327 Liteonit CV3-8D512 | Asus AsusPro P4540UQ-FY0056R SK Hynix HFS256G39TND-N210A | |
|---|---|---|---|---|---|---|
| AS SSD | -14% | 215% | -60% | 11% | -34% | |
| Copy Game MB/s (MB/s) | 263.6 | 323.5 23% | 889 237% | 214.6 -19% | 410.4 56% | 168.2 -36% |
| Copy Program MB/s (MB/s) | 191.1 | 195.3 2% | 336.4 76% | 71.1 -63% | 266.9 40% | 123.4 -35% |
| Copy ISO MB/s (MB/s) | 337.5 | 446.8 32% | 1678 397% | 296.7 -12% | 491.5 46% | 266.9 -21% |
| Score Total (Points) | 1027 | 752 -27% | 3731 263% | 1043 2% | 982 -4% | 977 -5% |
| Score Write (Points) | 335 | 234 -30% | 1158 246% | 405 21% | 400 19% | 316 -6% |
| Score Read (Points) | 453 | 337 -26% | 1727 281% | 414 -9% | 379 -16% | 442 -2% |
| Access Time Write * (ms) | 0.054 | 0.073 -35% | 0.028 48% | 0.42 -678% | 0.067 -24% | 0.224 -315% |
| Access Time Read * (ms) | 0.092 | 0.141 -53% | 0.031 66% | 0.191 -108% | 0.068 26% | 0.084 9% |
| 4K-64 Write (MB/s) | 231.4 | 132.2 -43% | 870 276% | 309.5 34% | 293.5 27% | 233.6 1% |
| 4K-64 Read (MB/s) | 372.9 | 257 -31% | 1430 283% | 328.4 -12% | 301.6 -19% | 364.5 -2% |
| 4K Write (MB/s) | 57.5 | 53.8 -6% | 133.2 132% | 52.5 -9% | 58 1% | 63.5 10% |
| 4K Read (MB/s) | 30.12 | 28.3 -6% | 54 79% | 38.73 29% | 27.05 -10% | 27.19 -10% |
| Seq Write (MB/s) | 457.1 | 479.8 5% | 1540 237% | 425 -7% | 488.7 7% | 190.8 -58% |
| Seq Read (MB/s) | 497.6 | 516 4% | 2429 388% | 471.7 -5% | 501 1% | 502 1% |
* ... smaller is better

GPU Performance
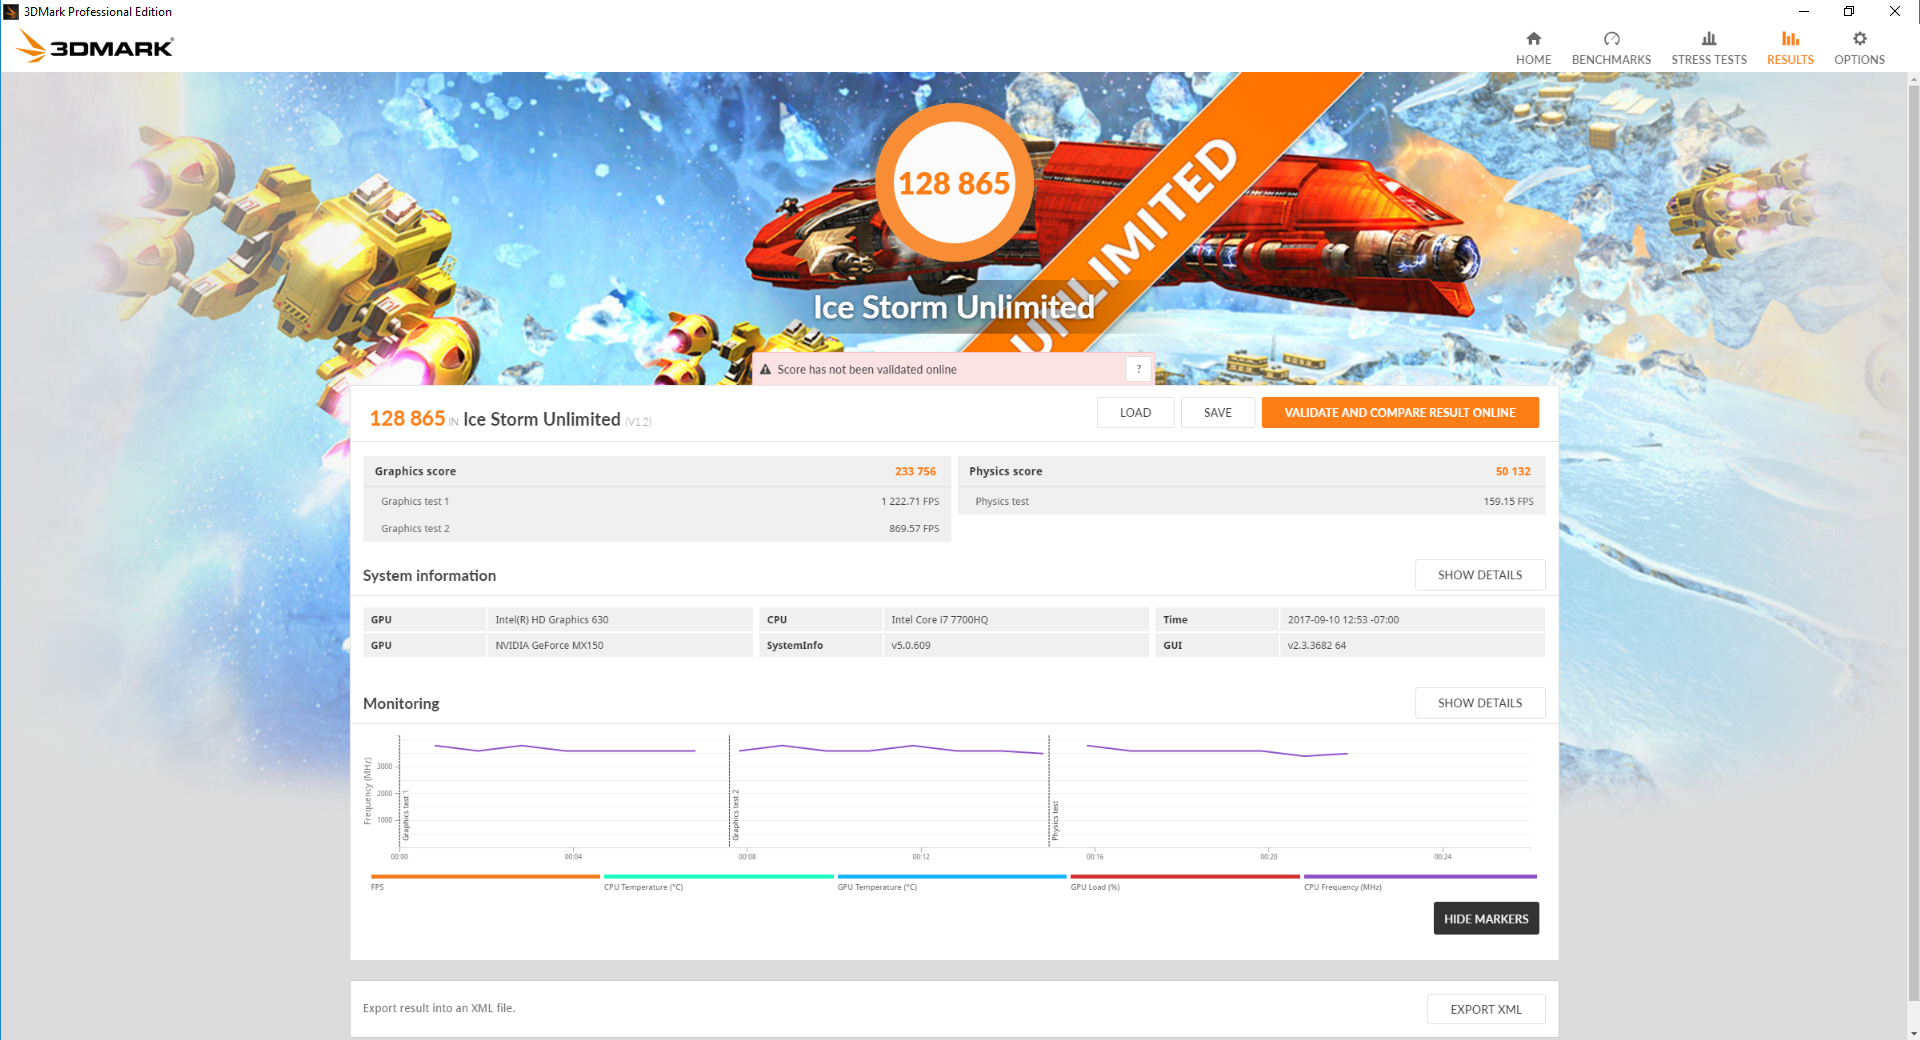
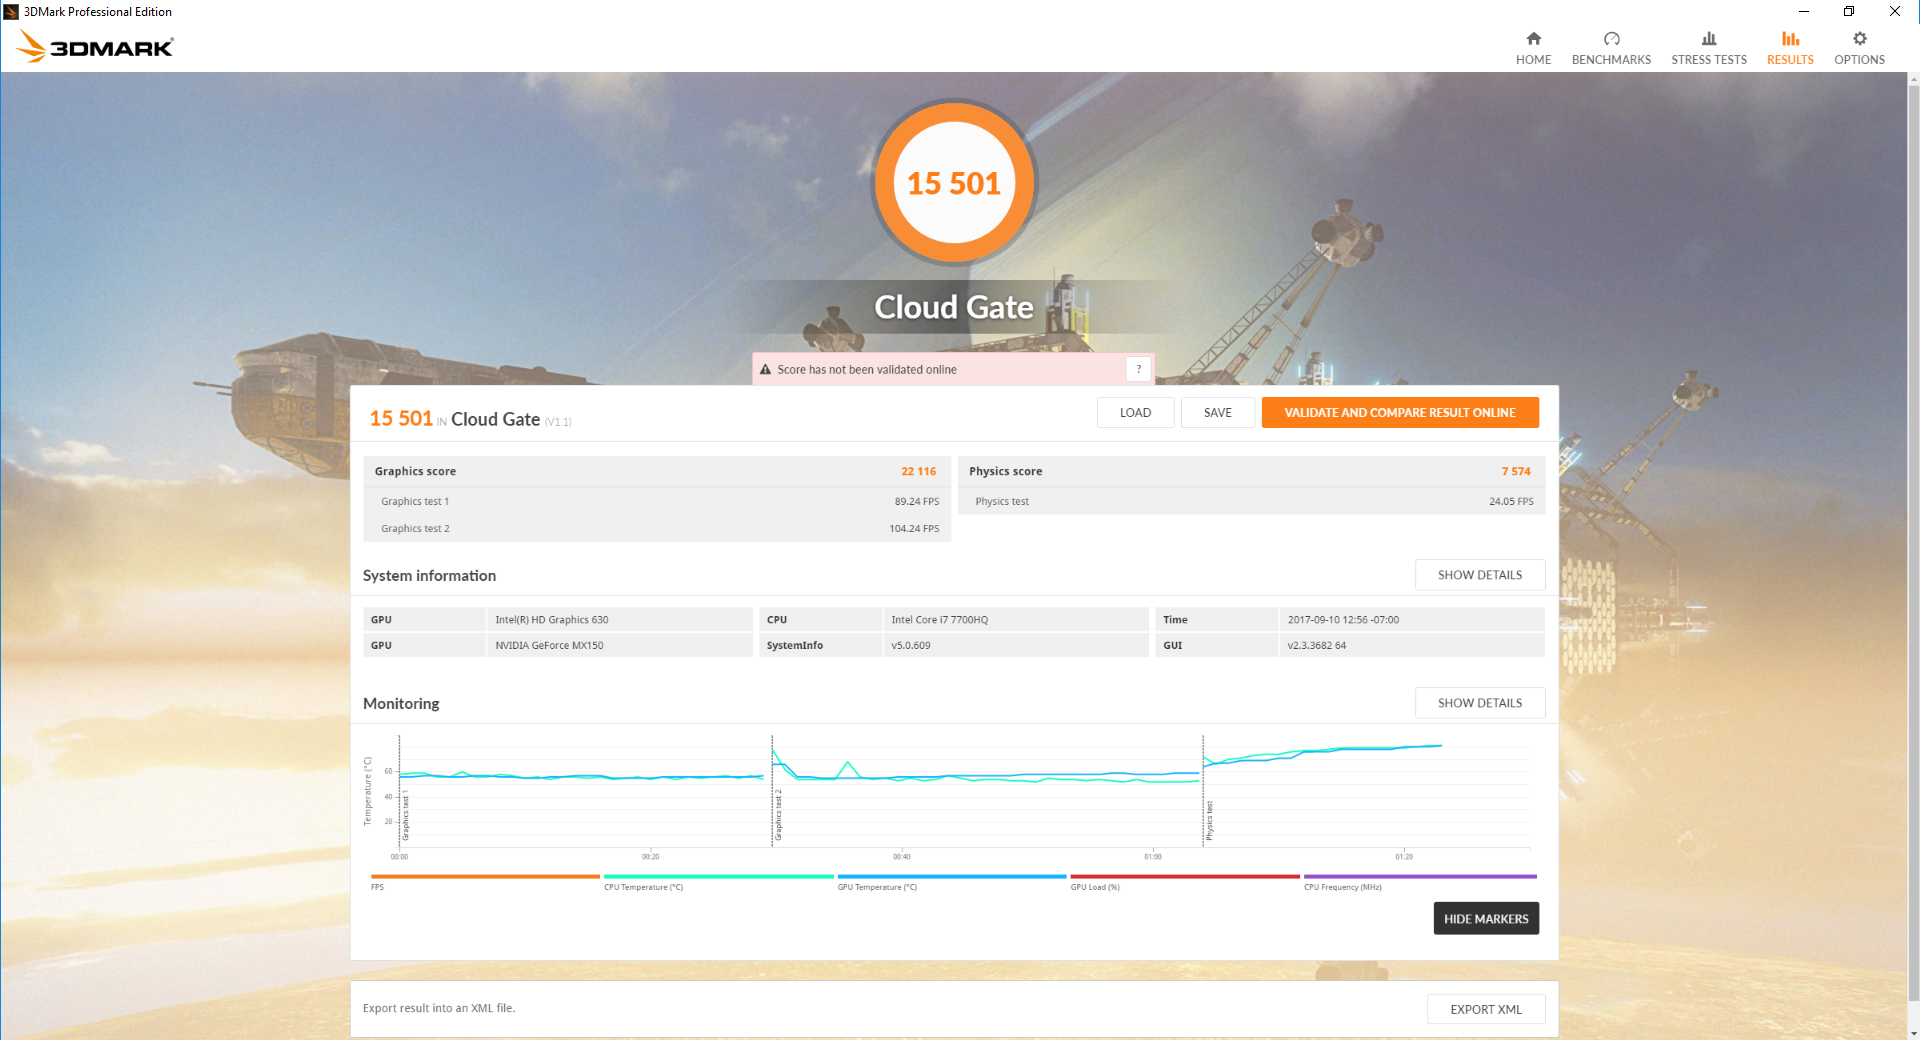
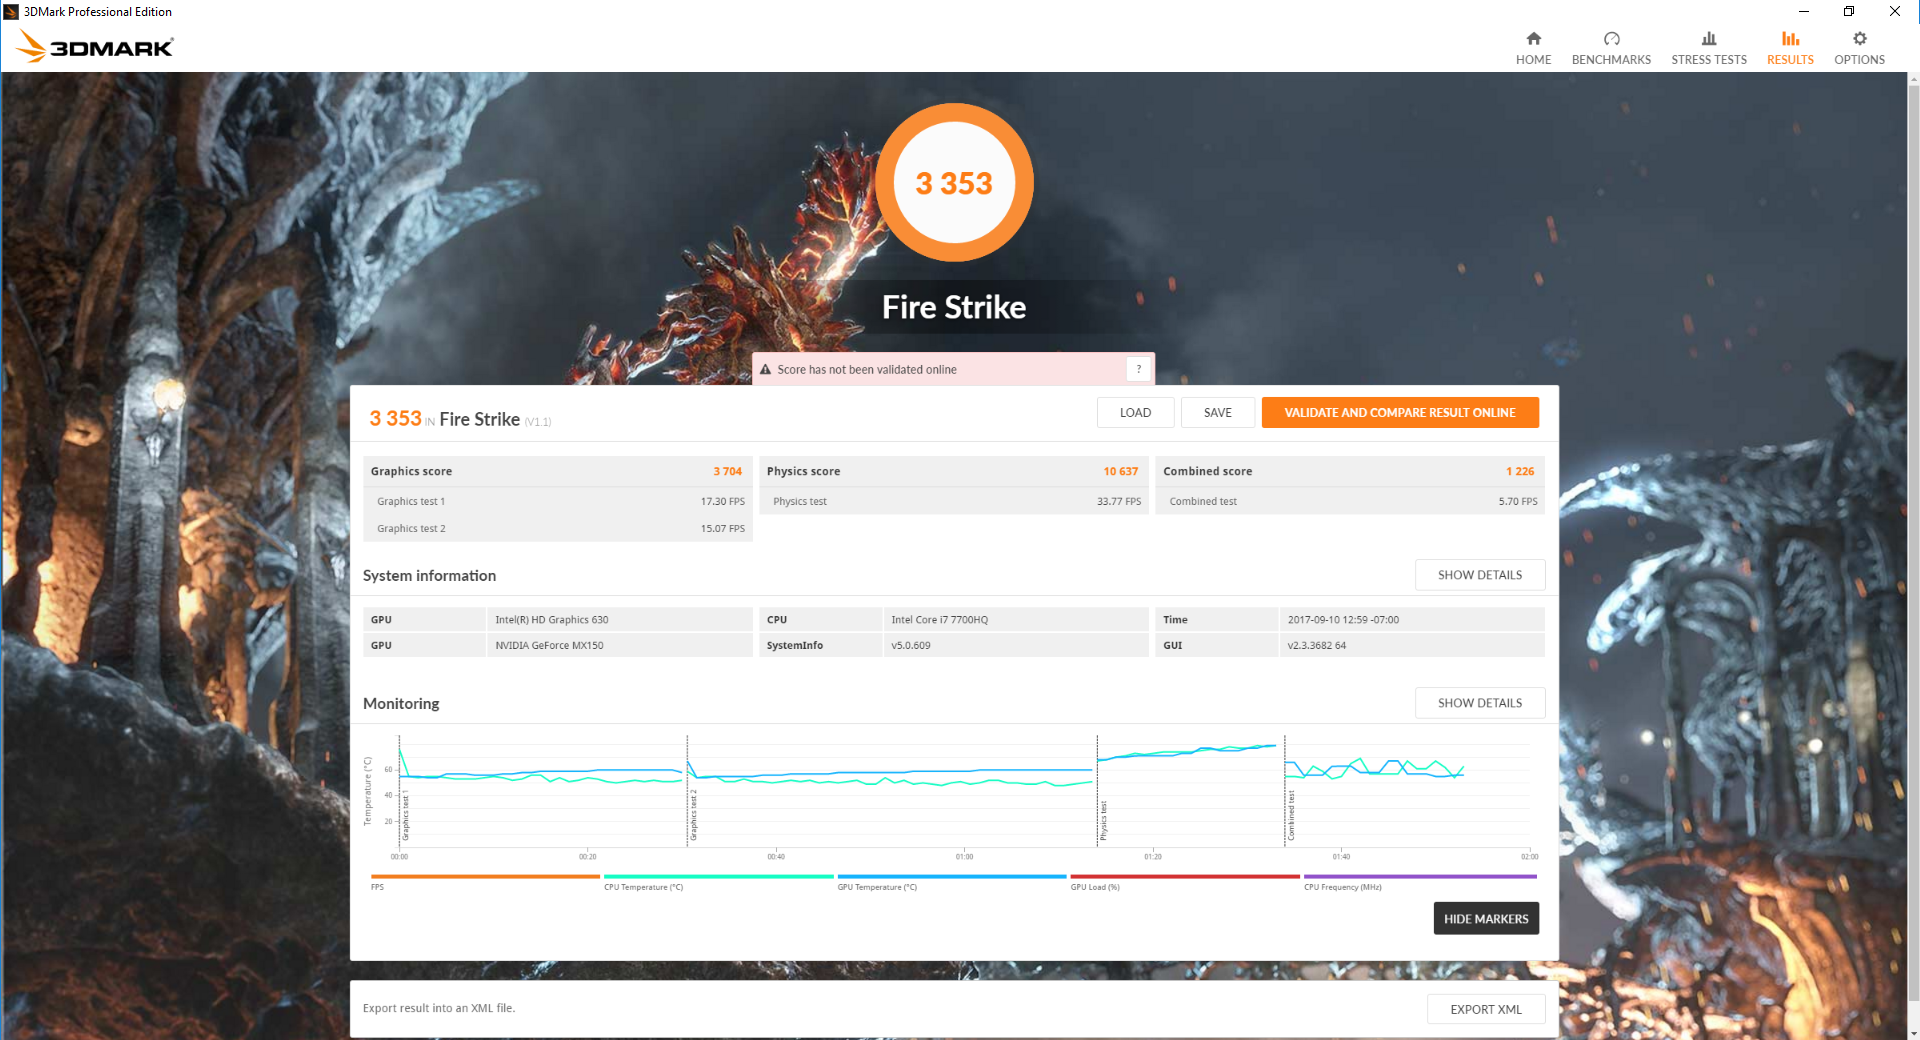
Raw GPU performance is approximately 60 to 70 percent faster than the GeForce 940MX and roughly equivalent to the GTX 950M according to 3DMark benchmarks. It's certainly nowhere near as powerful as the mainstream GTX 1050, but that is ok because Nvidia is instead marketing the MX150 as an alternative to integrated Intel HD Graphics with massive performance-per-Watt advantages over the older GeForce 940MX. From this perspective, the MX150 is about three times faster than the HD Graphics 630 and even the Iris Plus Graphics 640 pales in comparison to the Nvidia GPU. Fire Strike scores are on par with our reference desktop build equipped with the GT 1030.
See our dedicated comparison review on the MX150 GPU for more technical information and benchmarks.
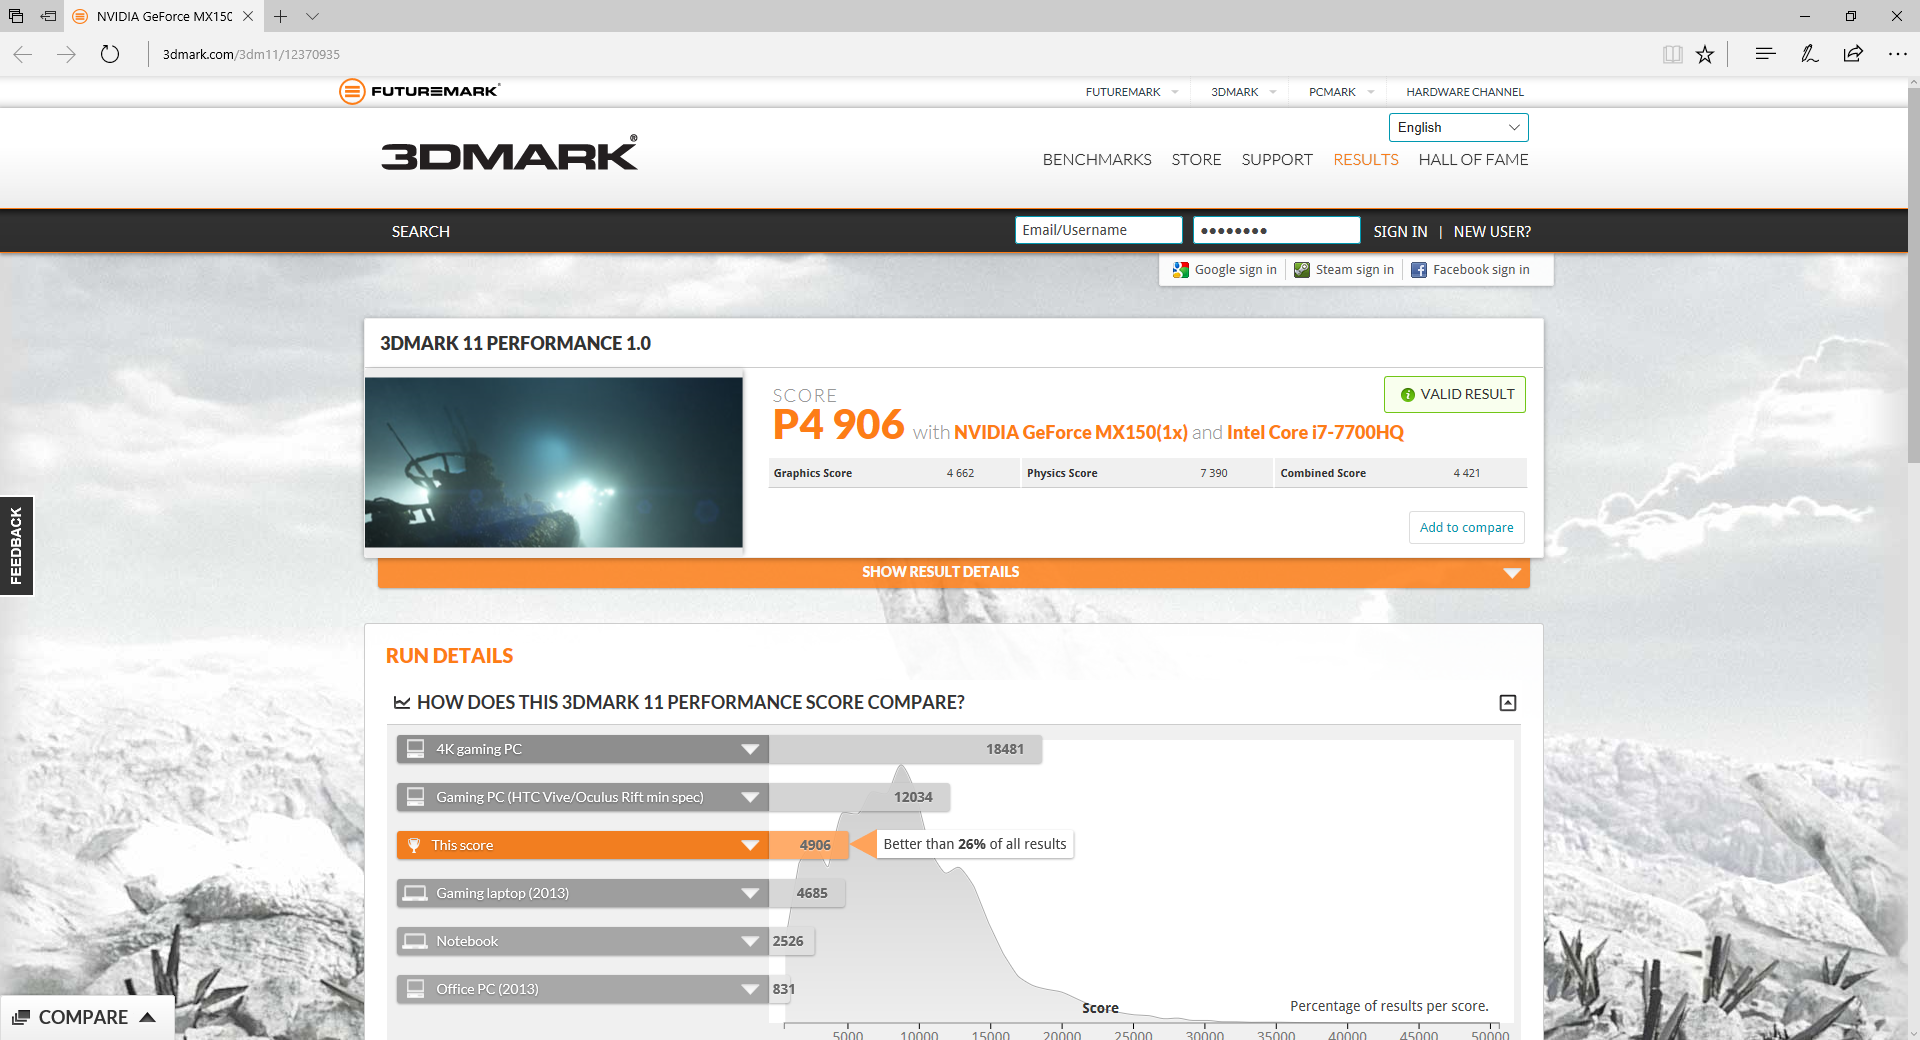
| 3DMark 11 Performance | 4906 points | |
| 3DMark Ice Storm Standard Score | 72119 points | |
| 3DMark Cloud Gate Standard Score | 15501 points | |
| 3DMark Fire Strike Score | 3353 points | |
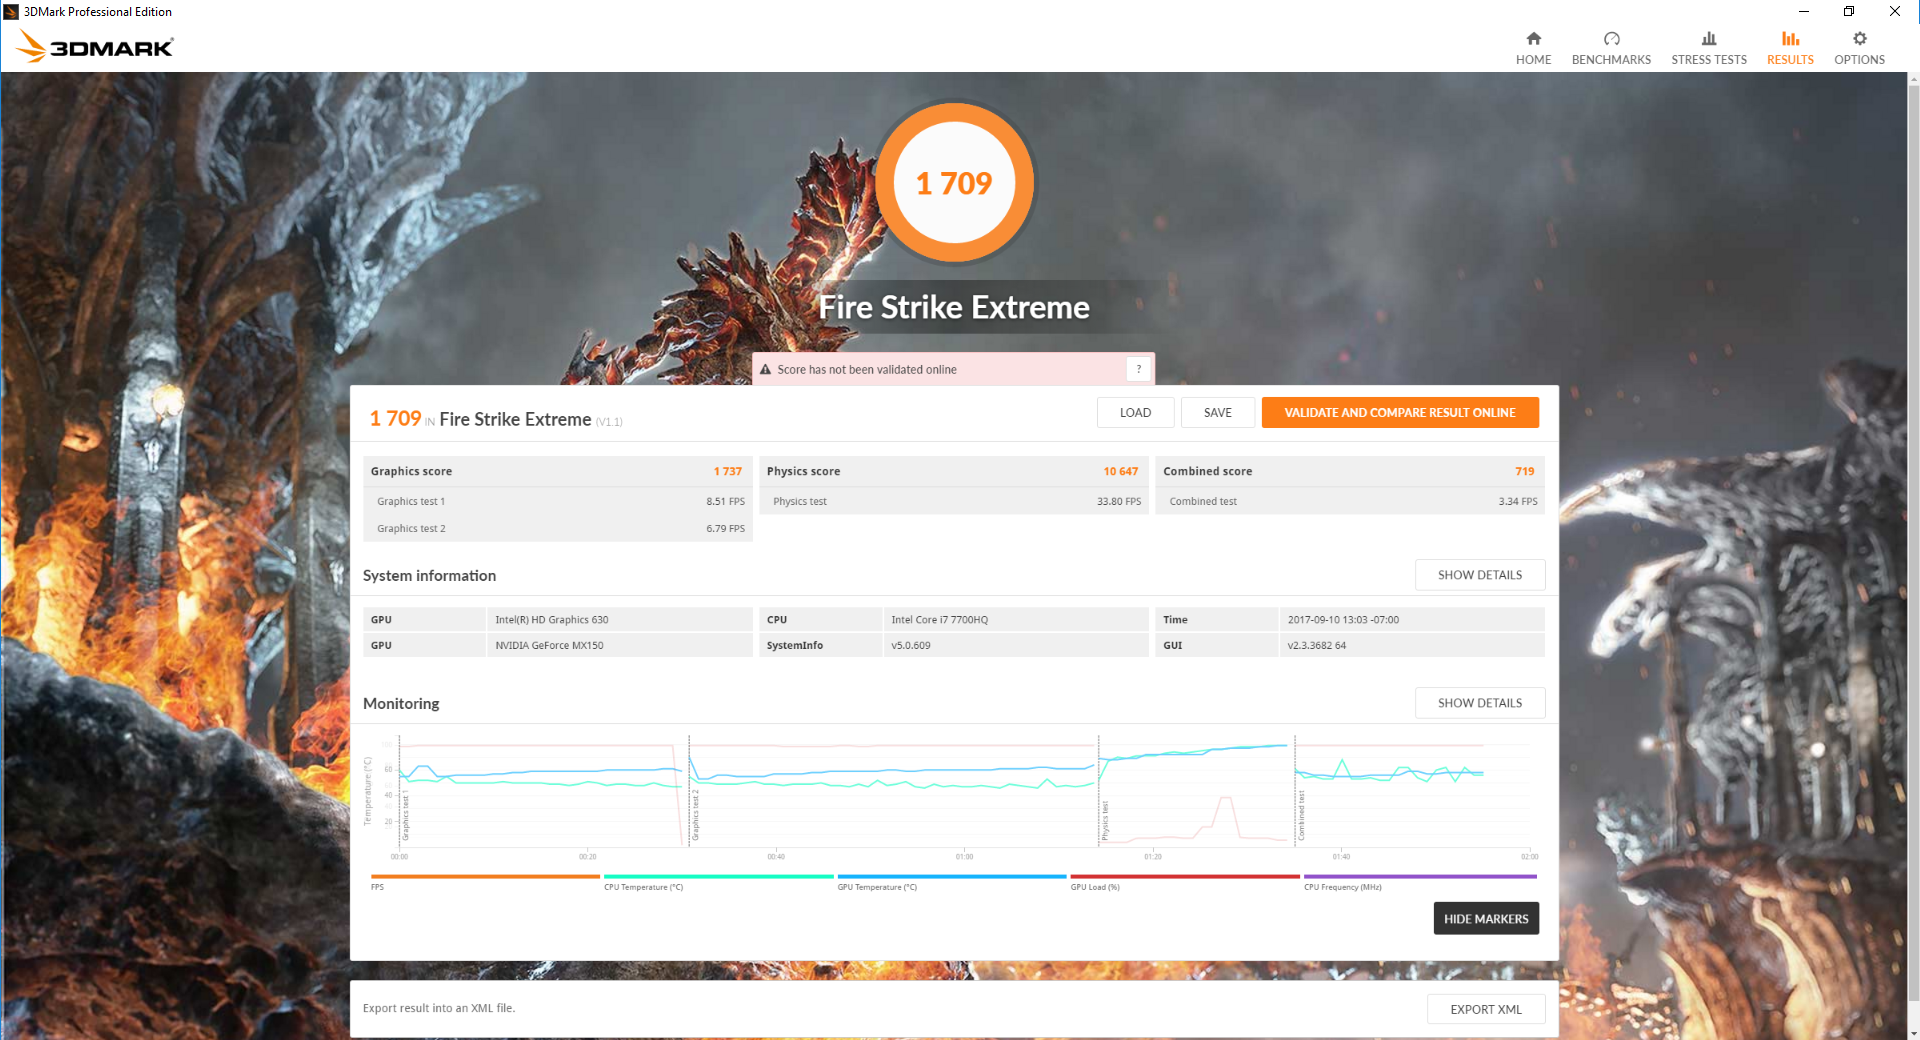
| 3DMark Fire Strike Extreme Score | 1709 points | |
Help | ||
Gaming Performance
Performance when gaming is comfortably between the GTX 950M and GTX 960M and about 40 to 45 percent slower than the GTX 1050. This is enough to run most games at native 1080p on low-medium settings so long as users are satisfied with a steady 30 FPS. More demanding titles like Batman: Arkham Knight and Witcher 3 have bandwidth-eating features like HairWorks and volumetric smoke that must be disabled in order to get decent performance. Once settings are balanced, however, performance will not be unlike what one would see from a standard Playstation 4.
Frame rates are nearly identical to our desktop GT 1030 setup and about 10 percent to 15 percent faster than the Aspire 5 A515 equipped with the same GPU. The slightly weaker performance from the Acer is likely due to its slower ULV dual-core CPU compared to the HQ-class processor in the Sager.
See our MX150 GPU page for more technical information and gaming benchmarks.
| BioShock Infinite - 1920x1080 Ultra Preset, DX11 (DDOF) | |
| Gigabyte Sabre 15G | |
| MSI GL72 6QF | |
| Desktop PC Intel Xeon E5 2680v4 Zotac GT 1030 | |
| Sager NP5852 | |
| Acer Aspire 5 A515-51G-51RL | |
| Medion Erazer P6661 MD 99873 | |
| Samsung Notebook 9 NP900X5N-X01US | |
| Apple MacBook Pro 13 2017 Touchbar i5 | |
| Rise of the Tomb Raider - 1920x1080 Very High Preset AA:FX AF:16x | |
| Gigabyte Sabre 15G | |
| MSI GL72 6QF | |
| Desktop PC Intel Xeon E5 2680v4 Zotac GT 1030 | |
| Sager NP5852 | |
| Acer Aspire 5 A515-51G-51RL | |
| Medion Erazer P6661 MD 99873 | |
| Overwatch - 1920x1080 Epic (Render Scale 100 %) AA:SM AF:16x | |
| Gigabyte Sabre 15G | |
| Sager NP5852 | |
| Desktop PC Intel Xeon E5 2680v4 Zotac GT 1030 | |
| Apple MacBook Pro 13 2017 Touchbar i5 | |
| low | med. | high | ultra | |
|---|---|---|---|---|
| Guild Wars 2 (2012) | 95.2 | 51 | 21.2 | |
| StarCraft II: Heart of the Swarm (2013) | 66 | |||
| BioShock Infinite (2013) | 202.9 | 113.8 | 95.4 | 34.9 |
| Metro: Last Light (2013) | 97.4 | 84.6 | 49.8 | 25.6 |
| Thief (2014) | 79.2 | 51.9 | 44.1 | 23.2 |
| The Witcher 3 (2015) | 69 | 42 | 23.5 | 12.6 |
| Batman: Arkham Knight (2015) | 57 | 49 | 22 | 8 |
| Fallout 4 (2015) | 45.8 | 25 | 19.8 | |
| Rise of the Tomb Raider (2016) | 78.4 | 44.6 | 24.5 | 19.2 |
| Ashes of the Singularity (2016) | 35.1 | 20.7 | 17.1 | |
| Overwatch (2016) | 168 | 54.4 | 34.4 | |
| Mafia 3 (2016) | 31.2 | 21.9 | 14 | |
| Prey (2017) | 50.6 | 40 | 34 | |
| Dirt 4 (2017) | 52.9 | 39 | 23.7 | |
| F1 2017 (2017) | 83 | 41 | 32 | 20 |
Stress Test
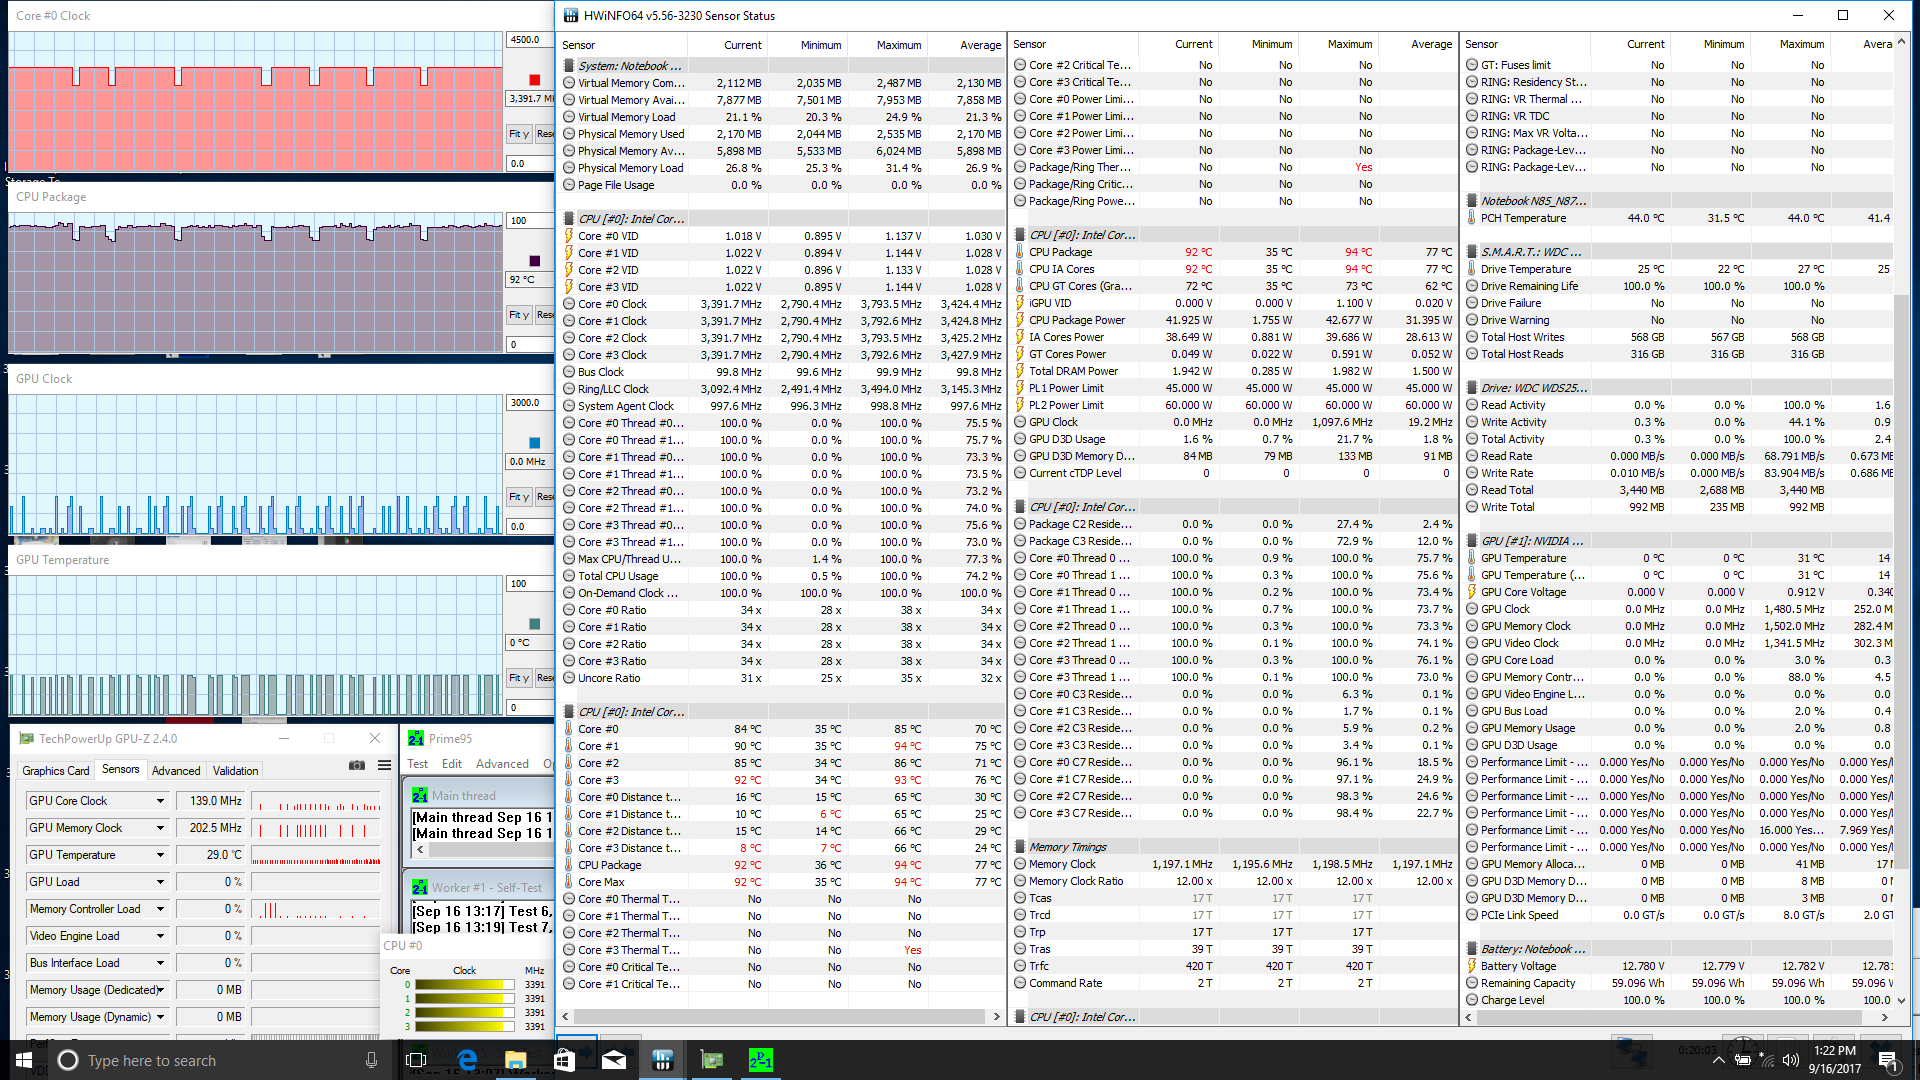
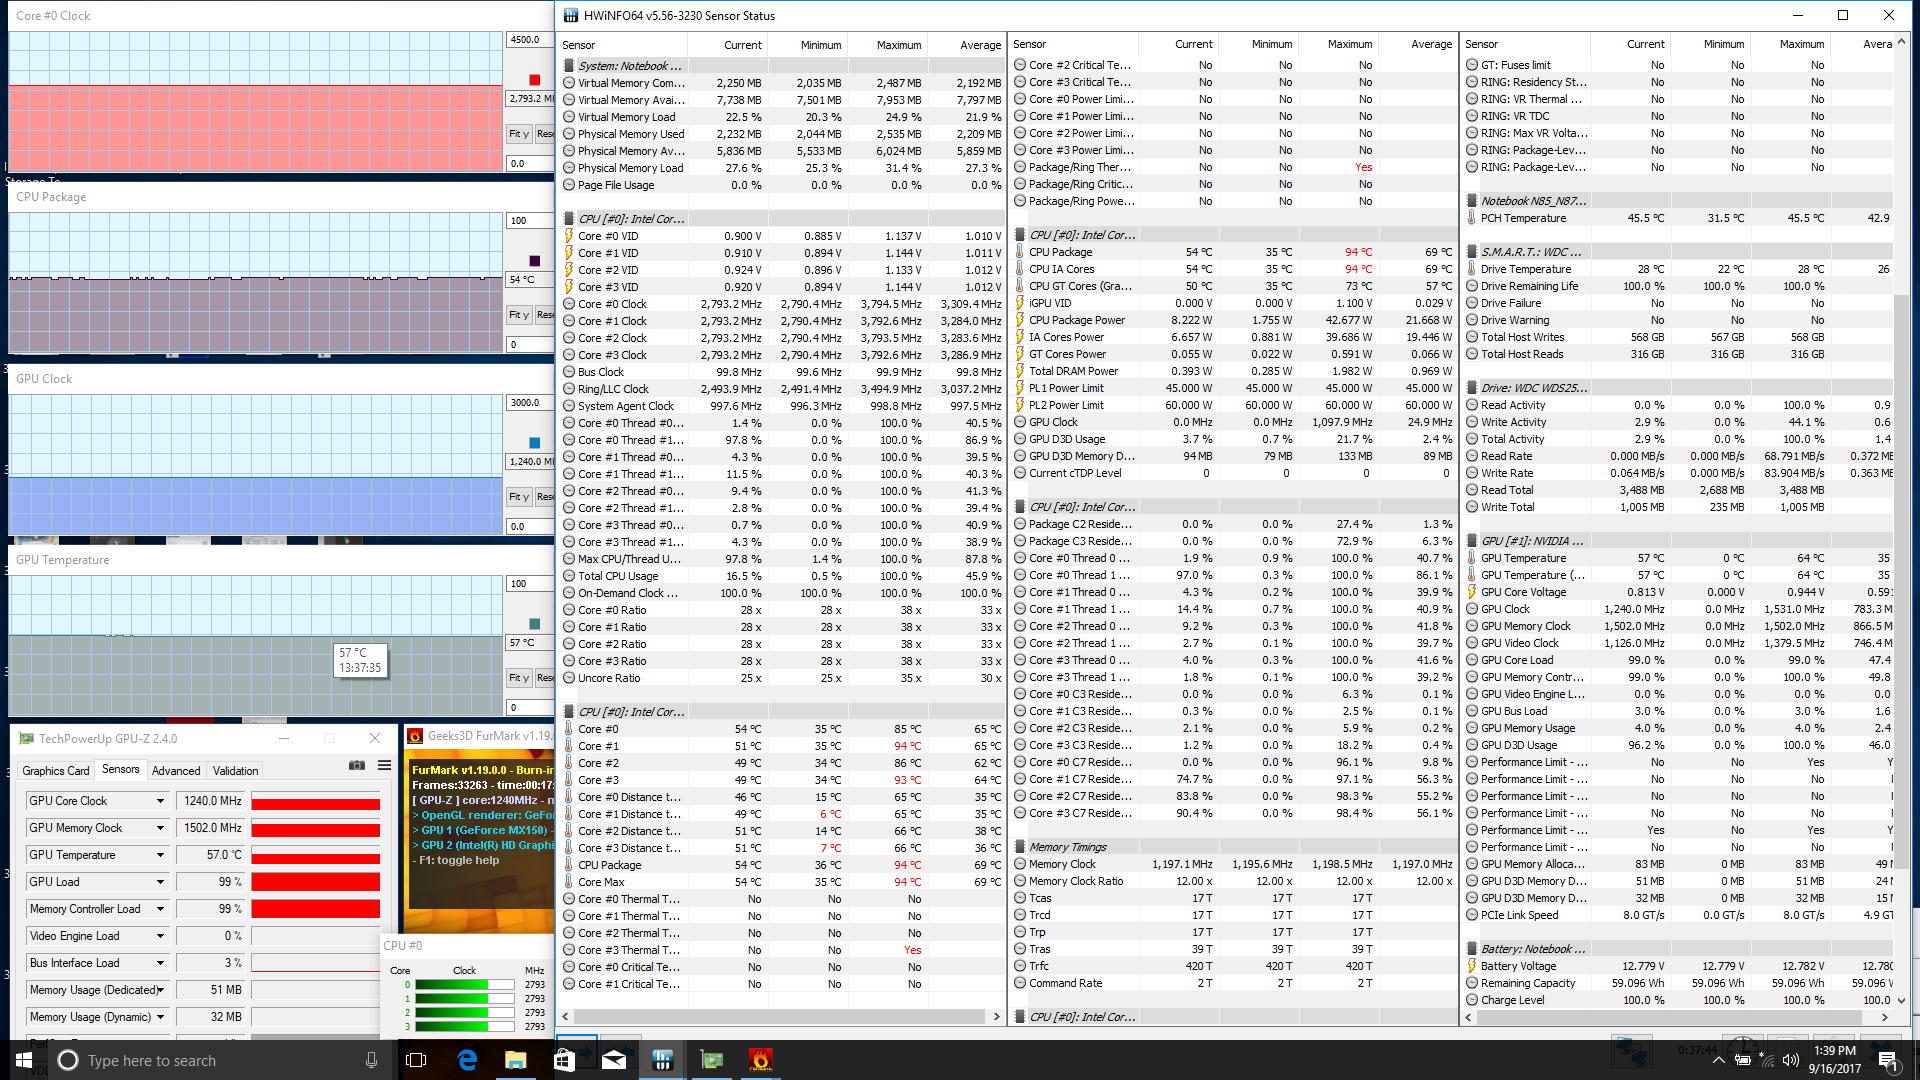
We subject the notebook to unrealistic stress conditions in order to identify for any potential throttling or stability issues. When subjected to Prime95 load, the CPU can be observed alternating between 2.8 GHz and 3.4 GHz instead of operating at some steady clock rate in between. CPU temperature fluctuates between 82 C and 90 C and, perhaps more annoyingly, the system fan begins to pulsate in tandem as well. The processor will not dip below its base 2.8 GHz clock rate, however, so users can expect fluctuating Turbo Boost when under extreme processor stress. Running only FurMark to stress the MX150 will see the GPU operating at a relatively cool 57 C.
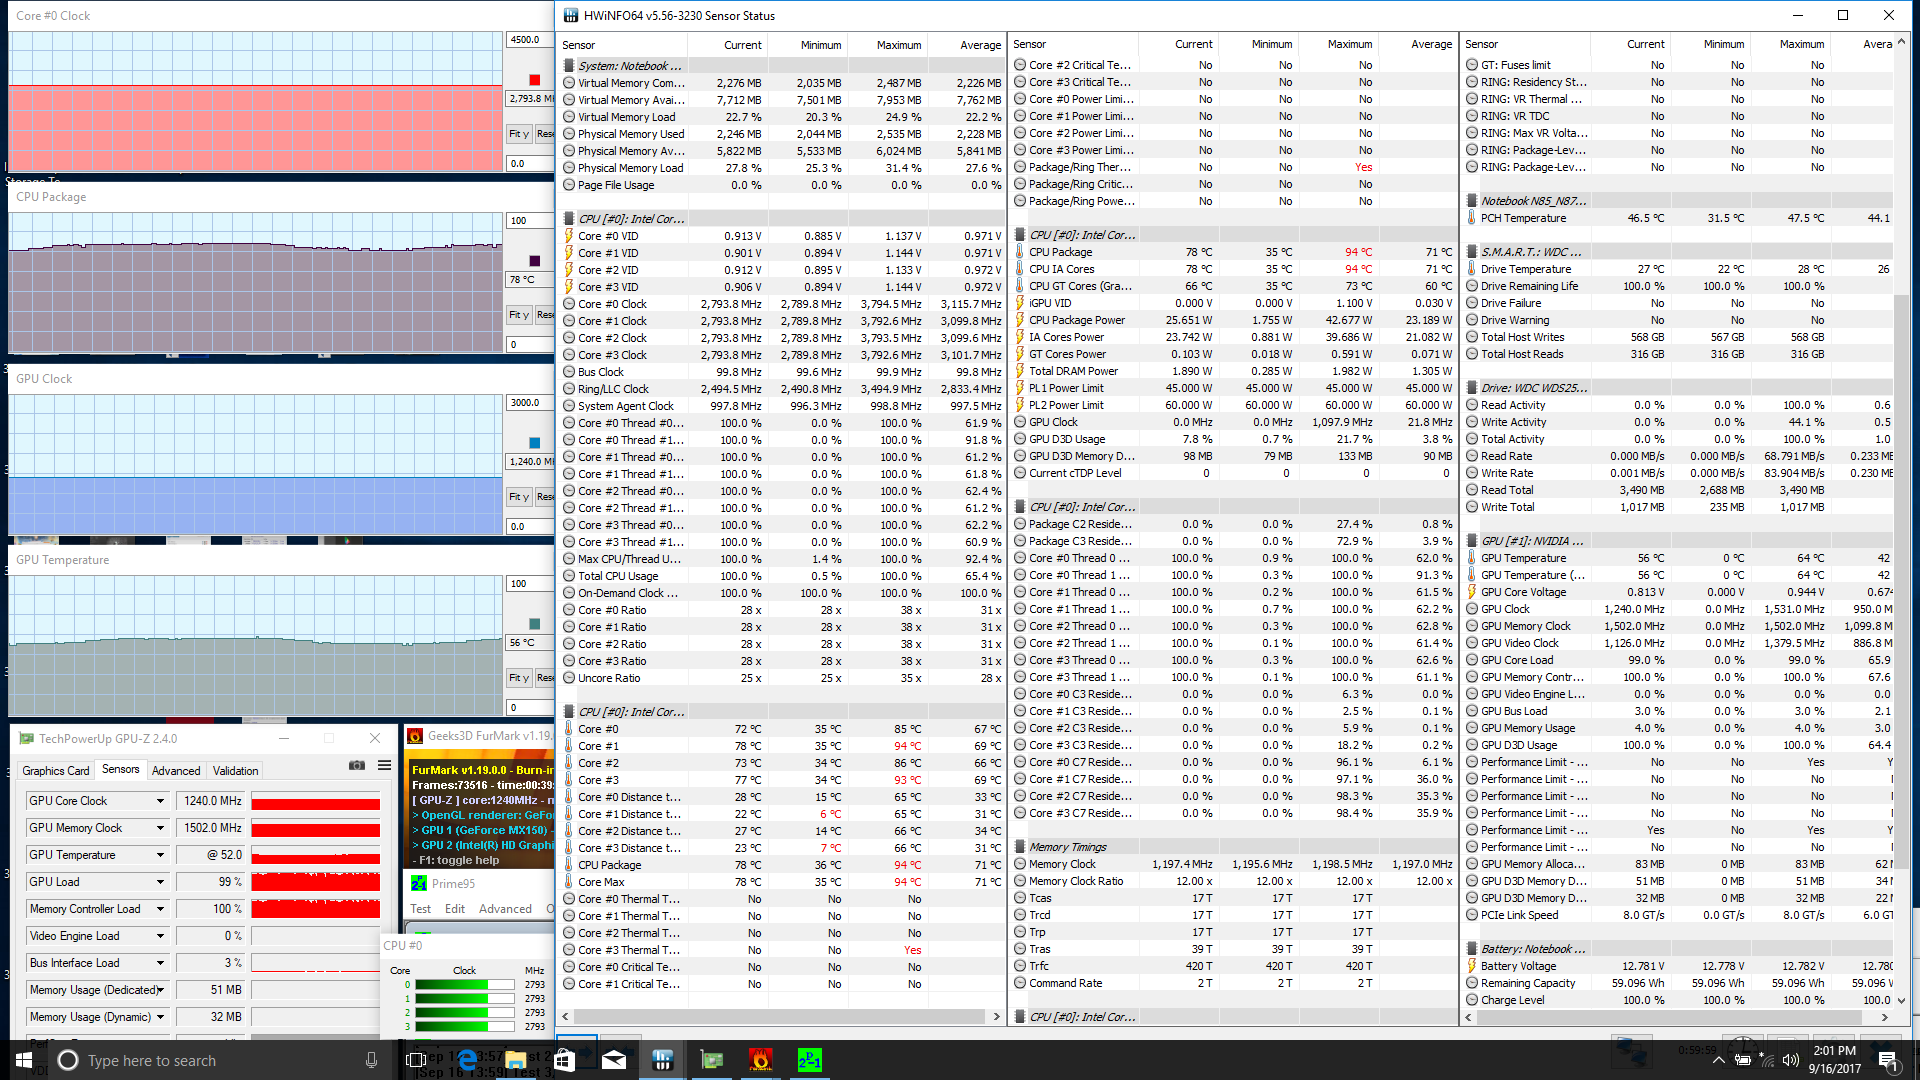
Running both Prime95 and FurMark simultaneously will strip the CPU of any Turbo Boost benefits for a steady 2.8 GHz base clock rate and a small core temperature fluctuation in the high 70 C range. GPU temperature remains cool in the low 50 C range compared to the low 60 C range of the GeForce 940MX in the Samsung Notebook 9.
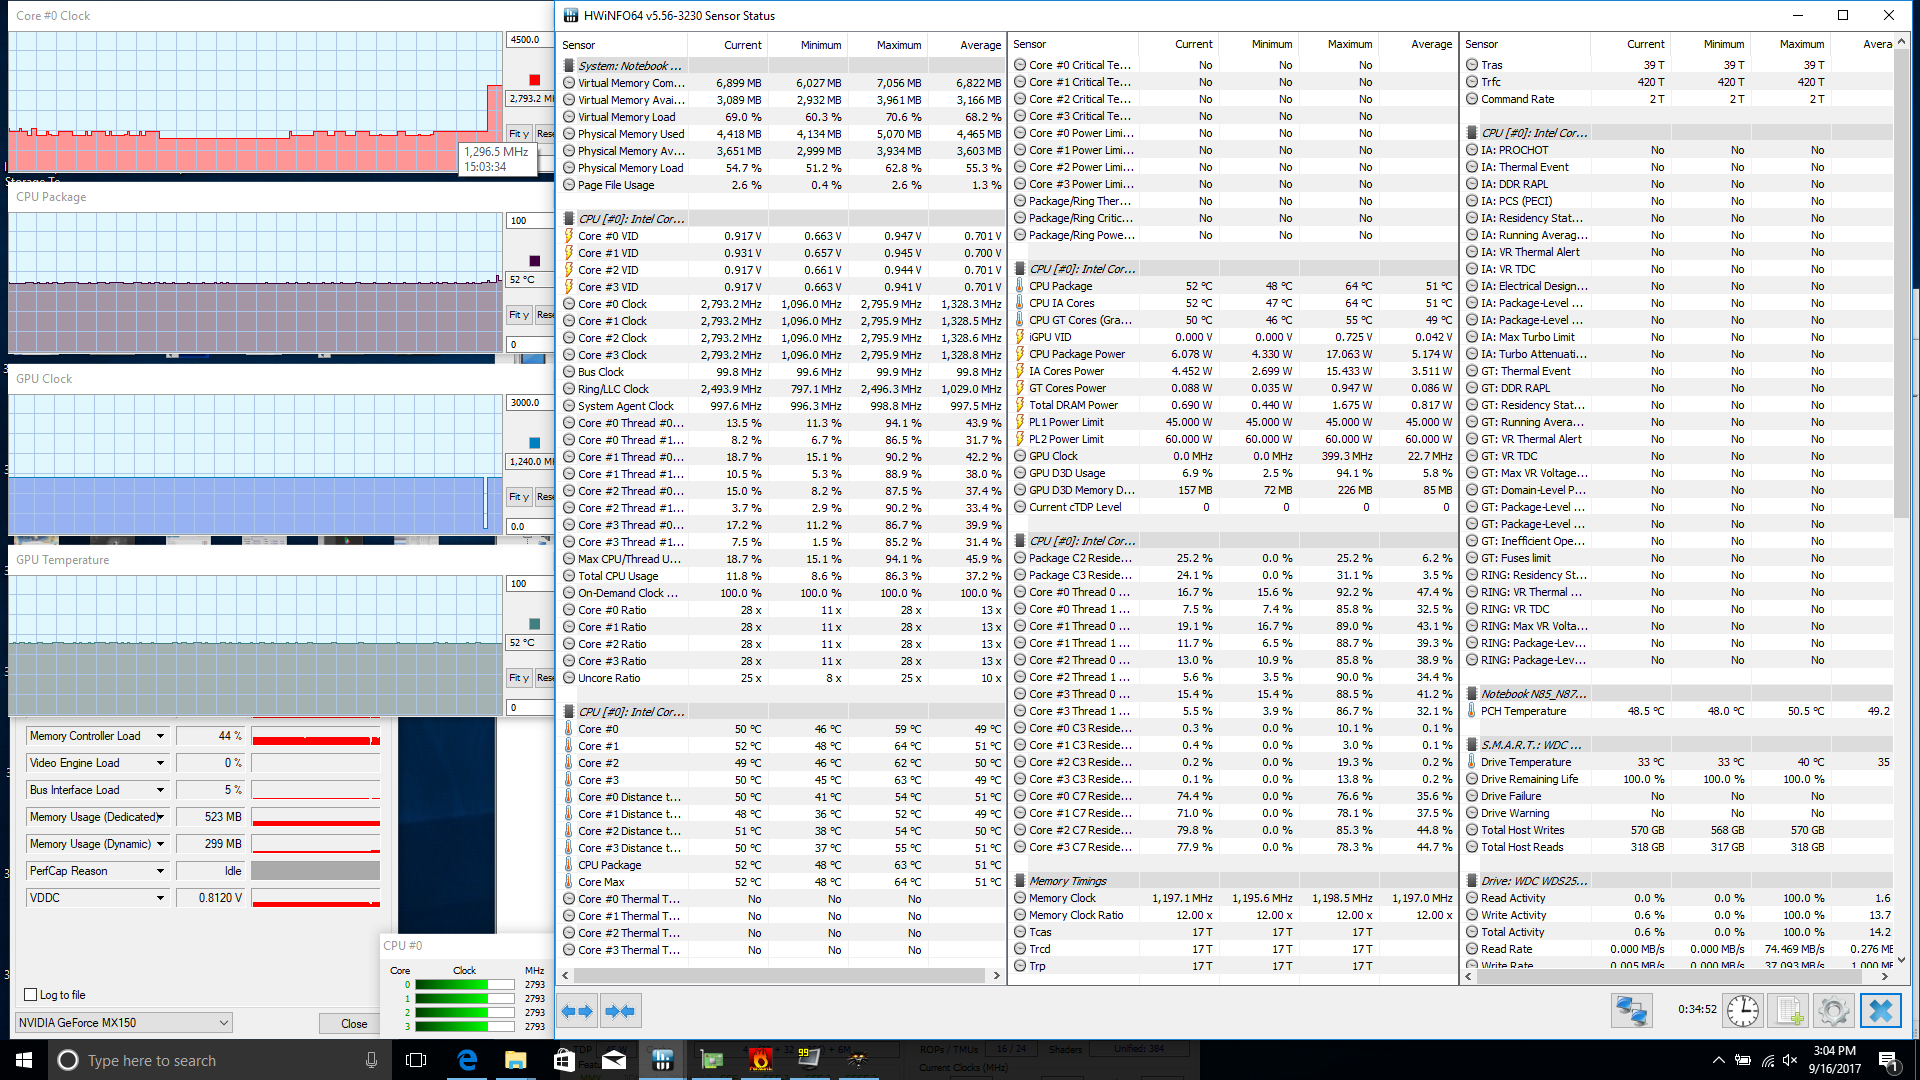
Witcher 3 stress is more representative of real-world gaming loads. Both the CPU and GPU can each be observed operating at a cool 52 C. GPU clock rate, however, is steady at 1240 MHz when gaming or well below its base 1468 MHz clock rate.
Running on batteries will limit both CPU and GPU clock rates. A Fire Strike run on batteries returns Physics and Graphics scores of 5470 and 3421 points, respectively, compared to 10637 and 3704 points when on mains.
| CPU Clock (GHz) | GPU Clock (MHz) | Average CPU Temperature (°C) | Average GPU Temperature (°C) | |
| Prime95 Stress | 2.8 - 3.4 | -- | 82 - 90 | -- |
| FurMark Stress | -- | 1240 | 54 | 57 |
| Prime95 + FurMark Stress | 2.8 | 1240 | 75 - 79 | 52 - 56 |
| Witcher 3 Stress (if applicable) | 1.3 | 1240 | 52 | 52 |
Emissions
System Noise
The cooling solution consists of twin ~45 mm fans and two heat pipes. Unlike most thin gaming notebooks, the CPU and GPU are independently cooled with no overlap.
Fan noise is the one major advantage that the NP5852 has over the more powerful Sabre 15 variant. The system is very nearly silent during low loads like browsing or video playback with just the smallest hint of coil whine if working in a completely silent room. Medium and gaming loads will have the fan steady at around 40 dB(A) to be significantly quieter than the Sabre 15 and about the same as the Acer Aspire 5 A515. Extreme loads can bump fan noise to over 50 dB(A), but this should be an unrealistic condition for most users.

Noise level
| Idle |
| 28.7 / 28.7 / 29.3 dB(A) |
| Load |
| 41.6 / 53.7 dB(A) |
 | ||
30 dB silent 40 dB(A) audible 50 dB(A) loud |
||
min: | ||
| Sager NP5852 GeForce MX150, i7-7700HQ, Western Digital WD Blue PC SSD WDS250G1B0B | Gigabyte Sabre 15G GeForce GTX 1050 Mobile, i7-7700HQ, Liteonit CV3-8D128 | Asus ZenBook Pro UX550VD GeForce GTX 1050 Mobile, i7-7700HQ, Samsung PM961 NVMe MZVLW512HMJP | Acer Aspire 5 A515-51G-51RL GeForce MX150, i5-7200U, Kingston RBUSNS8180DS3128GH | Acer TravelMate P658-G2-MG-7327 GeForce 940MX, i7-7500U, Liteonit CV3-8D512 | Asus AsusPro P4540UQ-FY0056R GeForce 940MX, i5-7200U, SK Hynix HFS256G39TND-N210A | |
|---|---|---|---|---|---|---|
| Noise | -11% | 3% | 0% | 4% | 4% | |
| off / environment * (dB) | 28.3 | 28.2 -0% | 29.4 -4% | 30.1 -6% | 30 -6% | 30.3 -7% |
| Idle Minimum * (dB) | 28.7 | 33 -15% | 29.4 -2% | 30.1 -5% | 30 -5% | 30.3 -6% |
| Idle Average * (dB) | 28.7 | 33.3 -16% | 29.9 -4% | 30.2 -5% | 30 -5% | 30.3 -6% |
| Idle Maximum * (dB) | 29.3 | 34.7 -18% | 29.9 -2% | 30.5 -4% | 30 -2% | 30.3 -3% |
| Load Average * (dB) | 41.6 | 44.5 -7% | 38.3 8% | 41.1 1% | 37.3 10% | 35.4 15% |
| Witcher 3 ultra * (dB) | 39.8 | 49.2 -24% | 39.8 -0% | 40.4 -2% | ||
| Load Maximum * (dB) | 53.7 | 52.8 2% | 39.6 26% | 41.2 23% | 38 29% | 37.2 31% |
* ... smaller is better
Temperature
The center of the keyboard can become as warm as 39 C when under heavy loads due to the positioning of the processors underneath. The surrounding WASD and NumPad keys never become uncomfortable to use and are comparatively cooler in the mid 30 C range. Fortunately, the hottest spot on the top left quadrant is away from keyboard keys and shouldn't be distracting when gaming. Surface temperatures are otherwise flat during low processing loads.
Users who choose to install a 2.5-inch SSD or HDD will experience warmer temperatures on the right palm rest than what we've recorded here.
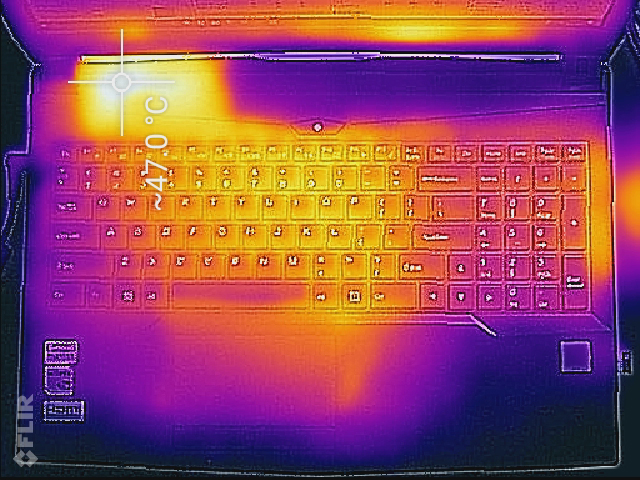
(-) The maximum temperature on the upper side is 46.8 °C / 116 F, compared to the average of 40.4 °C / 105 F, ranging from 21.2 to 68.8 °C for the class Gaming.
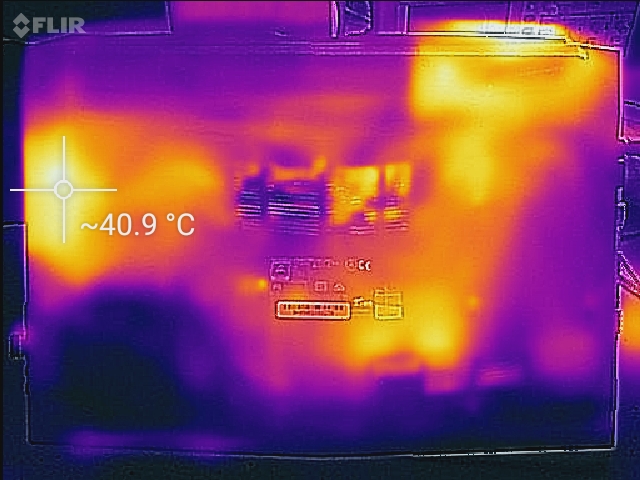
(±) The bottom heats up to a maximum of 40.8 °C / 105 F, compared to the average of 43.2 °C / 110 F
(+) In idle usage, the average temperature for the upper side is 26.6 °C / 80 F, compared to the device average of 33.9 °C / 93 F.
(±) Playing The Witcher 3, the average temperature for the upper side is 34.3 °C / 94 F, compared to the device average of 33.9 °C / 93 F.
(+) The palmrests and touchpad are reaching skin temperature as a maximum (34.8 °C / 94.6 F) and are therefore not hot.
(-) The average temperature of the palmrest area of similar devices was 28.8 °C / 83.8 F (-6 °C / -10.8 F).
Speakers

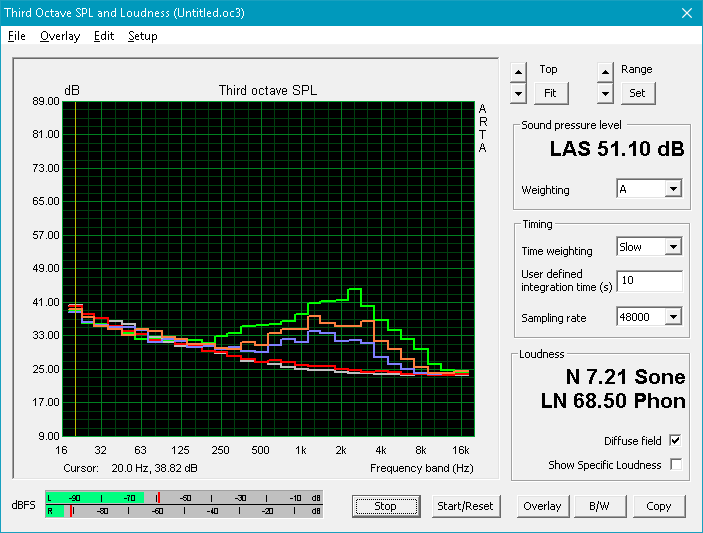
Our pink noise measurements confirm that speaker quality is similar to the Sabre 15. Thus, the integrated speakers suffer from the same drawbacks as the Gigabyte including poor bass and an overemphasized treble. In comparison, the pink noise graph for the GS63VR is broader and more able to evenly reproducible a wider range of frequencies. High volume settings will not introduce static or any major chassis reverberations.

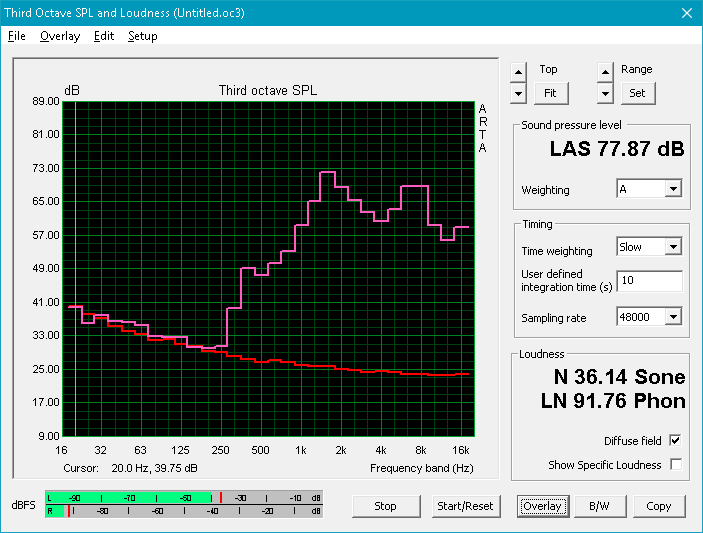
Sager NP5852 audio analysis
(-) | not very loud speakers (67.3 dB)
Bass 100 - 315 Hz
(-) | nearly no bass - on average 17.5% lower than median
(±) | linearity of bass is average (10.9% delta to prev. frequency)
Mids 400 - 2000 Hz
(±) | higher mids - on average 7.8% higher than median
(-) | mids are not linear (18% delta to prev. frequency)
Highs 2 - 16 kHz
(±) | higher highs - on average 5.9% higher than median
(-) | highs are not linear (19.8% delta to prev. frequency)
Overall 100 - 16.000 Hz
(-) | overall sound is not linear (41.9% difference to median)
Compared to same class
» 99% of all tested devices in this class were better, 0% similar, 0% worse
» The best had a delta of 6%, average was 18%, worst was 132%
Compared to all devices tested
» 95% of all tested devices were better, 0% similar, 4% worse
» The best had a delta of 4%, average was 24%, worst was 134%
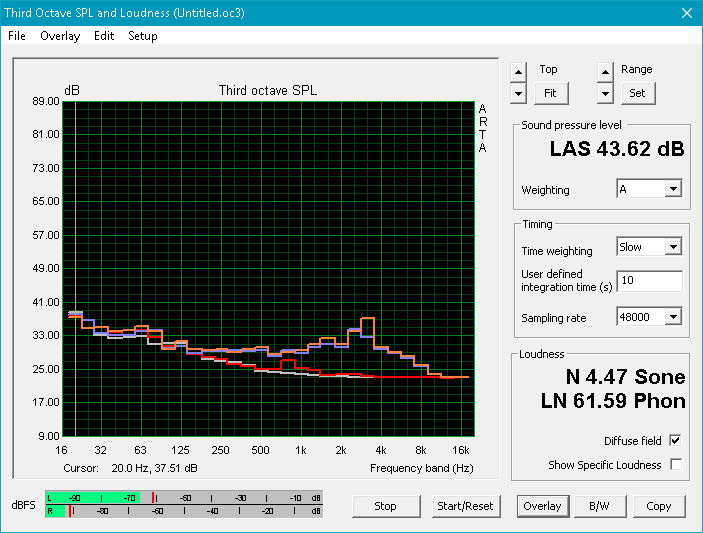
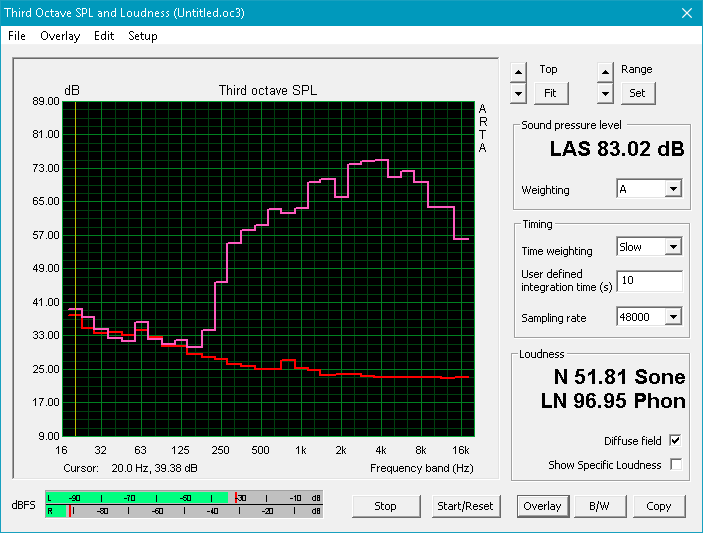
Apple MacBook 12 (Early 2016) 1.1 GHz audio analysis
(+) | speakers can play relatively loud (83.6 dB)
Bass 100 - 315 Hz
(±) | reduced bass - on average 11.3% lower than median
(±) | linearity of bass is average (14.2% delta to prev. frequency)
Mids 400 - 2000 Hz
(+) | balanced mids - only 2.4% away from median
(+) | mids are linear (5.5% delta to prev. frequency)
Highs 2 - 16 kHz
(+) | balanced highs - only 2% away from median
(+) | highs are linear (4.5% delta to prev. frequency)
Overall 100 - 16.000 Hz
(+) | overall sound is linear (10.2% difference to median)
Compared to same class
» 7% of all tested devices in this class were better, 2% similar, 91% worse
» The best had a delta of 5%, average was 18%, worst was 53%
Compared to all devices tested
» 5% of all tested devices were better, 1% similar, 94% worse
» The best had a delta of 4%, average was 24%, worst was 134%
Frequency Comparison (Checkbox selectable!)
Graph 1: Pink Noise 100% Vol.; Graph 2: Audio off
Energy Management
Power Consumption
Power consumption is about 30 W less than an older system equipped with the i7-6700HQ CPU and GTX 950M GPU when under intensive loads. In other words, the MX150-equipped Sager is noticeably more power efficient than a GTX 950M while offering a similar level of graphics performance. As another example, the 14-inch ThinkPad T470p with an i7-6700HQ CPU and GeForce 940MX GPU is still slightly more efficient during similar medium loads, but the power consumption difference pales in comparison to the 60 to 70 percent boost in GPU power gained from the MX150. The large jump in performance-per-Watt should be unsurprising for anyone familiar with the advantages of Pascal over Maxwell. Competing notebooks with ULV U-class processors, however, will still demand less power than our Sager when under higher loads.
When compared to the current generation GTX 1050, the Sabre 15 consumes about 20 W to 40 W more when under gaming loads.
Note that our power measurements when running Witcher 3 (54.8 W) are noticeably lower than our measurements when running 3DMark06 (71.3 W) due to different levels of CPU utilization between the two loads. Running both Prime95 and FurMark simultaneously will draw about 80 W from a small power adapter (~12.5 x 5.0 x 3.0 cm) rated for 90 W. The Sabre 15 actually ships with a more capable 120 W adapter in order to accommodate the GTX 1050 GPU.
| Off / Standby | |
| Idle | |
| Load |
|
Key:
min: | |
| Sager NP5852 i7-7700HQ, GeForce MX150, Western Digital WD Blue PC SSD WDS250G1B0B, IPS, 1920x1080, 15.6" | Gigabyte Sabre 15G i7-7700HQ, GeForce GTX 1050 Mobile, Liteonit CV3-8D128, IPS, 1920x1080, 15.6" | Acer Aspire 5 A515-51G-51RL i5-7200U, GeForce MX150, Kingston RBUSNS8180DS3128GH, IPS, 1920x1080, 15.6" | Acer TravelMate P658-G2-MG-7327 i7-7500U, GeForce 940MX, Liteonit CV3-8D512, IPS, 1920x1080, 15.6" | Asus N552VX-FY103T 6700HQ, GeForce GTX 950M, Toshiba MQ02ABD100H, AH-IPS, 1920x1080, 15.6" | HP Pavilion 15 UHD T9Y85AV 6700HQ, GeForce GTX 960M, SanDisk Z400s SD8SNAT-128G, IPS, 3840x2160, 15.6" | Lenovo ThinkPad T470p-20J7S00000 i7-7700HQ, GeForce 940MX, Samsung PM961 NVMe MZVLW512HMJP, IPS, 2560x1440, 14" | |
|---|---|---|---|---|---|---|---|
| Power Consumption | -16% | 35% | 29% | -5% | -24% | 25% | |
| Idle Minimum * (Watt) | 9.2 | 8 13% | 2.9 68% | 3.9 58% | 7 24% | 8.3 10% | 3.8 59% |
| Idle Average * (Watt) | 11.2 | 10.9 3% | 5.9 47% | 7.9 29% | 10.9 3% | 14.8 -32% | 6.5 42% |
| Idle Maximum * (Watt) | 11.3 | 11 3% | 6.4 43% | 11.3 -0% | 12.9 -14% | 16.8 -49% | 7.2 36% |
| Load Average * (Watt) | 71.3 | 76.7 -8% | 54 24% | 47 34% | 72 -1% | 71 -0% | 62.5 12% |
| Witcher 3 ultra * (Watt) | 54.8 | 94.9 -73% | 51 7% | ||||
| Load Maximum * (Watt) | 80.1 | 106.4 -33% | 66 18% | 62 23% | 109 -36% | 119.2 -49% | 99.6 -24% |
* ... smaller is better
Battery Life
Runtimes from the removable 62 Wh battery are average if not underwhelming for a gaming notebook. The Acer Aspire 5 with the same MX150 GPU can last for over two hours longer than our Sager when under similar WLAN conditions despite its smaller battery capacity. Users can expect just under six hours of real-world WLAN use out of the notebook or about two hours of gaming.
Charging from near empty to full capacity will take around two hours. It's worth mentioning that the battery for our NP5852 test unit is denser than the 47 Wh battery of the Sabre 15.
| Sager NP5852 i7-7700HQ, GeForce MX150, 62 Wh | Gigabyte Sabre 15G i7-7700HQ, GeForce GTX 1050 Mobile, 47 Wh | Asus ZenBook Pro UX550VD i7-7700HQ, GeForce GTX 1050 Mobile, 73 Wh | Acer Aspire 5 A515-51G-51RL i5-7200U, GeForce MX150, 48 Wh | Acer TravelMate P658-G2-MG-7327 i7-7500U, GeForce 940MX, 55 Wh | Acer Aspire F5-771G-50RD i5-7200U, GeForce GTX 950M, 40 Wh | |
|---|---|---|---|---|---|---|
| Battery runtime | -20% | 41% | 73% | 42% | -21% | |
| Reader / Idle (h) | 8.3 | 8.2 -1% | 17.7 113% | 20.9 152% | 7.2 -13% | |
| WiFi v1.3 (h) | 5.9 | 4.4 -25% | 8.9 51% | 8.6 46% | 8.4 42% | 4.5 -24% |
| Load (h) | 2 | 1.3 -35% | 1.2 -40% | 2.4 20% | 1.5 -25% | |
| Witcher 3 ultra (h) | 1.1 |
Pros
Cons
Verdict

In terms of performance, the gaming potential of the MX150 is impressive considering that it consumes about 40 percent less power than the Sabre 15 (GTX 1050) when gaming while being about 40 to 45 percent slower. Both running temperatures and fan noise are significantly cooler and quieter, respectively, for a respectable gaming experience in between schoolwork and breaks. It's actually quite amazing to see performance on par with an older GTX 860M or GTX 950M gaming notebook from an entry-level Pascal GPU.
Our main gripes about the NP5852 are not so much about its performance but on its price and chassis. Firstly, the $800 USD starting price is quite close to the Sabre 15, Samsung Odyssey, or Pavilion 15 Power with faster GTX 1050 graphics. Potential buyers will only need to invest about $100 to $200 USD more to get a very large boost in GPU power if gaming is priority. Secondly, the chassis is rather large for the entry-level MX150 GPU. The aforementioned alternatives are not significantly larger or thicker than our Sager and so a smaller Ultrabook-like chassis would have been more appropriate for the MX150. Pairing the MX150 with an Intel U-class will indeed result in slightly slower gaming performance as our comparisons against the Aspire 5 A515 have shown, but the extreme savings in weight and portability will likely offset the disadvantages for most casual gamers.
The Sager NP5852 is a great back-to-school casual gaming machine. Wait a couple of months, however, and the notebook market will be saturated with thinner and lighter designs that offer the same MX150 GPU. The NP5852 is recommendable only if prices fall further from the current crop of budget-friendly GTX 1050 notebooks.
Sager NP5852
- 09/21/2017 v6 (old)
Allen Ngo
Price comparison
