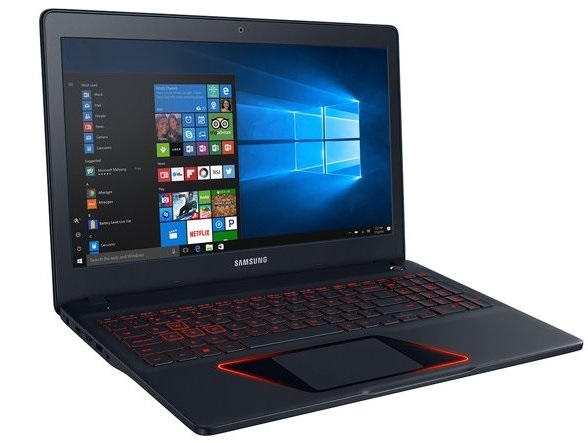
Samsung Odyssey NP800G5M (7700HQ, FHD, GTX 1050) Laptop Review

Samsung can make some pretty mean smartphones, but its presence in the laptop space is comparatively minimal and largely overshadowed by competitors. Thus, we were certainly caught off-guard when the manufacturer nonchalantly announced the 15.6-inch and 17.3-inch Odyssey notebooks at CES 2017. Gaming notebooks in particular have been on the rise in the face of slumping PC sales, so Samsung is likely eyeing a piece of that pie with this brand new entry.
The 15.6-inch Odyssey NP800G5M is an affordable gaming notebook in the same vein as the HP Omen 15 series, MSI GL series, Acer Aspire VX series, and the Asus FX/GL series. It's priced accordingly in the $1100 to $1200 USD range where it is a safe distance away from expensive flagships like the well-known MSI GT series or the Alienware or Gigabyte P series. We're always excited to test new notebook families as the first anchor model is usually a strong indication of what to expect in future generation offerings from the manufacturer. Competition in this entry-level gaming space is becoming increasingly crowded as even multimedia machines are beginning to incorporate the same graphics capabilities of the Odyssey 15 including the HP Pavilion 15t, Dell XPS 15 9560, and the Lenovo Yoga 720.
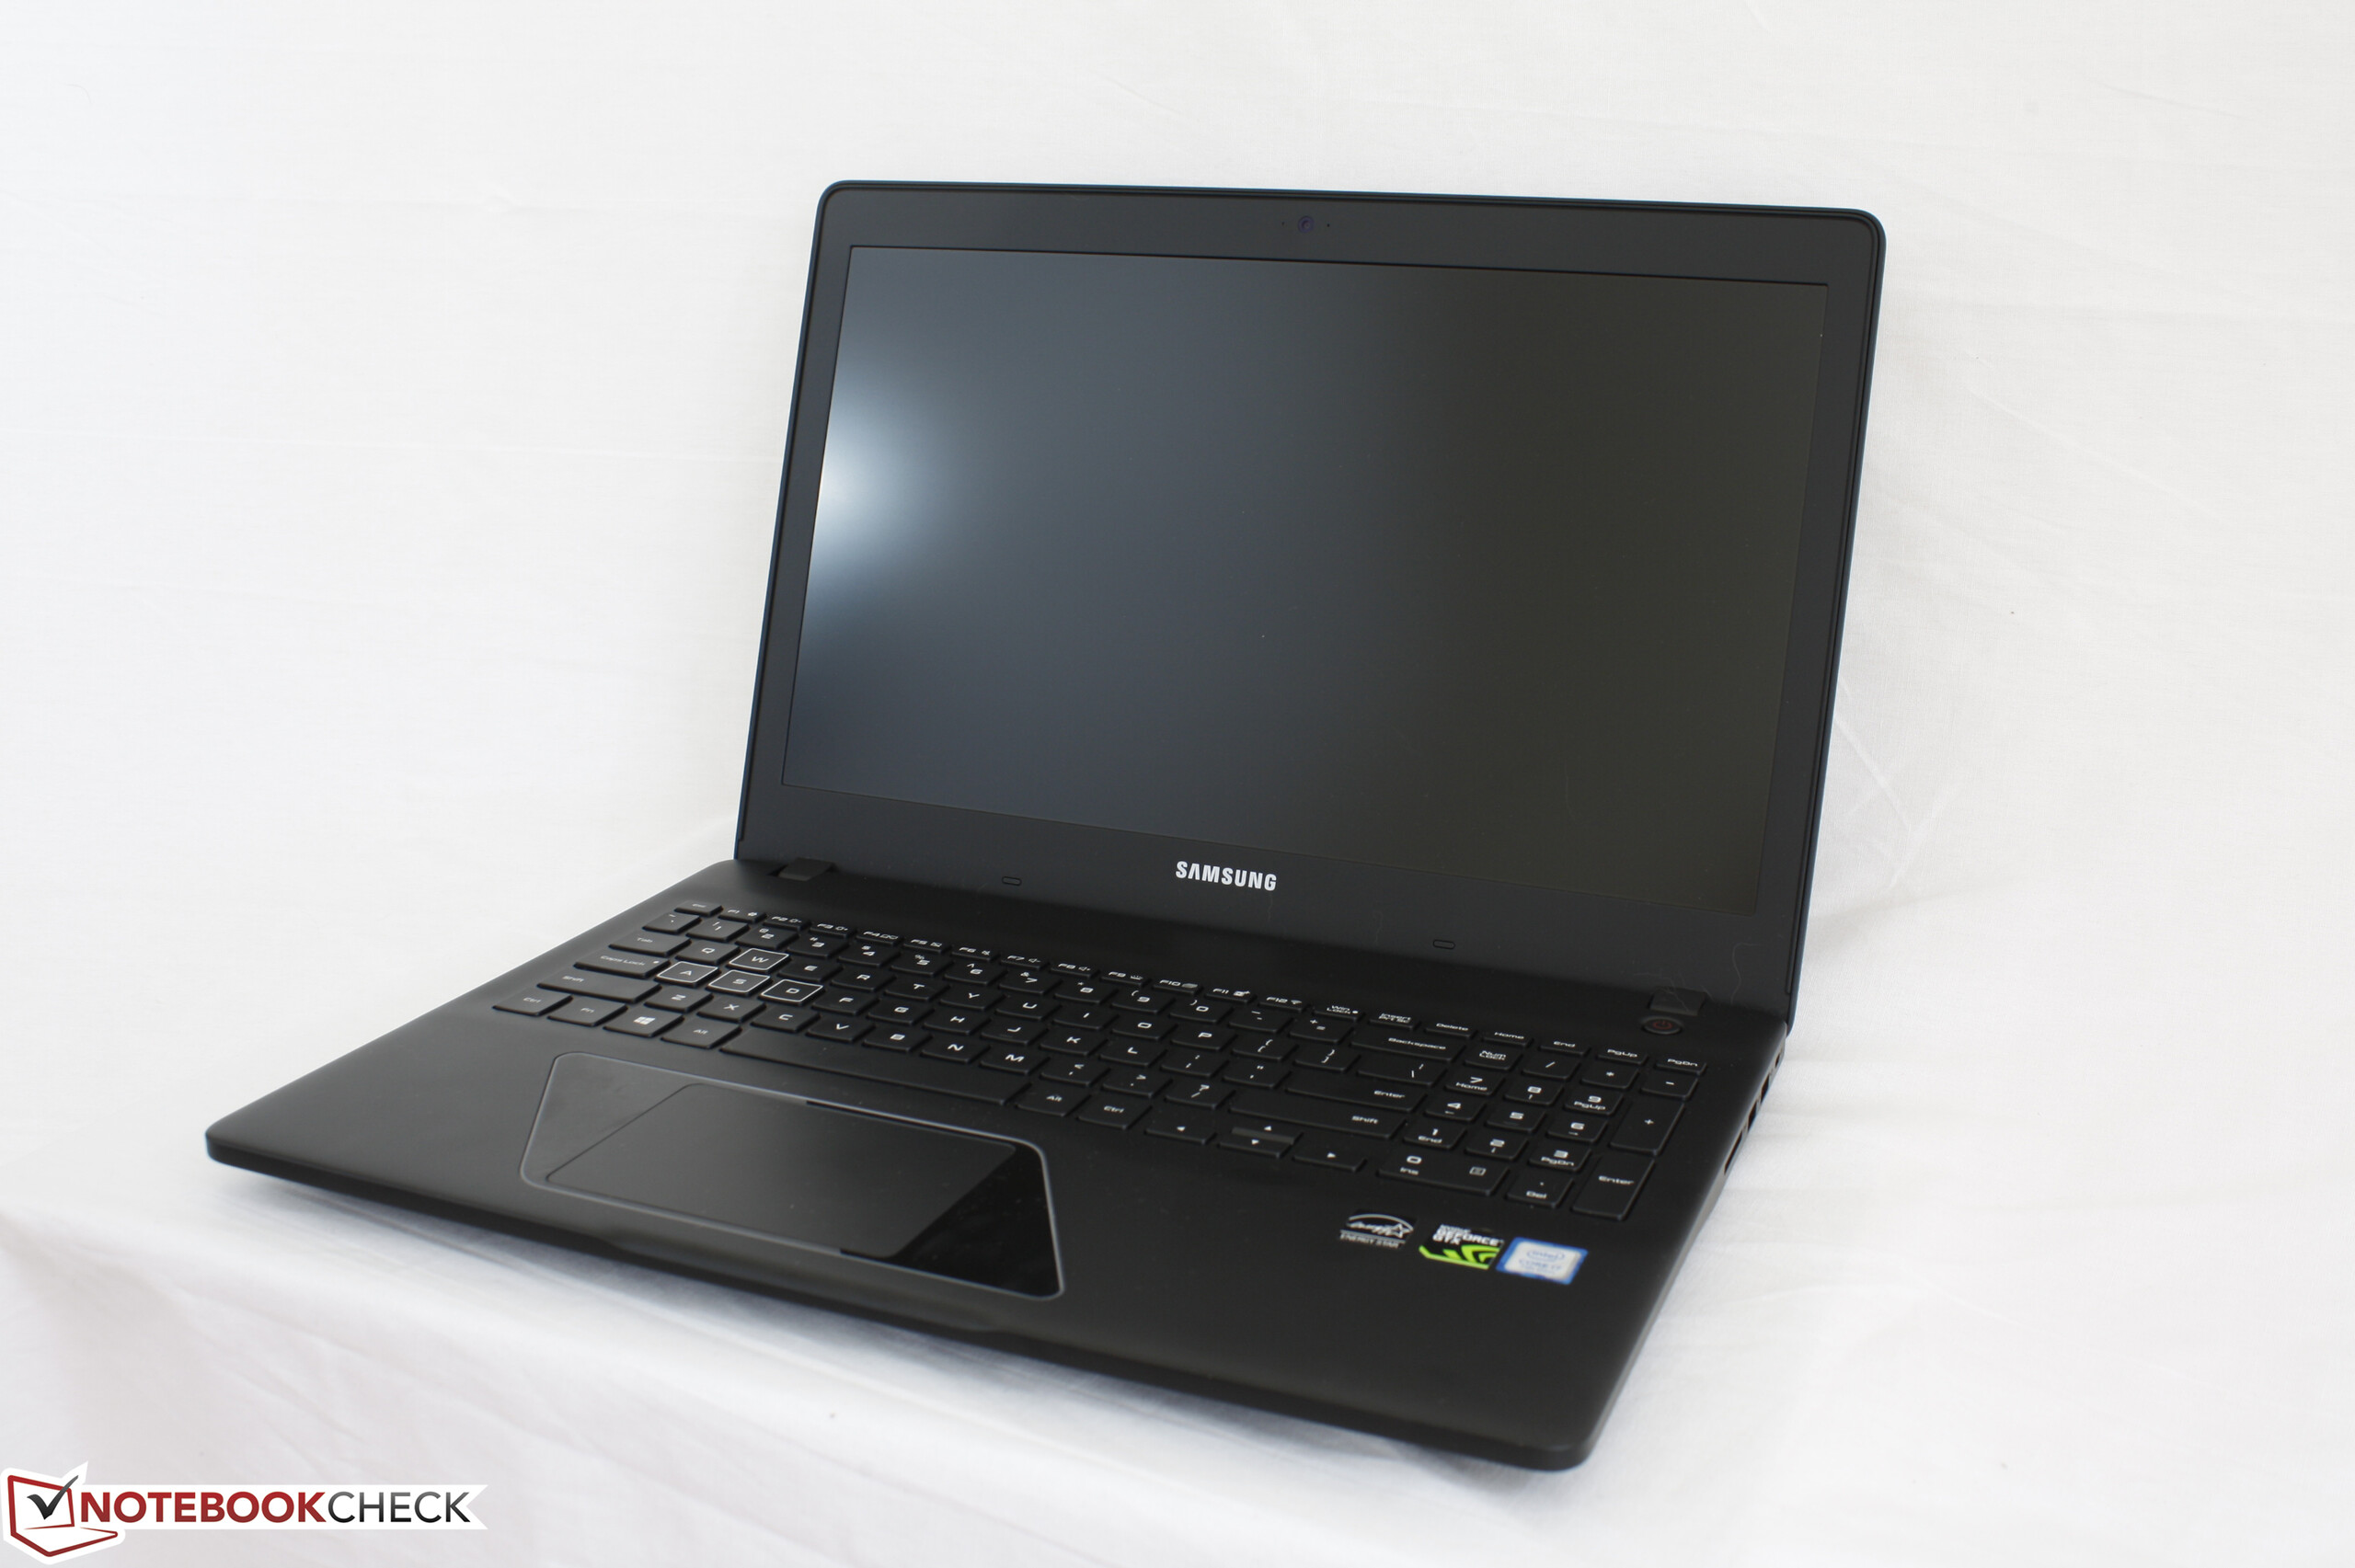
Case
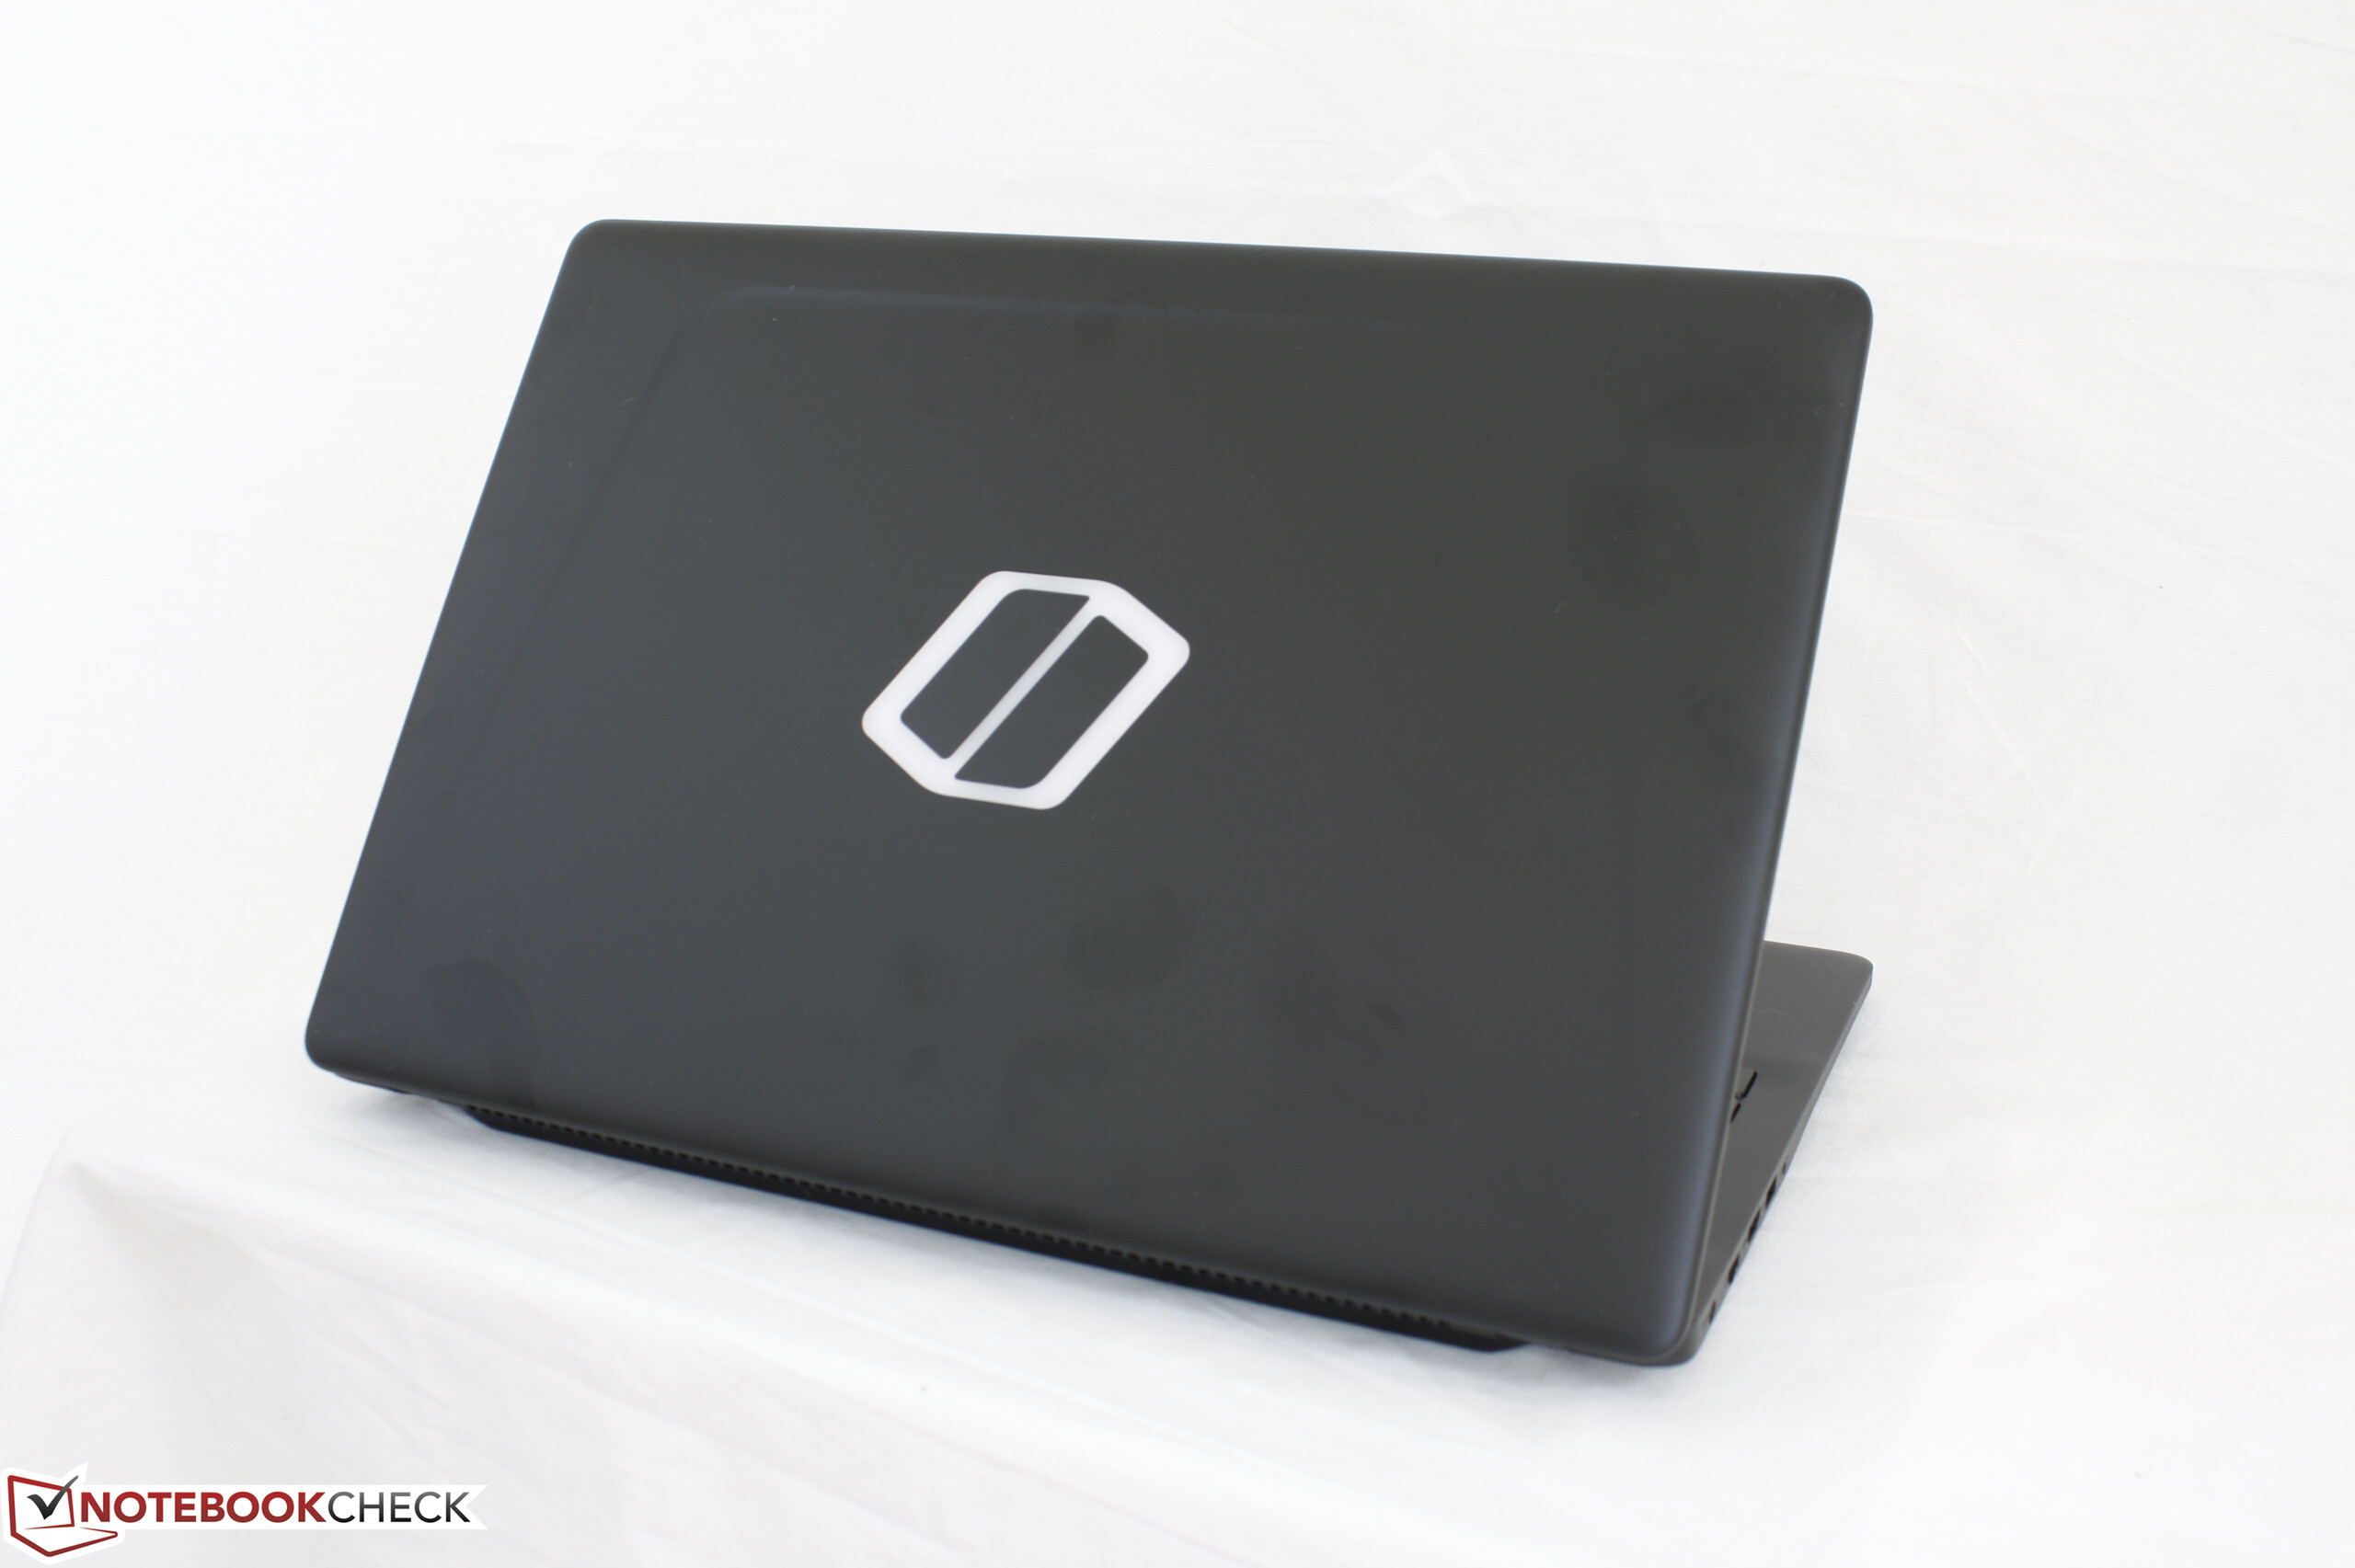
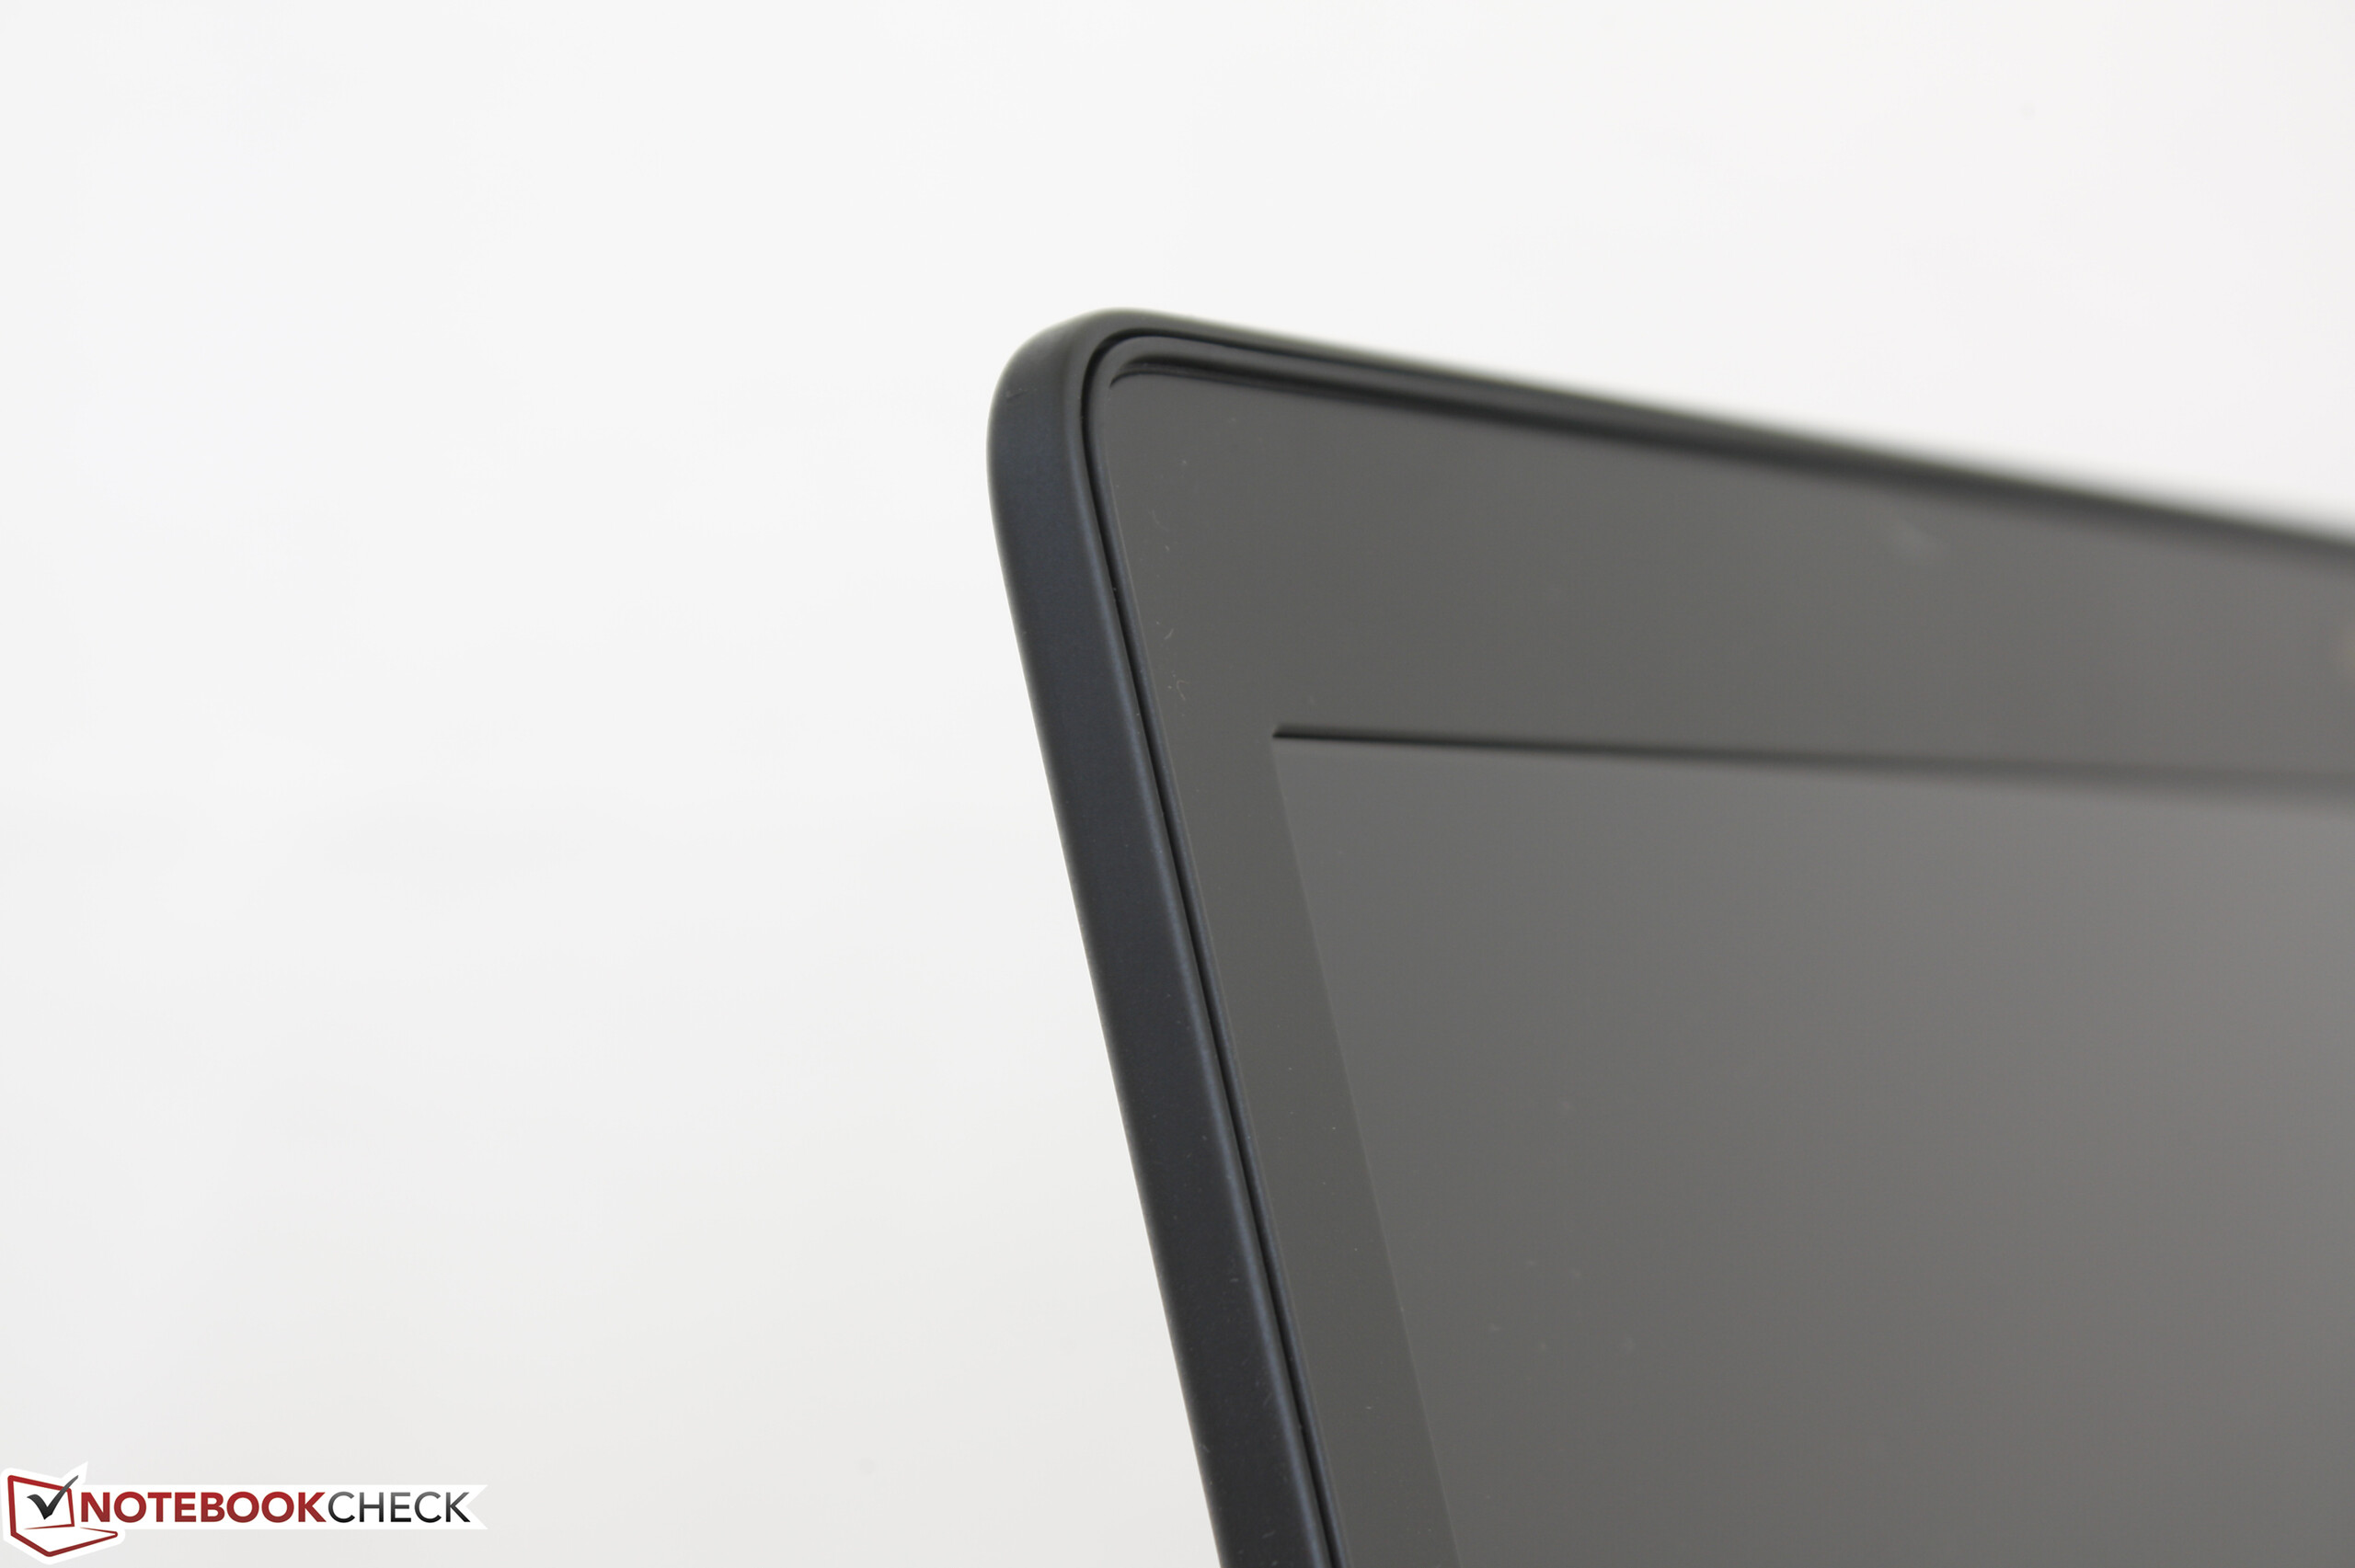
The Odyssey chassis is an original design that accentuates smooth matte surfaces and rounded edges and corners. Even the Odyssey logo on the lid is circular in contrast to Aorus and Lenovo Y notebooks that are typically designed with more defined features. Its surfaces appear to be plastic and they unfortunately accumulate fingerprints very easily. We suspect that portions of the notebook will become glossy over time as they collect grease similar to aging trackpads and keyboard keycaps.
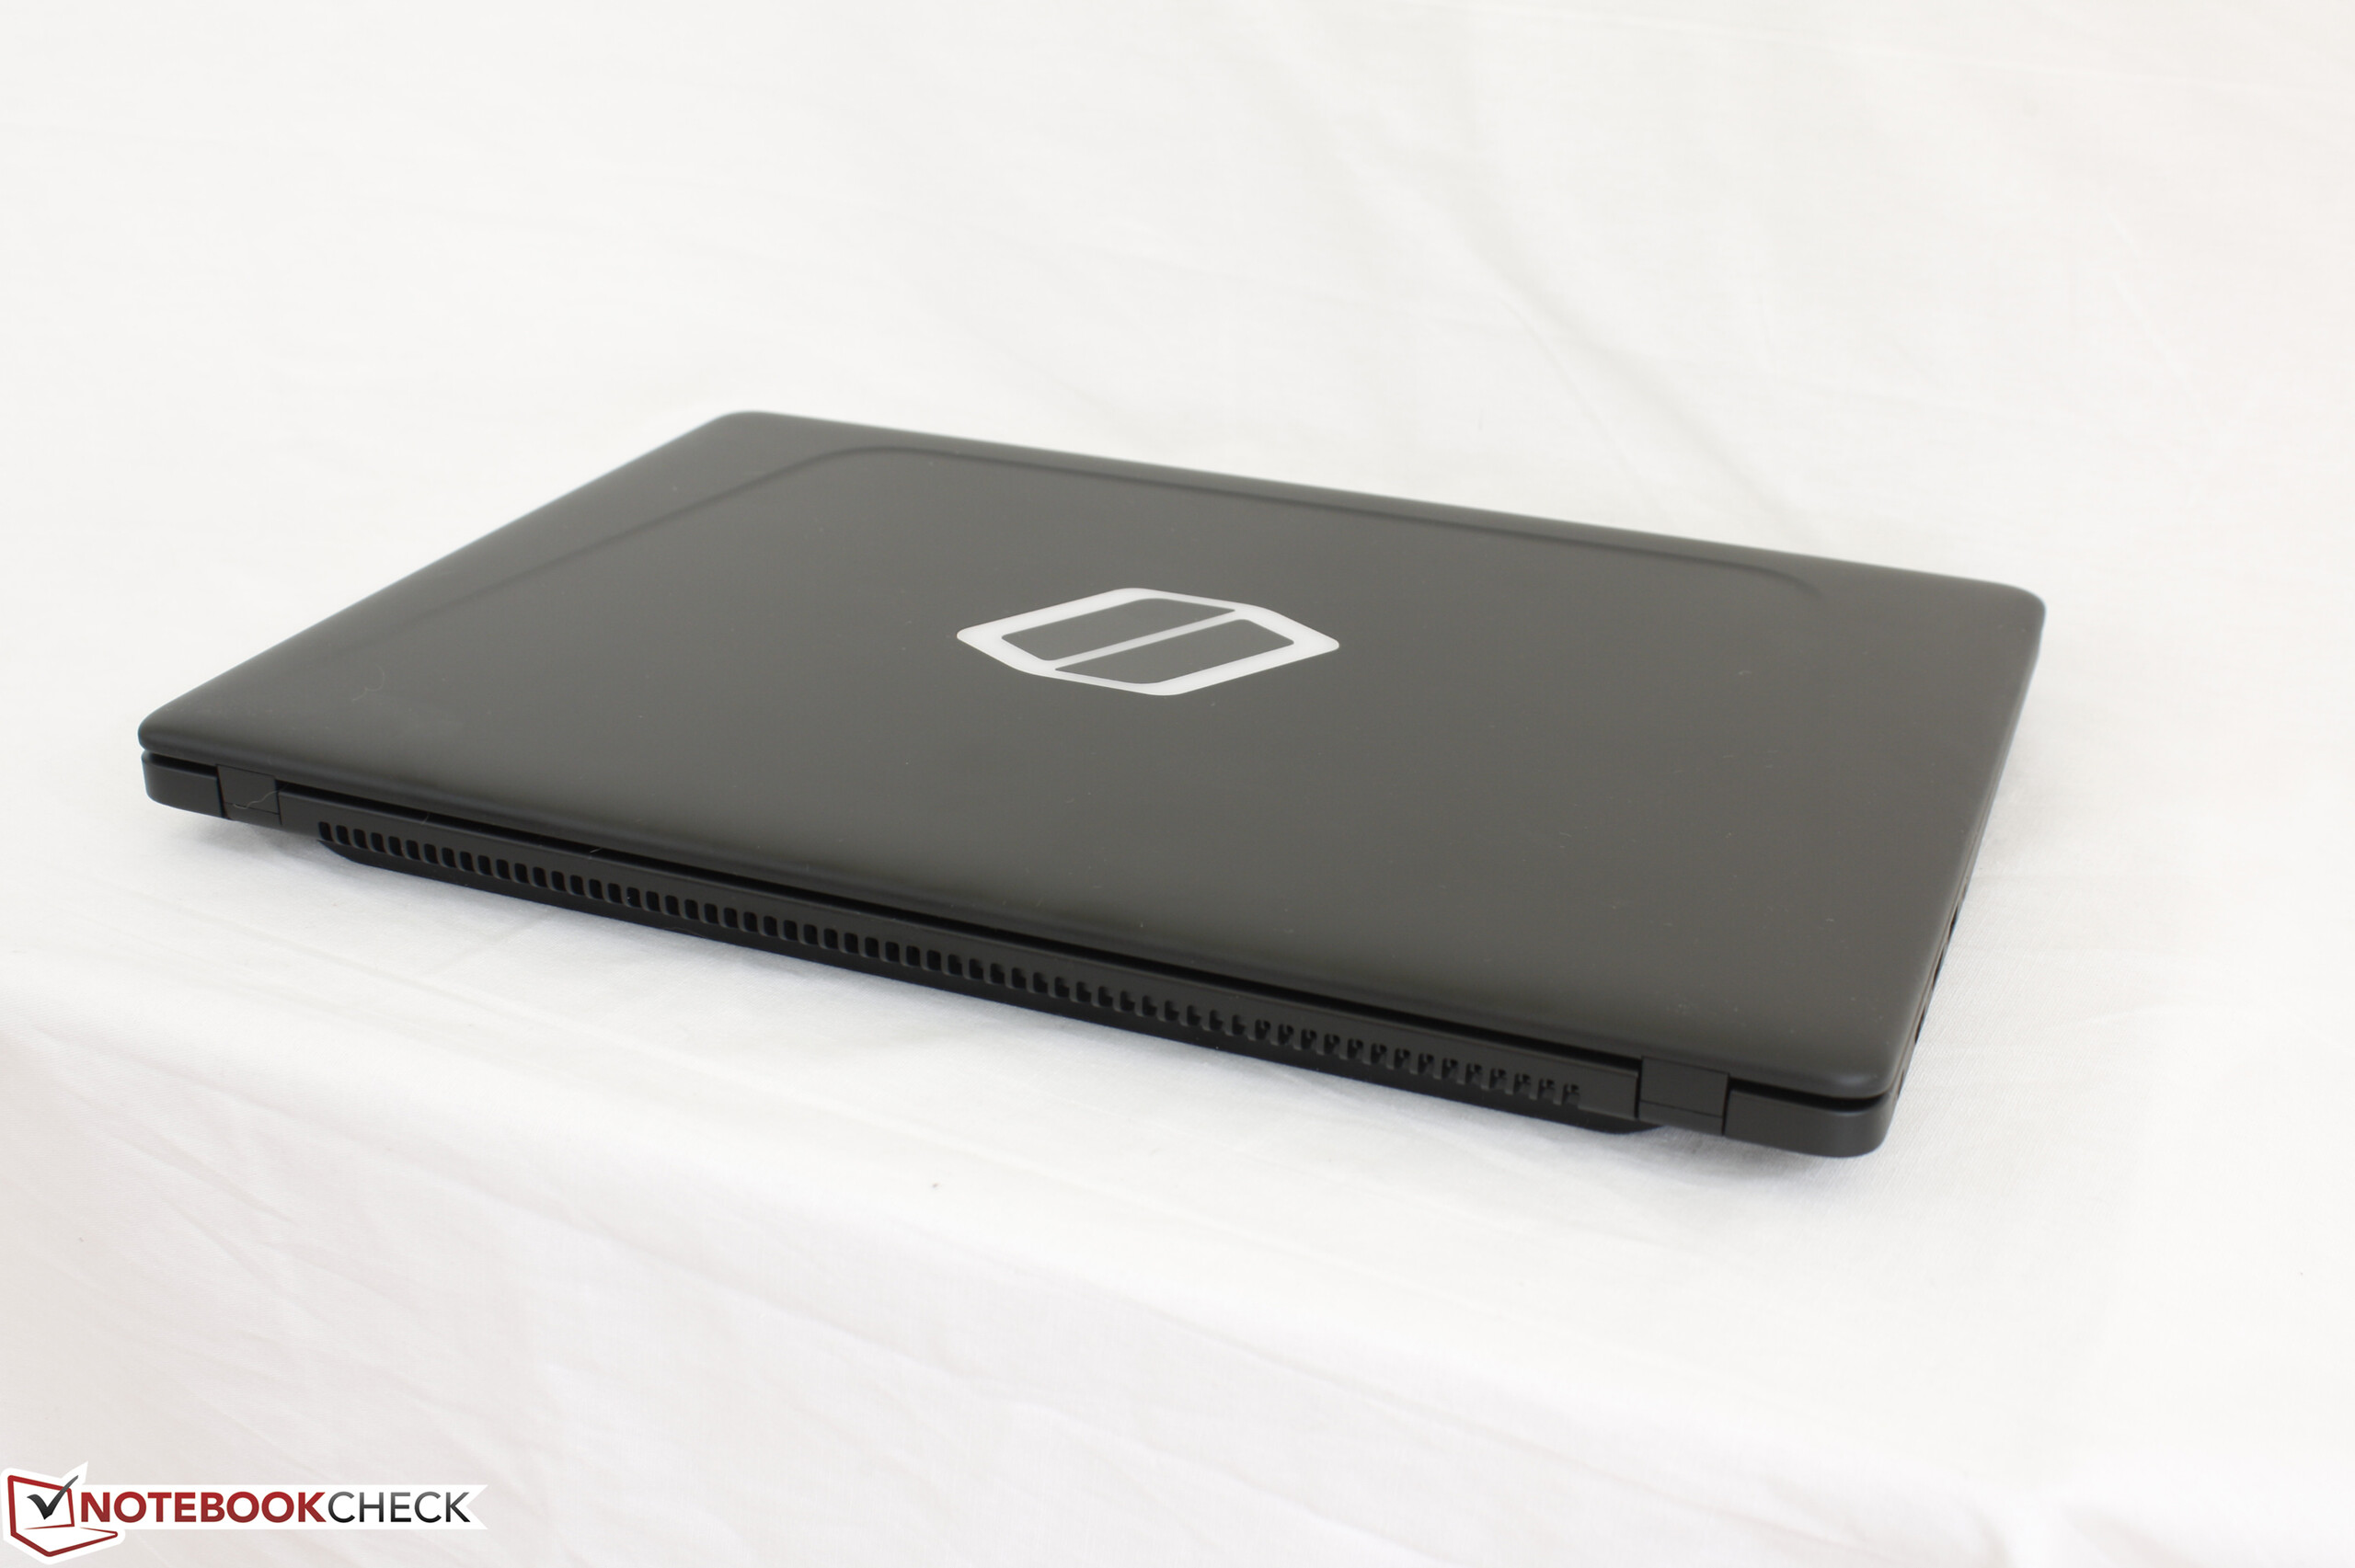
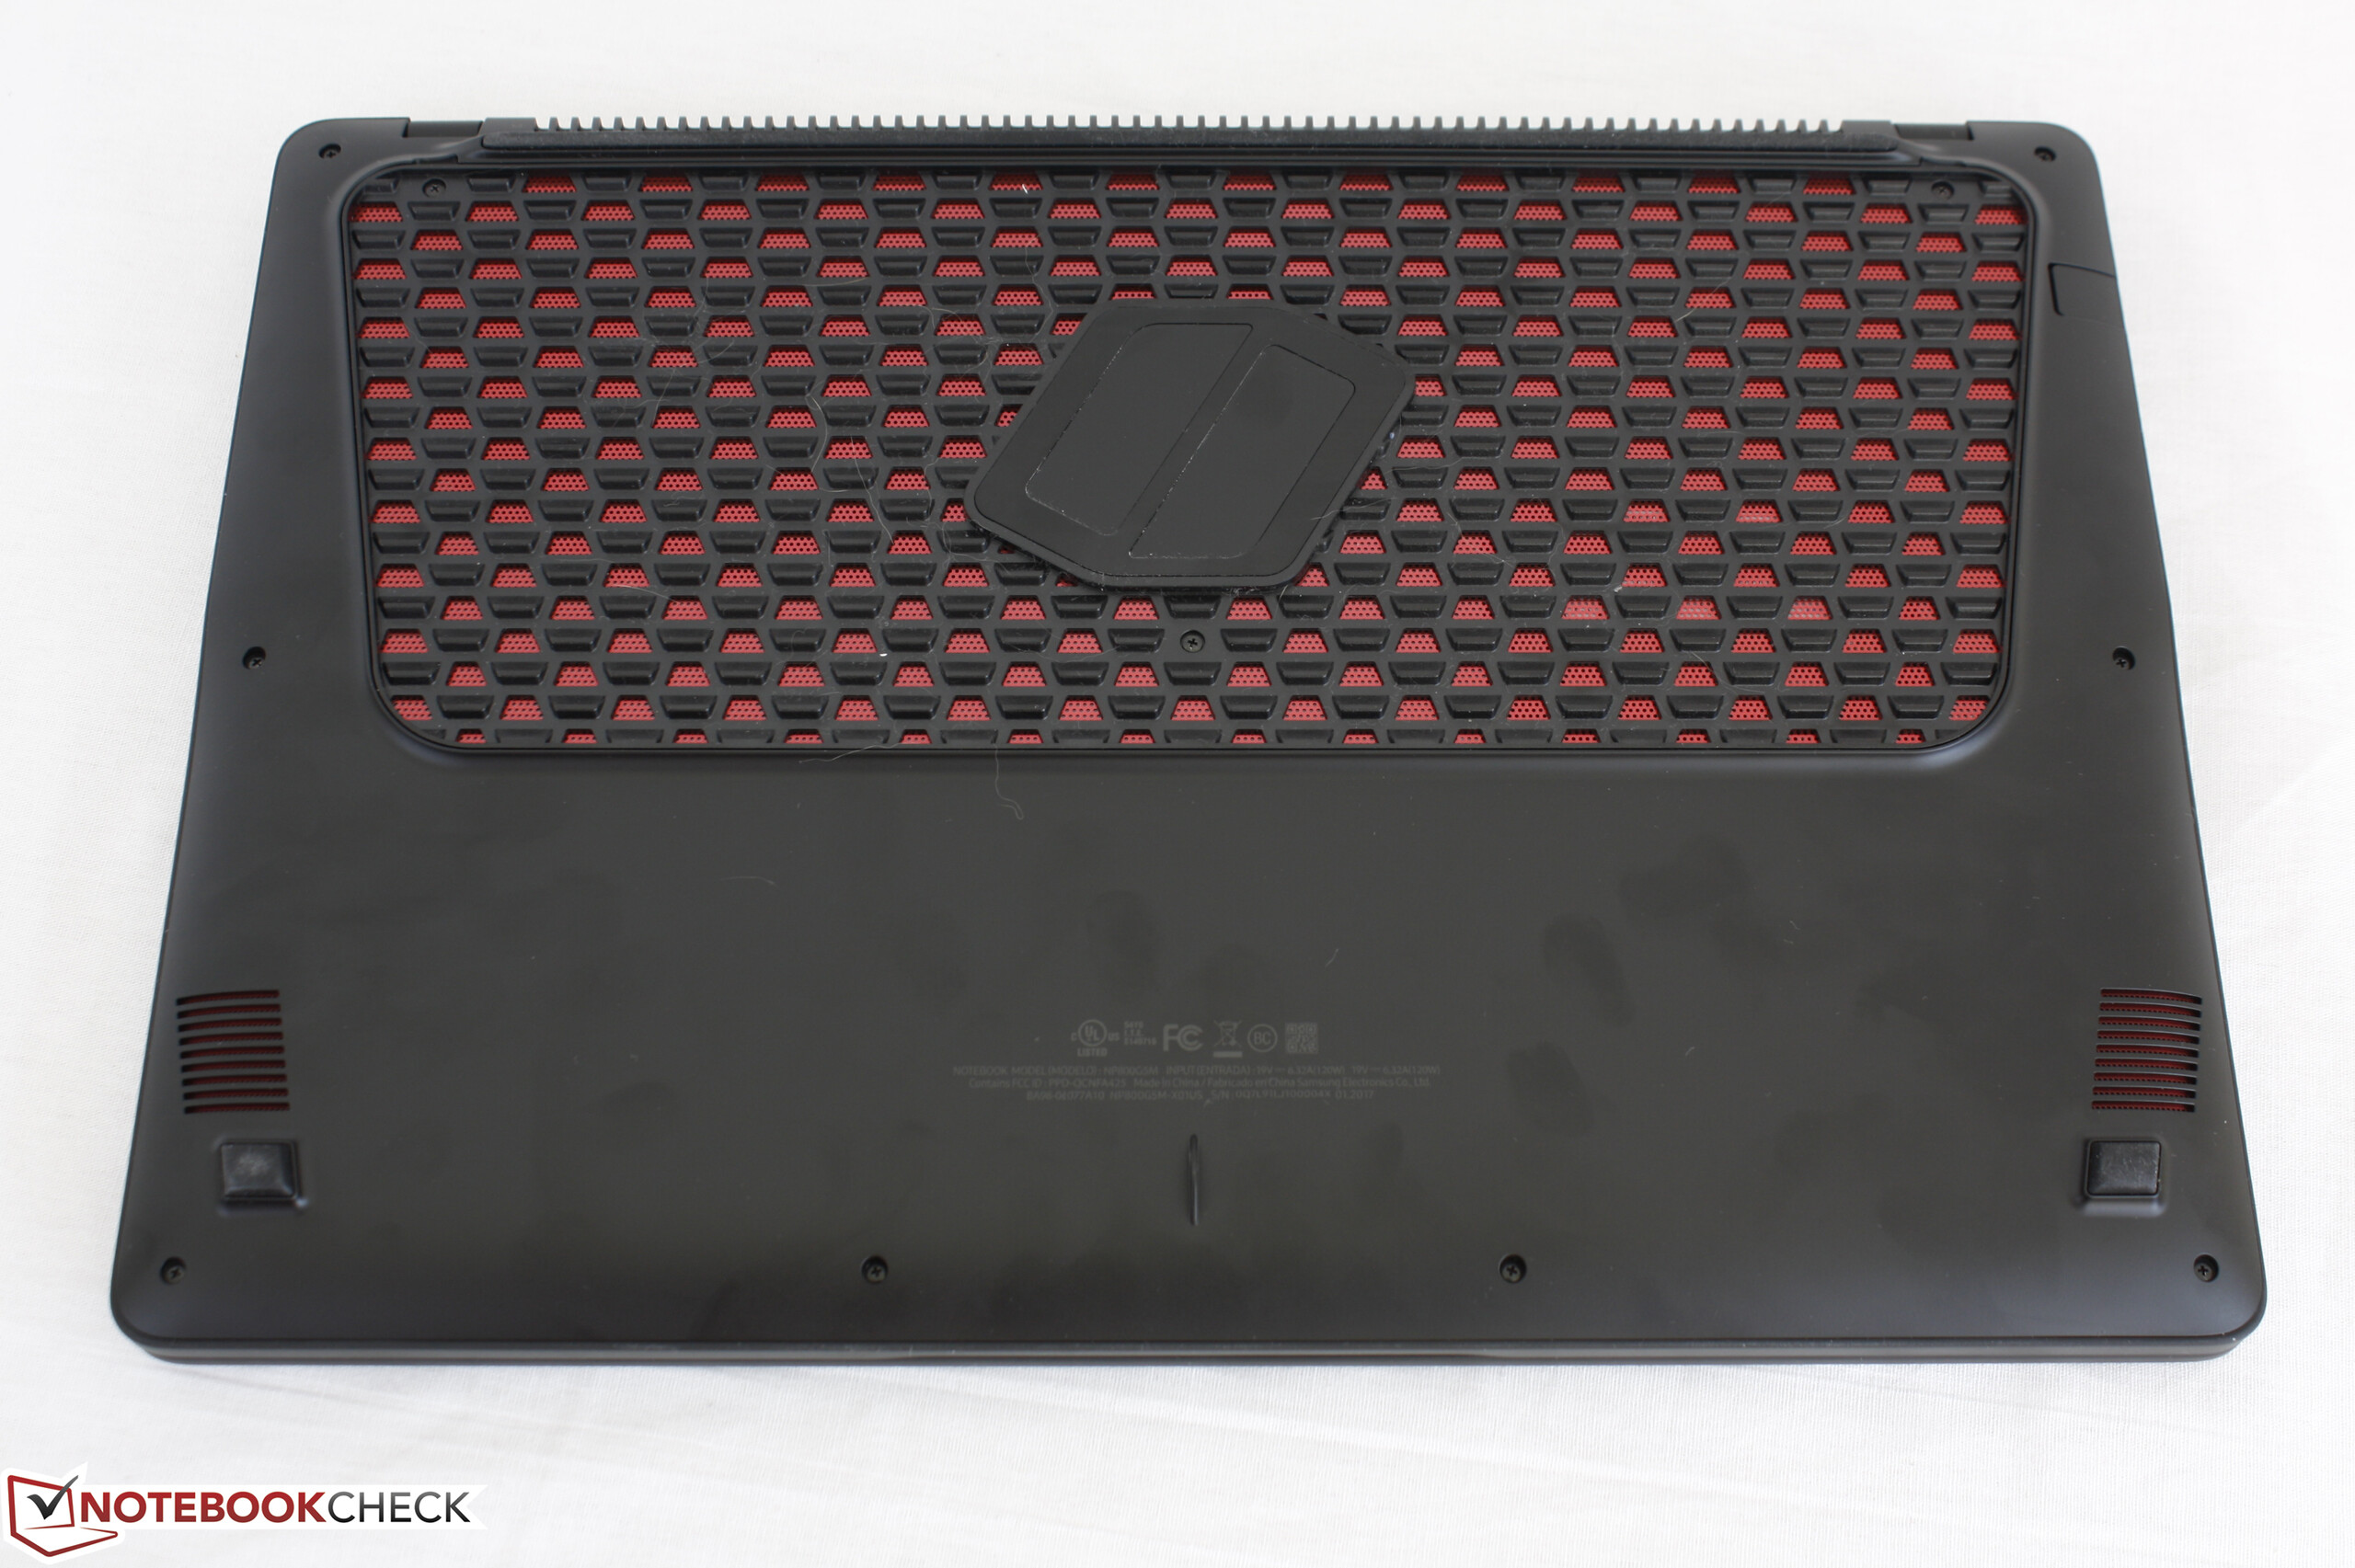
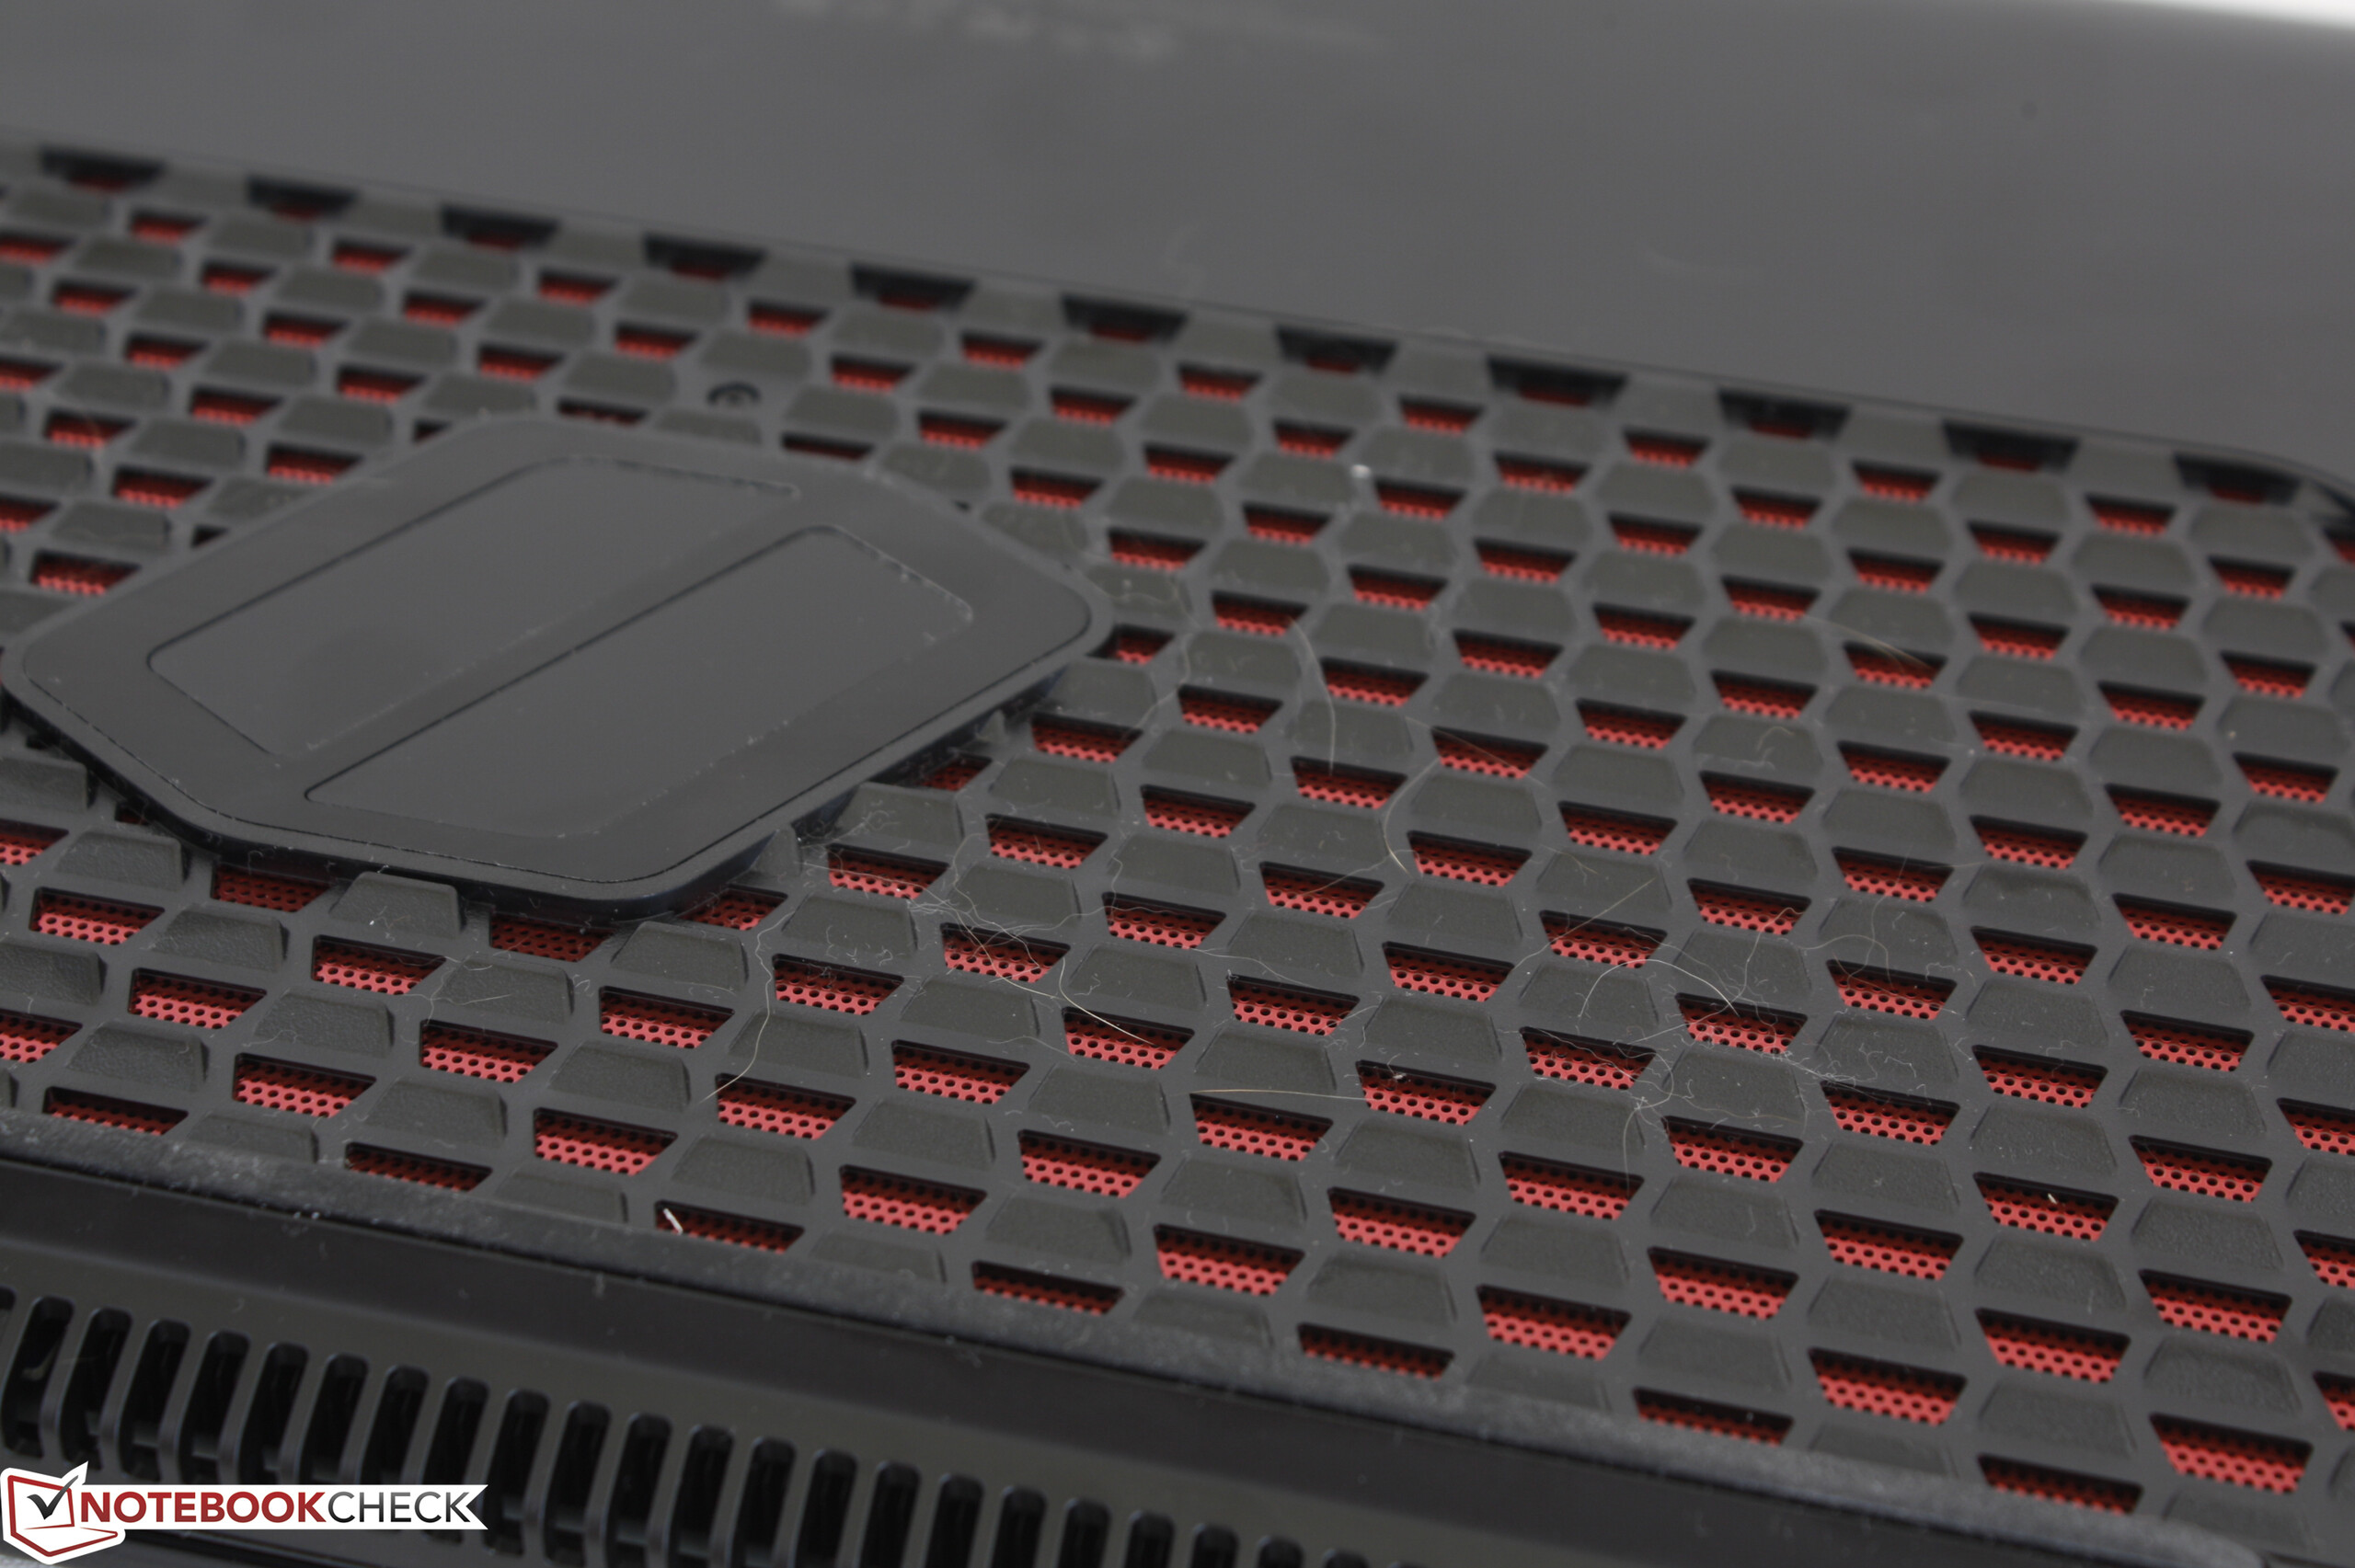
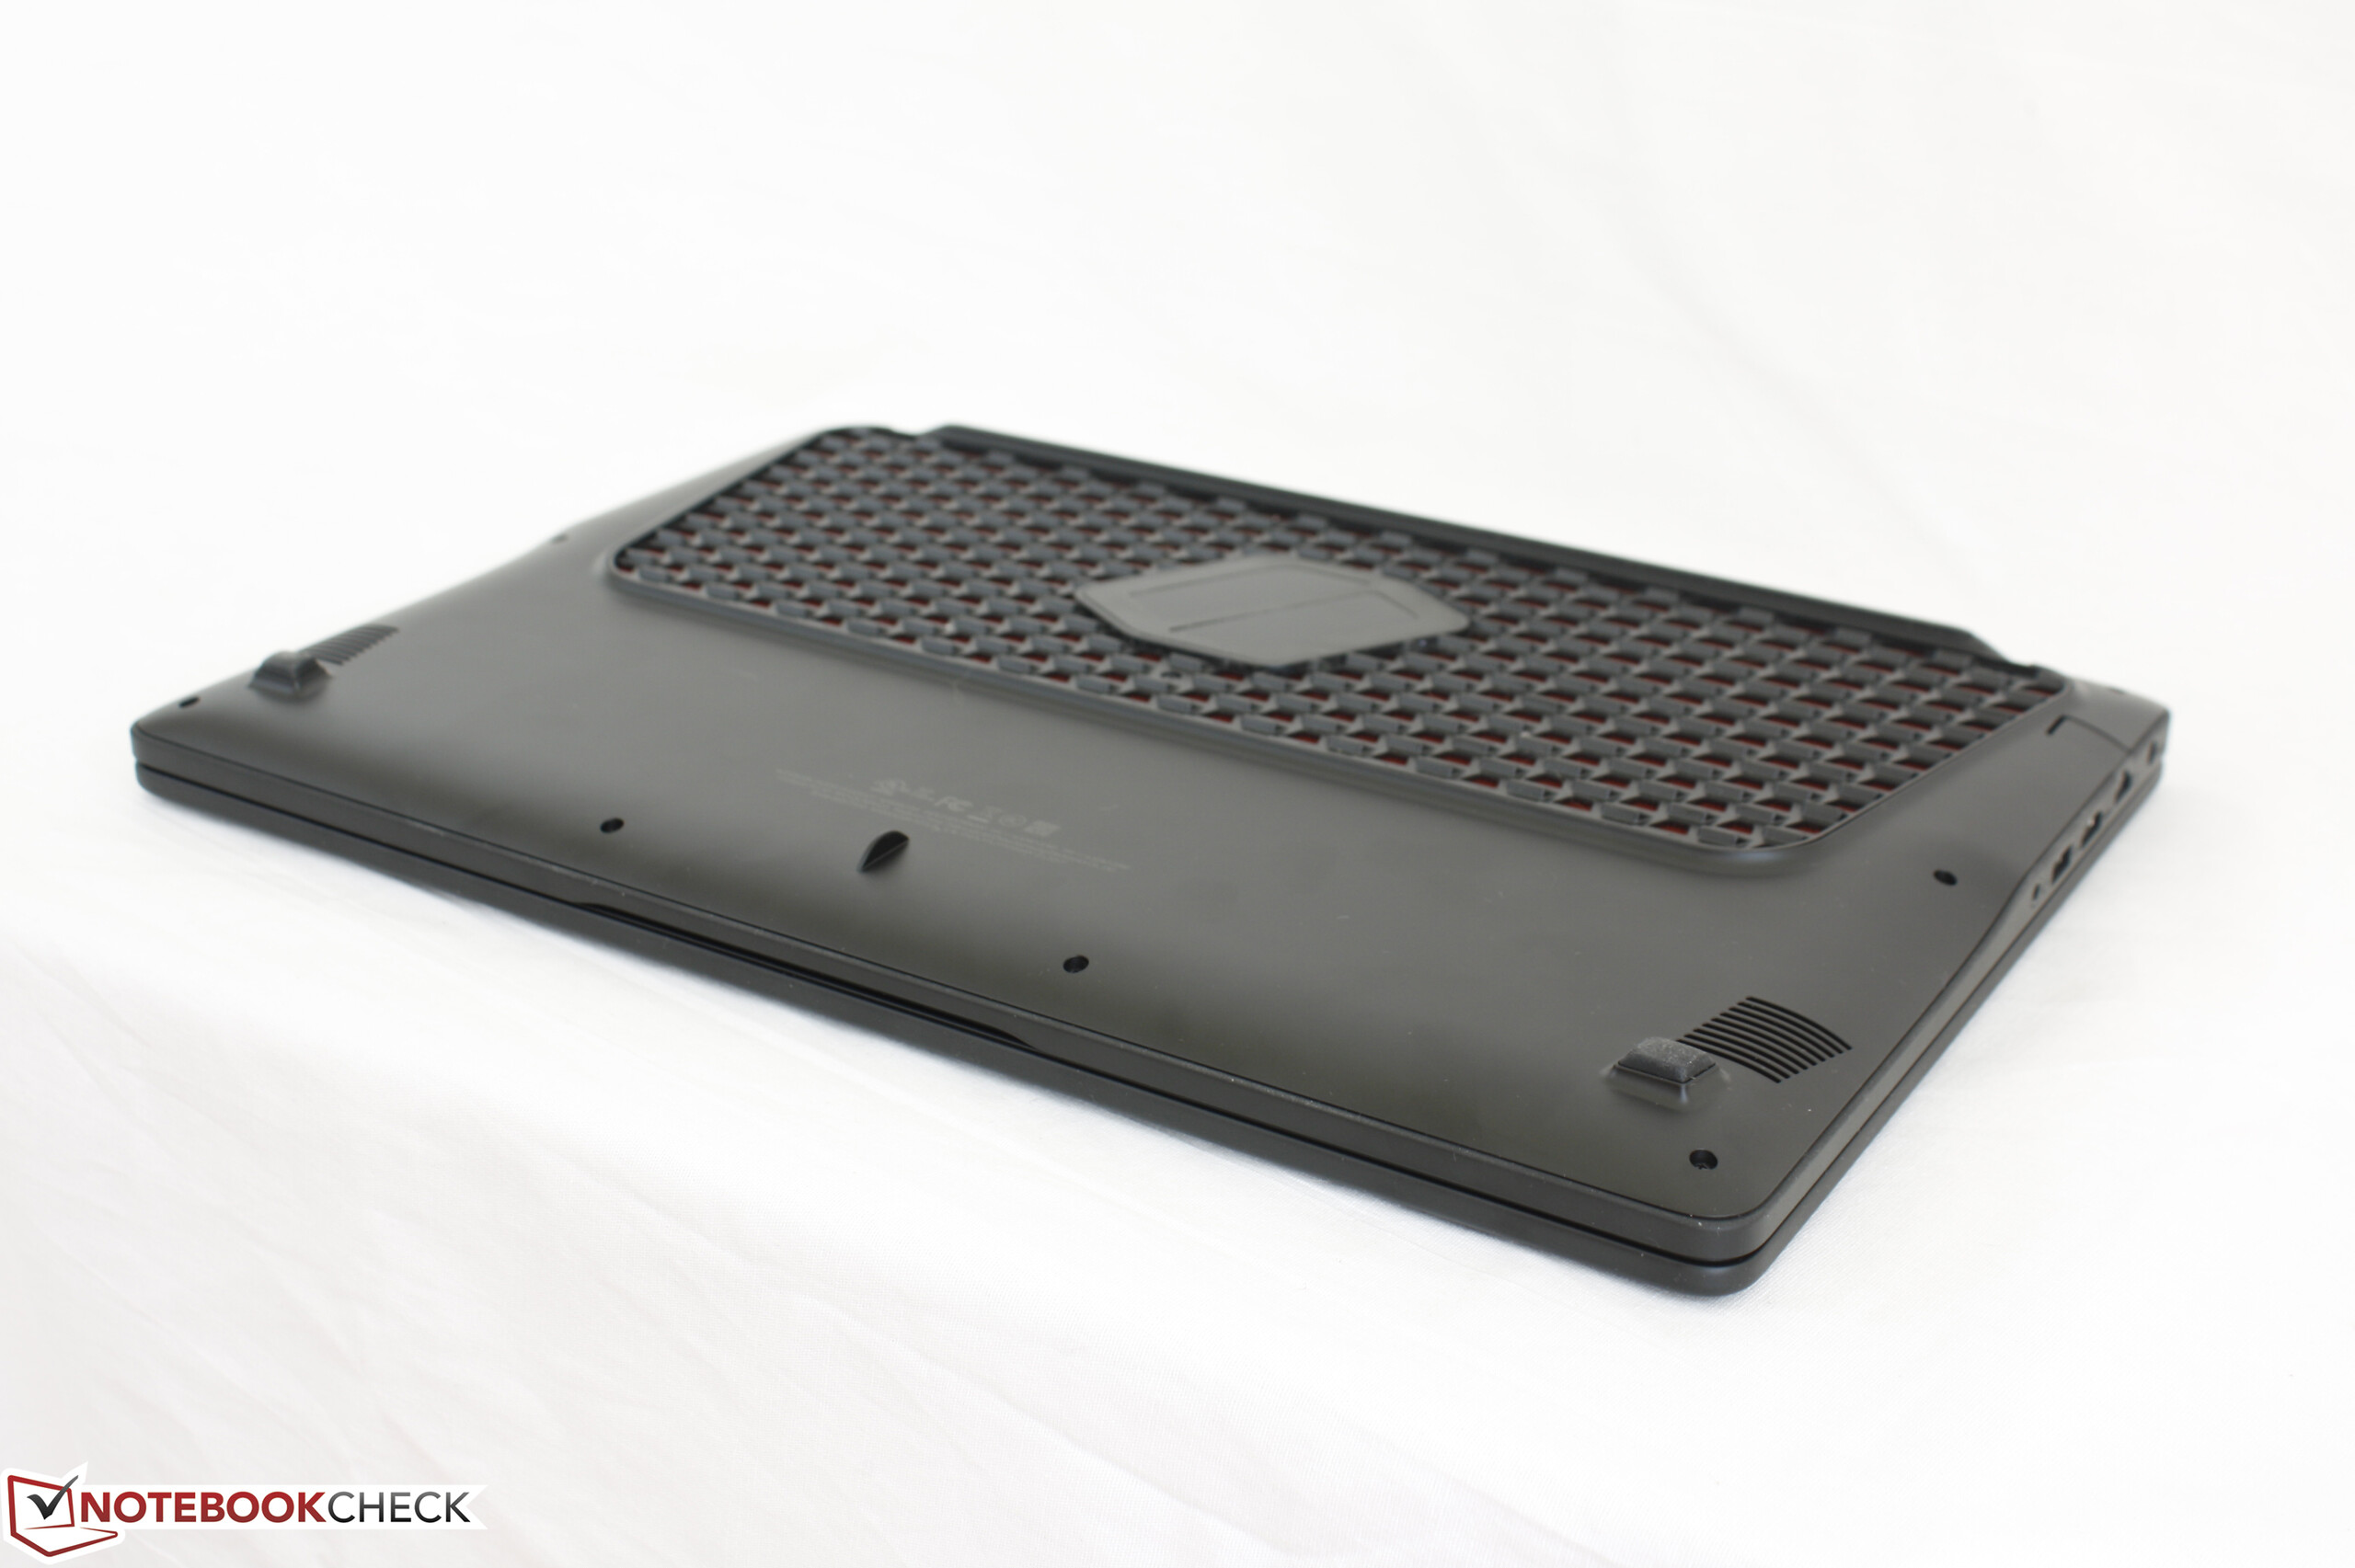
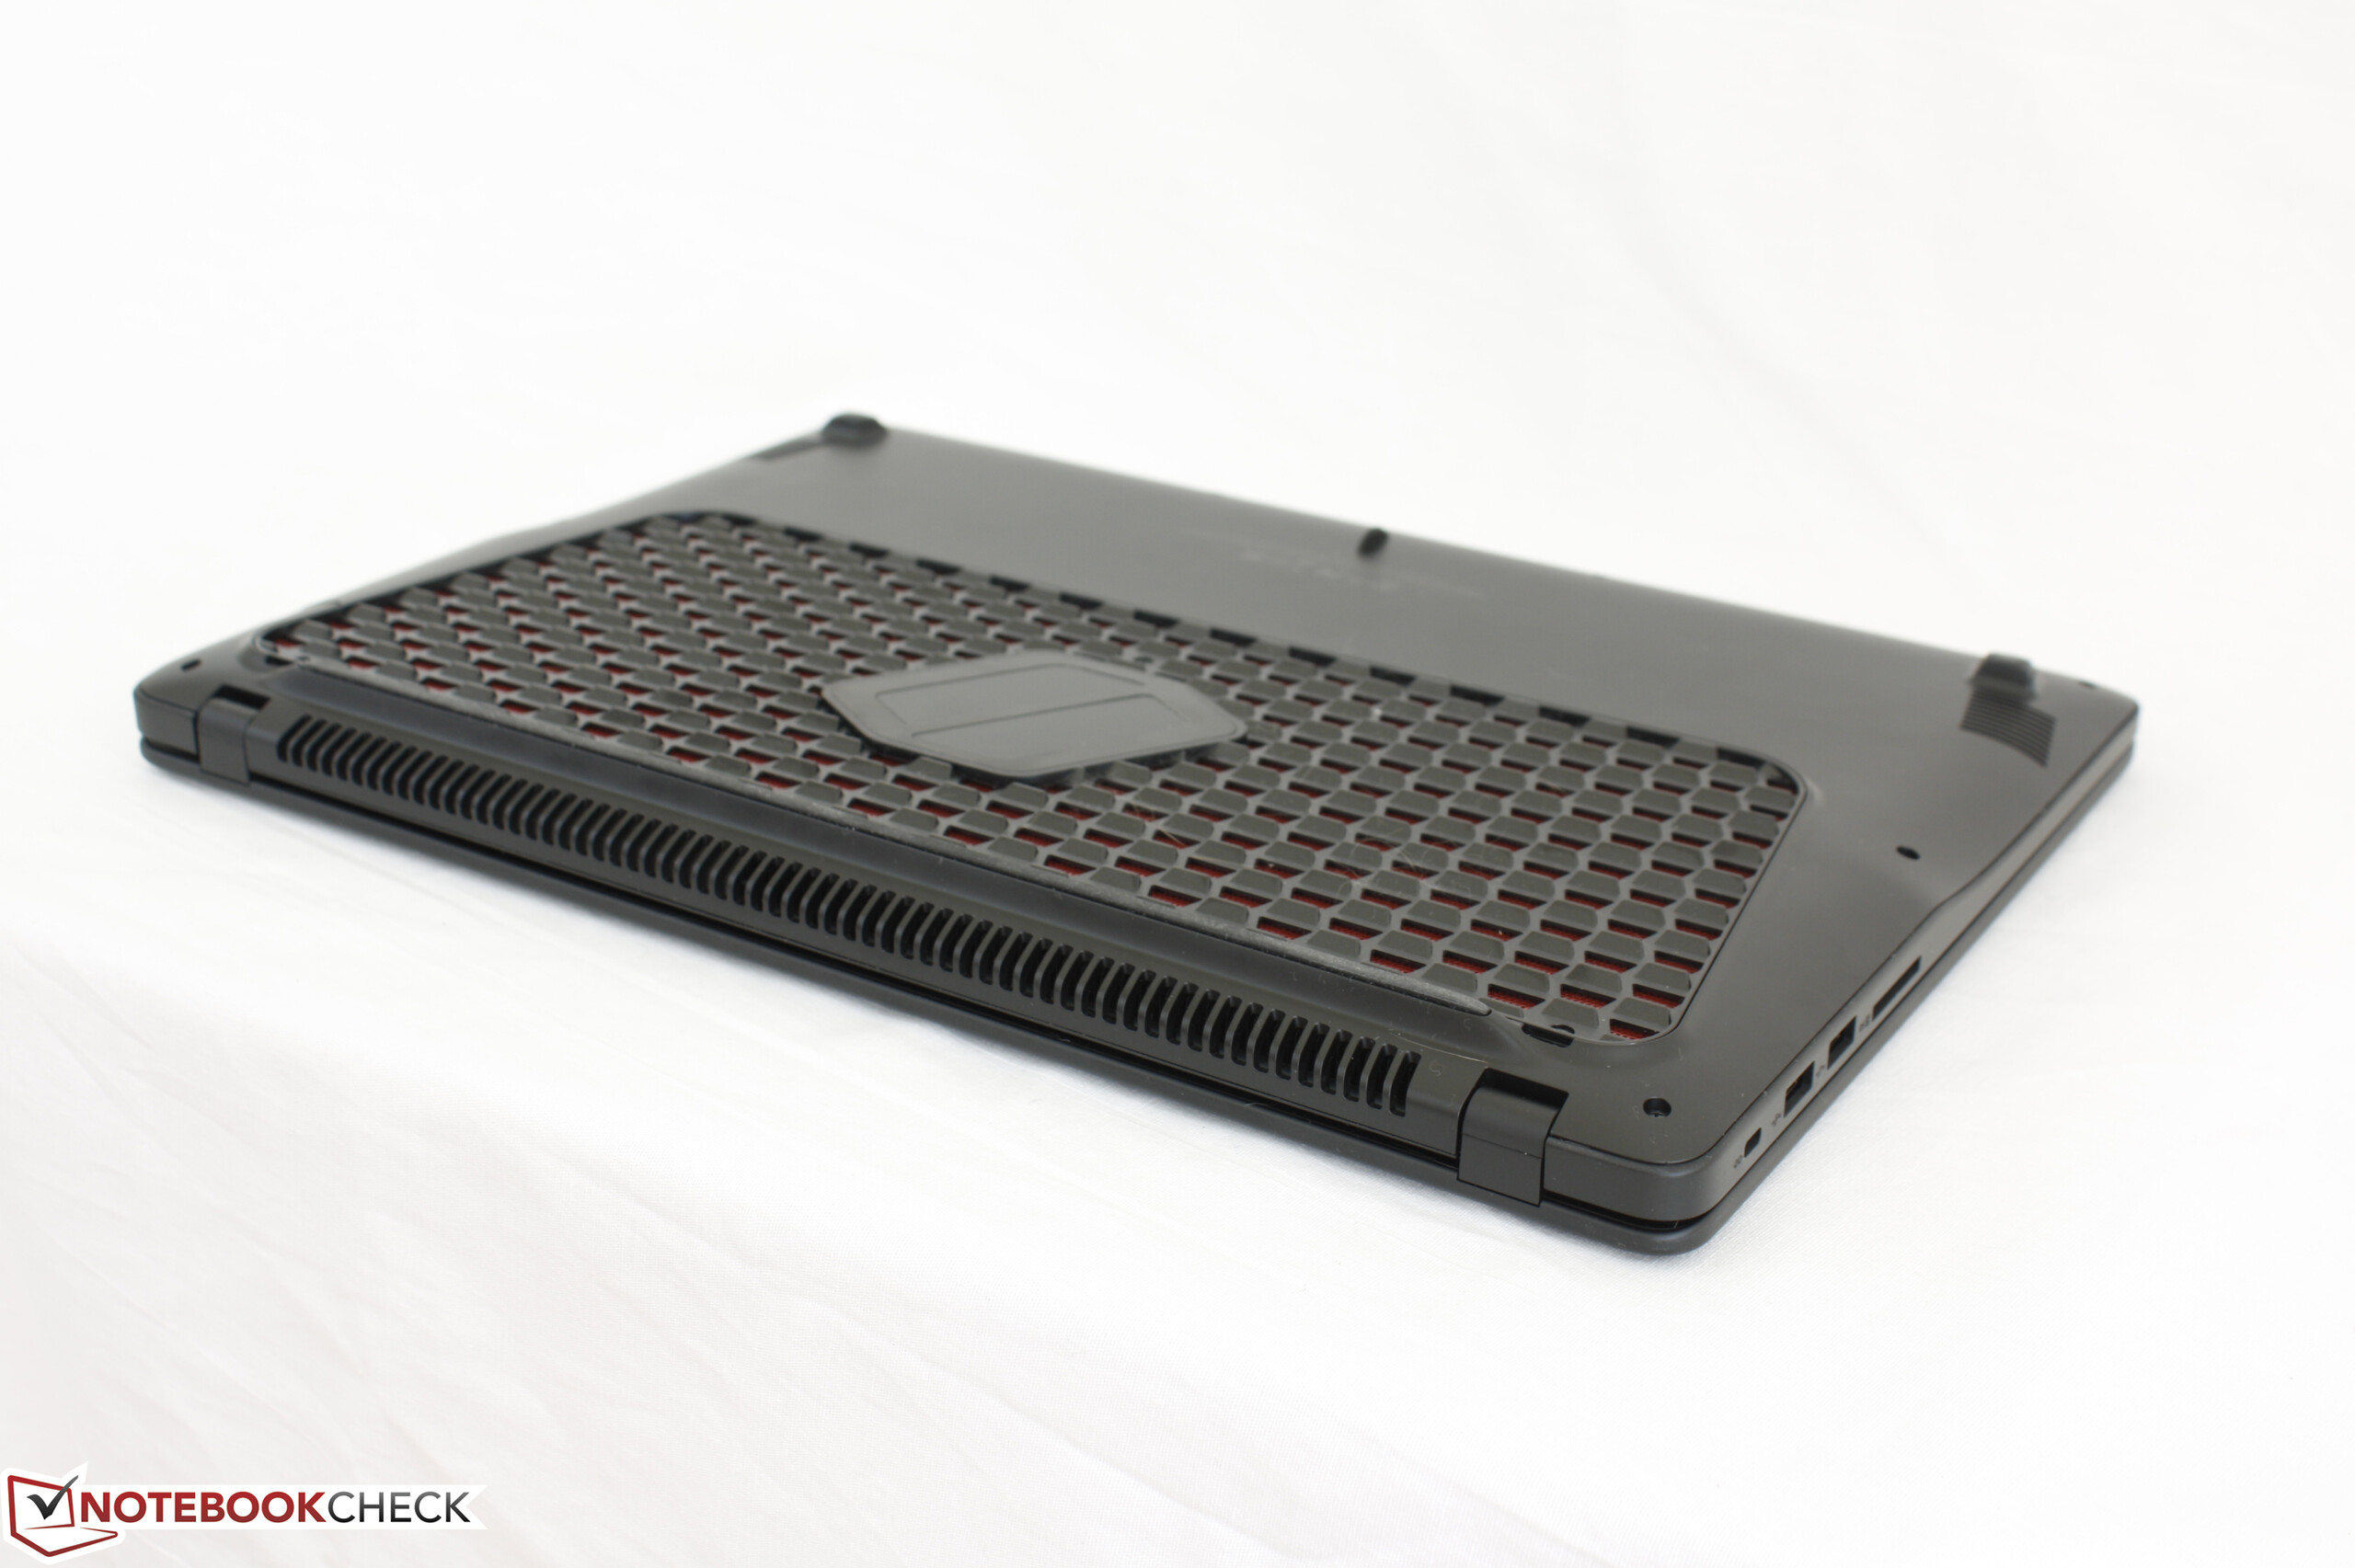
Rigidity is nowhere near as tough as the MSI GT62/GT72 series or the Alienware 15 series. Attempting to twist or bend the base, palm rests, or lid will result in audible creaking and slight warping that, while not significant enough to be a major reliability concern, make the system feel cheap and budget grade. This also includes the uniquely designed honeycomb-like bottom that doubles as ventilation since its hollow structure bends easily. To be fair, the chassis is not any worse than the Pavilion 15t and the lid is slightly more rigid than on a Gigabyte P55. The small dual hinges can be opened up to 170 degrees with no teetering when typing and we can notice no unintended gaps or defects between materials or protruding bezels around the screen. Overall, however, the chassis is middling in both design and construction.
In terms of size and weight, the Samsung is significantly heavier and thicker than the similarly equipped XPS 15 9560 while being thinner than the entry-level Asus GL553VD. It's very close in dimensions to the Pavilion 15t that the Odyssey 15 competes with directly.
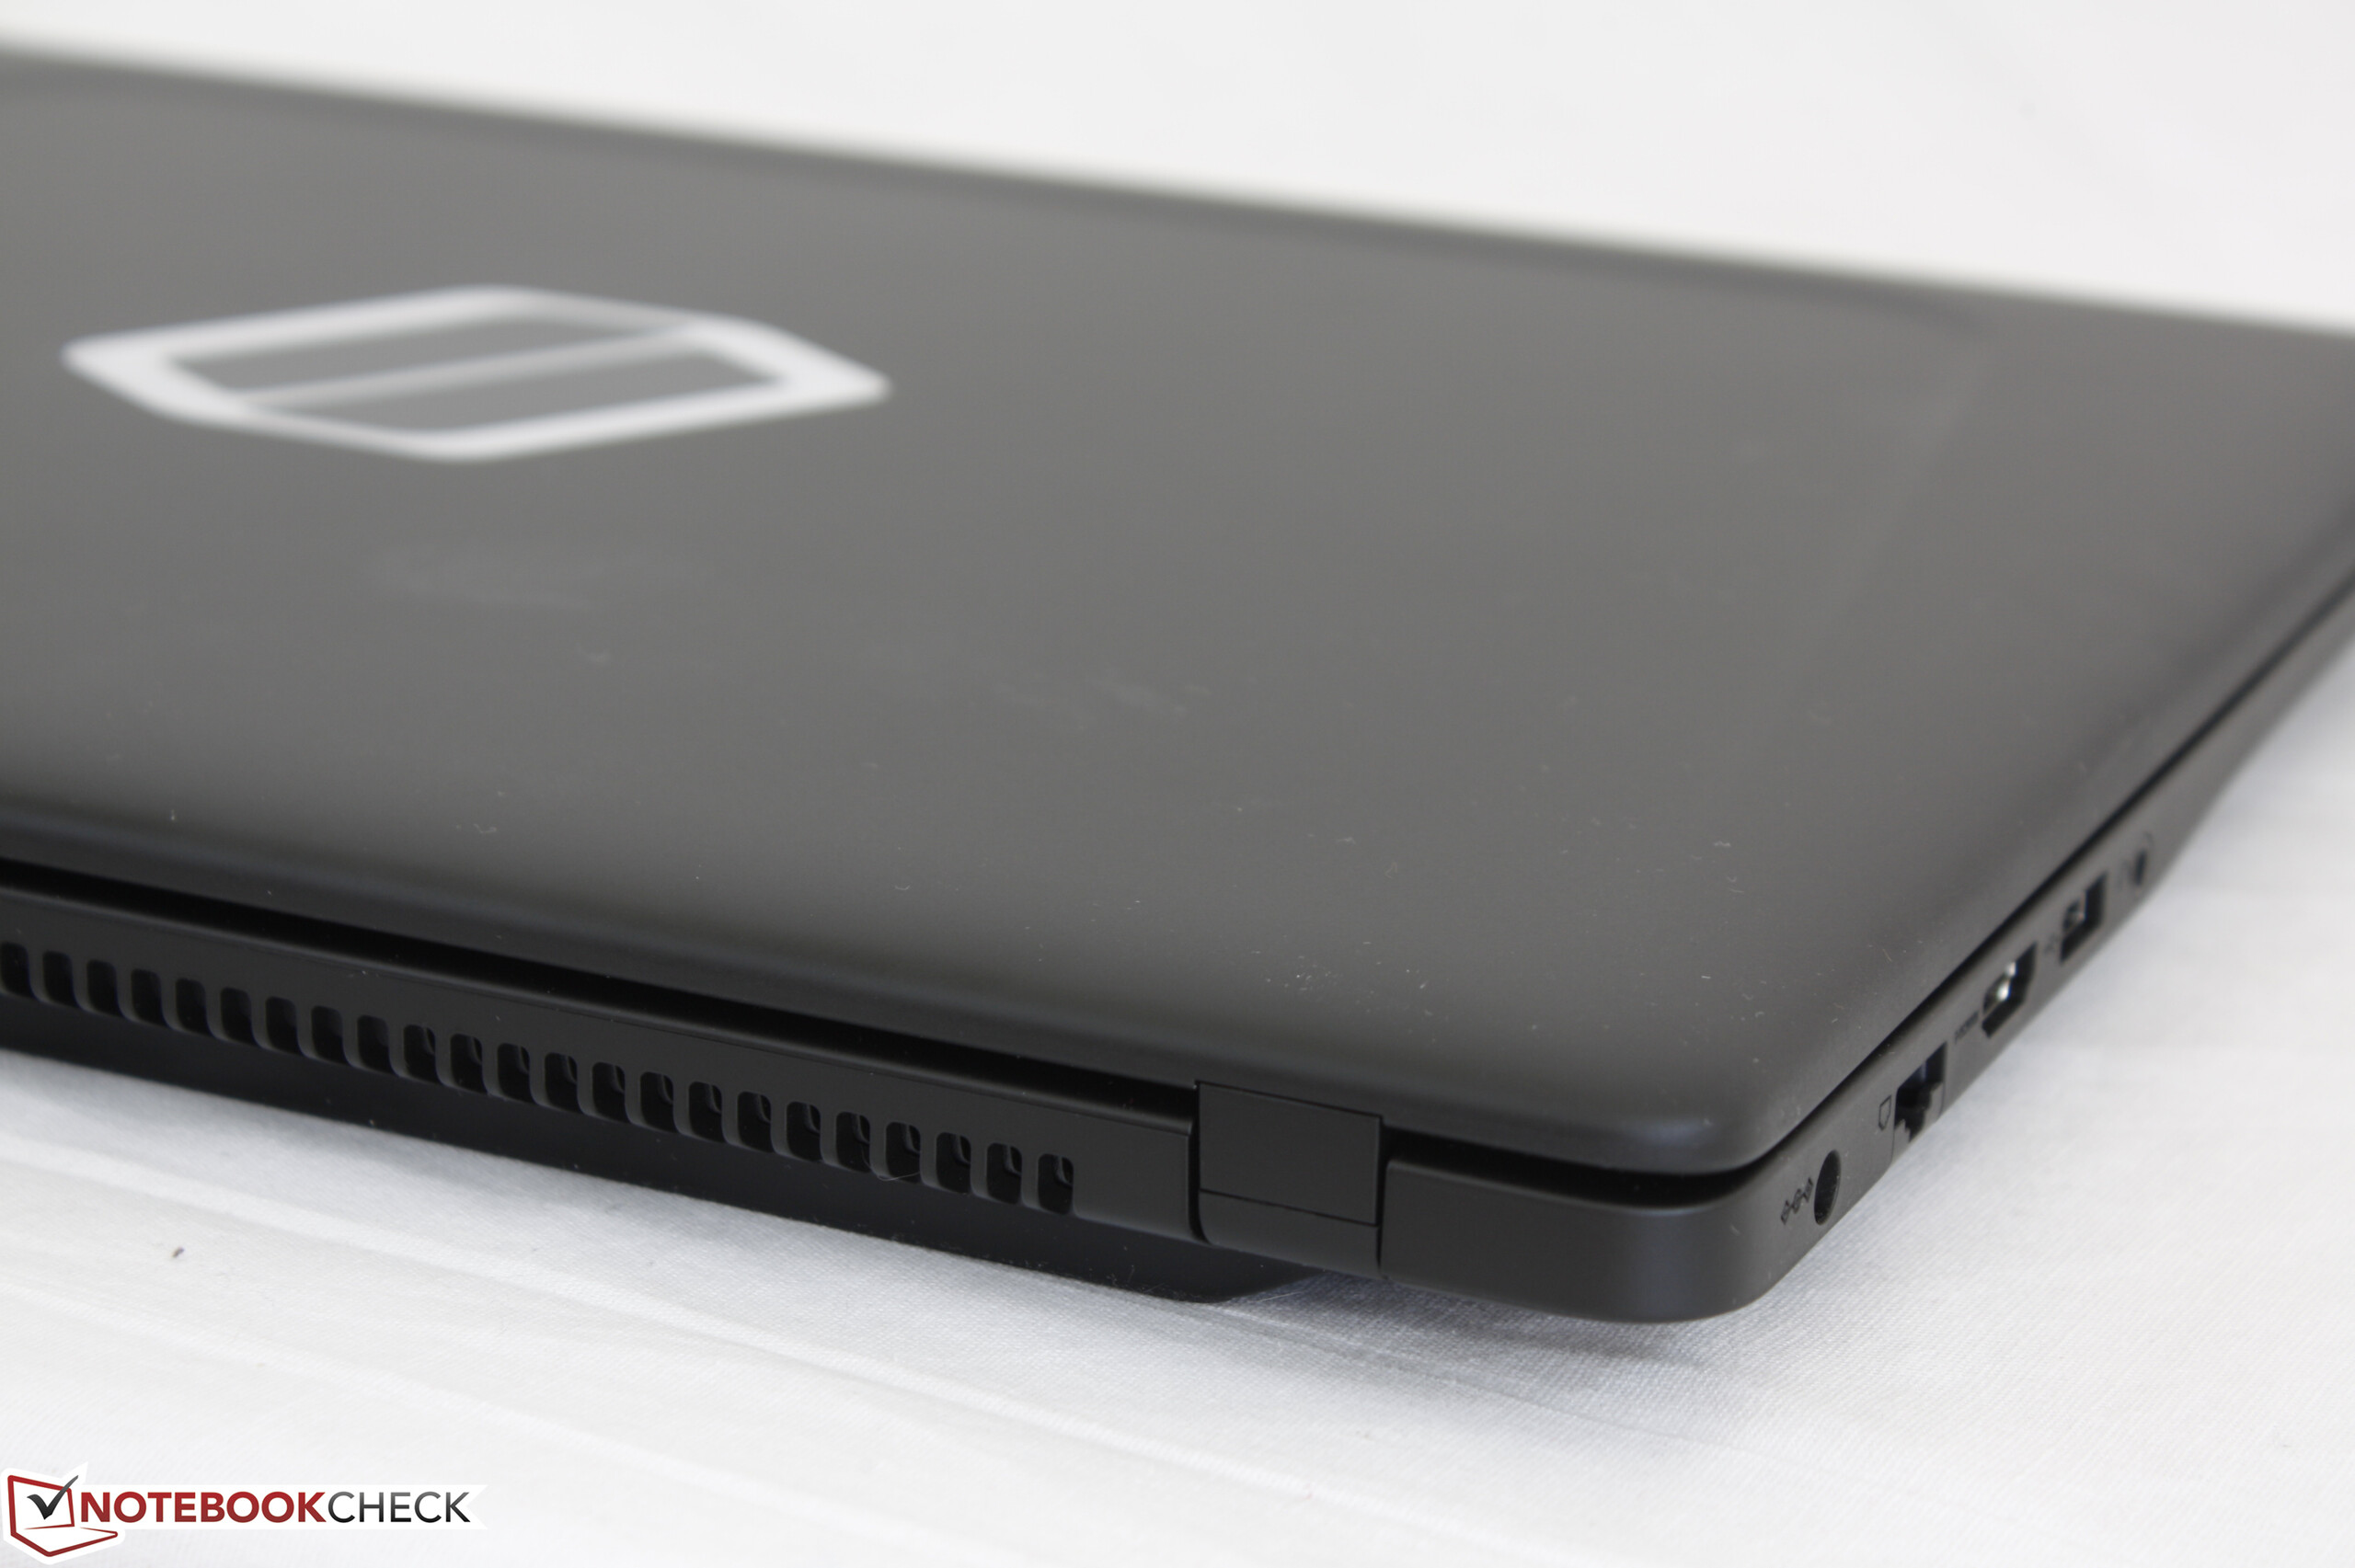
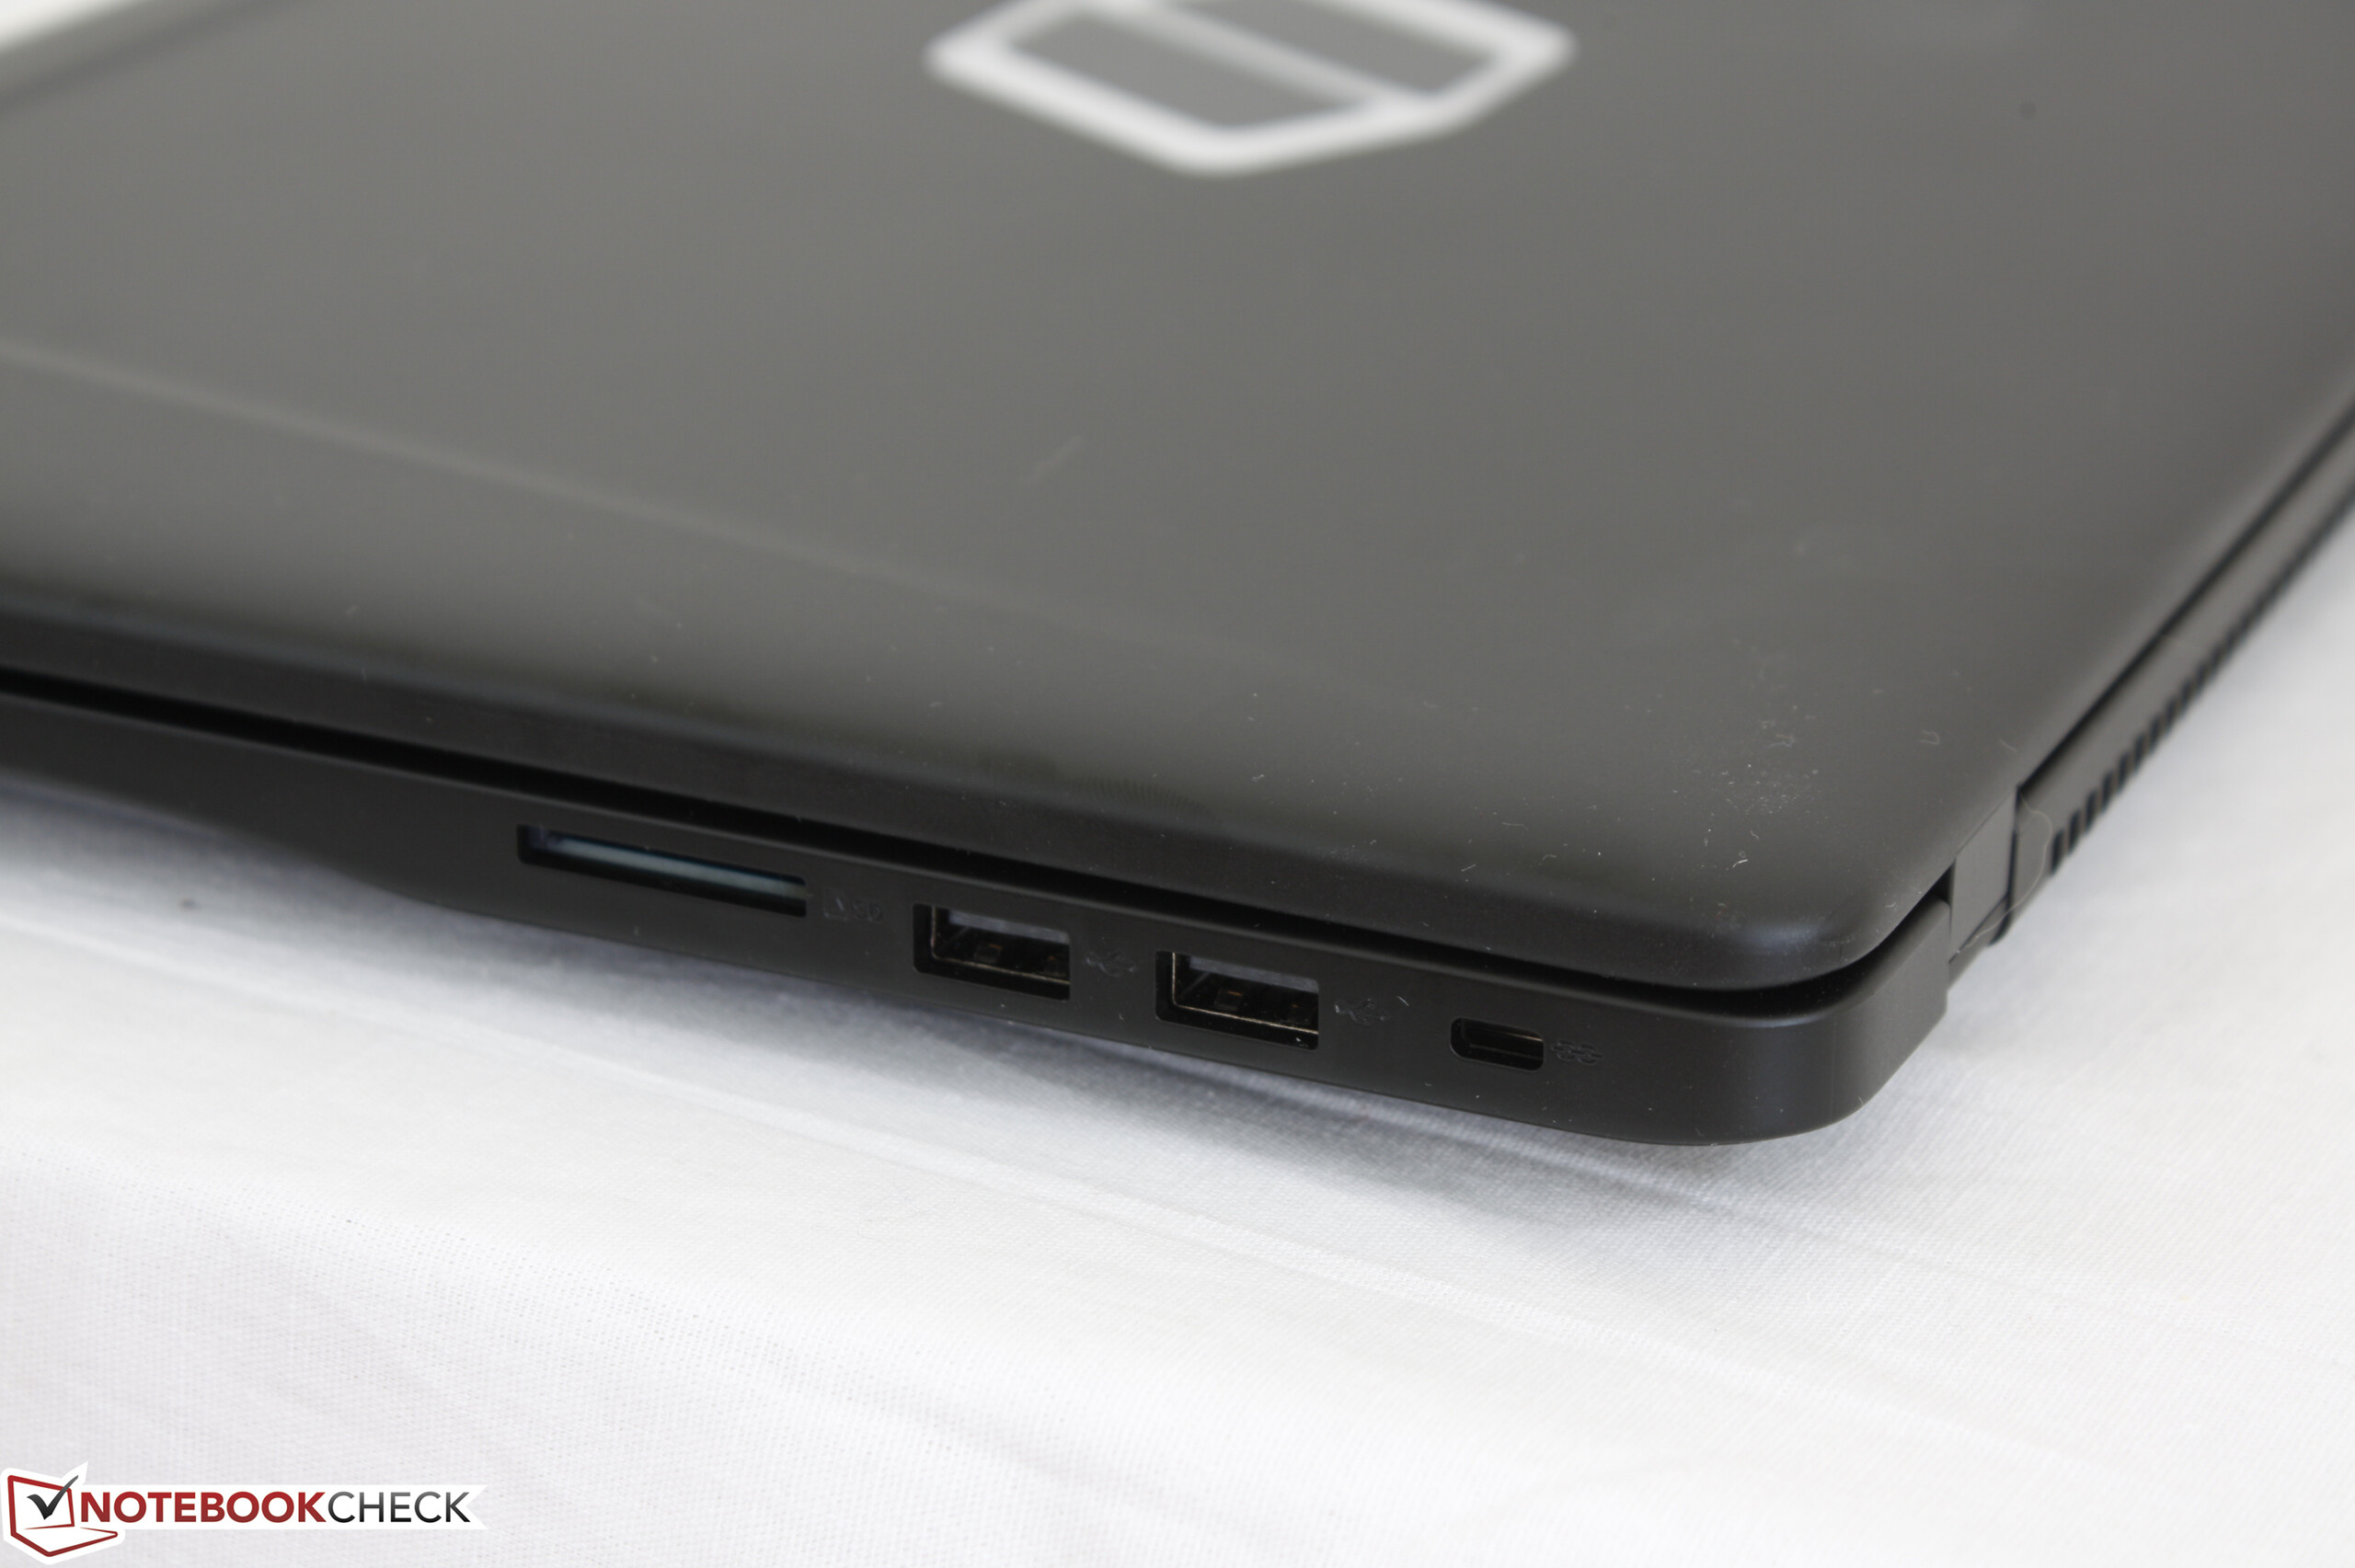
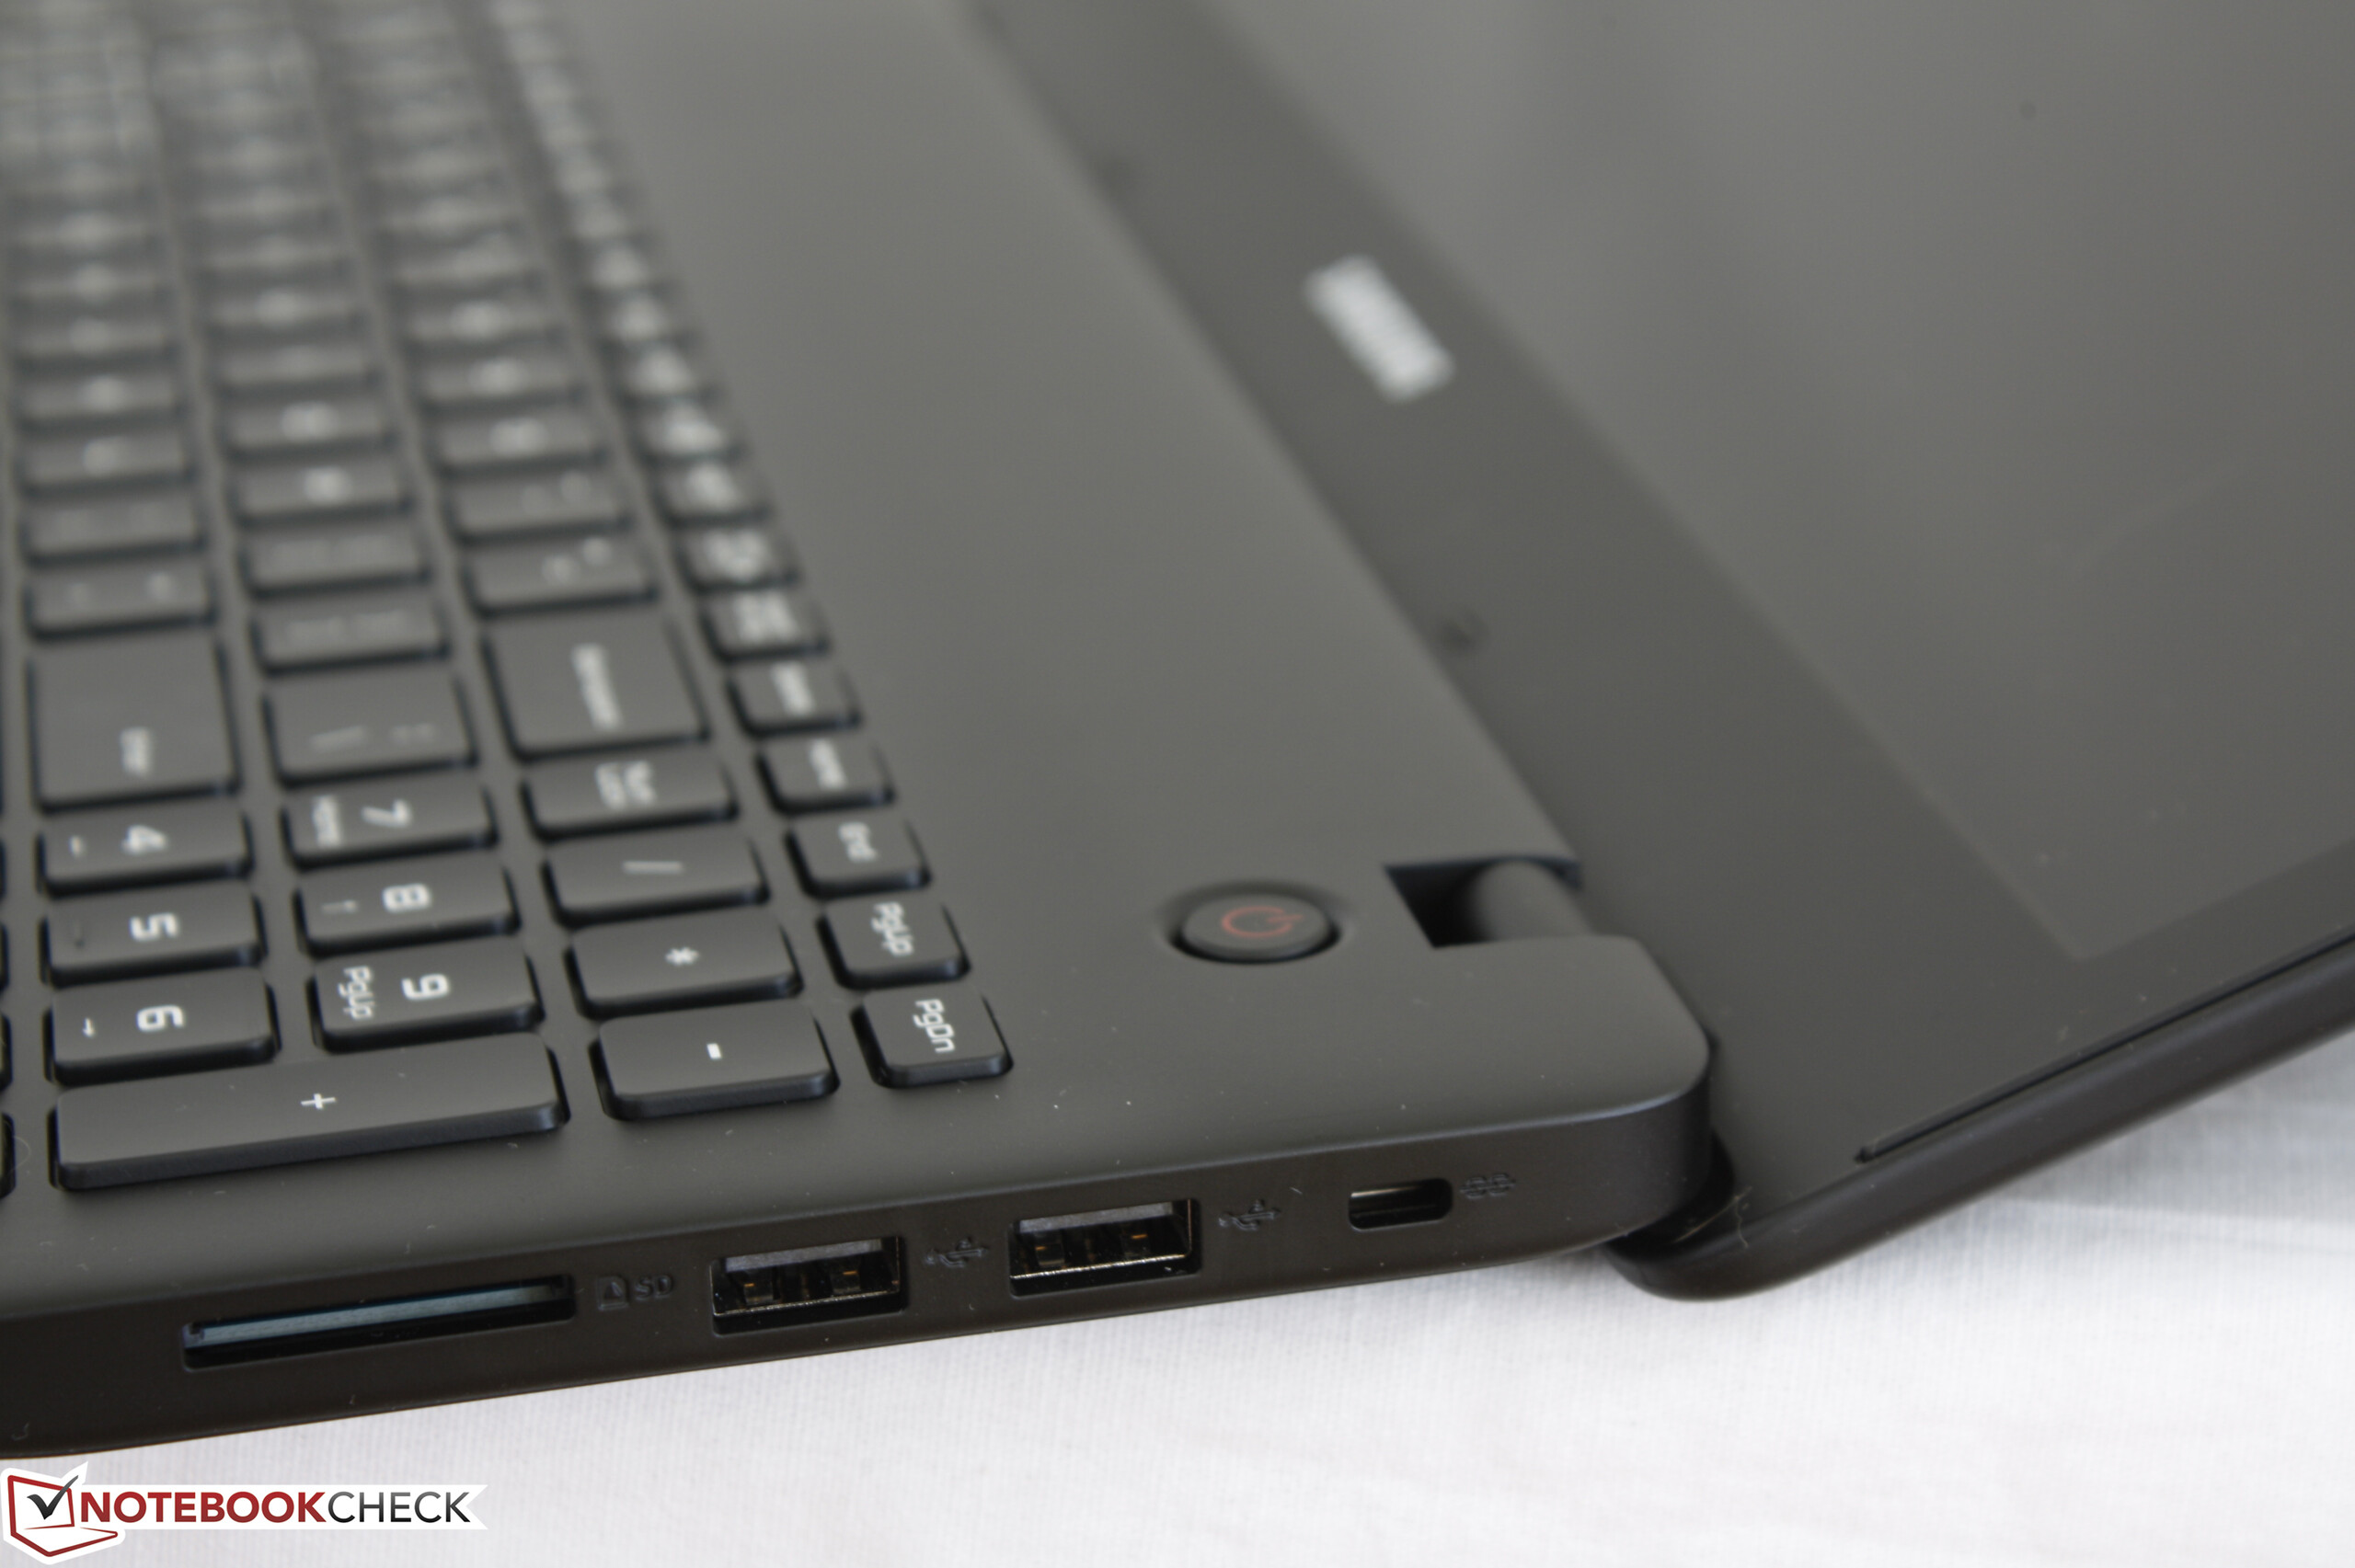
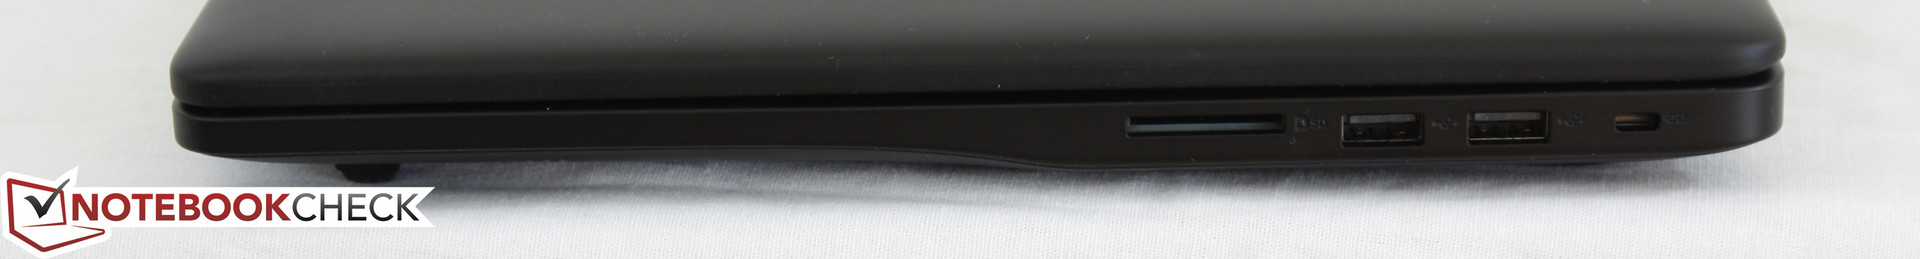
Connectivity
Available ports are almost exactly the same as on the HP Pavilion 15 with its single video-out option and 3x USB ports. In fact, even the positioning of the ports between the Samsung and HP models is nearly identical along the left and right-hand edges. The major difference is that the Samsung carries just one 3.0 USB port compared to two on the HP.
Costlier or thicker gaming notebooks like the GS63VR or GT62 can have multiple video-out options and more USB ports, so the Odyssey feels barebones in this regard. While we're not expecting Thunderbolt 3 on an entry-level gaming system, a standard USB Type-C Gen. 1 port would have been a welcomed addition.


Software
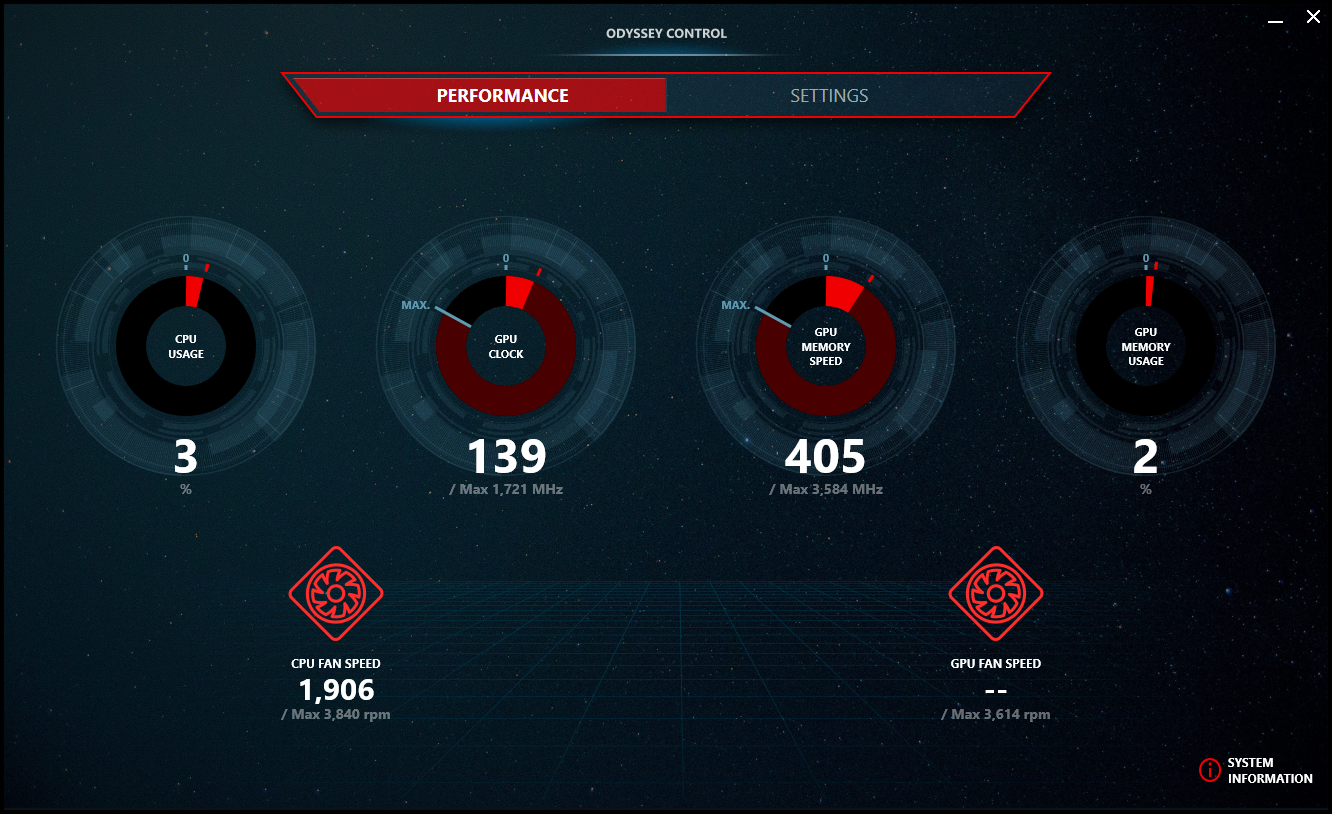
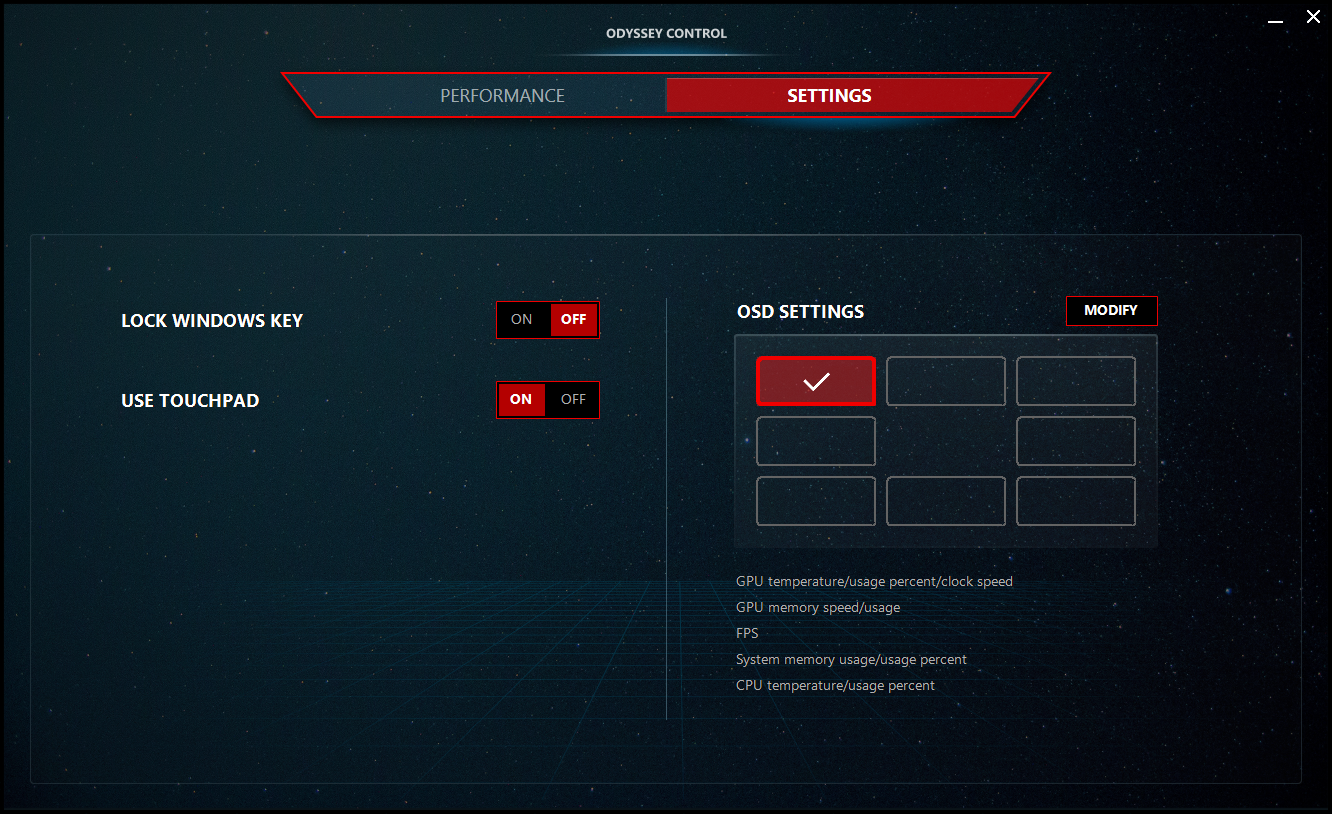
The Odyssey Control software is a simple system monitor for displaying CPU usage, GPU activity, and fan speeds for both the CPU and GPU fans. It also has a very handy corner overlay for real-time GPU temperature, CPU temperature, FPS, and RAM usage that gamers may like to have active. The software offers no other features and we're hoping that a future revision could perhaps add recording functionality for saving hardware data and gameplay.
SD Card Reader
The spring-loaded integrated card reader is one of the slowest for a gaming notebook with a transfer rate of just 18 MB/s from our UHS-II test card. In comparison, the XPS 15 is able to reach over 250 MB/s with the same SD card. Transferring 1 GB worth of images from the card to desktop will take about 41 seconds.
A fully inserted SD card will protrude by only one or two millimeters for safe handling.
| SD Card Reader | |
| average JPG Copy Test (av. of 3 runs) | |
| Dell XPS 15 9560 (i7-7700HQ, UHD) | |
| Asus FX502VM-AS73 | |
| Samsung Odyssey NP800G5M-X01US | |
| maximum AS SSD Seq Read Test (1GB) | |
| Dell XPS 15 9560 (i7-7700HQ, UHD) | |
| Asus FX502VM-AS73 | |
| Samsung Odyssey NP800G5M-X01US | |
Communication
Transfer rates from the Qualcomm QCA9377 module are limited to ~340 Mbps for both upstream and downstream even on the most ideal of conditions (1 meter away from Linksys EA8500 802.11ac test router). This suggests a standard 1x1 WLAN module whereas competing gaming notebooks with Intel 8260 or Killer 1535 modules can reach over 500 Mbps under similar conditions. We otherwise experienced no noticeable connectivity or latency issues during our time with the test unit.
| Networking | |
| iperf3 transmit AX12 | |
| HP Pavilion 15t-bc200 X7P44AV | |
| Asus FX502VM-AS73 | |
| Samsung Odyssey NP800G5M-X01US | |
| iperf3 receive AX12 | |
| HP Pavilion 15t-bc200 X7P44AV | |
| Asus FX502VM-AS73 | |
| Samsung Odyssey NP800G5M-X01US | |
Accessories
There are no included extras in the box beyond the AC adapter and a Quick Start guide. Samsung sells generic accessories such as backpacks and carrying bags designed for notebooks this size if needed.
Maintenance
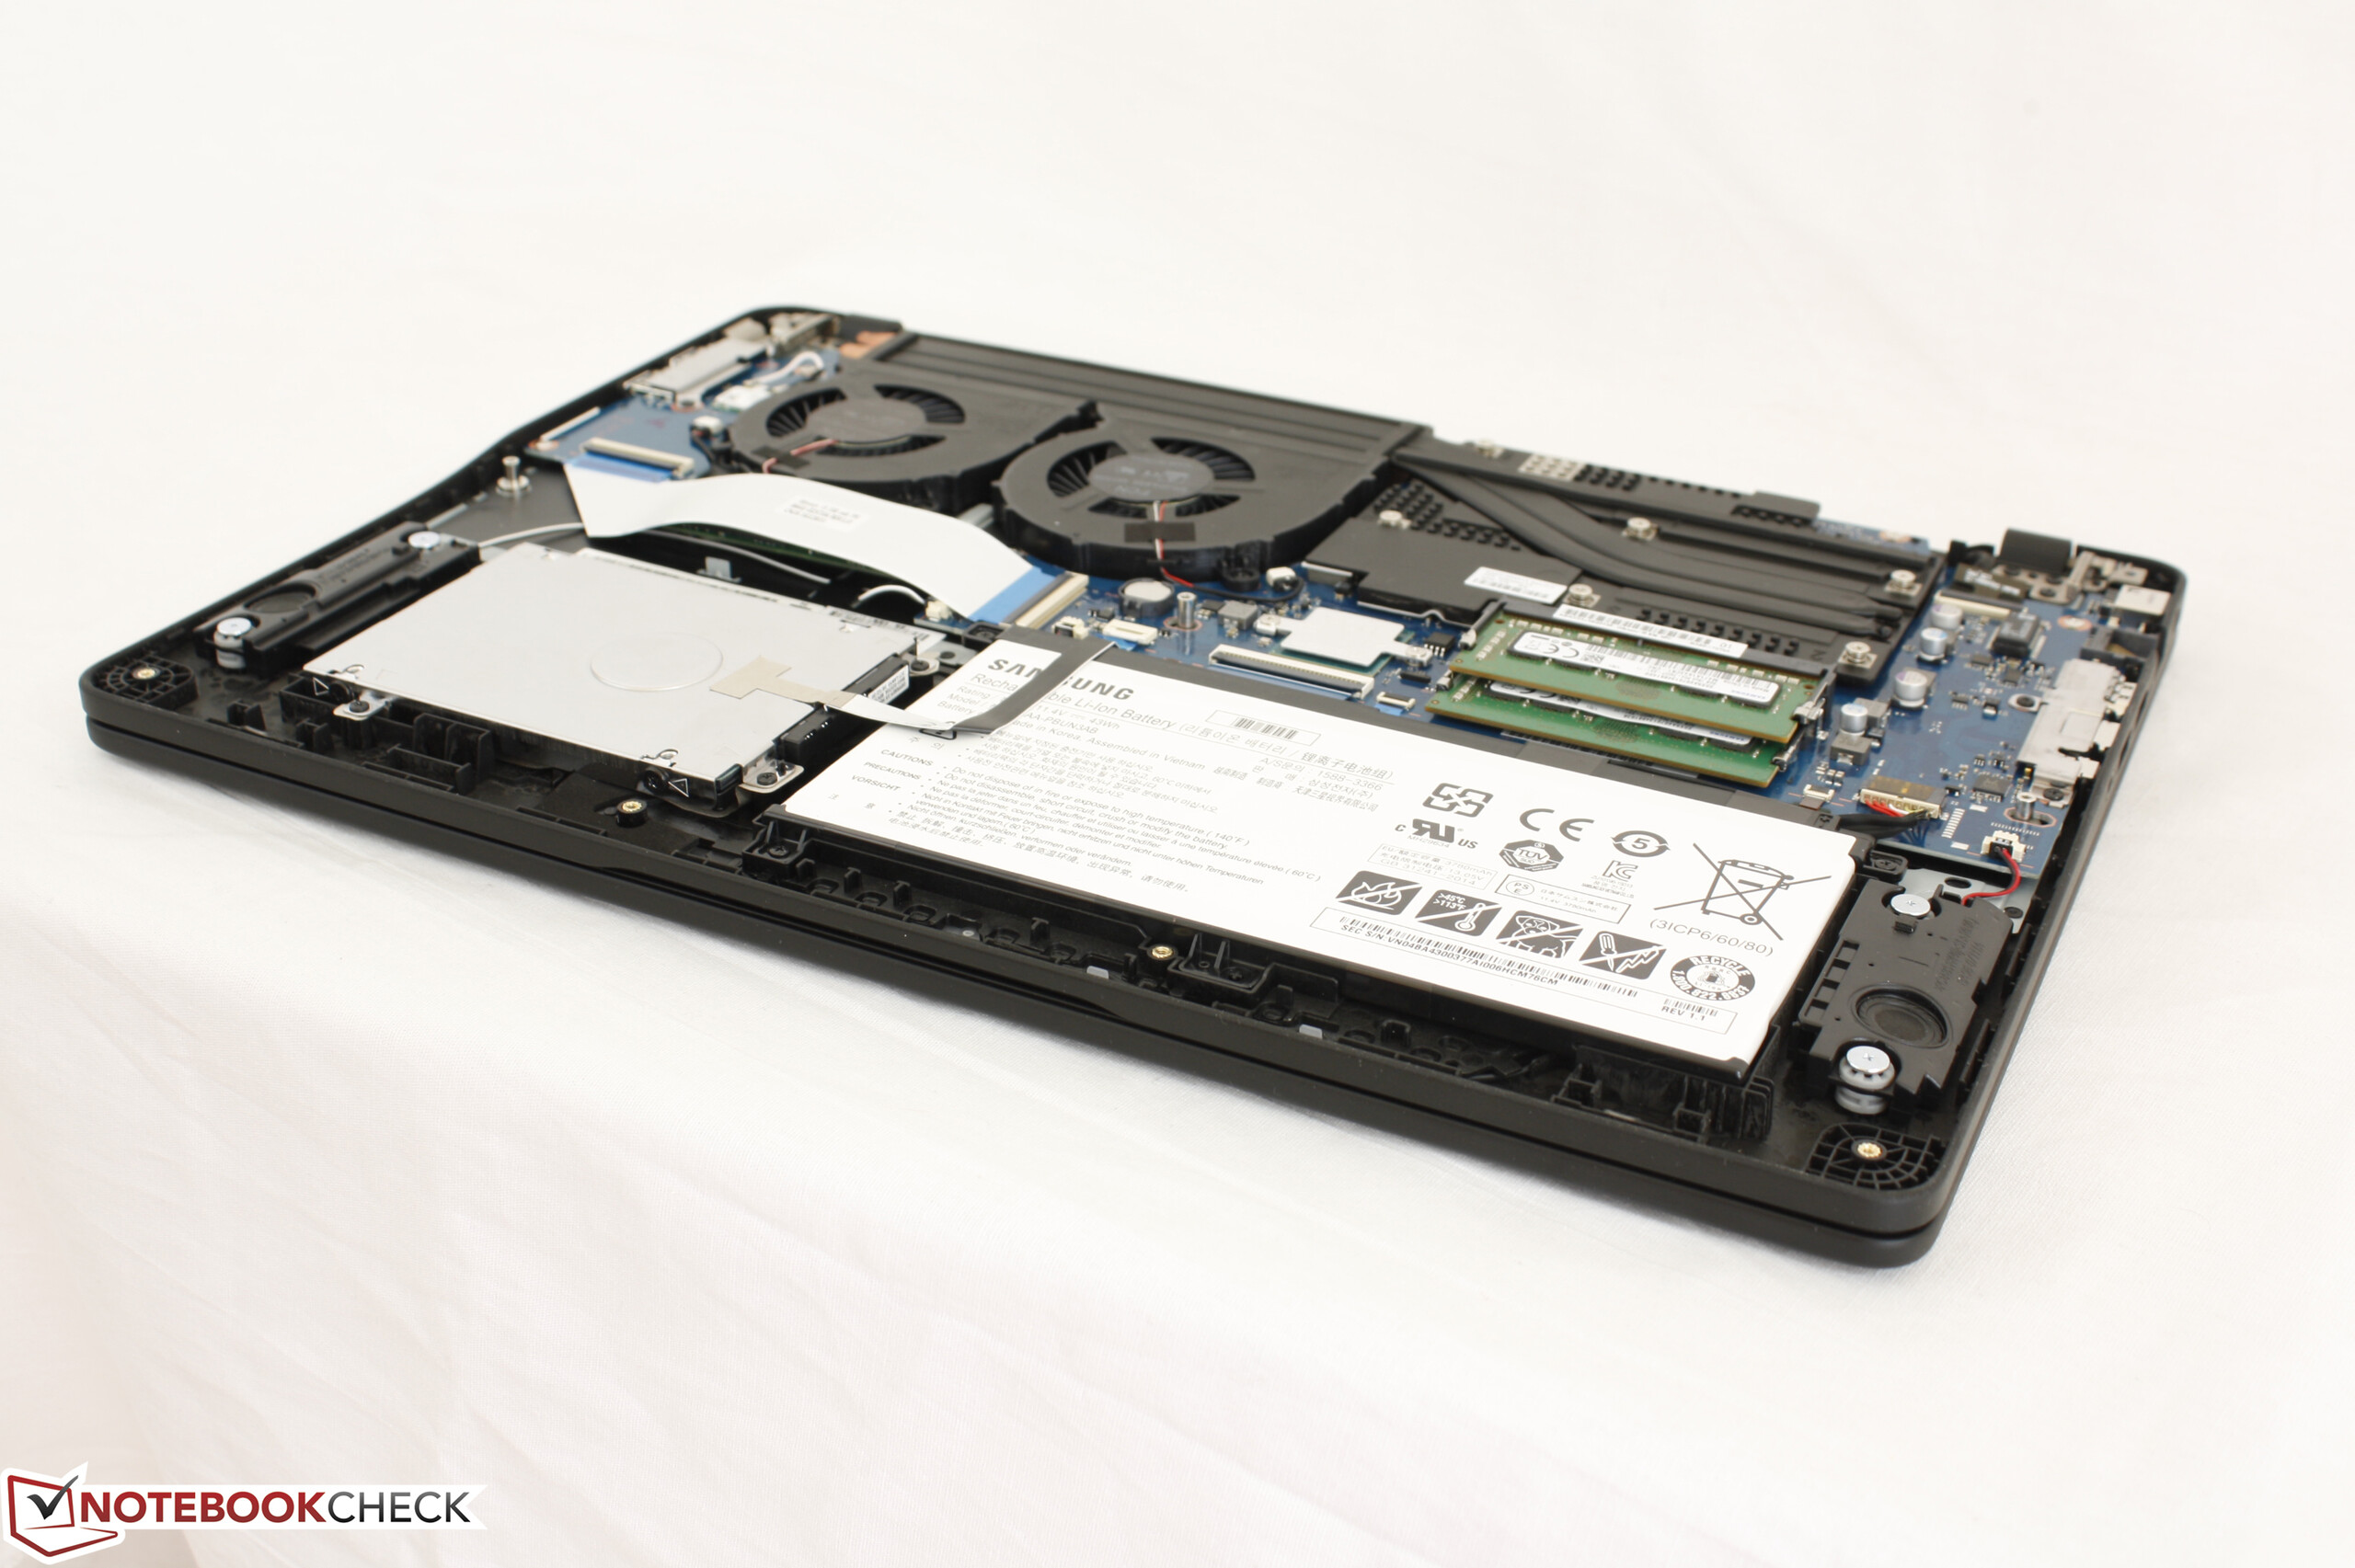
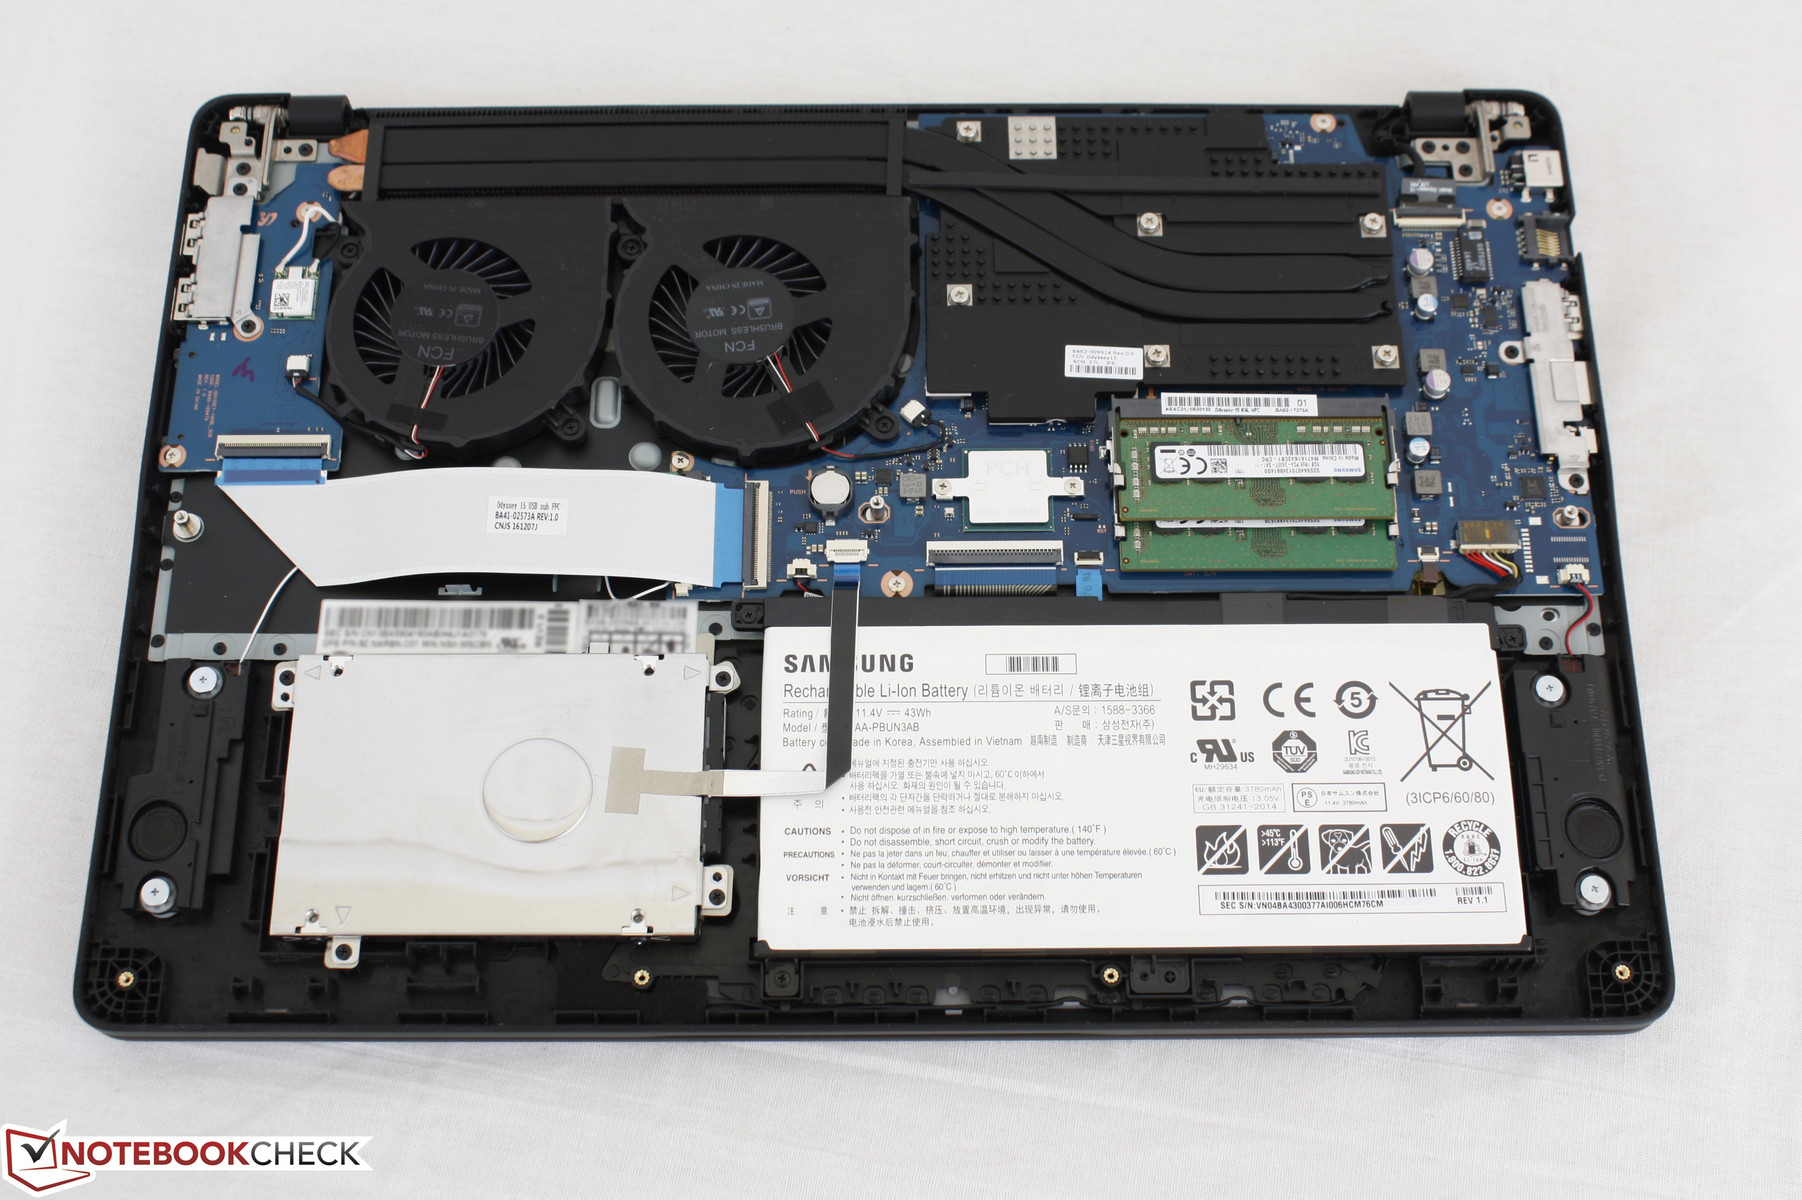
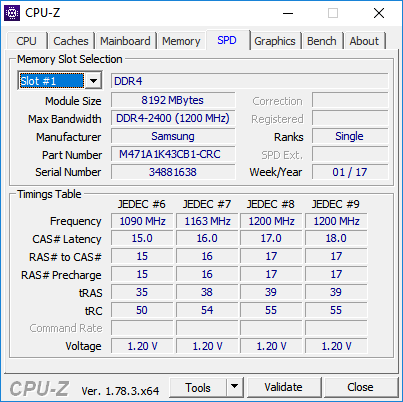
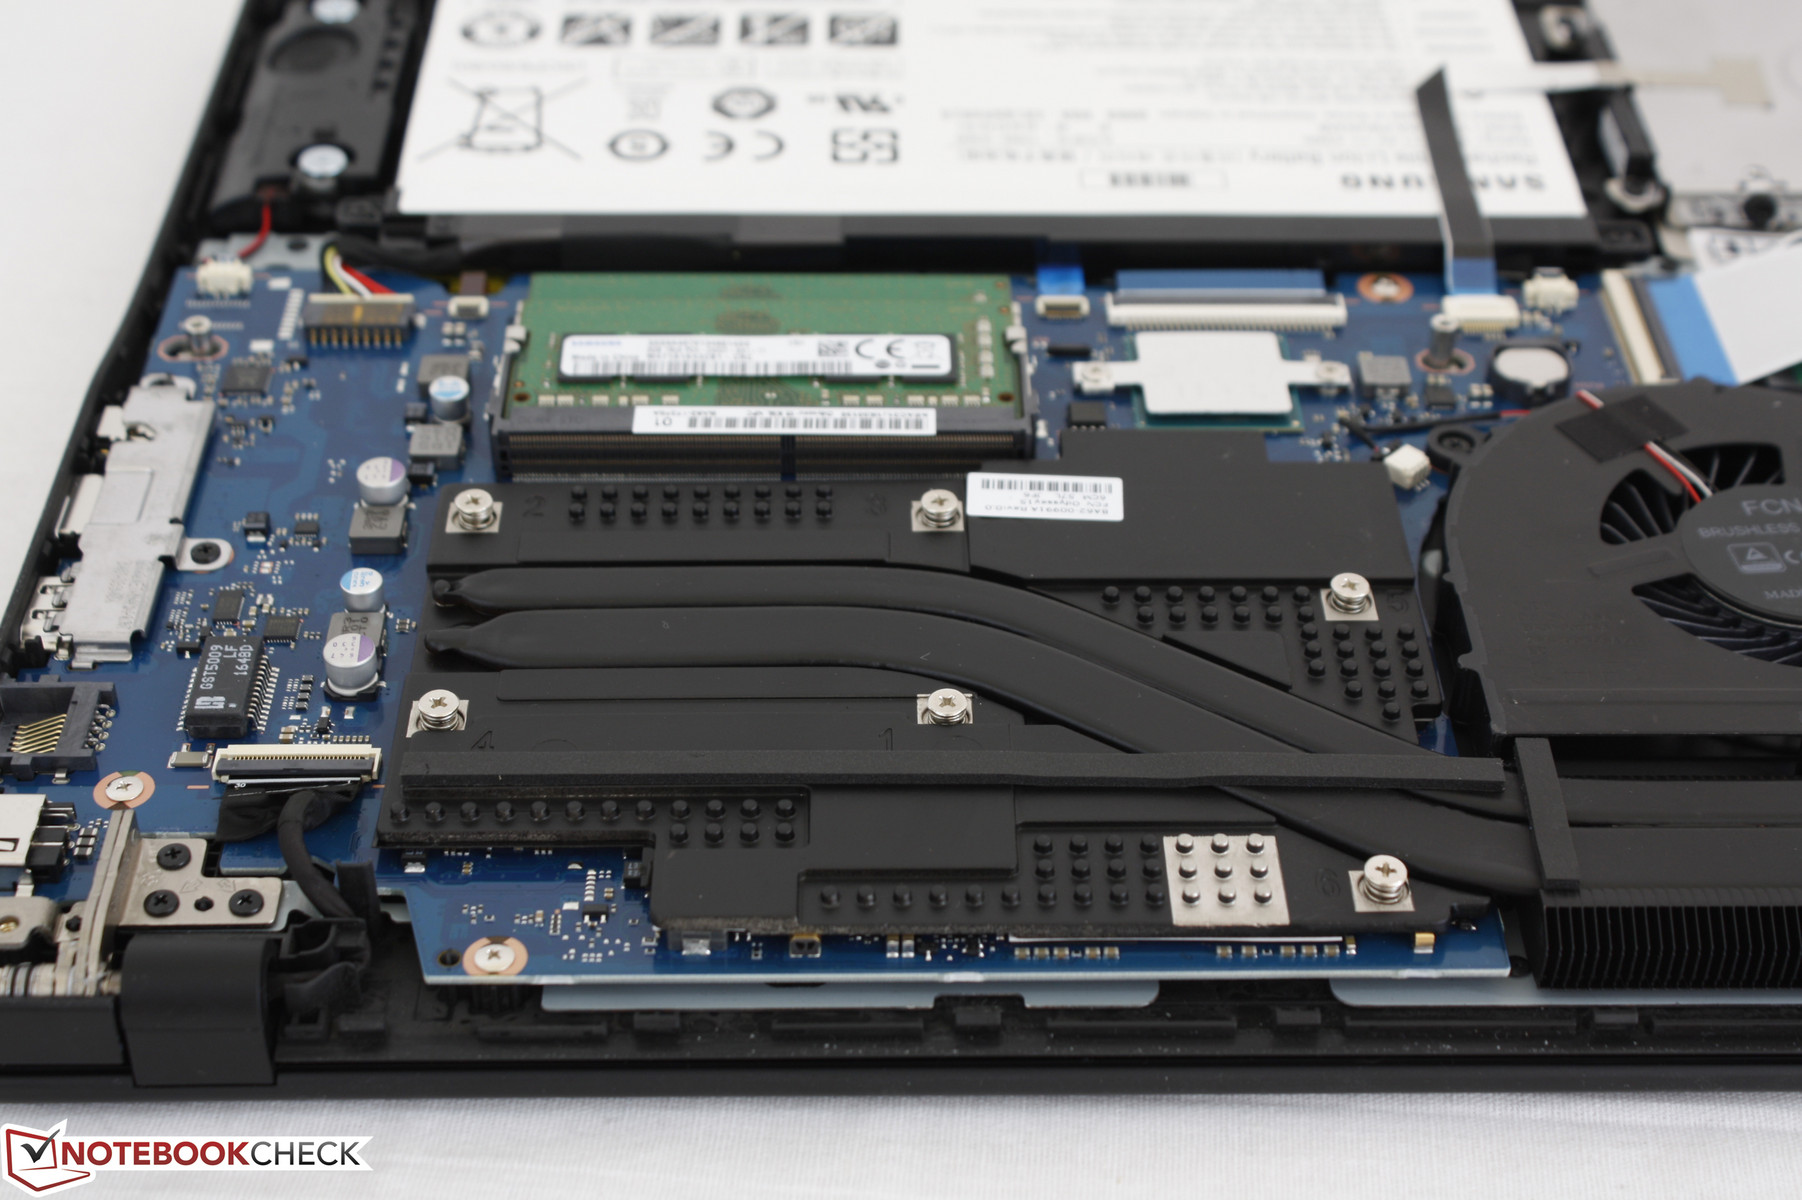
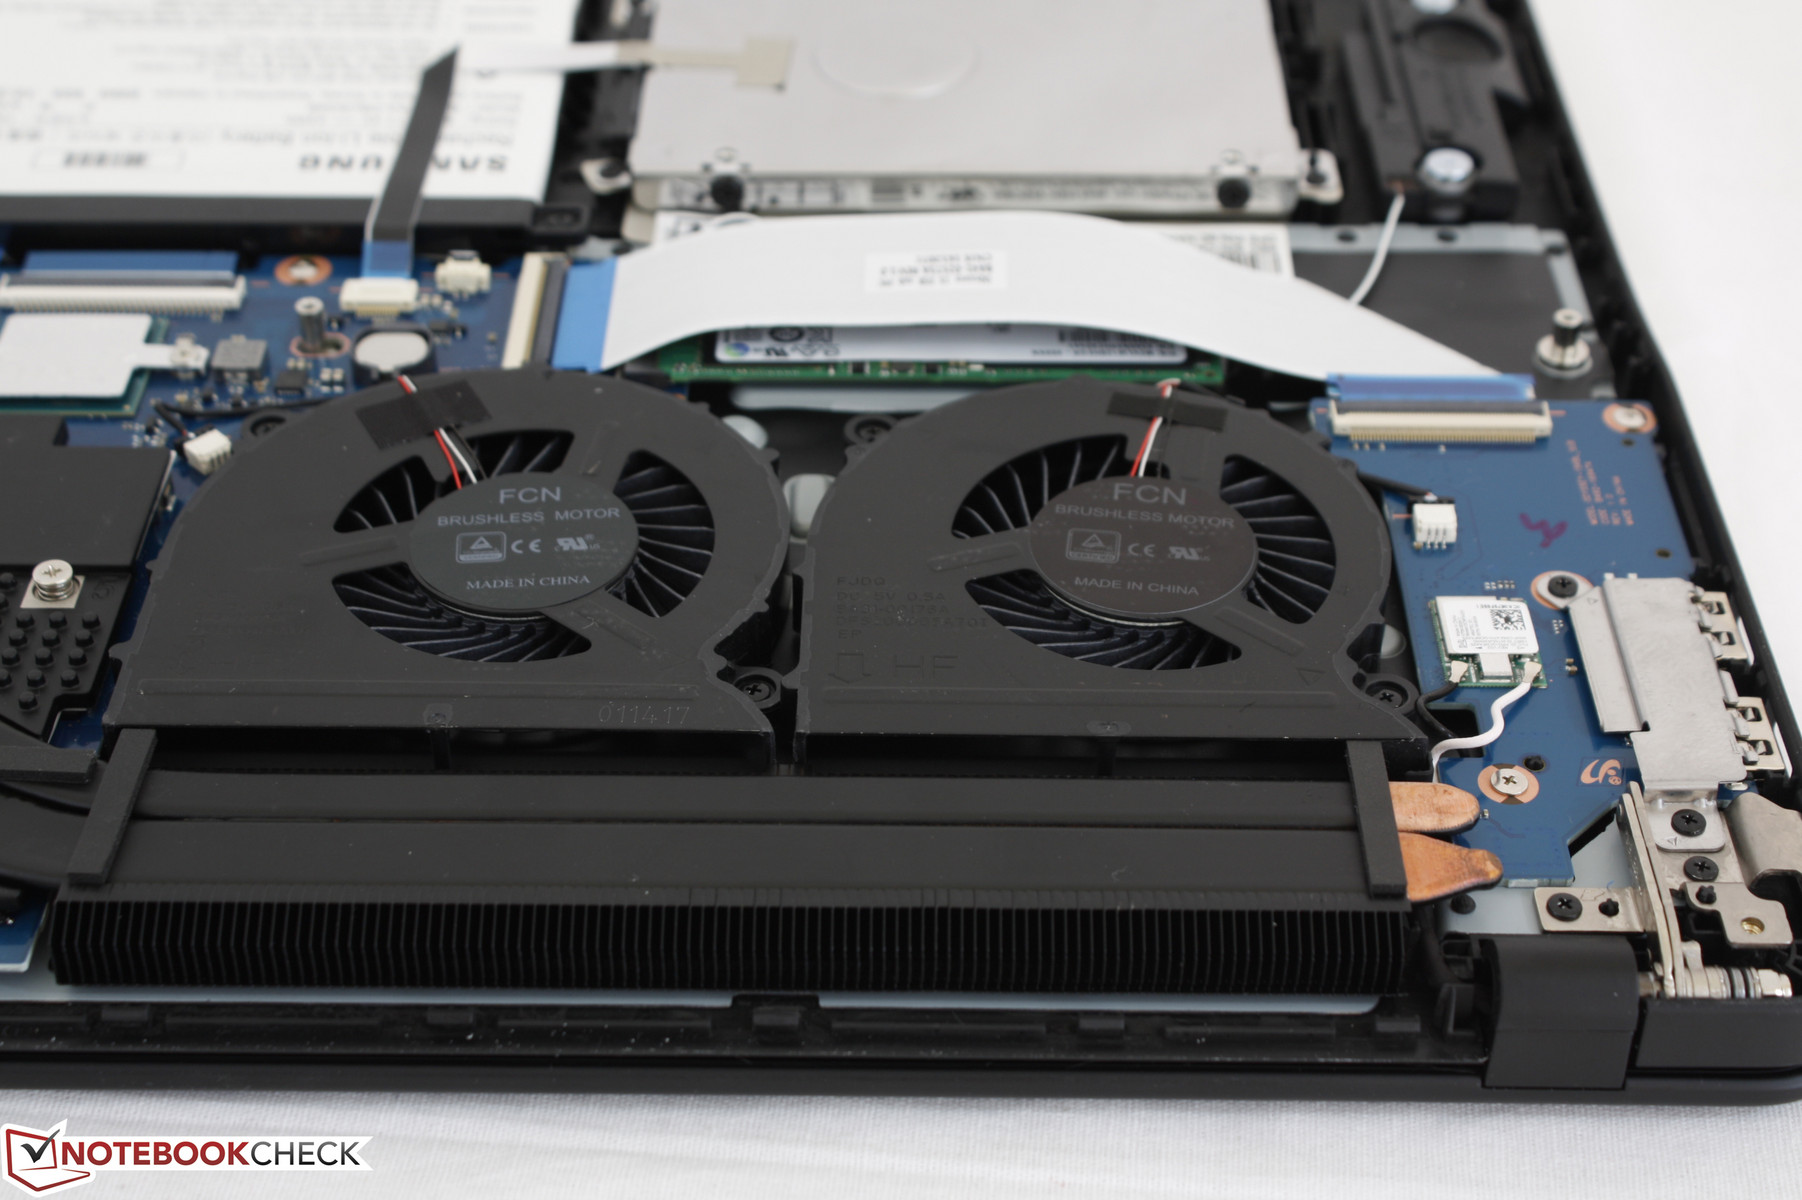
Samsung advertises an easy honeycomb-like "upgrade door" on the back of the unit for swapping storage and memory. Unfortunately, this small "door" is latched quite tightly around its edges and corners and is difficult to remove. We recommend removing the entire bottom panel instead as all that is needed is a Philips screwdriver and a sharp edge. The rear of the panel, however, can be tricky to pry open because of the surrounding hinges and rear ventilation grilles. Once removed, users will have direct access to the 2x system fans, 2x SODIMM slots, 2x storage drives, and the internal battery.
Warranty
The usual one-year limited manufacturer warranty applies whereas other gaming manufacturers like Gigabyte may offer two years as standard.
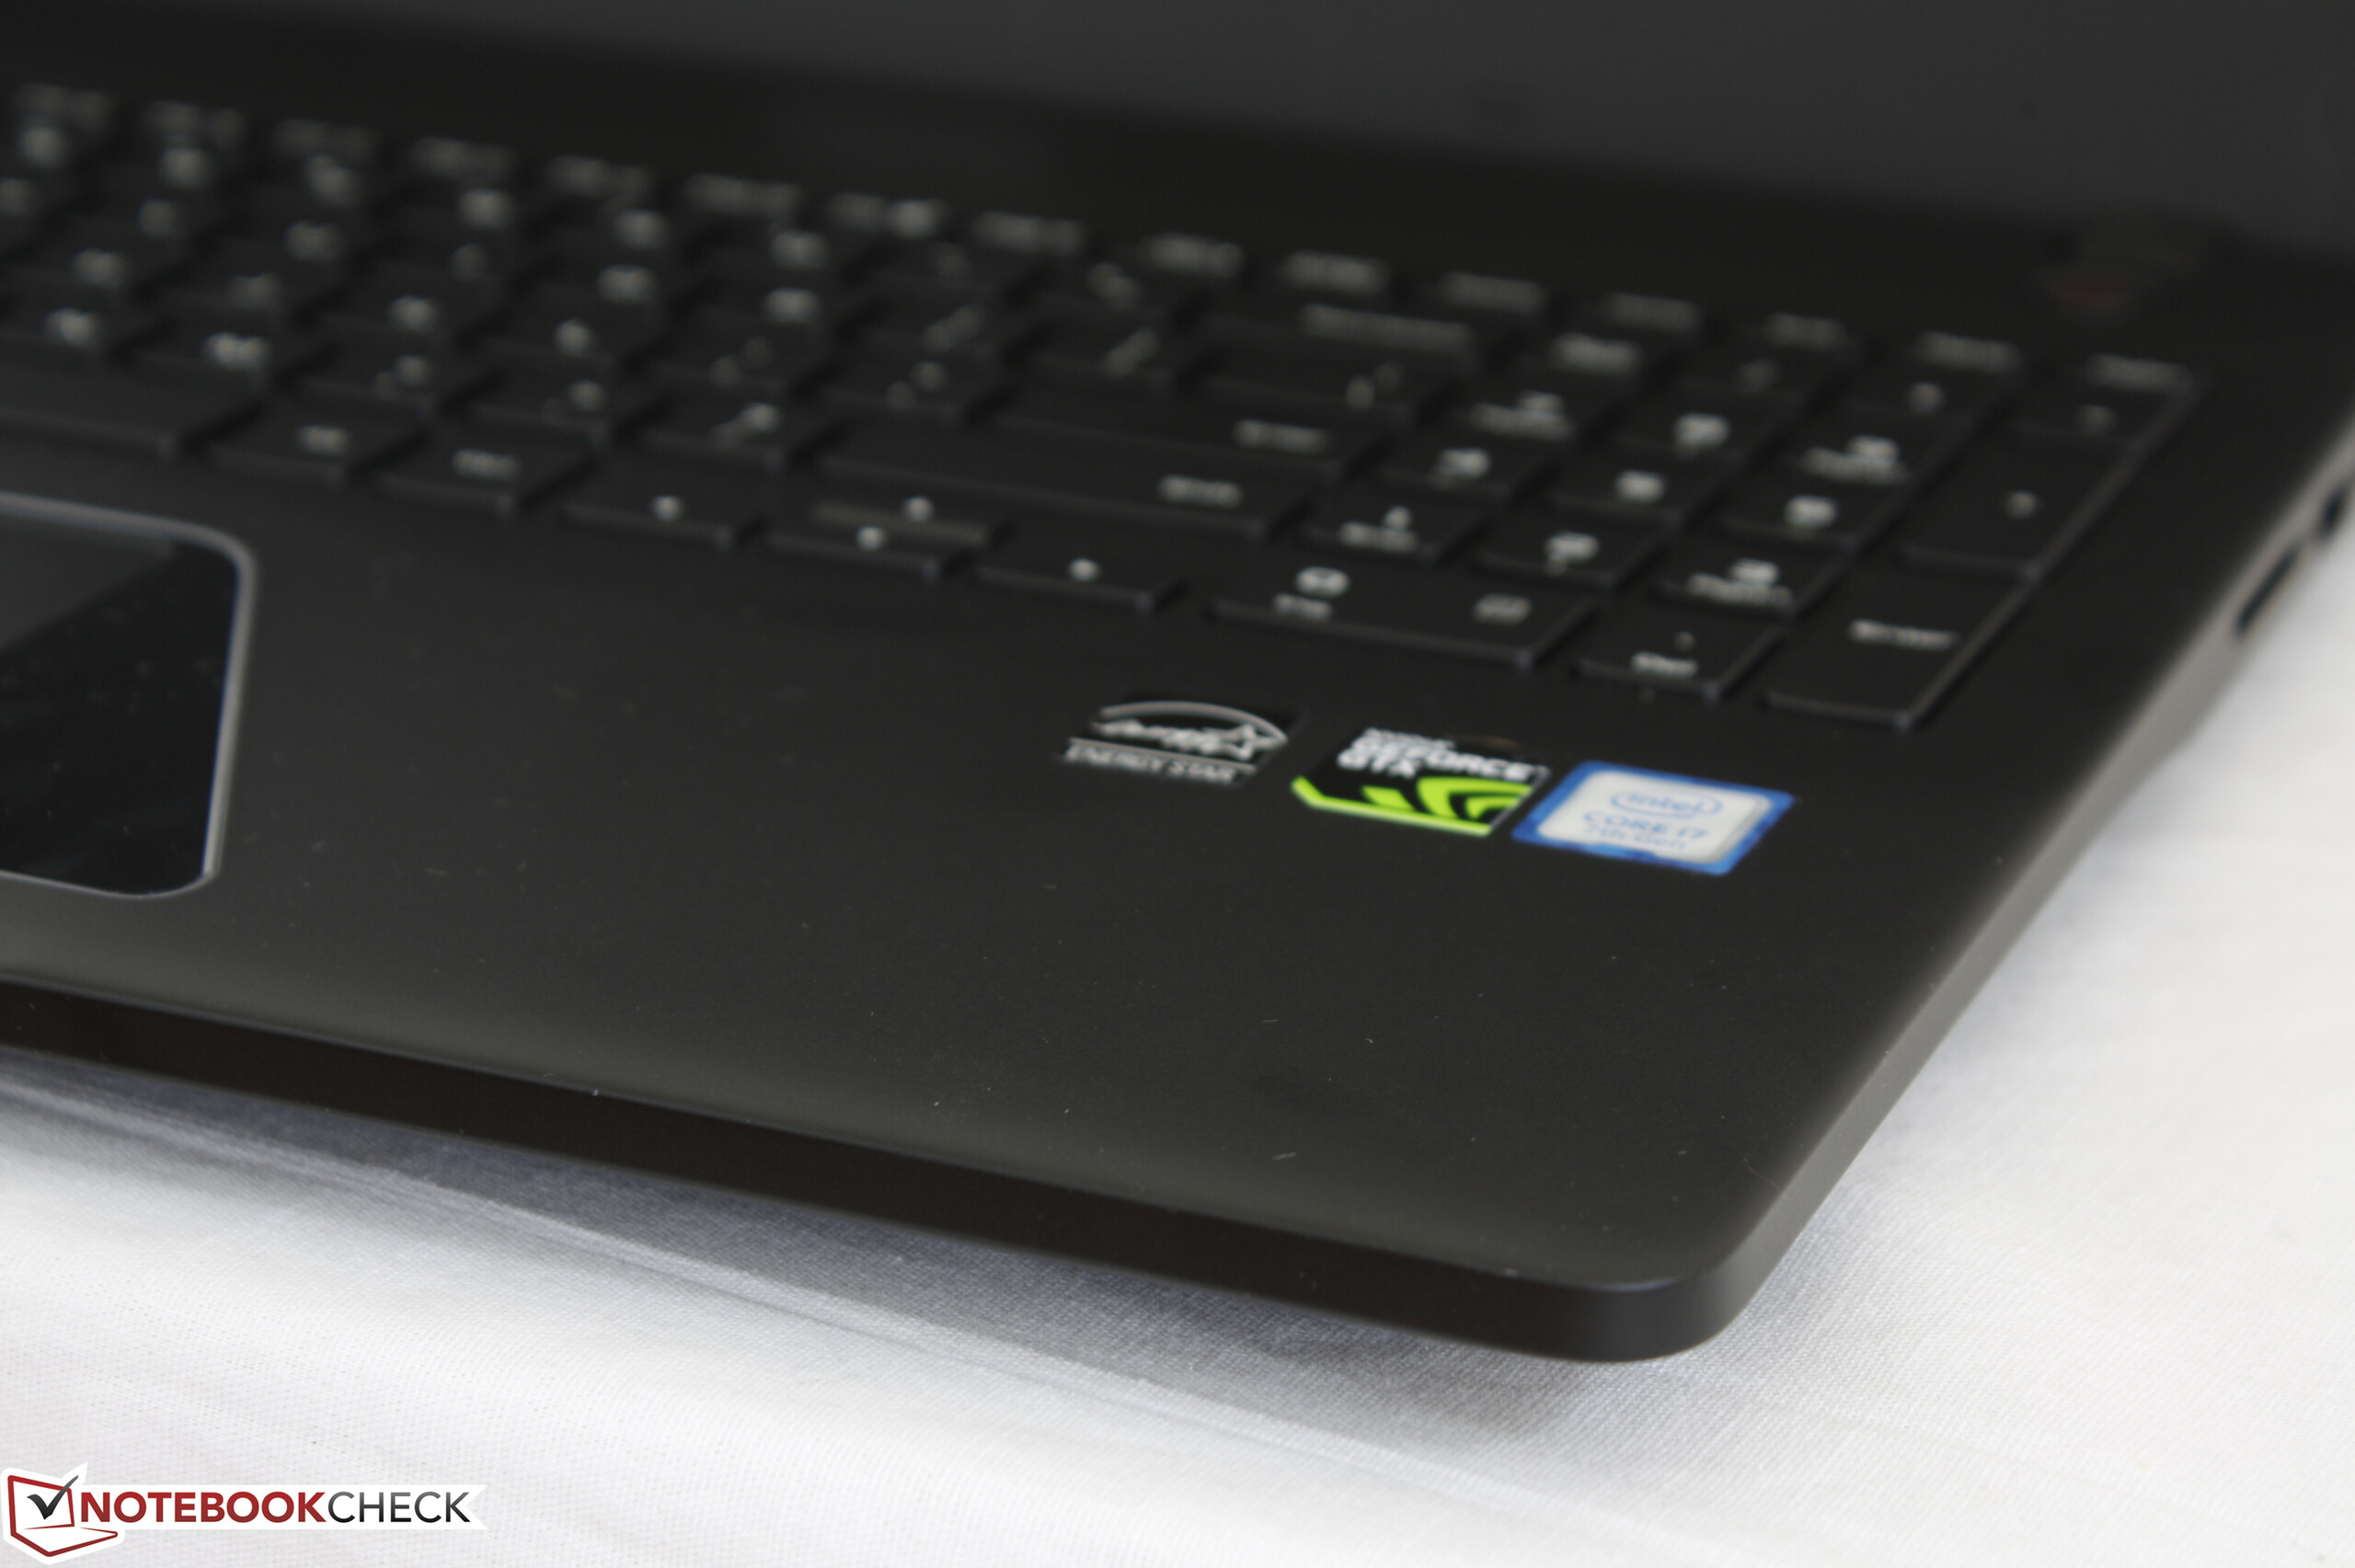
Input Devices
Keyboard
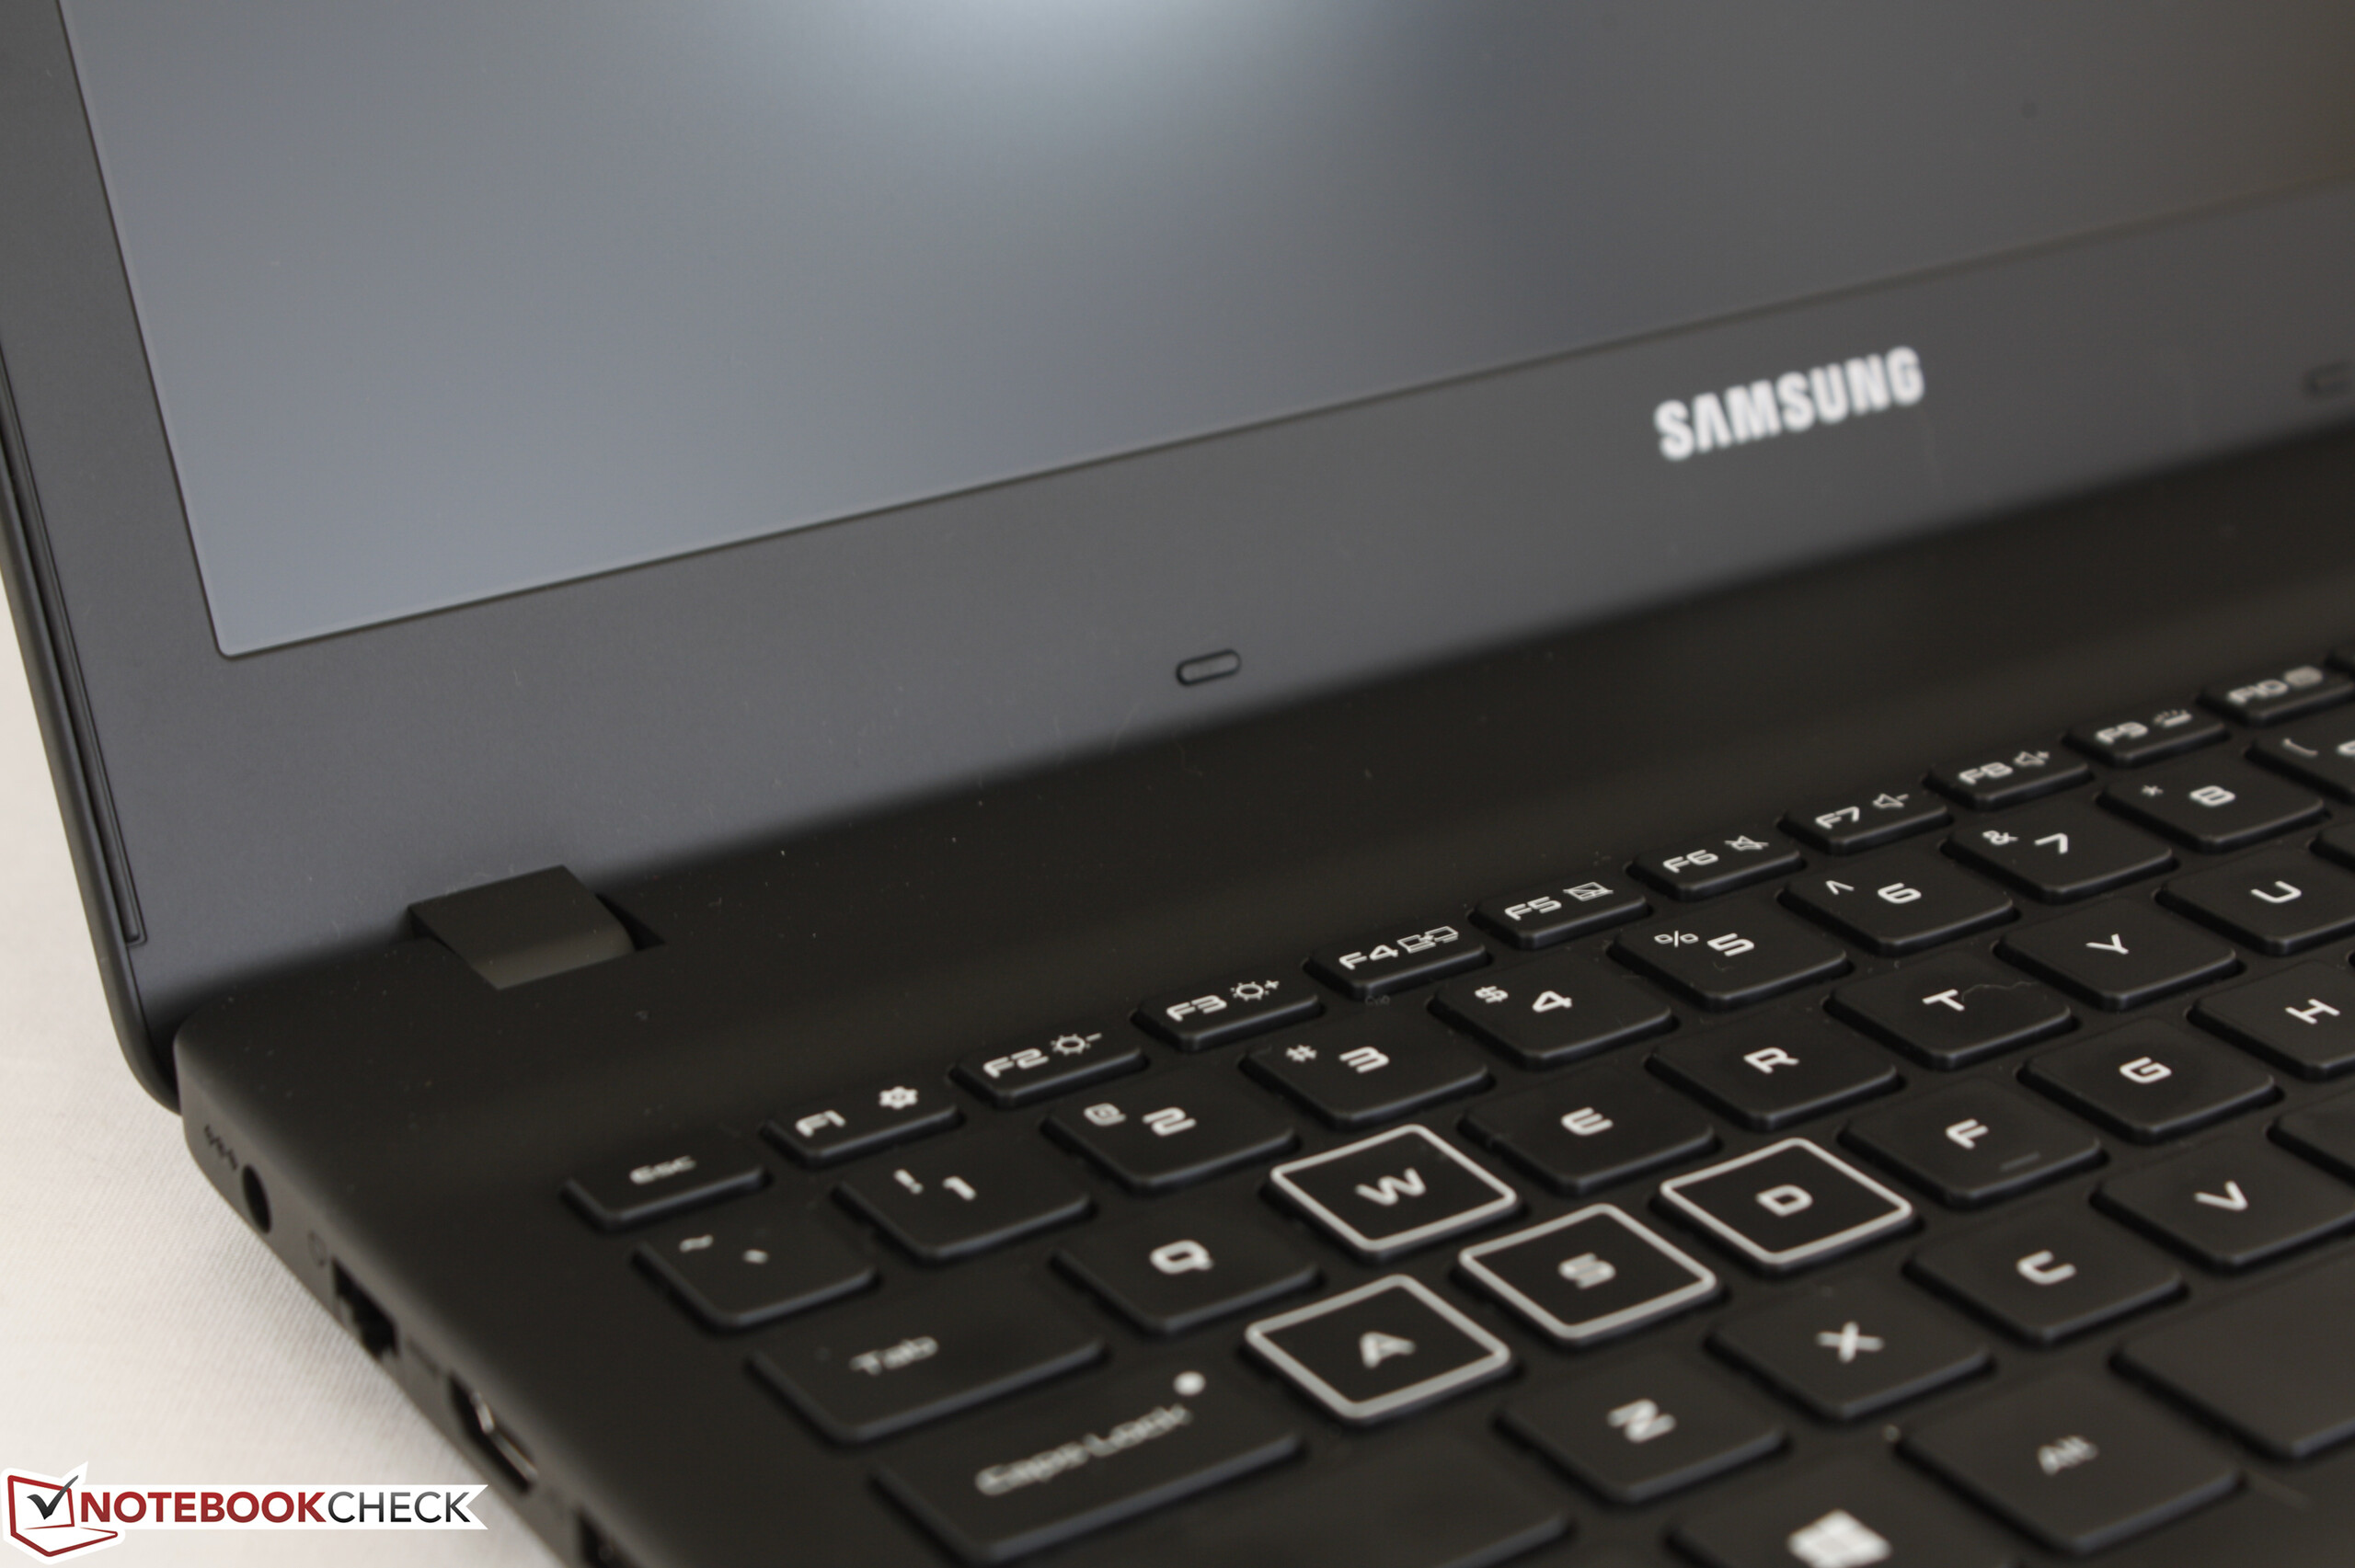
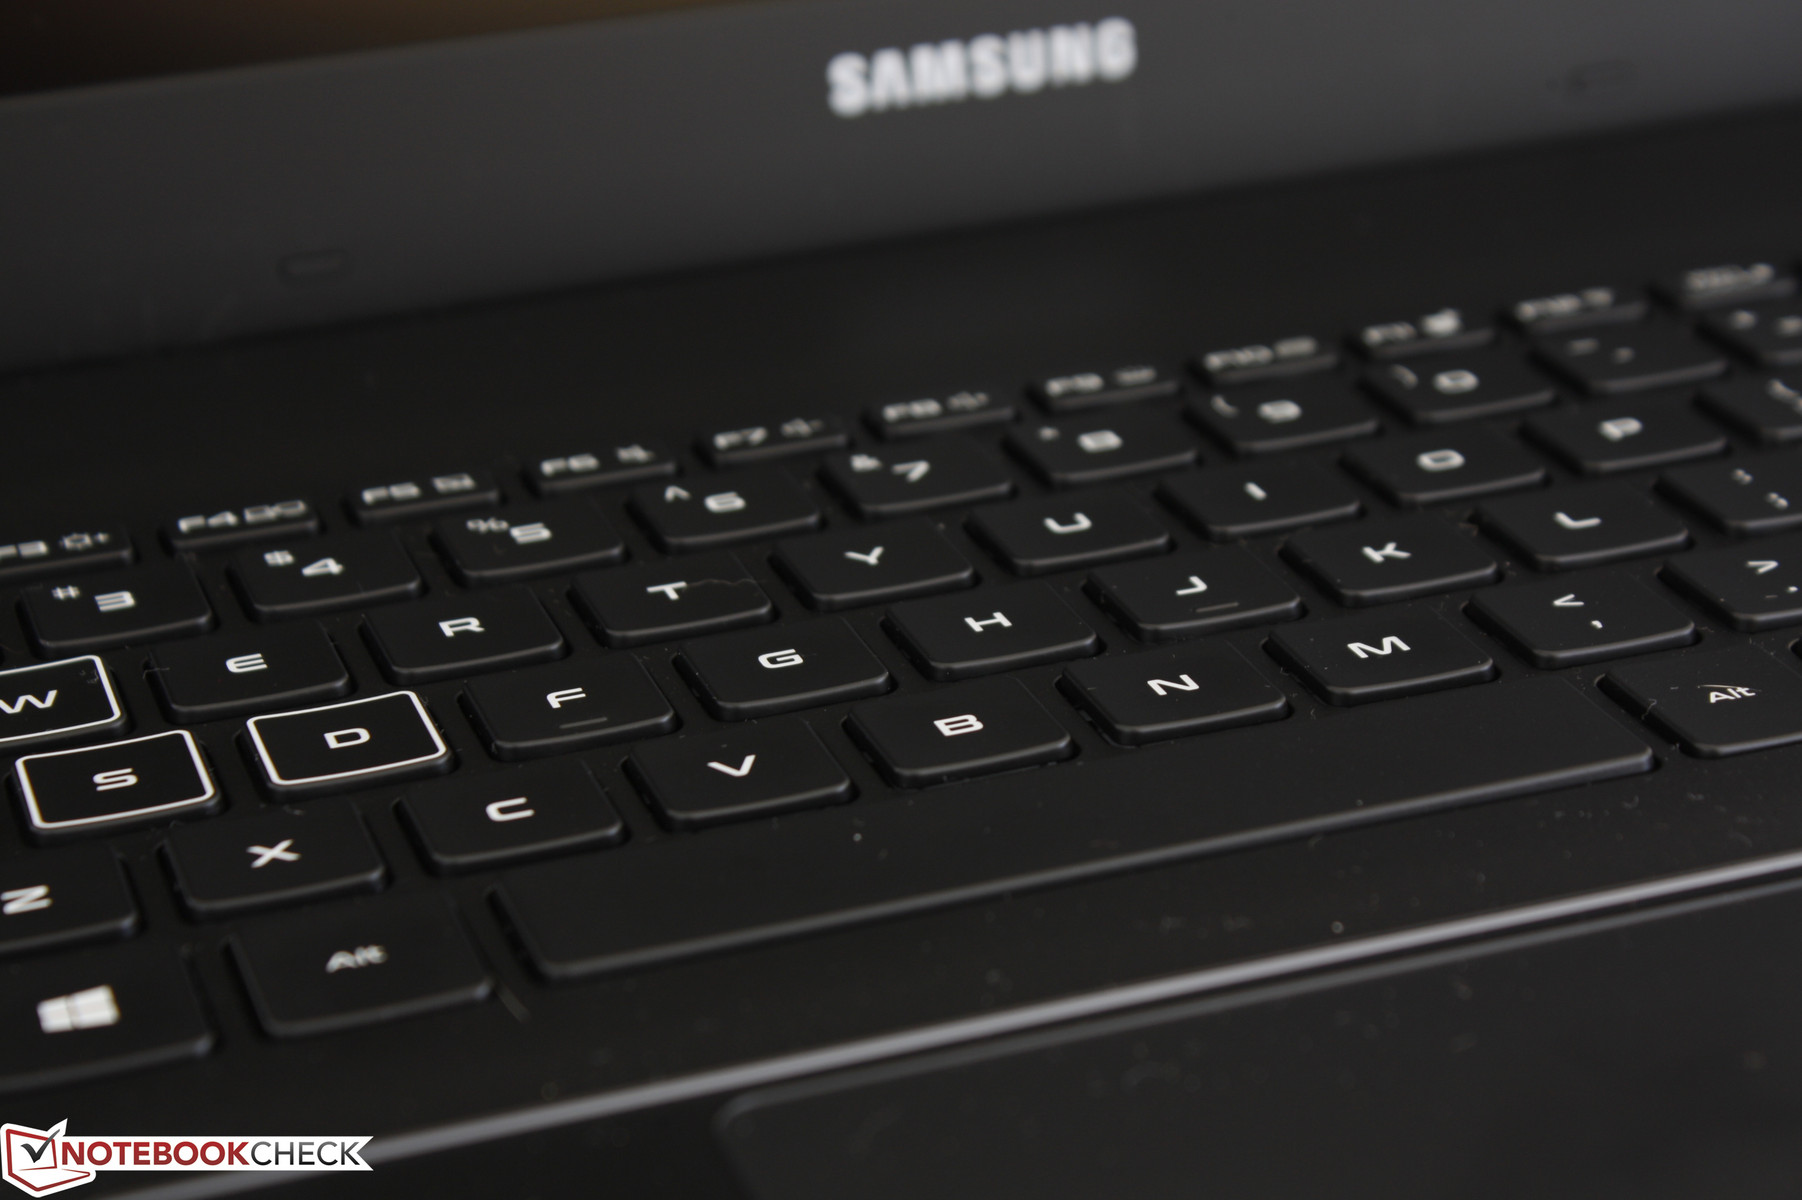
Tactile feedback from the main QWERTY keys is solid and surprisingly not spongy. The main issue is that the keys wiggle in place and have a higher-pitch clatter compared to other notebooks in this size category. The keyboard keys on an Asus GL series or MSI GT series are relatively firmer and quieter due to their more unyielding designs, so the typing experience is somewhat louder on the Odyssey. Key feedback is not entirely even across all keys either as the NumPad keys are physically smaller than the QWERTY keys and are noticeably spongier in feedback.
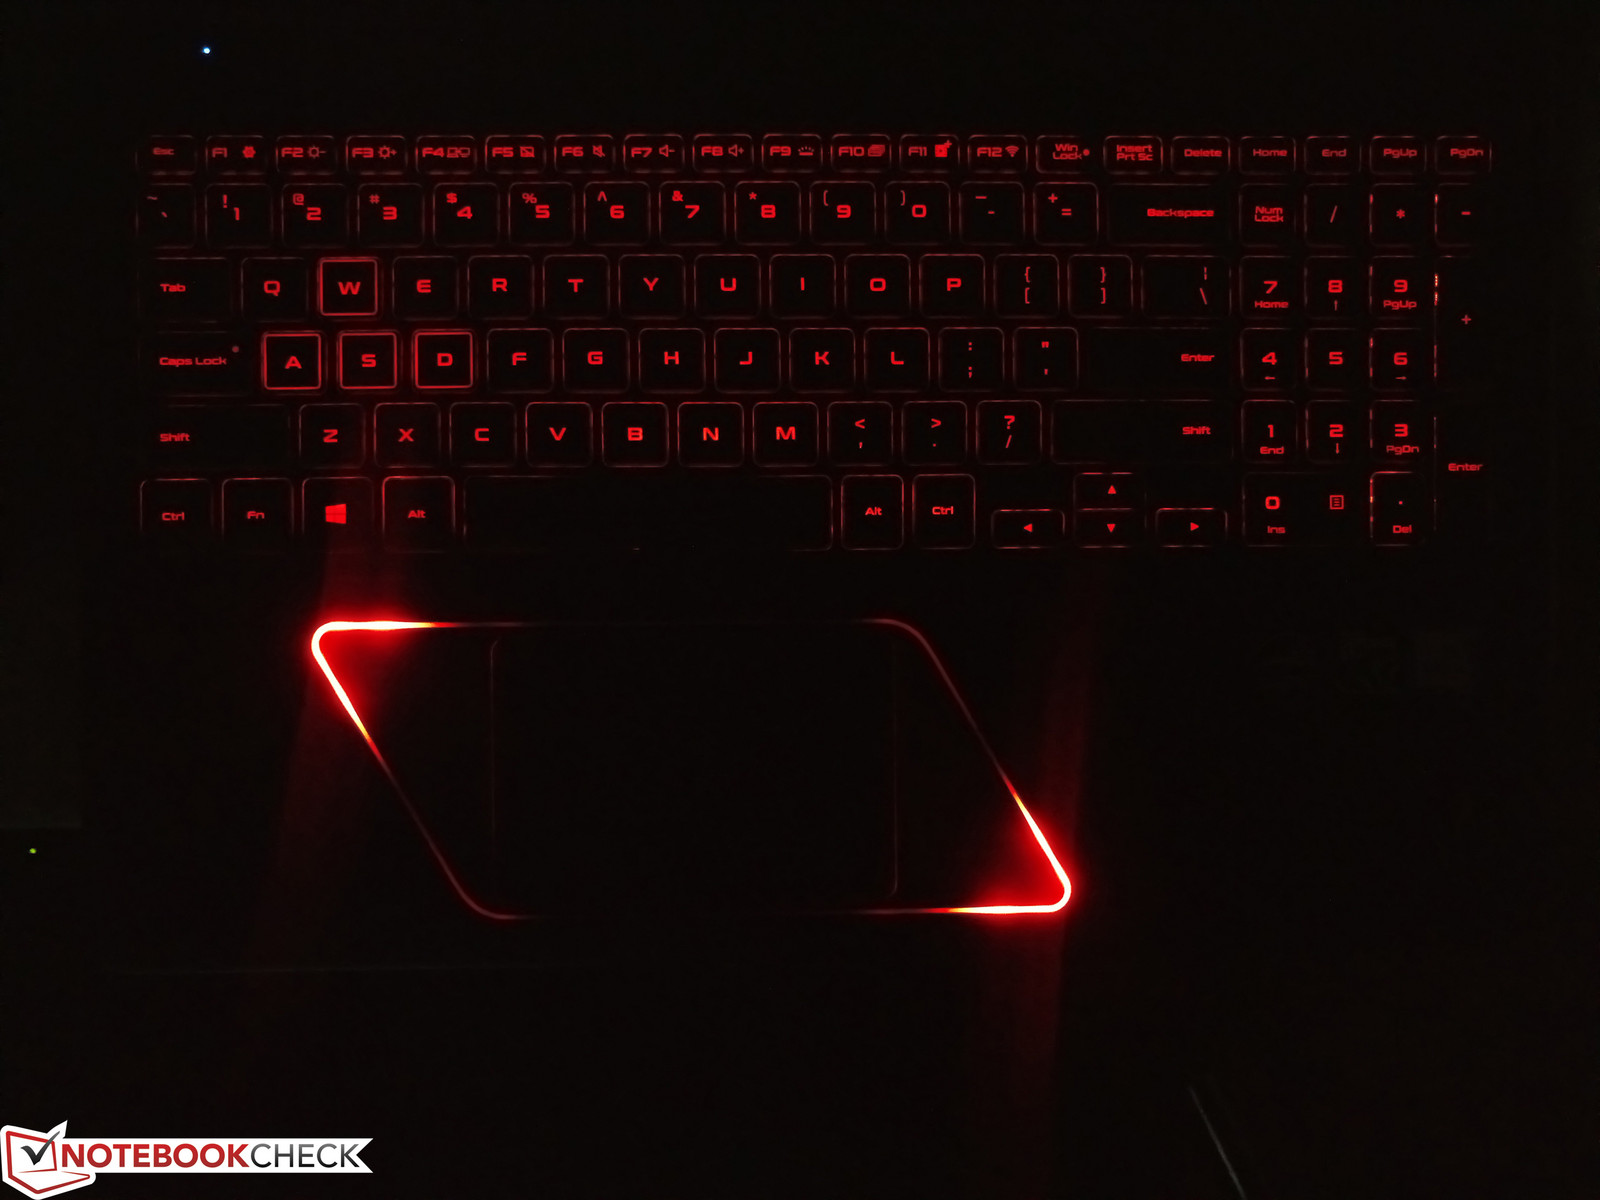
A standard three-level red backlight is available not unlike on most Asus gaming systems. The glossy zone around the trackpad will light red as well as a purely aesthetic feature in order to visually distinguish the Odyssey from other gaming systems. The problem is that this zone is much brighter than the keyboard keys and can thus be distracting when on the highest brightness level.
Touchpad
The ELAN-controlled integrated trackpad (~10.3 x 7.0 cm) performs reliably for simple cursor control with no jitters or dead zones. Glide is slightly rougher on the plastic surface compared to the trackpads on the MSI series, but it is at least firmer than the trackpad on the Pavilion 15t. The integrated mouse keys are shallow in travel and sound muffled when pressed. Tactile feedback is subsequently soft and on the weak side, so clicking repeatedly in quick succession is made more difficult than it ought to be.

Display
The non-touchscreen 1080p IPS matte panel comes standard with no other choices. Other gaming notebooks may offer QHD or UHD options, but gaming in resolutions above 1080p would be unwise with the GTX 1050. Our database shows no other notebooks shipping with the exact same BOE NV156FHM-N46 panel, but the NV156FHM-Nxx series of panels can be found on many 15.6-inch machines including the Lenovo IdeaPad 510 and Asus GL553VD.
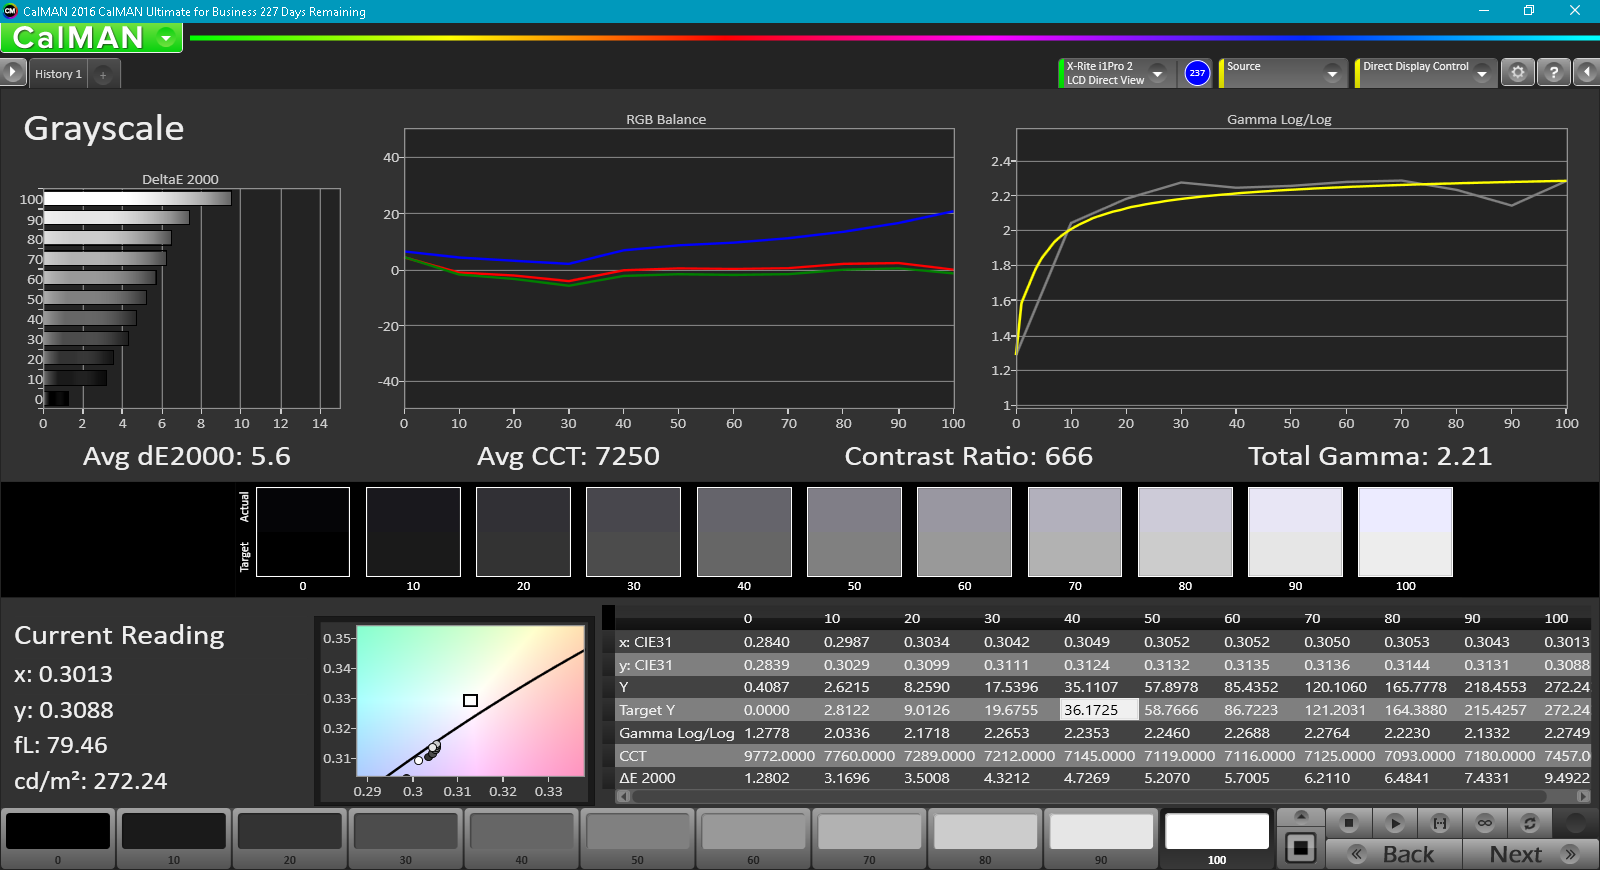
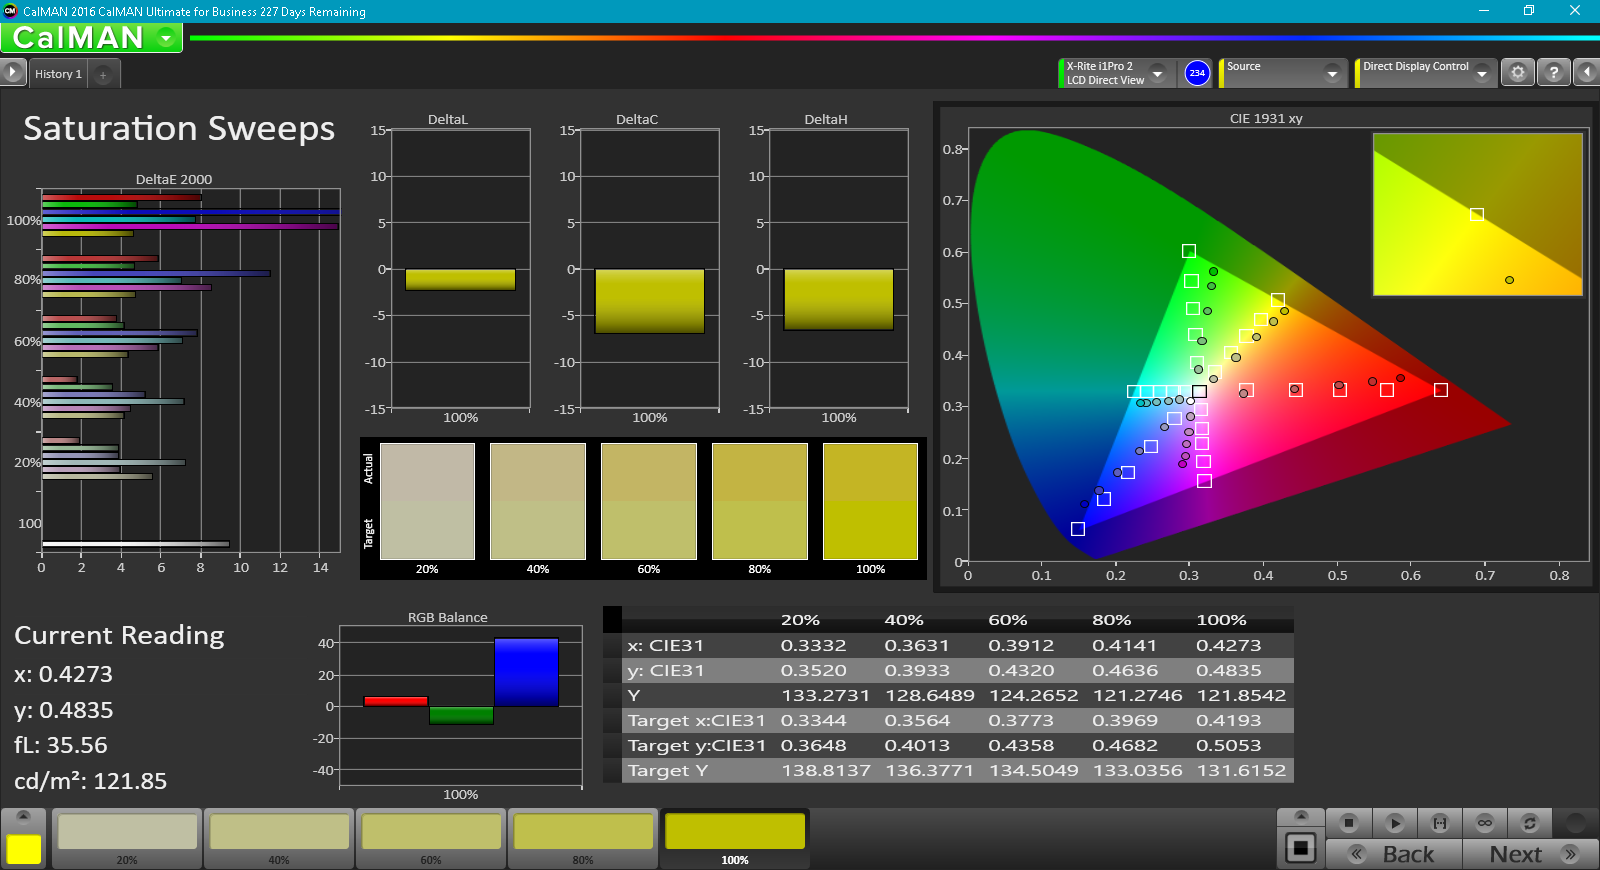
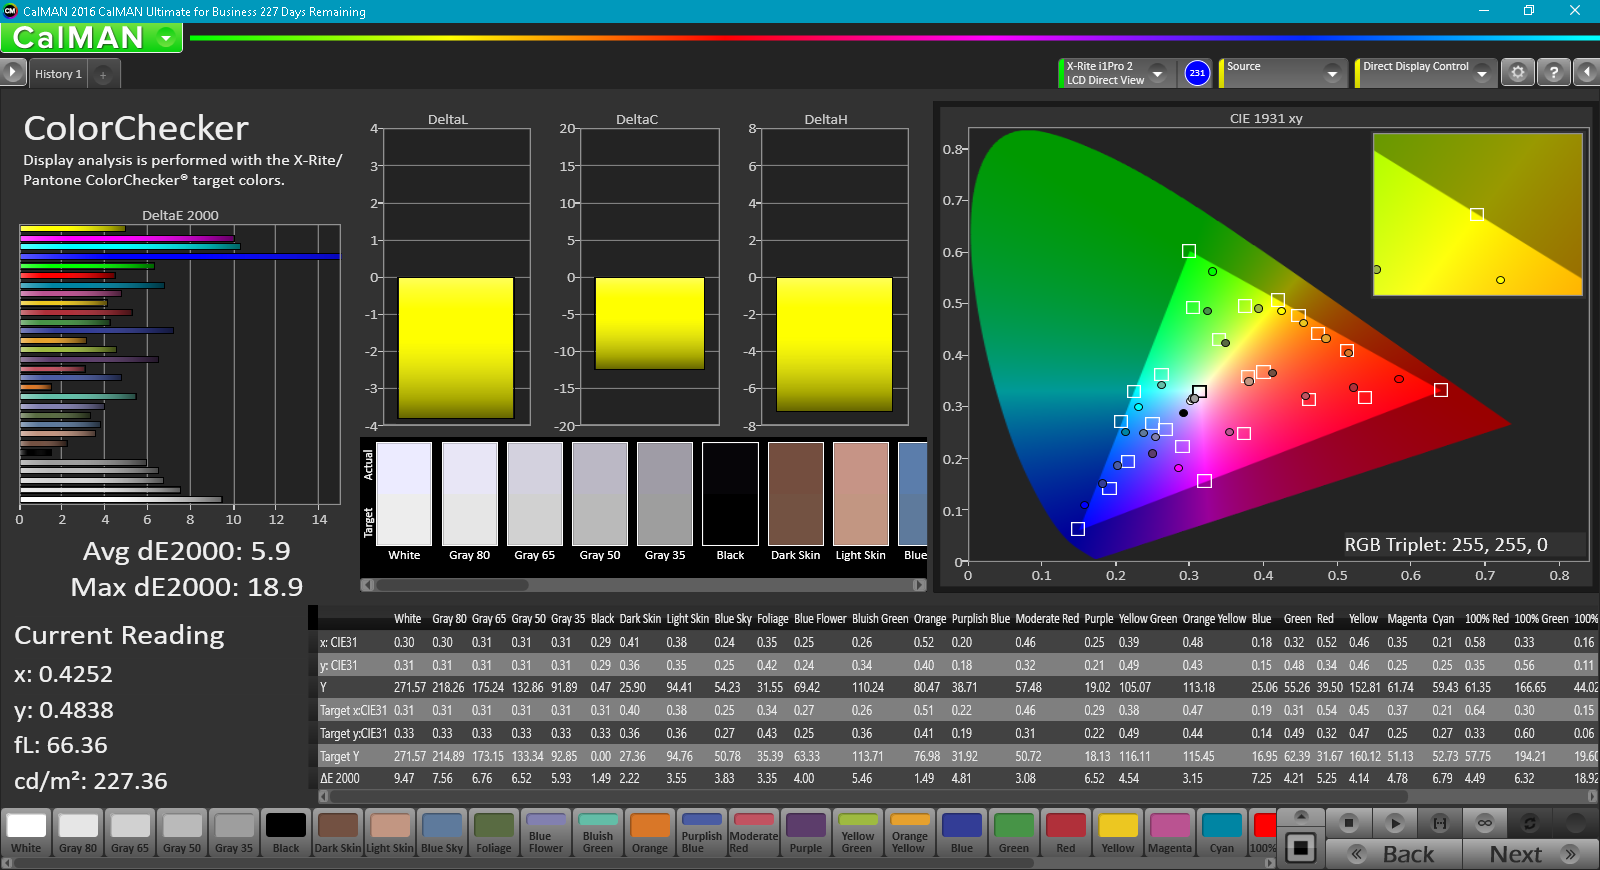
Samsung promises a backlight brightness of 250 nits and that is indeed what our own in-house measurements show on average. Most Ultrabooks can be much brighter at well over 300 nits, so the 200 nit range is more standard on gaming notebooks where very high brightness levels are less of a concern in practice. Contrast is unimpressive at about 533:1 compared to almost twice that on pricier gaming notebooks from Alienware or Gigabyte. Subjectively, however, texts and images are still sharp with no distracting color grains that can sometimes plague matte panels. Slight backlight bleeding is present on the bottom and top corners of our test unit that is fortunately largely unnoticeable when gaming or during video playback.


| |||||||||||||||||||||||||
Brightness Distribution: 90 %
Center on Battery: 255.9 cd/m²
Contrast: 533:1 (Black: 0.48 cd/m²)
ΔE ColorChecker Calman: 5.9 | ∀{0.5-29.43 Ø4.71}
ΔE Greyscale Calman: 5.6 | ∀{0.09-98 Ø4.96}
70.1% sRGB (Argyll 1.6.3 3D)
44.8% AdobeRGB 1998 (Argyll 1.6.3 3D)
48.71% AdobeRGB 1998 (Argyll 3D)
70.4% sRGB (Argyll 3D)
47.11% Display P3 (Argyll 3D)
Gamma: 2.21
CCT: 7250 K
| Samsung Odyssey NP800G5M-X01US IPS, 15.6", 1920x1080 | Asus FX502VM-AS73 TN LED, 15.6", 1920x1080 | HP Pavilion 15t-bc200 X7P44AV LGD04D4, , 15.6", 3840x2160 | Dell XPS 15 2017 9560 (7300HQ, Full-HD) Sharp SHP1453 LQ156M1, LED IGZO IPS InfinityEdge, 15.6", 1920x1080 | Gigabyte P55W v7 LG Philips LP156WF6 (LGD046F), IPS, 15.6", 1920x1080 | Apple MacBook Pro 15 2016 (2.9 GHz, 460) Apple APPA030, IPS, 15.4", 2880x1800 | |
|---|---|---|---|---|---|---|
| Display | -19% | 34% | 44% | 25% | 77% | |
| Display P3 Coverage (%) | 47.11 | 38.28 -19% | 63 34% | 68.9 46% | 63.5 35% | 99 110% |
| sRGB Coverage (%) | 70.4 | 56.9 -19% | 94.4 34% | 98.9 40% | 82 16% | 100 42% |
| AdobeRGB 1998 Coverage (%) | 48.71 | 39.47 -19% | 64.8 33% | 70.9 46% | 59.9 23% | 87.3 79% |
| Response Times | 30% | 24% | -48% | 16% | -43% | |
| Response Time Grey 50% / Grey 80% * (ms) | 38.8 ? | 28.4 ? 27% | 30.4 ? 22% | 54 ? -39% | 37 ? 5% | 46 ? -19% |
| Response Time Black / White * (ms) | 33.6 ? | 22.4 ? 33% | 24.8 ? 26% | 52.4 ? -56% | 25 ? 26% | 56 ? -67% |
| PWM Frequency (Hz) | 19230 ? | 119000 ? | ||||
| Screen | -8% | 15% | 46% | 28% | 61% | |
| Brightness middle (cd/m²) | 255.9 | 209.5 -18% | 259 1% | 400 56% | 287 12% | 420 64% |
| Brightness (cd/m²) | 249 | 205 -18% | 255 2% | 392 57% | 289 16% | 401 61% |
| Brightness Distribution (%) | 90 | 92 2% | 87 -3% | 89 -1% | 87 -3% | 90 0% |
| Black Level * (cd/m²) | 0.48 | 0.69 -44% | 0.51 -6% | 0.26 46% | 0.29 40% | 0.3 37% |
| Contrast (:1) | 533 | 304 -43% | 508 -5% | 1538 189% | 990 86% | 1400 163% |
| Colorchecker dE 2000 * | 5.9 | 4.7 20% | 3.9 34% | 4.9 17% | 4.92 17% | 3.33 44% |
| Colorchecker dE 2000 max. * | 18.9 | 19.7 -4% | 6.9 63% | 11 42% | 11 42% | 5.11 73% |
| Greyscale dE 2000 * | 5.6 | 1.8 68% | 4.5 20% | 7.2 -29% | 3.66 35% | 2.73 51% |
| Gamma | 2.21 100% | 2.23 99% | 2.43 91% | 2.11 104% | 2.32 95% | 2.48 89% |
| CCT | 7250 90% | 6975 93% | 7257 90% | 6911 94% | 6482 100% | 6457 101% |
| Color Space (Percent of AdobeRGB 1998) (%) | 44.8 | 36.2 -19% | 59.5 33% | 64.2 43% | 54 21% | 78.09 74% |
| Color Space (Percent of sRGB) (%) | 70.1 | 56.6 -19% | 98.9 41% | 82 17% | 99.97 43% | |
| Total Average (Program / Settings) | 1% /
-5% | 24% /
21% | 14% /
33% | 23% /
26% | 32% /
50% |
* ... smaller is better
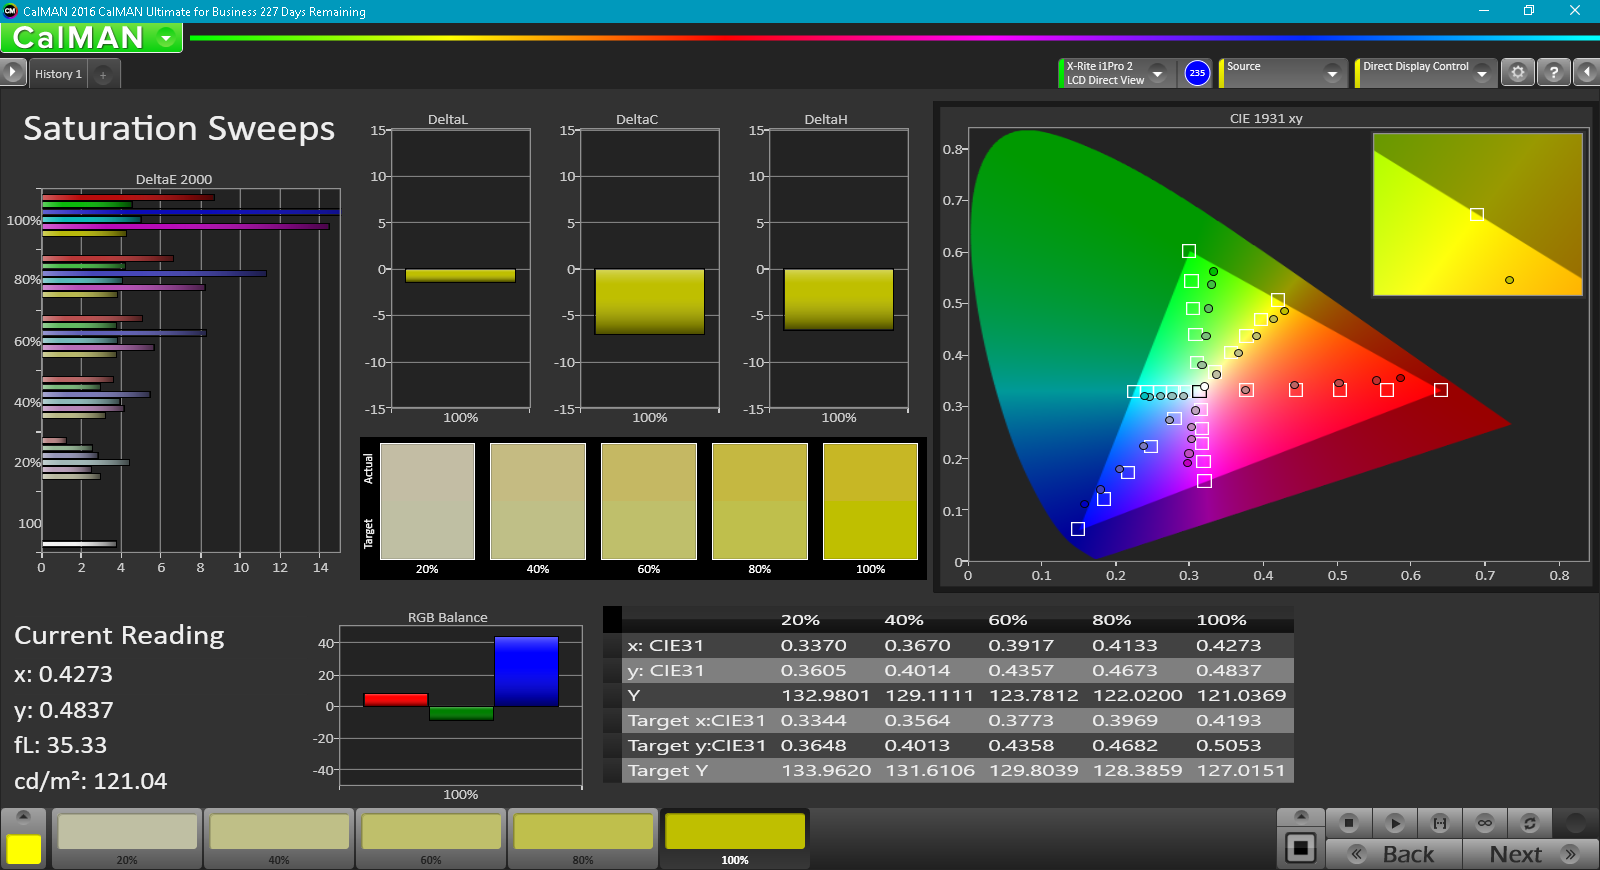
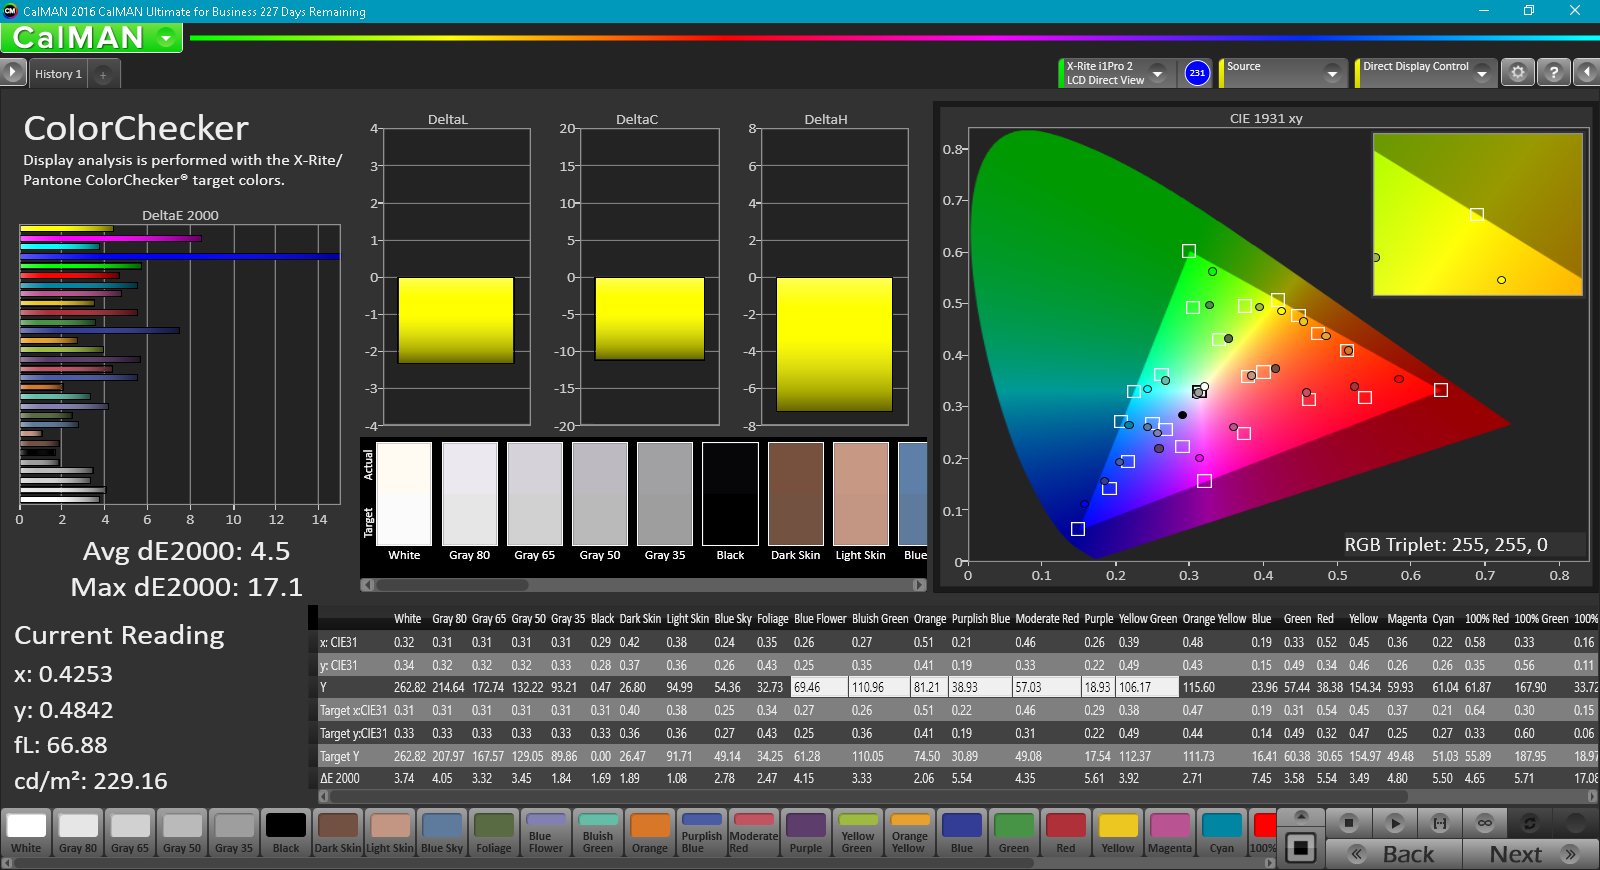
The panel covers approximately 45 percent and 70 percent of the AdobeRGB and sRGB standards, respectively. This is average as far as gaming notebooks go as costlier alternatives tend to offer 90 percent sRGB coverage or more. Response times are also middling for a gaming machine as there is no 120 Hz/5 ms option.
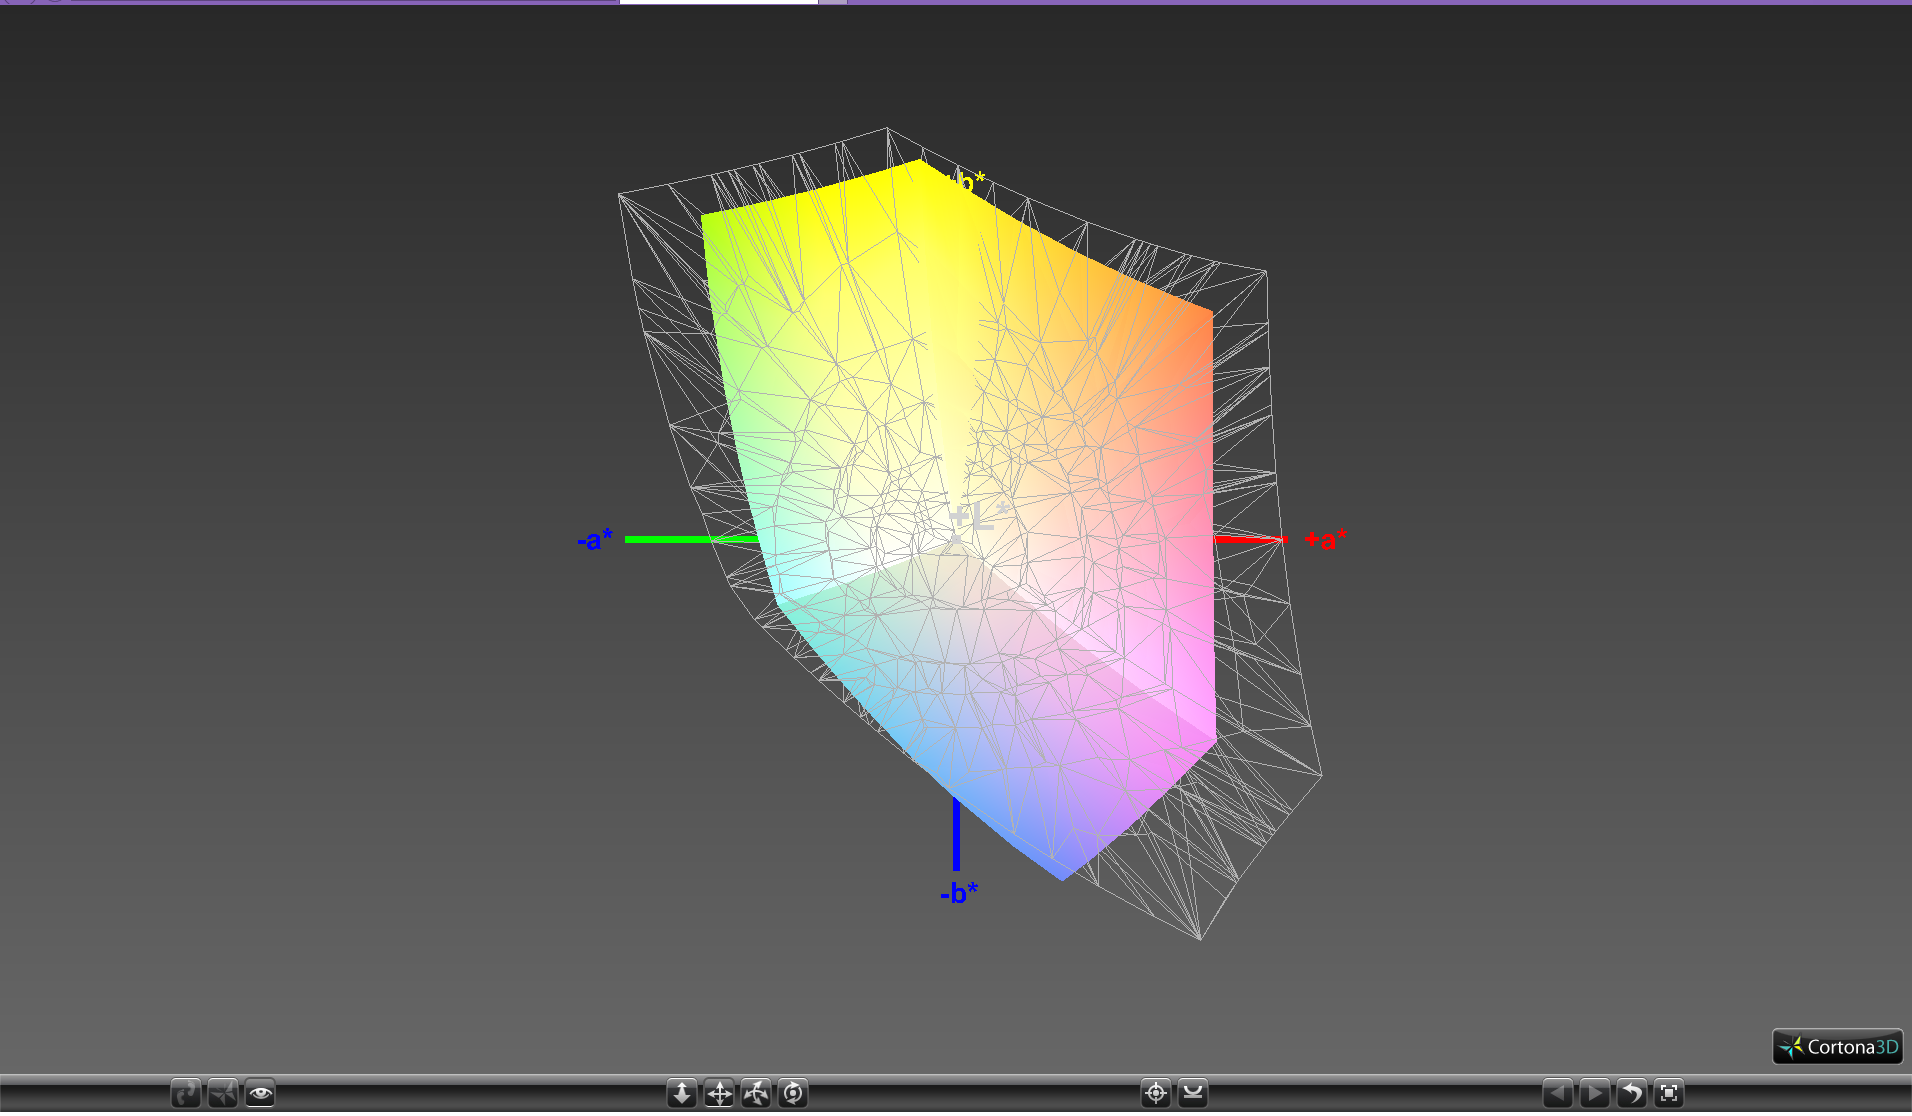
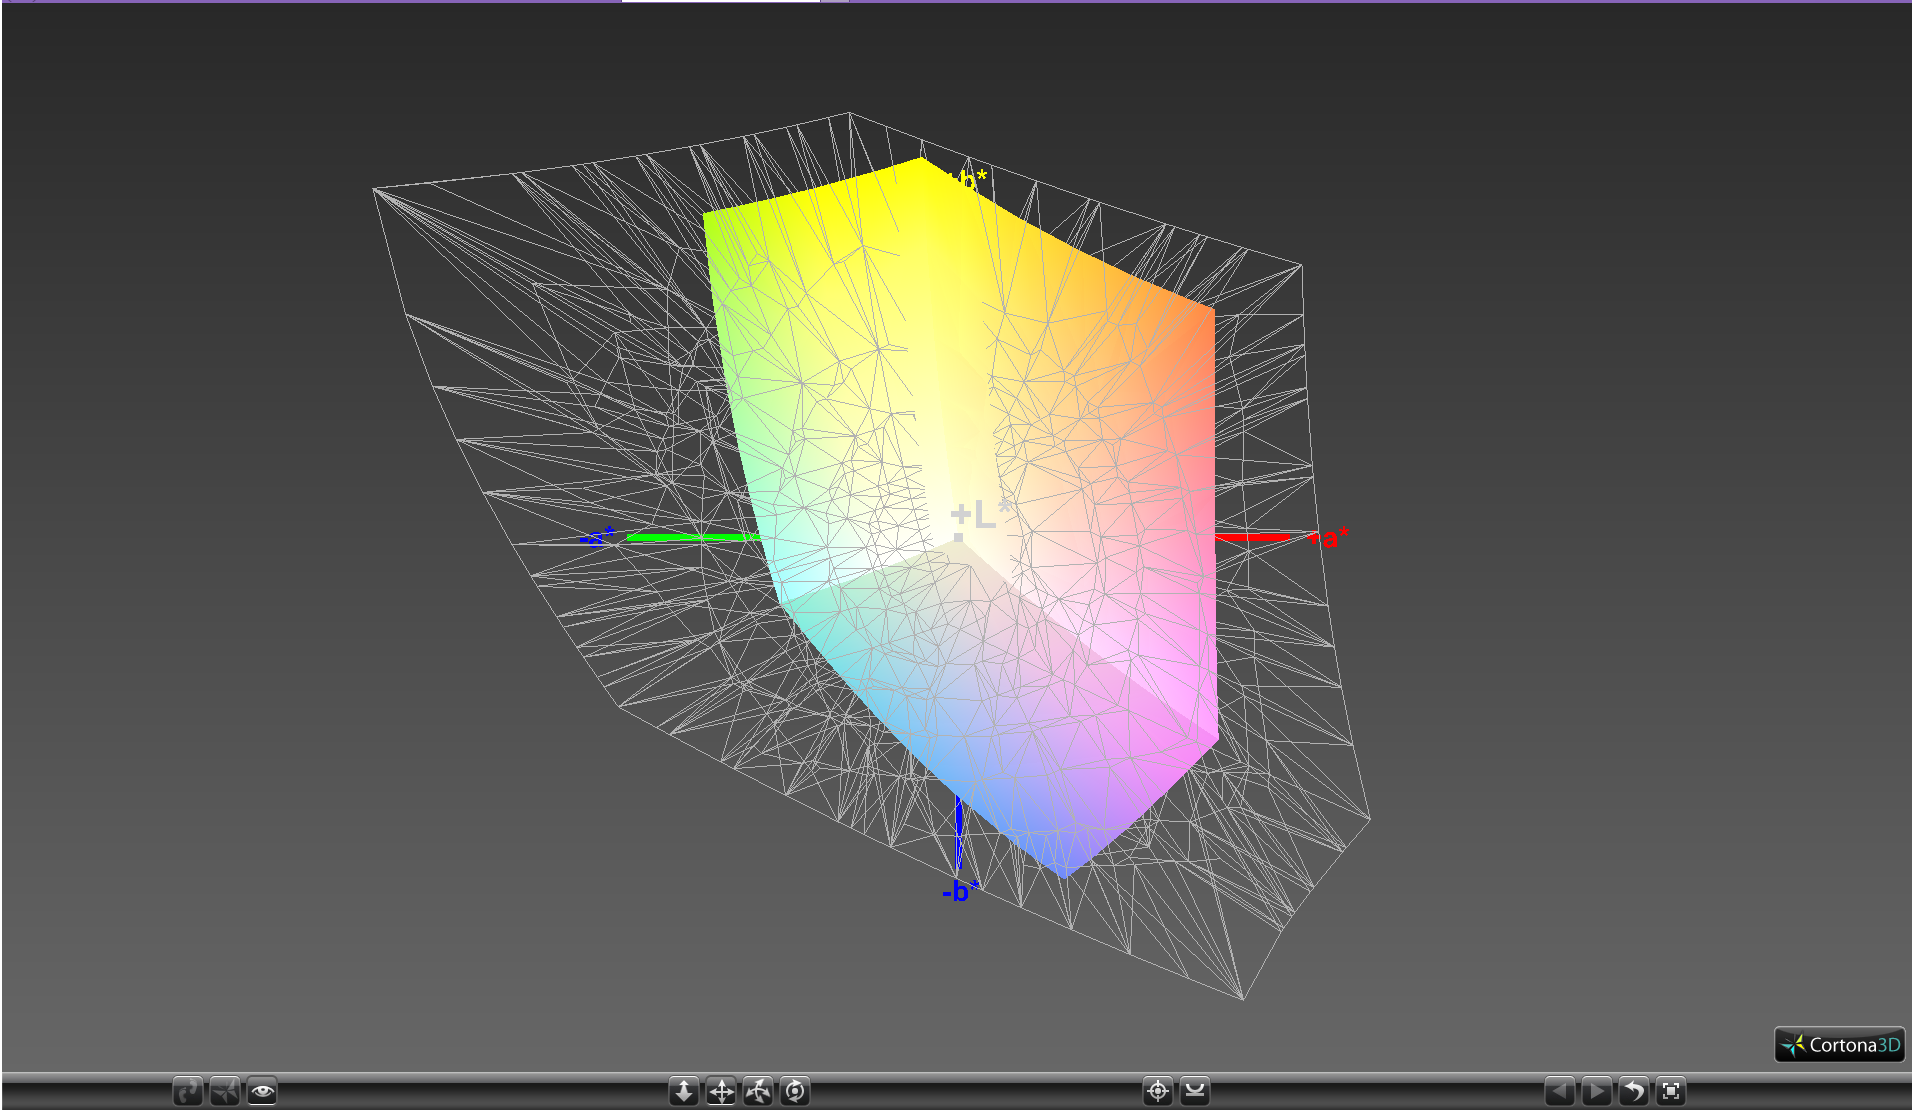
The narrow color gamut is made evident through further display measurements with a X-Rite spectrophotometer. Colors become increasingly more inaccurate at higher saturation levels due to imperfect sRGB coverage with Blue and Magenta colors in particular being represented less accurately than others. Grayscale and RGB balance are otherwise good after calibration and a slight reduction in color temperature.

Display Response Times
| ↔ Response Time Black to White | ||
|---|---|---|
| 33.6 ms ... rise ↗ and fall ↘ combined | ↗ 18.8 ms rise | 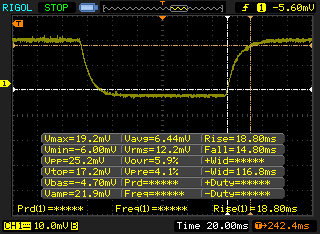 |
| ↘ 14.8 ms fall | ||
| The screen shows slow response rates in our tests and will be unsatisfactory for gamers. In comparison, all tested devices range from 0.1 (minimum) to 240 (maximum) ms. » 90 % of all devices are better. This means that the measured response time is worse than the average of all tested devices (19.8 ms). | ||
| ↔ Response Time 50% Grey to 80% Grey | ||
| 38.8 ms ... rise ↗ and fall ↘ combined | ↗ 20.8 ms rise | 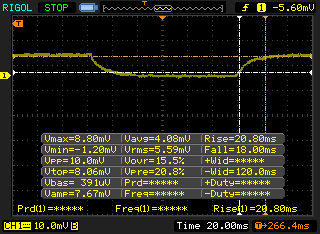 |
| ↘ 18 ms fall | ||
| The screen shows slow response rates in our tests and will be unsatisfactory for gamers. In comparison, all tested devices range from 0.165 (minimum) to 636 (maximum) ms. » 58 % of all devices are better. This means that the measured response time is worse than the average of all tested devices (30.9 ms). | ||
Screen Flickering / PWM (Pulse-Width Modulation)
| Screen flickering / PWM detected | 19230 Hz | ≤ 99 % brightness setting | 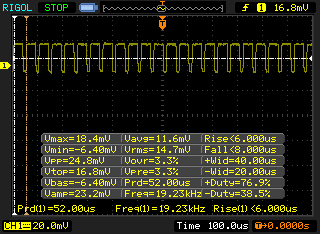 |
The display backlight flickers at 19230 Hz (worst case, e.g., utilizing PWM) Flickering detected at a brightness setting of 99 % and below. There should be no flickering or PWM above this brightness setting. The frequency of 19230 Hz is quite high, so most users sensitive to PWM should not notice any flickering. In comparison: 52 % of all tested devices do not use PWM to dim the display. If PWM was detected, an average of 7741 (minimum: 5 - maximum: 343500) Hz was measured. | |||
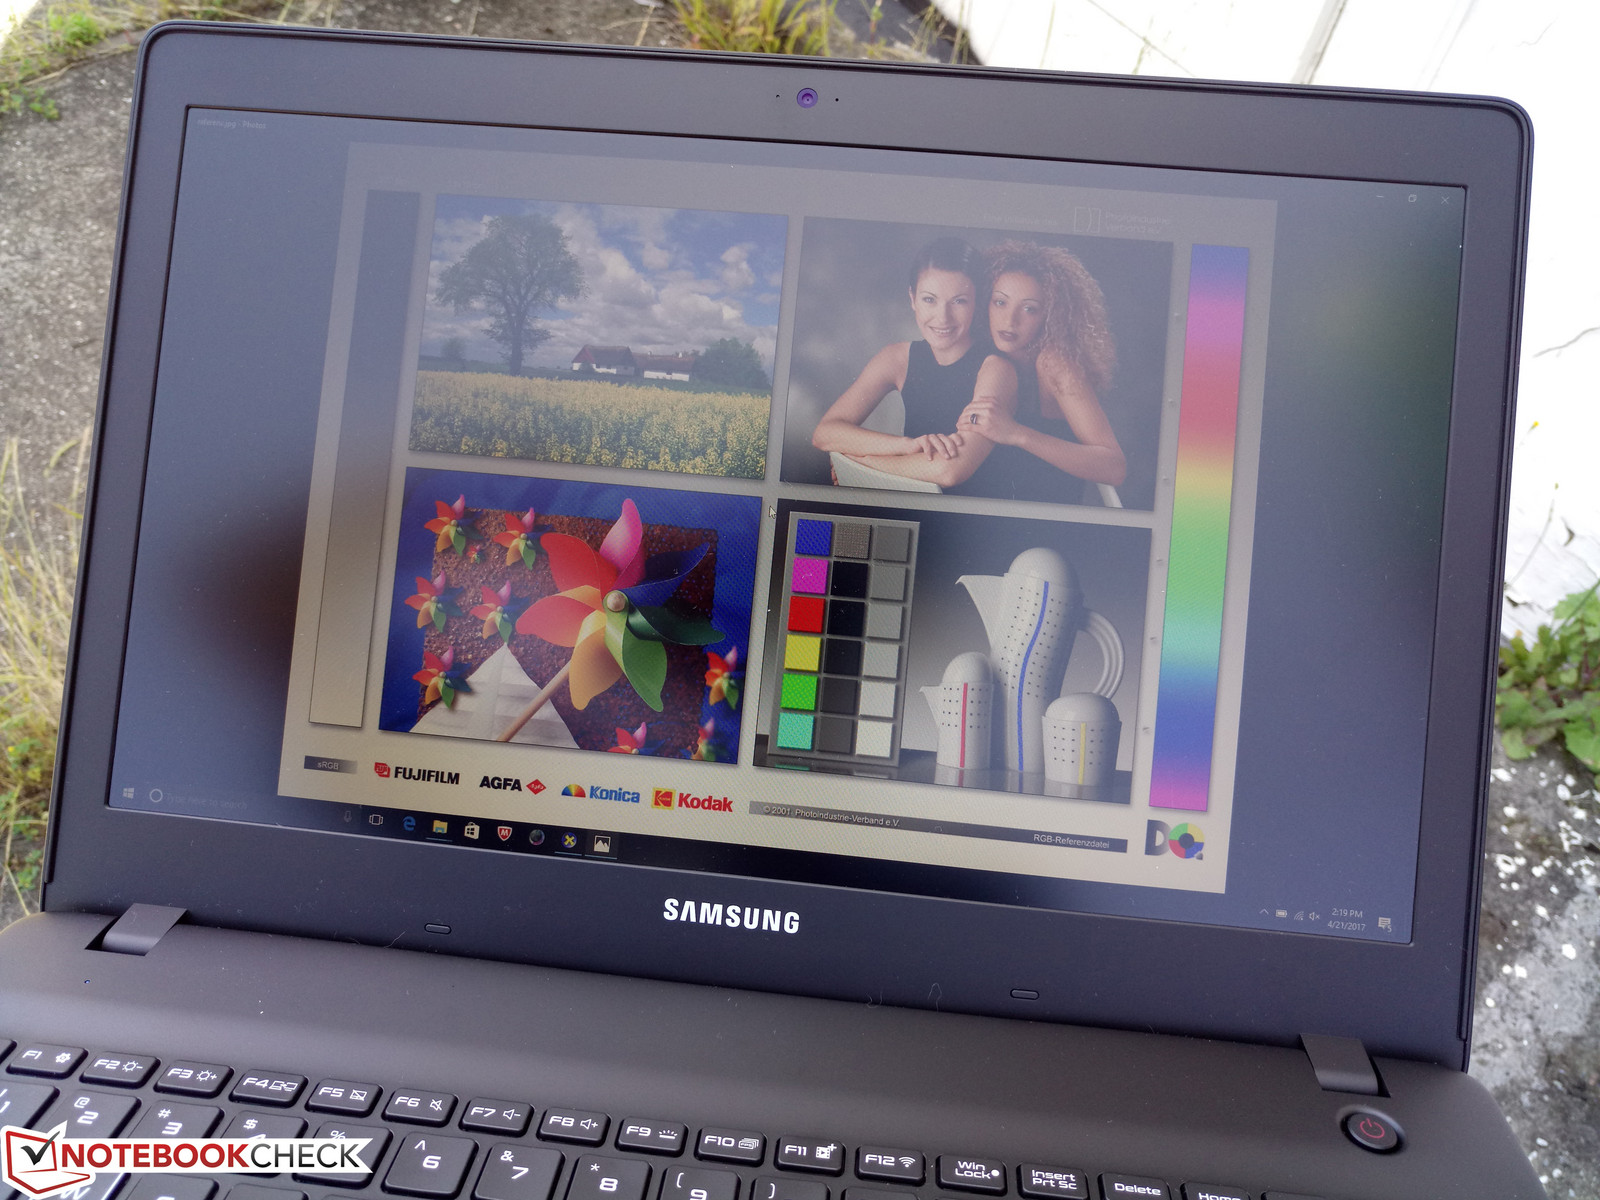
The display backlight is insufficient for comfortable use outdoors. Direct sunlight and even ambient lighting when under shade will wash out colors and texts. The wide IPS viewing angles and matte screen are not enough to compensate for the relatively dim backlight and average contrast.


Performance
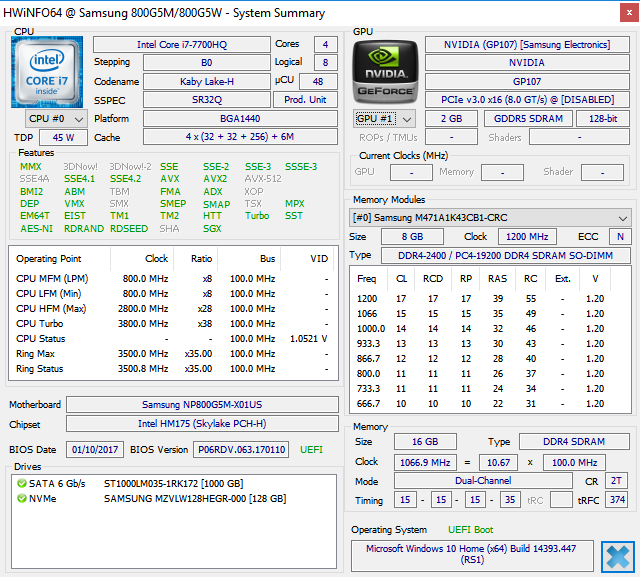
So far, only one 15.6-inch Odyssey SKU is available and it houses the i7-7700HQ CPU and GTX 1050 GPU. The larger 17.3-inch Odyssey has yet to launch and is expected to be much more powerful with GTX 1070 and AMD RX570 options. Until then, however, the FHD Odyssey 15 with 16 GB of RAM is the sole model.
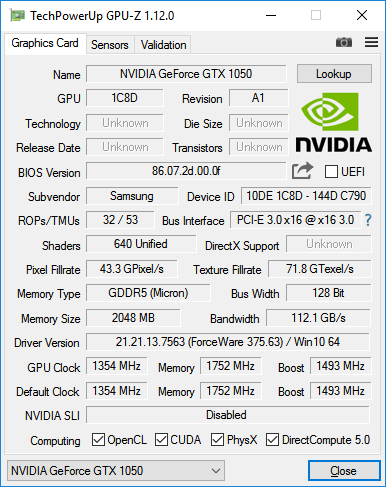
It's worth noting that the GTX 1050 GPU in the Odyssey is equipped with only 2 GB of GDDR5 VRAM whereas other gaming notebooks with the same GPU may have twice this capacity. The Asus GL753VD, for example, uses the same GTX 1050 GPU but with 4 GB of VRAM instead of just 2 GB.
Optimus is included for switching between the Nvidia GPU and the integrated HD Graphics 530. Subsequently, G-Sync is not available.
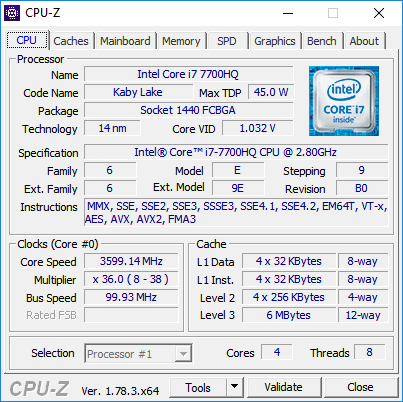
Processor
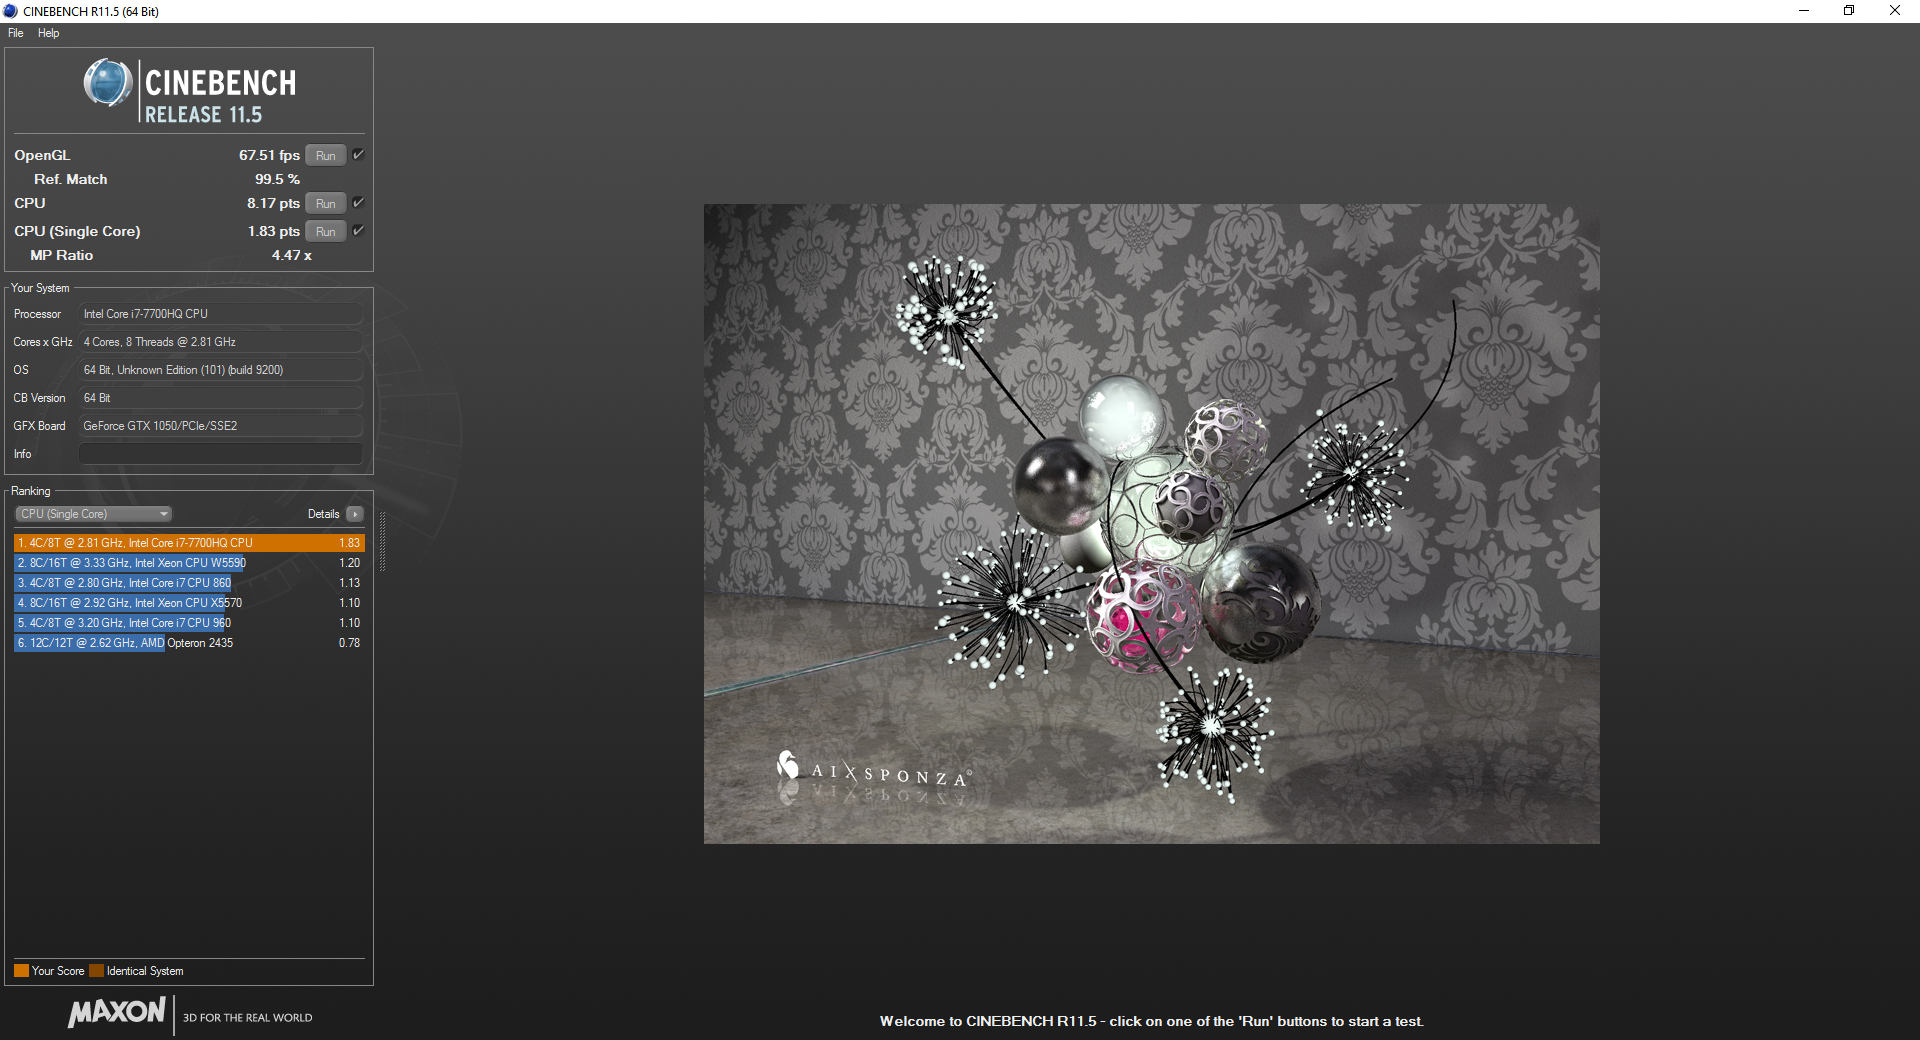
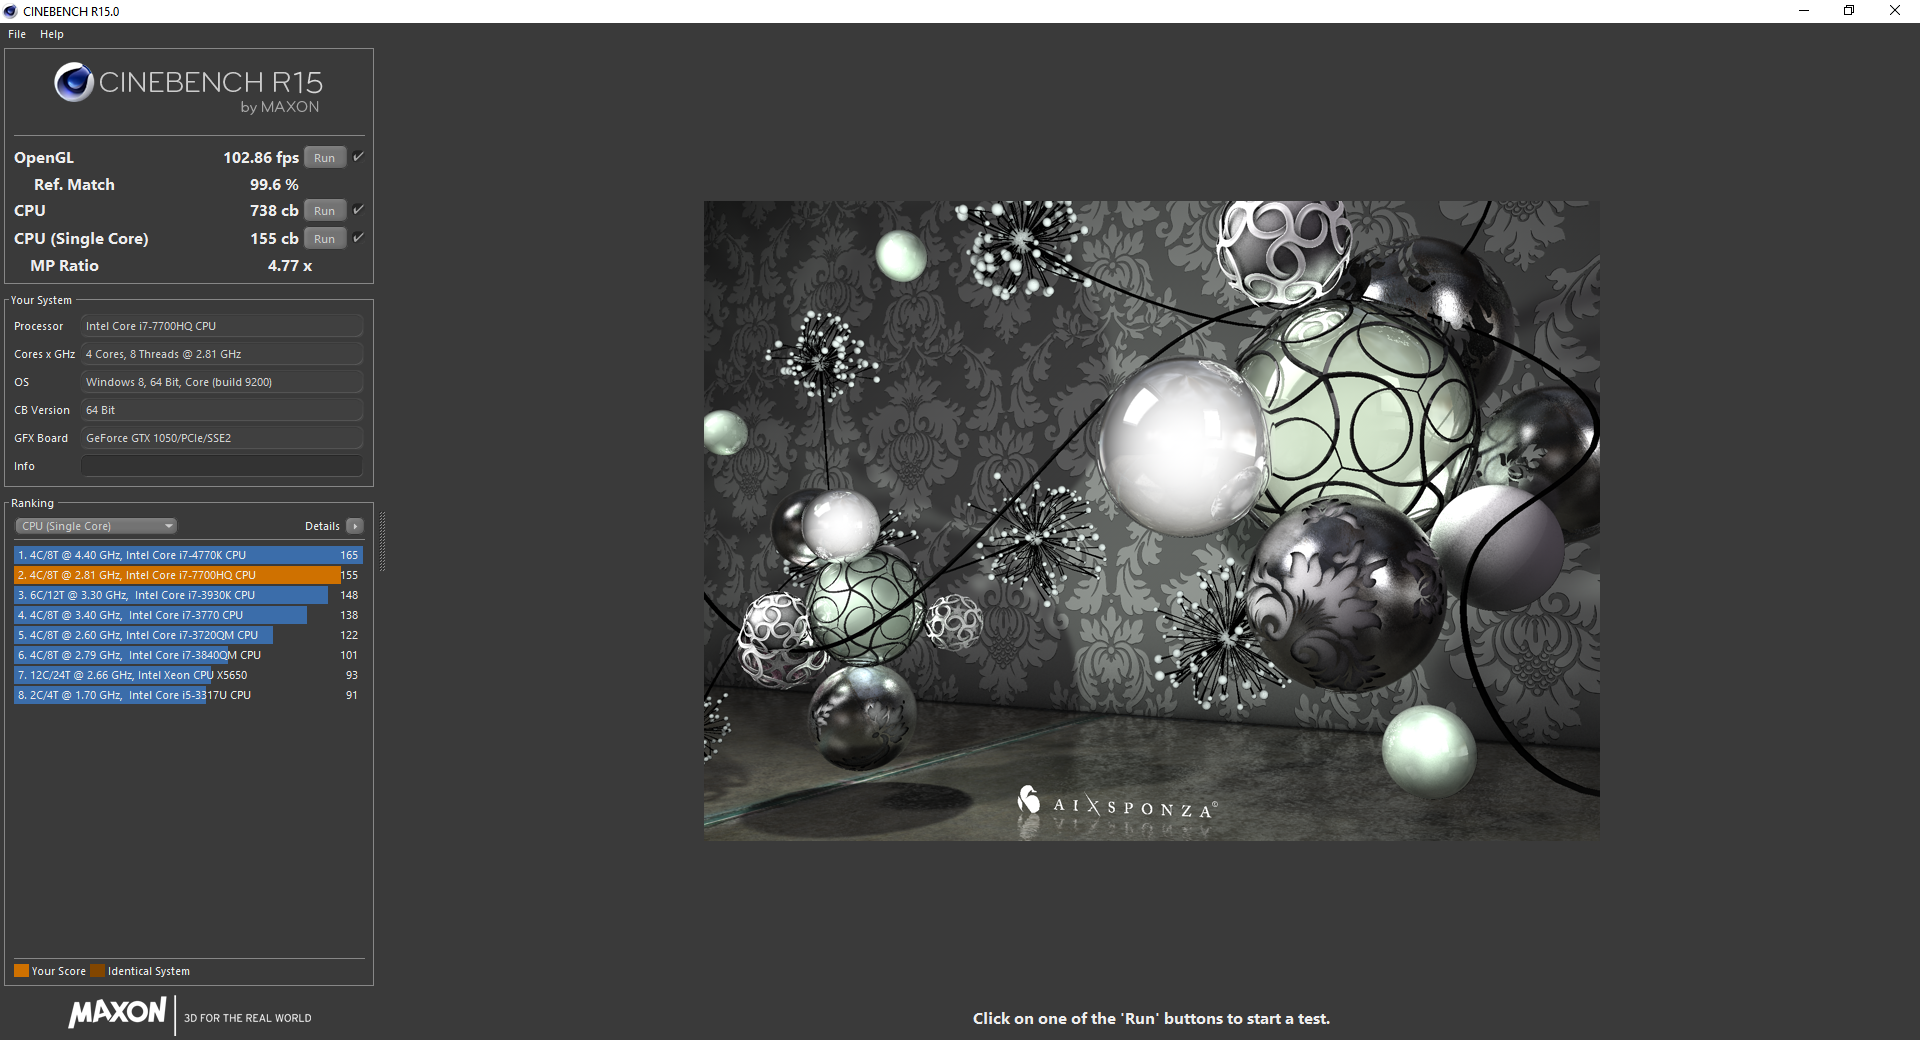
The i7-7700HQ is a common find on multimedia and gaming notebooks of 2017. Raw performance is not significantly faster than the older Skylake i7-6700HQ or Broadwell i7-5700HQ, but this is a moot point as most games are GPU-bound. Our CineBench scores nearly match the MSI GS63VR that also carries the same i7-7700HQ CPU while the enthusiast-level i7-7820HK is about 20 percent faster in both single- and multi-threaded workloads.
Running CineBench R15 Multi-Thread in a loop results in no performance drops over time. In comparison, the CPU in the GS63VR can drop by as much as 15 percent under the same CineBench loop testing conditions.
See our dedicated CPU page on the i7-7700HQ for more technical information and benchmark comparisons.
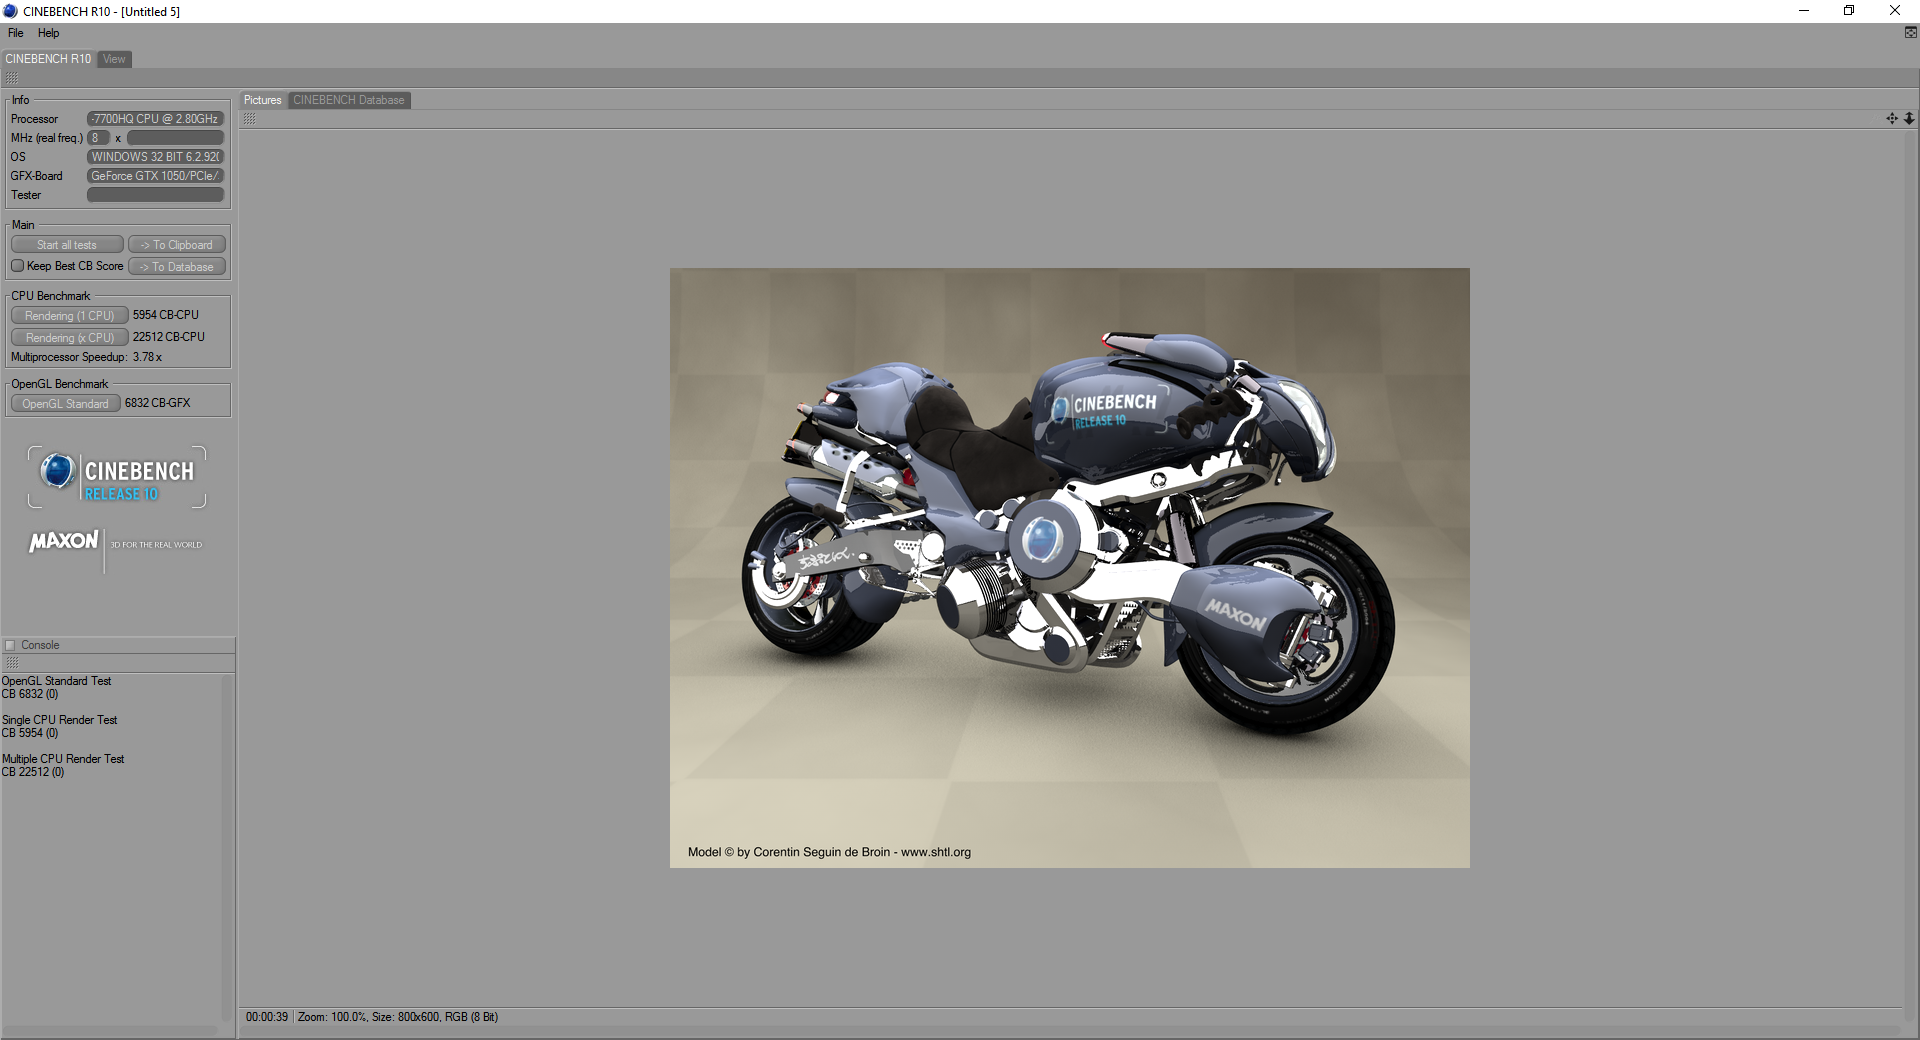
| Cinebench R10 | |
| Rendering Multiple CPUs 32Bit | |
| Eurocom Tornado F5 | |
| Samsung Odyssey NP800G5M-X01US | |
| MSI GS63VR 7RF-228US | |
| MSI GT80 Titan SLI | |
| Asus GL702VM-GC102D | |
| Rendering Single 32Bit | |
| Eurocom Tornado F5 | |
| Samsung Odyssey NP800G5M-X01US | |
| MSI GS63VR 7RF-228US | |
| MSI GT80 Titan SLI | |
| Asus GL702VM-GC102D | |
| wPrime 2.10 - 1024m | |
| MSI GS63VR 7RF-228US | |
| Samsung Odyssey NP800G5M-X01US | |
| Eurocom Tornado F5 | |
* ... smaller is better
System Performance
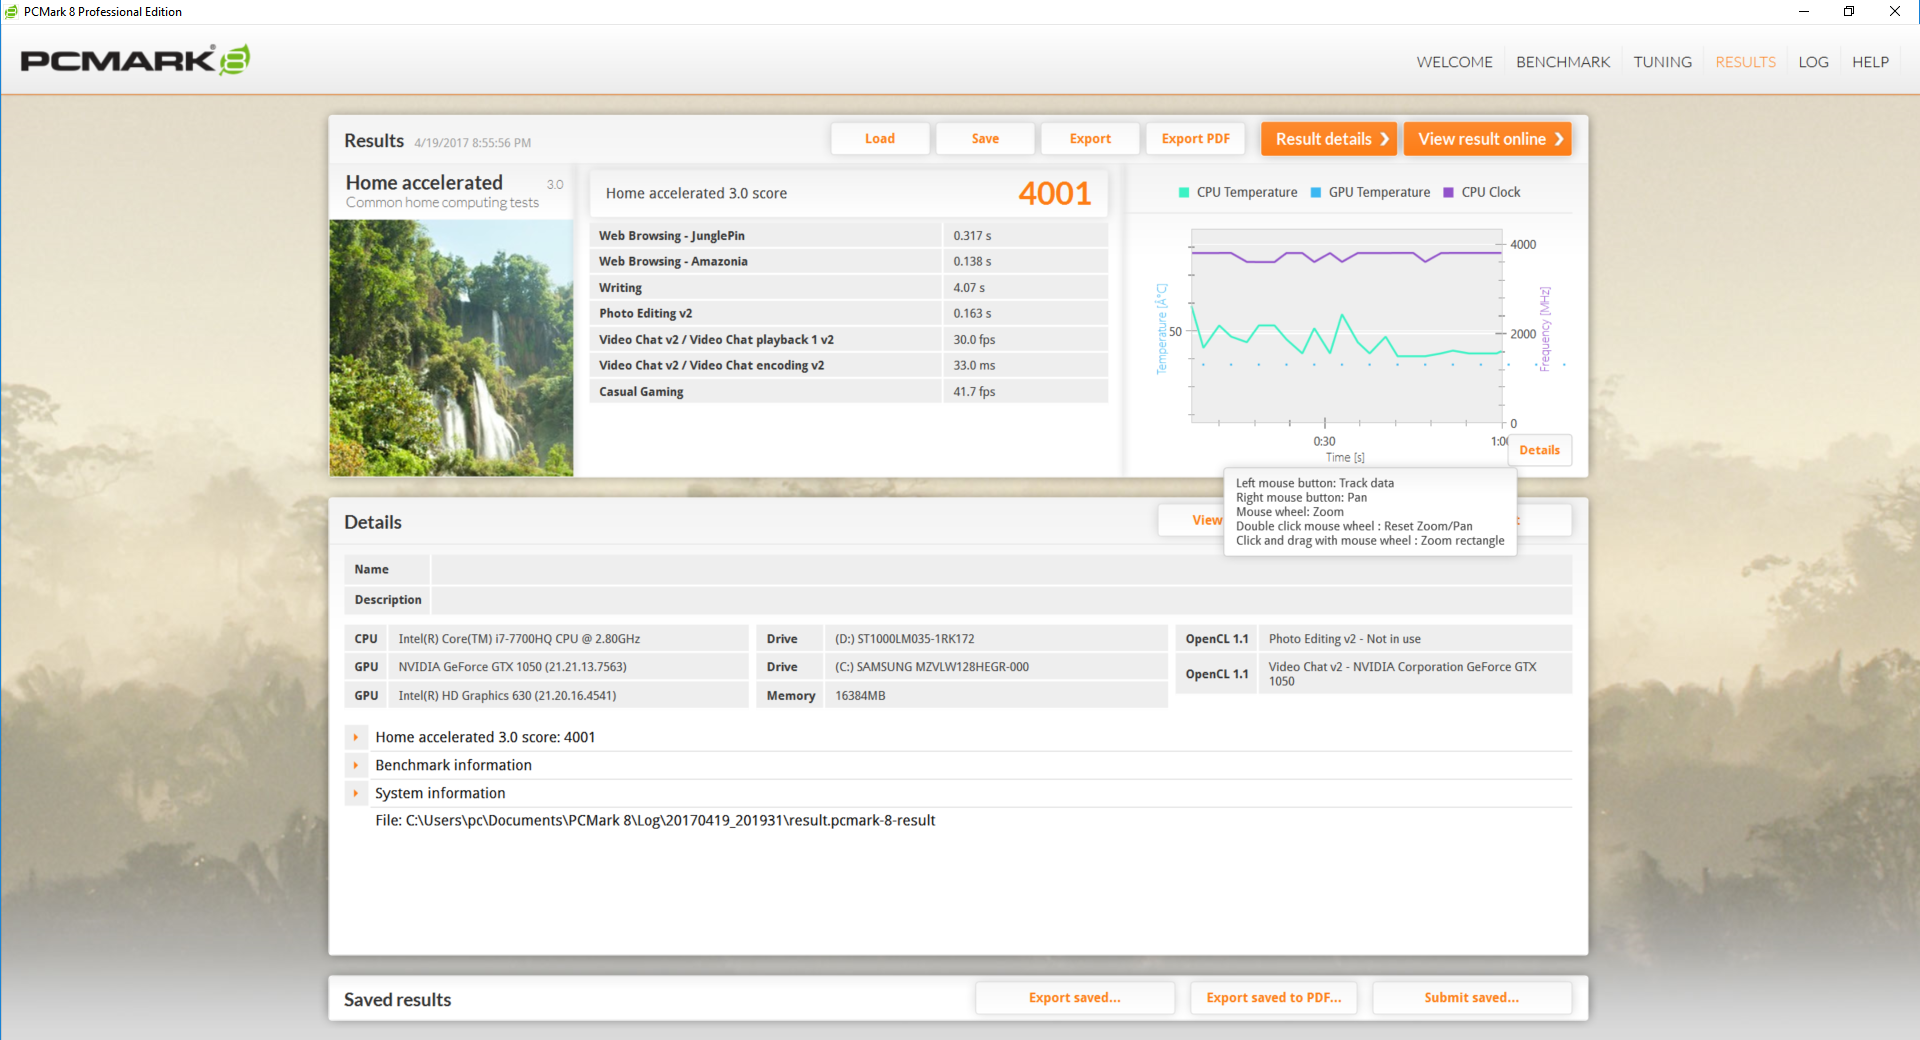
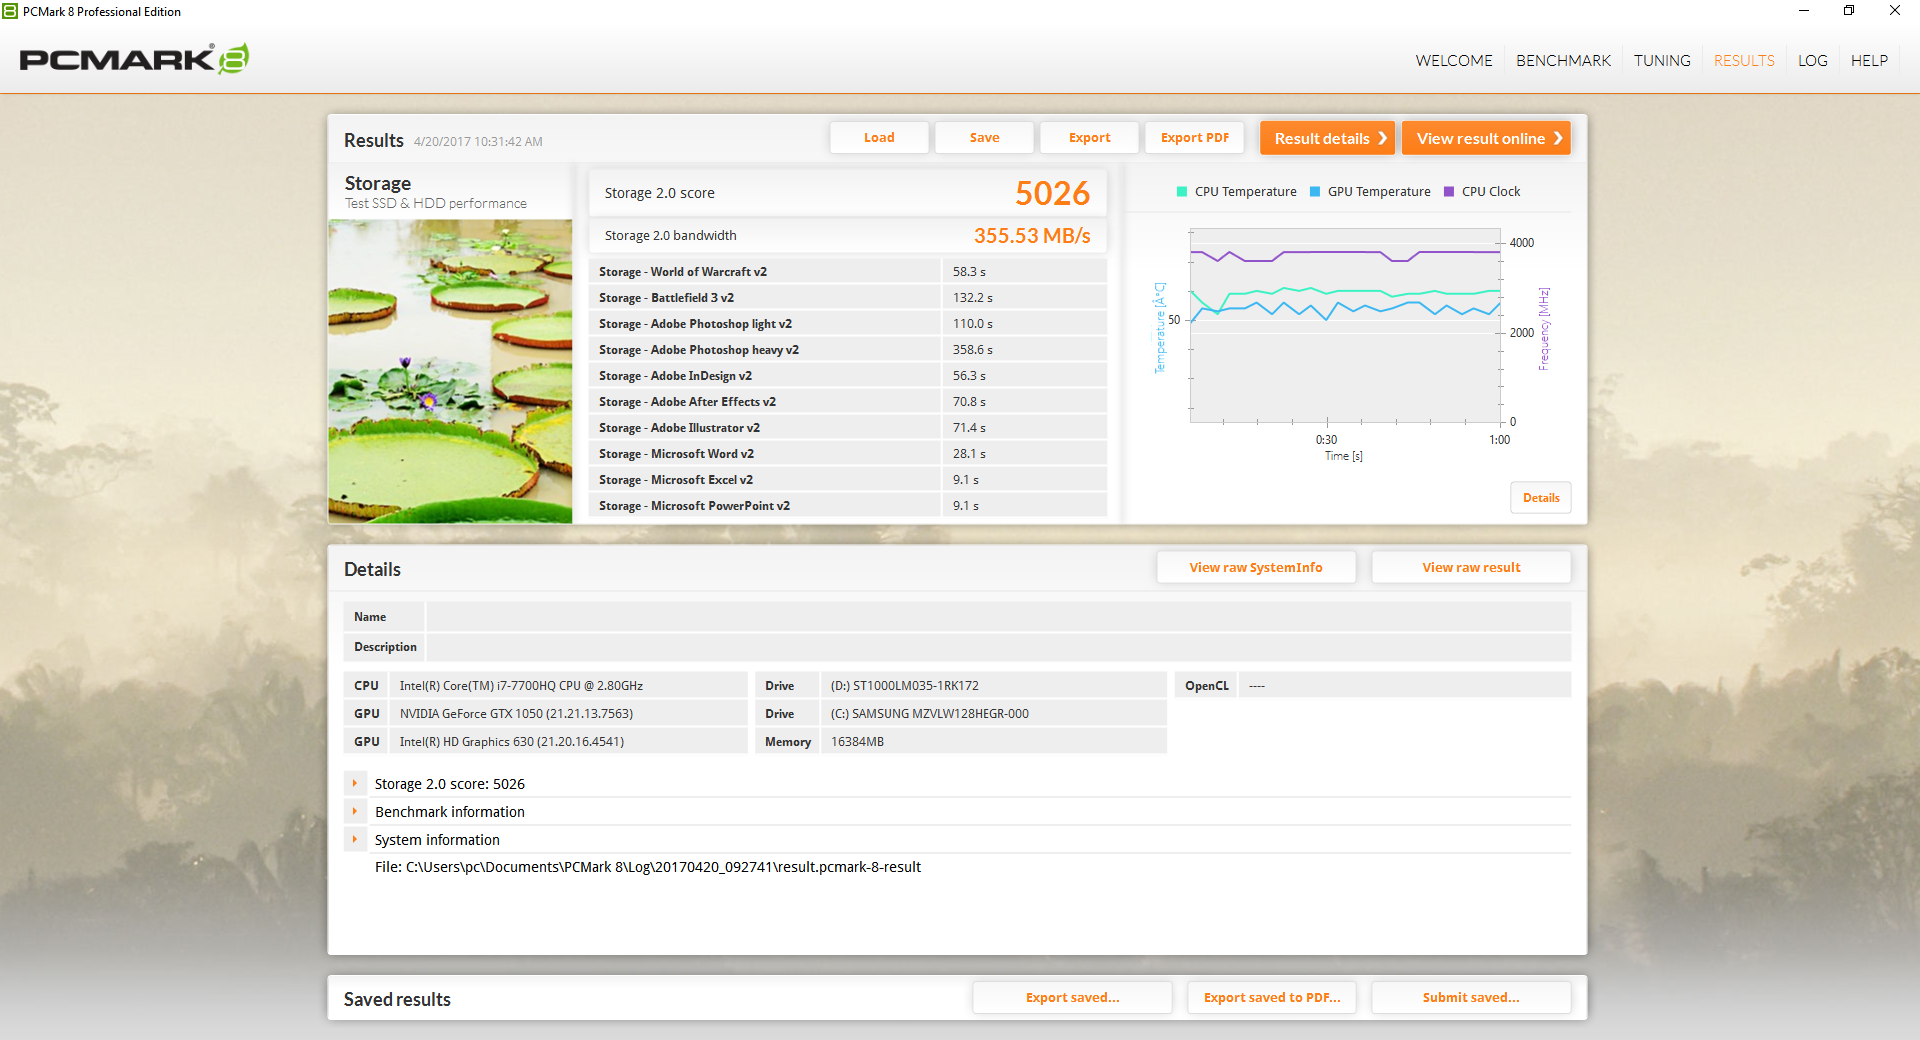
PCMark 8 ranks the Odyssey in the same ballpark as other multimedia and gaming systems. The Asus Strix GL553VD with the same CPU and GPU scores lower on the same tests largely due to its slow primary HDD.
We experienced no notable software or hardware issues during our time with the Odyssey unit.
| PCMark 8 | |
| Home Score Accelerated v2 | |
| Asus FX502VM-AS73 | |
| Gigabyte P55W v7 | |
| Samsung Odyssey NP800G5M-X01US | |
| Asus ROG Strix GL553VD-DS71 | |
| Dell XPS 15 2017 9560 (7300HQ, Full-HD) | |
| Work Score Accelerated v2 | |
| Gigabyte P55W v7 | |
| Samsung Odyssey NP800G5M-X01US | |
| Dell XPS 15 2017 9560 (7300HQ, Full-HD) | |
| Asus ROG Strix GL553VD-DS71 | |
| Asus FX502VM-AS73 | |
| Creative Score Accelerated v2 | |
| Asus FX502VM-AS73 | |
| Samsung Odyssey NP800G5M-X01US | |
| Asus ROG Strix GL553VD-DS71 | |
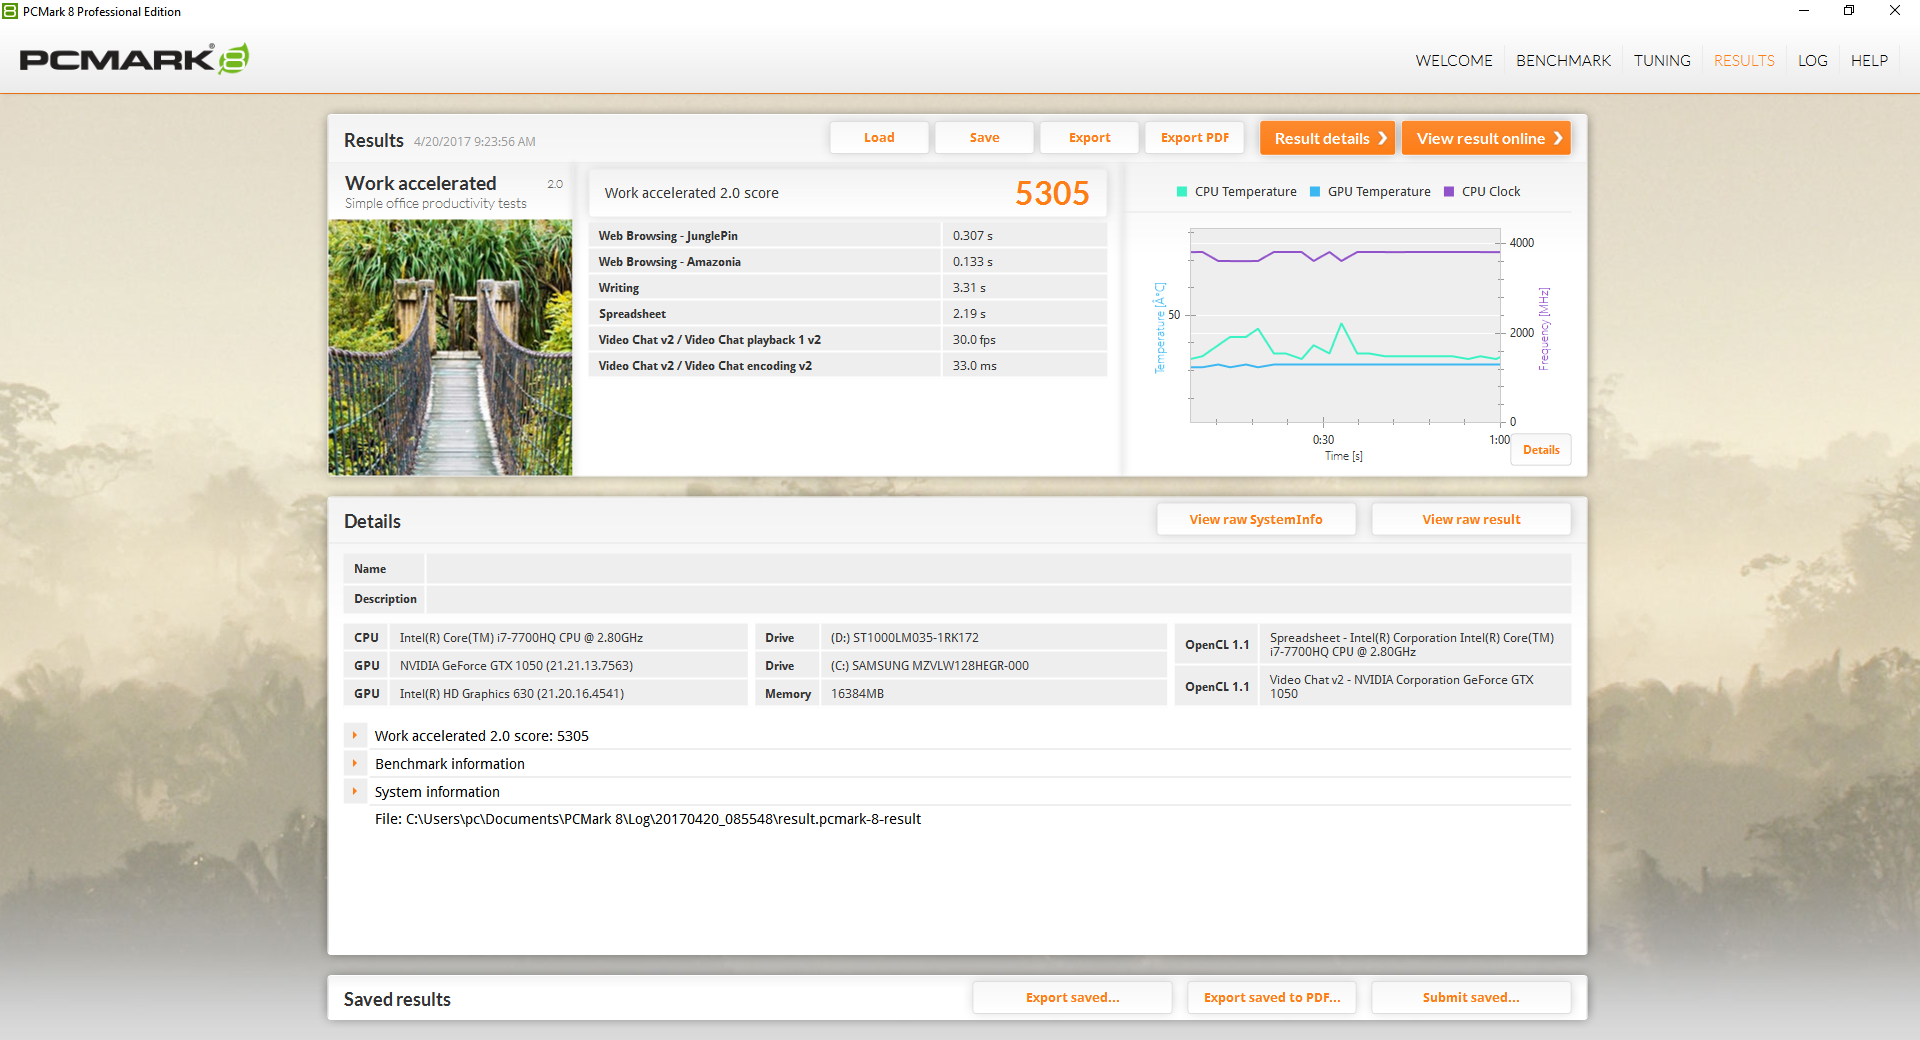
| PCMark 8 Home Score Accelerated v2 | 4001 points | |
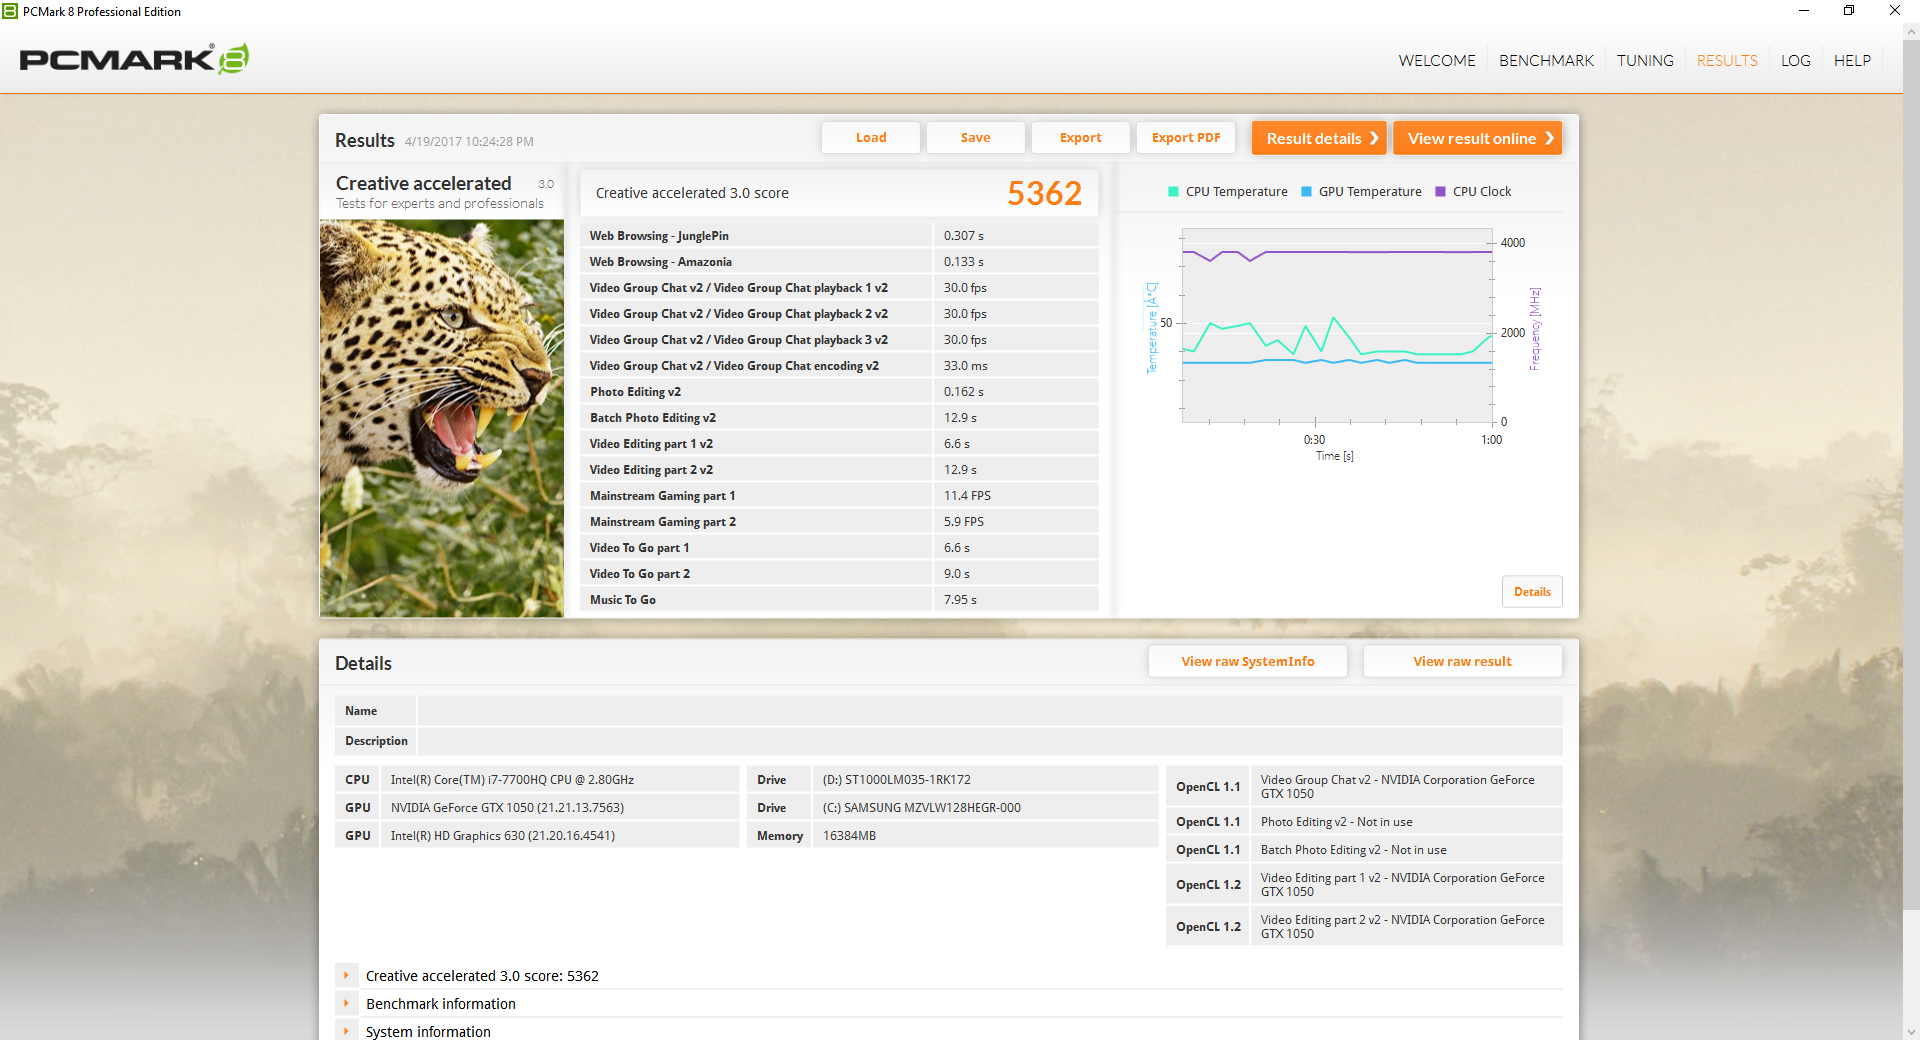
| PCMark 8 Creative Score Accelerated v2 | 5362 points | |
| PCMark 8 Work Score Accelerated v2 | 5305 points | |
Help | ||
Storage Devices

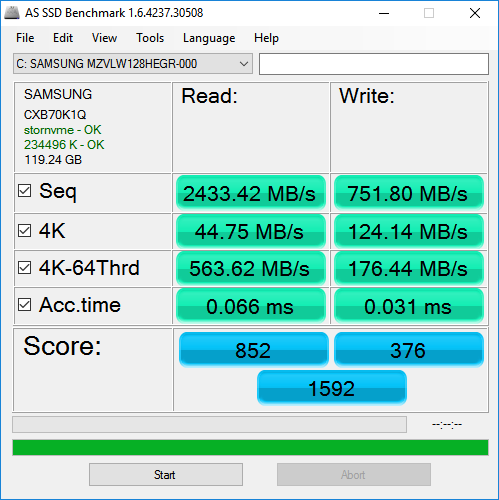
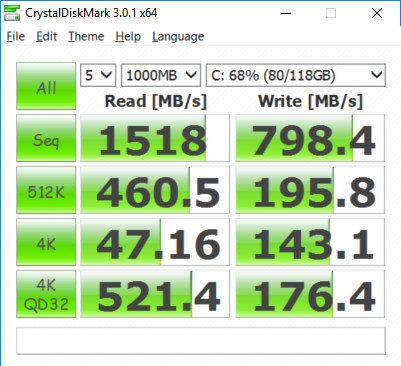
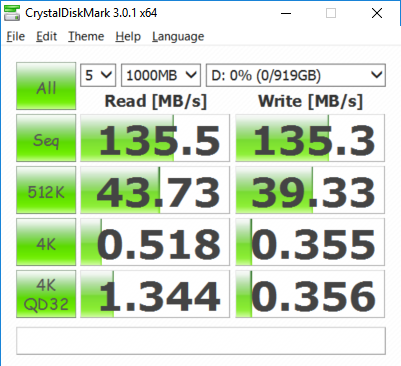
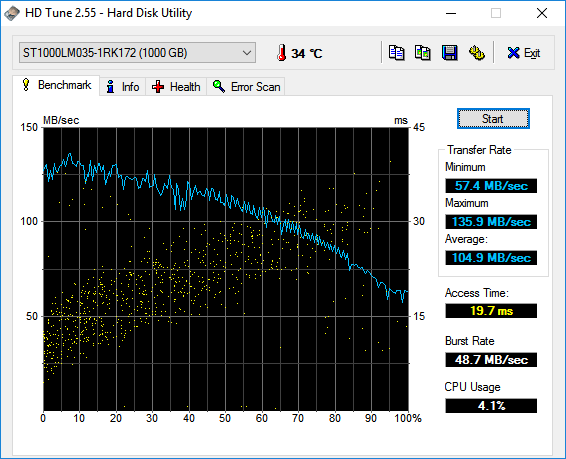
Two internal storage bays are available and, in our case, they are occupied by a primary 128 GB Samsung NVMe SSD and a secondary 1 TB Seagate HDD. Overall performance from the SSD is significantly faster than the SATA III SSD in our Asus FX502VM test unit, but write performance is average for a NVMe SSD as the Lite-On drive in our XPS 15 unit is noticeably faster. Meanwhile, the Seagate HDD returns an average transfer rate of almost 105 MB/s according to HD Tune, which is quite fast for a 5400 RPM HDD. We recommend using 7 mm drives as 9.5 mm options will be a very tight fit.
See our growing table of HDDs and SSDs for more benchmark comparisons.
| Samsung Odyssey NP800G5M-X01US Samsung PM961 NVMe MZVLW128HEGR | Asus FX502VM-AS73 SK Hynix HFS256G39TND-N210A | HP Pavilion 15t-bc200 X7P44AV Intel SSD 600p SSDPEKKW256G7 | Asus ROG Strix GL553VD-DS71 HGST Travelstar 7K1000 HTS721010A9E630 | Dell XPS 15 9560 (i7-7700HQ, UHD) Lite-On CX2-8B512-Q11 | |
|---|---|---|---|---|---|
| CrystalDiskMark 3.0 | -46% | 19% | -93% | 94% | |
| Read Seq (MB/s) | 1518 | 503 -67% | 1115 -27% | 93.5 -94% | 1684 11% |
| Write Seq (MB/s) | 798 | 138.2 -83% | 311 -61% | 89.6 -89% | 1106 39% |
| Read 512 (MB/s) | 460.5 | 343.5 -25% | 706 53% | 39.06 -92% | 977 112% |
| Write 512 (MB/s) | 195.8 | 137.8 -30% | 472.3 141% | 51.1 -74% | 1119 472% |
| Read 4k (MB/s) | 47.16 | 29.36 -38% | 31.97 -32% | 0.57 -99% | 45.14 -4% |
| Write 4k (MB/s) | 143.1 | 70.9 -50% | 135.1 -6% | 1.05 -99% | 134.1 -6% |
| Read 4k QD32 (MB/s) | 521 | 369.9 -29% | 288.3 -45% | 1.06 -100% | 509 -2% |
| Write 4k QD32 (MB/s) | 176.4 | 99.7 -43% | 405.5 130% | 1.04 -99% | 398.1 126% |

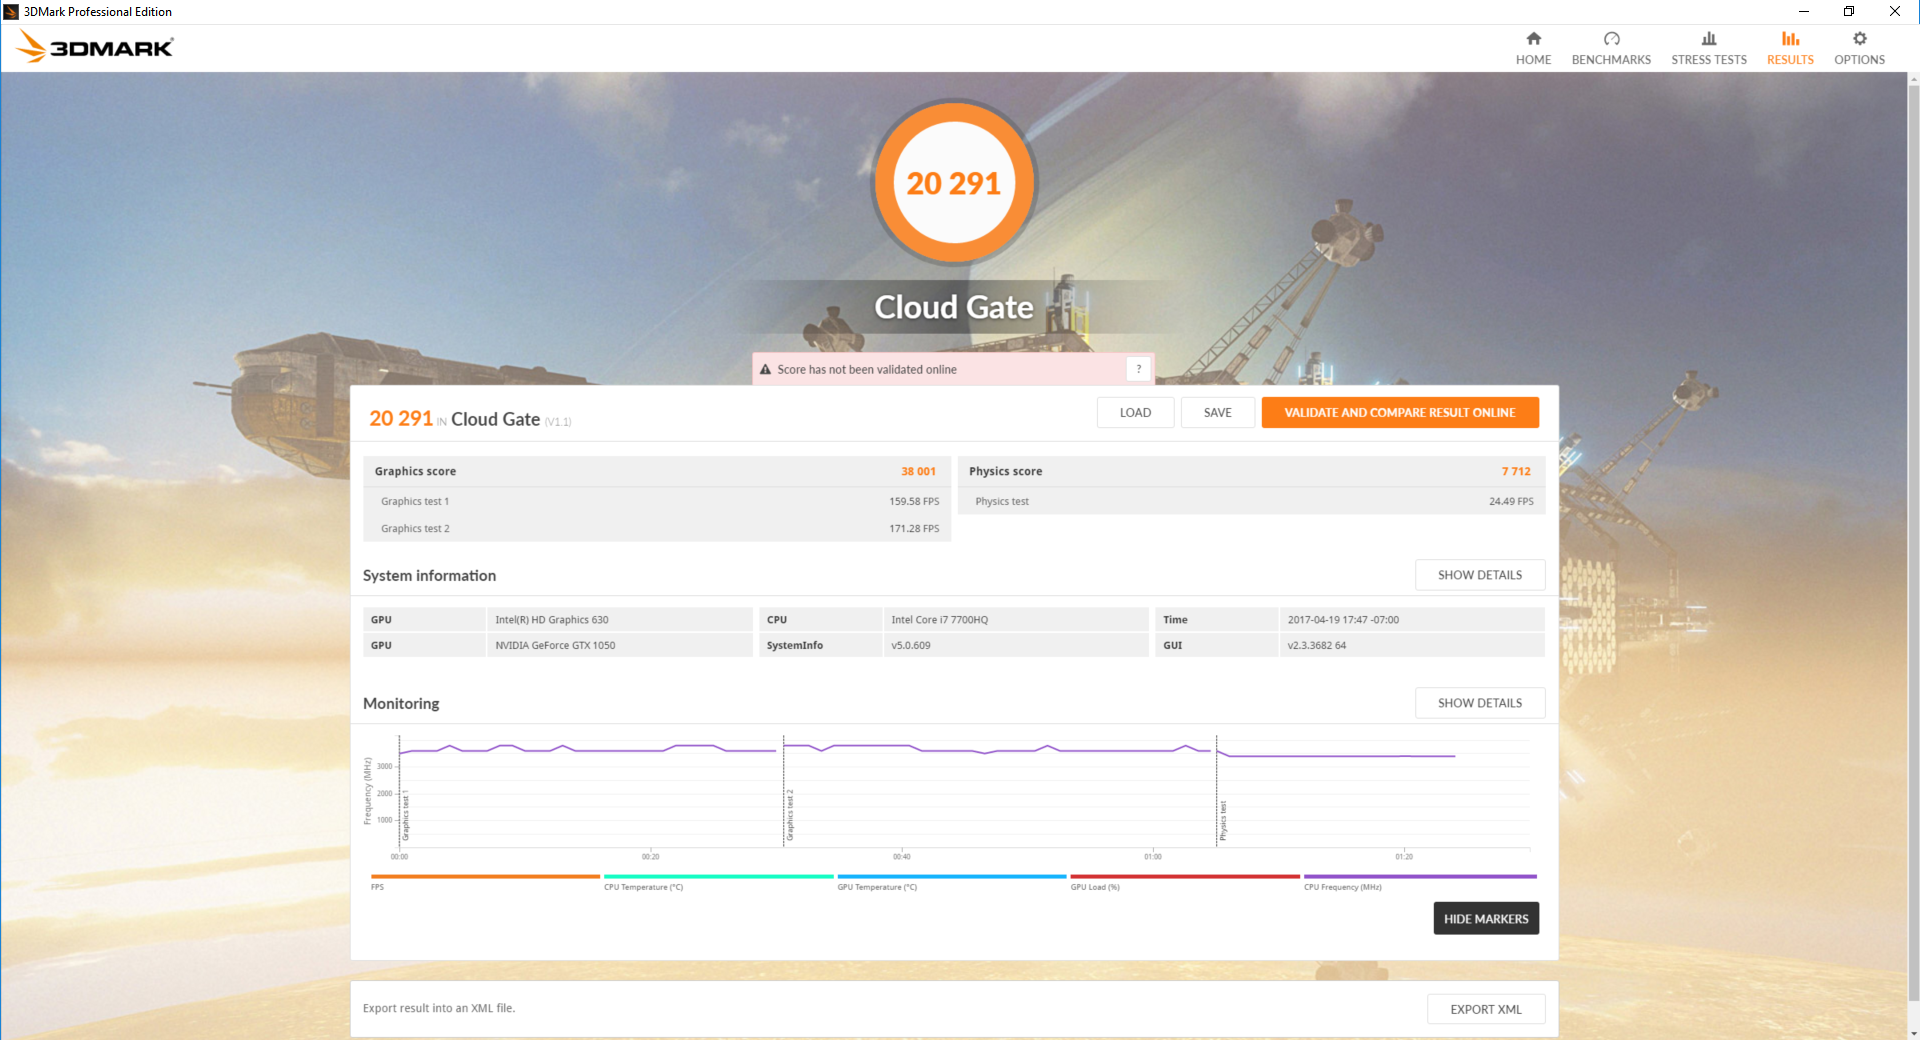
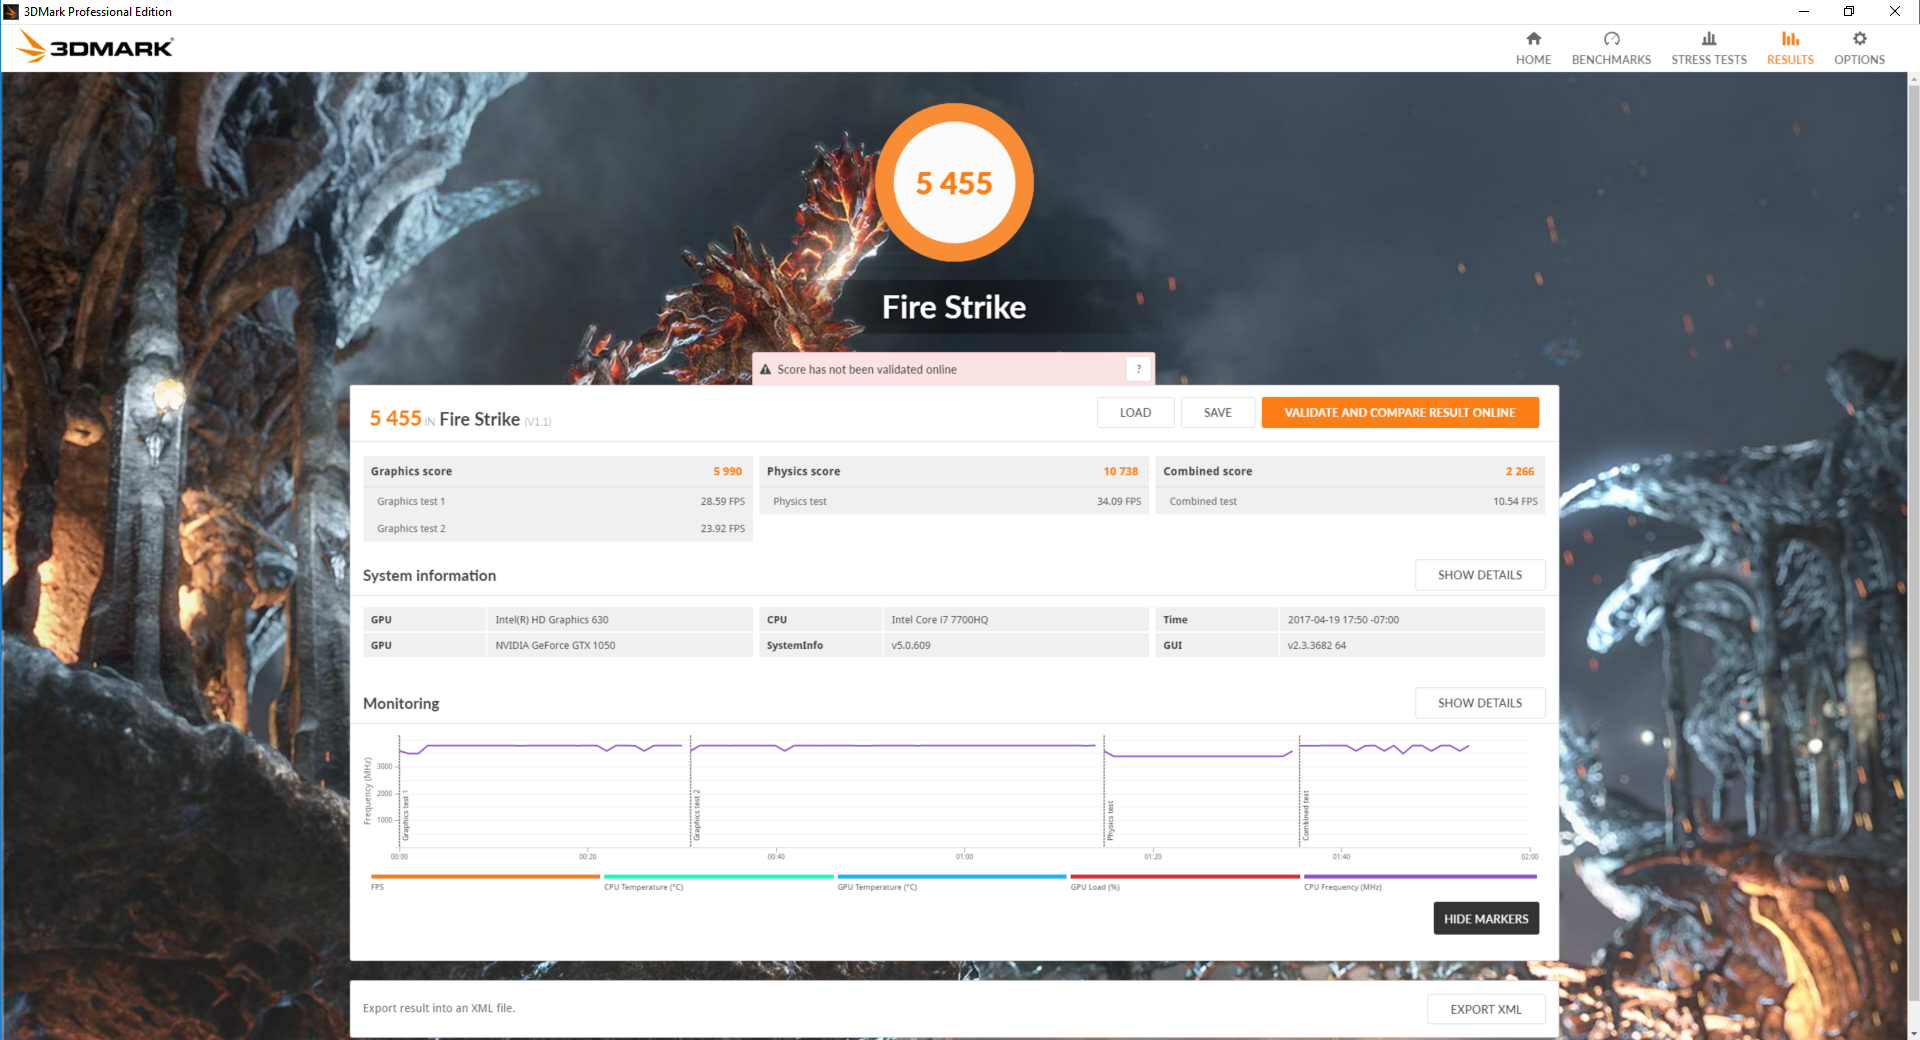
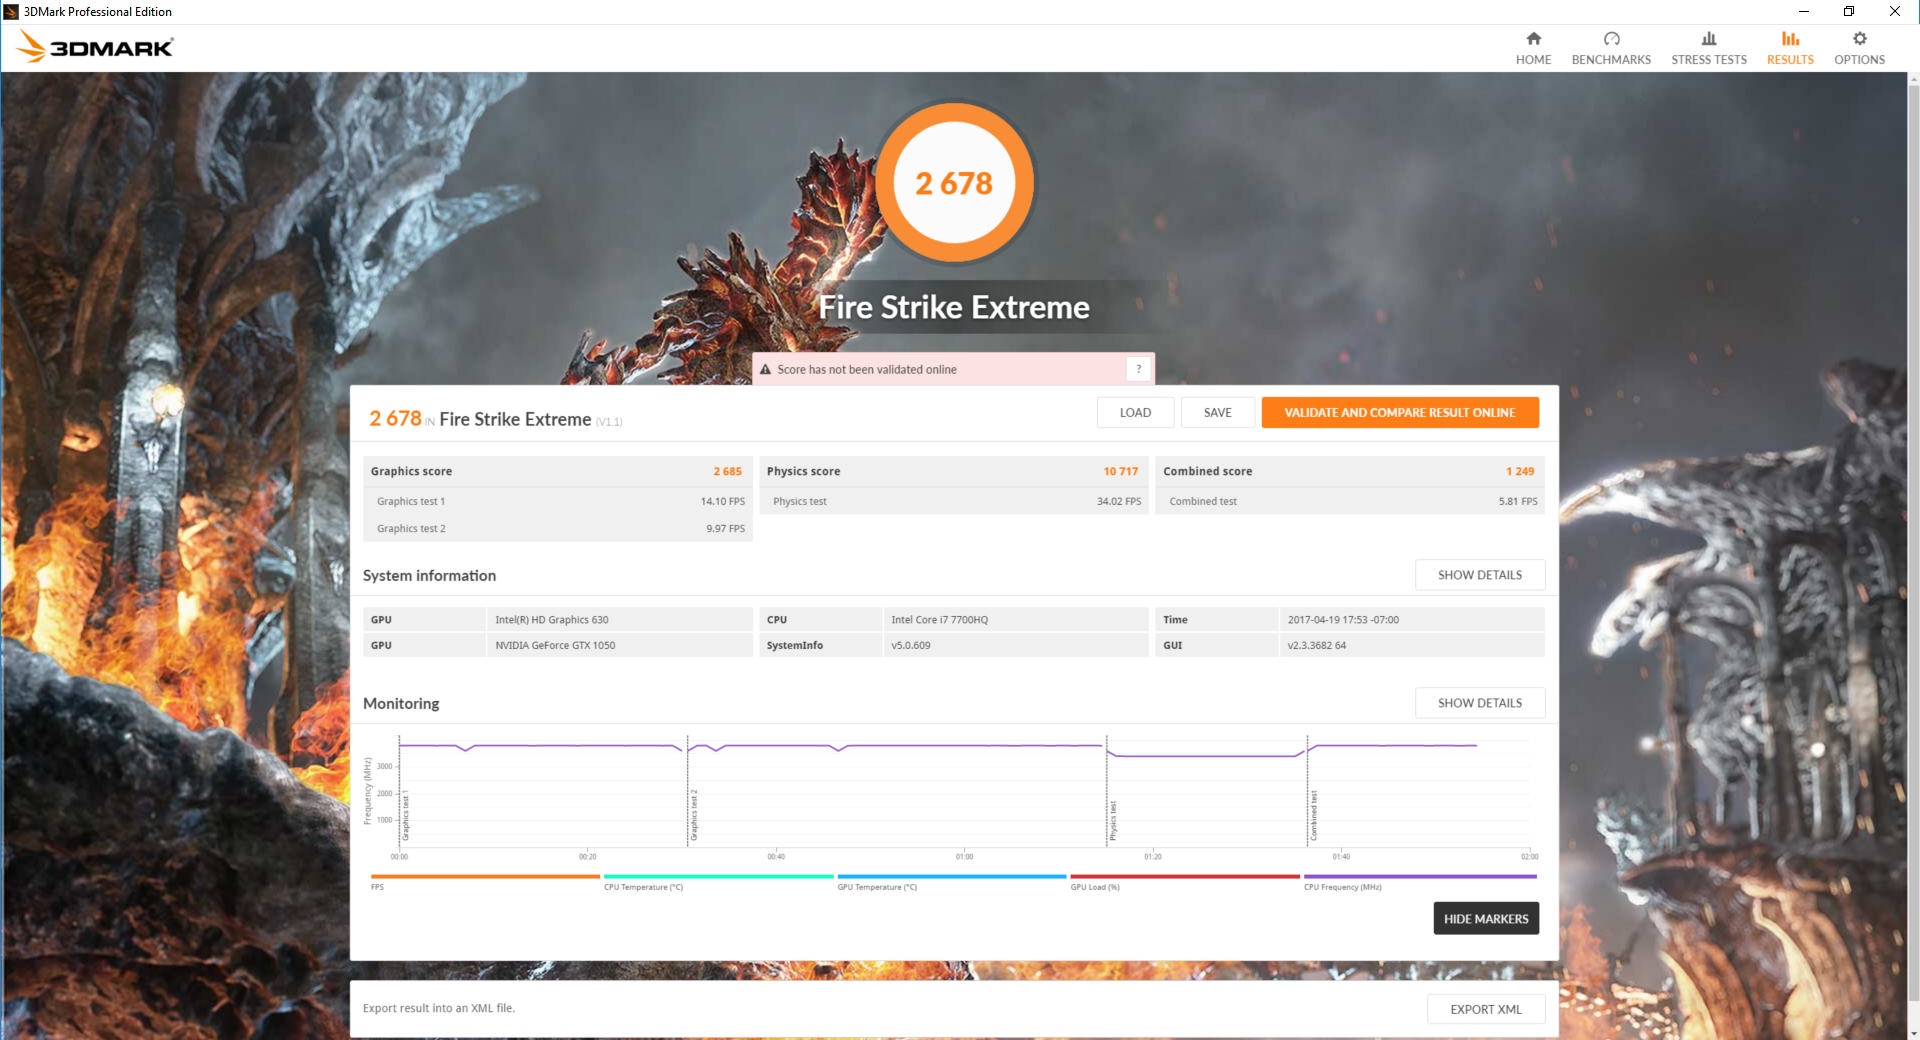
GPU Performance
3DMark paints a very clear picture as to what we can expect from the mobile GTX 1050. The GPU sits comfortably between the Maxwell GTX 965M and GTX 970M in raw performance, though it is unfortunately closer to the 965M than it is to the 970M. The desktop GTX 1050 still outperforms our mobile counterpart by about 10 to 20 percent depending on the 3DMark benchmark. Notebooks with the faster GTX 1050 Ti will run 20 to 30 percent faster than our configured Odyssey while upgrading from systems powered by the older GTX 950M will bring a massive performance boost of about 50 to 60 percent.
See our dedicated review page on the GTX 1050 for more information on the GPU.
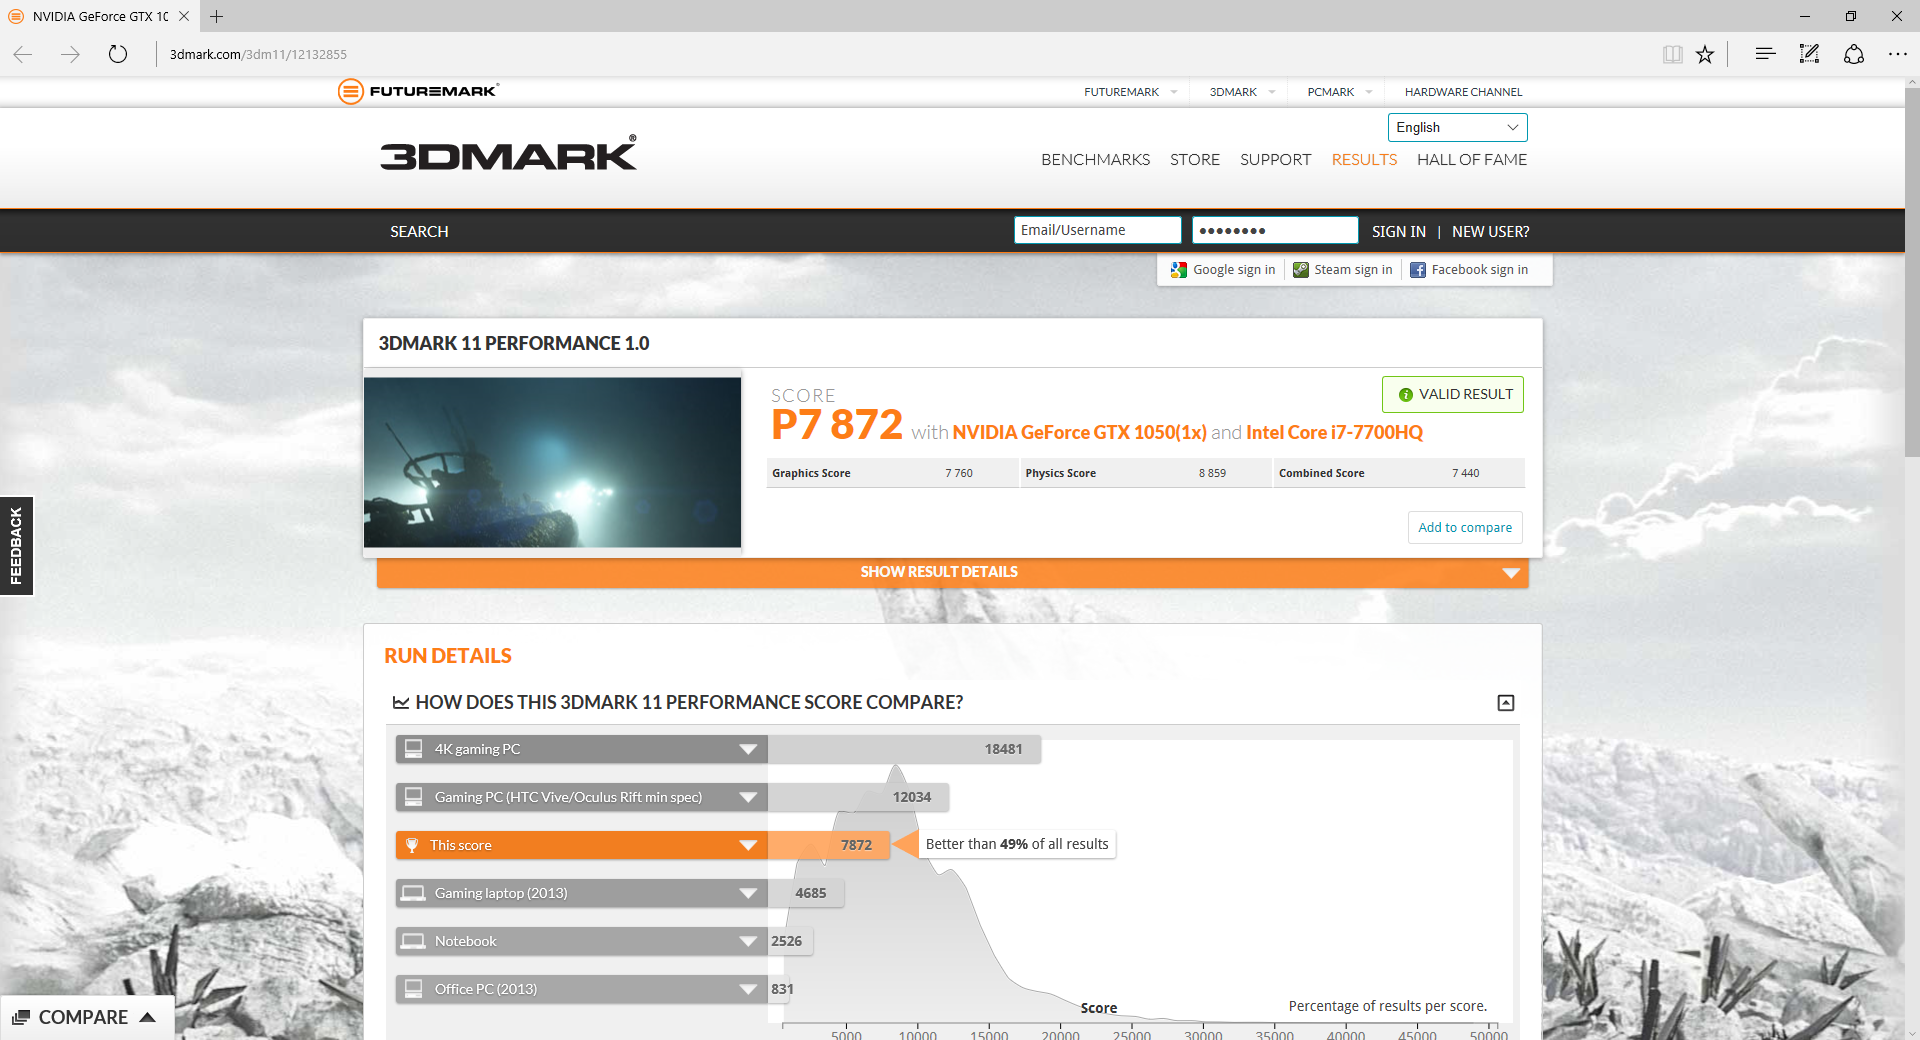
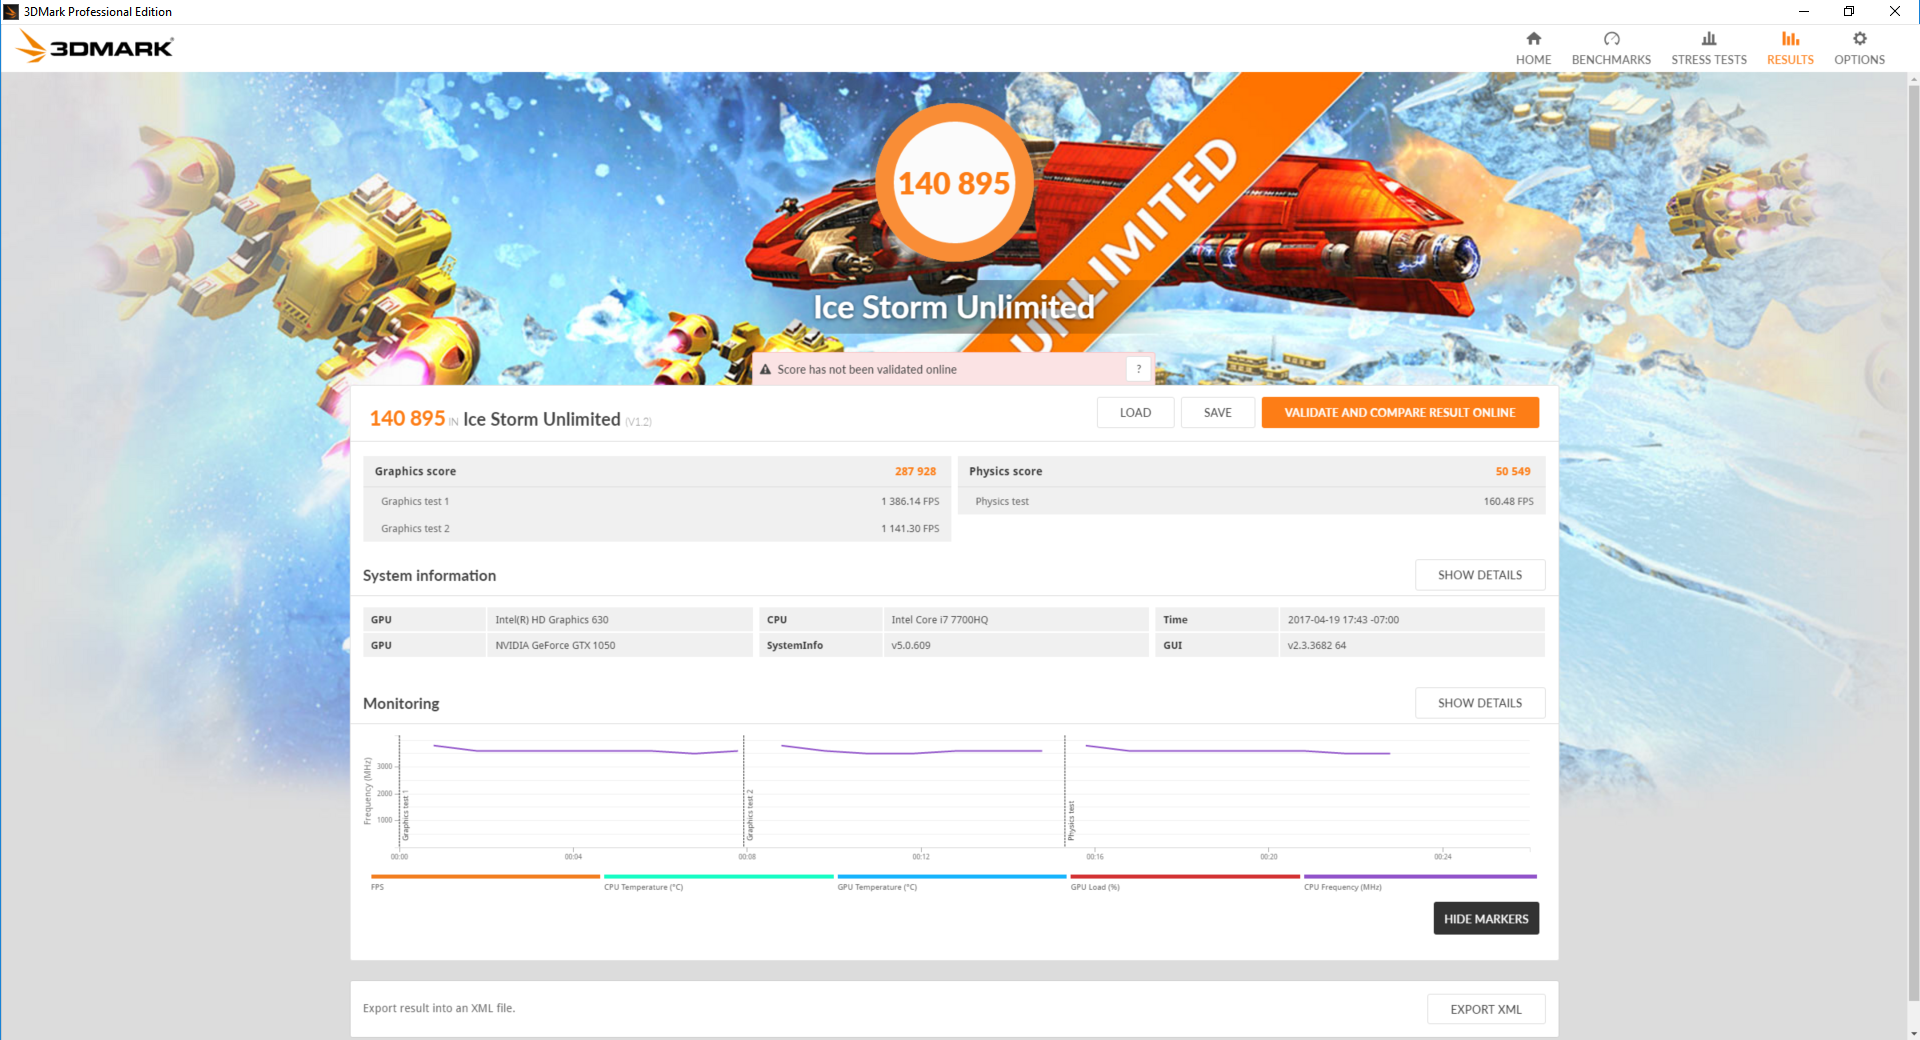
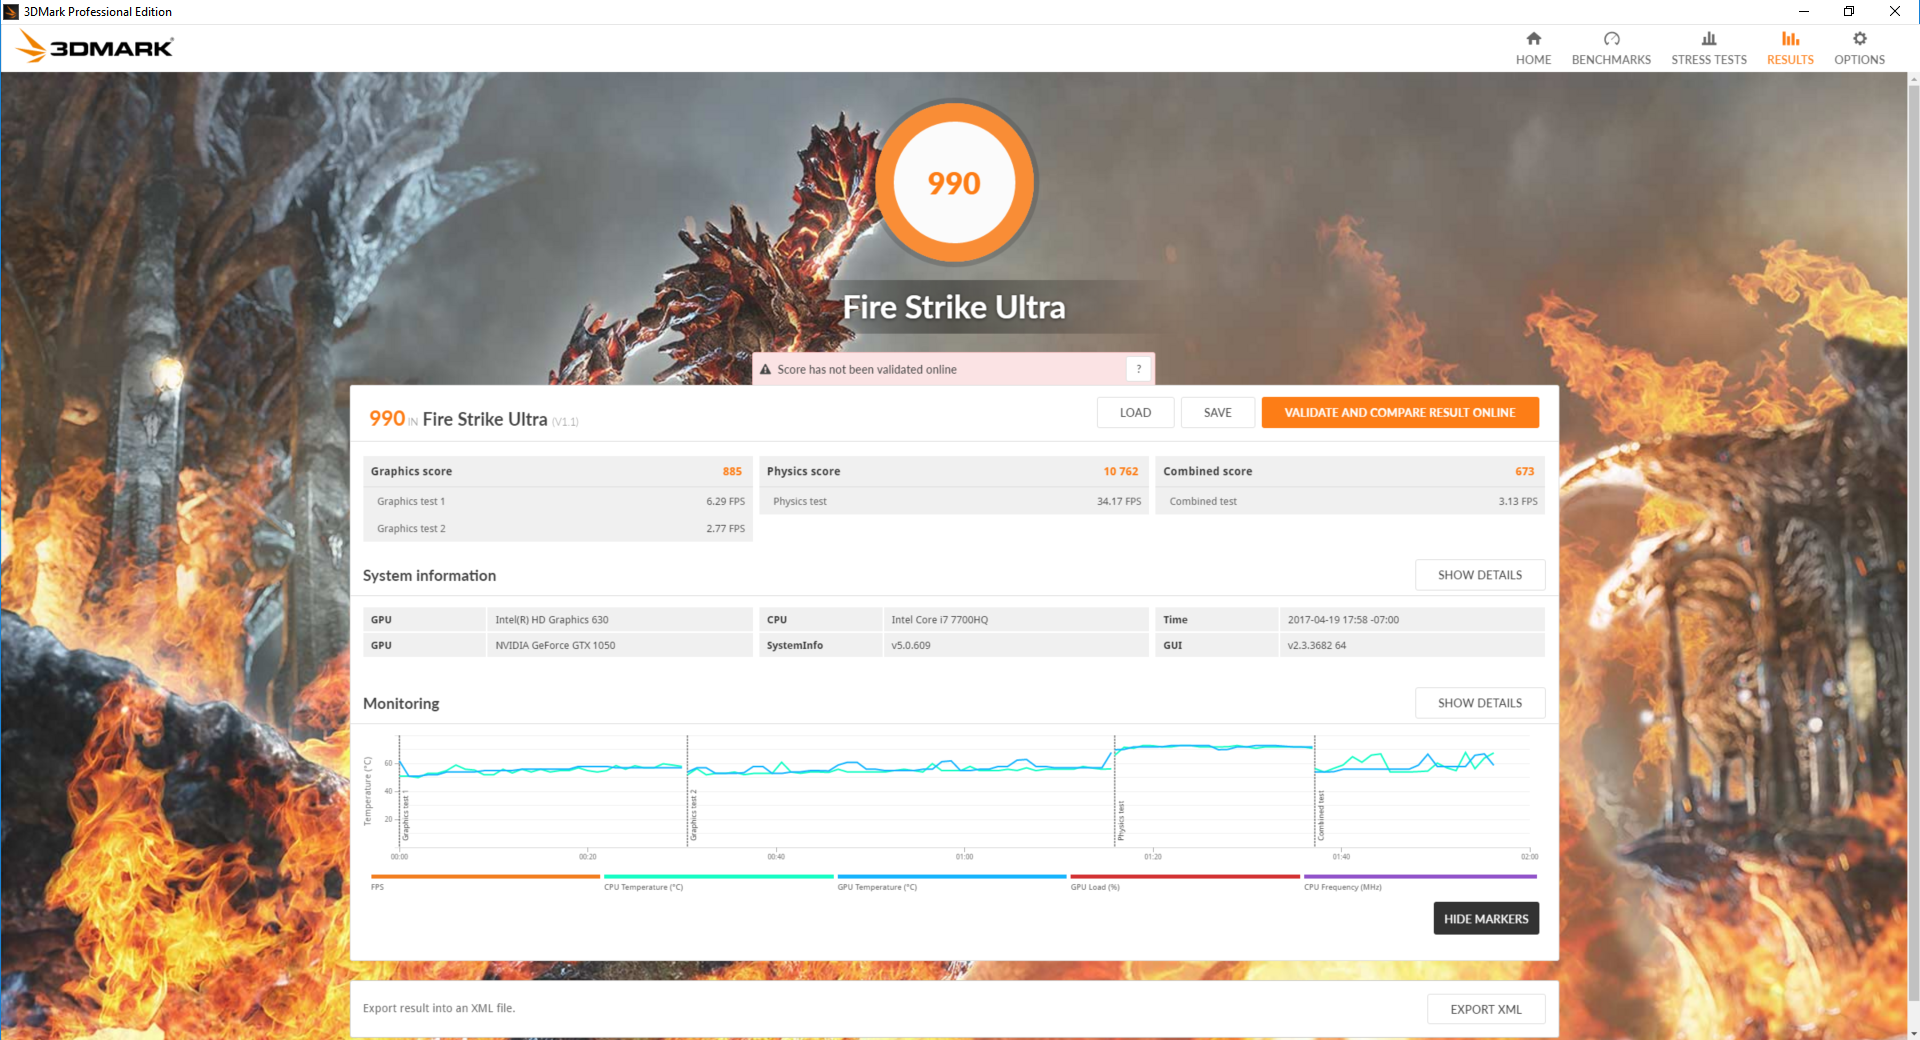
| 3DMark 11 Performance | 7872 points | |
| 3DMark Ice Storm Standard Score | 84774 points | |
| 3DMark Cloud Gate Standard Score | 20291 points | |
| 3DMark Fire Strike Score | 5455 points | |
| 3DMark Fire Strike Extreme Score | 2678 points | |
Help | ||
Gaming Performance
Despite being a low-end GTX solution, the GTX 1050 is a very capable GPU for mainstream 1080p gaming. Performance is impressive considering the meager 2 GB of VRAM as users can crank up graphical settings and still expect average frame rates to remain well above 30 FPS. In comparison, the older GTX 960M has a tougher time maintaining 30 FPS under similar 1080p settings and the GTX 950M is even worse. Gamers demanding 1080p60 will need to turn down settings to Medium or even lower for the more demanding titles. We recommend keeping texture quality in the Medium range or disabling special Nvidia effects if frame rates being to stutter due to the limited VRAM.
See our dedicated GPU page on the GTX 1050 for more benchmarks and comparisons.
| low | med. | high | ultra | |
|---|---|---|---|---|
| BioShock Infinite (2013) | 63.6 | |||
| Metro: Last Light (2013) | 78 | 43.8 | ||
| Thief (2014) | 73 | 40.4 | ||
| The Witcher 3 (2015) | 43 | 20.8 | ||
| Batman: Arkham Knight (2015) | 91 | 79 | 47 | 25 |
| Dota 2 Reborn (2015) | 115 | |||
| Fallout 4 (2015) | 41.5 | 34.2 | ||
| Rise of the Tomb Raider (2016) | 70.1 | 38.7 | 33.4 | |
| Ashes of the Singularity (2016) | 54.7 | 34.1 | 29.6 | |
| Doom (2016) | 47.5 | 43.5 | ||
| Overwatch (2016) | 95.3 | 54.2 |
Stress Test
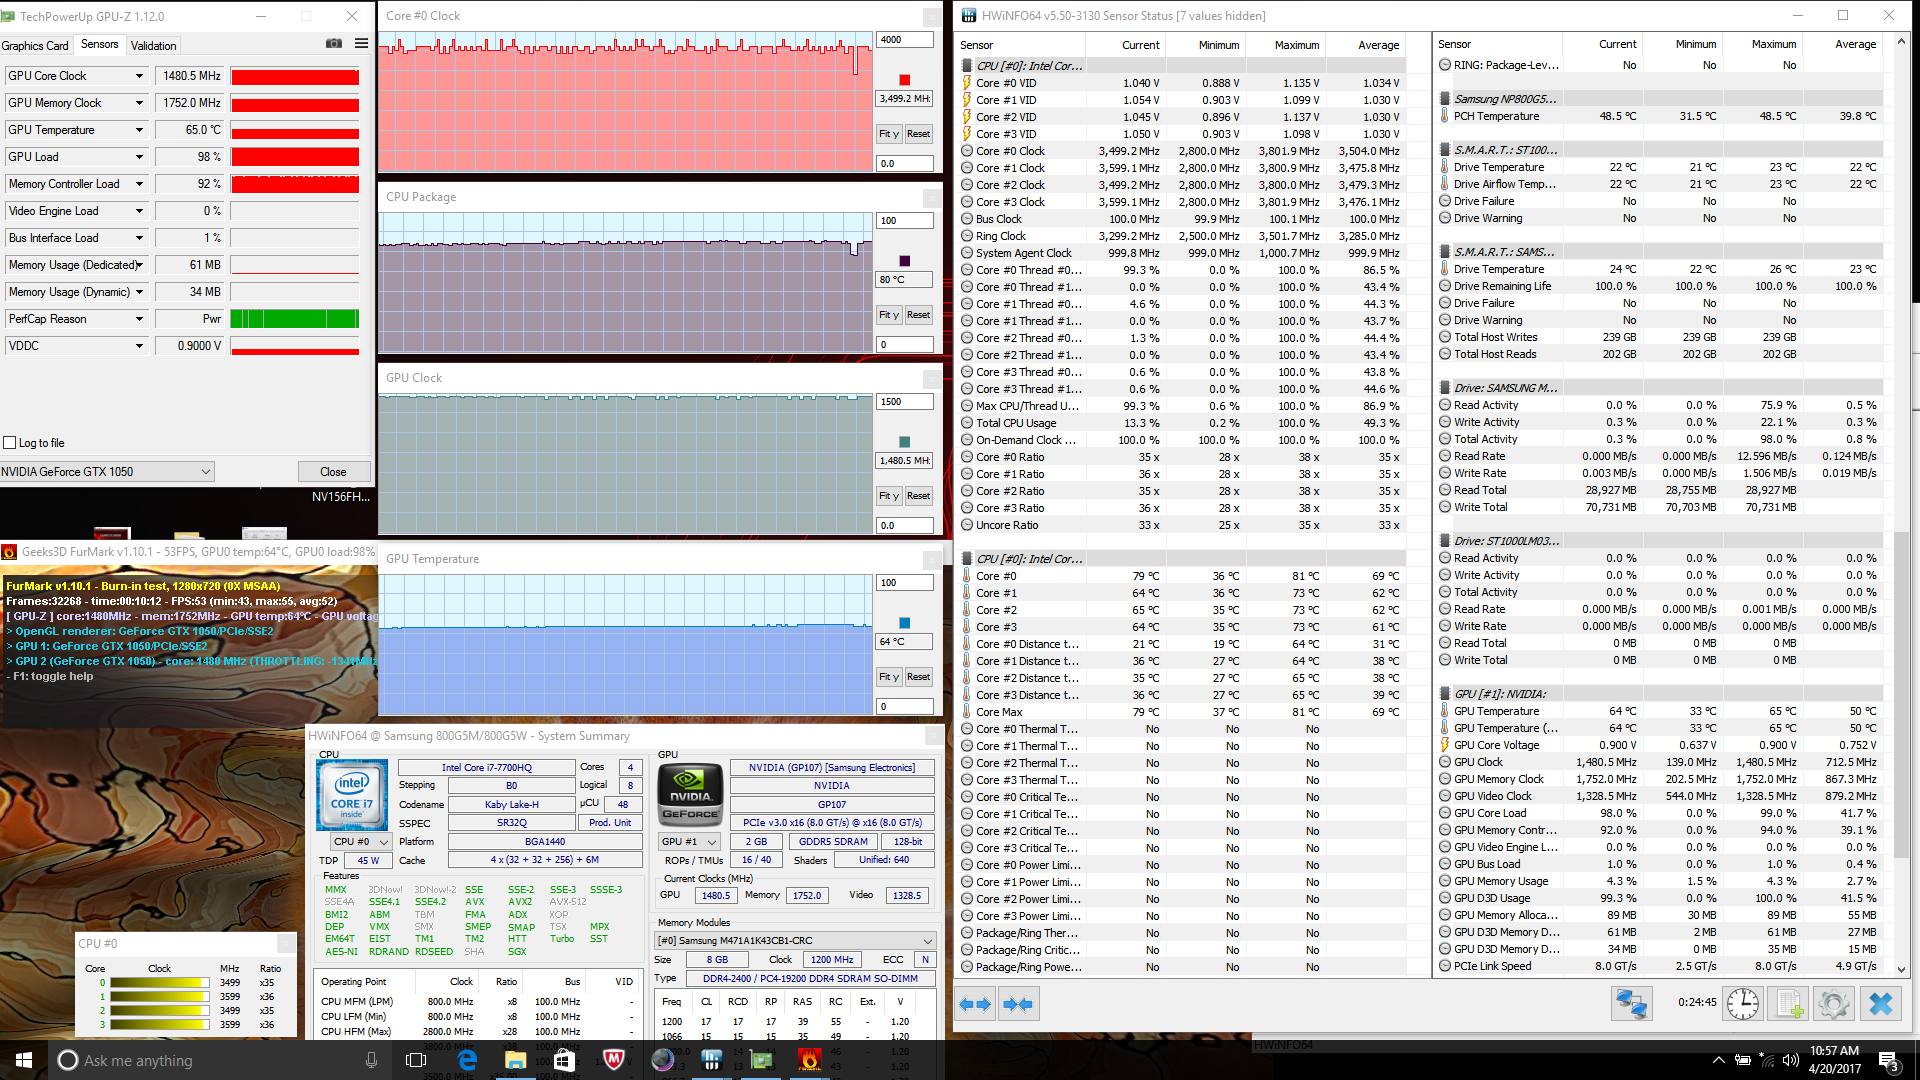
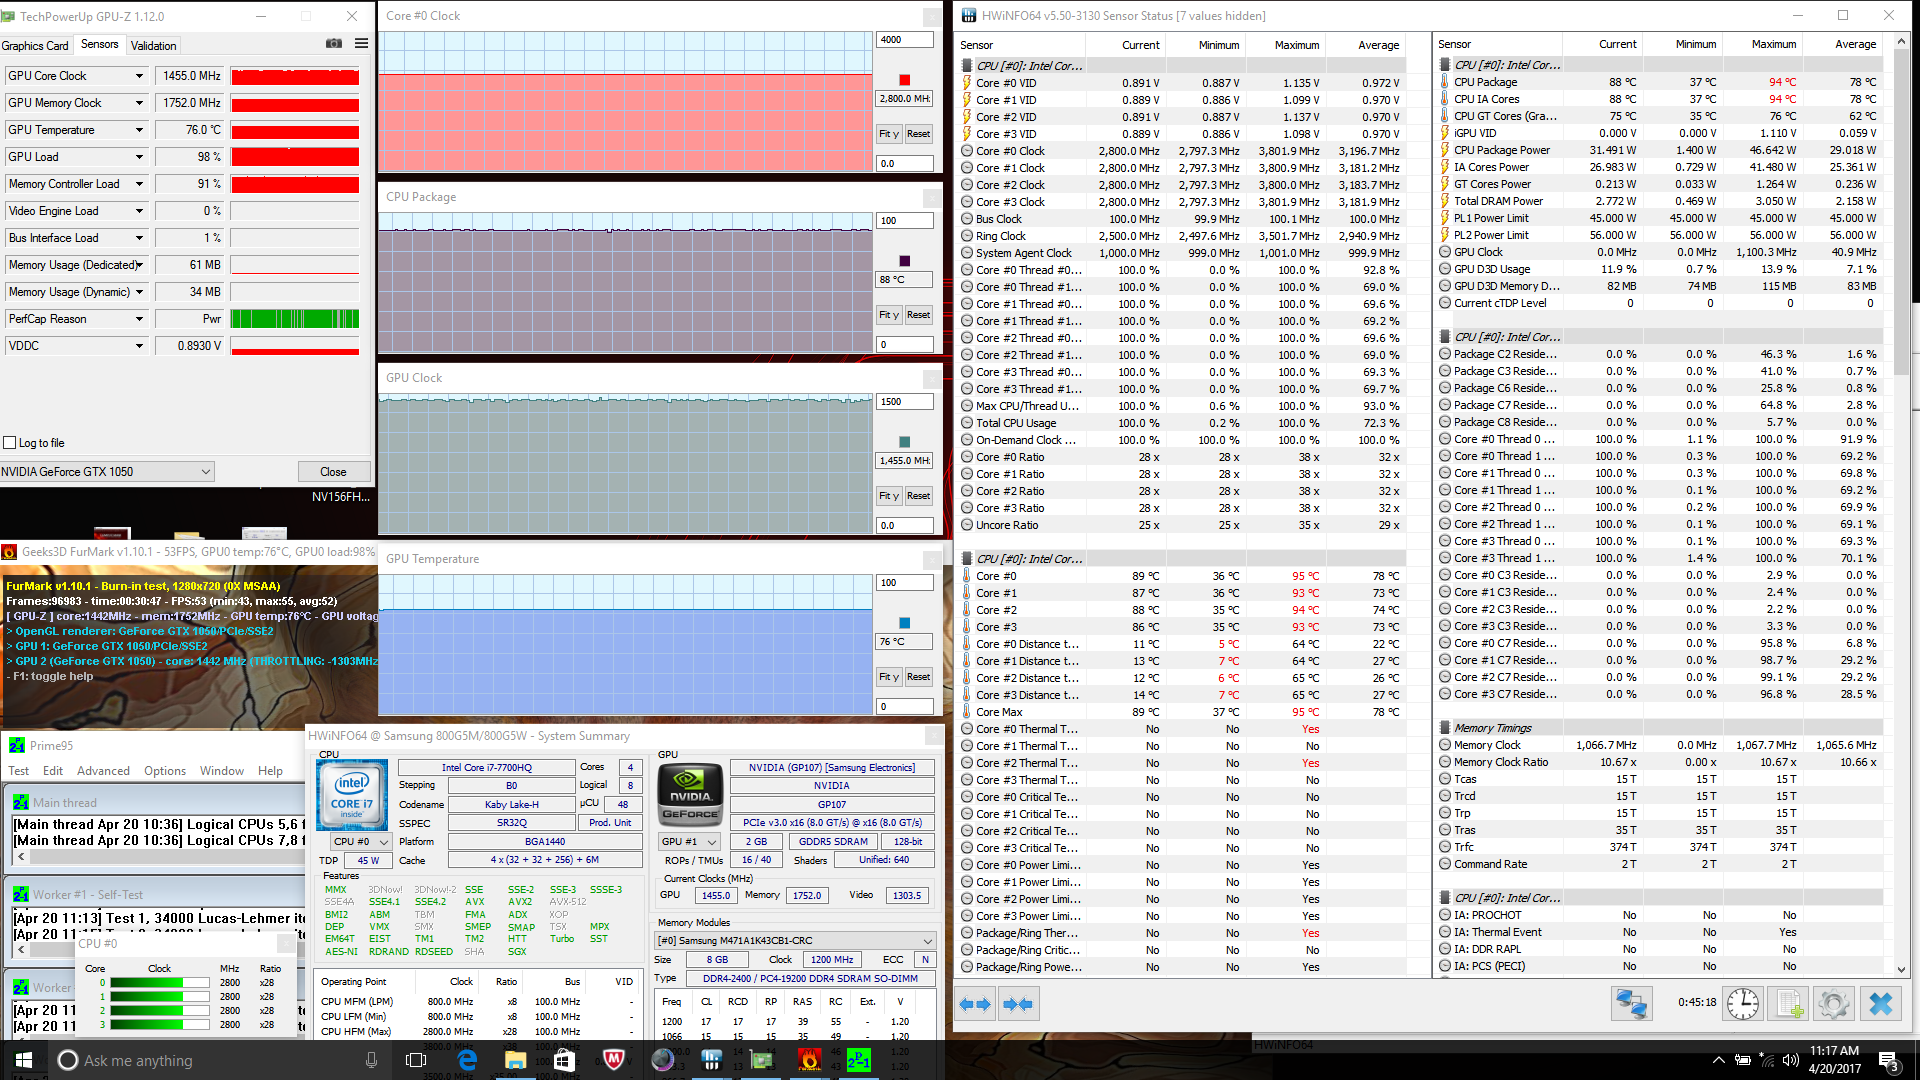
We stress the notebook to identify for any throttling or stability issues. The Odyssey performs very well as it is able to sustain a very high Turbo Boost of 3.4 GHz and a reasonable CPU temperature of 76 C when under Prime95 stress. Running both Prime95 and FurMark simultaneously will bring the CPU down to its base 2.8 GHz clock rate, so users won't need to worry about heavy throttling issues during use. These unrealistic loads can cause the CPU and GPU to run as warm as 88 C and 76 C, respectively.
Witcher 3 stress is more representative of what gamers will experience. The CPU and GPU maintain relatively cool core temperatures in the mid 60 C range compared to the 70 C to 80 C range on the similarly equipped XPS 15. Boost clock rates are maintained on both processors with no drop in frame rates over time as shown by our hour-long frame rate data below.
Running on batteries will throttle both CPU and GPU power. A 3DMark 11 run on batteries returns Physics and Graphics scores of 6965 and 3450 points, respectively, compared to 8859 and 7760 points when on mains. We recommend disabling any GPU power-saving features such as FPS limiters if higher performance is required.
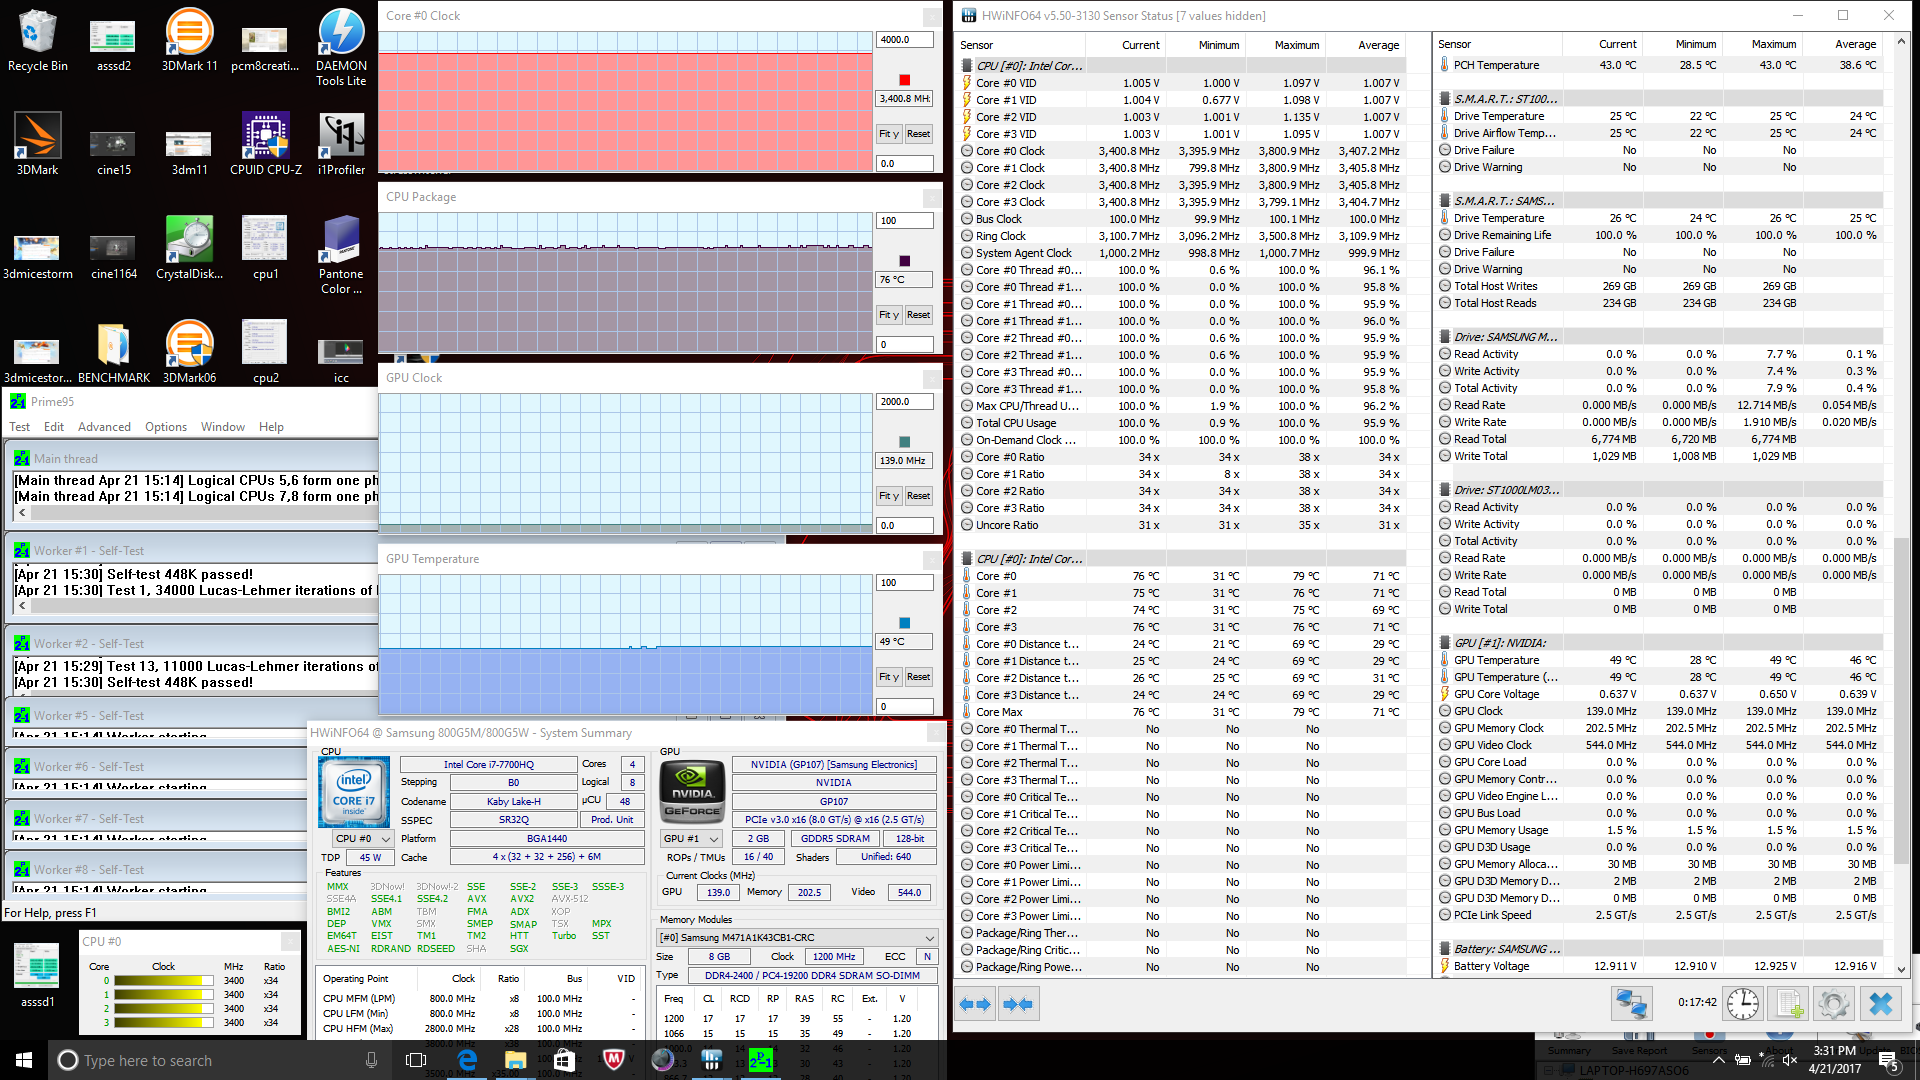
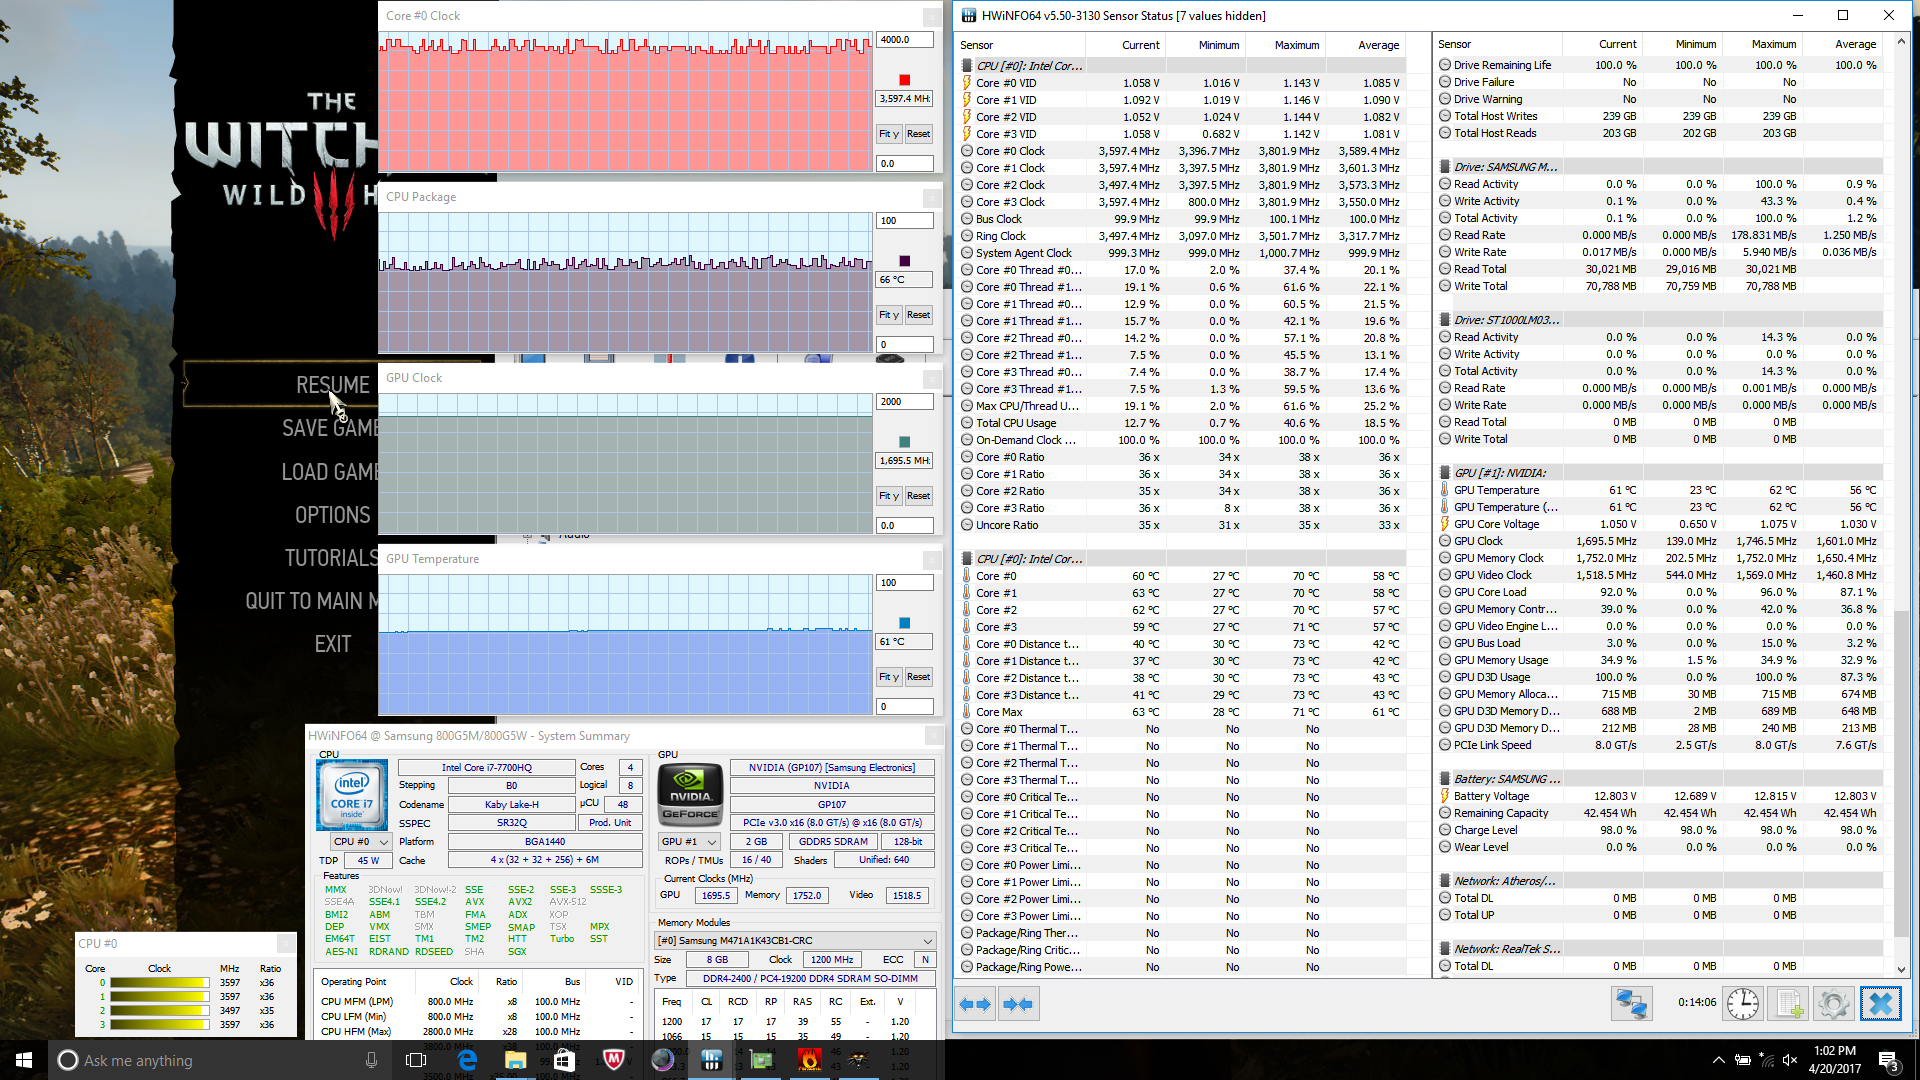
| CPU Clock (GHz) | GPU Clock (MHz) | Average CPU Temperature (°C) | Average GPU Temperature (°C) | |
| Prime95 Stress | 3.4 | -- | 76 | 49 |
| FurMark Stress | -- | 1481 | 80 | 64 |
| Prime95 + FurMark Stress | 2.8 | 1455 | 88 | 76 |
| Witcher 3 Stress | 3.5+ | 1696 | 66 | 61 |
Emissions
System Noise
The cooling system consists of twin 50 mm fans paired with two heat pipes atop the CPU and GPU. At least one fan is always active no matter the system load according to the Odyssey Control software, but fan noise is thankfully quiet when under idling processing loads at just 29 dB(A) against a silent background of 28 dB(A). Web browsing may bump the fans to 30 or 31 dB(A), which is still more than acceptable for word processing or video playback.
The main problem lies in how loud the fans can become when gaming. Fan noise picks up quickly when launching demanding applications and gaming for short periods will induce a constant fan noise of just over 49 dB(A). Simply running 3DMark will also bring the system up to this noise level and this is already significantly louder than the similarly equipped Pavilion 15t. As another example, the Asus FX502VM is more powerful than the Odyssey yet its fans are measurably quieter when under similar gaming loads. In this case, Odyssey users are sacrificing quieter fan noise in order to obtain those aforementioned cooler processor temperatures.
We can otherwise notice no coil whine on our test unit.
Noise level
| Idle |
| 28.1 / 29.1 / 29.1 dB(A) |
| HDD |
| 29.1 dB(A) |
| Load |
| 49.2 / 49.2 dB(A) |
 | ||
30 dB silent 40 dB(A) audible 50 dB(A) loud |
||
min: | ||
| Samsung Odyssey NP800G5M-X01US GeForce GTX 1050 Mobile, i7-7700HQ, Samsung PM961 NVMe MZVLW128HEGR | Asus FX502VM-AS73 GeForce GTX 1060 Mobile, i7-7700HQ, SK Hynix HFS256G39TND-N210A | HP Pavilion 15t-bc200 X7P44AV GeForce GTX 1050 Mobile, i7-7700HQ, Intel SSD 600p SSDPEKKW256G7 | Dell XPS 15 9560 (i7-7700HQ, UHD) GeForce GTX 1050 Mobile, i7-7700HQ, Lite-On CX2-8B512-Q11 | Gigabyte P55W v7 GeForce GTX 1060 Mobile, i7-7700HQ, Liteonit CV3-8D256 | Apple MacBook Pro 15 2016 (2.9 GHz, 460) Radeon Pro 460, 6920HQ, Apple SSD SM1024L | |
|---|---|---|---|---|---|---|
| Noise | -4% | -3% | -1% | -7% | 3% | |
| off / environment * (dB) | 28.1 | 28.7 -2% | 28.9 -3% | 28.4 -1% | 30 -7% | 29 -3% |
| Idle Minimum * (dB) | 28.1 | 30.6 -9% | 32.3 -15% | 29 -3% | 33 -17% | 30.3 -8% |
| Idle Average * (dB) | 29.1 | 30.6 -5% | 32.3 -11% | 29 -0% | 34 -17% | 30.3 -4% |
| Idle Maximum * (dB) | 29.1 | 31 -7% | 32.3 -11% | 32.2 -11% | 35 -20% | 30.3 -4% |
| Load Average * (dB) | 49.2 | 46.2 6% | 43.2 12% | 47.1 4% | 39 21% | 35.1 29% |
| Load Maximum * (dB) | 49.2 | 52.3 -6% | 45.2 8% | 47.1 4% | 50 -2% | 46 7% |
| Witcher 3 ultra * (dB) | 52 |
* ... smaller is better
Temperature
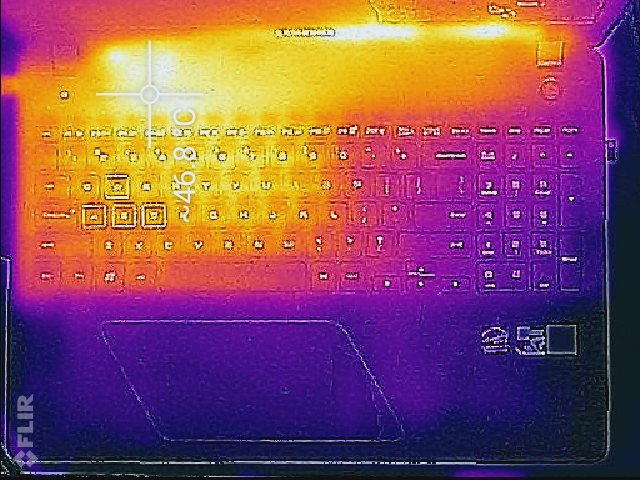
Surface temperatures are relatively flat during low loads with the rear quadrants being warmer than the front due to the design of the cooling solution. When under extreme loads, the left-hand side of the keyboard will become extremely warm at almost 50 C as shown by our temperature maps below. The positioning of both the CPU and GPU almost directly underneath the WASD keys has us scratching our heads as most gaming notebooks have been designed to avoid this. Expect these keys to be as warm as 40 C when gaming for sweaty fingers.
Fortunately, the palm rests and trackpad remain cool no matter the system load since only the HDD and battery occupy the space underneath. The rear ventilation grilles ensure that the left- and right-hand sides of the table don't become too warm.
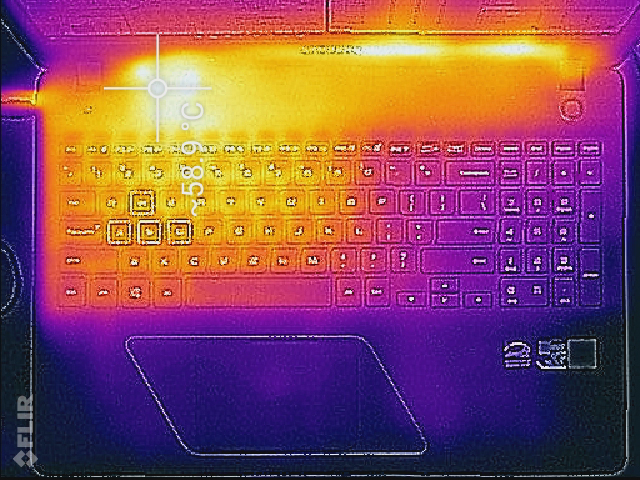
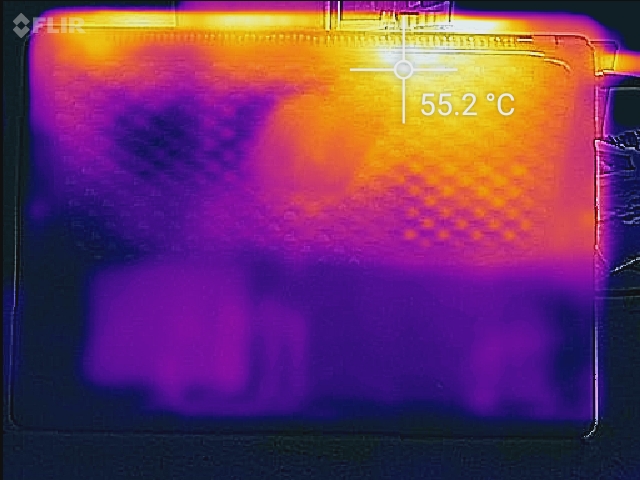
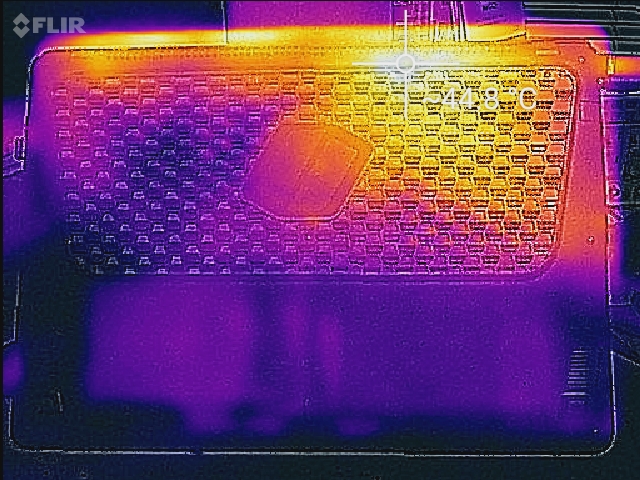
(-) The maximum temperature on the upper side is 58.4 °C / 137 F, compared to the average of 40.4 °C / 105 F, ranging from 21.2 to 68.8 °C for the class Gaming.
(-) The bottom heats up to a maximum of 54.2 °C / 130 F, compared to the average of 43.2 °C / 110 F
(+) In idle usage, the average temperature for the upper side is 25.4 °C / 78 F, compared to the device average of 33.9 °C / 93 F.
(±) Playing The Witcher 3, the average temperature for the upper side is 33.8 °C / 93 F, compared to the device average of 33.9 °C / 93 F.
(+) The palmrests and touchpad are cooler than skin temperature with a maximum of 27 °C / 80.6 F and are therefore cool to the touch.
(±) The average temperature of the palmrest area of similar devices was 28.8 °C / 83.8 F (+1.8 °C / 3.2 F).
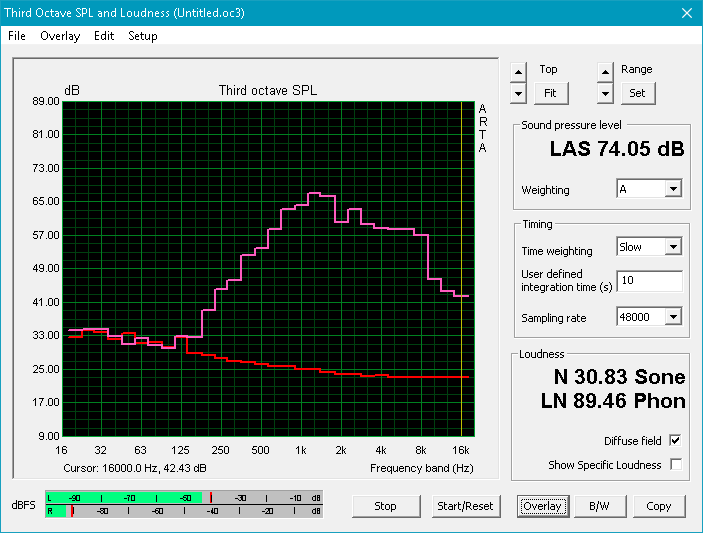
Speakers

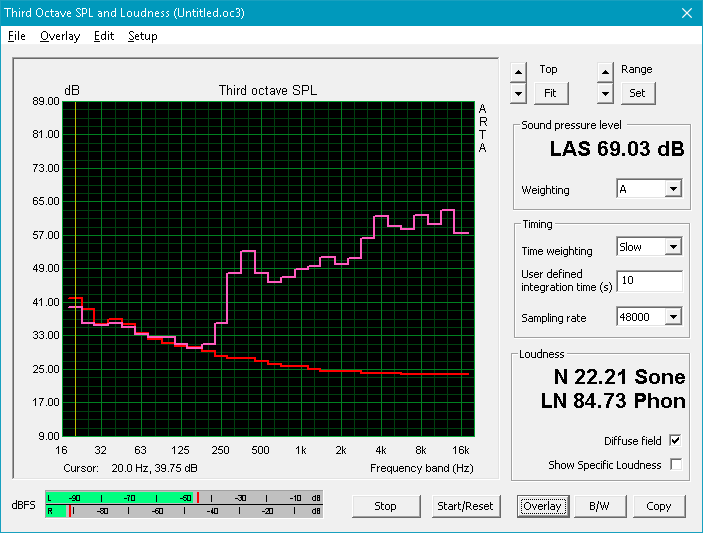
The 1.5 W stereo speakers are not as loud as other multimedia 15-inch notebooks including the Pavilion 15t. In turn, balance is slightly better and treble is not over-represented during music or video playback. Bass is still lacking as shown by the sudden drop off at the 250 Hz mark. Fortunately, maximum volume introduces no static or chassis reverberations. The 3.5 mm audio jack is plug-and-play without any issues and is definitely recommended when gaming to avoid the fan noise.
Samsung Odyssey NP800G5M-X01US audio analysis
(-) | not very loud speakers (63.1 dB)
Bass 100 - 315 Hz
(-) | nearly no bass - on average 15.2% lower than median
(±) | linearity of bass is average (13.7% delta to prev. frequency)
Mids 400 - 2000 Hz
(+) | balanced mids - only 2% away from median
(±) | linearity of mids is average (10.1% delta to prev. frequency)
Highs 2 - 16 kHz
(±) | higher highs - on average 8.4% higher than median
(±) | linearity of highs is average (11.5% delta to prev. frequency)
Overall 100 - 16.000 Hz
(-) | overall sound is not linear (37.2% difference to median)
Compared to same class
» 99% of all tested devices in this class were better, 0% similar, 1% worse
» The best had a delta of 6%, average was 18%, worst was 132%
Compared to all devices tested
» 94% of all tested devices were better, 1% similar, 5% worse
» The best had a delta of 4%, average was 23%, worst was 134%
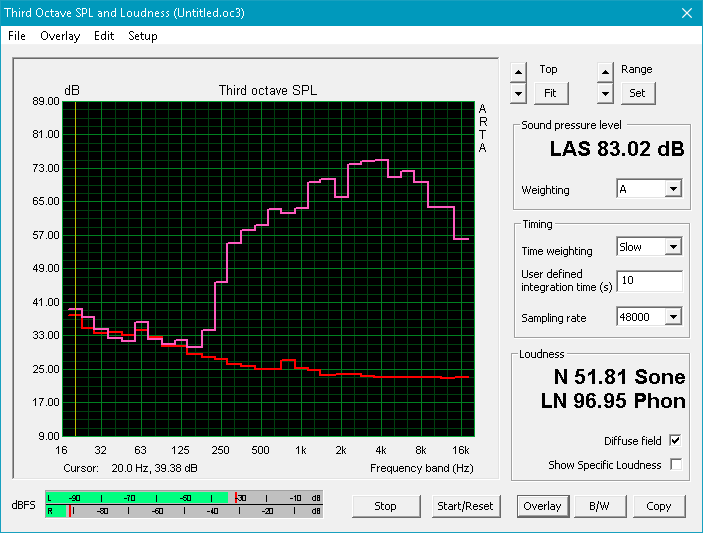
Apple MacBook 12 (Early 2016) 1.1 GHz audio analysis
(+) | speakers can play relatively loud (83.6 dB)
Bass 100 - 315 Hz
(±) | reduced bass - on average 11.3% lower than median
(±) | linearity of bass is average (14.2% delta to prev. frequency)
Mids 400 - 2000 Hz
(+) | balanced mids - only 2.4% away from median
(+) | mids are linear (5.5% delta to prev. frequency)
Highs 2 - 16 kHz
(+) | balanced highs - only 2% away from median
(+) | highs are linear (4.5% delta to prev. frequency)
Overall 100 - 16.000 Hz
(+) | overall sound is linear (10.2% difference to median)
Compared to same class
» 7% of all tested devices in this class were better, 2% similar, 90% worse
» The best had a delta of 5%, average was 18%, worst was 53%
Compared to all devices tested
» 5% of all tested devices were better, 1% similar, 94% worse
» The best had a delta of 4%, average was 23%, worst was 134%
Frequency Comparison (Checkbox selectable!)
Graph 1: Pink Noise 100% Vol.; Graph 2: Audio off
Energy Management
Power Consumption
Idling on desktop draws about 6 W to 11 W depending on the Power Profile and brightness setting not unlike the XPS 15 FHD SKU. Running 3DMark 06 demands almost 82 W or about 25 W less than the FX502VM and its GTX 1060 GPU. Overall power consumption results are in line with what we expect considering the GTX 1050 GPU and i7-7700HQ CPU.
Maximum load with Prime95 and FurMark will demand just under 123 W from a relatively large (14.5 x 7.5 x 4 cm) 120 W power adapter. It's uncommon for us to record consumption numbers that meet or exceed the rated capacity of the external PSU, so this is definitely an area for improvement should Samsung launch more Odyssey models in the future. This also indicates that Samsung likely has no plans to launch a 15-inch Odyssey with higher-end components very soon as this would require a more powerful AC adapter in the process.
| Off / Standby | |
| Idle | |
| Load |
|
Key:
min: | |
| Samsung Odyssey NP800G5M-X01US | Asus FX502VM-AS73 | Dell XPS 15 2017 9560 (7300HQ, Full-HD) | Asus ROG Strix GL553VD-DS71 | Gigabyte P55W v7 | Apple MacBook Pro 15 2016 (2.9 GHz, 460) | |
|---|---|---|---|---|---|---|
| Power Consumption | -57% | 0% | -12% | -28% | 14% | |
| Idle Minimum * (Watt) | 6.7 | 14.9 -122% | 6.6 1% | 7.7 -15% | 8 -19% | 3 55% |
| Idle Average * (Watt) | 8.9 | 15.1 -70% | 9 -1% | 11.7 -31% | 13 -46% | 9.9 -11% |
| Idle Maximum * (Watt) | 10.8 | 15.2 -41% | 10.7 1% | 12 -11% | 18 -67% | 12.5 -16% |
| Load Average * (Watt) | 81.8 | 105.8 -29% | 77.5 5% | 80.5 2% | 76 7% | 70.6 14% |
| Witcher 3 ultra * (Watt) | 92.2 | |||||
| Load Maximum * (Watt) | 122.7 | 148.8 -21% | 130 -6% | 128.4 -5% | 143 -17% | 90.8 26% |
* ... smaller is better
Battery Life
At just 43 Wh, the Odyssey uses one of the smallest internal battery packs for a 15.6-inch gaming notebook. Pricier alternatives like the Asus FX502VM or Gigabyte P55W v7 have battery capacities almost 50 percent larger. Even with this in mind, runtimes on the Samsung are average for its class at almost 4.5 hours of real-world WLAN use. Idling on desktop and on the minimum display brightness setting will last just over 10 hours before automatic shutdown, so users should be able to squeeze out more than just 4.5 hours of use for undemanding tasks.
Charging from near empty to full capacity will take 2 hours with the included AC adapter.
| Samsung Odyssey NP800G5M-X01US i7-7700HQ, GeForce GTX 1050 Mobile, 43 Wh | Asus FX502VM-AS73 i7-7700HQ, GeForce GTX 1060 Mobile, 64 Wh | Dell XPS 15 2017 9560 (7300HQ, Full-HD) i5-7300HQ, GeForce GTX 1050 Mobile, 56 Wh | Asus ROG Strix GL553VD-DS71 i7-7700HQ, GeForce GTX 1050 Mobile, 48 Wh | Gigabyte P55W v7 i7-7700HQ, GeForce GTX 1060 Mobile, 63 Wh | Apple MacBook Pro 15 2016 (2.9 GHz, 460) 6920HQ, Radeon Pro 460, 76 Wh | |
|---|---|---|---|---|---|---|
| Battery runtime | -17% | 9% | -20% | 28% | 52% | |
| Reader / Idle (h) | 10.2 | 6.1 -40% | 9.4 -8% | 7.3 -28% | 13.2 29% | |
| WiFi v1.3 (h) | 4.4 | 4.6 5% | 5.6 27% | 4.6 5% | 5.8 32% | 10.3 134% |
| Load (h) | 1.3 | 1.1 -15% | 1.4 8% | 0.8 -38% | 1.6 23% | 0.9 -31% |
Pros
Cons
Verdict
Our impressions on the first Odyssey notebook are a mixed bag. On one hand, the system performs admirably with no CPU or GPU throttling and runs at acceptably low operating temperatures for a gaming notebook. Its ability to maintain high Turbo Boost clock rates is something that super-thin gaming notebooks tend to struggle with, so the Odyssey has at least gotten core performance down to a tee.
Outside of its reliable performance, the Odyssey struggles with other factors. Most notably, fan noise is very load when gaming even for a gaming notebook. At nearly 50 dB(A), this range is expected from more powerful GPUs like the GTX 1070 or GTX 1080 - not the GTX 1050. Manual fan controls would have gone a long way to letting the user balance noise and core temperatures for more enjoyable gaming experiences.
Cut corners also become more obvious the longer we spend with the notebook. The SD reader is slow, connectivity features are barebones, GPU VRAM is halved, battery capacity is small, and both contrast and colors aren't as deep as on costlier alternatives. The extra warm WASD keys is also a strange design decision; a car manufacturer would never design uncomfortably warm steering wheels for the same reason that a gaming notebook should never have uncomfortably warm WASD keys.
The HP Pavilion 15t with the same CPU and GPU also retails in the $1100 to $1200 USD price range as does our configured Odyssey. While the Samsung excels in core performance, it's merely run-of-the-mill in nearly every other aspect and doesn't offer enough to propel it over other GTX 1050 notebooks.
The first Samsung Odyssey gaming notebook is finally available and.. it is dull and nothing special. CPU and GPU performances are great with no throttling, but fan noise is severe.
Samsung Odyssey NP800G5M-X01US
- 04/24/2017 v6 (old)
Allen Ngo
Price comparison
