MSI GT62VR 7RE Dominator Pro Notebook Review
For the original German review, see here.
The MSI GT62VR 7RE is the successor of the identically designed GT62VR 6RE Dominator Pro, which we had already under review. With the current model, MSI has replaced the Skylake processors with Kaby Lake processors. Competitors are devices such as the Alienware 15 R3, the Schenker XMG P507 PRO, and the Acer Predator 15.
Since the GT62VR 7RE and its predecessor share the same design, we will not cover case, connectivity, display, input devices, and speakers in detail here. Please refer to our GT62VR 6RE review for information about these.
SD card reader
| SD Card Reader | |
| average JPG Copy Test (av. of 3 runs) | |
| MSI GT62VR 7RE-223 | |
| MSI GT62VR-6RE16H21 | |
| Acer Predator 15 G9-593-765Q | |
| Schenker XMG P507 PRO | |
| maximum AS SSD Seq Read Test (1GB) | |
| MSI GT62VR 7RE-223 | |
| MSI GT62VR-6RE16H21 | |
| Acer Predator 15 G9-593-765Q | |
| Schenker XMG P507 PRO | |
Communication
| Networking | |
| iperf3 transmit AX12 | |
| Acer Predator 15 G9-593-765Q | |
| MSI GT62VR 7RE-223 | |
| Alienware 15 R3 | |
| Schenker XMG P507 PRO | |
| iperf3 receive AX12 | |
| Alienware 15 R3 | |
| Schenker XMG P507 PRO | |
| Acer Predator 15 G9-593-765Q | |
| MSI GT62VR 7RE-223 | |
Display
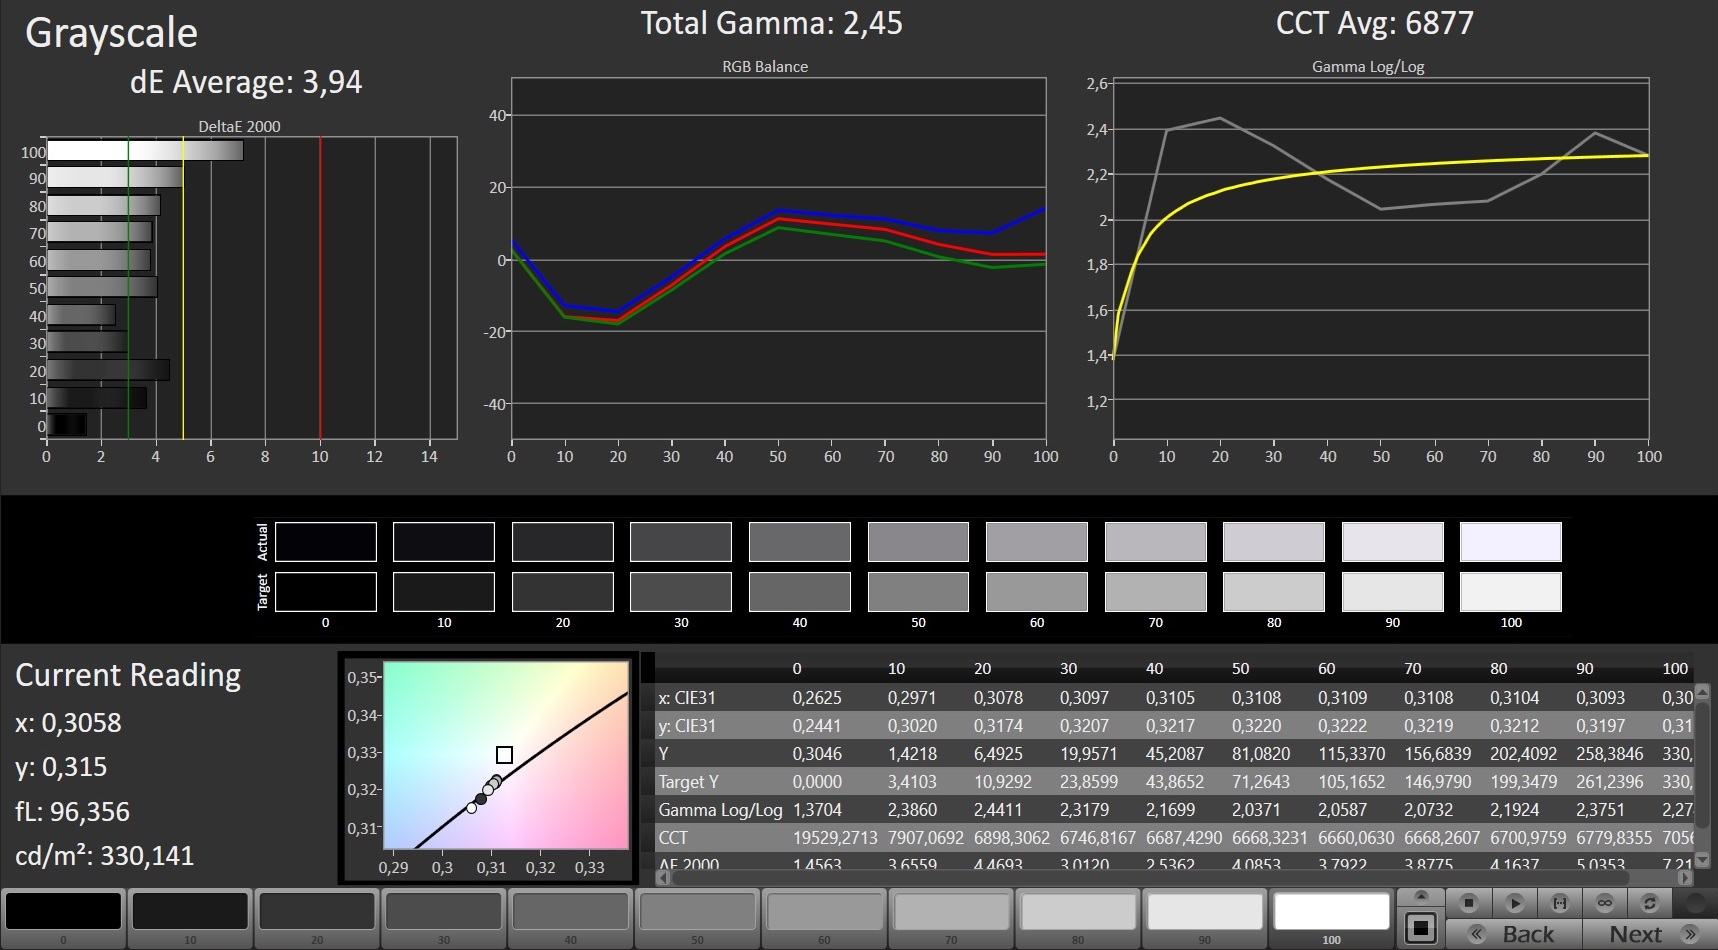
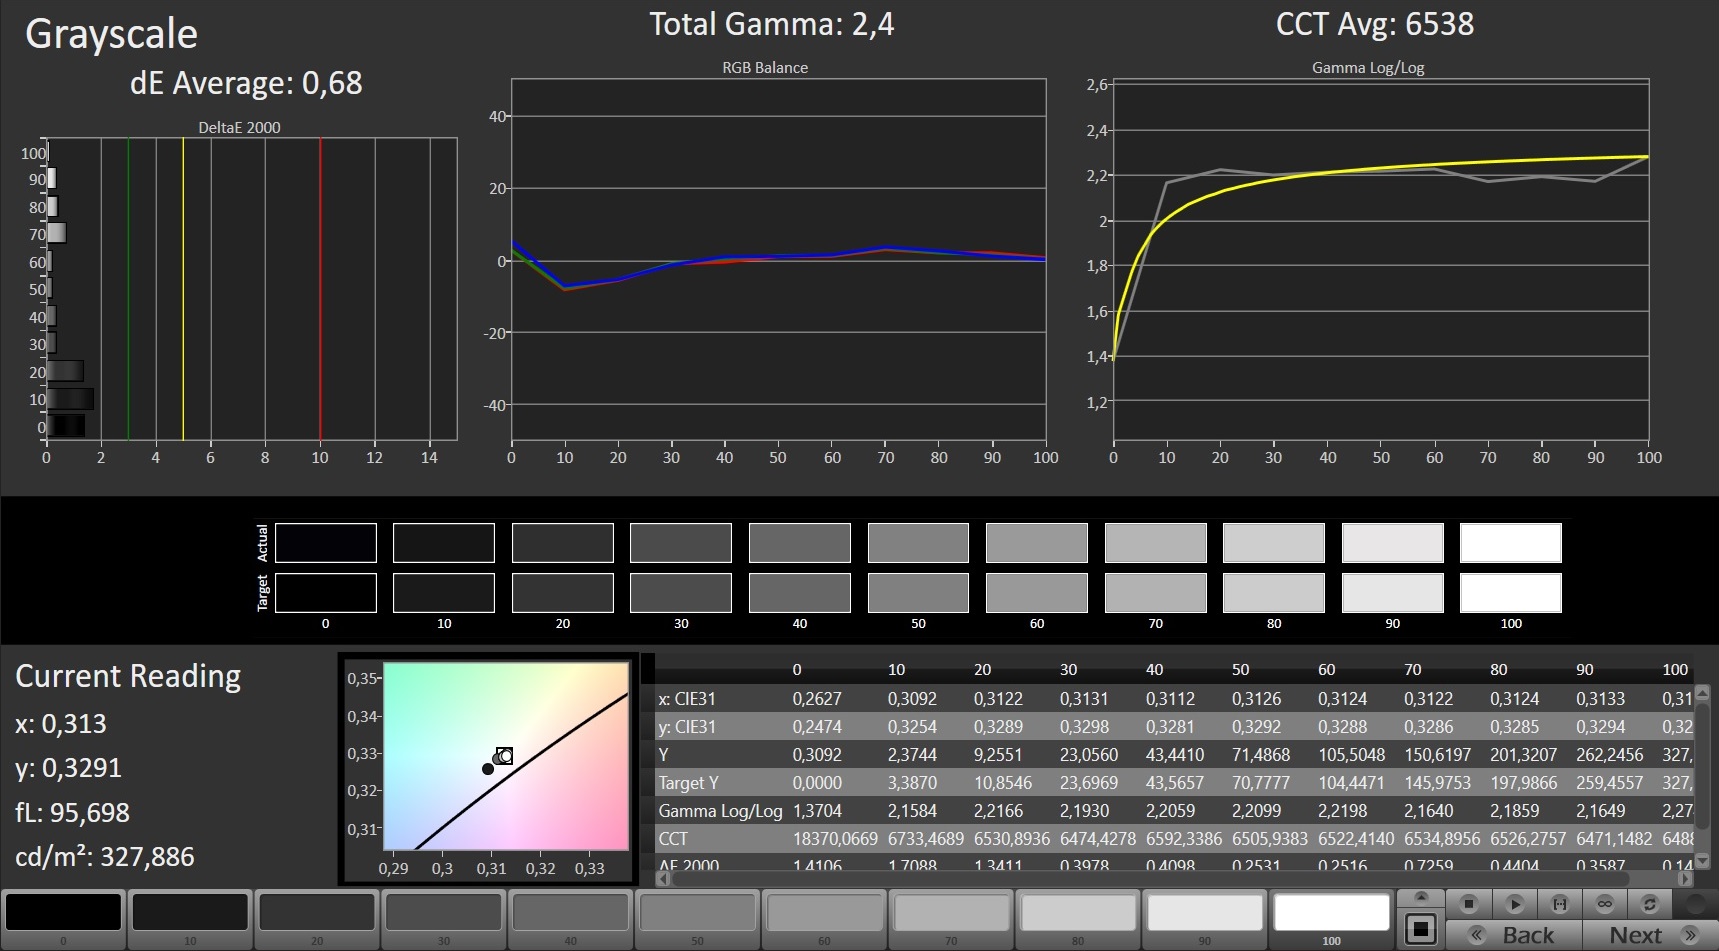
The GT62VR 7RE uses the same contrast-rich and viewing-angle-stable Full HD IPS display as its predecessor. The measurement values are slightly different, but this is usual. Two identical displays are never absolutely the same.
The panel supports Nvidia's G-Sync technology, which dynamically adjusts the frame rates of display and GPU to each other. This is supposed to give as smooth an image as possible; especially in computer games.
| |||||||||||||||||||||||||
Brightness Distribution: 85 %
Center on Battery: 310 cd/m²
Contrast: 1033:1 (Black: 0.3 cd/m²)
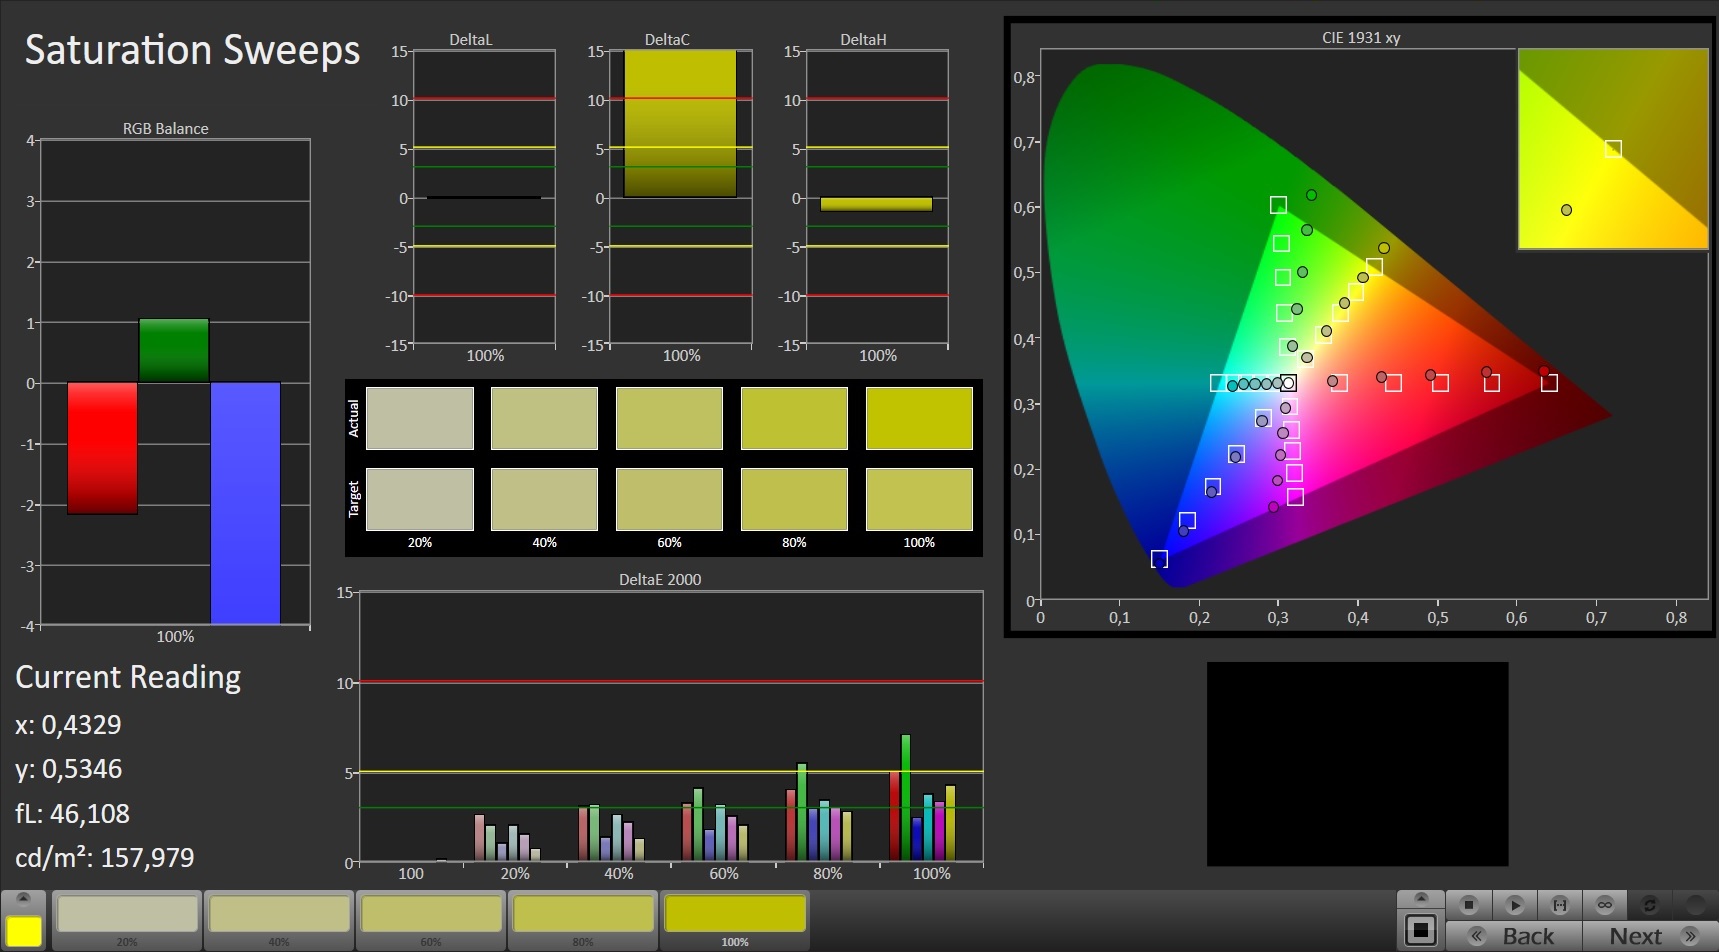
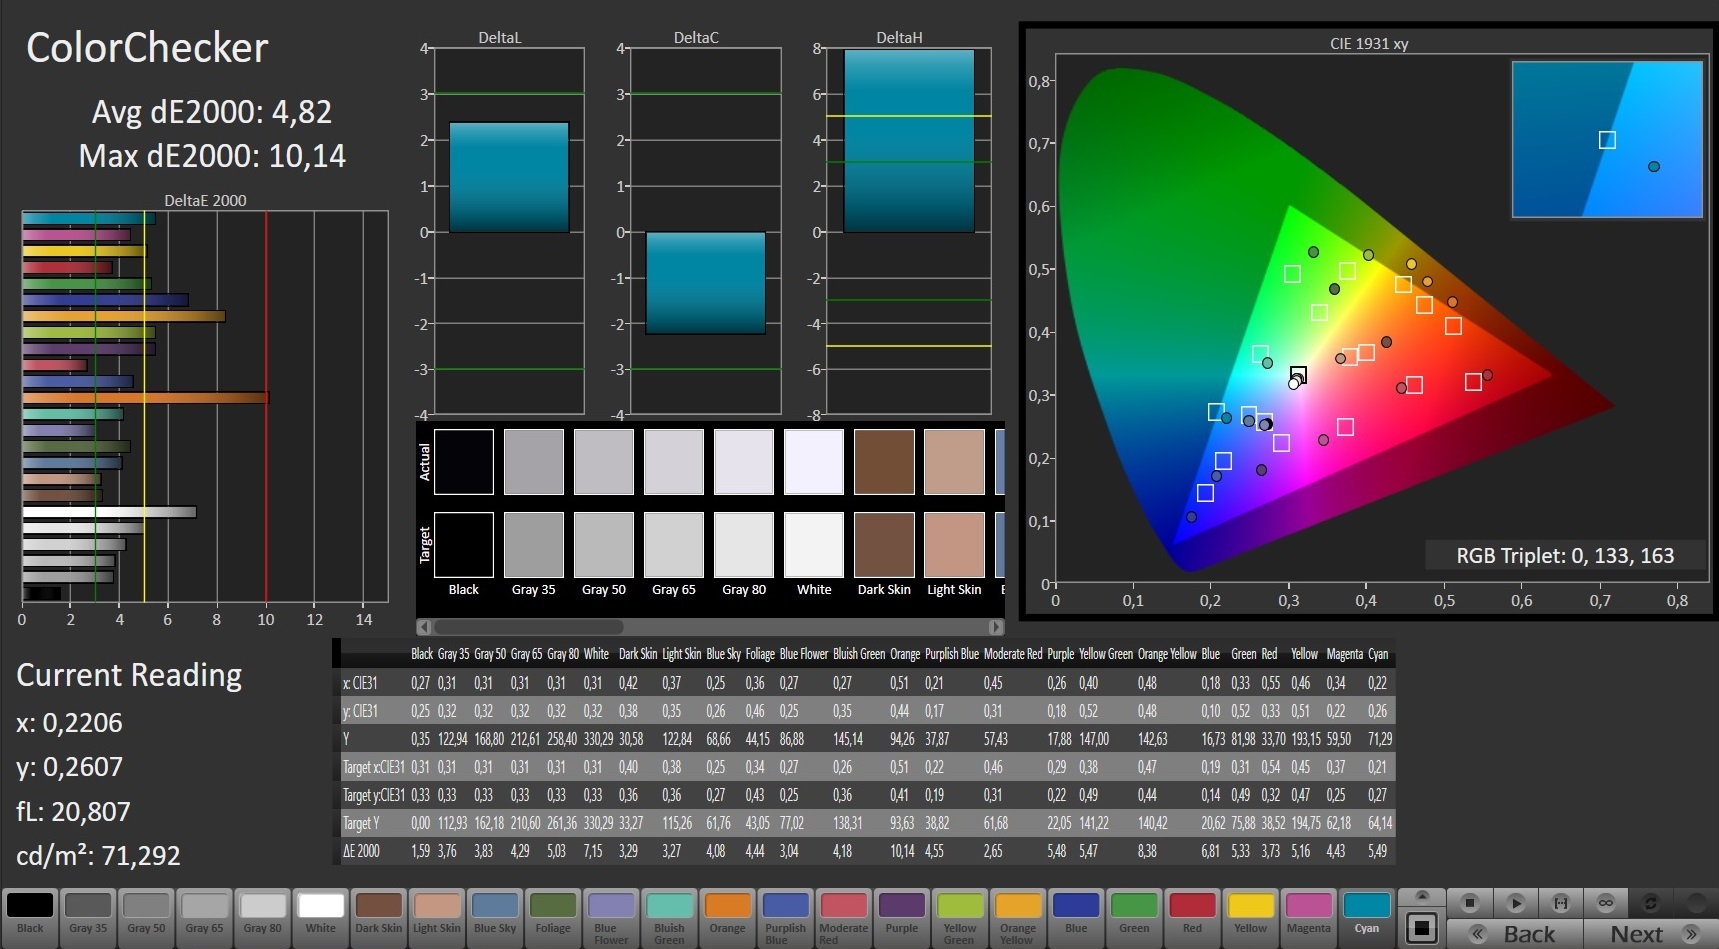
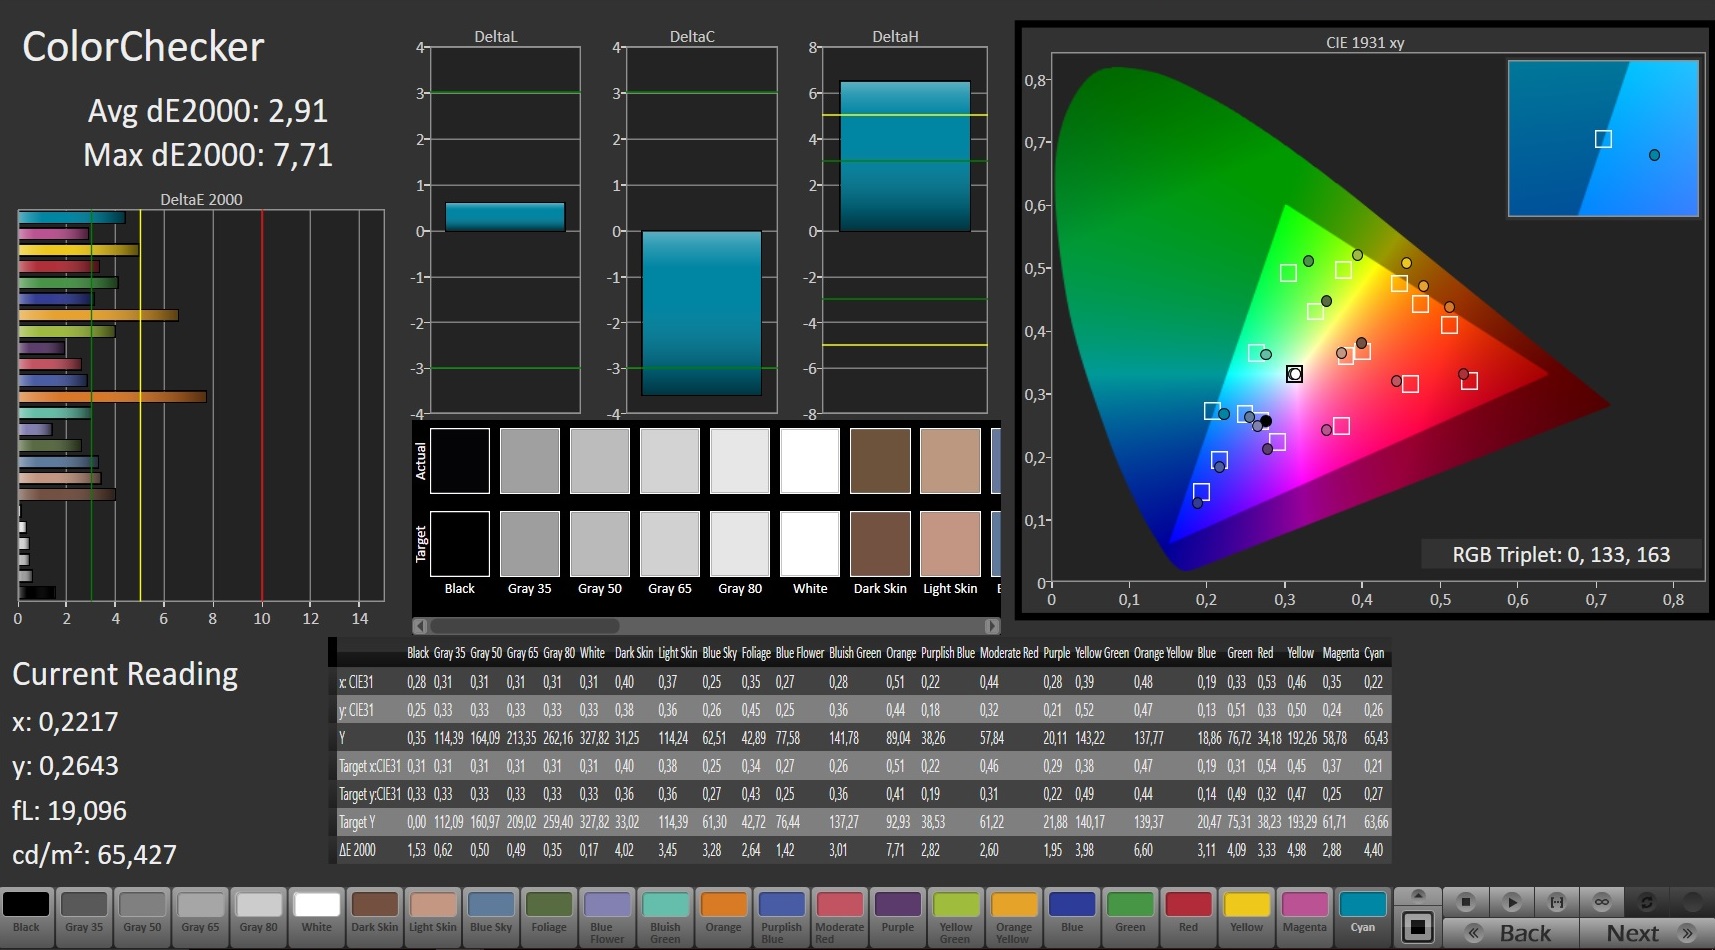
ΔE ColorChecker Calman: 4.82 | ∀{0.5-29.43 Ø4.72}
ΔE Greyscale Calman: 3.94 | ∀{0.09-98 Ø4.97}
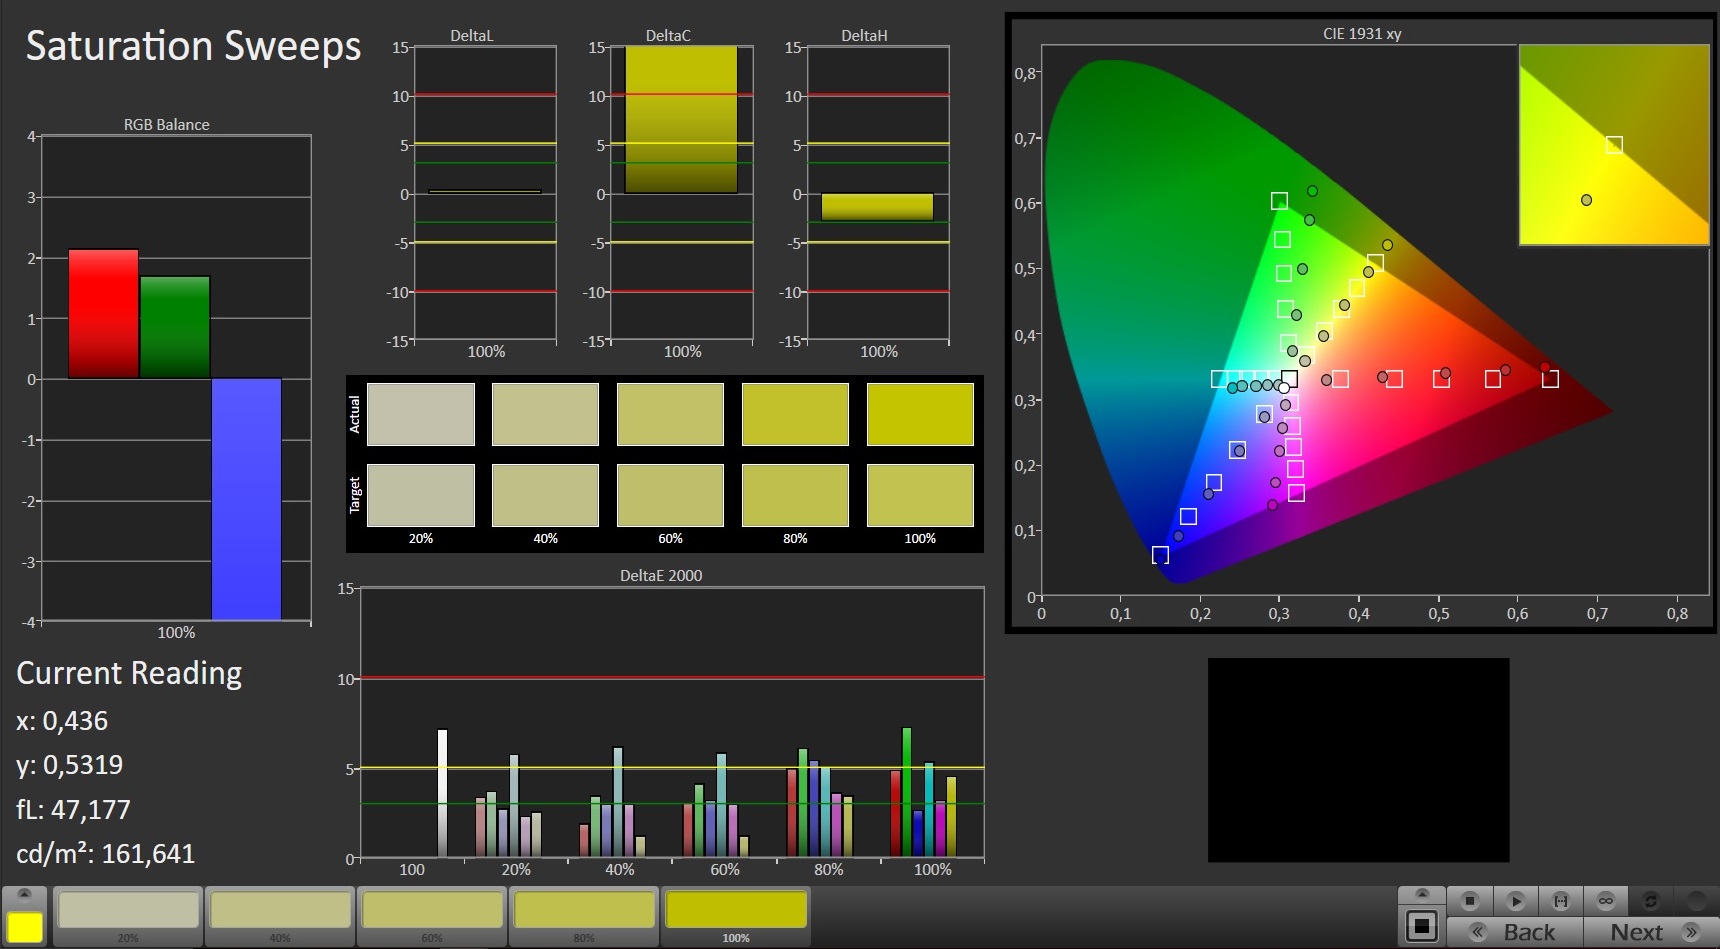
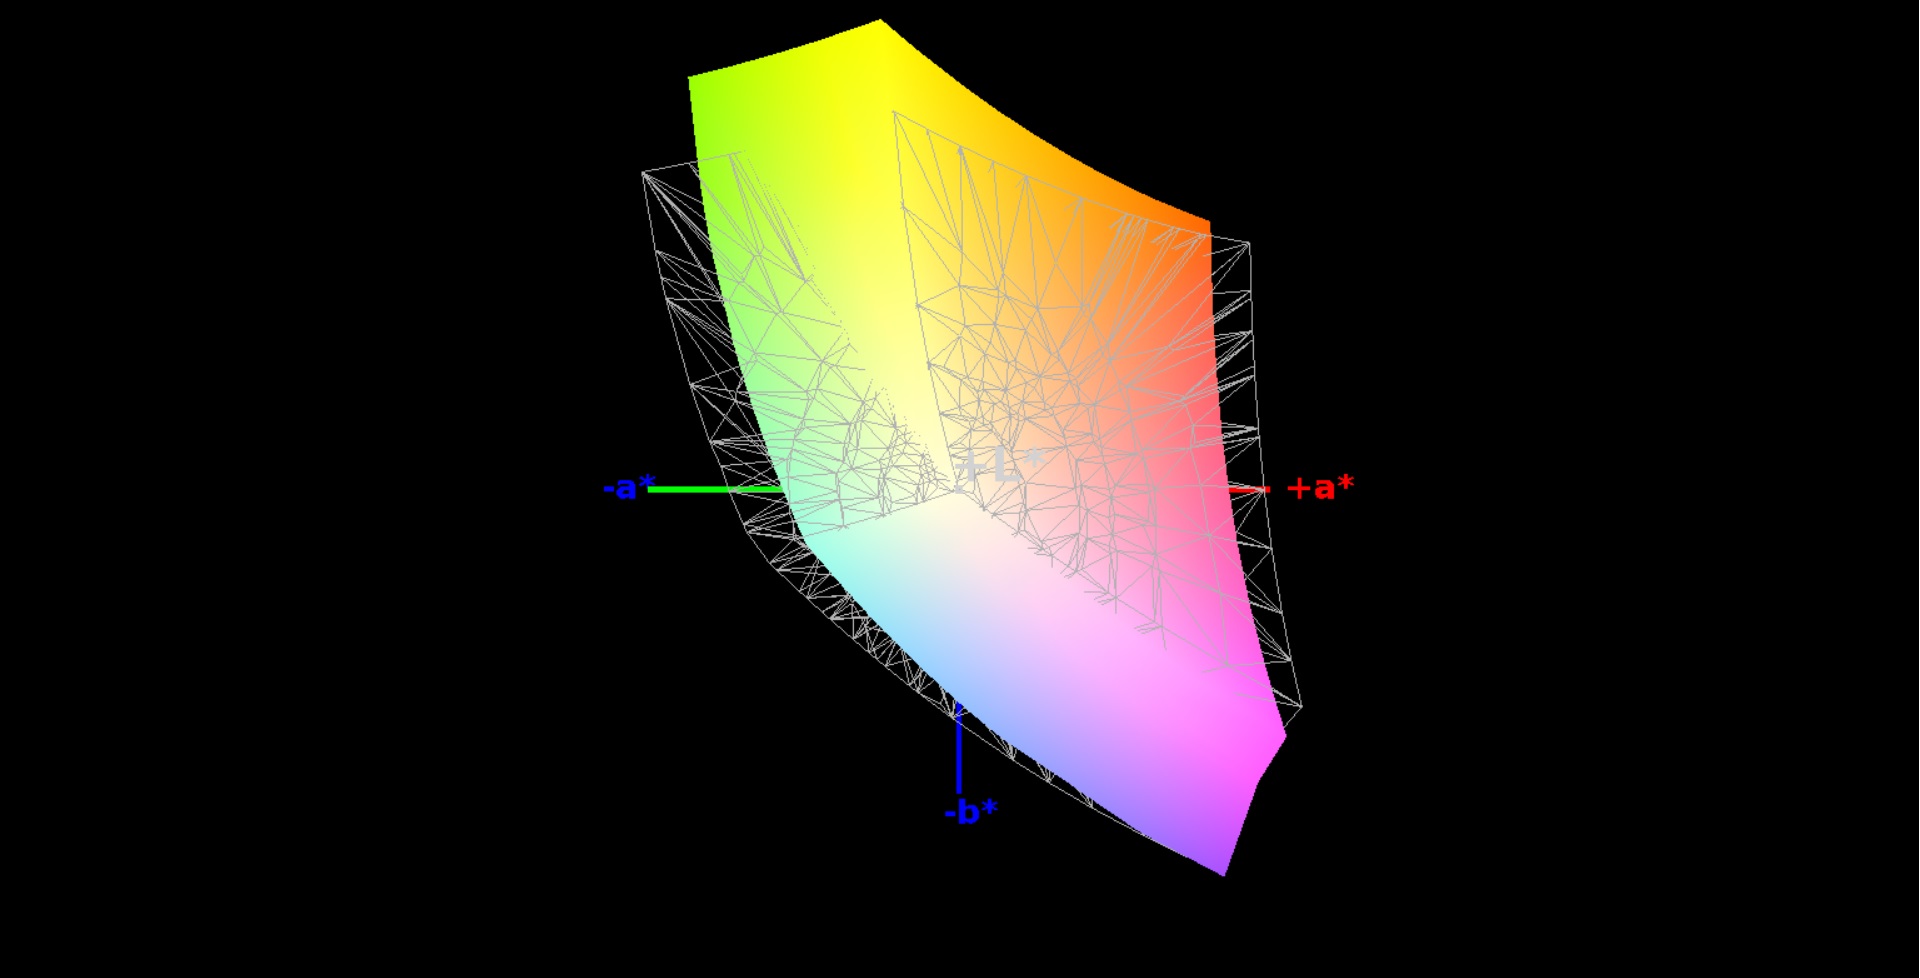
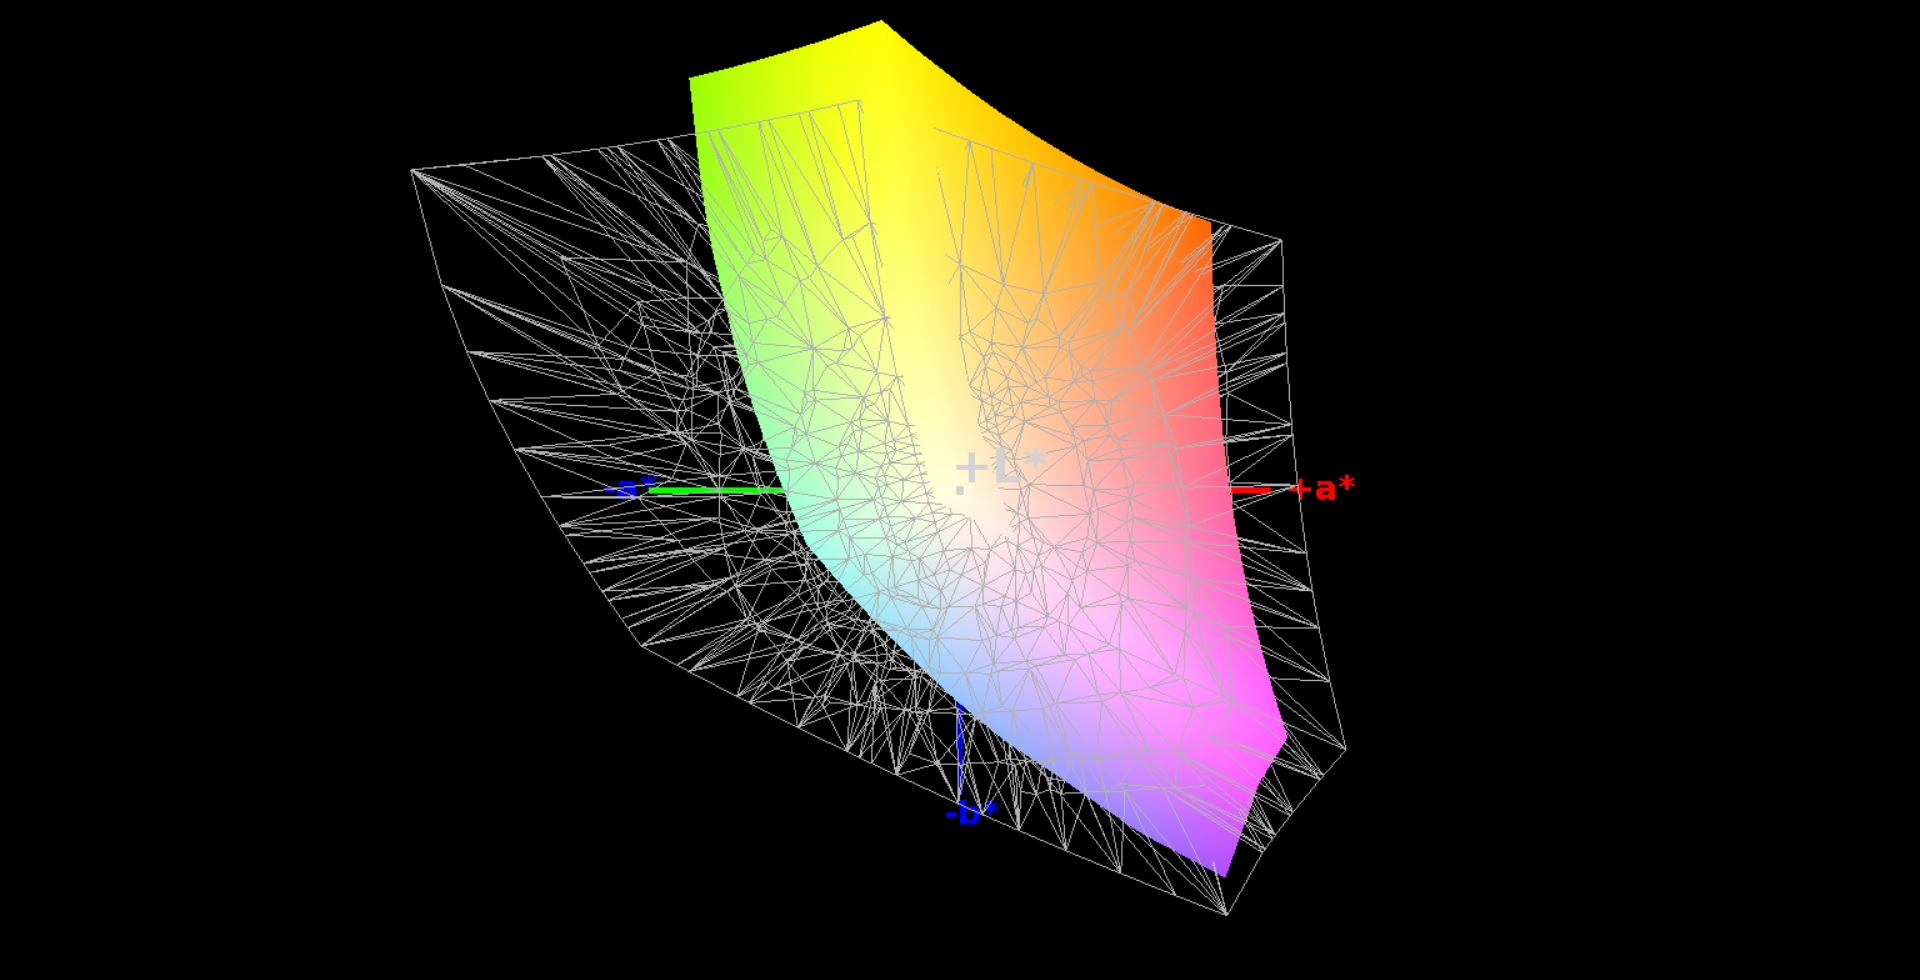
83% sRGB (Argyll 1.6.3 3D)
54% AdobeRGB 1998 (Argyll 1.6.3 3D)
60.8% AdobeRGB 1998 (Argyll 3D)
83.1% sRGB (Argyll 3D)
63.9% Display P3 (Argyll 3D)
Gamma: 2.45
CCT: 6877 K
| MSI GT62VR 7RE-223 LG Philips LP156WF6 (LGD046F), 1920x1080 | MSI GT62VR-6RE16H21 LG Philips LP156WF6 (LGD046F), 1920x1080 | Alienware 15 R3 HPJGK_B156HTN (AUO51ED), 1920x1080 | Schenker XMG P507 PRO AUO B156HTN05.2 (AUO52ED), 1920x1080 | Acer Predator 15 G9-593-765Q LG Philips LP156WF6-SPP1 (LGD04D5), 1920x1080 | |
|---|---|---|---|---|---|
| Display | 2% | 7% | 6% | 1% | |
| Display P3 Coverage (%) | 63.9 | 64.6 1% | 66 3% | 66.4 4% | 63.6 0% |
| sRGB Coverage (%) | 83.1 | 84.6 2% | 90.5 9% | 88.9 7% | 83.9 1% |
| AdobeRGB 1998 Coverage (%) | 60.8 | 61.8 2% | 66.2 9% | 65.1 7% | 61.3 1% |
| Response Times | 10% | 42% | 44% | 3% | |
| Response Time Grey 50% / Grey 80% * (ms) | 37 ? | 34 ? 8% | 25 ? 32% | 24 ? 35% | 35 ? 5% |
| Response Time Black / White * (ms) | 25 ? | 22 ? 12% | 12 ? 52% | 12 ? 52% | 25 ? -0% |
| PWM Frequency (Hz) | |||||
| Screen | 7% | -31% | -37% | 4% | |
| Brightness middle (cd/m²) | 310 | 273 -12% | 386 25% | 357 15% | 273 -12% |
| Brightness (cd/m²) | 311 | 278 -11% | 382 23% | 365 17% | 267 -14% |
| Brightness Distribution (%) | 85 | 88 4% | 93 9% | 85 0% | 83 -2% |
| Black Level * (cd/m²) | 0.3 | 0.27 10% | 0.39 -30% | 0.5 -67% | 0.27 10% |
| Contrast (:1) | 1033 | 1011 -2% | 990 -4% | 714 -31% | 1011 -2% |
| Colorchecker dE 2000 * | 4.82 | 3.67 24% | 10.2 -112% | 9.93 -106% | 3.77 22% |
| Colorchecker dE 2000 max. * | 10.14 | 8.33 18% | 15.81 -56% | 14.87 -47% | 10.64 -5% |
| Greyscale dE 2000 * | 3.94 | 2.73 31% | 11.28 -186% | 10.32 -162% | 2.48 37% |
| Gamma | 2.45 90% | 2.49 88% | 2.23 99% | 2.11 104% | 2.37 93% |
| CCT | 6877 95% | 7029 92% | 11383 57% | 10096 64% | 6854 95% |
| Color Space (Percent of AdobeRGB 1998) (%) | 54 | 55 2% | 59 9% | 58 7% | 55 2% |
| Color Space (Percent of sRGB) (%) | 83 | 84 1% | 90 8% | 89 7% | 84 1% |
| Total Average (Program / Settings) | 6% /
6% | 6% /
-14% | 4% /
-17% | 3% /
3% |
* ... smaller is better
Display Response Times
| ↔ Response Time Black to White | ||
|---|---|---|
| 25 ms ... rise ↗ and fall ↘ combined | ↗ 4 ms rise | 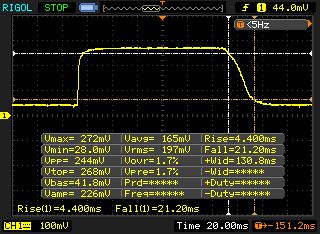 |
| ↘ 21 ms fall | ||
| The screen shows relatively slow response rates in our tests and may be too slow for gamers. In comparison, all tested devices range from 0.1 (minimum) to 240 (maximum) ms. » 59 % of all devices are better. This means that the measured response time is worse than the average of all tested devices (19.8 ms). | ||
| ↔ Response Time 50% Grey to 80% Grey | ||
| 37 ms ... rise ↗ and fall ↘ combined | ↗ 16 ms rise | 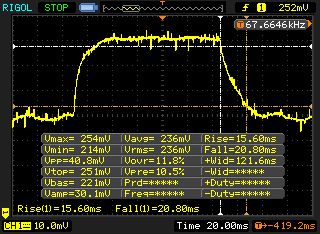 |
| ↘ 21 ms fall | ||
| The screen shows slow response rates in our tests and will be unsatisfactory for gamers. In comparison, all tested devices range from 0.165 (minimum) to 636 (maximum) ms. » 53 % of all devices are better. This means that the measured response time is worse than the average of all tested devices (31 ms). | ||
Screen Flickering / PWM (Pulse-Width Modulation)
| Screen flickering / PWM not detected | 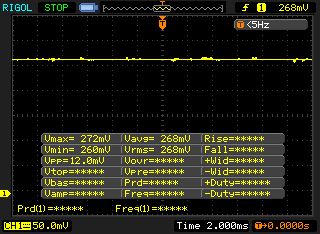 | ||
In comparison: 52 % of all tested devices do not use PWM to dim the display. If PWM was detected, an average of 7753 (minimum: 5 - maximum: 343500) Hz was measured. | |||
Performance
With the GT62VR 7RE, MSI has a 15.6-inch gaming notebook in its line-up. The computer can smoothly run all current games. It also performs well in other fields of application such as video editing, and image editing. The device costs about 2100 Euros.
Processor
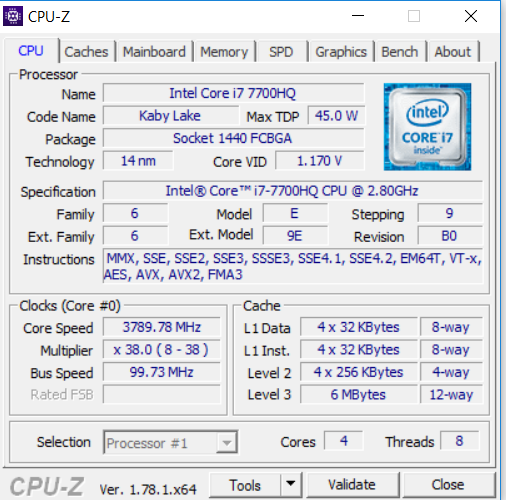
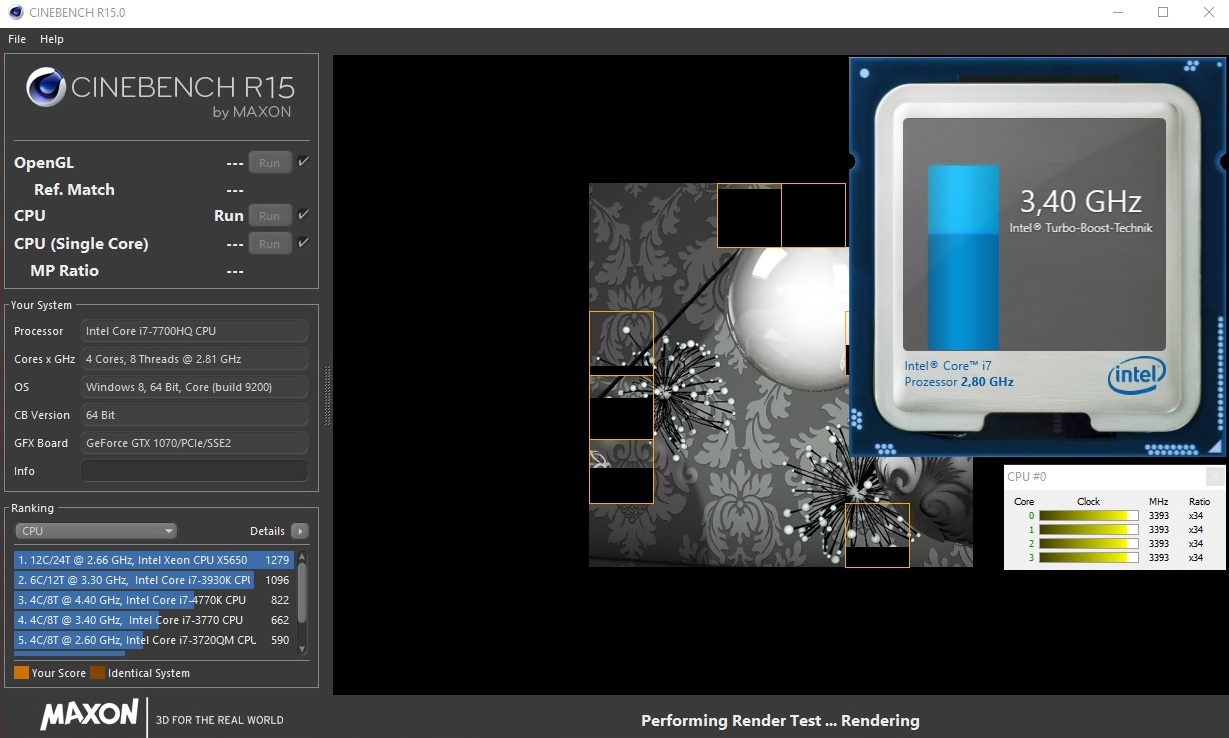
First and foremost, the GT62VR 7RE is a CPU upgrade. The Core i7-6700HQ (Skylake) of the predecessor was replaced by an Core i7-7700HQ (Kaby Lake). The latter features a base clock of 2.8 GHz. Thanks to Turbo, the clock rate can increase to 3.4 GHz (four cores), 3.6 GHz (two cores), and 3.8 GHz (once core). Thanks to its 200 to 300 MHz higher clock rates, the Core i7-7700HQ performs slightly better than its predecessor in our CPU tests. You will not really notice the small performance gain in everyday use. Primarily, it becomes apparent in the benchmarks. The CPU works at 3.4 to 3.8 GHz in single thread applications and clocks at 3.4 GHz in multi thread applications.

| Cinebench R10 | |
| Rendering Multiple CPUs 32Bit | |
| MSI GT62VR 7RE-223 | |
| Rendering Single 32Bit | |
| MSI GT62VR 7RE-223 | |
| Geekbench 4.0 | |
| 64 Bit Single-Core Score | |
| MSI GT62VR 7RE-223 | |
| 64 Bit Multi-Core Score | |
| MSI GT62VR 7RE-223 | |
| Geekbench 3 | |
| 32 Bit Single-Core Score | |
| MSI GT62VR 7RE-223 | |
| 32 Bit Multi-Core Score | |
| MSI GT62VR 7RE-223 | |
| JetStream 1.1 - 1.1 Total | |
| MSI GT62VR 7RE-223 | |
| Octane V2 - Total Score | |
| MSI GT62VR 7RE-223 | |
| Mozilla Kraken 1.1 - Total | |
| MSI GT62VR 7RE-223 | |
* ... smaller is better
System Performance
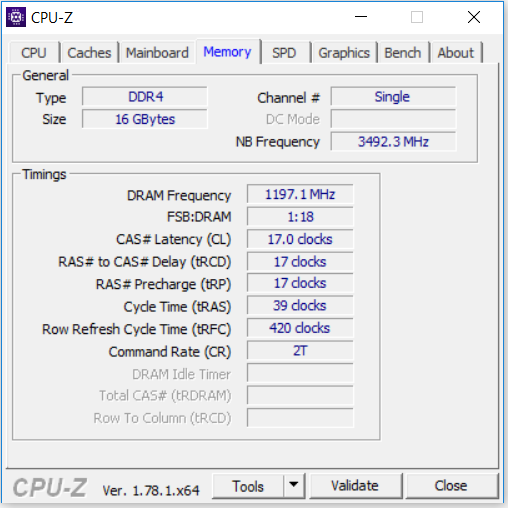
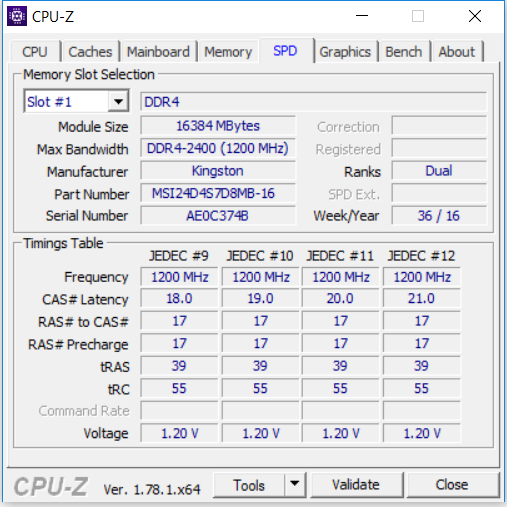
Thanks to a fast SSD, a powerful processor and a fast GPU, the MSI computer is not lacking in system performance. Hence, the GT62VR 7RE achieves excellent results in the PC Mark benchmarks and is suitable for all applications with high demands on performance. The performance could even be slightly improved by adding a second RAM module in order to enable dual channel mode.
| PCMark 8 | |
| Home Score Accelerated v2 | |
| MSI GT62VR 7RE-223 | |
| Alienware 15 R3 | |
| Acer Predator 15 G9-593-765Q | |
| MSI GT62VR-6RE16H21 | |
| Schenker XMG P507 PRO | |
| Work Score Accelerated v2 | |
| MSI GT62VR 7RE-223 | |
| Alienware 15 R3 | |
| Schenker XMG P507 PRO | |
| Acer Predator 15 G9-593-765Q | |
| MSI GT62VR-6RE16H21 | |
| PCMark 7 - Score | |
| Alienware 15 R3 | |
| MSI GT62VR 7RE-223 | |
| Acer Predator 15 G9-593-765Q | |
| Schenker XMG P507 PRO | |
| MSI GT62VR-6RE16H21 | |
| PCMark 7 Score | 6831 points | |
| PCMark 8 Home Score Accelerated v2 | 5011 points | |
| PCMark 8 Creative Score Accelerated v2 | 7738 points | |
| PCMark 8 Work Score Accelerated v2 | 5406 points | |
Help | ||
Storage Devices
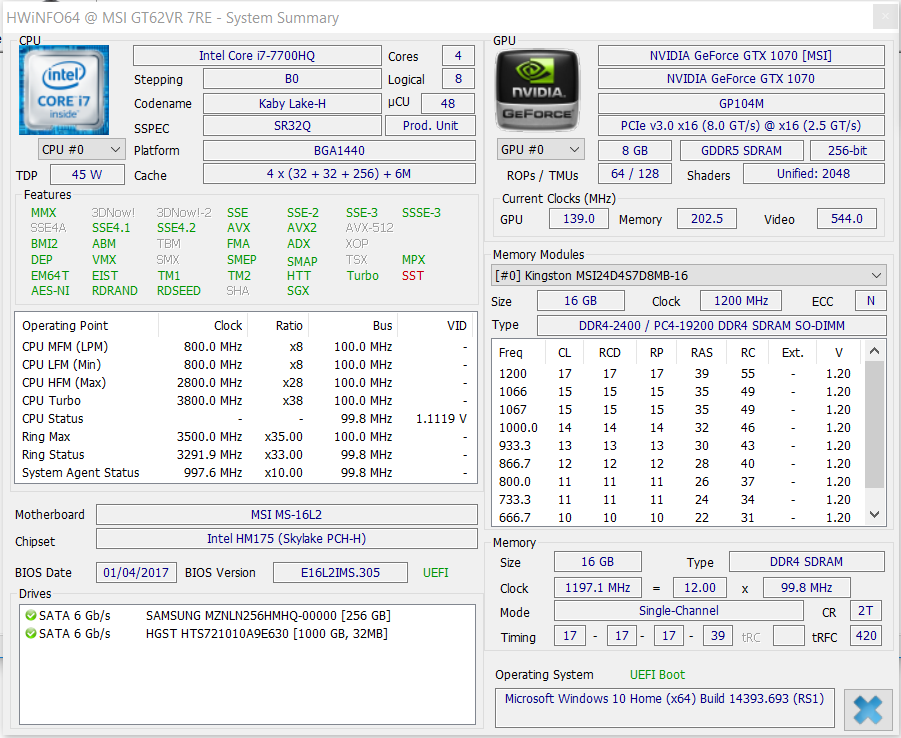
The GT62VR 7RE comes with an M.2 SSD from Samsung with a gross capacity of 256 GB. The transfer rates of the SATA III SSD are quite good. As an alternative, it is possible to use a significantly faster (and more expensive) PCIe/NVMe model in this M.2 slot. In addition, the computer has a conventional 2.5-inch hard drive (1 TB, 7200 rpm) on board.

| MSI GT62VR 7RE-223 Samsung SSD PM871a MZNLN256HMHQ | MSI GT62VR-6RE16H21 Toshiba HG6 THNSNJ256G8NY | Alienware 15 R3 | Schenker XMG P507 PRO Samsung SSD 960 Evo 500GB m.2 NVMe | Acer Predator 15 G9-593-765Q LiteOn CV1-8B512 | |
|---|---|---|---|---|---|
| CrystalDiskMark 3.0 | -4% | 44% | 152% | -7% | |
| Read Seq (MB/s) | 521 | 523 0% | 1123 116% | 1718 230% | 517 -1% |
| Write Seq (MB/s) | 422.8 | 485.5 15% | 429.2 2% | 1635 287% | 449.7 6% |
| Read 512 (MB/s) | 462 | 444.7 -4% | 833 80% | 873 89% | 355.3 -23% |
| Write 512 (MB/s) | 286.9 | 471.2 64% | 428.1 49% | 1216 324% | 433.7 51% |
| Read 4k (MB/s) | 38.55 | 21.86 -43% | 37.8 -2% | 59.1 53% | 27.69 -28% |
| Write 4k (MB/s) | 122.8 | 98.8 -20% | 122.9 0% | 177.5 45% | 72.9 -41% |
| Read 4k QD32 (MB/s) | 388.4 | 350.3 -10% | 542 40% | 668 72% | 290.9 -25% |
| Write 4k QD32 (MB/s) | 257.9 | 162.2 -37% | 429.8 67% | 546 112% | 273.8 6% |
Graphics Card
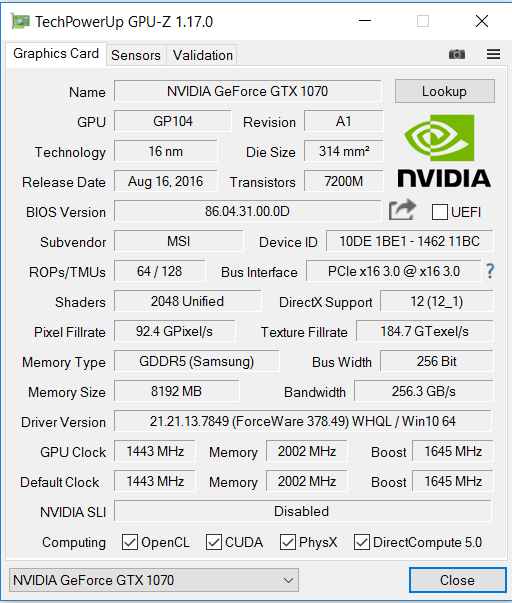
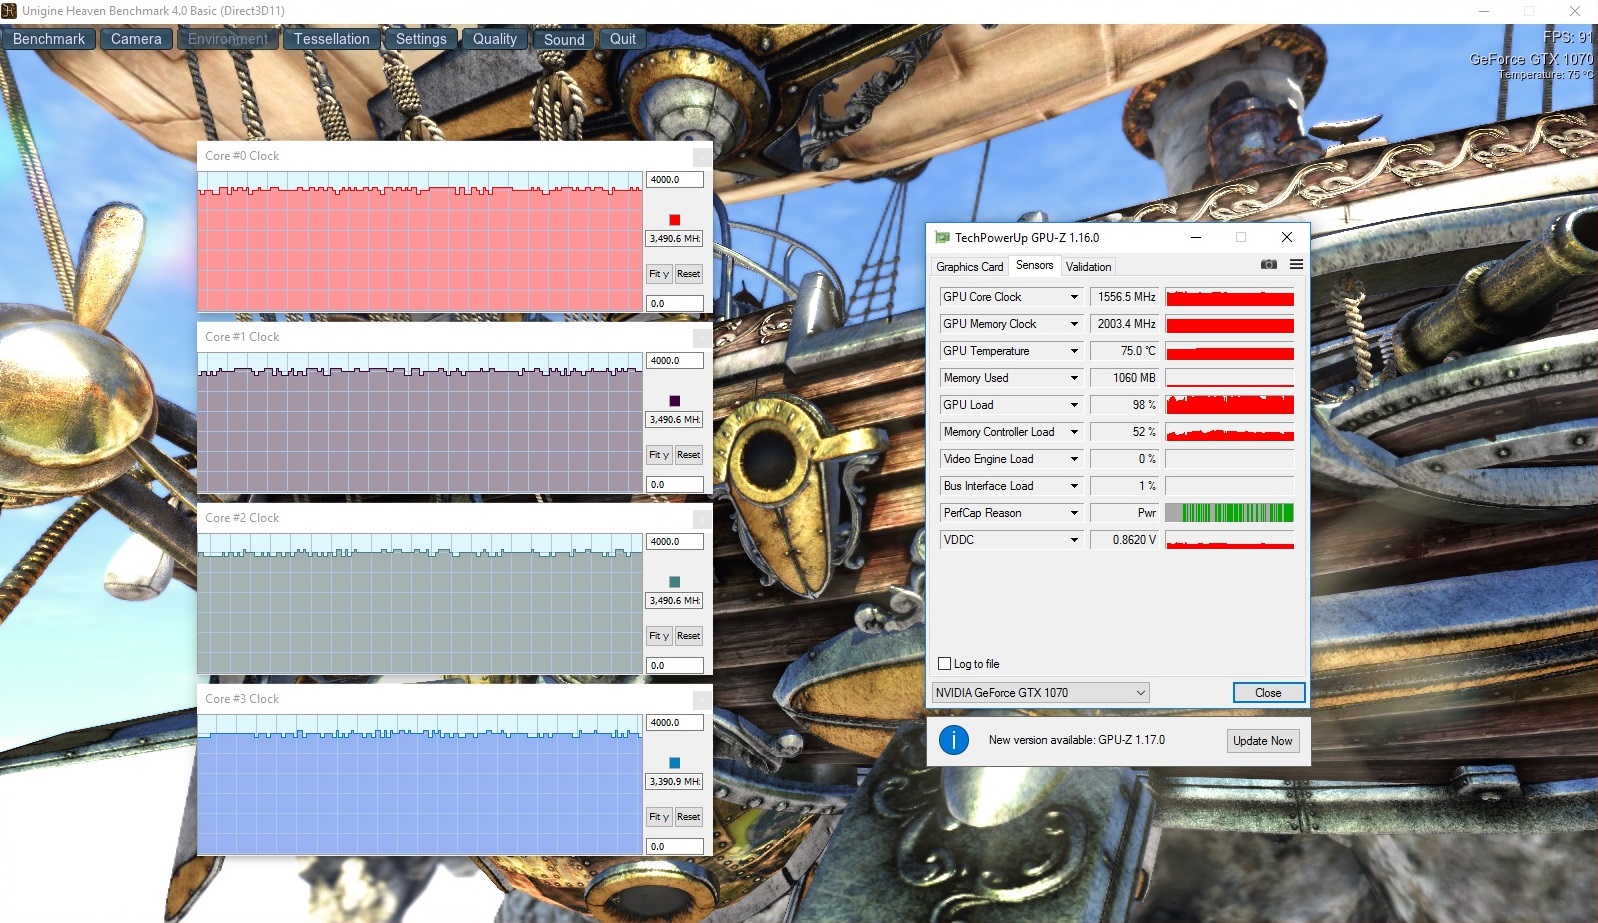
The integrate GPU (HD Graphics 630) is disabled and cannot be activated. The BIOS of the computer does not have such an option. As a result, Nvidia's GeForce GTX 1070 is used all the time. The Pascal chip supports DirectX 12 and reaches clock rates of up to 1873 MHz. However, this high clock rate cannot be maintained for a long time. In our test, the CPU clocks at 1550 MHz on average. The graphics card features 8192 GB of GDDR5 VRAM. The results of the 3DMark benchmarks are as expected and on a normal level for this GPU.
| 3DMark - 1920x1080 Fire Strike Graphics | |
| Alienware 15 R3 | |
| MSI GT62VR 7RE-223 | |
| Acer Predator 15 G9-593-765Q | |
| MSI GT62VR-6RE16H21 | |
| Schenker XMG P507 PRO | |
| 3DMark 11 - 1280x720 Performance GPU | |
| Alienware 15 R3 | |
| MSI GT62VR 7RE-223 | |
| Acer Predator 15 G9-593-765Q | |
| MSI GT62VR-6RE16H21 | |
| Schenker XMG P507 PRO | |
| 3DMark 06 Standard Score | 30759 points | |
| 3DMark 11 Performance | 15359 points | |
| 3DMark Ice Storm Standard Score | 123515 points | |
| 3DMark Cloud Gate Standard Score | 26786 points | |
| 3DMark Fire Strike Score | 13768 points | |
| 3DMark Fire Strike Extreme Score | 7445 points | |
| 3DMark Time Spy Score | 5114 points | |
Help | ||
Gaming Performance
It should not come as a surprise that the MSI computer can smoothly run all current games. The native resolution of the display (1920 x 1080) can always be used. In terms of quality settings, it is possible to select high or maximum settings depending on the game. Many games can also be played in 4k resolution. However, this requires such a display. According to MSI's web site, the GT62VR 7RE is also available with UHD display. However, we could not find models using such a display.
| BioShock Infinite - 1920x1080 Ultra Preset, DX11 (DDOF) | |
| MSI GT62VR 7RE-223 | |
| MSI GT62VR-6RE16H21 | |
| Gigabyte P55W v6 | |
| Battlefield 4 - 1920x1080 Ultra Preset AA:4x MS | |
| MSI GT62VR 7RE-223 | |
| MSI GT62VR-6RE16H21 | |
| Battlefield 1 - 1920x1080 Ultra Preset AA:T | |
| Alienware 15 R3 | |
| MSI GT62VR 7RE-223 | |
| Deus Ex Mankind Divided - 1920x1080 Ultra Preset AA:2xMS AF:8x | |
| MSI GT62VR 7RE-223 | |
| Acer Predator 15 G9-593-765Q | |
| Gigabyte P55W v6 | |
| Resident Evil 7 - 1920x1080 Very High / On AA:FXAA+T | |
| MSI GT62VR 7RE-223 | |
| Alienware 15 R3 | |
| low | med. | high | ultra | |
|---|---|---|---|---|
| Tomb Raider (2013) | 413.3 | 372.6 | 361.6 | 206.2 |
| BioShock Infinite (2013) | 208.2 | 186.6 | 186.2 | 130.6 |
| Battlefield 4 (2013) | 194.4 | 184.7 | 181.9 | 139.2 |
| Deus Ex Mankind Divided (2016) | 97.6 | 92.2 | 75.3 | 43.6 |
| Battlefield 1 (2016) | 144.7 | 128.3 | 110.8 | 104.5 |
| Civilization 6 (2016) | 70 | 57.2 | 49.7 | 49.5 |
| Titanfall 2 (2016) | 143.8 | 143.5 | 129.8 | 121 |
| Resident Evil 7 (2017) | 368.8 | 274.8 | 204.3 | 162.3 |
Emissions
System Noise
We measured a maximum noise level of 36 dB in idle mode, which is mediocre in view of the notebook's performance class. The fans are permanently active and do not run absolutely smoothly. They sound a bit like a propeller-driven plane flying at a distance. The automatic fan control, which we used during this test, is responsible for this. You can improve this: The pre-installed Dragon Center allows manually reducing the fan speed. The noise does not get too loud under load. During our stress test, the noise level increased to 46 dB - several other devices are louder. The noise level is between 36 and 43 dB during everyday gaming.
Noise level
| Idle |
| 34 / 35 / 36 dB(A) |
| Load |
| 40 / 46 dB(A) |
 | ||
30 dB silent 40 dB(A) audible 50 dB(A) loud |
||
min: | ||
| MSI GT62VR 7RE-223 i7-7700HQ, GeForce GTX 1070 Mobile | MSI GT62VR-6RE16H21 6700HQ, GeForce GTX 1070 Mobile | Alienware 15 R3 i7-7700HQ, GeForce GTX 1070 Mobile | Schenker XMG P507 PRO i7-7700HQ, GeForce GTX 1070 Mobile | Acer Predator 15 G9-593-765Q 6700HQ, GeForce GTX 1070 Mobile | Gigabyte P55W v6 6700HQ, GeForce GTX 1060 Mobile | |
|---|---|---|---|---|---|---|
| Noise | 3% | -5% | -8% | -2% | -5% | |
| off / environment * (dB) | 30 | 30 -0% | 30 -0% | 31 -3% | 30 -0% | 31 -3% |
| Idle Minimum * (dB) | 34 | 32 6% | 31 9% | 33 3% | 31 9% | 35 -3% |
| Idle Average * (dB) | 35 | 33 6% | 32 9% | 34 3% | 35 -0% | 36 -3% |
| Idle Maximum * (dB) | 36 | 34 6% | 42 -17% | 44 -22% | 38 -6% | 37 -3% |
| Load Average * (dB) | 40 | 40 -0% | 49 -23% | 46 -15% | 43 -8% | 41 -2% |
| Load Maximum * (dB) | 46 | 46 -0% | 50 -9% | 52 -13% | 49 -7% | 52 -13% |
* ... smaller is better
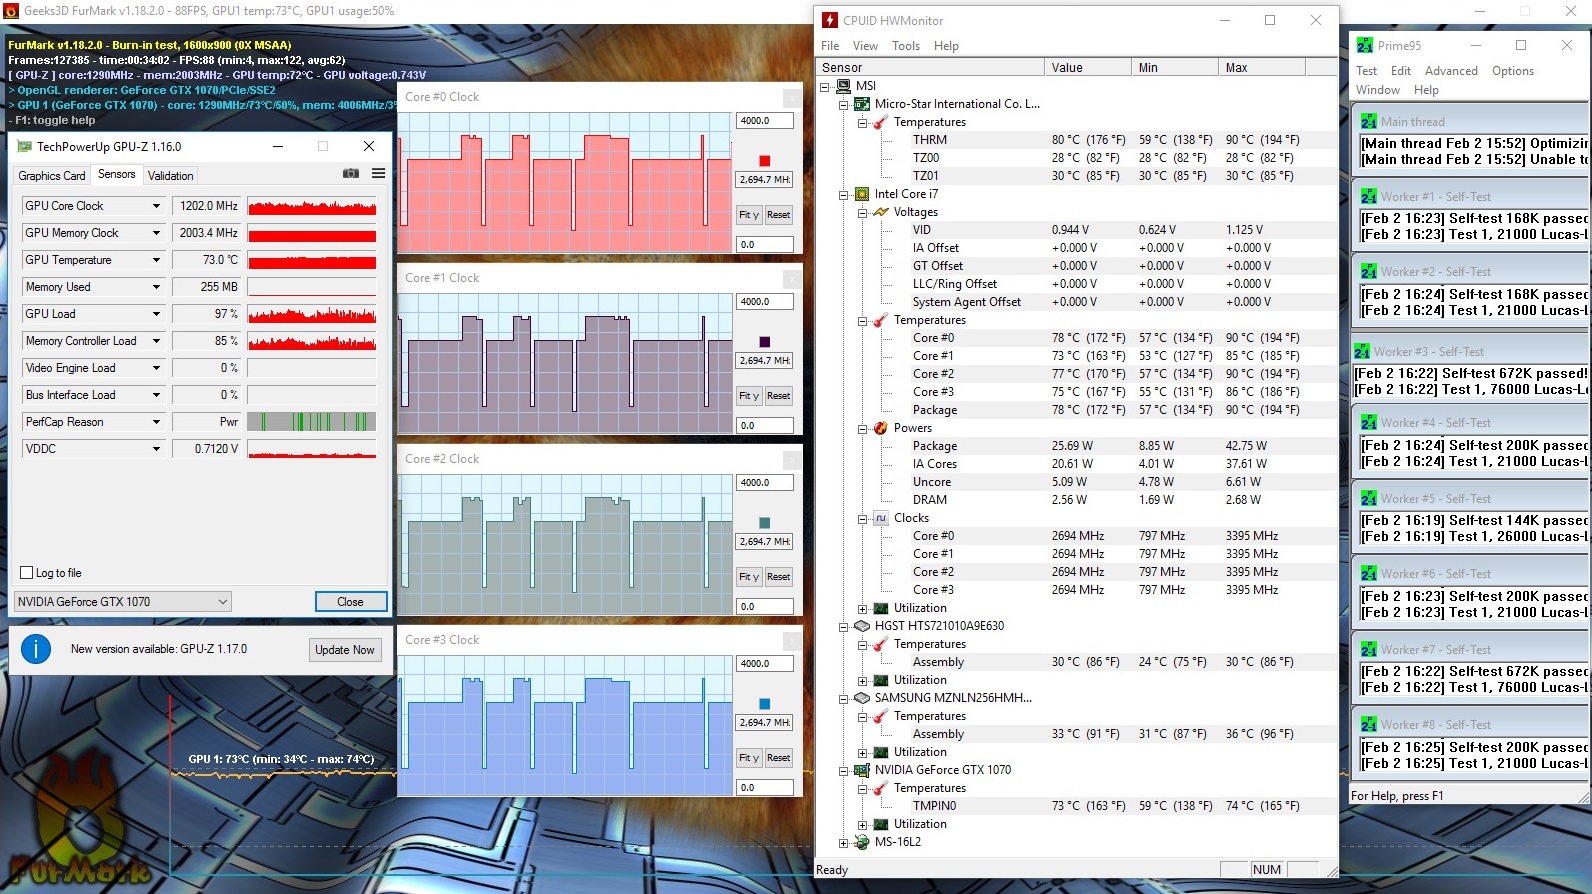
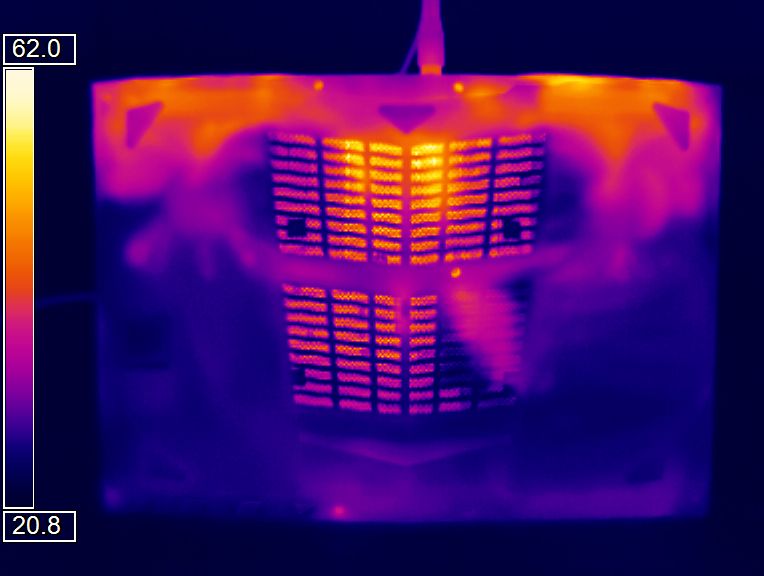
Temperature
The GT62VR 7RE behaves differently in our stress test (Prime95 and Furmark run for at least one hour) in mains operation and on battery. In mains operation, the processor works at 2.7 to 3.4 GHz. The GPU clock fluctuates between 1200 and 1600 MHz. However, the clock rate is slightly lower than the base clock (1443 MHz) most of the time. On battery, the CPU works at 2.6 to 3 GHz and the GPU clocks at 1443 MHz. The computer does not get overly warm during the stress test. It only exceeds the 40 °C level in a few measurement segments. During everyday use, the temperature remains even lower.
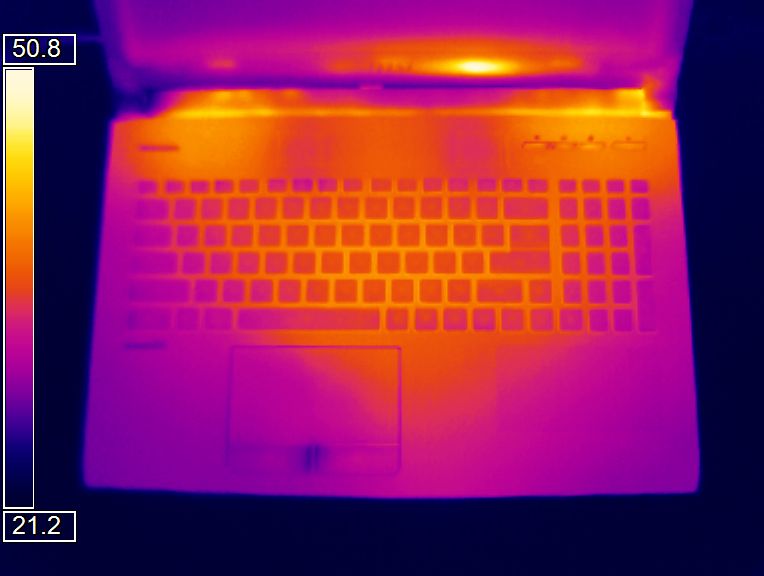
(±) The maximum temperature on the upper side is 40.6 °C / 105 F, compared to the average of 40.4 °C / 105 F, ranging from 21.2 to 68.8 °C for the class Gaming.
(-) The bottom heats up to a maximum of 48.4 °C / 119 F, compared to the average of 43.2 °C / 110 F
(+) In idle usage, the average temperature for the upper side is 25 °C / 77 F, compared to the device average of 33.9 °C / 93 F.
(+) The palmrests and touchpad are reaching skin temperature as a maximum (34.7 °C / 94.5 F) and are therefore not hot.
(-) The average temperature of the palmrest area of similar devices was 28.8 °C / 83.8 F (-5.9 °C / -10.7 F).
| MSI GT62VR 7RE-223 i7-7700HQ, GeForce GTX 1070 Mobile | MSI GT62VR-6RE16H21 6700HQ, GeForce GTX 1070 Mobile | Alienware 15 R3 i7-7700HQ, GeForce GTX 1070 Mobile | Schenker XMG P507 PRO i7-7700HQ, GeForce GTX 1070 Mobile | Acer Predator 15 G9-593-765Q 6700HQ, GeForce GTX 1070 Mobile | Gigabyte P55W v6 6700HQ, GeForce GTX 1060 Mobile | |
|---|---|---|---|---|---|---|
| Heat | -8% | -25% | -24% | 4% | -17% | |
| Maximum Upper Side * (°C) | 40.6 | 44 -8% | 46 -13% | 49.2 -21% | 40.5 -0% | 47.7 -17% |
| Maximum Bottom * (°C) | 48.4 | 53.1 -10% | 51.8 -7% | 62 -28% | 42 13% | 51.2 -6% |
| Idle Upper Side * (°C) | 26.8 | 28.8 -7% | 36.5 -36% | 32.4 -21% | 28.2 -5% | 32.1 -20% |
| Idle Bottom * (°C) | 26.4 | 28.2 -7% | 38.2 -45% | 33 -25% | 24.3 8% | 32.8 -24% |
* ... smaller is better
Speakers
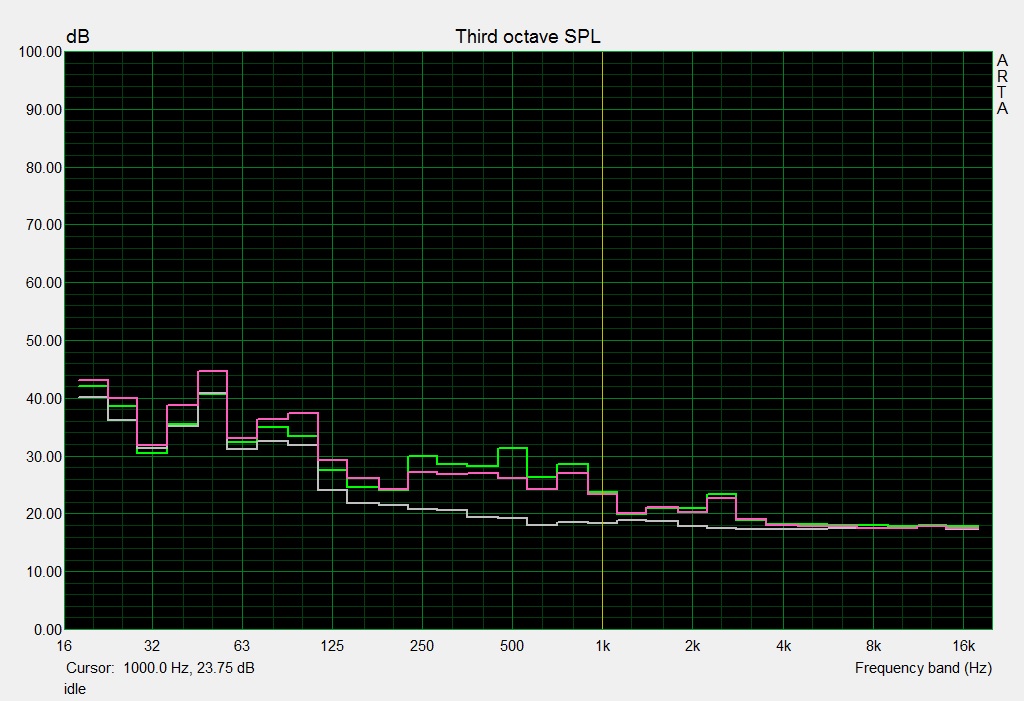
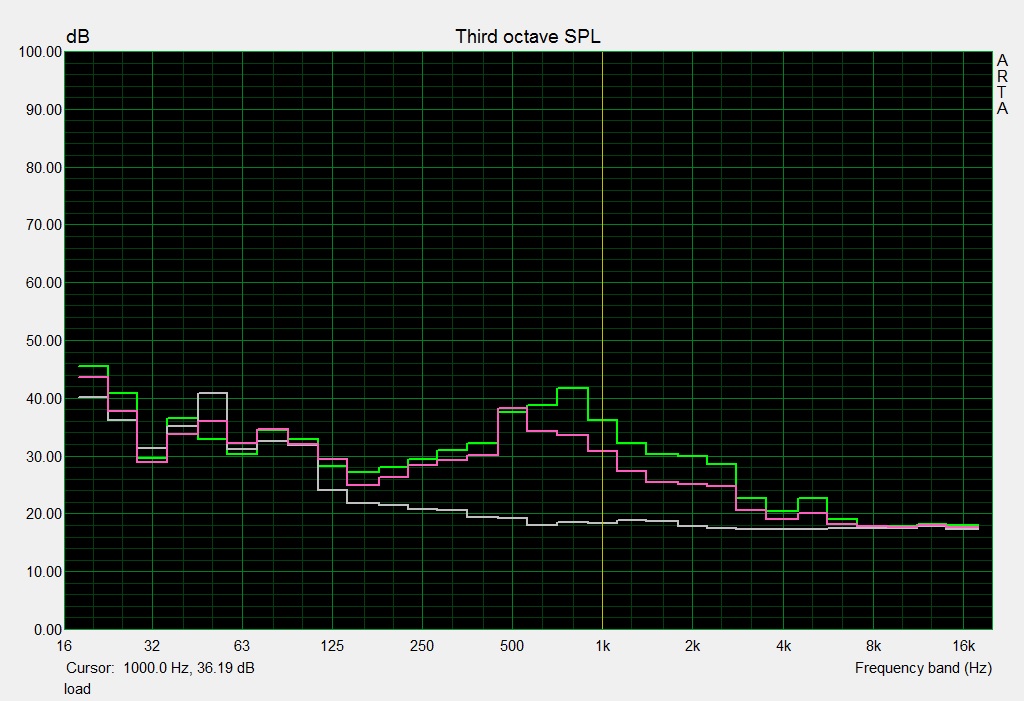
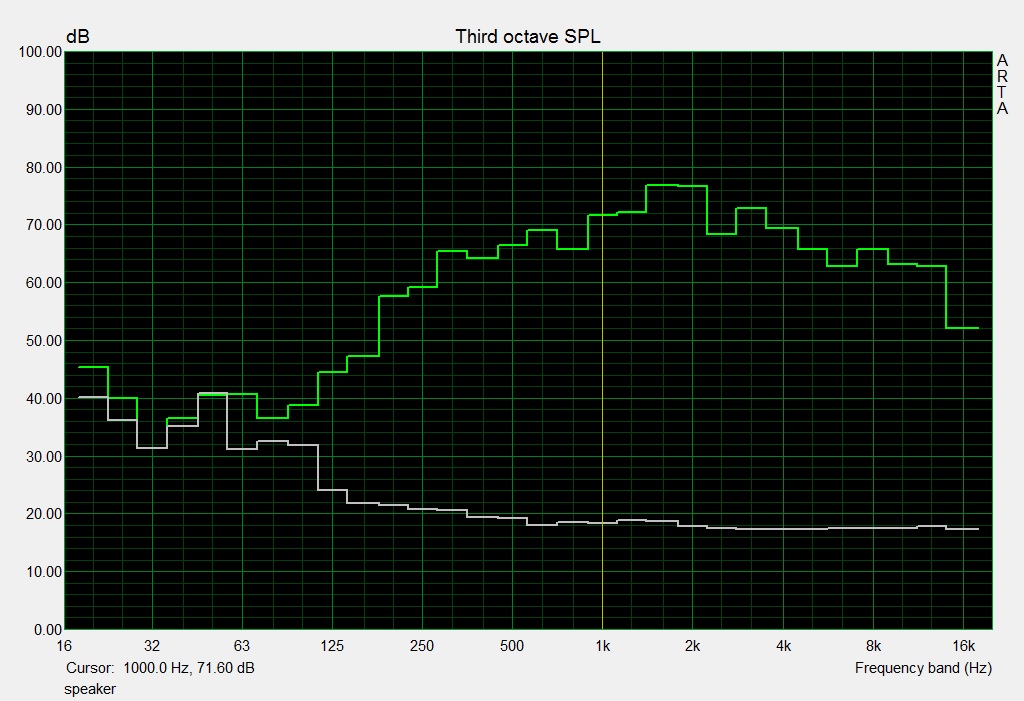
MSI GT62VR 7RE-223 audio analysis
(+) | speakers can play relatively loud (83 dB)
Bass 100 - 315 Hz
(±) | reduced bass - on average 13.6% lower than median
(±) | linearity of bass is average (10.1% delta to prev. frequency)
Mids 400 - 2000 Hz
(±) | higher mids - on average 5% higher than median
(+) | mids are linear (5.4% delta to prev. frequency)
Highs 2 - 16 kHz
(+) | balanced highs - only 2.7% away from median
(±) | linearity of highs is average (8.6% delta to prev. frequency)
Overall 100 - 16.000 Hz
(±) | linearity of overall sound is average (15.6% difference to median)
Compared to same class
» 36% of all tested devices in this class were better, 6% similar, 58% worse
» The best had a delta of 6%, average was 18%, worst was 132%
Compared to all devices tested
» 23% of all tested devices were better, 5% similar, 72% worse
» The best had a delta of 4%, average was 23%, worst was 134%
Alienware 15 R3 audio analysis
(+) | speakers can play relatively loud (82 dB)
Bass 100 - 315 Hz
(-) | nearly no bass - on average 19.1% lower than median
(±) | linearity of bass is average (10.4% delta to prev. frequency)
Mids 400 - 2000 Hz
(±) | higher mids - on average 6.7% higher than median
(±) | linearity of mids is average (7.5% delta to prev. frequency)
Highs 2 - 16 kHz
(+) | balanced highs - only 3.6% away from median
(+) | highs are linear (5.2% delta to prev. frequency)
Overall 100 - 16.000 Hz
(±) | linearity of overall sound is average (21.6% difference to median)
Compared to same class
» 77% of all tested devices in this class were better, 5% similar, 18% worse
» The best had a delta of 6%, average was 18%, worst was 132%
Compared to all devices tested
» 61% of all tested devices were better, 7% similar, 32% worse
» The best had a delta of 4%, average was 23%, worst was 134%
Frequenzdiagramm im Vergleich (Checkboxen oben an-/abwählbar!)
Energy Management
Power Consumption
Since the integrated GPU is deactivated in the MSI, the energy demand is higher than necessary in idle mode. However, the same is true for many competitors. During the stress test, the power consumption increases to up to 193 Watt. Hence, the 230 Watt power adapter will not reach its limits. The energy demand is about 82 Watt (+/- 20 Watt) when playing games.
| Off / Standby | |
| Idle | |
| Load |
|
Key:
min: | |
| MSI GT62VR 7RE-223 i7-7700HQ, GeForce GTX 1070 Mobile | MSI GT62VR-6RE16H21 6700HQ, GeForce GTX 1070 Mobile | Alienware 15 R3 i7-7700HQ, GeForce GTX 1070 Mobile | Schenker XMG P507 PRO i7-7700HQ, GeForce GTX 1070 Mobile | Acer Predator 15 G9-593-765Q 6700HQ, GeForce GTX 1070 Mobile | Gigabyte P55W v6 6700HQ, GeForce GTX 1060 Mobile | |
|---|---|---|---|---|---|---|
| Power Consumption | -9% | 1% | 12% | 0% | 35% | |
| Idle Minimum * (Watt) | 20 | 20 -0% | 19 5% | 14 30% | 18 10% | 8 60% |
| Idle Average * (Watt) | 24 | 26 -8% | 23 4% | 18 25% | 24 -0% | 13 46% |
| Idle Maximum * (Watt) | 29 | 32 -10% | 29 -0% | 24 17% | 29 -0% | 17 41% |
| Load Average * (Watt) | 82 | 100 -22% | 85 -4% | 87 -6% | 86 -5% | 71 13% |
| Load Maximum * (Watt) | 193 | 202 -5% | 192 1% | 201 -4% | 201 -4% | 165 15% |
* ... smaller is better
Battery Life
In our realistic WLAN test, we simulate web surfing. The profile "balanced" is active, the energy saving features are disabled, and the display brightness is set to about 150 cd/m². The GT62VR lasts 4:06 h. In our video test, the computer achieves about the same battery runtime: 4:12 h. In this test, the short film Big Buck Bunny (H.264 coding, 1920 x 1080 pixels) runs in a loop. The Wi-Fi modules and the energy saving features are disabled, and the display brightness is set to about 150 cd/m². The GT62VR 7RE and its predecessor are on par in terms of battery life. Only the Kaby Lake model's maximum battery life is slightly longer.
| MSI GT62VR 7RE-223 i7-7700HQ, GeForce GTX 1070 Mobile, 75 Wh | MSI GT62VR-6RE16H21 6700HQ, GeForce GTX 1070 Mobile, 75.24 Wh | Alienware 15 R3 i7-7700HQ, GeForce GTX 1070 Mobile, 99 Wh | Schenker XMG P507 PRO i7-7700HQ, GeForce GTX 1070 Mobile, 60 Wh | Acer Predator 15 G9-593-765Q 6700HQ, GeForce GTX 1070 Mobile, Wh | Gigabyte P55W v6 6700HQ, GeForce GTX 1060 Mobile, 63 Wh | |
|---|---|---|---|---|---|---|
| Battery runtime | -7% | 5% | -17% | 18% | 35% | |
| Reader / Idle (h) | 6.3 | 5 -21% | 6.4 2% | 10.2 62% | ||
| H.264 (h) | 4.2 | 4.4 5% | 3.6 -14% | 5 19% | 5.6 33% | |
| WiFi v1.3 (h) | 4.1 | 4.1 0% | 4.4 7% | 3.3 -20% | 4.8 17% | 5.9 44% |
| Load (h) | 1.6 | 1.6 0% | 1.7 6% | 1.9 19% | 1.6 0% |
Pros
Cons
Verdict
The combination from Kaby Lake quad core processor and GeForce GTX 1070 can smoothly run all current games in Full HD resolution with high to maximum quality settings. Pro: Despite powerful hardware, the temperature increase is only moderate. The small performance gain primarily leads to slightly better benchmark results, but is subjectively not noticeable.
MSI delivers a generally well-made gaming notebook with the GT62VR 7RE.
A fast SATA III SSD ensures a responsive system. If the performance of the SSD is not sufficient for you, you can replace it by a significantly faster PCIe/NVMe model. It is also possible to replace the existing 2.5-inch hard drive. Since the computer lacks a maintenance hatch, you will need to remove the underside in both cases.
The matte Full HD IPS display works at a frequency of 60 Hz. It is bright, contrast-rich, and viewing-angle stable. Nvidia's G-Sync technology ensure smooth image sequences.
MSI GT62VR 7RE-223
- 02/14/2017 v6 (old)
Sascha Mölck
Price comparison
