Gigabyte P55W v6 Notebook Review

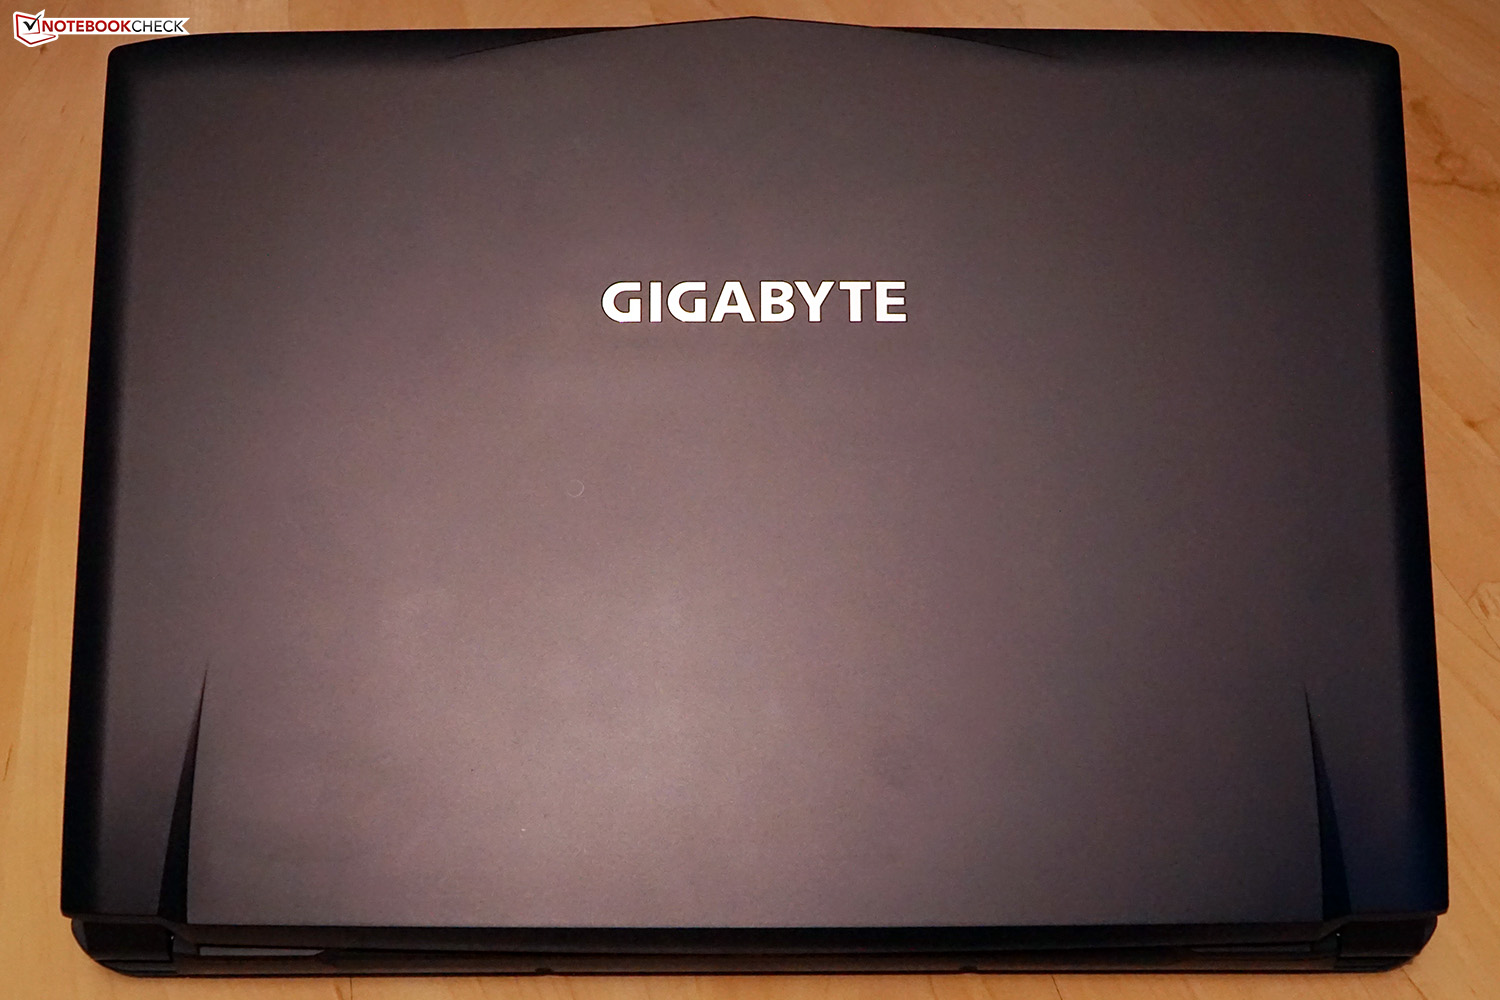
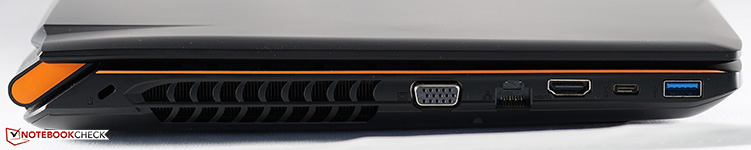
As the name indicates, the P55v6 is the sixth iteration of Gigabyte's affordable gaming system. The company clearly didn't waste any time on cosmetic tweaks: the chassis including the input devices and physical ports is a direct carry-over from the predecessor. For details, please take a look at our review of the P55W v4.
Our main focus is going to be directed at the internal components - especially the graphics card. Some of the components which differ slightly - like the display and the processor - are also worth taking a look at, since there are often measurable and noticeable differences.
Our review notebook is of course not without competition. The Asus Strix GL502VM and the MSI GS63VR are almost identical as far as the CPU, GPU, and the RAM is concerned. In order to distinguish the P55W v6 from notebooks in the next higher and lower performance classes, we'll also compare the Gigabyte system to the Acer Predator 15 G9-593 (with GeForce GTX 1070) and the Acer Aspire VX5-591G (with GTX 1050 Ti).

| SD Card Reader | |
| average JPG Copy Test (av. of 3 runs) | |
| Acer Predator 15 G9-593-765Q | |
| Asus Strix GL502VM-FY039T | |
| Gigabyte P55W v6 | |
| Gigabyte P55W v5 | |
| MSI GS63VR-6RF16H22 Stealth Pro | |
| maximum AS SSD Seq Read Test (1GB) | |
| Acer Predator 15 G9-593-765Q | |
| Gigabyte P55W v6 | |
| Asus Strix GL502VM-FY039T | |
| Gigabyte P55W v5 | |
| MSI GS63VR-6RF16H22 Stealth Pro | |
| Networking | |
| iperf3 transmit AX12 | |
| Acer Predator 15 G9-593-765Q | |
| Asus Strix GL502VM-FY039T | |
| Gigabyte P55W v6 | |
| iperf3 receive AX12 | |
| Asus Strix GL502VM-FY039T | |
| Acer Predator 15 G9-593-765Q | |
| Gigabyte P55W v6 | |
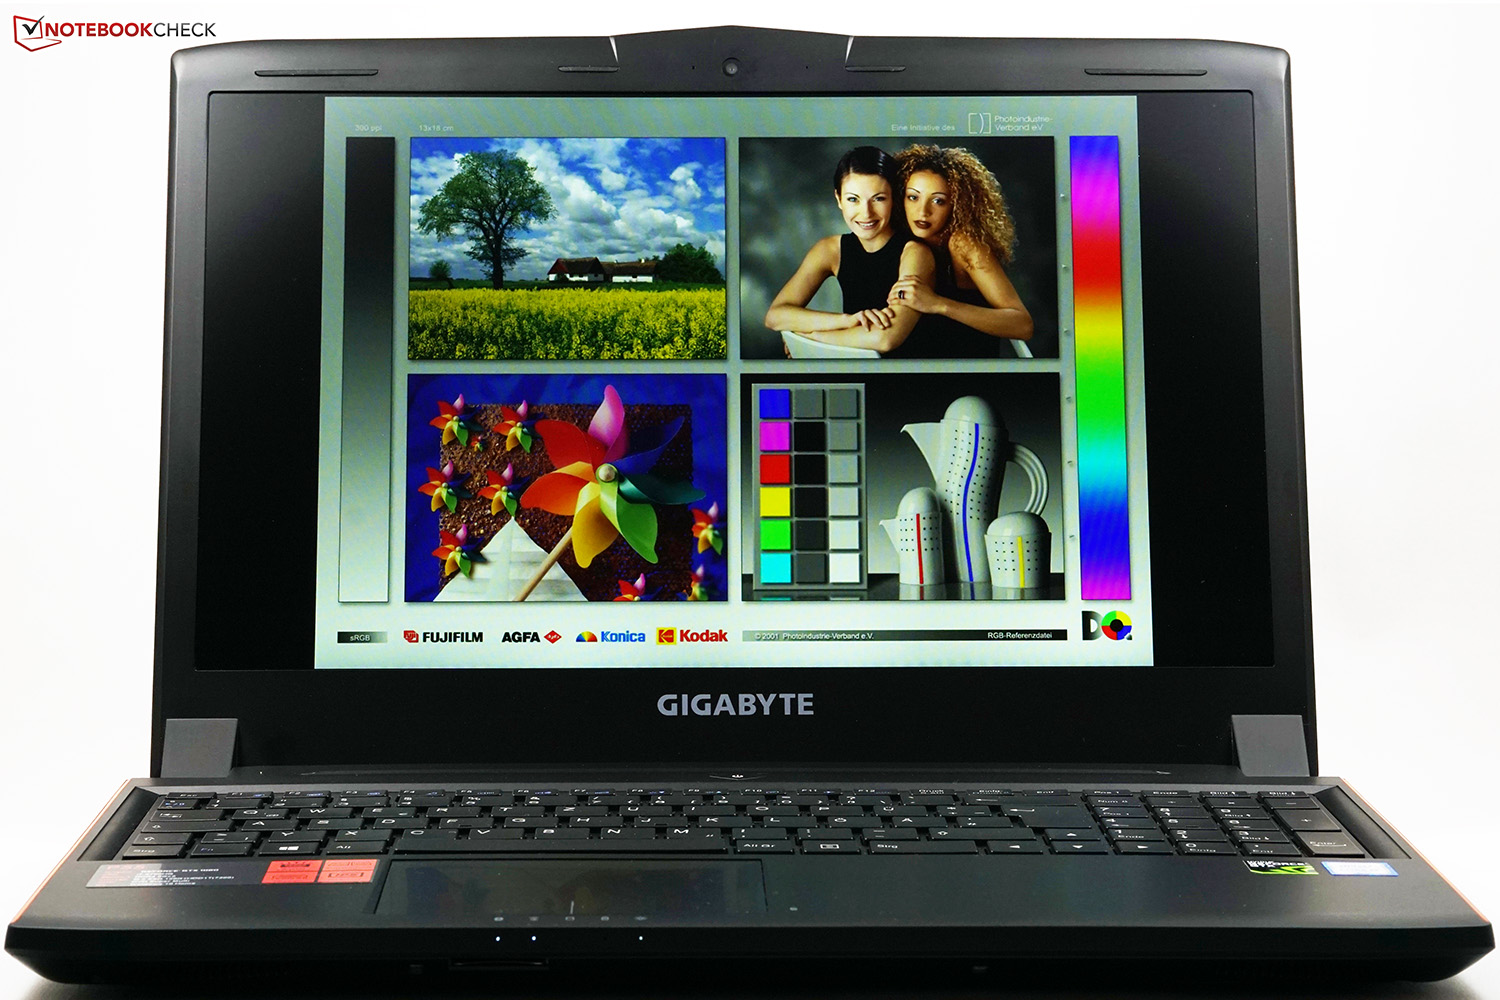
Display
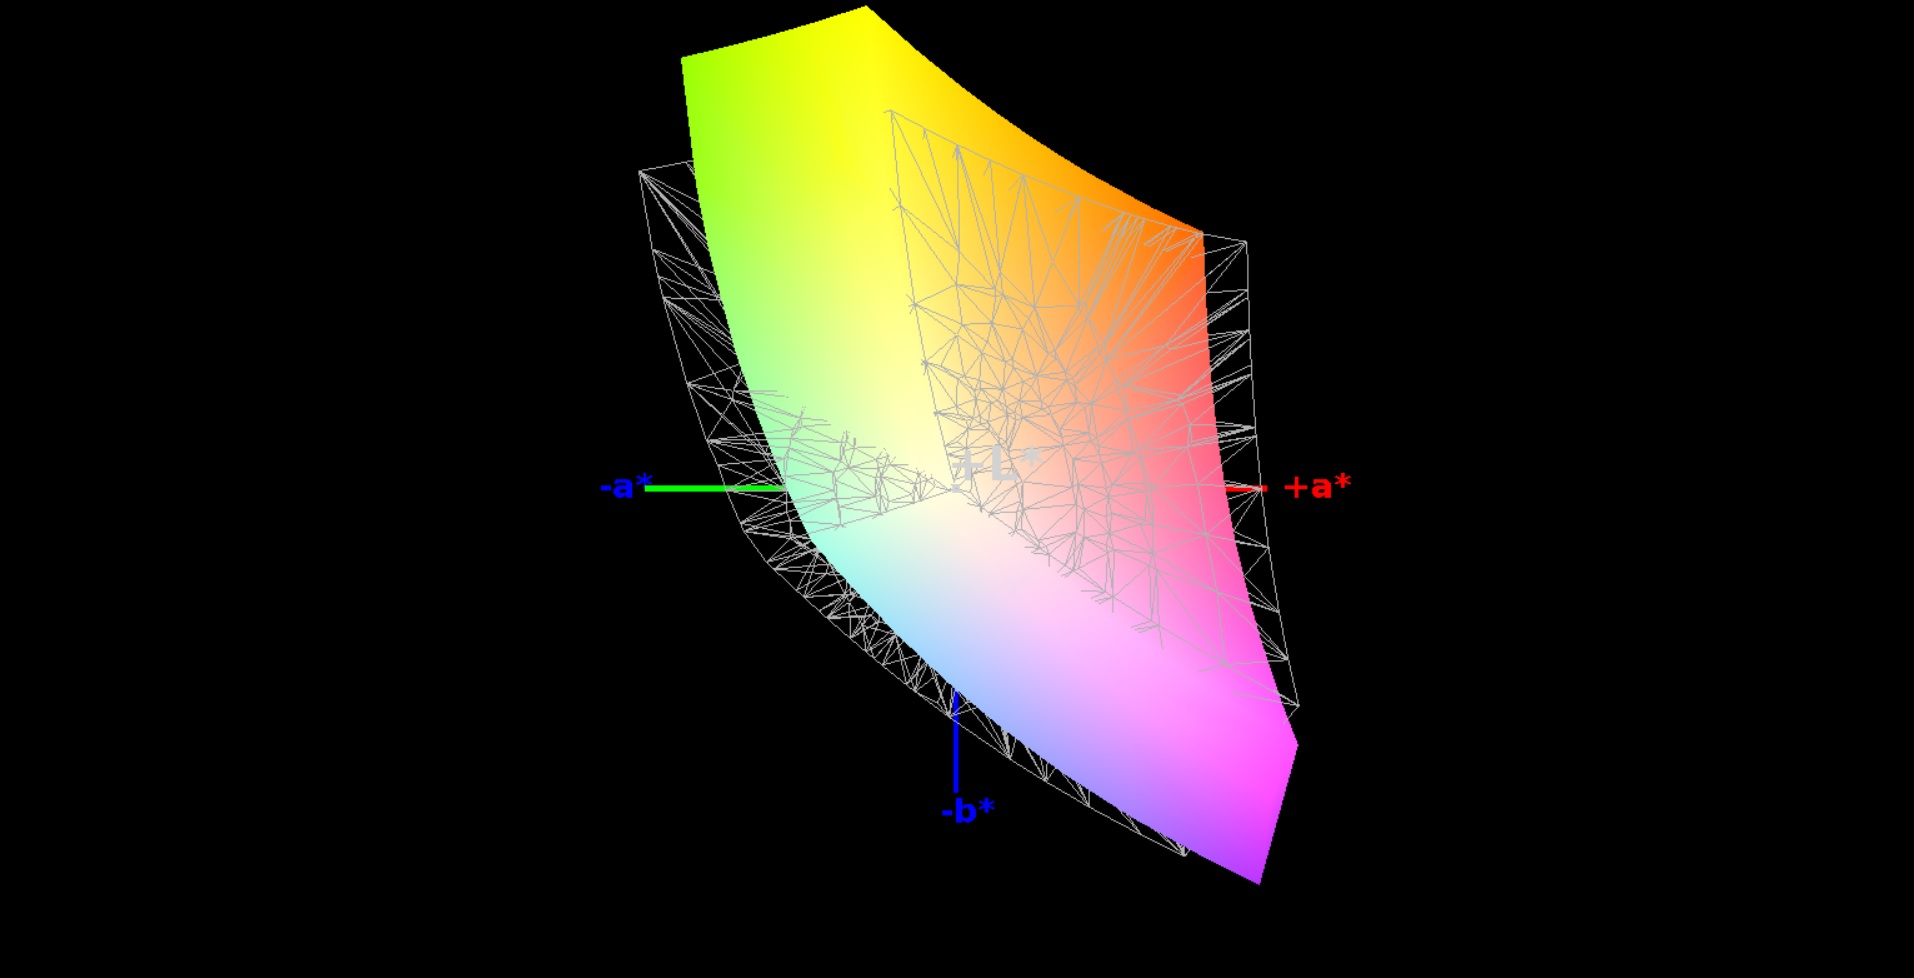
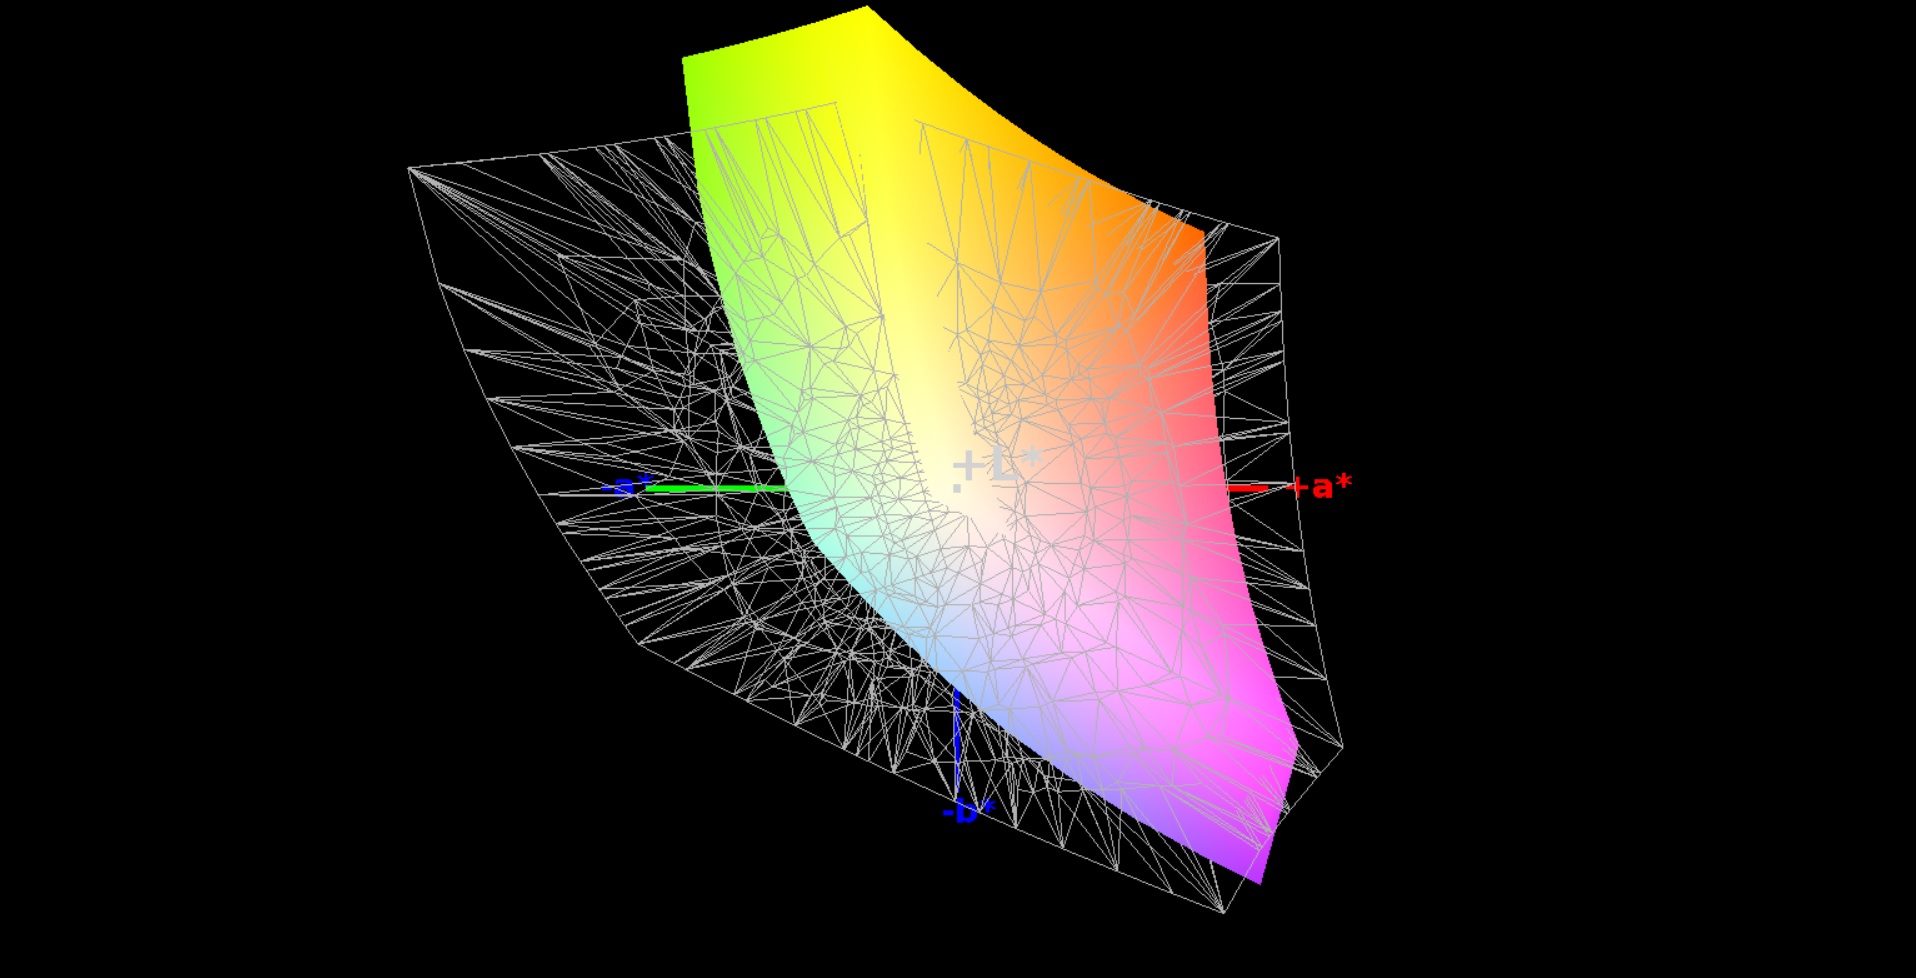
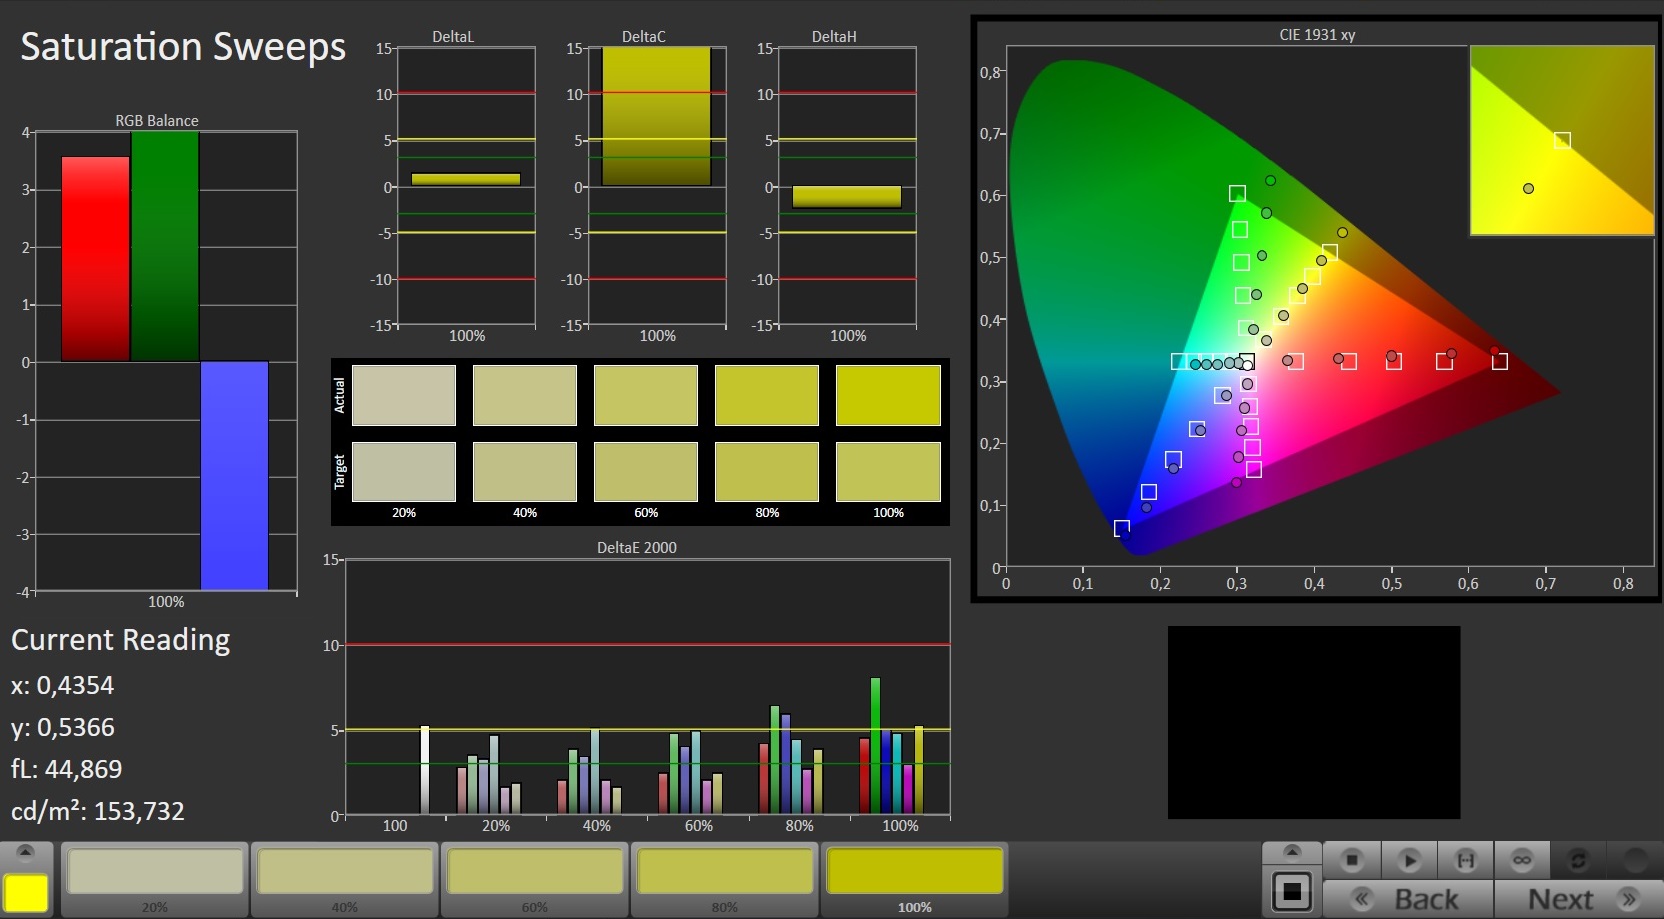
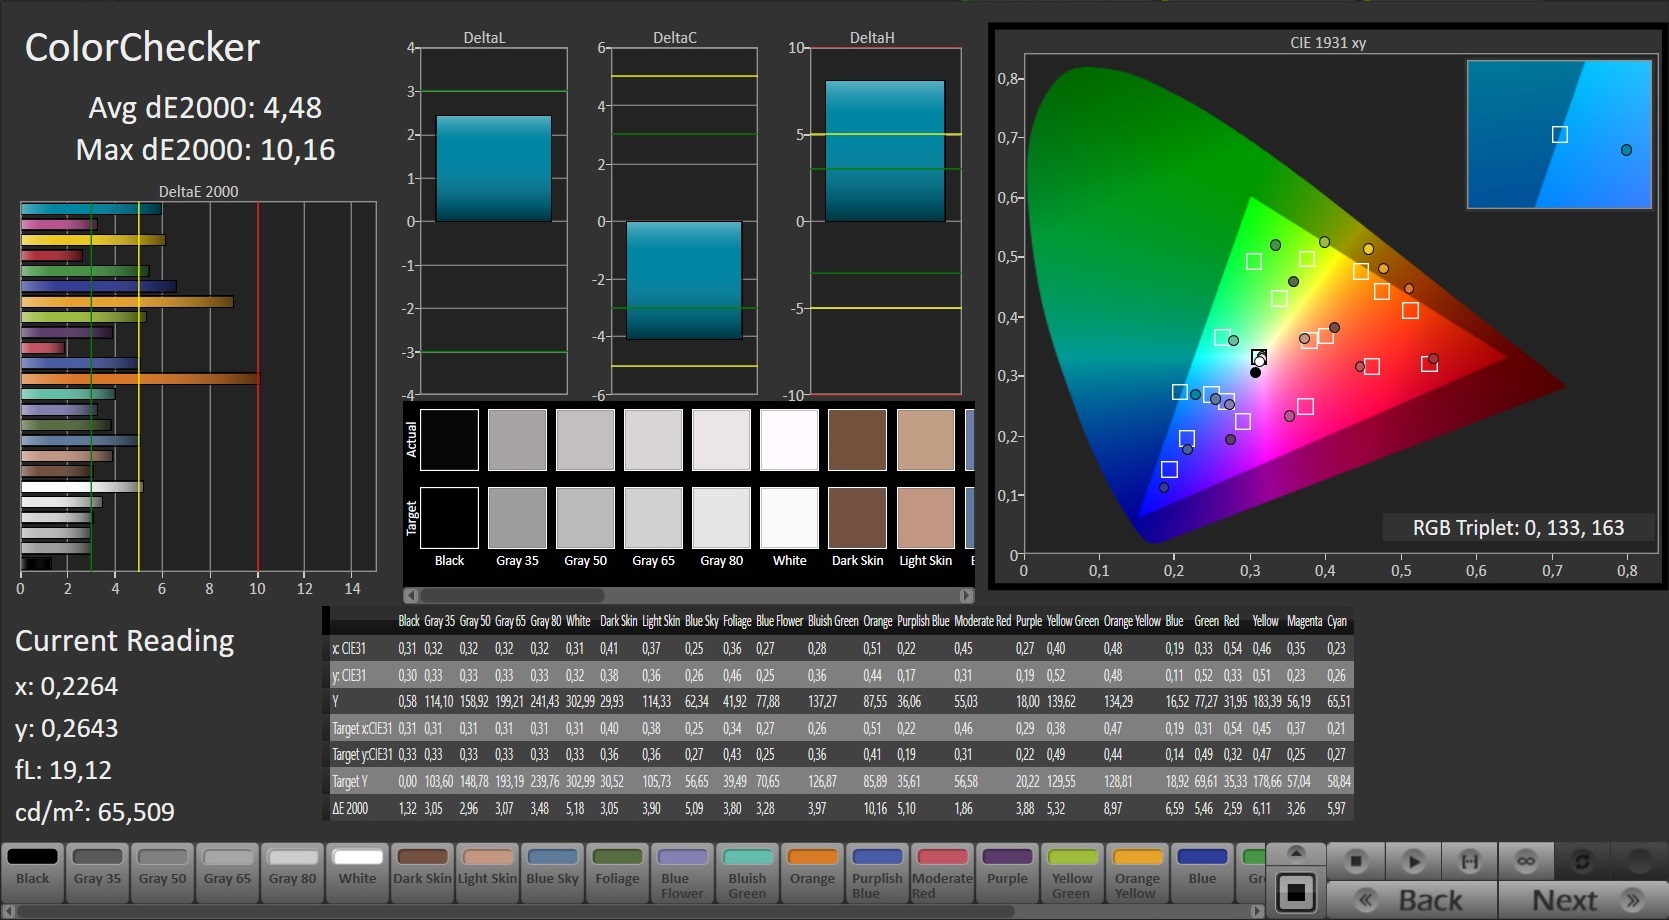
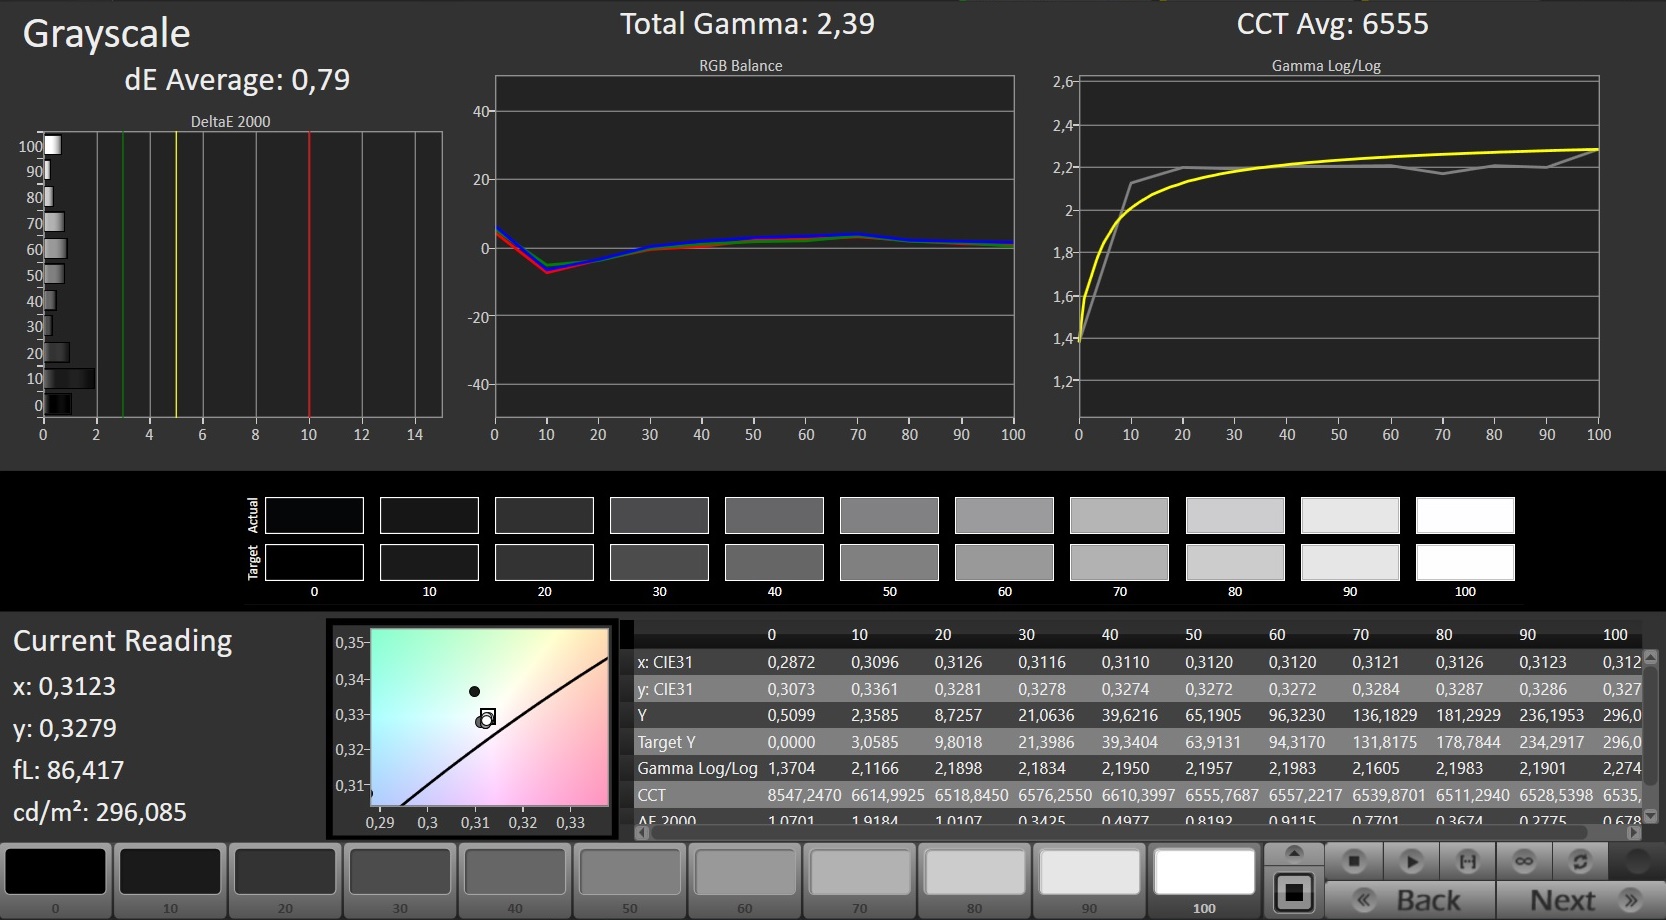
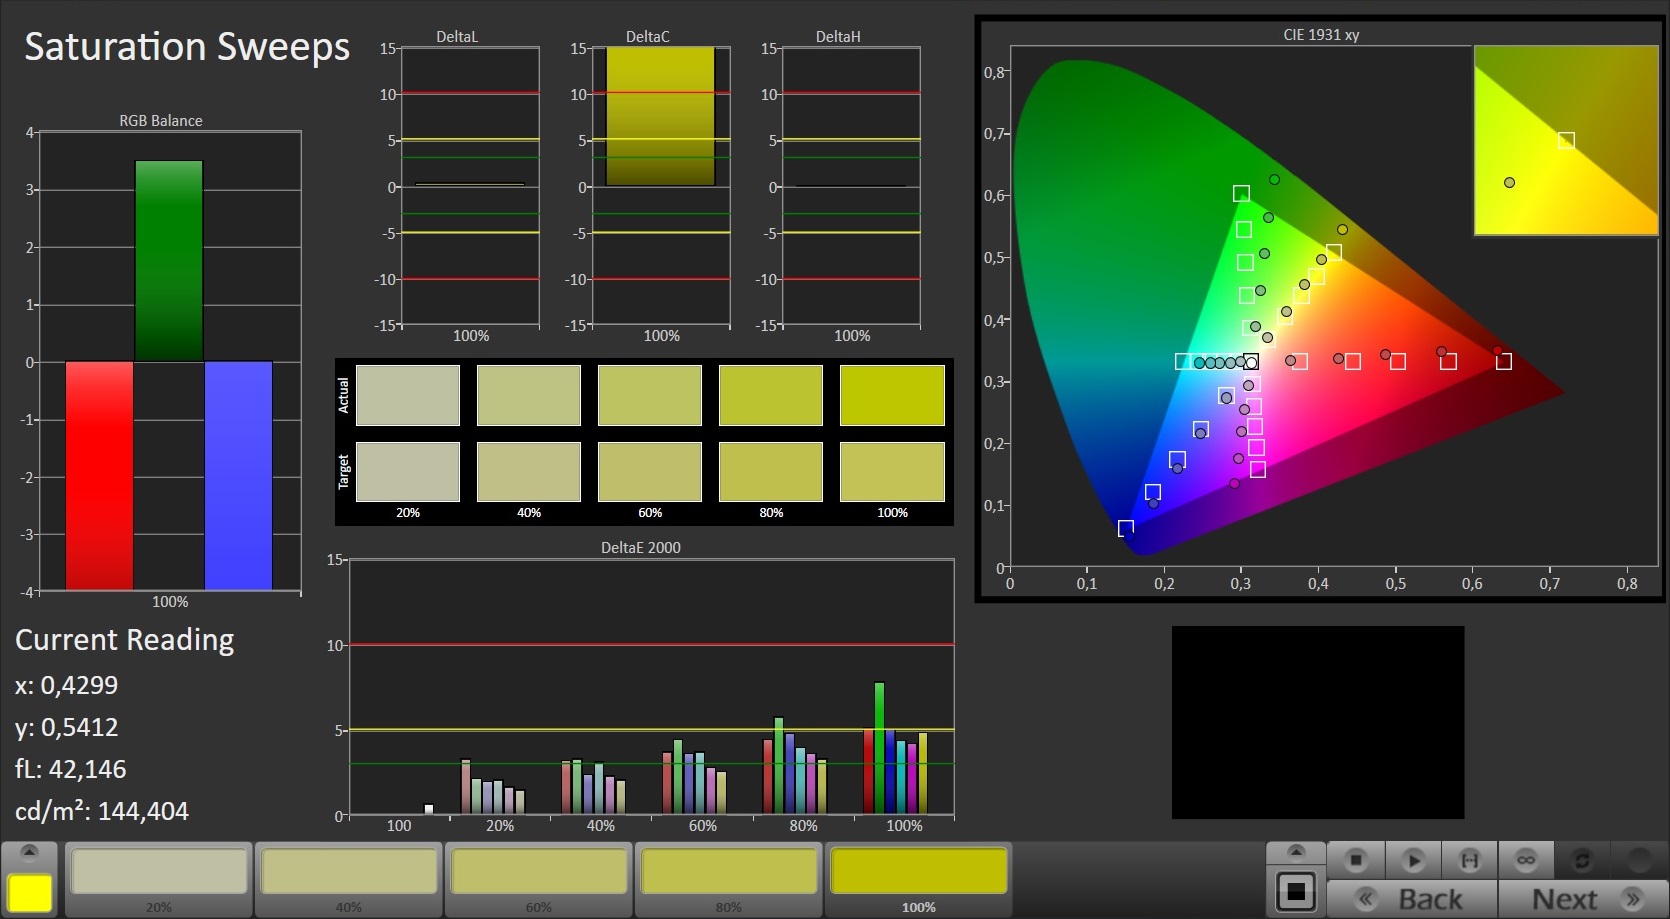
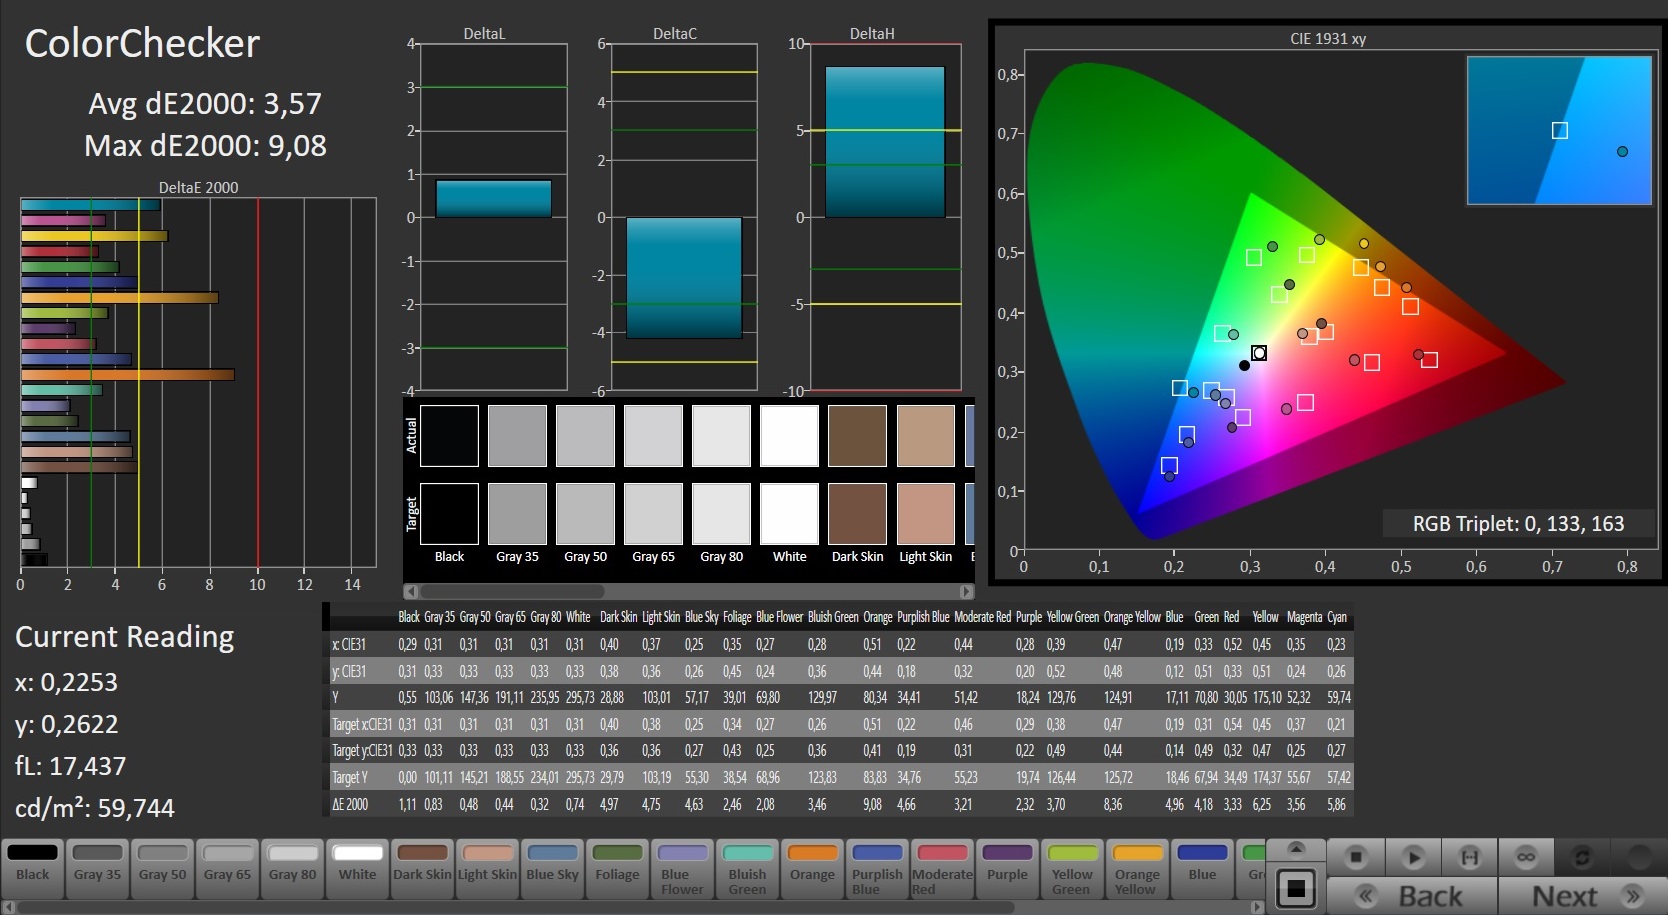
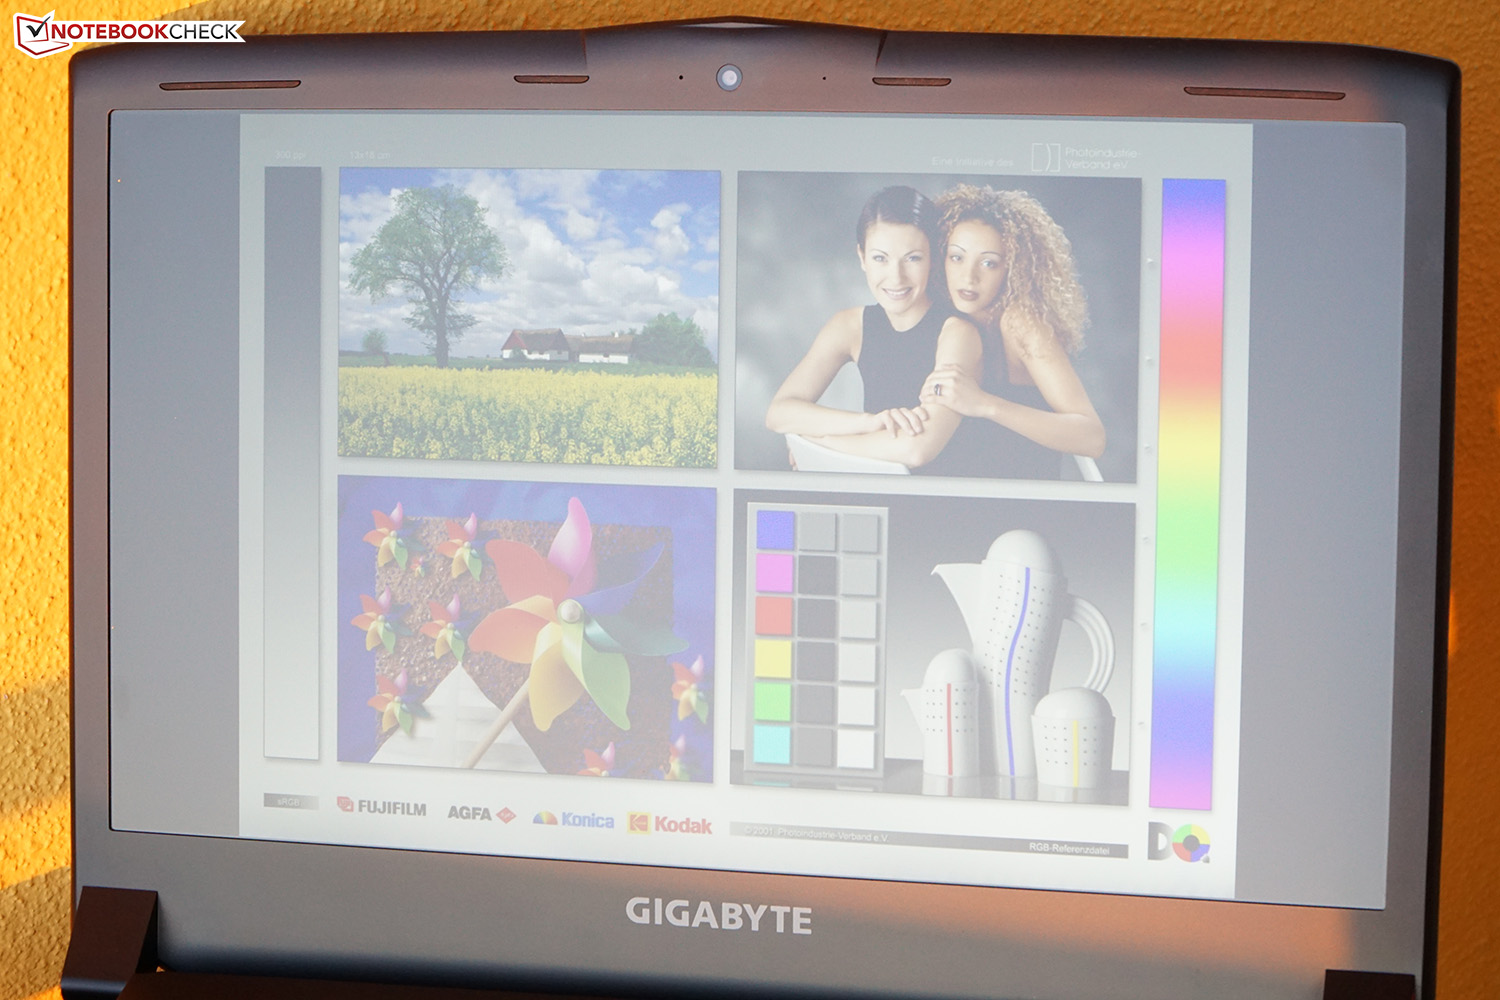
Gigabyte decided to use the same 15.6-inch display panel also found in versions 4 and 5 of the laptop. Interestingly enough, the measurements aren't close to identical: the review notebook features higher brightness, better color accuracy and better color space coverage than the P55W v5 and performs well when compared to the other competitors. Contrast and brightness distribution are a different story, however. In addition, we noticed light bleeding up top on dark backgrounds. A positive aspect is the fact that the brightness adjustment does not make use of PWM.
For our measurements we used the setting "Native Color" in Gigabyte's own tweaking tool "Smart Manager".
| |||||||||||||||||||||||||
Brightness Distribution: 82 %
Center on Battery: 280 cd/m²
Contrast: 609:1 (Black: 0.46 cd/m²)
ΔE ColorChecker Calman: 4.48 | ∀{0.5-29.43 Ø4.72}
ΔE Greyscale Calman: 2.69 | ∀{0.09-98 Ø4.97}
80% sRGB (Argyll 1.6.3 3D)
53% AdobeRGB 1998 (Argyll 1.6.3 3D)
59% AdobeRGB 1998 (Argyll 3D)
80.6% sRGB (Argyll 3D)
63.2% Display P3 (Argyll 3D)
Gamma: 2.37
CCT: 6455 K
| Gigabyte P55W v6 LG Philips LP156WF4 (LGD040E), 1920x1080 | Gigabyte P55W v5 LG Philips LP156WF4-SPH1, 1920x1080 | Asus Strix GL502VM-FY039T LG Philips LP156WF6-SPB6 (LGD046F), 1920x1080 | MSI GS63VR-6RF16H22 Stealth Pro Samsung 156HL01-104 (SDC324C) , 1920x1080 | Acer Predator 15 G9-593-765Q LG Philips LP156WF6-SPP1 (LGD04D5), 1920x1080 | |
|---|---|---|---|---|---|
| Display | -14% | 3% | 15% | 3% | |
| Display P3 Coverage (%) | 63.2 | 50.1 -21% | 64.5 2% | 67.8 7% | 63.6 1% |
| sRGB Coverage (%) | 80.6 | 73.5 -9% | 83.4 3% | 97.4 21% | 83.9 4% |
| AdobeRGB 1998 Coverage (%) | 59 | 51.2 -13% | 60.9 3% | 69.7 18% | 61.3 4% |
| Response Times | 17% | 24% | 16% | 28% | |
| Response Time Grey 50% / Grey 80% * (ms) | 56 ? | 44 ? 21% | 40 ? 29% | 35 ? 37% | |
| Response Time Black / White * (ms) | 31 ? | 27 ? 13% | 25 ? 19% | 26 ? 16% | 25 ? 19% |
| PWM Frequency (Hz) | 202 ? | ||||
| Screen | 6% | 10% | 14% | 13% | |
| Brightness middle (cd/m²) | 280 | 254 -9% | 321 15% | 293 5% | 273 -2% |
| Brightness (cd/m²) | 294 | 267 -9% | 296 1% | 279 -5% | 267 -9% |
| Brightness Distribution (%) | 82 | 89 9% | 88 7% | 84 2% | 83 1% |
| Black Level * (cd/m²) | 0.46 | 0.28 39% | 0.33 28% | 0.33 28% | 0.27 41% |
| Contrast (:1) | 609 | 907 49% | 973 60% | 888 46% | 1011 66% |
| Colorchecker dE 2000 * | 4.48 | 4.28 4% | 4.42 1% | 3.59 20% | 3.77 16% |
| Colorchecker dE 2000 max. * | 10.16 | 10.6 -4% | 9.78 4% | 5.79 43% | 10.64 -5% |
| Greyscale dE 2000 * | 2.69 | 2.77 -3% | 3.34 -24% | 3.86 -43% | 2.48 8% |
| Gamma | 2.37 93% | 2.28 96% | 2.4 92% | 2.53 87% | 2.37 93% |
| CCT | 6455 101% | 6284 103% | 6213 105% | 7229 90% | 6854 95% |
| Color Space (Percent of AdobeRGB 1998) (%) | 53 | 47 -11% | 55 4% | 63 19% | 55 4% |
| Color Space (Percent of sRGB) (%) | 80 | 73 -9% | 83 4% | 97 21% | 84 5% |
| Total Average (Program / Settings) | 3% /
3% | 12% /
10% | 15% /
14% | 15% /
13% |
* ... smaller is better

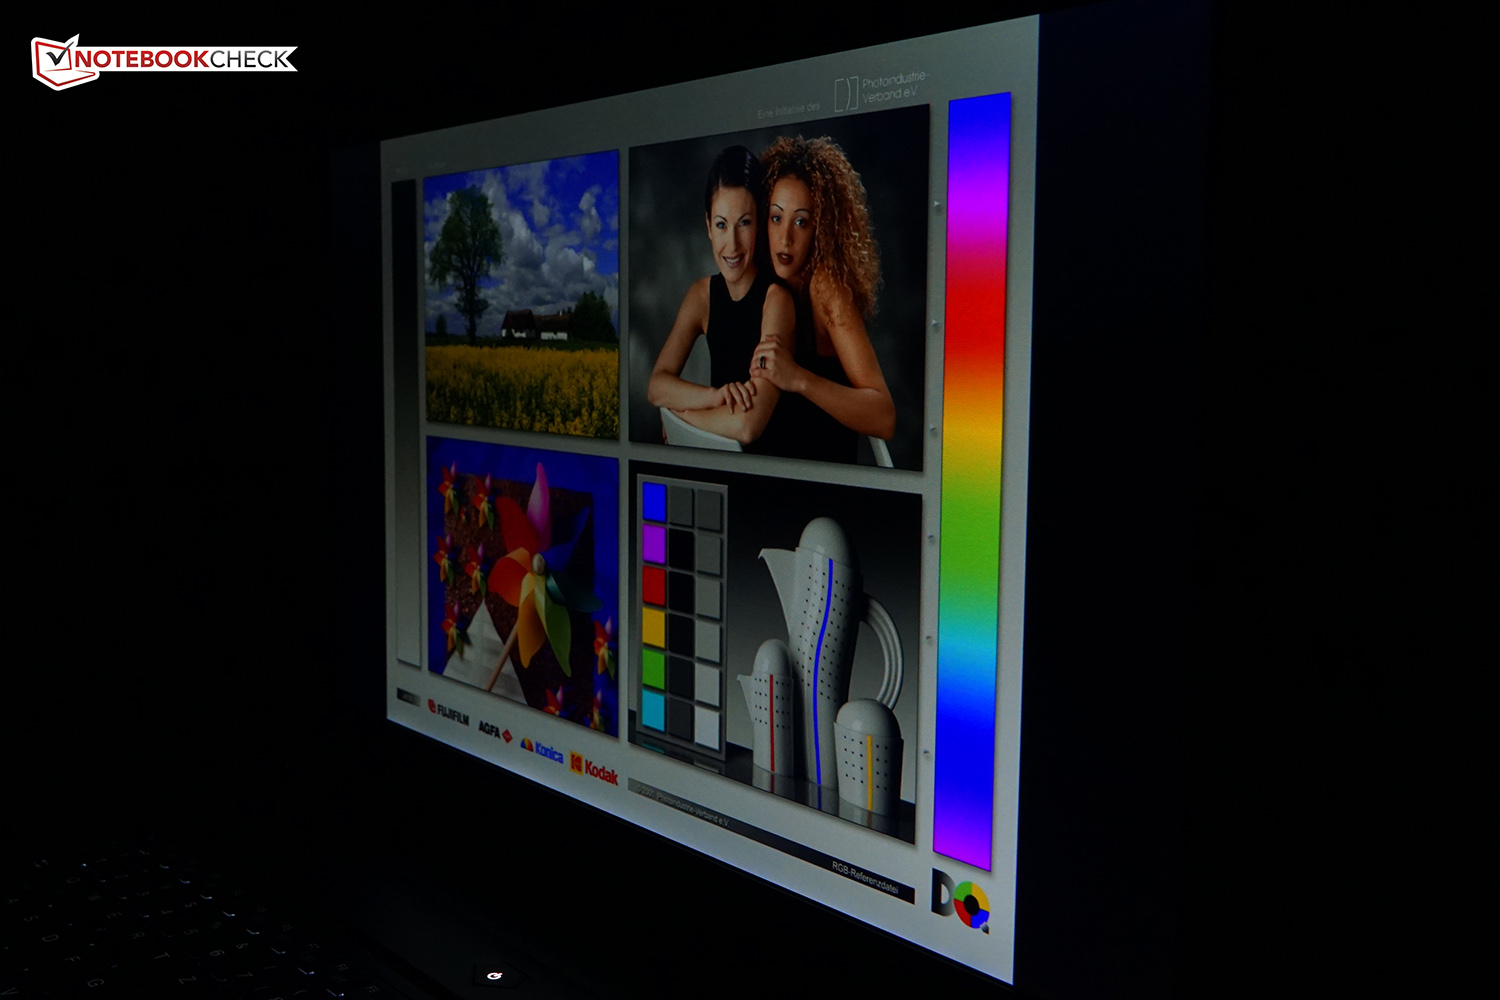
Outdoors, the display doesn't cope well with the brightness of the sun because of the low contrast ratio - especially noticeable when viewing light-colored content. The viewing angle stability is without flaws, however.
Display Response Times
| ↔ Response Time Black to White | ||
|---|---|---|
| 31 ms ... rise ↗ and fall ↘ combined | ↗ 8 ms rise | 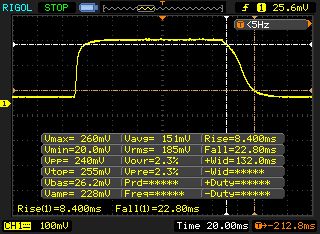 |
| ↘ 23 ms fall | ||
| The screen shows slow response rates in our tests and will be unsatisfactory for gamers. In comparison, all tested devices range from 0.1 (minimum) to 240 (maximum) ms. » 84 % of all devices are better. This means that the measured response time is worse than the average of all tested devices (19.8 ms). | ||
| ↔ Response Time 50% Grey to 80% Grey | ||
| 56 ms ... rise ↗ and fall ↘ combined | ↗ 23 ms rise | 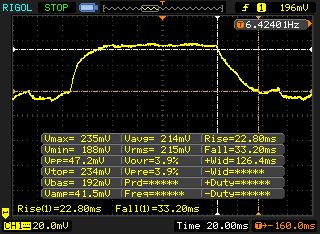 |
| ↘ 33 ms fall | ||
| The screen shows slow response rates in our tests and will be unsatisfactory for gamers. In comparison, all tested devices range from 0.165 (minimum) to 636 (maximum) ms. » 93 % of all devices are better. This means that the measured response time is worse than the average of all tested devices (31 ms). | ||
Screen Flickering / PWM (Pulse-Width Modulation)
| Screen flickering / PWM not detected | 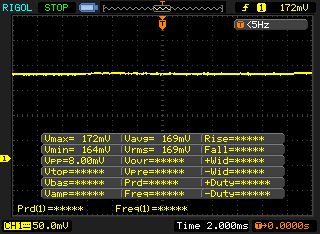 | ||
In comparison: 52 % of all tested devices do not use PWM to dim the display. If PWM was detected, an average of 7769 (minimum: 5 - maximum: 343500) Hz was measured. | |||
Performance
The P55W v6 offers the performance one would expect from a current-generation (and somewhat inexpensive) gaming notebook. For a price of 1600 Euro (~$1710), the buyer gets a system with a high-performance CPU, 16 GB of RAM and a powerful GPU - more than enough power to handle even modern games.
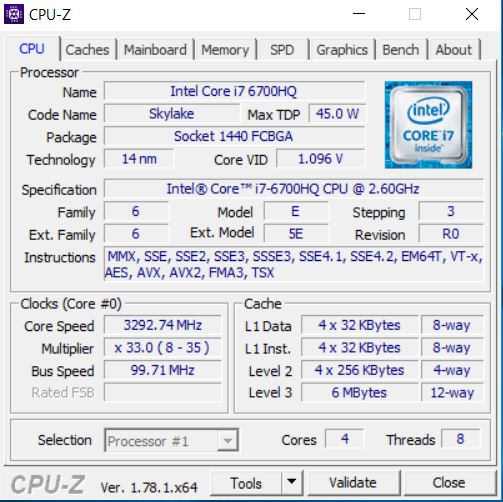


Processor
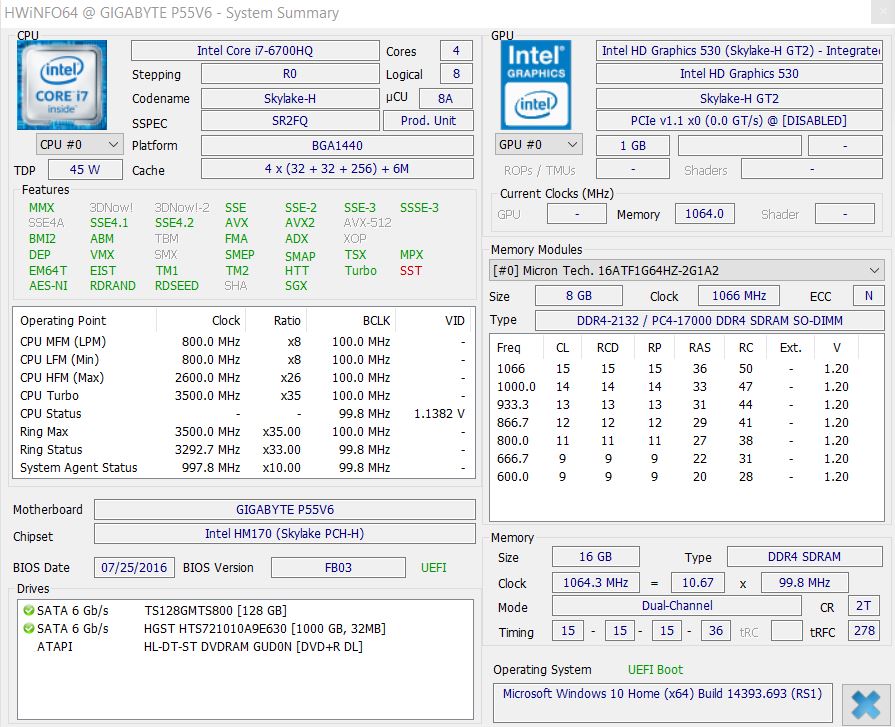
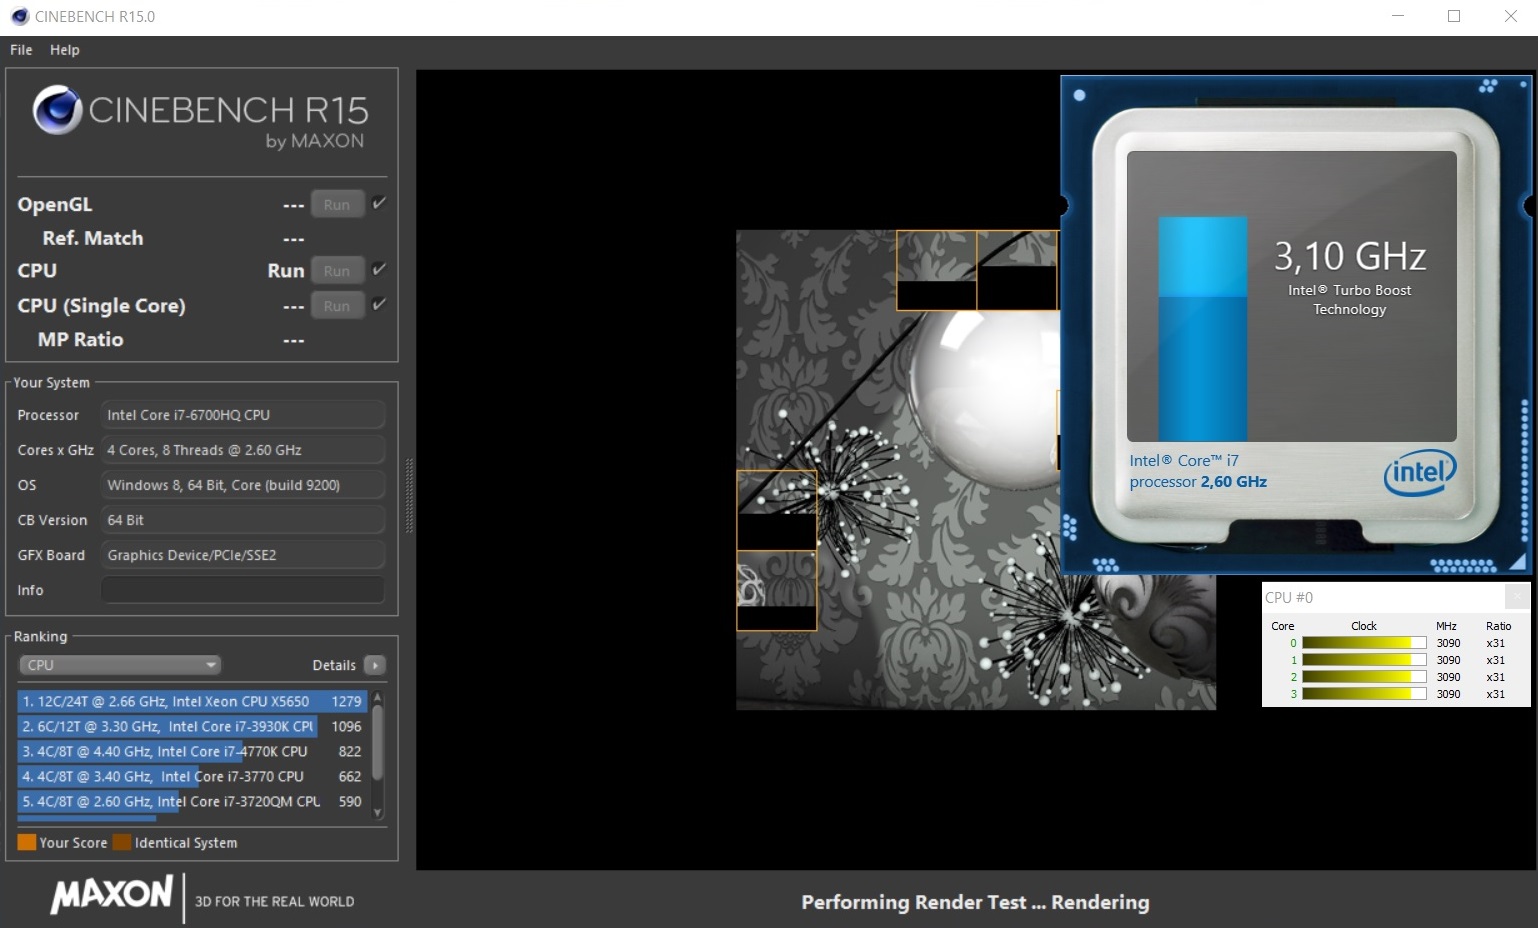
The mobile high-end CPU Core i7-6700HQ was the de facto standard for gaming notebooks for a long time. We use the past tense here since the Skylake-successor Kaby Lake is already on the market. CPUs in the newer series - like the Core i7-7700HQ in the Acer Aspire VX5-591G - feature an improved 14nm-construction and offer higher performance per MHz. Speaking of performance: we expect the quad-core i7-6700HQ (2.6 GHz base frequency; 3.5 GHz Turbo) to be more than adequate for quite some time to come.
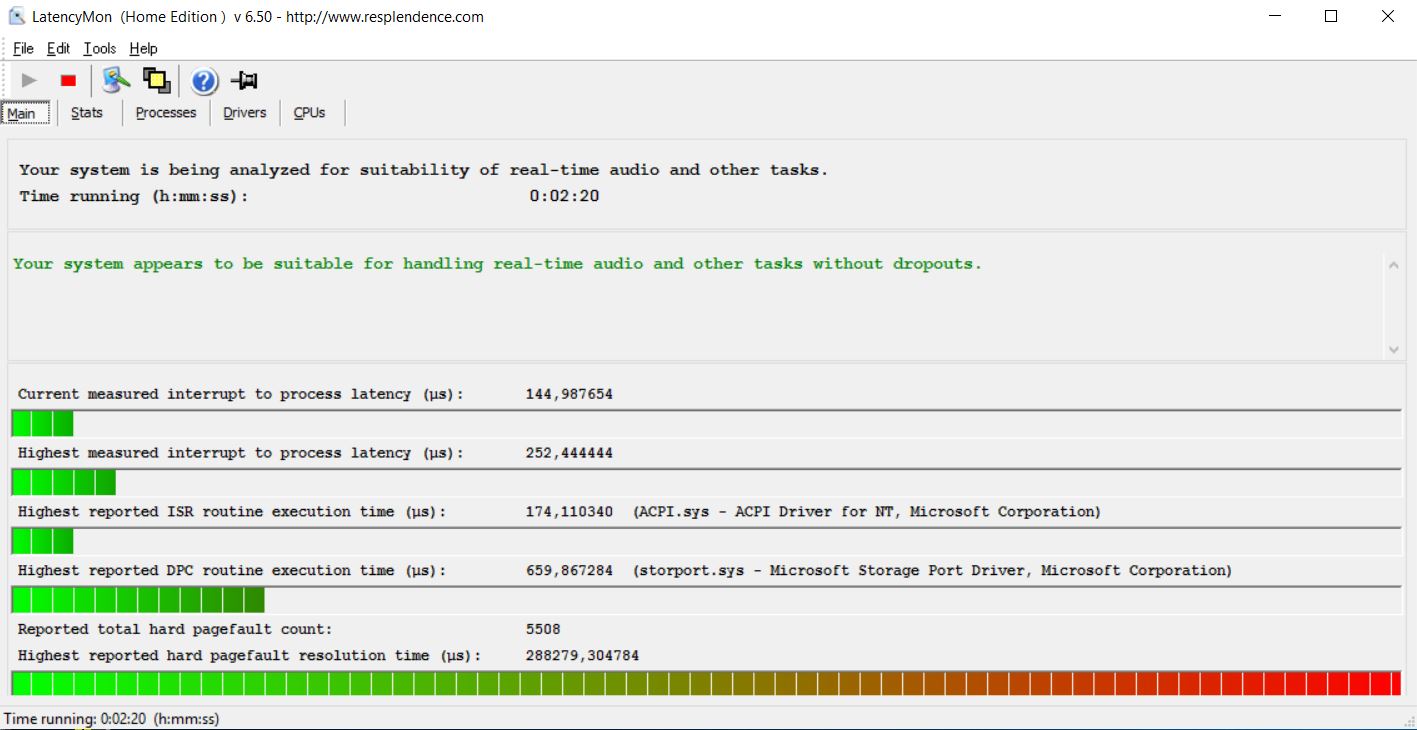
Our review notebook performed exactly as expected during the Cinebench test. For his particular as well as all other performance tests we use the fan preset "normal". We didn't observe any throttling under load, although the CPU frequency dipped down to 650 MHz sporadically. We should clarify though that during our subsequent gaming tests, we never noticed any decline in the frame rate even after extended periods of time - so this behavior doesn't seem to affect daily use at all.

System Performance
We use the practically relevant PCMark 8 benchmark tests to evaluate overall system performance,. The "Work Score" primarily reflects the CPU performance and the performance of the hard drive. The P55W performs about as well as the predecessor and the MSI GS63VR. Both the Asus Strix and the Acer Predator are marginally faster.
The "Home Score" also incorporates the GPU performance, so it doesn't come as a surprise that the review notebook pulls ahead of the Acer Aspire (GTX 1050 Ti) and the predecessor (GTX 970M). The combination of Core i7-6700HQ and GeForce GTX 1060 allows for even better performance: the Asus Strix almost catches up to the beefier and more expensive Acer Predator. For daily use, this difference doesn't matter, as the P55W v6 performs smoothly at all times.
| PCMark 7 Score | 5715 points | |
| PCMark 8 Home Score Accelerated v2 | 4014 points | |
| PCMark 8 Creative Score Accelerated v2 | 4897 points | |
| PCMark 8 Work Score Accelerated v2 | 4784 points | |
Help | ||
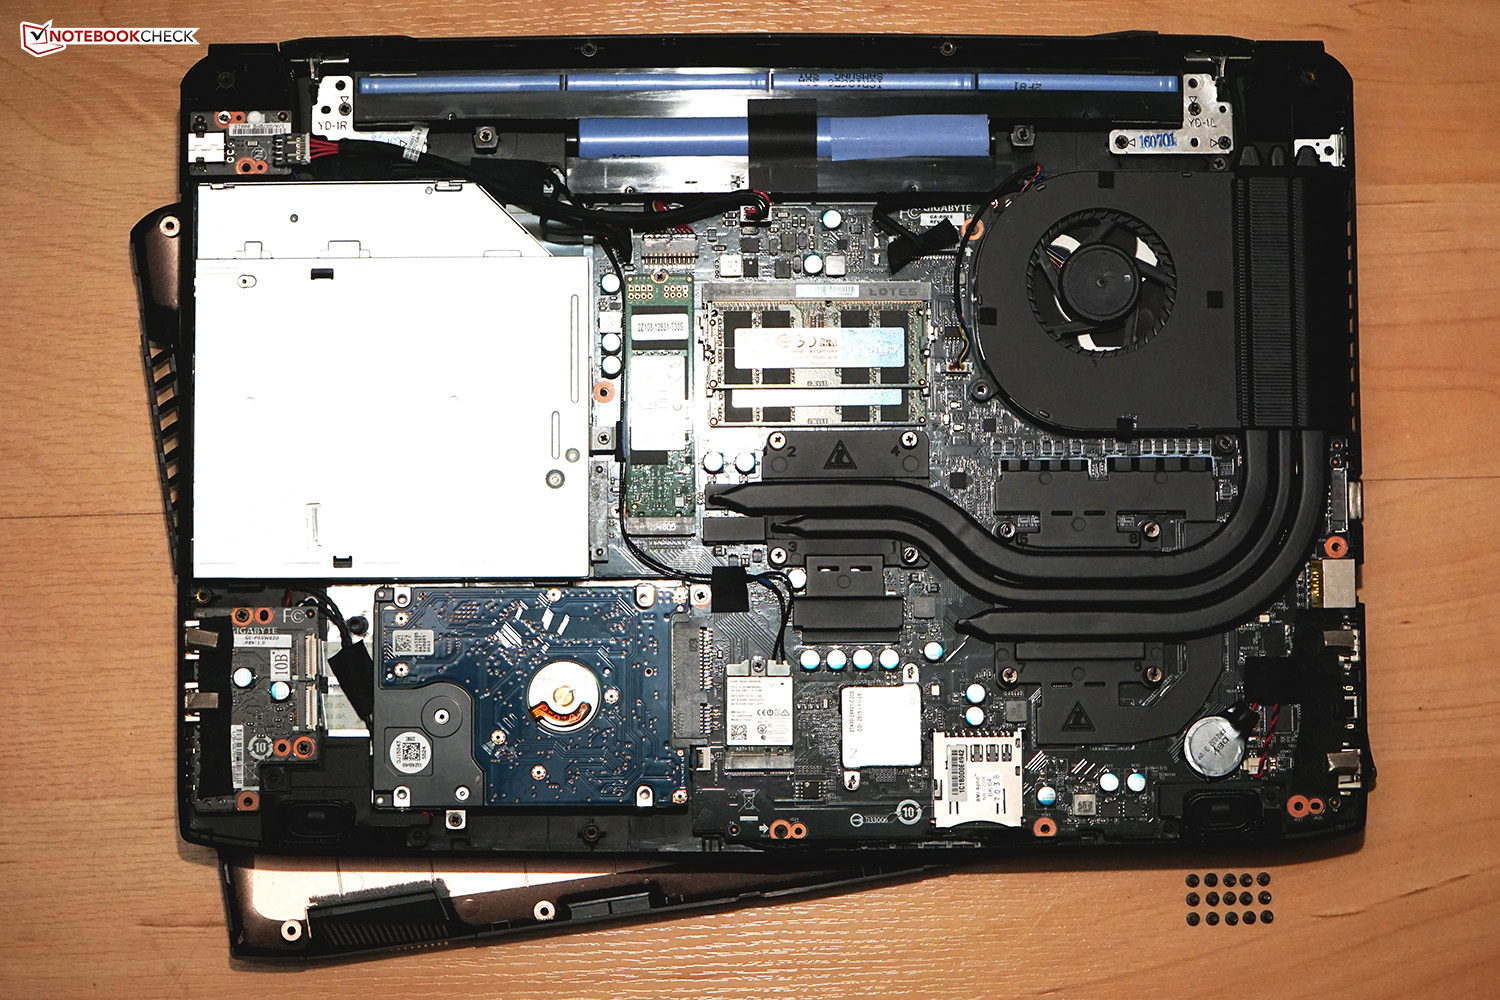
Storage Devices
The smooth performance we talked about is on tap despite the fact that the system drive isn't one of the fasted ones out there. On the contrary: the 128 GB SSD from Transcend is actually by far the slowest drive in our comparison. The predecessor in particular outperforms the review candidate in all observed metrics. We should mention though that while the Samung SM951 NVMe drive might be one of the fastest M.2 models, it also happens to be one of the really expensive ones, so it makes sense for Gigabyte to make some cuts here to lower the price. As we mentioned already, this change doesn't really affect everyday performance. The SSD is significantly faster than the (also included) 1 TB conventional drive in any case.
| Gigabyte P55W v6 Transcend MTS800 128GB M.2 (TS128GMTS800) | Gigabyte P55W v5 Samsung SM951 MZVPV128 NVMe | Asus Strix GL502VM-FY039T Micron SSD 1100 (MTFDDAV256TBN) | MSI GS63VR-6RF16H22 Stealth Pro Samsung SM951 MZVPV256HDGL m.2 PCI-e | Acer Aspire VX5-591G-D0DD SK Hynix Canvas SC300 512GB M.2 (HFS512G39MND) | Acer Predator 15 G9-593-765Q LiteOn CV1-8B512 | |
|---|---|---|---|---|---|---|
| CrystalDiskMark 3.0 | 166% | 53% | 298% | 50% | 55% | |
| Read Seq (MB/s) | 511 | 1356 165% | 462.5 -9% | 1973 286% | 494.2 -3% | 517 1% |
| Write Seq (MB/s) | 161.1 | 657 308% | 462.7 187% | 1292 702% | 449.6 179% | 449.7 179% |
| Read 512 (MB/s) | 338 | 1044 209% | 335 -1% | 1279 278% | 348.1 3% | 355.3 5% |
| Write 512 (MB/s) | 160.8 | 642 299% | 407.1 153% | 1288 701% | 418.2 160% | 433.7 170% |
| Read 4k (MB/s) | 26.2 | 50.8 94% | 25.61 -2% | 52.3 100% | 16.97 -35% | 27.69 6% |
| Write 4k (MB/s) | 76.7 | 142.7 86% | 86.3 13% | 153.2 100% | 38.36 -50% | 72.9 -5% |
| Read 4k QD32 (MB/s) | 264.7 | 588 122% | 246.7 -7% | 464.4 75% | 394.9 49% | 290.9 10% |
| Write 4k QD32 (MB/s) | 160.3 | 236.3 47% | 301.5 88% | 384.4 140% | 317.4 98% | 273.8 71% |

GPU Performance
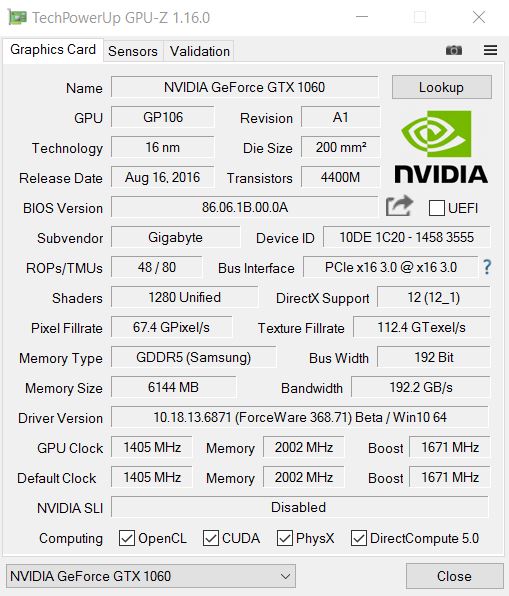
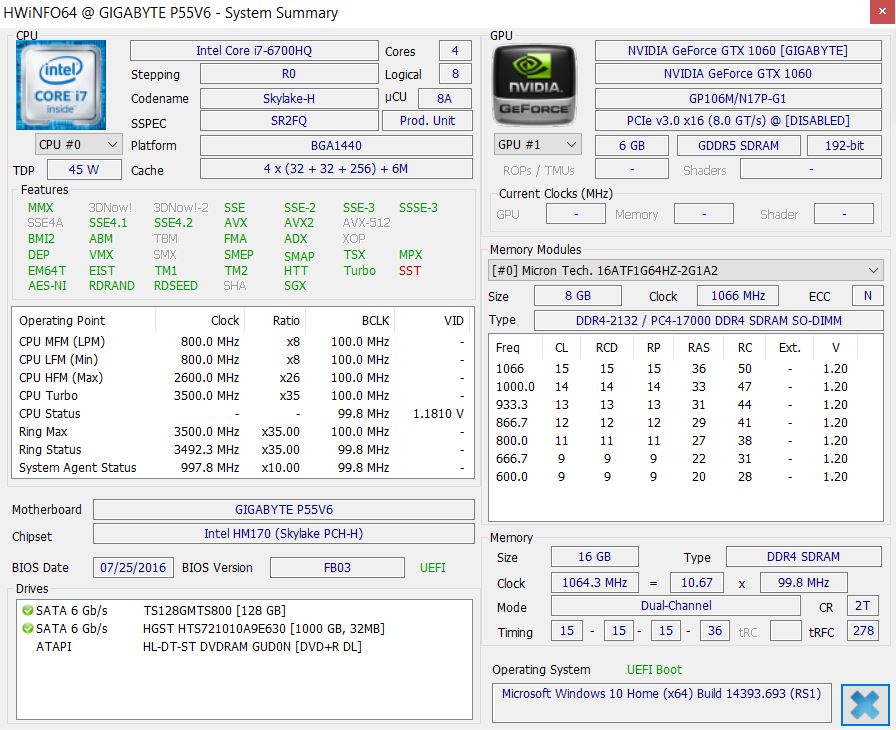
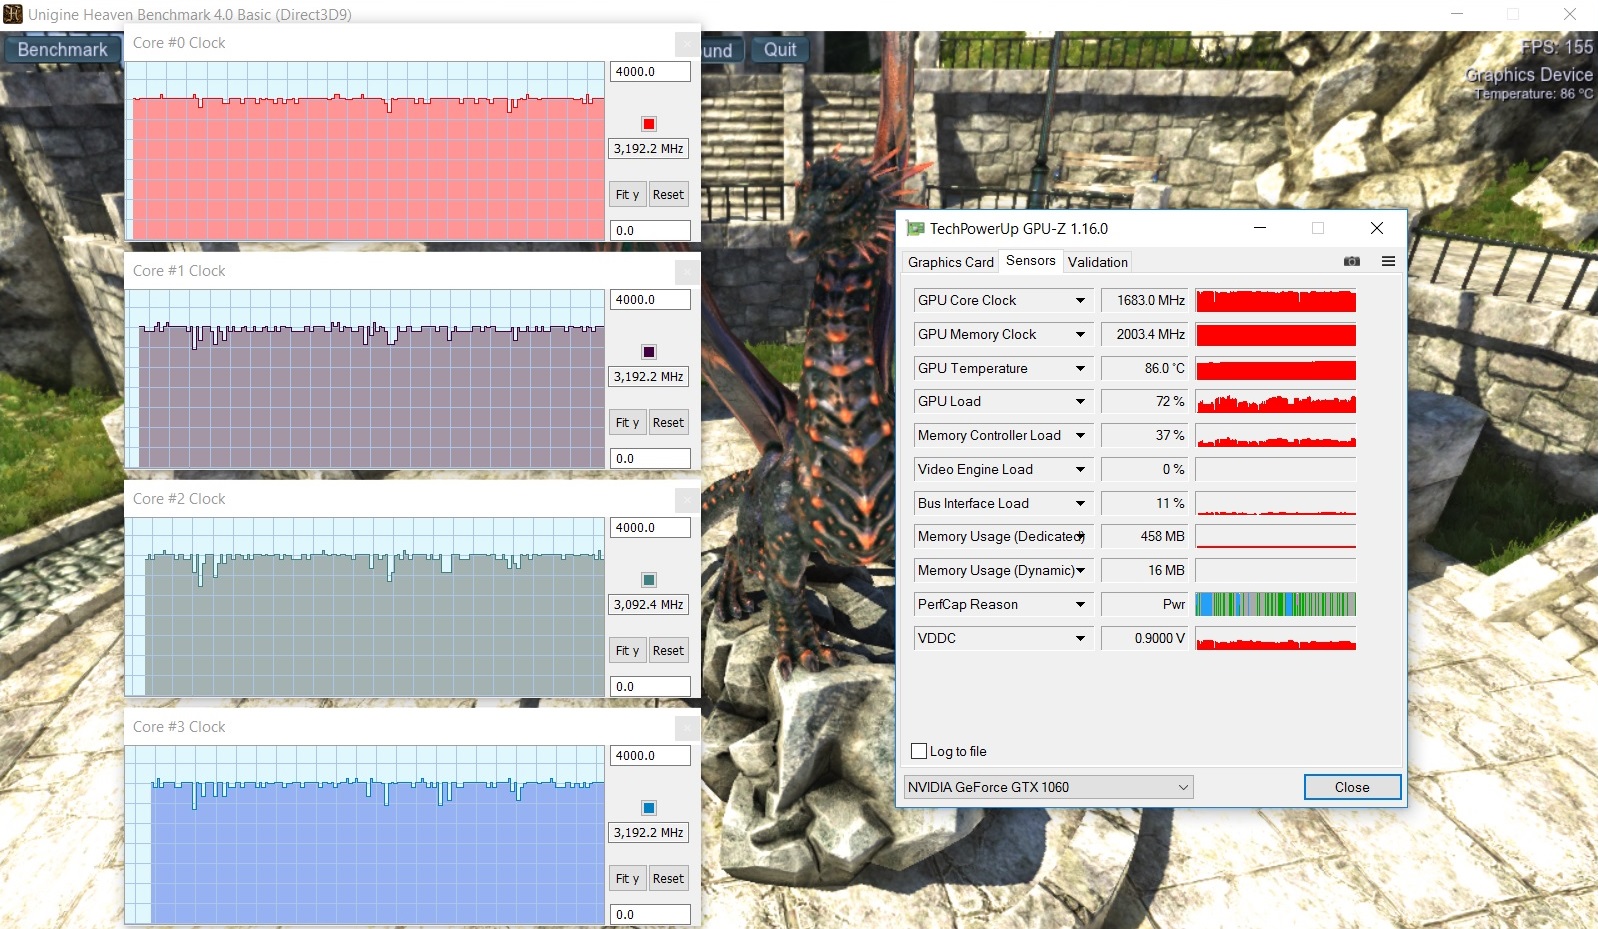
Let's move on to the GPU now. The GeForce GTX 1060 is Nvidia's "entry-level" upper-class Pascal GPU and as such a very sensible choice for this system. The GPU runs at a base frequency of 1405 MHz and comes with 1280 shader units as well as 6 GB of RAM with a 192-bit interface - similar to the desktop version. Gigabyte also raised the maximum Boost by 10 % compared to the reference model, which means that the GPU frequency tops out at 1850 MHz. The system can't sustain this level under load for a long time - more on that later.
An evaluation of the 3DMark scores show that the P55W v6 offers the same 3D performance as other, identically equipped systems. The performance difference between the new GPU and the GeForce GTX 970M in the predecessor is about 50 %, which is a massive improvement considering that the system price hasn't changed at all.
| 3DMark | |
| 1280x720 Cloud Gate Standard Graphics | |
| Acer Predator 15 G9-593-765Q | |
| Asus Strix GL502VM-FY039T | |
| Gigabyte P55W v6 | |
| MSI GS63VR-6RF16H22 Stealth Pro | |
| Acer Aspire VX5-591G-D0DD | |
| Gigabyte P55W v5 | |
| 1920x1080 Fire Strike Graphics | |
| Acer Predator 15 G9-593-765Q | |
| MSI GS63VR-6RF16H22 Stealth Pro | |
| Asus Strix GL502VM-FY039T | |
| Gigabyte P55W v6 | |
| Acer Aspire VX5-591G-D0DD | |
| Gigabyte P55W v5 | |
| 3DMark 11 - 1280x720 Performance GPU | |
| Acer Predator 15 G9-593-765Q | |
| Asus Strix GL502VM-FY039T | |
| MSI GS63VR-6RF16H22 Stealth Pro | |
| Gigabyte P55W v6 | |
| Gigabyte P55W v5 | |
| Acer Aspire VX5-591G-D0DD | |
| 3DMark 11 Performance | 12433 points | |
| 3DMark Cloud Gate Standard Score | 22706 points | |
| 3DMark Fire Strike Score | 9527 points | |
| 3DMark Fire Strike Extreme Score | 4963 points | |
Help | ||
Gaming Performance
The GeForce GTX 1060 handles gaming very well. At the native Full-HD resolution, most titles - even newer ones - run well at maximum details. Only Deus Ex: Mankind Divided - which happens to be quite demanding on the hardware - runs slower than 30 FPS and thus isn't really playable. Unfortunately, the GPU offers much less performance with the notebook running on battery and the output drops by about 40 %.
The next higher-performing model in Nvidia's current lineup is the GeForce GTX 1070, which is about 40 - 60 % faster. At this time, only users who own a 4K monitor really have a significant advantage - but this advantage doesn't come cheap.
| The Witcher 3 | |
| 1920x1080 Ultra Graphics & Postprocessing (HBAO+) | |
| Acer Predator 15 G9-593-765Q | |
| MSI GS63VR-6RF16H22 Stealth Pro | |
| Gigabyte P55W v6 | |
| Acer Aspire VX5-591G-D0DD | |
| 1920x1080 High Graphics & Postprocessing (Nvidia HairWorks Off) | |
| Acer Predator 15 G9-593-765Q | |
| MSI GS63VR-6RF16H22 Stealth Pro | |
| Gigabyte P55W v6 | |
| Acer Aspire VX5-591G-D0DD | |
| Deus Ex Mankind Divided | |
| 1920x1080 High Preset AF:4x | |
| Acer Predator 15 G9-593-765Q | |
| Gigabyte P55W v6 | |
| MSI GS63VR-6RF16H22 Stealth Pro | |
| 1920x1080 Ultra Preset AA:2xMS AF:8x | |
| Acer Predator 15 G9-593-765Q | |
| Gigabyte P55W v6 | |
| MSI GS63VR-6RF16H22 Stealth Pro | |
| BioShock Infinite - 1920x1080 Ultra Preset, DX11 (DDOF) | |
| Asus Strix GL502VM-FY039T | |
| MSI GS63VR-6RF16H22 Stealth Pro | |
| Gigabyte P55W v6 | |
| Gigabyte P55W v5 | |
| low | med. | high | ultra | |
|---|---|---|---|---|
| BioShock Infinite (2013) | 189 | 176.2 | 151.7 | 99.7 |
| The Witcher 3 (2015) | 166.1 | 127.2 | 63.3 | 37.8 |
| Deus Ex Mankind Divided (2016) | 116.1 | 98.4 | 54.6 | 28 |
Emissions
System Noise
Similar to the predecessors, the fan of the P55W v6 never stops spinning (fan setting "normal") during idle. The fan is always audible, except when the conventional hard drive is being accessed - its clacking noise then moves slightly into the foreground.
The fan speed increases in four distinctly audible steps when the system is under load.. The fan rarely spins at its maximum - and if, it only does so to "curtail" the temperature under maximum load. The result in that case is a noise level of 52 dB, which is a bit much in our opinion. Quite annoying is the difference between the maximum and the average loudness of 41 dB: while the system noise is generally tolerable, the occasional increases of 11 dB make headphones a welcome accessory.
Noise level
| Idle |
| 35 / 36 / 37 dB(A) |
| HDD |
| 37 dB(A) |
| DVD |
| 39 / dB(A) |
| Load |
| 41 / 52 dB(A) |
 | ||
30 dB silent 40 dB(A) audible 50 dB(A) loud |
||
min: | ||
| Gigabyte P55W v6 GeForce GTX 1060 Mobile, 6700HQ | Gigabyte P55W v5 GeForce GTX 970M, 6700HQ | Asus Strix GL502VM-FY039T GeForce GTX 1060 Mobile, 6700HQ | MSI GS63VR-6RF16H22 Stealth Pro GeForce GTX 1060 Mobile, 6700HQ | Acer Predator 15 G9-593-765Q GeForce GTX 1070 Mobile, 6700HQ | |
|---|---|---|---|---|---|
| Noise | 4% | 3% | 8% | 3% | |
| off / environment * (dB) | 31 | 31 -0% | 30 3% | 30 3% | |
| Idle Minimum * (dB) | 35 | 33 6% | 32 9% | 32 9% | 31 11% |
| Idle Average * (dB) | 36 | 34 6% | 33 8% | 33 8% | 35 3% |
| Idle Maximum * (dB) | 37 | 35 5% | 34 8% | 34 8% | 38 -3% |
| Load Average * (dB) | 41 | 43 -5% | 44 -7% | 37 10% | 43 -5% |
| Load Maximum * (dB) | 52 | 49 6% | 53 -2% | 46 12% | 49 6% |
* ... smaller is better
Temperature
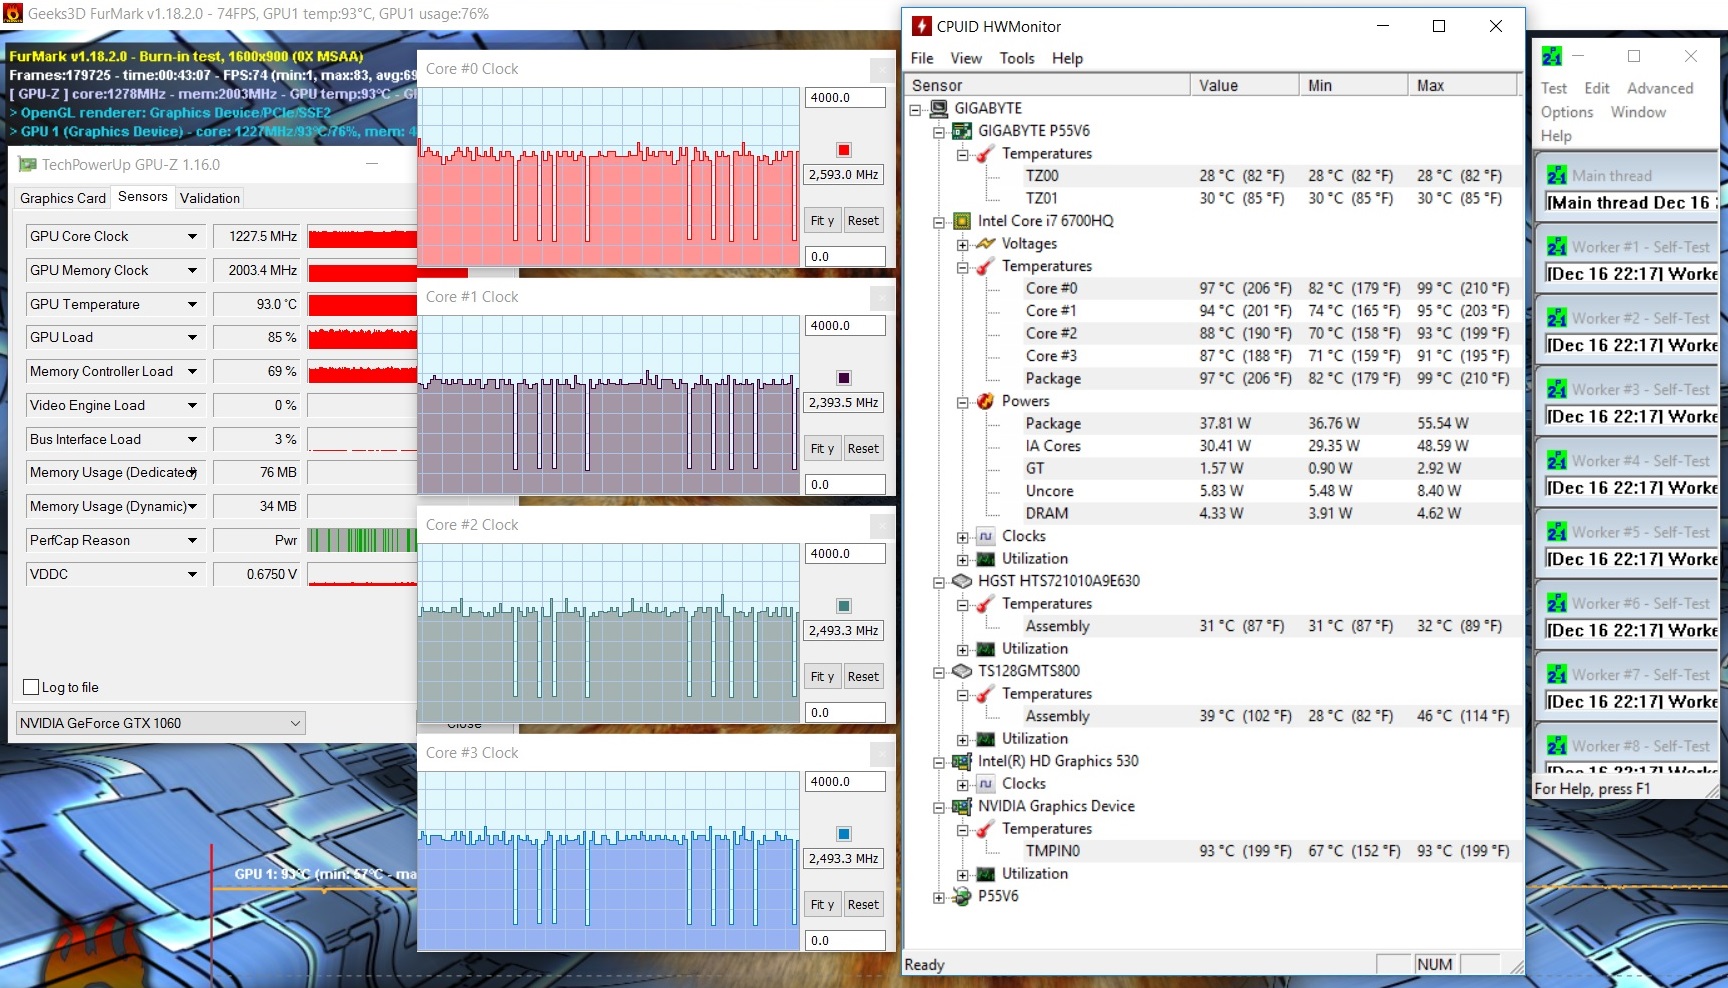
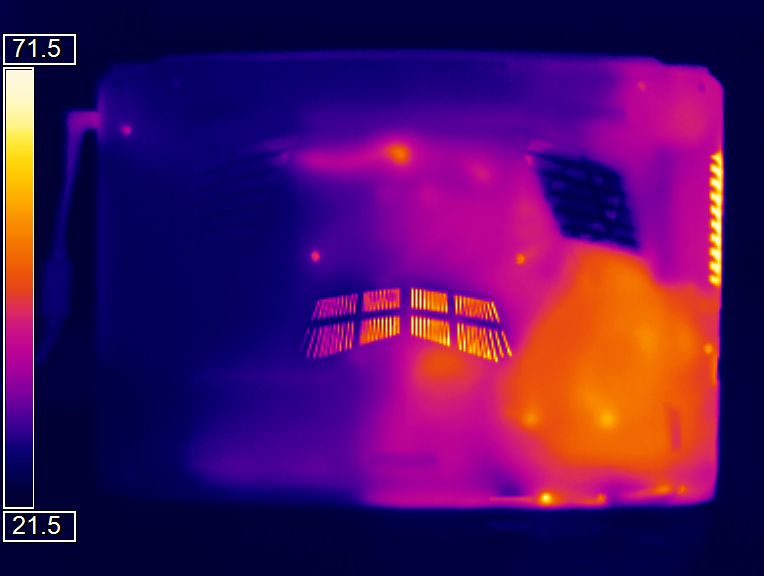
Our review notebooks gets hotter than average during idle, but we wouldn't call the result uncomfortable. Under load, the temperature doesn't increase quite as much as we've observed when evaluating other competitors (including the predecessor).
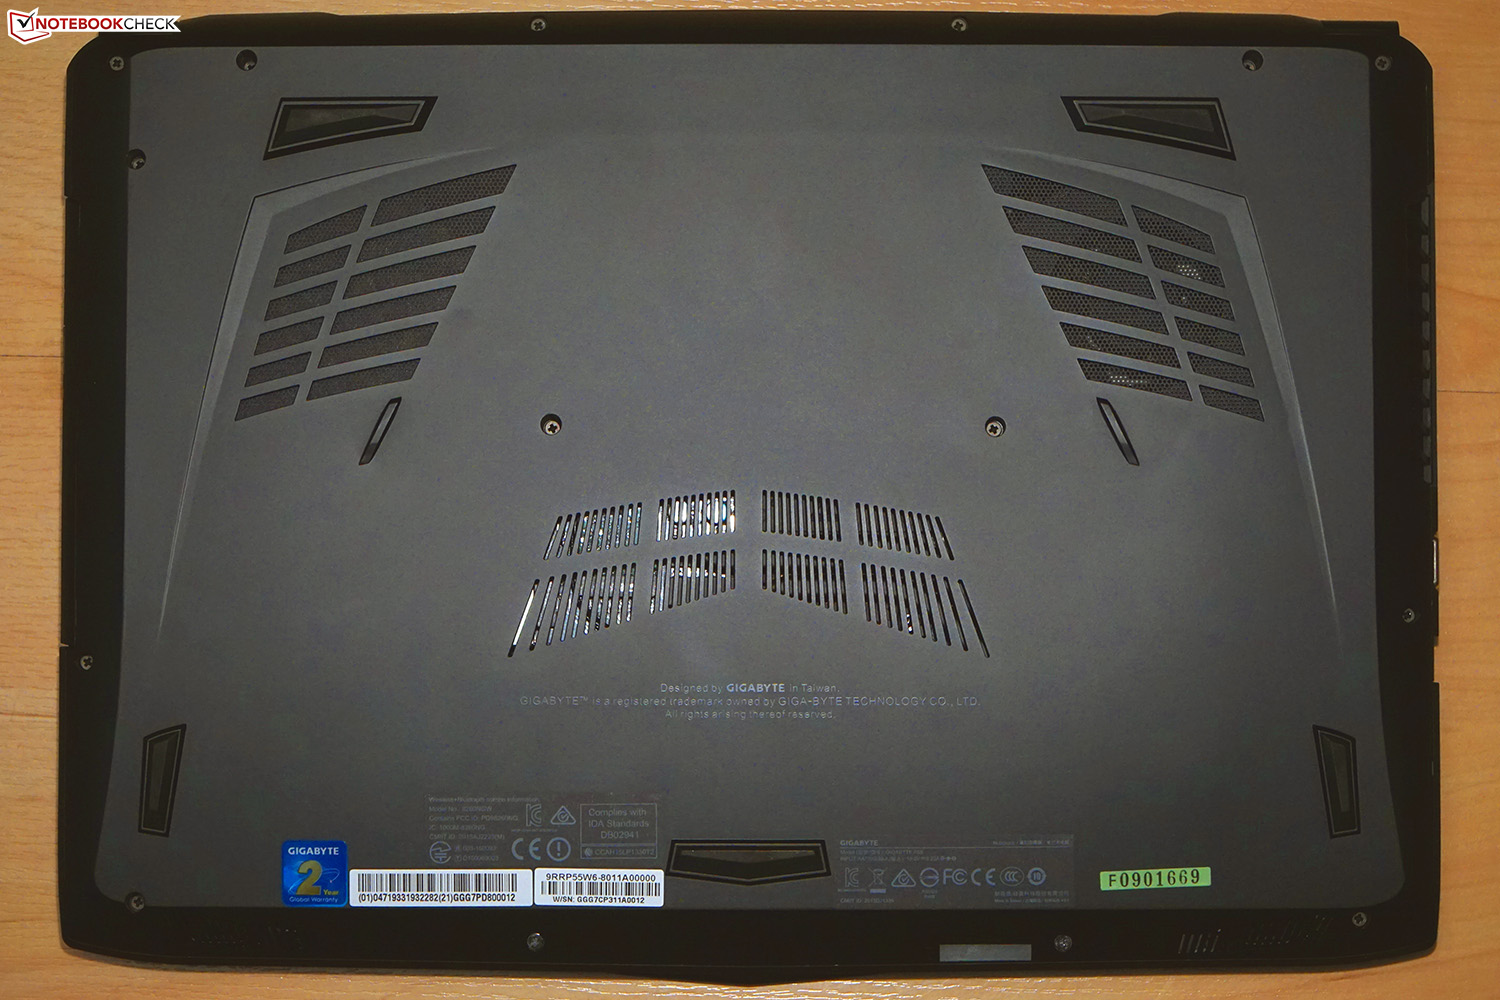
The temperature on the bottom of the notebook never quite reached 50 degrees even during extended gaming sessions. To achieve higher temperatures, we had to "resort"to our stress test with Prime95 and Furmark running in parallel for an hour. Here, the processor remained at least at its base frequency of 2.6 GHz - except for the aforementioned brief dips to 650 MHz. GPU throttling was an issue though and the system reduced the clock speed to about 1.2 GHz to keep the heat in check.
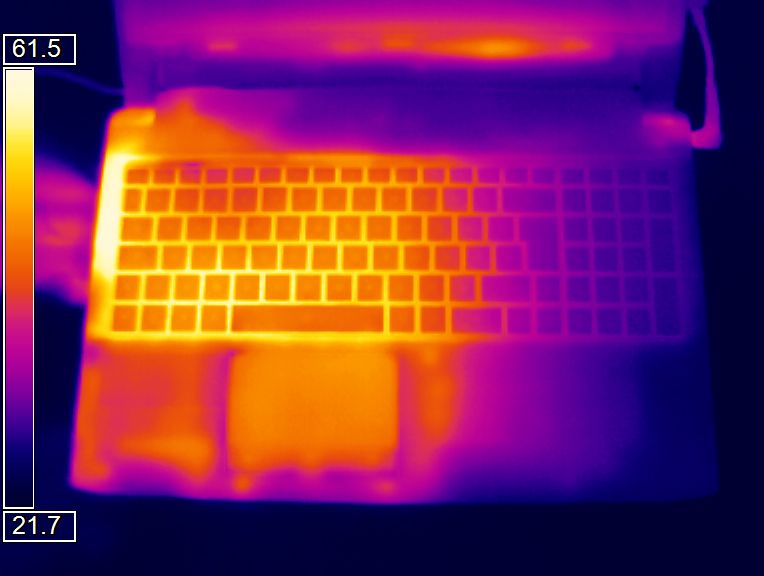
(-) The maximum temperature on the upper side is 47.7 °C / 118 F, compared to the average of 40.4 °C / 105 F, ranging from 21.2 to 68.8 °C for the class Gaming.
(-) The bottom heats up to a maximum of 51.2 °C / 124 F, compared to the average of 43.2 °C / 110 F
(+) In idle usage, the average temperature for the upper side is 28 °C / 82 F, compared to the device average of 33.9 °C / 93 F.
(-) The palmrests and touchpad can get very hot to the touch with a maximum of 45.2 °C / 113.4 F.
(-) The average temperature of the palmrest area of similar devices was 28.8 °C / 83.8 F (-16.4 °C / -29.6 F).
| Gigabyte P55W v6 GeForce GTX 1060 Mobile, 6700HQ | Gigabyte P55W v5 GeForce GTX 970M, 6700HQ | Asus Strix GL502VM-FY039T GeForce GTX 1060 Mobile, 6700HQ | MSI GS63VR-6RF16H22 Stealth Pro GeForce GTX 1060 Mobile, 6700HQ | Acer Predator 15 G9-593-765Q GeForce GTX 1070 Mobile, 6700HQ | |
|---|---|---|---|---|---|
| Heat | 5% | -17% | 5% | 18% | |
| Maximum Upper Side * (°C) | 47.7 | 50 -5% | 65.3 -37% | 45.3 5% | 40.5 15% |
| Maximum Bottom * (°C) | 51.2 | 57.7 -13% | 64.4 -26% | 62.6 -22% | 42 18% |
| Idle Upper Side * (°C) | 32.1 | 25.7 20% | 35.4 -10% | 25.3 21% | 28.2 12% |
| Idle Bottom * (°C) | 32.8 | 27.2 17% | 31.6 4% | 27.3 17% | 24.3 26% |
* ... smaller is better
Speakers
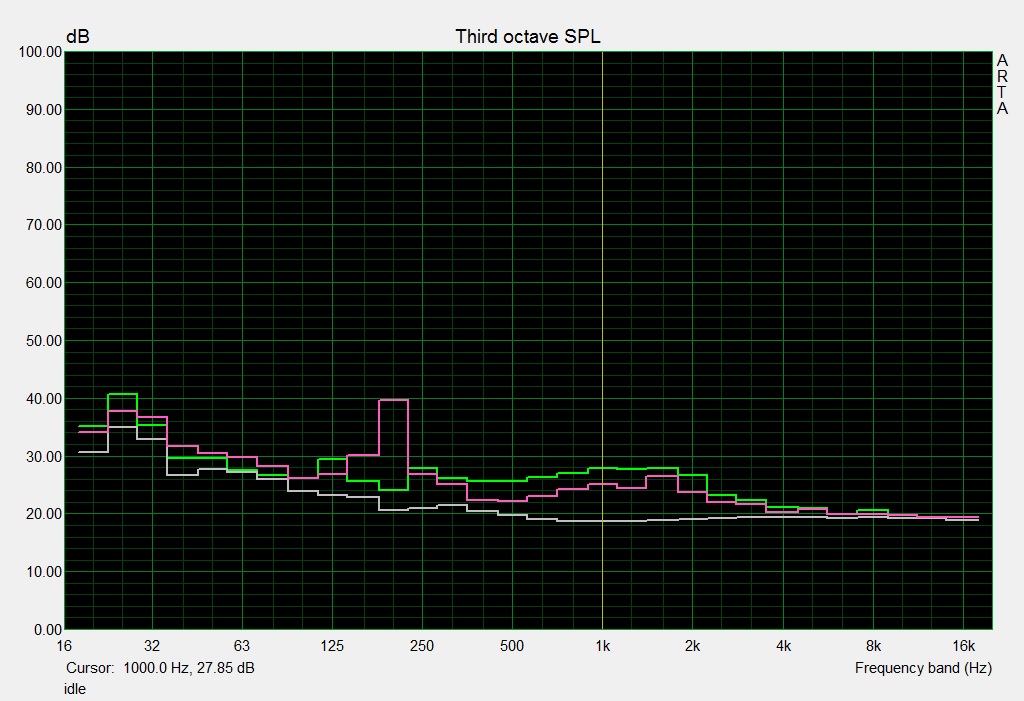
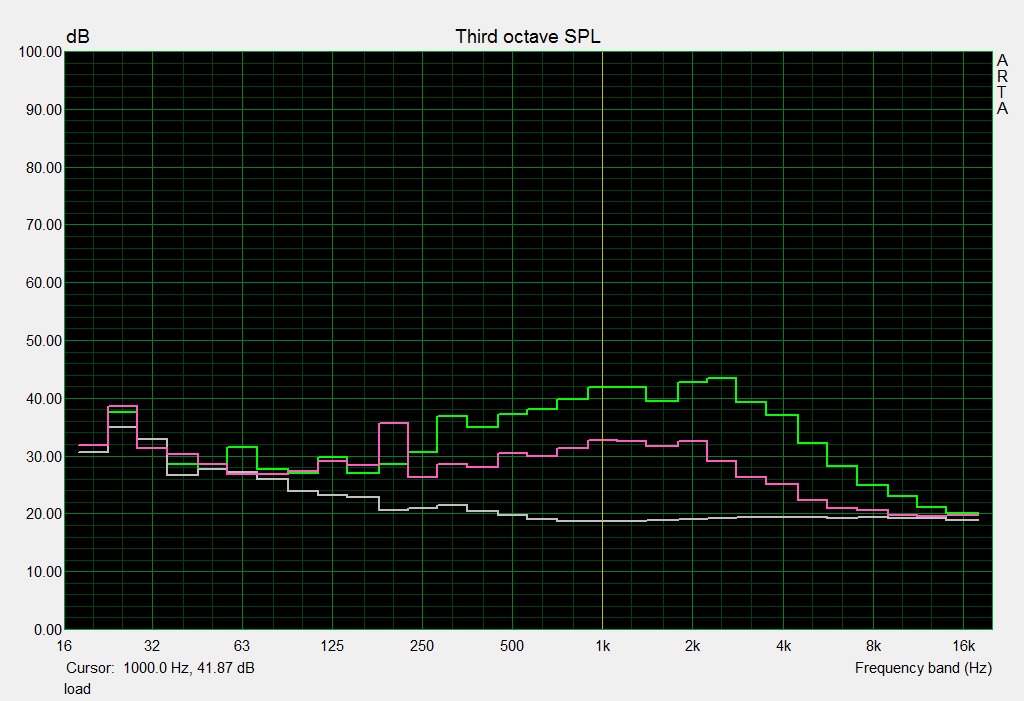
Gigabyte P55W v6 audio analysis
(+) | speakers can play relatively loud (83 dB)
Bass 100 - 315 Hz
(-) | nearly no bass - on average 24.9% lower than median
(±) | linearity of bass is average (8.7% delta to prev. frequency)
Mids 400 - 2000 Hz
(±) | higher mids - on average 7% higher than median
(±) | linearity of mids is average (8.9% delta to prev. frequency)
Highs 2 - 16 kHz
(±) | higher highs - on average 6% higher than median
(±) | linearity of highs is average (7.8% delta to prev. frequency)
Overall 100 - 16.000 Hz
(±) | linearity of overall sound is average (25.2% difference to median)
Compared to same class
» 90% of all tested devices in this class were better, 3% similar, 7% worse
» The best had a delta of 6%, average was 18%, worst was 132%
Compared to all devices tested
» 77% of all tested devices were better, 5% similar, 18% worse
» The best had a delta of 4%, average was 24%, worst was 134%
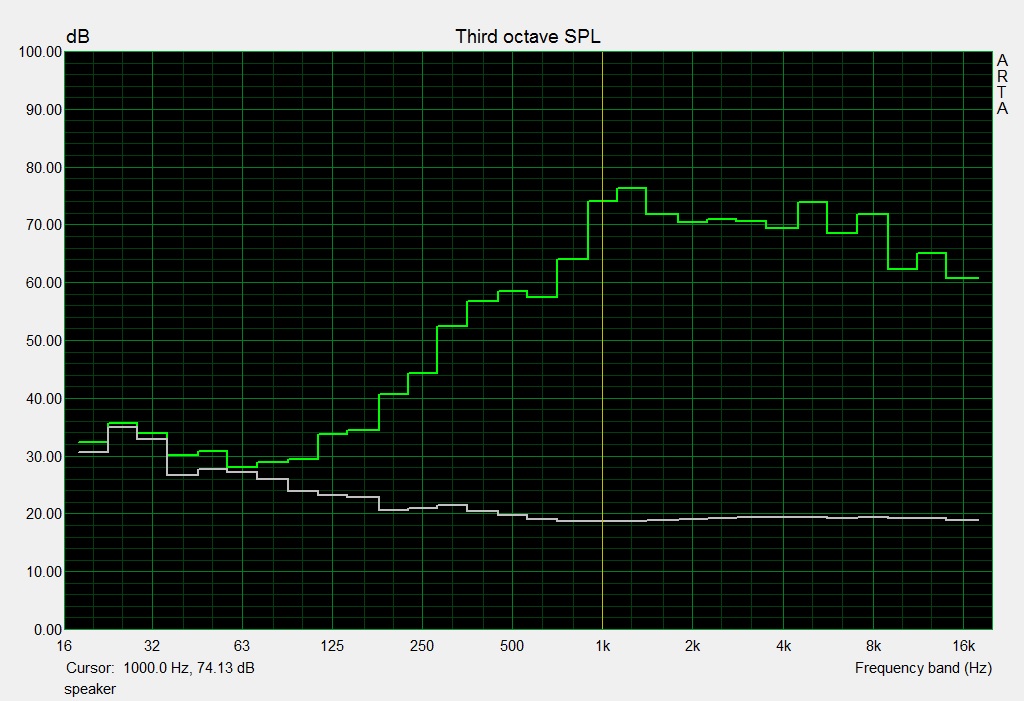
Asus Strix GL502VM-FY039T audio analysis
(±) | speaker loudness is average but good (76 dB)
Bass 100 - 315 Hz
(-) | nearly no bass - on average 19.1% lower than median
(-) | bass is not linear (18.1% delta to prev. frequency)
Mids 400 - 2000 Hz
(+) | balanced mids - only 2.9% away from median
(+) | mids are linear (4% delta to prev. frequency)
Highs 2 - 16 kHz
(±) | higher highs - on average 5.6% higher than median
(±) | linearity of highs is average (8% delta to prev. frequency)
Overall 100 - 16.000 Hz
(±) | linearity of overall sound is average (23% difference to median)
Compared to same class
» 83% of all tested devices in this class were better, 5% similar, 12% worse
» The best had a delta of 6%, average was 18%, worst was 132%
Compared to all devices tested
» 69% of all tested devices were better, 5% similar, 26% worse
» The best had a delta of 4%, average was 24%, worst was 134%
Energy Management
Power Consumption
The P55W v6 is comparatively frugal when it comes to the power consumption. We measured 8 - 17 watts during idle, which is on par with the predecessor and better than the other systems in our comparison. Under load, we measured an average power draw of 71 watts, which is also at the lower end. The power adapter supplies 180 watts and easily handles the peak power draw of 165 watts. Even at maximum load, the battery is still charging.
| Off / Standby | |
| Idle | |
| Load |
|
Key:
min: | |
| Gigabyte P55W v6 GeForce GTX 1060 Mobile, 6700HQ | Gigabyte P55W v5 GeForce GTX 970M, 6700HQ | Asus Strix GL502VM-FY039T GeForce GTX 1060 Mobile, 6700HQ | MSI GS63VR-6RF16H22 Stealth Pro GeForce GTX 1060 Mobile, 6700HQ | Acer Predator 15 G9-593-765Q GeForce GTX 1070 Mobile, 6700HQ | |
|---|---|---|---|---|---|
| Power Consumption | -4% | -34% | -56% | -65% | |
| Idle Minimum * (Watt) | 8 | 9 -13% | 16 -100% | 18 -125% | 18 -125% |
| Idle Average * (Watt) | 13 | 13 -0% | 19 -46% | 22 -69% | 24 -85% |
| Idle Maximum * (Watt) | 17 | 17 -0% | 23 -35% | 30 -76% | 29 -71% |
| Load Average * (Watt) | 71 | 81 -14% | 68 4% | 77 -8% | 86 -21% |
| Load Maximum * (Watt) | 165 | 152 8% | 157 5% | 165 -0% | 201 -22% |
* ... smaller is better
Battery Life
For a gaming notebook, the P55W v6 features decent run times quite comparable to the predecessor despite the much better performance. With a battery life of up to the 10 hours, the P55W v6 is one of the longest-lasting systems in its class.
| Gigabyte P55W v6 GeForce GTX 1060 Mobile, 6700HQ, 63 Wh | Gigabyte P55W v5 GeForce GTX 970M, 6700HQ, 61 Wh | Asus Strix GL502VM-FY039T GeForce GTX 1060 Mobile, 6700HQ, 64 Wh | MSI GS63VR-6RF16H22 Stealth Pro GeForce GTX 1060 Mobile, 6700HQ, 65 Wh | Acer Predator 15 G9-593-765Q GeForce GTX 1070 Mobile, 6700HQ, Wh | |
|---|---|---|---|---|---|
| Battery runtime | -1% | -30% | -30% | -4% | |
| Reader / Idle (h) | 10.2 | 10.1 -1% | 5.3 -48% | 6 -41% | |
| H.264 (h) | 5.6 | 5.5 -2% | 3.9 -30% | 4.5 -20% | 5 -11% |
| WiFi v1.3 (h) | 5.9 | 5.8 -2% | 3.7 -37% | 3.5 -41% | 4.8 -19% |
| Load (h) | 1.6 | 1.6 0% | 1.5 -6% | 1.3 -19% | 1.9 19% |
Pros
Cons
Verdict
The various editions of the Gigabyte P55W always managed to hit the sweet spot between performance and price - and version 6 is fortunately no different. The change from the GeForce GTX 970 to a GTX 1060 results in a 50 % increase in 3D performance, while the price hasn't changed at all (1600 Euro / ~$1710). "More bang for the buck" hits the nail on its head.
The external appearance hasn't changed at all - the chassis and decent selection of physical ports, the very decent input devices and the so-so speakers remain unchanged. Once again, Gigabyte uses a Skylake CPU with 16 GB of RAM, so the system has power to spare and can handle demanding tasks without slowing down much. The battery life hasn't really been affected, either.
Compared to the predecessor, the new notebooks seems to have take a step backwards in some areas. The display features a much lower contrast ratio and the brightness distribution has taken a turn for the worse. This is remarkable primarily since the panels - at least according to their model number and type - are identical. The outrageously fast Samsung SSD the P55W v5 was equipped with had to make way for a much slower drive from Transcend. The noise emissions are also worse now - particularly annoying are the fluctuations at maximum load.
All things considered, the P55W v6 is a decent and successful evolution of the gaming series - and at 1600 Euro (~$1710), the user gets a lot of 3D performance for the money. The identically equipped Asus ROG Strix GL502VM is the only other system with the same price-to-performance ratio. Users who don't need as much gaming performance can save a lot of money and take a look at the Acer Aspire VX5-591G for about 1000 Euro (~$1070). Gamers who demand even higher performance than what the P55W v6 can offer need to be prepared to spend a lot of money: the Acer Predator 15 G9-593, for example, sells for about 2.500 Euro (~$2670).
Gigabyte P55W v6
- 01/31/2017 v6 (old)
Oliver Moebel
Price comparison