Notebook reviews with NVIDIA GeForce GTX 970M graphics card
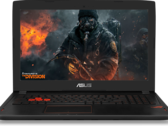
Asus ROG Strix GL502VT-DS74 Notebook Review
Thin, but not too thin. Asus seems to have struck a perfect balance in the race for a thinner and thinner gaming notebook while still maintaining case rigidity and enthusiast-level Nvidia GPU options. Inevitably, some important features have been omitted along the way.
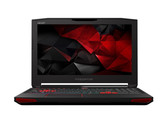
Intel Core i7-6700HQ, NVIDIA GeForce GTX 970M, 15.6", 2.5 kgAcer Predator 15 (i7-6700HQ, GTX 970M) Notebook Review
Cool system. While the design of the Predator 15 is controversial, the cooling system is beyond any doubt. After the GTX 980M variant had to prove its capabilities at the end of 2015, we have tested the refresh with GeForce GTX 970M this time.
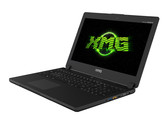
Intel Core i7-6700HQ, NVIDIA GeForce GTX 970M, 15.6", 3.5 kgSchenker XMG C506 (Gigabyte P35X v5) Notebook Review
Ultra-slim model. It should be a well-known fact that nowadays gaming laptops can be very slim. Schenker Technologies take it to extremes and sells a slim 21-millimeter (~0.83 in) premium-range model based on Gigabyte's P35X v5 in the form of the XMG C506. Can the cooling system manage the heat development?
Intel Core i7-6700HQ, NVIDIA GeForce GTX 970M, 15.6", 2.4 kgGigabyte P57W Notebook Review
Gaming scion. With the P57W, Gigabyte presents a high-end notebook in 17-inch format, which brings various modern features and technologies. Apart from a replaceable drive bay, the manual fan control stands out. Do rivals have to prepare for strong competition?
Intel Core i7-6700HQ, NVIDIA GeForce GTX 970M, 17.3", 3.2 kgGigabyte P55W v5 Notebook Review
Enduring. There are no obvious performance gains in Gigabyte's gaming laptop when compared with the predecessor. However, the new Skylake processor leads to a considerably better battery life. Furthermore, a fast NVMe SSD is also on board.
Intel Core i7-6700HQ, NVIDIA GeForce GTX 970M, 15.6", 2.6 kgMSI GS60-6QE4K16H21: Intel Core i7-6700HQ, 15.60", 2 kg
Review » MSI GS60 6QE Ghost Pro Notebook Review
Acer Predator 17 G9-791-75PV: Intel Core i7-6700HQ, 17.30", 4.1 kg
Review » Acer Predator 17 G9-791 Notebook Review
Gigabyte P34W v5: Intel Core i7-6700HQ, 14.00", 1.8 kg
Review » Gigabyte P34W v5 Xotic PC Edition Notebook Review
Schenker XMG P406: Intel Core i7-6700HQ, 14.00", 2.2 kg
Review » Schenker XMG P406 (Clevo P640RE) Notebook Review
MSI GS40-6QE16H11: Intel Core i7-6700HQ, 14.00", 1.8 kg
Review » MSI GS40 6QE Phantom Notebook Review
Aorus X3 Plus v5: Intel Core i7-6700HQ, 13.90", 1.8 kg
Review » Aorus X3 Plus v5 Notebook Review
Asus G752VT: Intel Core i7-6700HQ, 17.30", 4.1 kg
Review » Asus ROG G752VT Notebook Review
MSI GE72-6QF8H11: Intel Core i7-6700HQ, 17.30", 2.9 kg
Review » MSI GE72 6QF Apache Pro Notebook Review
MSI GS70-6QE16H21: Intel Core i7-6700HQ, 17.30", 2.7 kg
Review » MSI GS70 6QE Stealth Pro Notebook Review
MSI GS60 6QE-002US: Intel Core i7-6700HQ, 15.60", 2.1 kg
Review » Xotic PC MSI GS60 6QE 002US Notebook Review
Schenker XMG P506: Intel Core i7-6700HQ, 15.60", 2.7 kg
Review » Schenker XMG P506 (Clevo P651RE) Notebook Review
Gigabyte P55 V4: Intel Core i7-5700HQ, 15.60", 2.7 kg
Review » Gigabyte P55W V4 Notebook Review
MSI GT70-2QD16SR21: Intel Core i7-4710MQ, 17.30", 3.8 kg
Review » MSI GT70 (GTX 970M) Notebook Review
Aorus X3 Plus v3: Intel Core i7-4710HQ, 13.90", 1.8 kg
Review » Aorus X3 Plus v3 Notebook Review
MSI GE62-2QFUi716H11: Intel Core i7-4720HQ, 15.60", 2.4 kg
Review » MSI GE62 (GTX 970M) Notebook Review
Schenker XMG U705: Intel Core i7-4790, 17.30", 3.9 kg
Review » Schenker XMG U705 (Clevo P771ZM) Notebook Review
Razer Blade 14 2015: Intel Core i7-4720HQ, 14.00", 2 kg
Review » Razer Blade 14 (Early 2015) Notebook Review
Alienware 15: Intel Core i7-4710HQ, 15.60", 3 kg
Review » Alienware 15 Notebook Review
Gigabyte P34W V3: Intel Core i7-4720HQ, 14.00", 1.8 kg
Review » Gigabyte P34W v3 Notebook Review
Schenker XMG U505: Intel Core i7-4790S, 15.60", 3.5 kg
Review » Schenker XMG U505 (Clevo P751ZM) Notebook Review
MSI GS60 2QE Ghost Pro 4K (2QEUi716SR51G): Intel Core i7-4720HQ, 15.60", 2 kg
Review » MSI GS60 2QE Ghost Pro 4K (2QEUi716SR51G) Notebook Review
MSI GS70-2QE16SR51: Intel Core i7-4720HQ, 17.30", 2.7 kg
Review » MSI GS70-2QE16SR51 Notebook Review
Schenker XMG P505: Intel Core i7-4870HQ, 15.60", 2.6 kg
Review » Clevo P651SE (Schenker XMG P505) Barebones Notebook Review
Asus Strix GL502VT-FW038T: Intel Core i7-6700HQ, 15.60", 2 kg
External Review » Asus Strix GL502VT-FW038T
Asus G752VT-GC062T: Intel Core i7-6700HQ, 17.30", 4.3 kg
External Review » Asus G752VT-GC062T
Asus Strix GL702VT 90NB0CQ1-M0134: Intel Core i7-6700HQ, 17.30", 2.7 kg
External Review » Asus Strix GL702VT 90NB0CQ1-M0134
Acer Predator 15 G9-592-7925: Intel Core i7-6700HQ, 15.60", 3.5 kg
External Review » Acer Predator 15 G9-592-7925
Acer Predator 17 G9-791-71MG: Intel Core i7-6700HQ, 17.30", 3.9 kg
External Review » Acer Predator 17 G9-791-71MG
MSI GS72-6QE4K16H21: Intel Core i7-6700HQ, 17.30", 2.6 kg
External Review » MSI GS72-6QE4K16H21
MSI GE72-6QF8H11: Intel Core i7-6700HQ, 17.30", 2.9 kg
External Review » MSI GE72-6QF8H11
Asus Strix GL502VT-FY002T: Intel Core i7-6700HQ, 15.60", 2.2 kg
External Review » Asus Strix GL502VT-FY002T
Alienware 15 R2 A15-0238: Intel Core i7-6700HQ, 15.60", 3.2 kg
External Review » Alienware 15 R2 A15-0238
MSI GE62-6QF8H11 Apache Pro: Intel Core i7-6700HQ, 15.60", 2.4 kg
External Review » MSI GE62-6QF8H11 Apache Pro
Alienware 17 A17-4518: Intel Core i7-4720HQ, 17.30", 3.8 kg
External Review » Alienware 17 A17-4518
Asus Strix GL502VT-FY010T: Intel Core i7-6700HQ, 15.60", 2.5 kg
External Review » Asus Strix GL502VT-FY010T
Acer Predator 17 G9-792-707R: Intel Core i7-6700HQ, 17.30", 4.2 kg
External Review » Acer Predator 17 G9-792-707R
Medion Erazer X7841: Intel Core i7-6700HQ, 17.30", 3.5 kg
External Review » Medion Erazer X7841
Asus Strix GL502VT-FY186: Intel Core i7-6700HQ, 15.60", 2.2 kg
External Review » Asus Strix GL502VT-FY186
Acer Predator 15 G9-592-70GD: Intel Core i7-6700HQ, 15.60", 3.5 kg
External Review » Acer Predator 15 G9-592-70GD
Gigabyte P35W v5: Intel Core i7-6700HQ, 15.60", 2.4 kg
External Review » Gigabyte P35W v5
Asus ROG Strix GL702VT-GC023T: Intel Core i7-6700HQ, 17.30", 2.7 kg
External Review » Asus ROG Strix GL702VT-GC023T
Eurocom Sky M5: Intel Core i7-6700HQ, 15.60", 2.5 kg
External Review » Eurocom Sky M5
Gigabyte Aero 14-W-CF2: Intel Core i7-6700HQ, 14.00", 1.9 kg
External Review » Gigabyte Aero 14-W-CF2
Asus Strix GL502VT-DS74: Intel Core i7-6700HQ, 15.60", 2.5 kg
External Review » Asus Strix GL502VT-DS74
Schenker XMG P406: Intel Core i7-6700HQ, 14.00", 2.2 kg
External Review » Schenker XMG P406
Gigabyte P57W: Intel Core i7-6700HQ, 17.30", 3.2 kg
External Review » Gigabyte P57W
Acer Predator 17 G9-791-75BE: Intel Core i7-6700HQ, 17.30", 4 kg
External Review » Acer Predator 17 G9-791-75BE
Acer Predator 15 G9-591-79KE: Intel Core i7-6700HQ, 15.60", 3.4 kg
External Review » Acer Predator 15 G9-591-79KE
MSI GT72-6QD81FD: Intel Core i7-6700HQ, 17.30", 3.9 kg
External Review » MSI GT72-6QD81FD
Eurocom Monster 4: Intel Core i7-6700HQ, 14.00", 2 kg
External Review » Eurocom Monster 4
Acer Predator 17 G9-791-75PV: Intel Core i7-6700HQ, 17.30", 4.1 kg
External Review » Acer Predator 17 G9-791-75PV
Acer Predator 15 G9-591-79K: Intel Core i7-6700HQ, 15.60", 3.4 kg
External Review » Acer Predator 15 G9-591-79K
Schenker XMG P506: Intel Core i7-6700HQ, 15.60", 2.7 kg
External Review » Schenker XMG P506
Razer Blade 14 inch 2016: Intel Core i7-6700HQ, 14.00", 1.9 kg
External Review » Razer Blade 14 inch 2016
MSI GE62-6QF-004FR: Intel Core i7-6700HQ, 15.60", 2.4 kg
External Review » MSI GE62-6QF-004FR
MSI GS40-6QE-014FR Phantom: Intel Core i7-6700HQ, 14.00", 1.8 kg
External Review » MSI GS40-6QE-014FR Phantom
Gigabyte P55W v5: Intel Core i7-6700HQ, 15.60", 2.6 kg
External Review » Gigabyte P55W v5
Gigabyte P57W-CF1: Intel Core i7-6700HQ, 17.30", 2.9 kg
External Review » Gigabyte P57W-CF1
Digital Storm Equinox 15 inch: Intel Core i7-6700HQ, 15.60", 1.9 kg
External Review » Digital Storm Equinox 15 inch
Aorus X3 Plus v5: Intel Core i7-6700HQ, 13.90", 1.8 kg
External Review » Aorus X3 Plus v5
Alienware 17 R3-A17-9911: Intel Core i7-6700HQ, 17.30", 3.8 kg
External Review » Alienware 17 R3-A17-9911
MSI GS40-6QE-026CZ Phantom: Intel Core i7-6700HQ, 14.00", 1.9 kg
External Review » MSI GS40-6QE-026CZ Phantom
MSI GS40 6QE-019RU Phantom: Intel Core i7-6700HQ, 14.00", 1.6 kg
External Review » MSI GS40 6QE-019RU Phantom
MSI GS60-6QE-019CZ: Intel Core i7-6700HQ, 15.60", 2.1 kg
External Review » MSI GS60-6QE-019CZ
MSI GS40-6QE-020RU Phantom: Intel Core i7-6700HQ, 14.00", 1.6 kg
External Review » MSI GS40-6QE-020RU Phantom
Alienware 17 R3: Intel Core i7-6700HQ, 17.30", 3.8 kg
External Review » Alienware 17 R3
Asus G752VT-GC037T: Intel Core i7-6700HQ, 17.30", 4 kg
External Review » Asus G752VT-GC037T
Asus G752VT: Intel Core i7-6700HQ, 17.30", 4.1 kg
External Review » Asus G752VT
MSI GE72 6QF-009RU Apache Pro: Intel Core i7-6700HQ, 17.30", 2.9 kg
External Review » MSI GE72 6QF-009RU Apache Pro
Gigabyte P34W v5: Intel Core i7-6700HQ, 14.00", 1.8 kg
External Review » Gigabyte P34W v5
MSI GS60 6QE-063UK: Intel Core i7-6700HQ, 15.60", 2 kg
External Review » MSI GS60 6QE-063UK
MSI GS40-6QE16H11: Intel Core i7-6700HQ, 14.00", 1.8 kg
External Review » MSI GS40-6QE16H11
Asus G752VT-DH72: Intel Core i7-6700HQ, 17.30", 4 kg
External Review » Asus G752VT-DH72
MSI GS60 6QE-002US: Intel Core i7-6700HQ, 15.60", 2.1 kg
External Review » MSI GS60 6QE-002US
MSI GT72S 6QD Dominator G-037: Intel Core i7-6820HK, 17.30", 3.8 kg
External Review » MSI GT72S 6QD Dominator G-037
MSI GE62-6QF16H21: Intel Core i7-6700HQ, 15.60", 2.4 kg
External Review » MSI GE62-6QF16H21
MSI GS70 6QE-017AU: Intel Core i7-6700HQ, 17.30", 2.6 kg
External Review » MSI GS70 6QE-017AU
MSI GE72-6QF16H21: Intel Core i7-6700HQ, 17.30", 2.9 kg
External Review » MSI GE72-6QF16H21
MSI GS60 6QE-017RUGhost Pro: Intel Core i7-6700HQ, 15.60", 2.1 kg
External Review » MSI GS60 6QE-017RUGhost Pro
Gigabyte P37W v4: Intel Core i7-5700HQ, 17.30", 2.8 kg
External Review » Gigabyte P37W v4
Asus G751JT-T7179T: Intel Core i7-4720HQ, 17.30", 3.8 kg
External Review » Asus G751JT-T7179T
MSI GS60 2QE-646FR: Intel Core i7-5700HQ, 15.60", 2 kg
External Review » MSI GS60 2QE-646FR
MSI GS70 2QE-059FR: Intel Core i7-4710HQ, 17.30", 2.7 kg
External Review » MSI GS70 2QE-059FR
Gigabyte P55WV4 9WP55WV43-CZ-A-001: Intel Core i7-5700HQ, 15.60", 2.5 kg
External Review » Gigabyte P55WV4 9WP55WV43-CZ-A-001
MSI GS60 Ghost Pro 4K-605: Intel Core i7-5700HQ, 15.60", 2 kg
External Review » MSI GS60 Ghost Pro 4K-605
Gigabyte P55 V4: Intel Core i7-5700HQ, 15.60", 2.7 kg
External Review » Gigabyte P55 V4
MSI GT72-2QD8H21BW: Intel Core i7-5700HQ, 17.30", 3.8 kg
External Review » MSI GT72-2QD8H21BW
Asus G751JT-CH71: Intel Core i7-4710HQ, 17.30", 4.8 kg
External Review » Asus G751JT-CH71
Medion Erazer X7833-MD99119: Intel Core i7-4710MQ, 17.30", 3.4 kg
External Review » Medion Erazer X7833-MD99119
Asus G751JT-T7032H: Intel Core i7-4710HQ, 17.30", 4.8 kg
External Review » Asus G751JT-T7032H
Schenker XMG U705: Intel Core i7-4790, 17.30", 3.9 kg
External Review » Schenker XMG U705
MSI GE62-2QFUi716H11: Intel Core i7-4720HQ, 15.60", 2.4 kg
External Review » MSI GE62-2QFUi716H11
Alienware 17-1784: Intel Core i7-4710HQ, 17.30", 3.8 kg
External Review » Alienware 17-1784
Gigabyte P34W V3: Intel Core i7-4720HQ, 14.00", 1.8 kg
External Review » Gigabyte P34W V3
MSI GS30 2M-034PL: Intel Core i7-4870HQ, 13.30", 1.2 kg
External Review » MSI GS30 2M-034PL
Aorus X3 Plus v3: Intel Core i7-4710HQ, 13.90", 1.8 kg
External Review » Aorus X3 Plus v3
Razer Blade 14 2015: Intel Core i7-4720HQ, 14.00", 2 kg
External Review » Razer Blade 14 inch 2015
Alienware 15: Intel Core i7-4710HQ, 15.60", 3 kg
External Review » Alienware 15
MSI GS60 2QE-262ES: Intel Core i7-4720HQ, 15.60", 2.1 kg
External Review » MSI GS60 2QE-262ES
MSI GS60 2QE-085FR Ghost Pro 4K: Intel Core i7-4710HQ, 15.60", 1.9 kg
External Review » MSI GS60 2QE-085FR Ghost Pro 4K
Digital Storm Triton: Intel Core i7-4710HQ, 15.60", 2.5 kg
External Review » Digital Storm Triton
Eurocom M5 Pro: Intel Core i7-4710HQ, 15.60", 2.6 kg
External Review » Eurocom M5 Pro
MSI GS70-2QE-062RU: Intel Core i7-4710HQ, 17.30", 2.7 kg
External Review » MSI GS70-2QE-062RU
Asus G751JT-T7016H: Intel Core i7-4710HQ, 17.00", 4.2 kg
External Review » Asus G751JT-T7016H
MSI GS60 2QE Ghost Pro 4K (2QEUi716SR51G): Intel Core i7-4720HQ, 15.60", 2 kg
External Review » MSI GS60-2QEWi716SR51G
MSI GS70-2QE16SR51: Intel Core i7-4720HQ, 17.30", 2.7 kg
External Review » MSI GS70-2QE16SR51
Schenker XMG P505: Intel Core i7-4870HQ, 15.60", 2.6 kg
External Review » Schenker XMG P505