Notebook reviews with NVIDIA GeForce RTX 2060 Max-Q graphics card
MSI Stealth 15M GeForce RTX Laptop Review: Faster Graphics than the Dell XPS 15, HP Spectre x360, or Asus ZenBook
The raw performance of the Stealth 15M A11SEK is impressive considering how light it is and that it's running on a Core U-series CPU. Unfortunately, the weak build quality and hinges leave a lot to be desired.
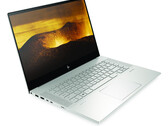
Intel Core i7-1185G7, NVIDIA GeForce RTX 2060 Max-Q, 15.6", 1.7 kgThis is HP's Answer To The Apple MacBook Pro: 2020 Envy 15 Creator Core i7 Review
HP is betting big on 4K AMOLED, faster GeForce RTX graphics, and cheaper starting prices to challenge the all-popular MacBook Pro series and attract more content creators.
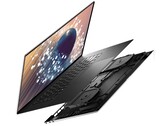
Intel Core i7-10750H, NVIDIA GeForce RTX 2060 Max-Q, 15.6", 2 kgDell XPS 17 9700 Core i7 Laptop Review: Pretty Much A MacBook Pro 17
Can Dell dominate the 17-inch market the same way it captured the 15-inch market? The XPS 17 is surprisingly compact with specifications that read like something twice the size, but a few small details miss the mark.
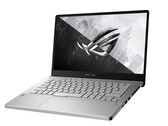
Intel Core i7-10875H, NVIDIA GeForce RTX 2060 Max-Q, 17", 2.5 kgAsus Zephyrus G14 Ryzen 9 GeForce RTX 2060 Max-Q Laptop Review: Kicking Core i9 to the Curb
The octa-core Ryzen 9 4900HS would be impressive on any 15.6-inch or 17.3-inch gaming laptop, but to see it work so well in such a small 14-inch form factor is extraordinary. There are, however, one or two caveats preventing it from being the ultimate gaming laptop.
AMD Ryzen 9 4900HS, NVIDIA GeForce RTX 2060 Max-Q, 14", 1.6 kgAsus ROG Zephyrus G15 GA502IV-PH96: AMD Ryzen 9 4900HS, 15.60", 2.1 kg
External Review » Asus ROG Zephyrus G15 GA502IV-PH96
HP Pavilion Gaming 16-a0043ns: Intel Core i7-10750H, 16.10", 2.4 kg
External Review » HP Pavilion Gaming 16-a0043ns
HP Envy 15-ep0041ur: Intel Core i7-10750H, 15.60", 2.1 kg
External Review » HP Envy 15-ep0041ur
HP Envy 15-ep0175nd: Intel Core i7-10750H, 15.60", 2.1 kg
External Review » HP Envy 15-ep0175nd
Asus ROG Zephyrus G15 GA502IV-HN042: AMD Ryzen 9 4900HS, 15.60", 2.1 kg
External Review » Asus ROG Zephyrus G15 GA502IV-HN042
HP Pavilion Gaming 16-a0042ns: Intel Core i5-10300H, 16.10", 2.4 kg
External Review » HP Pavilion Gaming 16-a0042ns
HP Pavilion Gaming 16-a0033ns: Intel Core i7-10750H, 16.10"
External Review » HP Pavilion Gaming 16-a0033ns
HP Envy 15-ep008n: Intel Core i7-10750H, 15.60", 2.2 kg
External Review » HP Envy 15-ep008n
HP Envy 15-ep0016tx: Intel Core i7-10750H, 15.60", 2.2 kg
External Review » HP Envy 15-ep0016tx
HP Envy 15-ep0015nl: Intel Core i7-10750H, 15.60", 2.2 kg
External Review » HP Envy 15-ep0015nl
HP Pavilion Gaming 16-A0029NS: Intel Core i7-10750H, 16.10", 2.4 kg
External Review » HP Pavilion Gaming 16-A0029NS
HP Envy 15-ep0190nd: Intel Core i9-10885H, 15.60", 2.2 kg
External Review » HP Envy 15-ep0190nd
Asus Zephyrus G14 GA401IVC-HA275T (ACRNM RMT01): AMD Ryzen 9 4900HS, 15.60", 1.7 kg
External Review » Asus Zephyrus G14 GA401IVC-HA275T (ACRNM RMT01)
HP Gaming Pavilion 15-dk1064tx: Intel Core i5-10300H, 15.60", 2.2 kg
External Review » HP Gaming Pavilion 15-dk1064tx
Dell XPS 17 9700-C9T5T: Intel Core i9-10885H, 17.30", 2.5 kg
External Review » Dell XPS 17 9700-C9T5T
HP Envy 15-ep0098nr: Intel Core i7-10750H, 15.60", 2 kg
External Review » HP Envy 15-ep0098nr
HP Gaming Pavilion 15-dk1003ns: Intel Core i7-10750H, 15.60", 2.2 kg
External Review » HP Gaming Pavilion 15-dk1003ns
Dell XPS 17 9700 Core i7 RTX 2060 Max-Q: Intel Core i7-10875H, 17.00", 2.5 kg
External Review » Dell XPS 17 9700 Core i7 RTX 2060 Max-Q
Asus ROG Zephyrus G15 GA502IV-HN020: AMD Ryzen 7 4800HS, 15.60", 2.1 kg
External Review » Asus Zephyrus G15 GA502IV-HN020
Asus Zephyrus G14 GA401IV-HE003T: AMD Ryzen 7 4800HS, 14.00", 1.6 kg
External Review » Asus Zephyrus G14 GA401IV-HE003T
Asus Zephyrus G14 GA401IV-HE253T: AMD Ryzen 7 4800HS, 14.00", 1.7 kg
External Review » Asus Zephyrus G14 GA401IV-HE253T
Asus Zephyrus G14 GA401IV-HA116T: AMD Ryzen 9 4900HS, 14.00", 1.7 kg
External Review » Asus Zephyrus G14 GA401IV-HA116T
Asus Zephyrus G14 GA401IV-HE022: AMD Ryzen 7 4800HS, 14.00", 1.6 kg
External Review » Asus Zephyrus G14 GA401IV-HE022
Razer Blade 15 Base Model 2020, i7-10750H, RTX 2060 Max-Q: Intel Core i7-10750H, 15.60", 2.1 kg
External Review » Razer Blade 15 Base Model 2020, i7-10750H, RTX 2060 Max-Q
Asus ProArt StudioBook 17 H700GV RTX 2060, Xeon E-2276M: Intel Xeon E-2276M, 17.00", 2.4 kg
External Review » Asus ProArt StudioBook 17 H700GV RTX 2060, Xeon E-2276M
Asus Zephyrus G14 GA401IV: AMD Ryzen 9 4900HS, 14.00", 1.6 kg
External Review » Asus Zephyrus G14 GA401IV
Lenovo Legion Y540-15IRH-81SX00CKSP: Intel Core i7-9750H, 15.60", 2.3 kg
External Review » Lenovo Legion Y540-15IRH-81SX00CKSP
MSI Stealth 15M A11SEK: Intel Core i7-1185G7, 15.60", 1.7 kg
» The MSI Stealth 15M is proof that gaming laptops with 15 W to 25 W Tiger Lake Core U CPUs can work
Dell XPS 17 9700 Core i7 RTX 2060 Max-Q: Intel Core i7-10875H, 17.00", 2.5 kg
» Dell XPS 17 battery drain issue fixed on latest production batches
HP Envy 15-ep0098nr: Intel Core i7-10750H, 15.60", 2 kg
» New HP Envy 15 makes for a better gaming laptop than the Omen 15
Dell XPS 17 9700 Core i7 RTX 2060 Max-Q: Intel Core i7-10875H, 17.00", 2.5 kg
» Dell finally addresses XPS 17 9700 and Precision 5750 charging woes, but the solution isn't as simple as you may think
» Here are 5 super simple ways we would improve the Dell XPS 17
Asus Zephyrus G14 GA401IV: AMD Ryzen 9 4900HS, 14.00", 1.6 kg
» Seven simple ways we would make the Asus Zephyrus G14 even better
» AMD Ryzen 9 4900HS is faster than every mobile Intel Core i9 laptop in the market today according to our own benchmarks