Reviews for the Intel Core i7-1185G7 processor
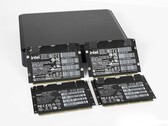
Intel NUC Pro Chassis Element in review - Modular barebone for many purposes
The NUC pro chassis element is primarily just an empty case and only comes to life with a compute element. We took a closer look at the device and analyzed the performance of four different compute elements. These rely on Intel's latest Alder Lake-U processors in the latest version.
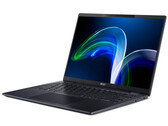
Intel Core i7-1185G7, Iris Xe G7 96EUsAcer TravelMate P6 TMP614P-52 review: Lightweight office notebook with great battery life
The TravelMate offers a Core i7 processor (Tiger Lake), 16 GB of RAM and excellent battery life. Acer has made a great decision to use a 14-inch display with a work-friendly 16:10 aspect ratio (1,920 x 1,200 pixels) and provide a three-year warranty on the device in Germany (two years in the US).
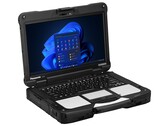
Intel Core i7-1185G7, Iris Xe G7 96EUs, 14", 1.2 kgPanasonic Toughbook 40 laptop review: Highly adaptive and modular
The model can support up to four individual expansion cards in order to meet the various demands of police officers, utility companies, and other public sector working conditions. Panasonic is banking on versatility to better distinguish the Toughbook series from others.
Intel Core i7-1185G7, Iris Xe G7 96EUs, 14", 3.9 kgGetac S410 Gen 4 laptop review: Simple changes with huge upgrades
Intel's Tiger Lake-U series has done wonders for consumer laptops and so it's great to finally see the same options available on rugged models designed for enterprise or industrial use.
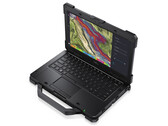
Intel Core i7-1185G7, Iris Xe G7 96EUs, 14", 3.2 kgDell Latitude 7330 Rugged Extreme review: One of the best 13-inch rugged laptops
It may be heavy, but everything has been done so right that the weight can be overlooked. The display itself is better than on most other rugged laptops in terms of colors, contrast, and brightness.
Intel Core i7-1185G7, Iris Xe G7 96EUs, 13.3", 2.7 kgMicrosoft Surface Pro 8, i7-1185G7: Intel Iris Xe Graphics G7 96EUs, 13.00", 0.9 kg
Review » Microsoft Surface Pro 8 Convertible Review: Powerful, 120 Hz and finally Thunderbolt
Dell Latitude 15 9520 2-in-1: Intel Iris Xe Graphics G7 96EUs, 15.00", 1.7 kg
Review » Dell Latitude 15 9520 2-in-1 vs. Latitude 9510 2-in-1: Newer isn't always better
Fujitsu LifeBook U9311X i7 LTE: Intel Iris Xe Graphics G7 96EUs, 13.30", 1 kg
Review » Fujitsu LifeBook U9311X in review - 1 kg business convertible with LTE
Panasonic Toughbook FZ-55 MK2: Intel Iris Xe Graphics G7 96EUs, 14.00", 2.3 kg
Review » Panasonic Toughbook FZ-55 MK2 rugged laptop review: Iris Xe makes all the difference
HP EliteBook 840 Aero G8 3E4Q6AA: Intel Iris Xe Graphics G7 96EUs, 14.00", 1.2 kg
Review » HP EliteBook 840 Aero G8 review: Possibly the quietest Intel EVO laptop we've ever seen
MSI Summit E14 A11SCS: NVIDIA GeForce GTX 1650 Ti Max-Q, 14.00", 1.3 kg
Review » MSI Summit E14 laptop review: GeForce GTX graphics without the GeForce GTX weight
Dell Latitude 9420 2-in-1: Intel Iris Xe Graphics G7 96EUs, 14.00", 1.5 kg
Review » Dell Latitude 9420 2-in-1 Convertible Review: Totally Better Than The Latitude 9410
HP Elite Dragonfly Max: Intel Iris Xe Graphics G7 96EUs, 13.30", 1.2 kg
Review » HP EliteBook Dragonfly Max Convertible Review: Sure View Sounds Better Than It Looks
Lenovo ThinkPad P14s Gen2-20VX000GGE: NVIDIA T500 Laptop GPU, 14.00", 1.5 kg
Review » Lenovo ThinkPad P14s Gen 2 laptop in review: Compact workstation with new graphics card
Dell XPS 13 9310 OLED: Intel Iris Xe Graphics G7 96EUs, 13.40", 1.2 kg
Review » Dell XPS 13 9310 OLED Laptop Review: Is It Better Than IPS?
Microsoft Surface Laptop 4 13 i7: Intel Iris Xe Graphics G7 96EUs, 13.50", 1.3 kg
Review » Microsoft Surface Laptop 4 13 Laptop Review - Too expensive with Intel CPU?
MSI Summit E13 Flip Evo A11MT: Intel Iris Xe Graphics G7 96EUs, 13.40", 1.4 kg
Review » MSI Summit E13 Flip Evo Convertible Review: A Timeless Design
MSI Stealth 15M A11SEK: NVIDIA GeForce RTX 2060 Max-Q, 15.60", 1.7 kg
Review » MSI Stealth 15M GeForce RTX Laptop Review: Faster Graphics than the Dell XPS 15, HP Spectre x360, or Asus ZenBook
Lenovo Yoga 9 14 ITL 4K: Intel Iris Xe Graphics G7 96EUs, 14.00", 1.5 kg
Review » Lenovo Yoga 9i 14 4K laptop review: High-performance 14-inch 2-in-1 now also with 4K touchscreen and Intel Core i7-1185G7
MSI Summit E15 A11SCST: NVIDIA GeForce GTX 1650 Ti Max-Q, 15.60", 1.8 kg
Review » MSI Summit E15 laptop review: Advance into the premium business segment
MSI Prestige 14 Evo A11M-005: Intel Iris Xe Graphics G7 96EUs, 14.00", 1.2 kg
Review » MSI Prestige 14 Evo laptop review: Intel is catching up
Dell XPS 13 9310 Core i7 4K: Intel Iris Xe Graphics G7 96EUs, 13.40", 1.3 kg
Review » Core i7-1165G7 vs. Core i7-1185G7: Dell XPS 13 9310 4K Laptop Review
Intel Reference Design Laptop 28W: Intel Iris Xe Graphics G7 96EUs, 14.00"
Review » Intel Core i7-1185G7 in Review - First Tiger Lake Benchmarks
Panasonic Toughbook 40: Intel Iris Xe Graphics G7 96EUs, 14.00", 3.9 kg
External Review » Panasonic Toughbook 40
Acer TravelMate P6 TMP614P-52-724G: Intel Iris Xe Graphics G7 96EUs, 14.00", 1.2 kg
External Review » Acer TravelMate P6 TMP614P-52-724G
Dell Latitude 7330 Rugged Extreme: Intel Iris Xe Graphics G7 96EUs, 13.30", 2.7 kg
External Review » Dell Latitude 7330 Rugged Extreme
Dell Latitude 14 5430 Rugged, i7-1185G7: Intel Iris Xe Graphics G7 96EUs, 14.00", 2 kg
External Review » Dell Latitude 14 5430 Rugged, i7-1185G7
Dell Latitude 15 9520 2-in-1: Intel Iris Xe Graphics G7 96EUs, 15.00", 1.7 kg
External Review » Dell Latitude 15 9520 2-in-1
Dell Latitude 15 5520, i7-1185G7: Intel Iris Xe Graphics G7 96EUs, 15.60", 1.6 kg
External Review » Dell Latitude 15 5520, i7-1185G7
Dell XPS 13 9310 Core i7 4K: Intel Iris Xe Graphics G7 96EUs, 13.40", 1.3 kg
External Review » Dell XPS 13 9310 Core i7 4K
Microsoft Surface Pro 8, i7-1185G7: Intel Iris Xe Graphics G7 96EUs, 13.00", 0.9 kg
External Review » Microsoft Surface Pro 8, i7-1185G7
Dell Latitude 15 9520-NMM8M: Intel Iris Xe Graphics G7 96EUs, 15.60", 1.4 kg
External Review » Dell Latitude 15 9520-NMM8M
Panasonic Toughbook FZ-55 MK2: Intel Iris Xe Graphics G7 96EUs, 14.00", 2.3 kg
External Review » Panasonic Toughbook FZ-55 MK2
MSI Summit E14 A11SCST-069NE: NVIDIA GeForce GTX 1650 Ti Mobile, 14.00", 1.3 kg
External Review » MSI Summit E14 A11SCST-069NE
Dell Latitude 13 7320 2-in-1, i7-1185G7: Intel Iris Xe Graphics G7 96EUs, 13.30", 1.1 kg
External Review » Dell Latitude 13 7320 2-in-1, i7-1185G7
MSI Summit E14 A11SCS: NVIDIA GeForce GTX 1650 Ti Max-Q, 14.00", 1.3 kg
External Review » MSI Summit E14 A11SCS
Fujitsu LifeBook U9311X i7 LTE: Intel Iris Xe Graphics G7 96EUs, 13.30", 1 kg
External Review » Fujitsu LifeBook U9311X i7 LTE
HP ZBook Firefly 14 G8, i7-1185G7: NVIDIA T500 Laptop GPU, 14.00", 1.4 kg
External Review » HP ZBook Firefly 14 G8, i7-1185G7
Microsoft Surface Laptop 4 15, i7-1185G7: Intel Iris Xe Graphics G7 96EUs, 15.00", 1.5 kg
External Review » Microsoft Surface Laptop 4 15, i7-1185G7
Dell Latitude 9420 2-in-1: Intel Iris Xe Graphics G7 96EUs, 14.00", 1.5 kg
External Review » Dell Latitude 9420 2-in-1
MSI Prestige 14 A11SCS-036DC: NVIDIA GeForce GTX 1650 Ti Max-Q, 14.00", 1.3 kg
External Review » MSI Prestige 14 A11SCS-036DC
Lenovo ThinkPad X1 Yoga G6-20XY002VUS: Intel Iris Xe Graphics G7 96EUs, 14.00", 1.4 kg
External Review » Lenovo ThinkPad X1 Yoga G6-20XY002VUS
HP EliteBook 840 Aero G8 3E4Q6AA: Intel Iris Xe Graphics G7 96EUs, 14.00", 1.2 kg
External Review » HP EliteBook 840 G8 3E4Q6AA
MSI Summit E15 A11SCS-091AU: NVIDIA GeForce GTX 1650 Ti Max-Q, 15.60", 1.7 kg
External Review » MSI Summit E15 A11SCS-091AU
Asus ExpertBook B9 B9400CEA-KC0266R: Intel Iris Xe Graphics G7 96EUs, 14.00", 1 kg
External Review » Asus ExpertBook B9 B9400CEA-KC0266R
Lenovo ThinkPad X1 Carbon G9 FHD, i7-1185G7: Intel Iris Xe Graphics G7 96EUs, 15.60", 1.1 kg
External Review » Lenovo ThinkPad X1 Carbon G9 FHD, i7-1185G7
MSI Prestige 14 Evo A11M-266RU: Intel Iris Xe Graphics G7 96EUs, 14.00", 1.3 kg
External Review » MSI Prestige 14 Evo A11M-266RU
MSI Stealth 15M A11SEK-055XES: NVIDIA GeForce RTX 2060 Mobile, 15.60", 1.7 kg
External Review » MSI Stealth 15M A11SEK-055XES
HP ZBook Firefly 15 G8-313P1EA: NVIDIA T500 Laptop GPU, 15.60", 1.8 kg
External Review » HP ZBook Firefly 15 G8-313P1EA
Dell Latitude 14 7420, i7-1185G7: Intel Iris Xe Graphics G7 96EUs, 14.00", 1.2 kg
External Review » Dell Latitude 14 7420, i7-1185G7
Dell XPS 13 9310 OLED: Intel Iris Xe Graphics G7 96EUs, 13.40", 1.2 kg
External Review » Dell XPS 13 9310 OLED
MSI Summit E13 Flip Evo A11MT: Intel Iris Xe Graphics G7 96EUs, 13.40", 1.4 kg
External Review » MSI Summit E13 Flip Evo A11MT
Dell Latitude 13 7320, i7-1185G7: Intel Iris Xe Graphics G7 96EUs, 13.30", 1.3 kg
External Review » Dell Latitude 13 7320, i7-1185G7
Lenovo ThinkPad P14s Gen2-20VX000GGE: NVIDIA T500 Laptop GPU, 14.00", 1.5 kg
External Review » Lenovo ThinkPad P14s Gen2-20VX000GGE
HP Elite Dragonfly Max: Intel Iris Xe Graphics G7 96EUs, 13.30", 1.2 kg
External Review » HP Elite Dragonfly Max
Microsoft Surface Laptop 4 13 i7: Intel Iris Xe Graphics G7 96EUs, 13.50", 1.3 kg
External Review » Microsoft Surface Laptop 4 13 i7
MSI Prestige 15 A11SCS-033XES: NVIDIA GeForce GTX 1650 Ti Max-Q, 15.60", 1.7 kg
External Review » MSI Prestige 15 A11SCS-033XES
HP EliteBook 840 Aero G8, i7-1185G7: Intel Iris Xe Graphics G7 96EUs, 14.00", 1.2 kg
External Review » HP EliteBook 840 Aero G8, i7-1185G
Lenovo Yoga 9i 14ITL5-82BG004GGE: Intel Iris Xe Graphics G7 96EUs, 14.00", 1.4 kg
External Review » Lenovo Yoga 9i 14ITL5-82BG004GGE
MSI Summit E15 A11SCST-067RU: NVIDIA GeForce GTX 1650 Ti Max-Q, 15.60", 1.8 kg
External Review » MSI Summit E15 A11SCST-067RU
MSI Summit E15 A11SCST-227ID: NVIDIA GeForce GTX 1650 Ti Max-Q, 15.60"
External Review » MSI Summit E15 A11SCST-227ID
MSI Prestige 15 A11SCX-019XES: NVIDIA GeForce GTX 1650 Max-Q, 15.60", 1.7 kg
External Review » MSI Prestige 15 A11SCX-019XES
MSI Prestige 14 Evo A11M-014IT: Intel Iris Xe Graphics G7 96EUs, 14.00", 1.3 kg
External Review » MSI Prestige 14 Evo A11M-014IT
MSI Summit E15 A11SCST: NVIDIA GeForce GTX 1650 Ti Max-Q, 15.60", 1.8 kg
External Review » MSI Summit E15 A11SCST
Lenovo Yoga 9 14 ITL 4K: Intel Iris Xe Graphics G7 96EUs, 14.00", 1.5 kg
External Review » Lenovo Yoga 9 14 ITL 4K
MSI Stealth 15M A11SDK-085: NVIDIA GeForce GTX 1660 Ti Max-Q, 15.60"
External Review » MSI Stealth 15M A11SDK-085
MSI Stealth 15M A11SDK-032RU: NVIDIA GeForce GTX 1660 Ti Max-Q, 15.60"
External Review » MSI Stealth 15M A11SDK-032RU
MSI Prestige 14 Evo A11M-005: Intel Iris Xe Graphics G7 96EUs, 14.00", 1.2 kg
External Review » MSI Prestige 14 Evo A11M-005
Lenovo Yoga 9 14ITL5, i7-1185G7: Intel Iris Xe Graphics G7 96EUs, 14.00", 1.4 kg
External Review » Lenovo Yoga 9 14ITL5, i7-1185G7
Microsoft Surface Pro 8, i7-1185G7: Intel Iris Xe Graphics G7 96EUs, 13.00", 0.9 kg
» Microsoft Surface Pro 8 tablet with 120Hz display discounted by 39%
Microsoft Surface Laptop 4 15, i7-1185G7: Intel Iris Xe Graphics G7 96EUs, 15.00", 1.5 kg
» Maxed-out Microsoft Surface Laptop 4 with Core i7, 32GB RAM and 1TB SSD now 46% off
Lenovo ThinkPad P14s Gen2-20VX000GGE: NVIDIA T500 Laptop GPU, 14.00", 1.5 kg
» Lenovo ThinkPad P14s Gen 2 with Core i7, 16GB RAM and Quadro T500 dGPU on sale for 78% off
Dell XPS 13 9310 OLED: Intel Iris Xe Graphics G7 96EUs, 13.40", 1.2 kg
» Dell XPS 13 9310 ultrabook with 3.5K OLED display, Core i7 and 16GB RAM hits lowest price yet on Amazon
MSI Summit E13 Flip Evo A11MT: Intel Iris Xe Graphics G7 96EUs, 13.40", 1.4 kg
» MSI Summit E13 Flip Evo with Intel Core i7-1185G7 now 22% off on Amazon
Acer TravelMate P6 TMP614P-52-724G: Intel Iris Xe Graphics G7 96EUs, 14.00", 1.2 kg
» Acer TravelMate P6: lightweight, long-lasting 14-inch laptop with a 16:10 display
Dell Latitude 15 9520 2-in-1: Intel Iris Xe Graphics G7 96EUs, 15.00", 1.7 kg
» Thinking about buying the Dell Latitude 15 9520 2-in-1? You may want to read this first
HP EliteBook 840 Aero G8 3E4Q6AA: Intel Iris Xe Graphics G7 96EUs, 14.00", 1.2 kg
» The HP EliteBook 840 G8 has one huge advantage over most other business laptops, but it comes at a cost
MSI Summit E14 A11SCS: NVIDIA GeForce GTX 1650 Ti Max-Q, 14.00", 1.3 kg
» MSI Summit E14 vs. MSI Prestige 14: What's the difference?
Dell Latitude 9420 2-in-1: Intel Iris Xe Graphics G7 96EUs, 14.00", 1.5 kg
» Dell Latitude 9420 2-in-1 is two leaps forward and one small step back
HP Elite Dragonfly Max: Intel Iris Xe Graphics G7 96EUs, 13.30", 1.2 kg
» We're not so sure about HP Sure View
Lenovo ThinkPad P14s Gen2-20VX000GGE: NVIDIA T500 Laptop GPU, 14.00", 1.5 kg
» Lenovo ThinkPad P14s Gen 2: Better CPU performance in the AMD predecessor
Dell XPS 13 9310 OLED: Intel Iris Xe Graphics G7 96EUs, 13.40", 1.2 kg
» All the great (and not so great) features of the Dell XPS 13 9310 OLED compared to IPS
MSI Summit E13 Flip Evo A11MT: Intel Iris Xe Graphics G7 96EUs, 13.40", 1.4 kg
» MSI Summit E13 Flip vs. XPS 13 2-in-1: Giving Dell a run for its money
MSI Stealth 15M A11SEK: NVIDIA GeForce RTX 2060 Max-Q, 15.60", 1.7 kg
» The MSI Stealth 15M is proof that gaming laptops with 15 W to 25 W Tiger Lake Core U CPUs can work
Lenovo Yoga 9 14 ITL 4K: Intel Iris Xe Graphics G7 96EUs, 14.00", 1.5 kg
» High-end Lenovo Yoga 9i 14 4K 2-in-1: Is the extra price for the new processor and the 4K touchscreen worth it?
MSI Summit E15 A11SCST: NVIDIA GeForce GTX 1650 Ti Max-Q, 15.60", 1.8 kg
» MSI Summit E15 - A challenger for the Dell XPS 15 and the Lenovo ThinkPad X1 Extreme
MSI Prestige 14 Evo A11M-005: Intel Iris Xe Graphics G7 96EUs, 14.00", 1.2 kg
» MSI Prestige 14 Evo: Intel versus AMD