MSI Summit E13 Flip vs. XPS 13 2-in-1: Giving Dell a run for its money
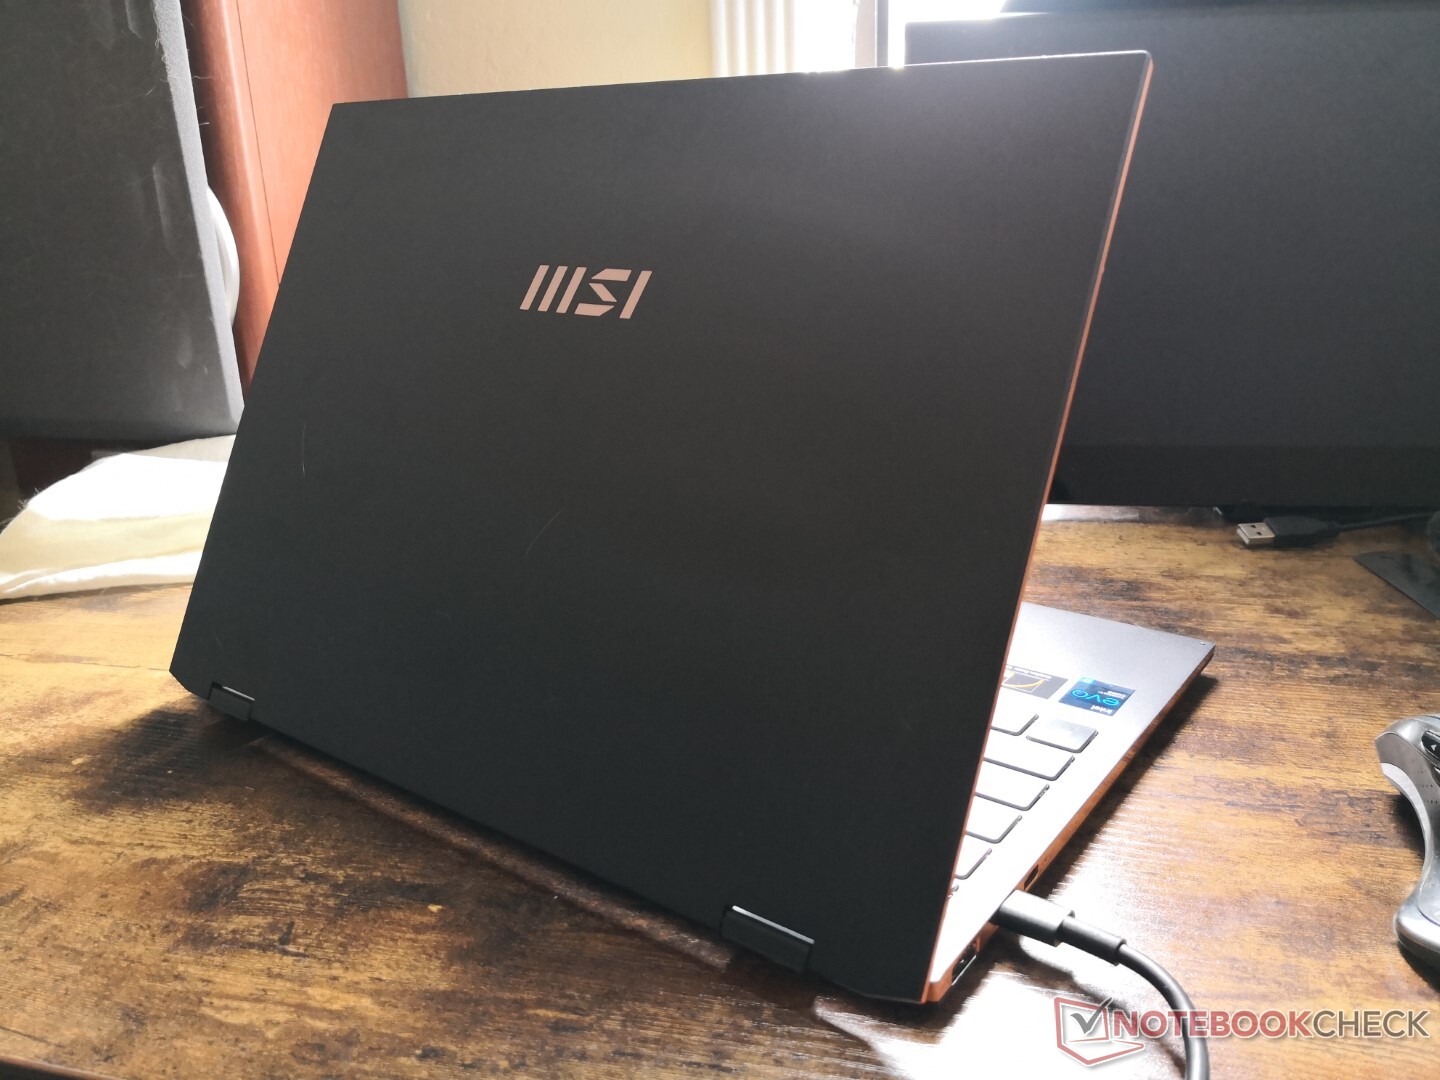
MSI isn't just a gaming company anymore. Its latest Summit series is a direct answer to popular prosumer laptops like the Dell XPS, HP Spectre, Asus ZenBook, Huawei MateBook X Pro, and even the MacBook Air or MacBook Pro. We recently just finished reviewing the 13.4-inch MSI Summit E13 Flip convertible and it is already proving to be a worthwhile alternative to the venerable 13.4-inch XPS 13 alternative.
Our graphs and tables below compare the Summit E13 Flip with last year's XPS 13 7390 2-in-1 to show the advantages and disadvantages of each. We would have loved to compare the newer Tiger Lake XPS 13 9310 2-in-1 instead, but Dell says it was unable to send us a unit for testing and so we had to use its older Ice Lake model as the next best thing. The XPS 13 7390 2-in-1 and 9310 2-in-1 are otherwise visually identical.
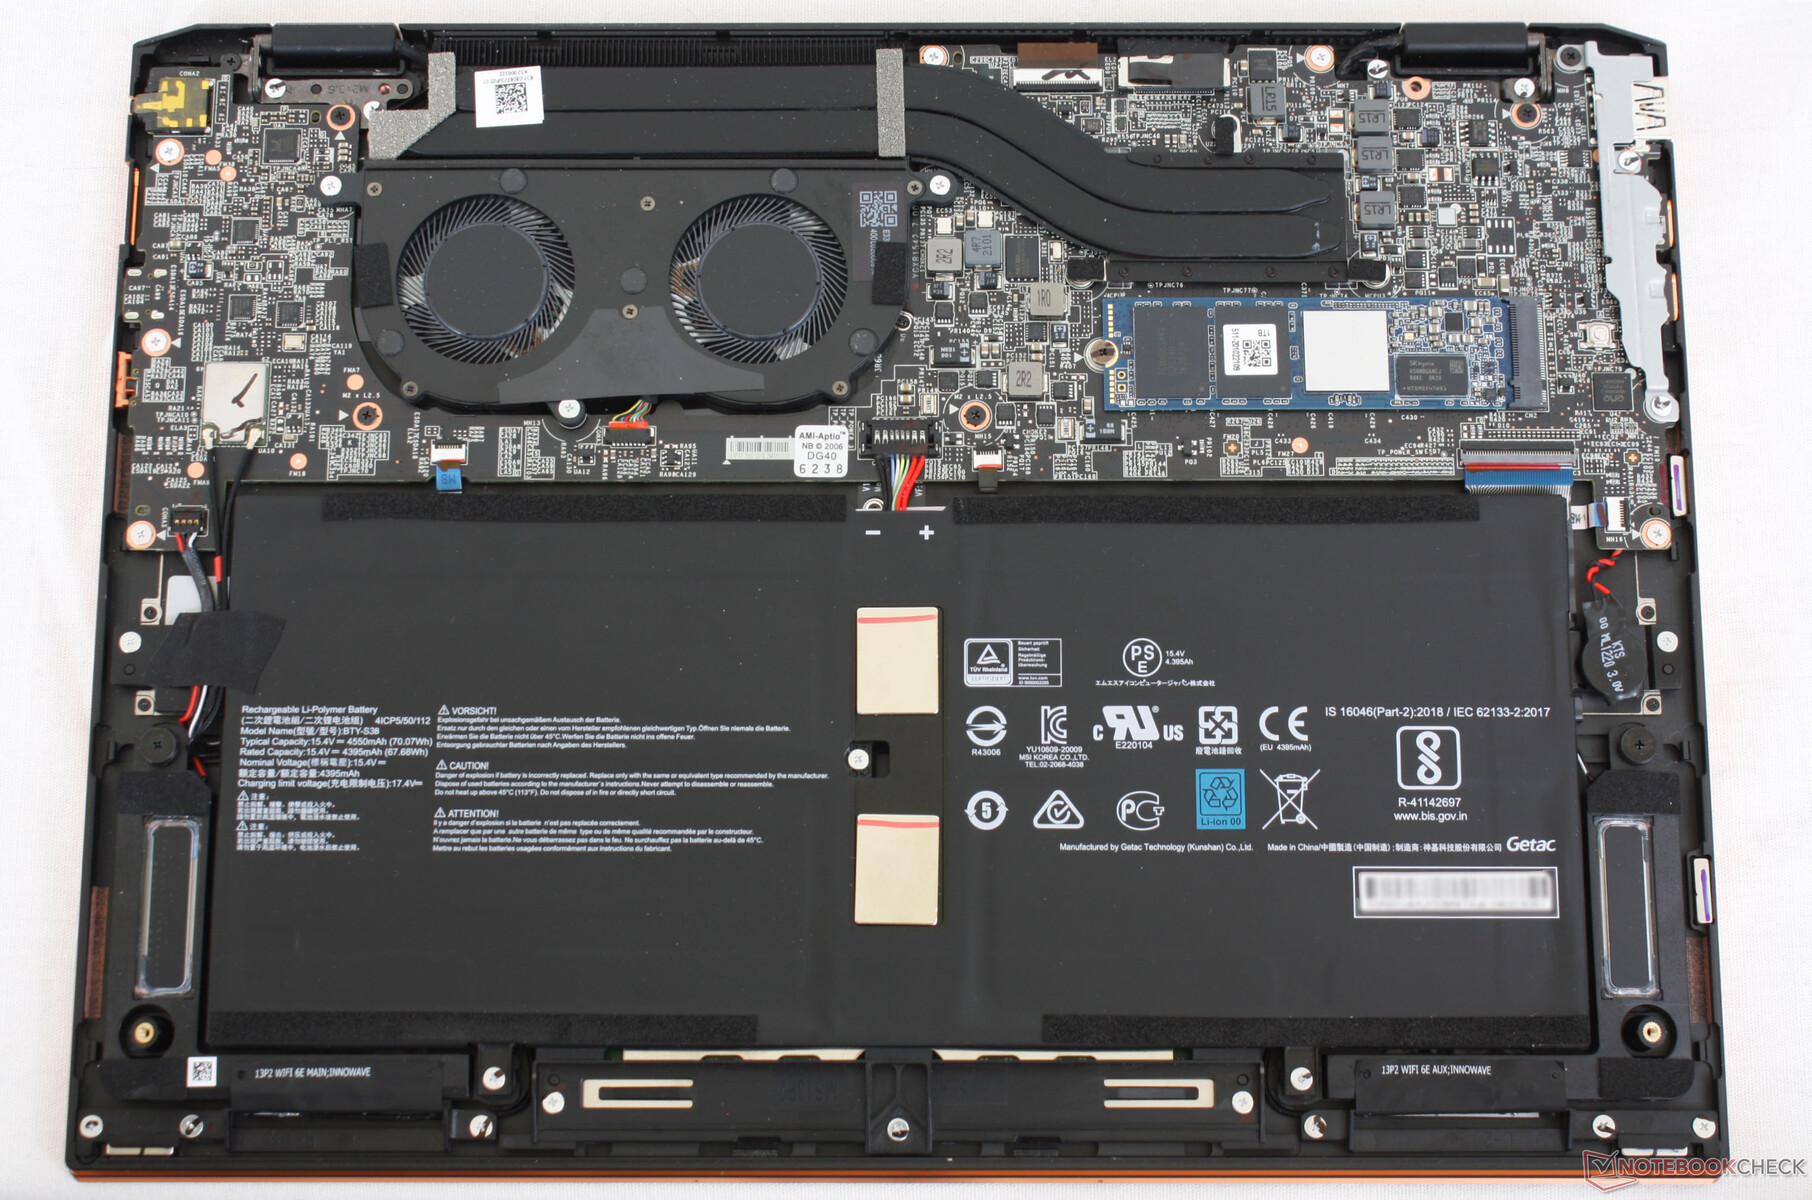
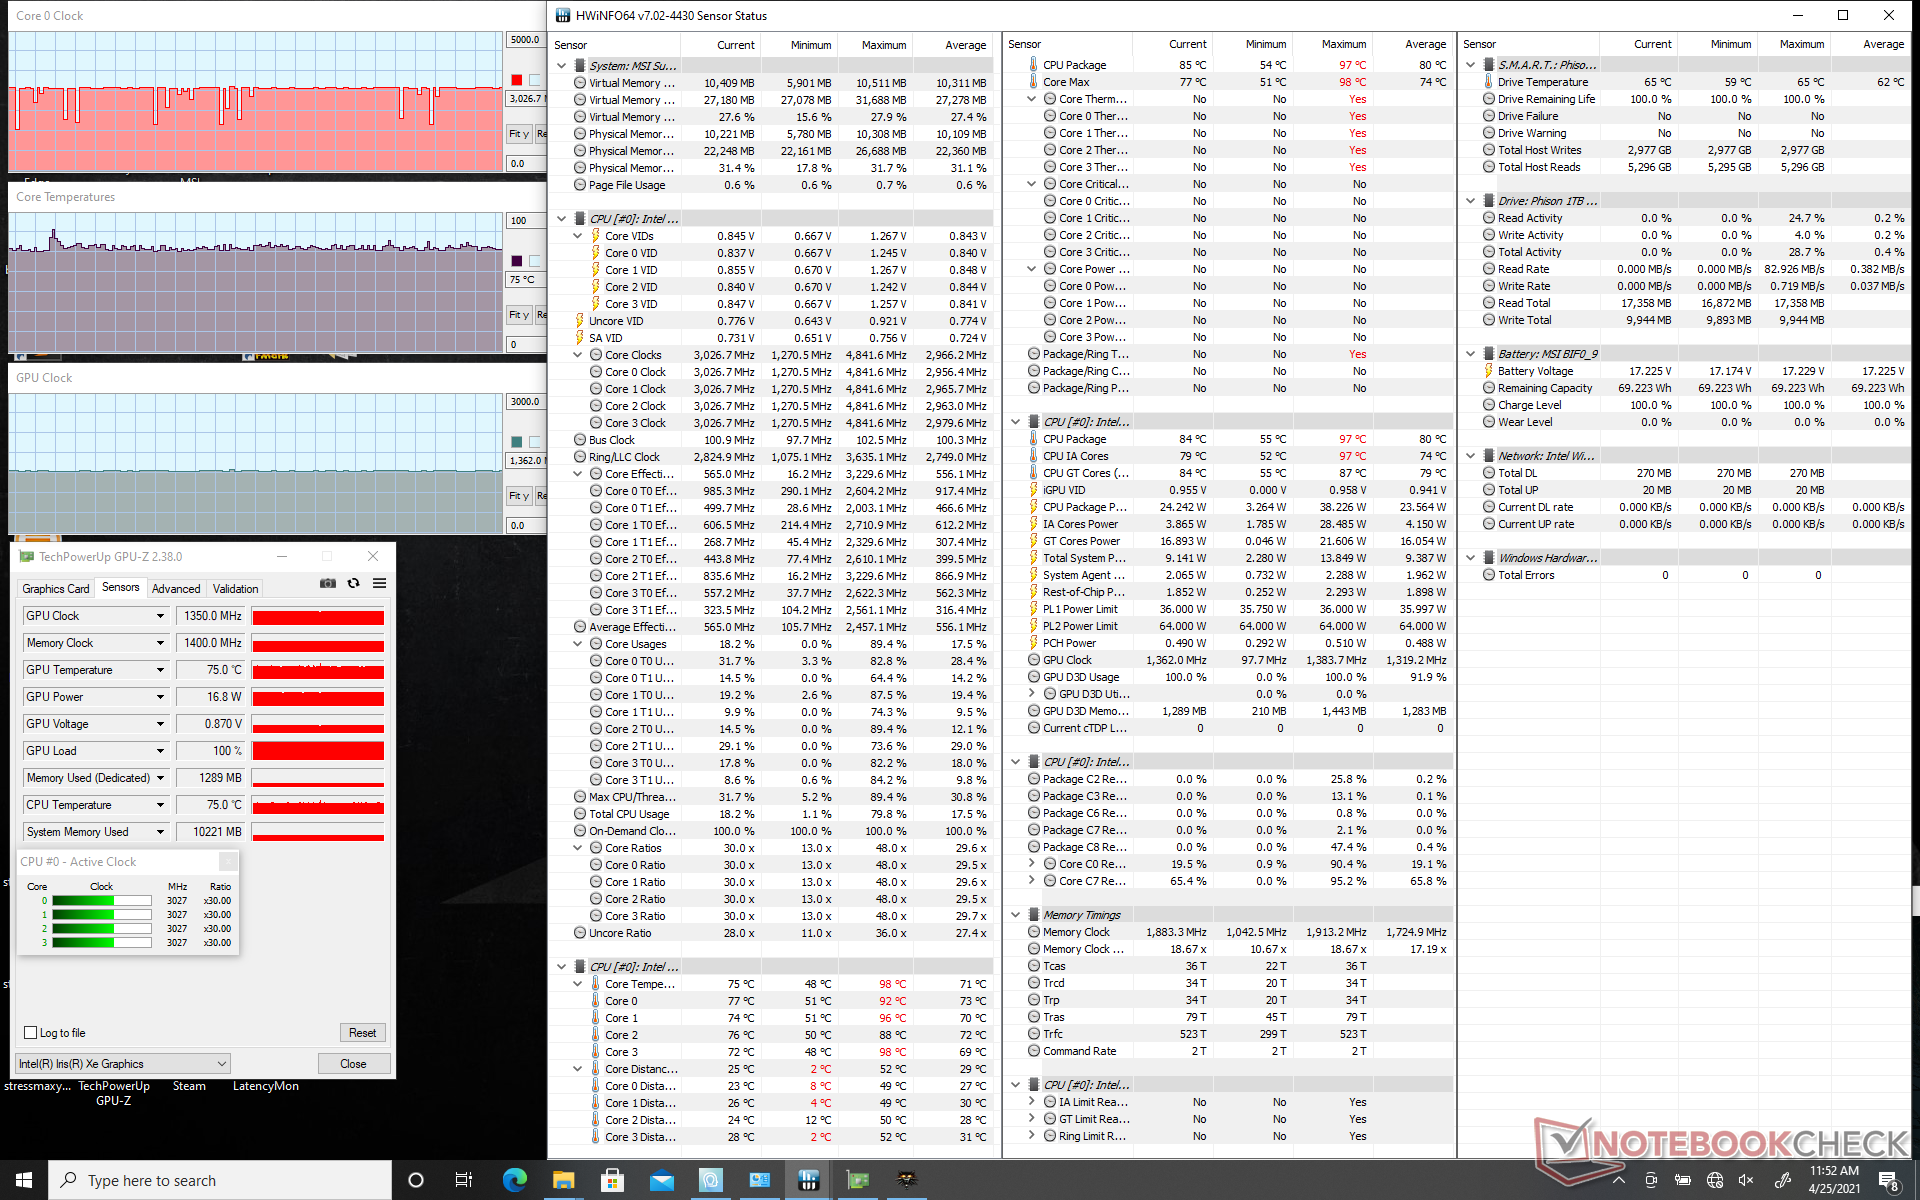
The biggest advantages of the MSI system are its smoother 120 Hz display refresh rate, greater and more consistent performance, PCIe 4.0 M.2 slot, and larger battery for longer runtimes. The higher refresh rate in particular adds significantly to the user experience as it boosts responsiveness especially when using a stylus.
The disadvantages of the MSI are arguably just as considerable. Most notably, it is slightly heavier and larger than the Dell alternative meaning its higher performance, longer runtimes, and larger port options don't come free. Its fans tend to be more noticeable as well because they change in RPM more frequently when running higher loads.
We can't declare one system to be objectively better than the other since they have their pros and cons. If you don't mind a slightly bigger system for its superior display, port options, battery life, and performance, for example, then the extra girth and noise of the MSI may be worth it over the Dell. See our reviews on the MSI Summit E13 Flip and Dell XPS 13 7390 2-in-1 to learn more about each system.
| MSI Summit E13 Flip Evo | Dell XPS 13 7390 2-in-1 | |
|---|---|---|
| CPU/GPU | 11th gen Core i7-1185G7 Iris Xe | 10th gen Core i7-1065G7 Iris Plus G7 |
| Touchscreen | 13.4-inch, 16:10, 1920 x 1200 120 Hz refresh rate | 13.4-inch, 16:10, 1920 x 1200 |
RAM | 32 GB LPDDR4X 2133 MHz | 16 GB LPDDR4 1866 MHz |
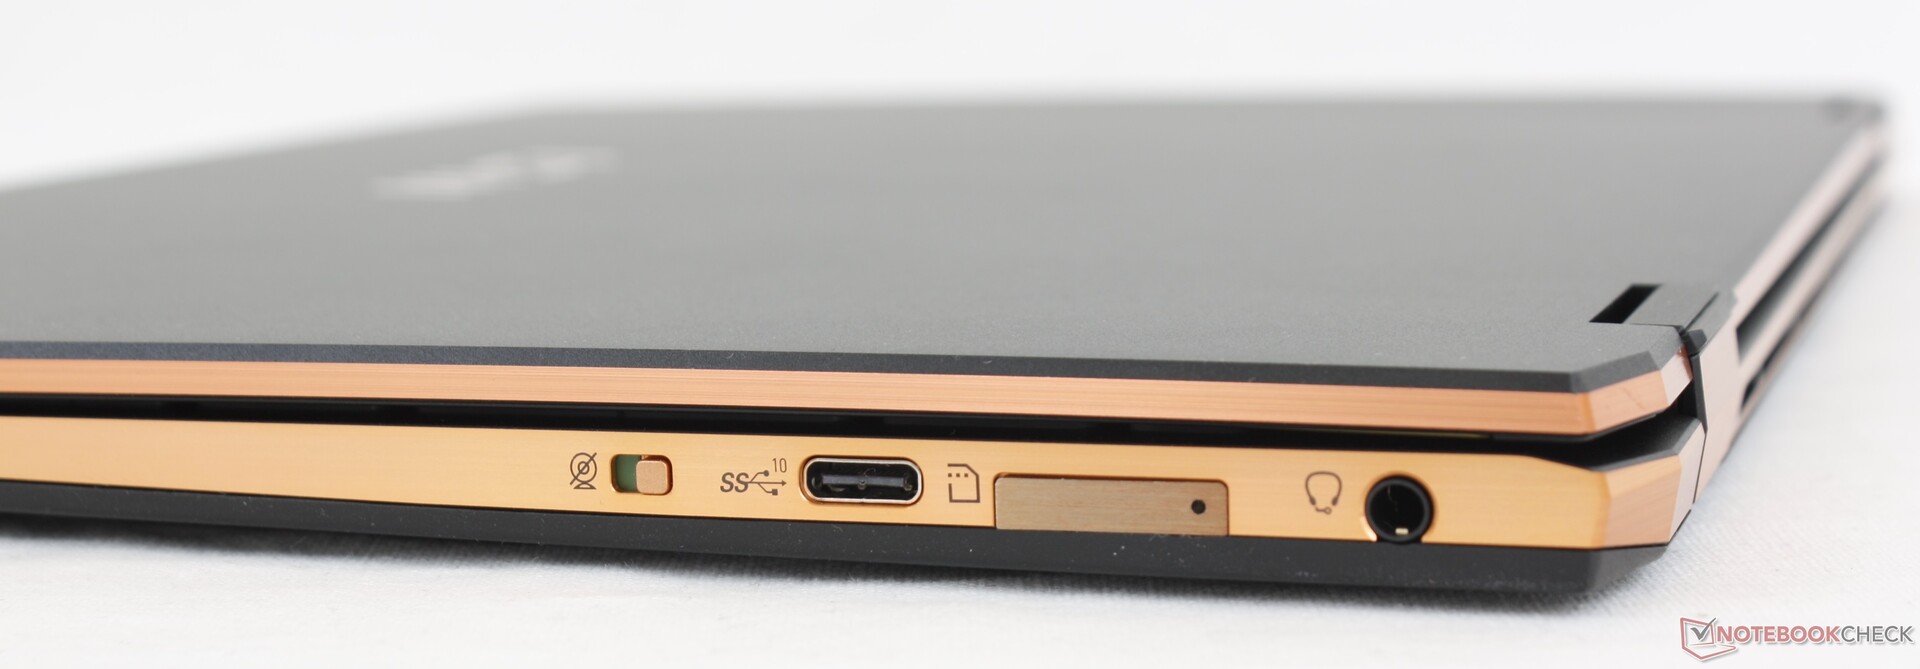
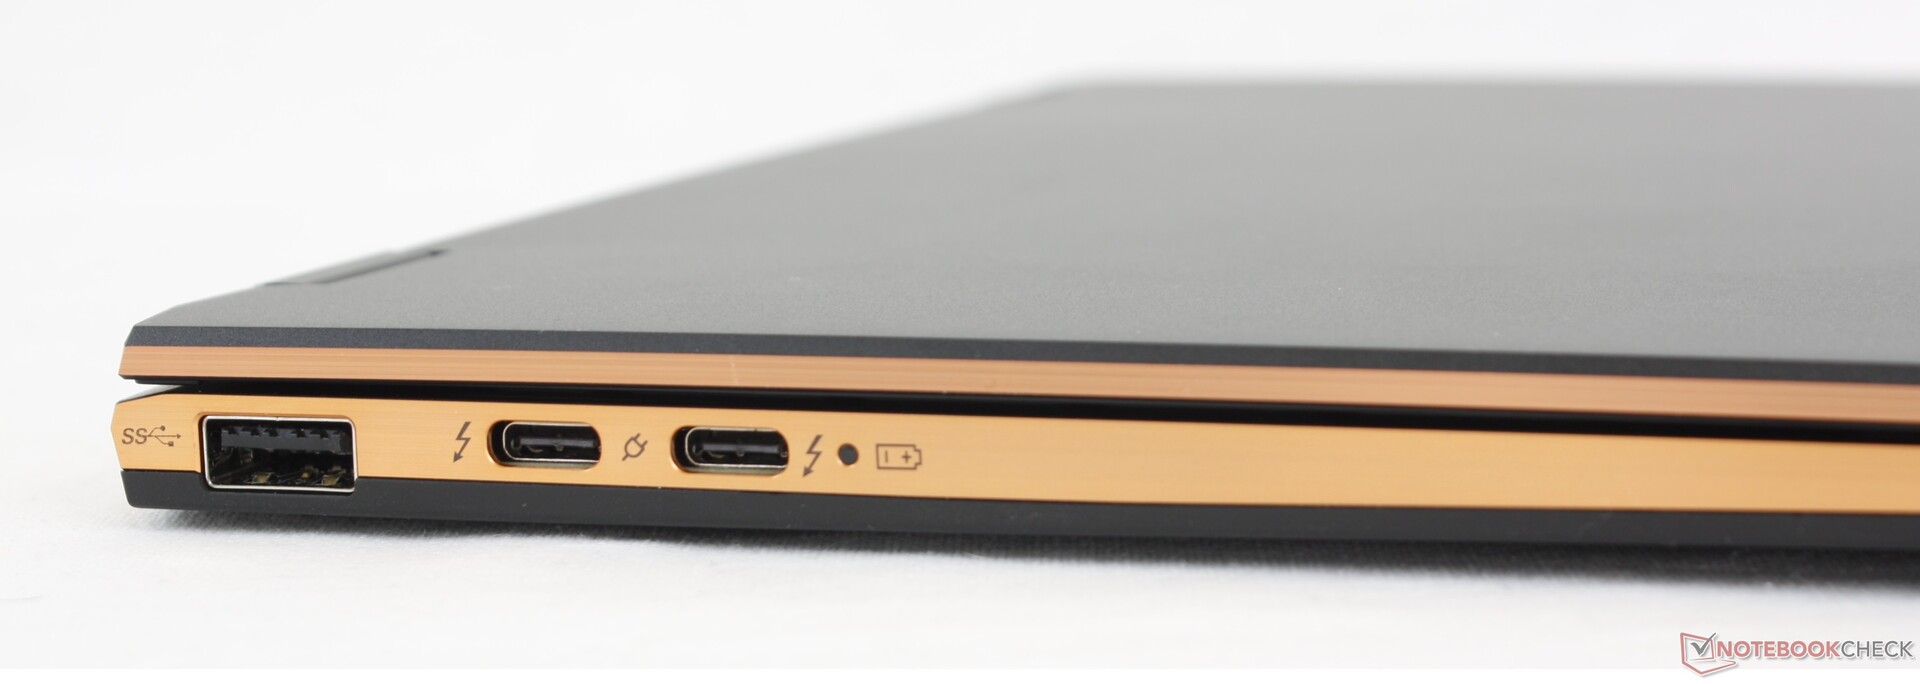
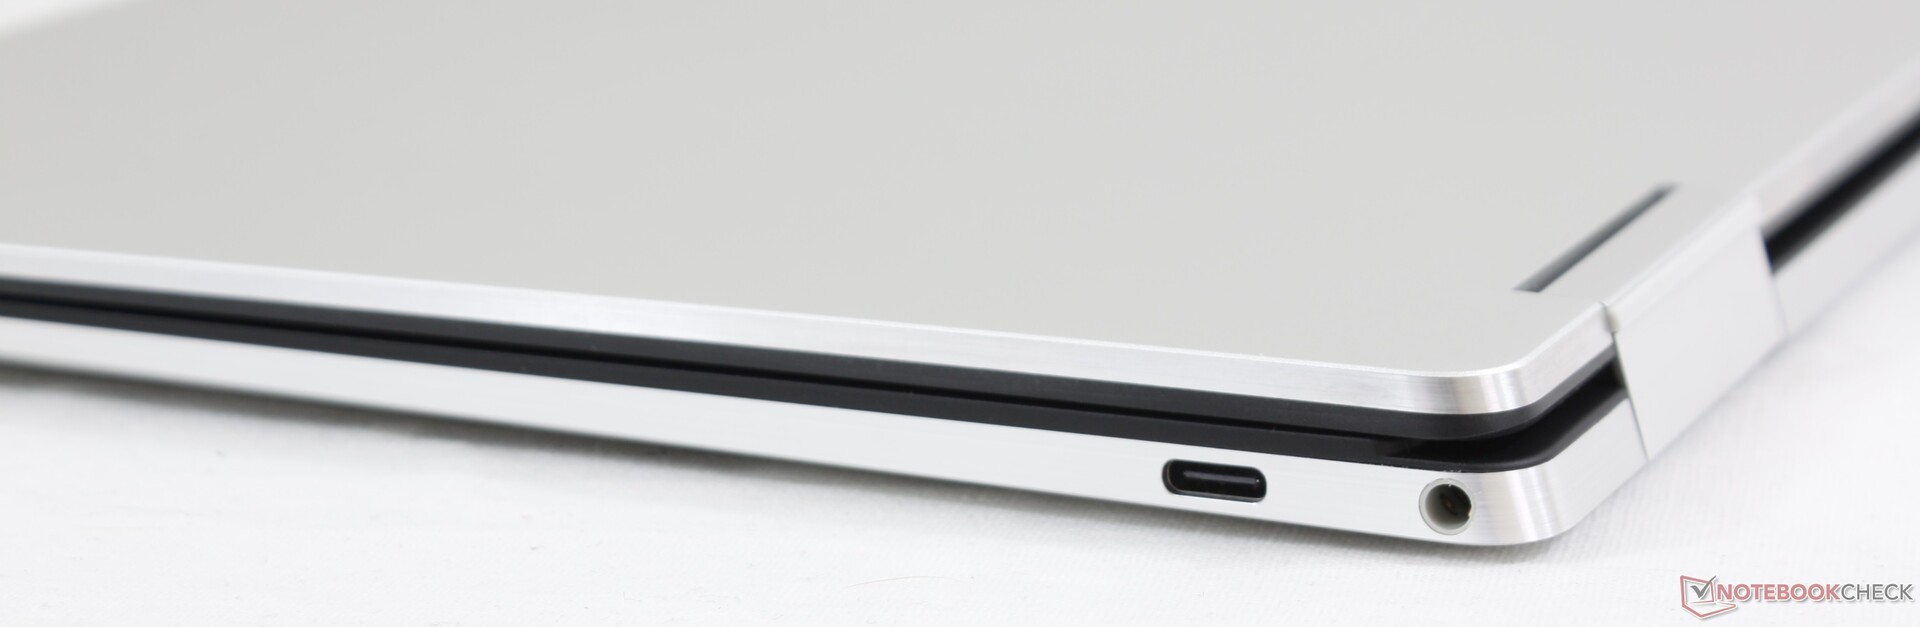
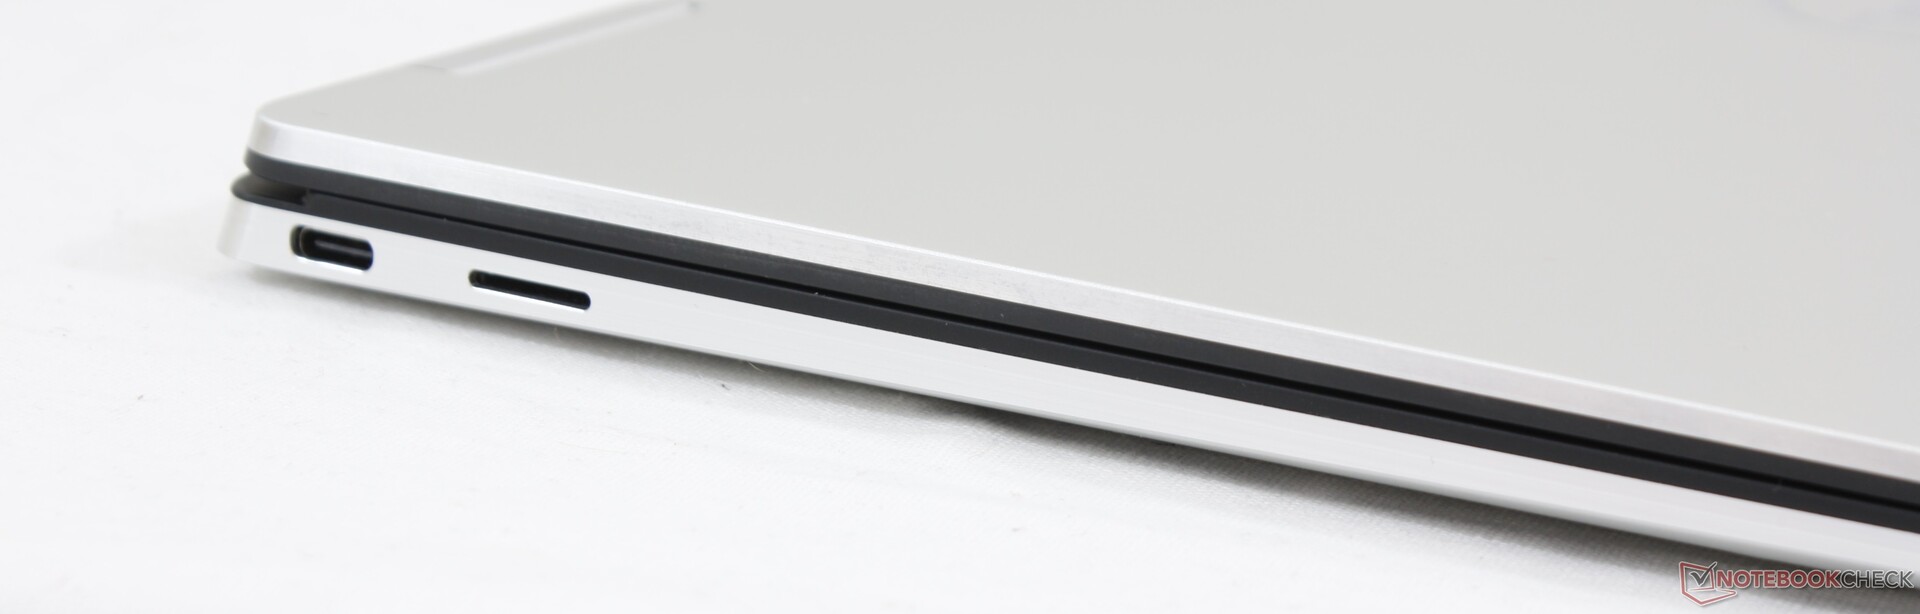
| Ports | 3x USB-C (2x Thunderbolt 4 + DisplayPort + Power Delivery) 1x USB-A 1x 3.5 mm combo audio MicroSD reader | 2x USB-C (2x Thunderbolt 3 + DisplayPort + Power Delivery) 1x 3.5 mm combo audio MicroSD reader |
| MSI Summit E13 Flip Evo A11MT Sharp LQ134N1JW53, IPS, 13.4", 1920x1200 | Dell XPS 13 7390 2-in-1 Core i7 Sharp LQ134N1, IPS, 13.4", 1920x1200 | |
|---|---|---|
| Display | 0% | |
| Display P3 Coverage (%) | 69.8 | 69.9 0% |
| sRGB Coverage (%) | 98.8 | 99.2 0% |
| AdobeRGB 1998 Coverage (%) | 70.6 | 71.5 1% |
| Response Times | 30% | |
| Response Time Grey 50% / Grey 80% * (ms) | 64 ? | 47.6 ? 26% |
| Response Time Black / White * (ms) | 44 ? | 29.2 ? 34% |
| PWM Frequency (Hz) | 2500 ? | |
| Screen | -15% | |
| Brightness middle (cd/m²) | 551.3 | 549.8 0% |
| Brightness (cd/m²) | 517 | 520 1% |
| Brightness Distribution (%) | 91 | 86 -5% |
| Black Level * (cd/m²) | 0.37 | 0.39 -5% |
| Contrast (:1) | 1490 | 1410 -5% |
| Colorchecker dE 2000 * | 1.45 | 2.12 -46% |
| Colorchecker dE 2000 max. * | 2.86 | 3.66 -28% |
| Colorchecker dE 2000 calibrated * | 1.7 | 1.37 19% |
| Greyscale dE 2000 * | 1.3 | 2.6 -100% |
| Gamma | 2.14 103% | 2.3 96% |
| CCT | 6580 99% | 6884 94% |
| Color Space (Percent of AdobeRGB 1998) (%) | 65 | 65.4 1% |
| Color Space (Percent of sRGB) (%) | 99 | 99.7 1% |
| Total Average (Program / Settings) | 5% /
-7% |
* ... smaller is better
Cinebench R23: Multi Core | Single Core
Cinebench R15: CPU Single 64Bit | CPU Multi 64Bit
Blender: v2.79 BMW27 CPU
7-Zip 18.03: 7z b 4 -mmt1 | 7z b 4
Geekbench 5.5: Single-Core | Multi-Core
HWBOT x265 Benchmark v2.2: 4k Preset
LibreOffice : 20 Documents To PDF
R Benchmark 2.5: Overall mean
| Cinebench R20 / CPU (Multi Core) | |
| MSI Summit E13 Flip Evo A11MT | |
| Dell XPS 13 7390 2-in-1 Core i7 | |
| Cinebench R20 / CPU (Single Core) | |
| MSI Summit E13 Flip Evo A11MT | |
| Dell XPS 13 7390 2-in-1 Core i7 | |
| Cinebench R23 / Multi Core | |
| MSI Summit E13 Flip Evo A11MT | |
| Cinebench R23 / Single Core | |
| MSI Summit E13 Flip Evo A11MT | |
| Cinebench R15 / CPU Single 64Bit | |
| MSI Summit E13 Flip Evo A11MT | |
| Dell XPS 13 7390 2-in-1 Core i7 | |
| Cinebench R15 / CPU Multi 64Bit | |
| MSI Summit E13 Flip Evo A11MT | |
| Dell XPS 13 7390 2-in-1 Core i7 | |
| Blender / v2.79 BMW27 CPU | |
| Dell XPS 13 7390 2-in-1 Core i7 | |
| MSI Summit E13 Flip Evo A11MT | |
| 7-Zip 18.03 / 7z b 4 -mmt1 | |
| MSI Summit E13 Flip Evo A11MT | |
| Dell XPS 13 7390 2-in-1 Core i7 | |
| 7-Zip 18.03 / 7z b 4 | |
| MSI Summit E13 Flip Evo A11MT | |
| Dell XPS 13 7390 2-in-1 Core i7 | |
| Geekbench 5.5 / Single-Core | |
| MSI Summit E13 Flip Evo A11MT | |
| Geekbench 5.5 / Multi-Core | |
| MSI Summit E13 Flip Evo A11MT | |
| HWBOT x265 Benchmark v2.2 / 4k Preset | |
| MSI Summit E13 Flip Evo A11MT | |
| Dell XPS 13 7390 2-in-1 Core i7 | |
| LibreOffice / 20 Documents To PDF | |
| MSI Summit E13 Flip Evo A11MT | |
| R Benchmark 2.5 / Overall mean | |
| MSI Summit E13 Flip Evo A11MT | |
* ... smaller is better
| PCMark 10 | |
| Score | |
| MSI Summit E13 Flip Evo A11MT | |
| Dell XPS 13 7390 2-in-1 Core i7 | |
| Essentials | |
| Dell XPS 13 7390 2-in-1 Core i7 | |
| MSI Summit E13 Flip Evo A11MT | |
| Productivity | |
| Dell XPS 13 7390 2-in-1 Core i7 | |
| MSI Summit E13 Flip Evo A11MT | |
| Digital Content Creation | |
| MSI Summit E13 Flip Evo A11MT | |
| Dell XPS 13 7390 2-in-1 Core i7 | |
| 3DMark | |
| 1920x1080 Fire Strike Graphics | |
| MSI Summit E13 Flip Evo A11MT | |
| Dell XPS 13 9310 Core i7 4K | |
| Dell XPS 13 7390 2-in-1 Core i7 | |
| 2560x1440 Time Spy Graphics | |
| MSI Summit E13 Flip Evo A11MT | |
| Dell XPS 13 9310 Core i7 4K | |
| Dell XPS 13 7390 2-in-1 Core i7 | |
| 2560x1440 Time Spy Score | |
| MSI Summit E13 Flip Evo A11MT | |
| Dell XPS 13 9310 Core i7 4K | |
| Dell XPS 13 7390 2-in-1 Core i7 | |
| 3DMark 11 | |
| 1280x720 Performance GPU | |
| MSI Summit E13 Flip Evo A11MT | |
| Dell XPS 13 9310 Core i7 4K | |
| Dell XPS 13 7390 2-in-1 Core i7 | |
| 1280x720 Performance Combined | |
| MSI Summit E13 Flip Evo A11MT | |
| Dell XPS 13 9310 Core i7 4K | |
| Dell XPS 13 7390 2-in-1 Core i7 | |
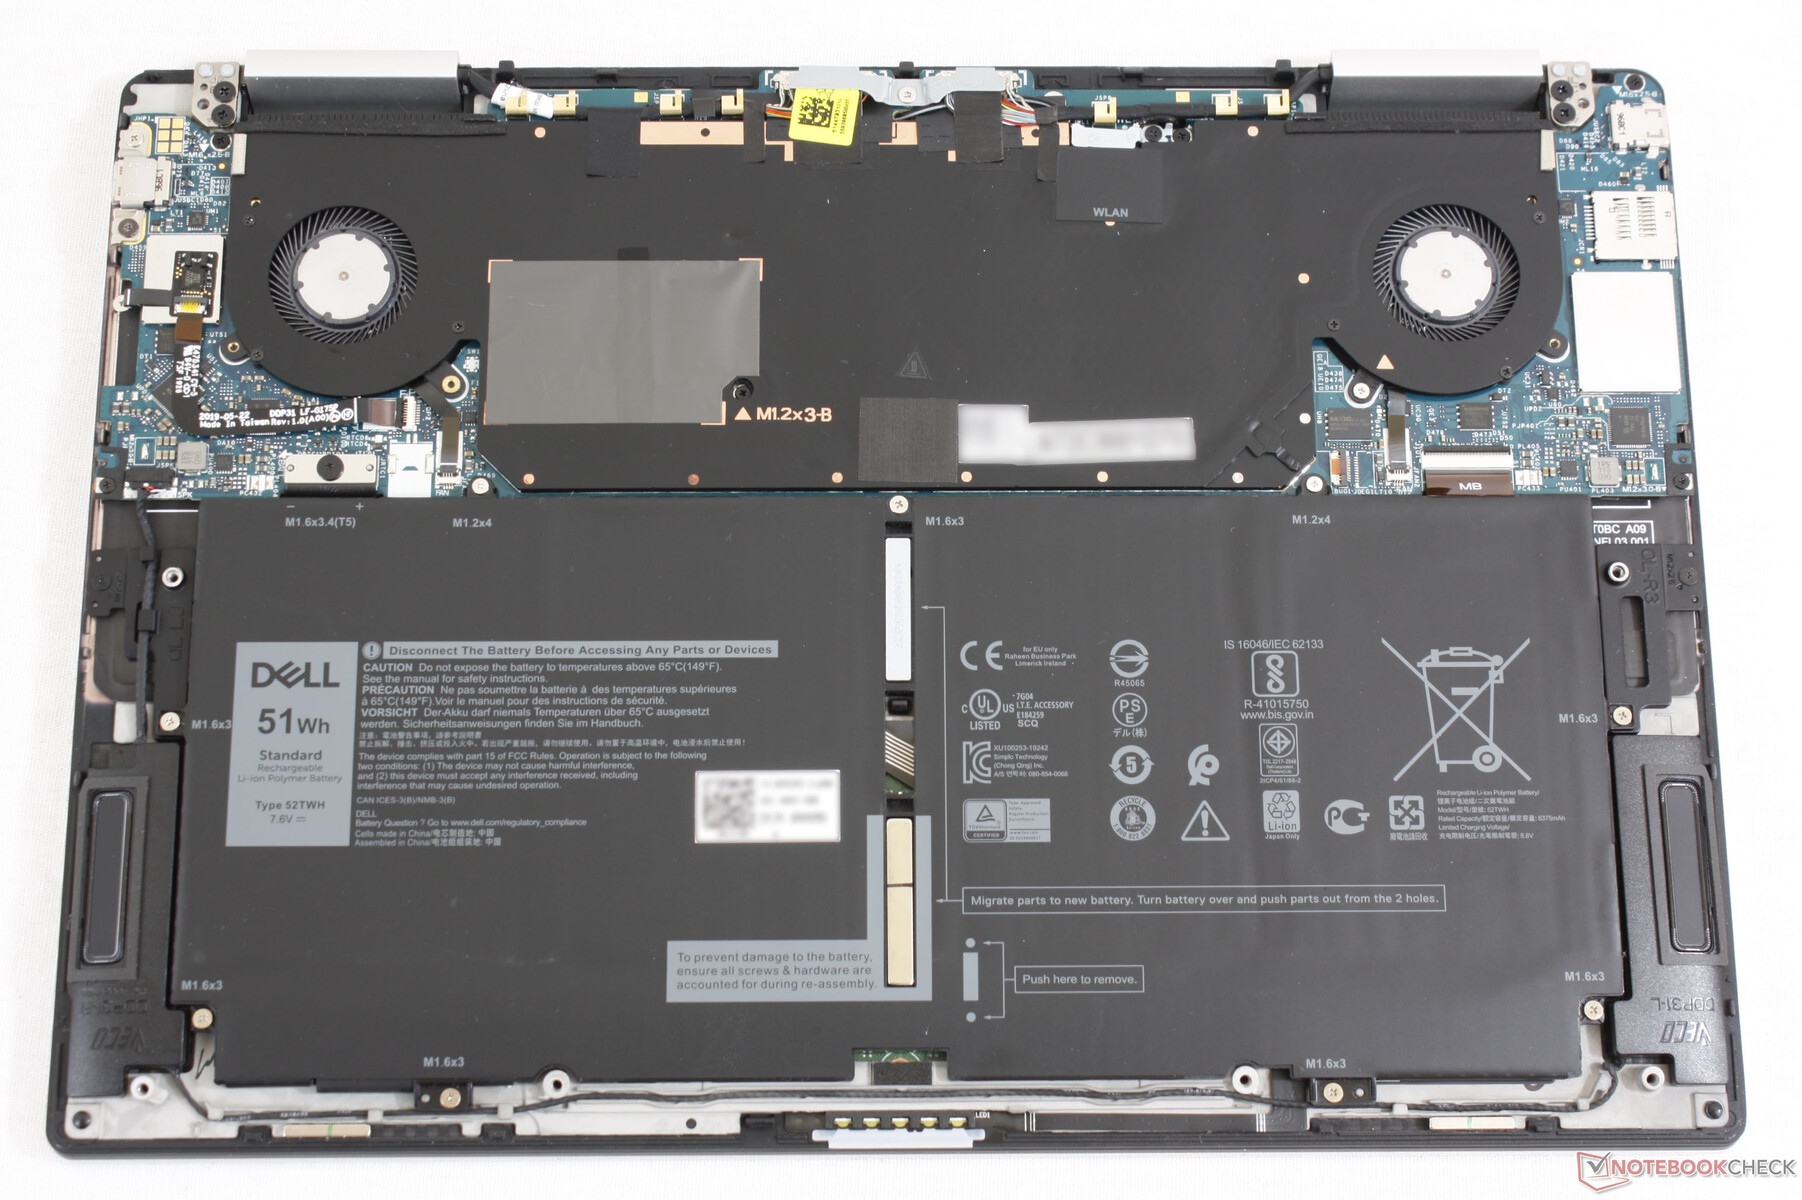
| MSI Summit E13 Flip Evo A11MT Iris Xe G7 96EUs, i7-1185G7, Phison 1TB SM2801T24GKBB4S-E162 | Dell XPS 13 7390 2-in-1 Core i7 Iris Plus Graphics G7 (Ice Lake 64 EU), i7-1065G7, Toshiba BG4 KBG40ZPZ512G | |
|---|---|---|
| Noise | -4% | |
| off / environment * (dB) | 24.5 | 28.1 -15% |
| Idle Minimum * (dB) | 24.7 | 28.1 -14% |
| Idle Average * (dB) | 24.7 | 28.1 -14% |
| Idle Maximum * (dB) | 26.4 | 28.1 -6% |
| Load Average * (dB) | 37.8 | 31.7 16% |
| Witcher 3 ultra * (dB) | 41.4 | 43.4 -5% |
| Load Maximum * (dB) | 48.8 | 43.4 11% |
* ... smaller is better
| MSI Summit E13 Flip Evo A11MT i7-1185G7, Iris Xe G7 96EUs, 70 Wh | Dell XPS 13 7390 2-in-1 Core i7 i7-1065G7, Iris Plus Graphics G7 (Ice Lake 64 EU), 51 Wh | |
|---|---|---|
| Battery runtime | -20% | |
| Reader / Idle (h) | 21.1 | |
| WiFi v1.3 (h) | 11.2 | 9 -20% |
| Load (h) | 1.8 |
Price comparison
