Dell XPS 13 7390 2-in-1 Core i7-1065G7 Review: Faster Than Any XPS 13 Before It
We recently checked out the $1000 XPS 13 7390 2-in-1 base model with the entry-level Ice Lake Core i3-1005G1 CPU and found it to be pretty good as an overall package. Raw processor performance was somewhat middling considering the price, but the super bright display and overall quality of the system made up for the Core i3-like performance.
For this review, we'll be looking at the $1700 XPS 13 7390 2-in-1 configuration with the high-end Core i7-1065G7 CPU and integrated Iris Plus GPU to see how it compares to the lesser Core i3 option. How much of a performance boost does the quad-core Core i7 offer over the dual-core Core i3? Can you game on the new Iris Plus GPU and is there a battery life deficit with the more powerful processor?
See our existing review on the XPS 13 7390 2-in-1 to learn more about the chassis, display, keyboard, and other physical features. We'll be focusing on all the differences we can find between the Core i3 and Core i7 configurations to help those who may on the fence for a new XPS 13 convertible.
Dell XPS 13 7390 2-in-1 Core i7 is now $400 off with coupon code and rebate cards until October 10. See here for details.
More Dell reviews:
Case
SD Card Reader
| SD Card Reader | |
| average JPG Copy Test (av. of 3 runs) | |
| Dell XPS 13 9380 2019 (Toshiba Exceria Pro SDXC 64 GB UHS-II) | |
| Dell XPS 13 9370 FHD i5 (Toshiba Exceria Pro M501 64 GB UHS-II) | |
| Dell XPS 13 7390 2-in-1 Core i3 (Toshiba Exceria Pro M501 64 GB UHS-II) | |
| Dell XPS 13 7390 2-in-1 Core i7 (Toshiba Exceria Pro M501 64 GB UHS-II) | |
| Dell XPS 13-9365 2-in-1 (Toshiba THN-M401S0640E2) | |
| maximum AS SSD Seq Read Test (1GB) | |
| Dell XPS 13 9370 FHD i5 (Toshiba Exceria Pro M501 64 GB UHS-II) | |
| Dell XPS 13 7390 2-in-1 Core i3 (Toshiba Exceria Pro M501 64 GB UHS-II) | |
| Dell XPS 13 9380 2019 (Toshiba Exceria Pro SDXC 64 GB UHS-II) | |
| Dell XPS 13 7390 2-in-1 Core i7 (Toshiba Exceria Pro M501 64 GB UHS-II) | |
| Dell XPS 13-9365 2-in-1 (Toshiba THN-M401S0640E2) | |
Communication
Strangely, transmit speeds are much lower than expected even when standing just 1 to 2 meters away from the source. The older Qualcomm QCA6174 in the XPS 13 9380 is able to outperform the Wi-Fi 6 compatible Killer AX1650s regardless of of our 1 Gbps-limited server. We suspect this could be a bug or an antennae mishap on our unit.
(October 13, 2019 update: We've determined that the issue may be related to our Netgear EA8500 router rather than the XPS system itself. We will update this section as soon as we can confirm the source of the anomaly.)
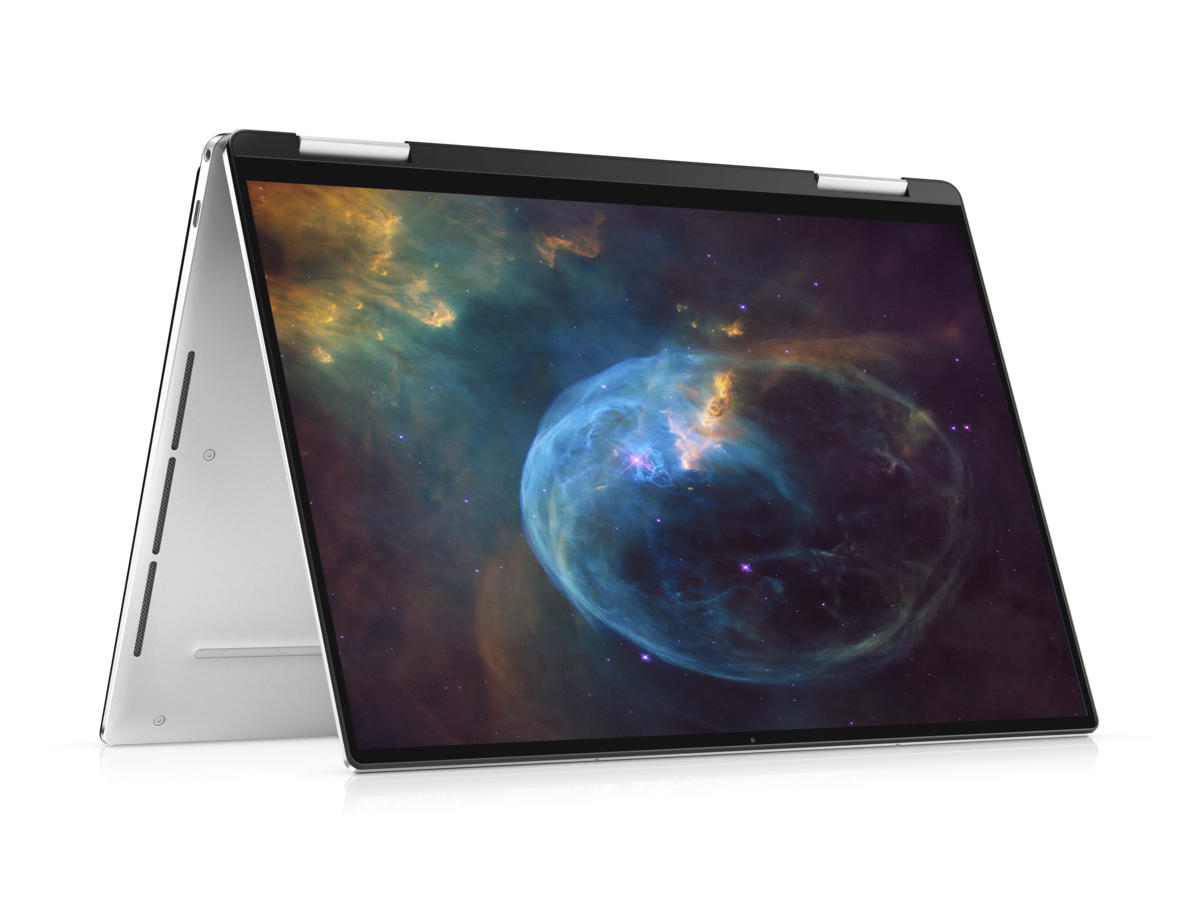
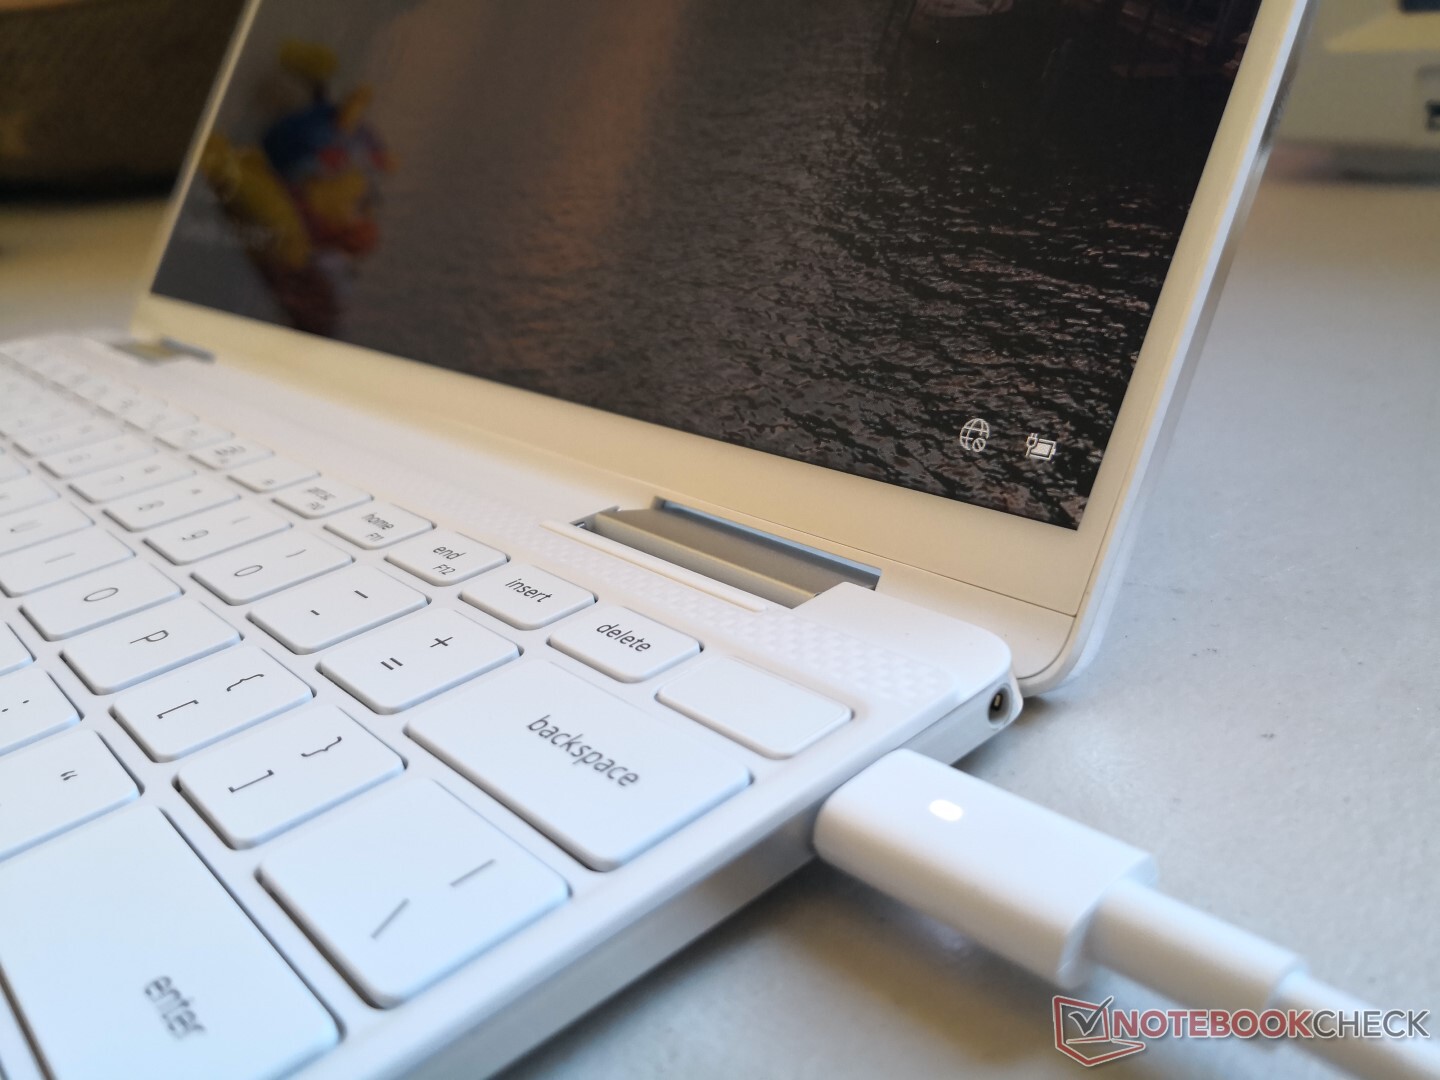
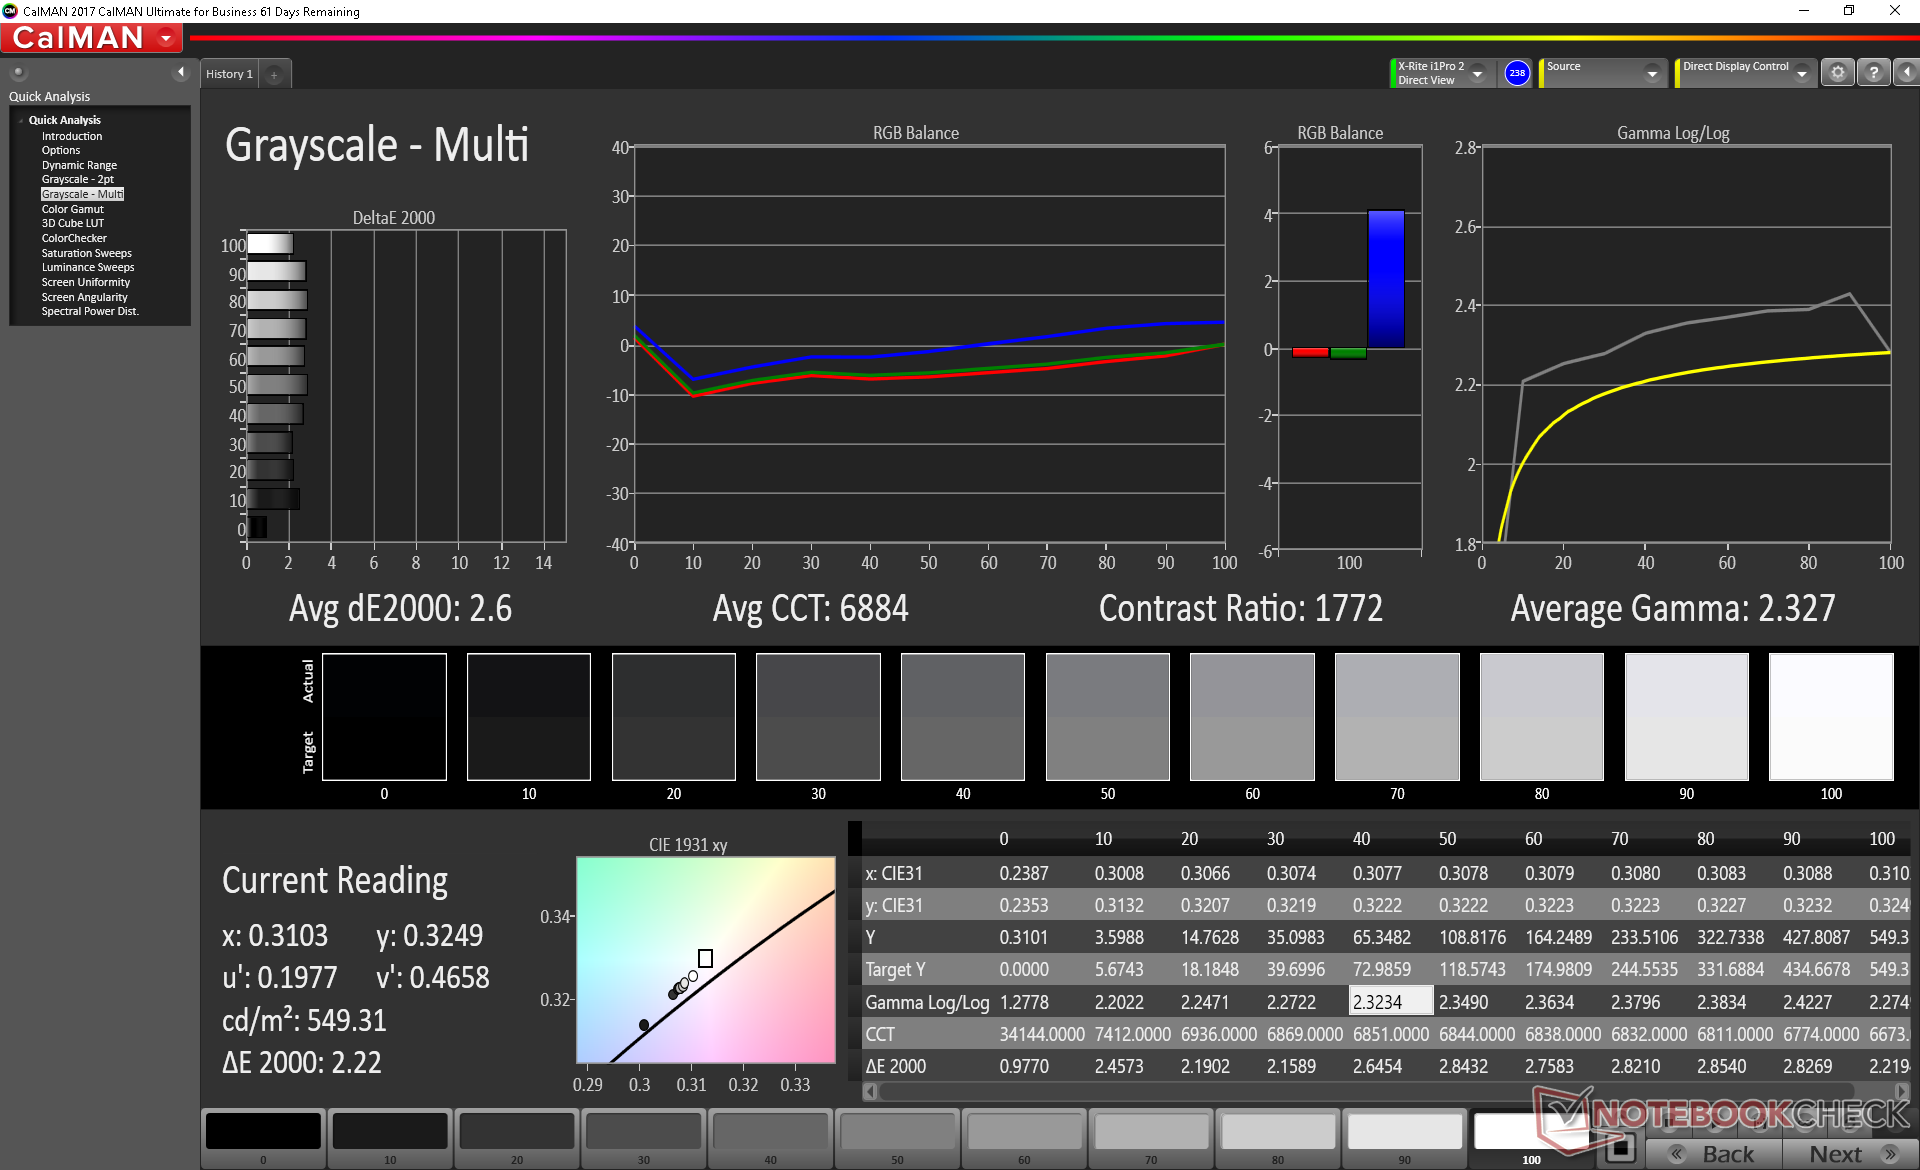
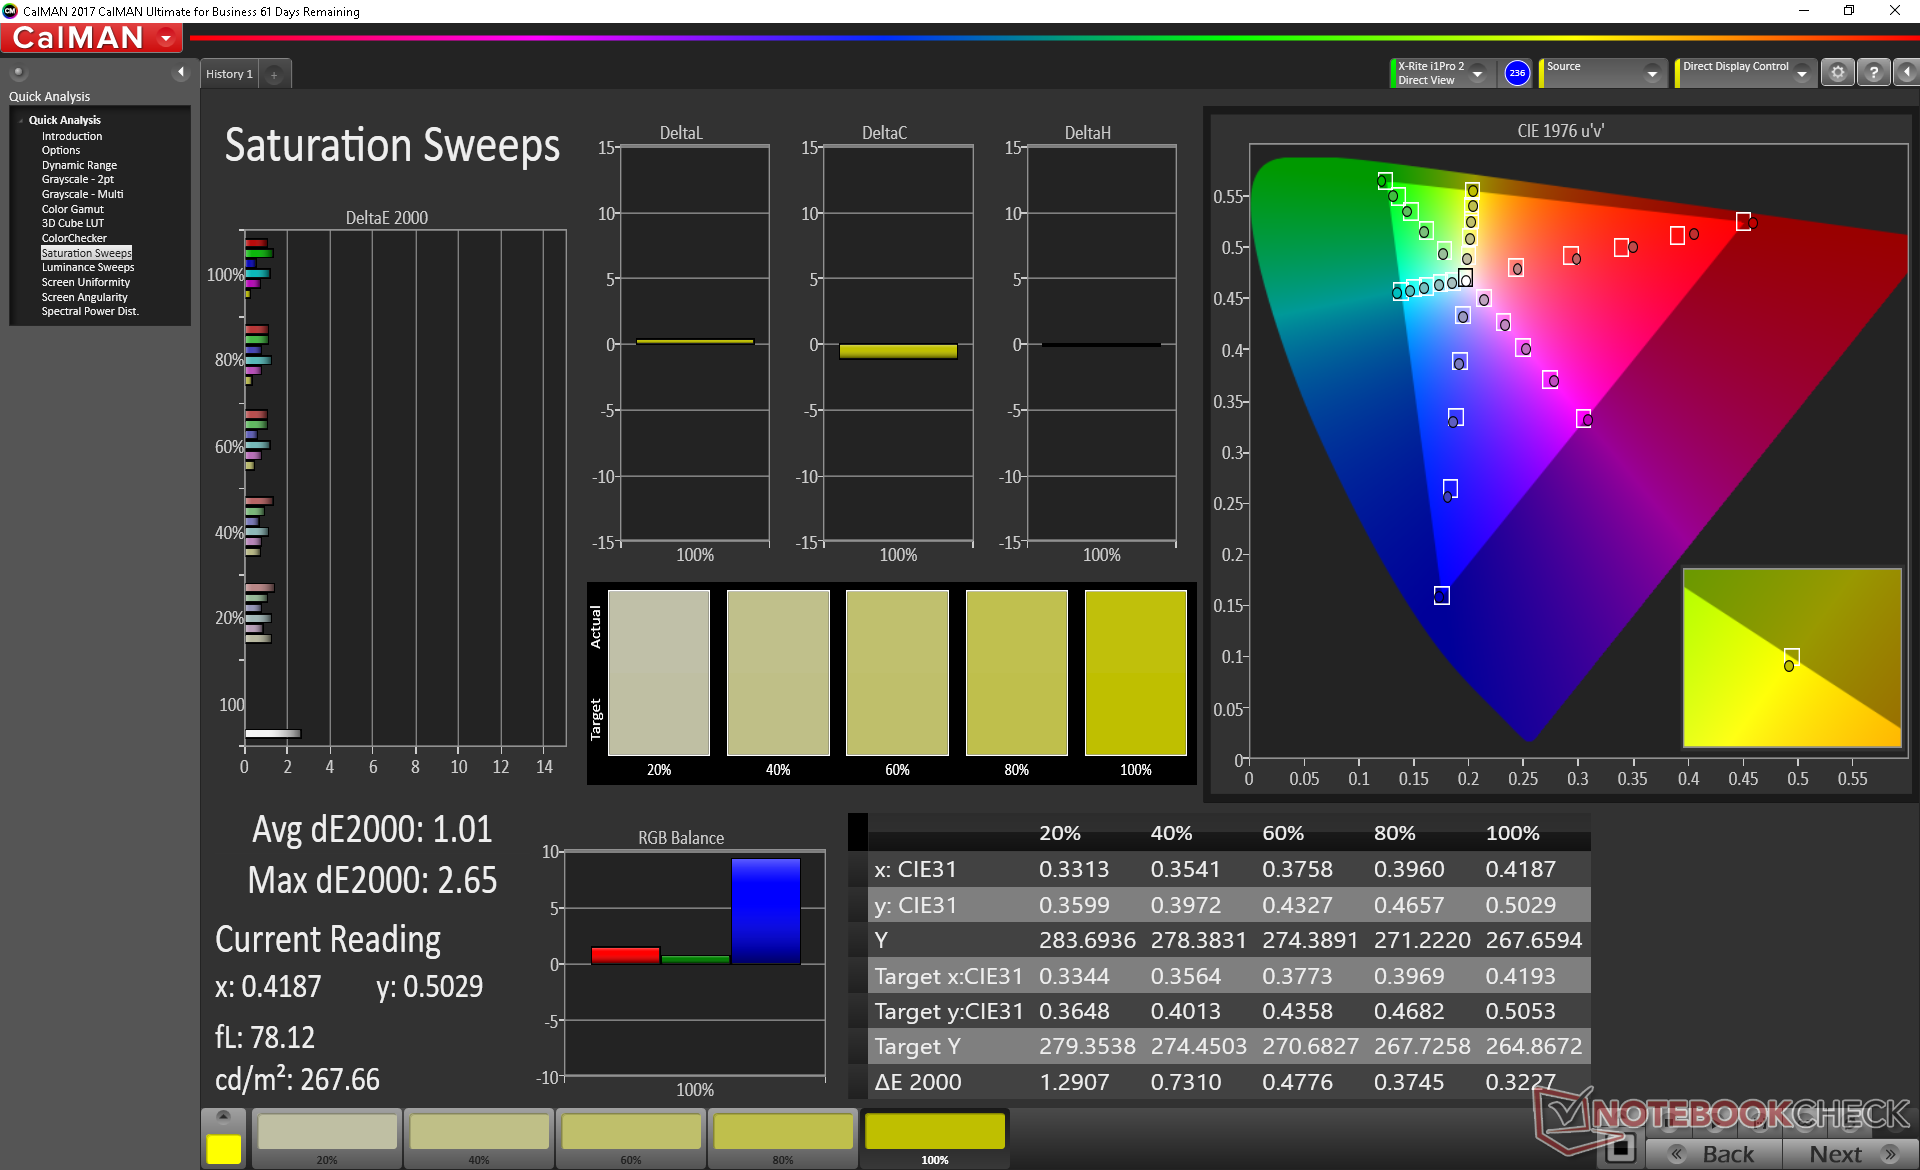
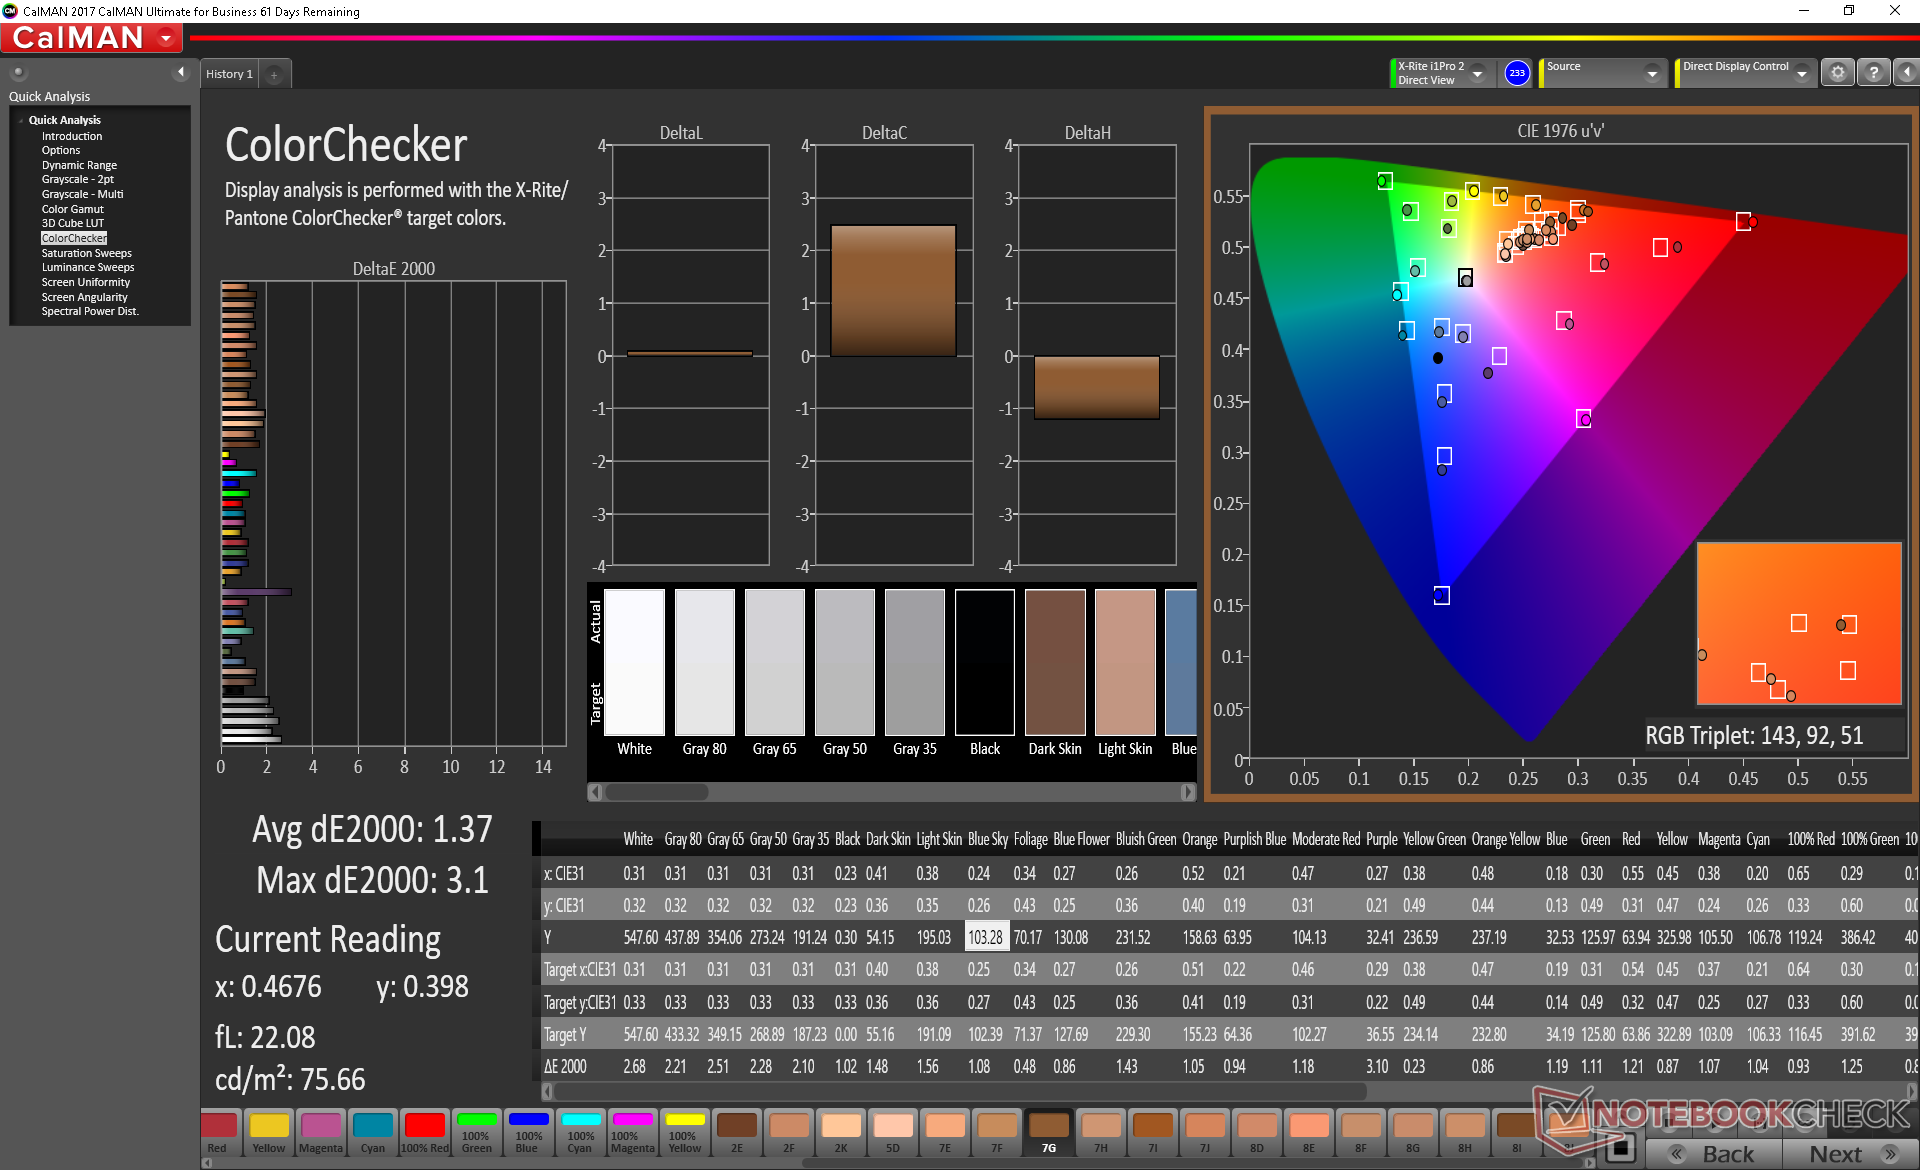
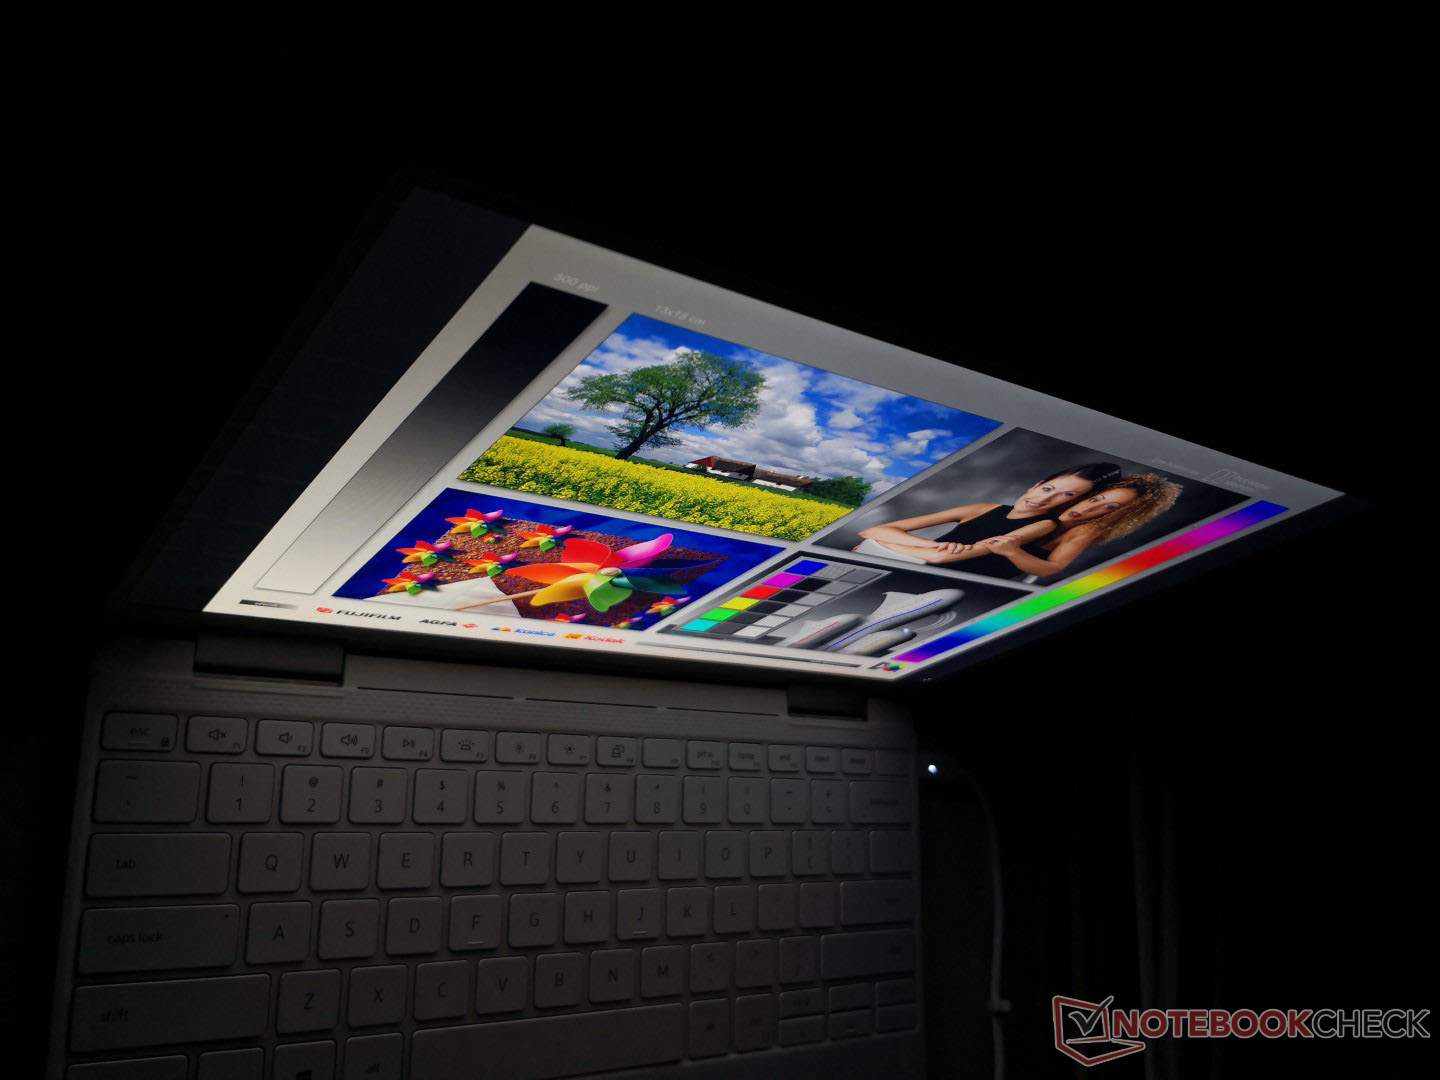
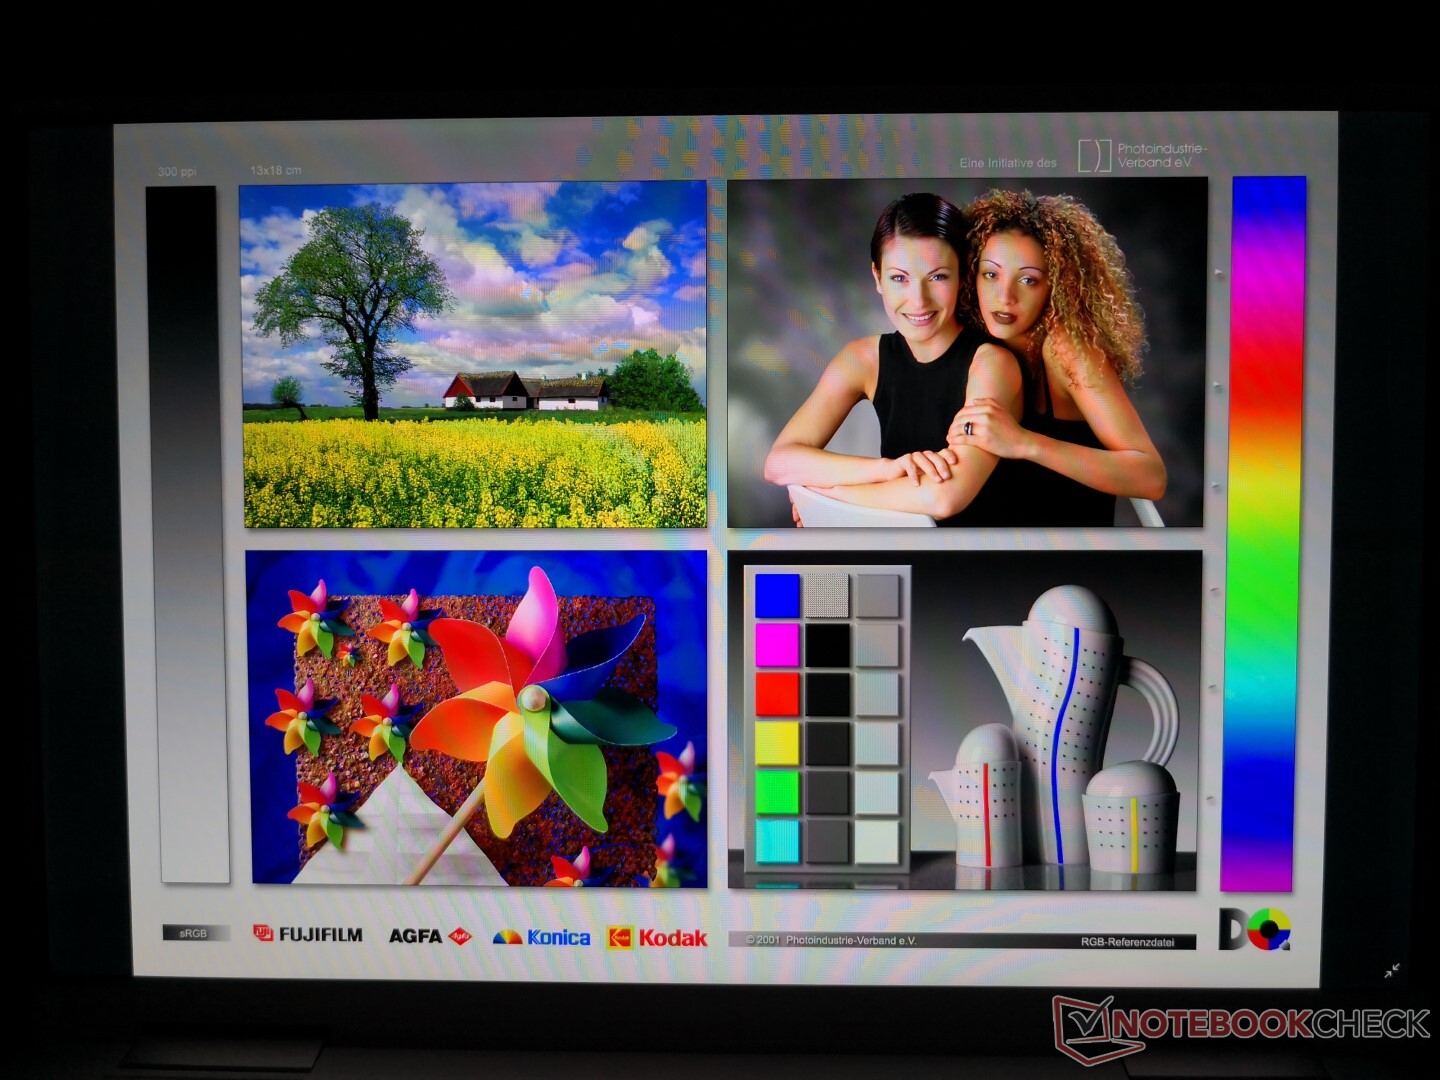
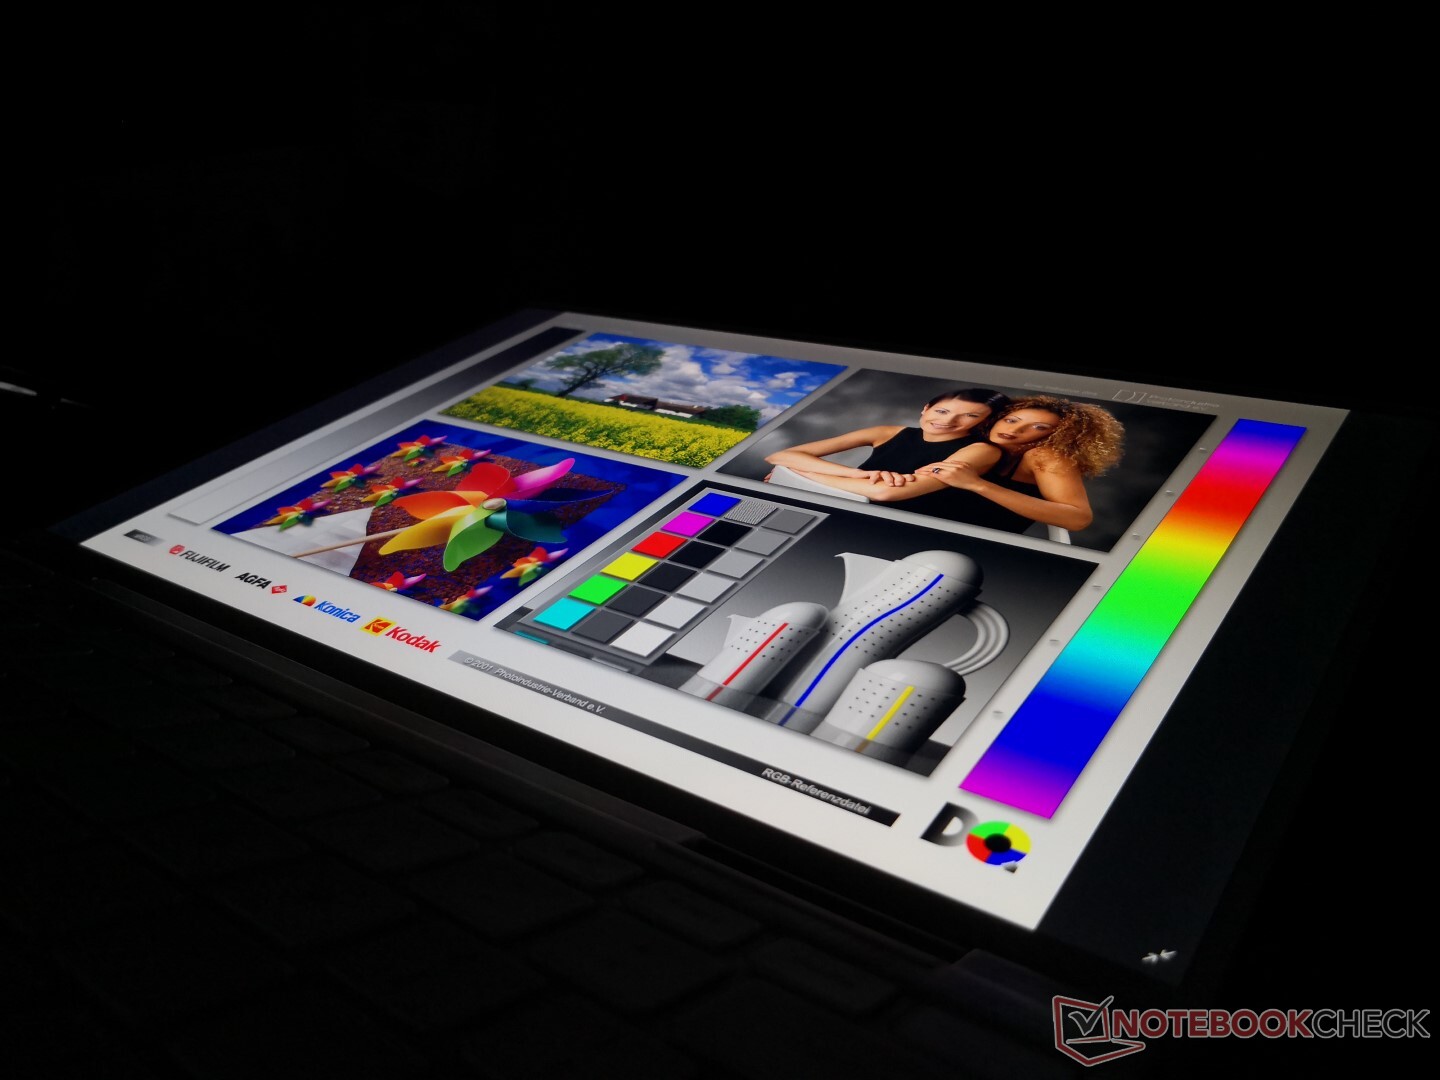
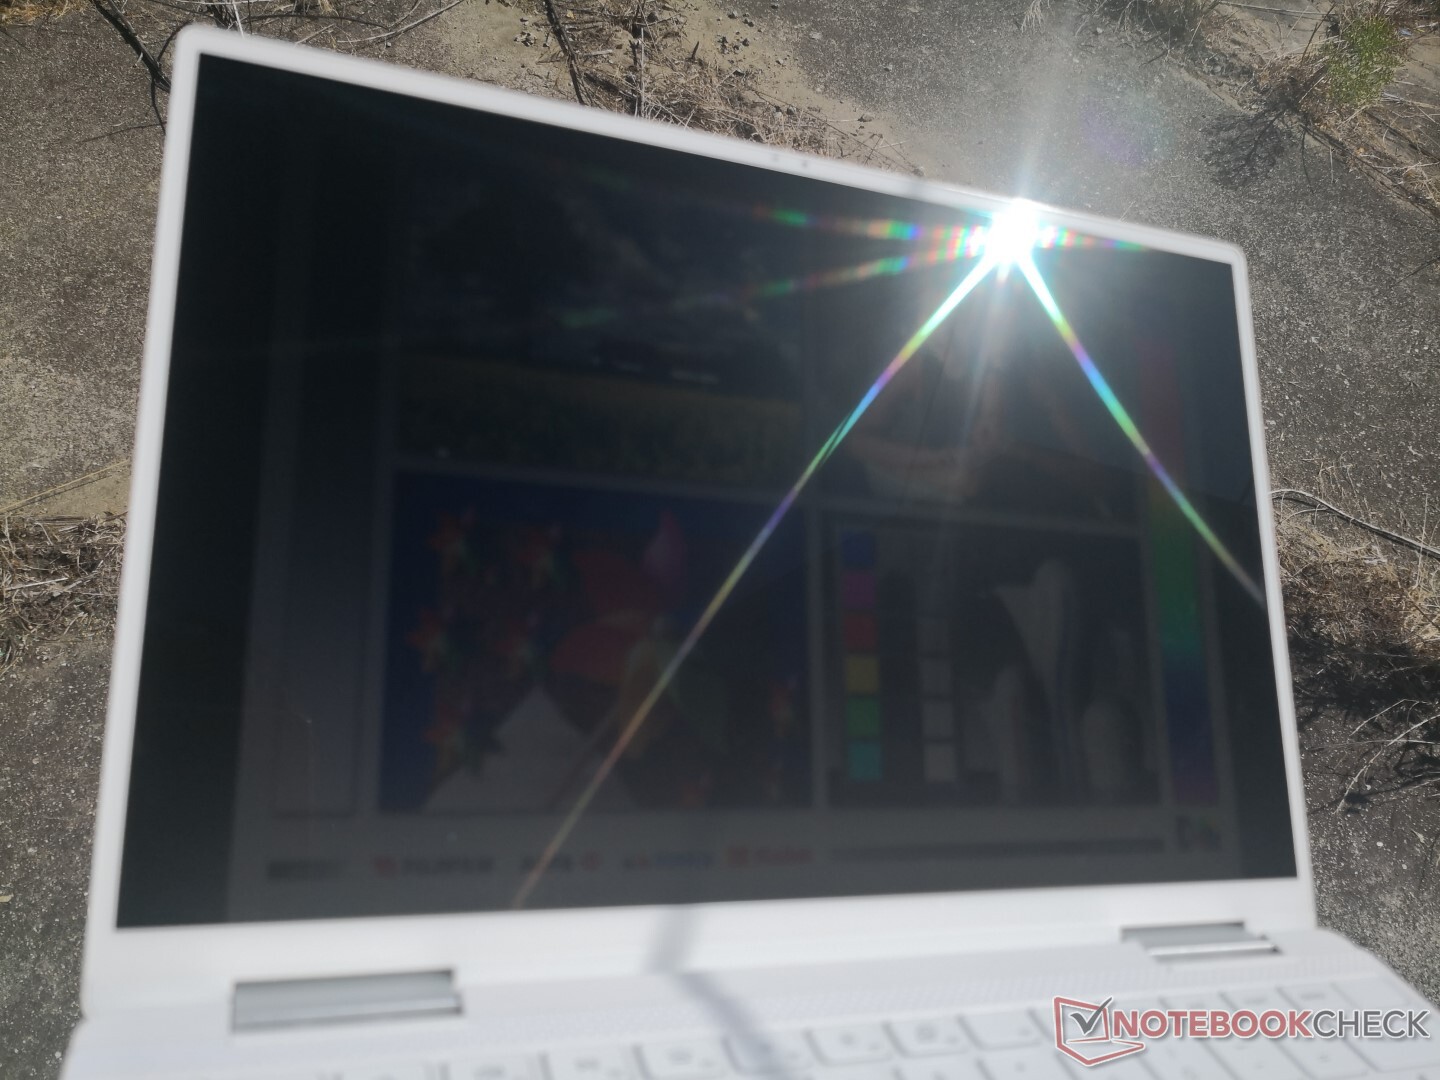
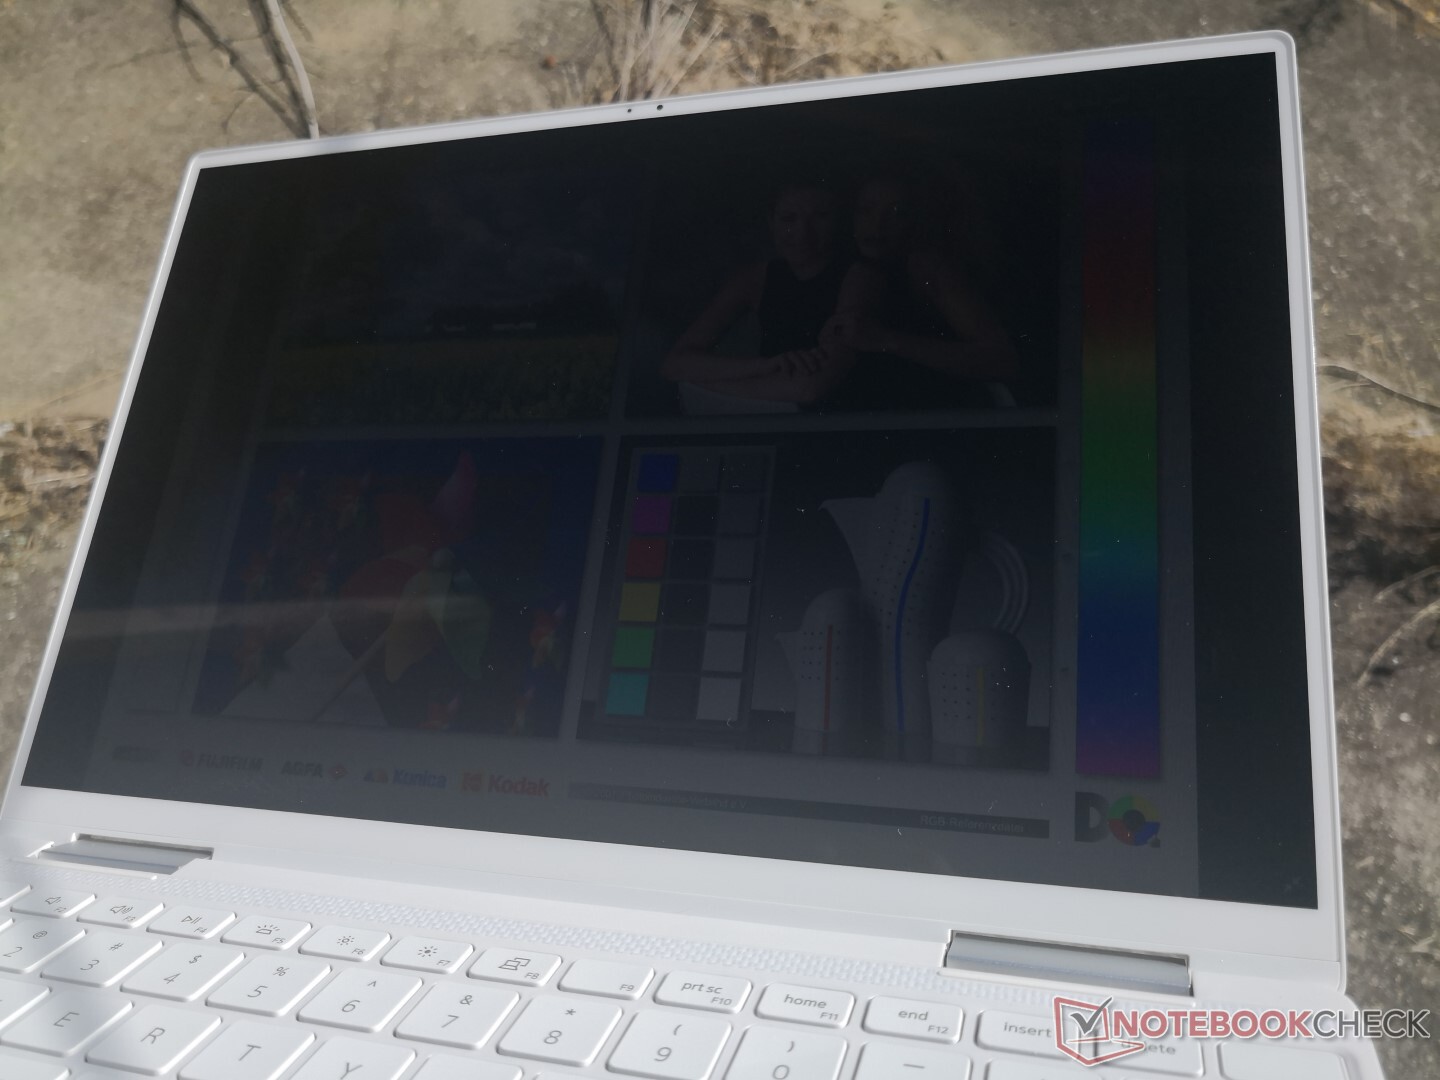
Display: Brighter Than Most Ultrabooks
The crisp 16:10 display remains identical to the one on the Core i3 SKU down to the Sharp LQ134N1 panel name. Consequently, our measurements on contrast, response times, brightness, and gamut are quite similar between the two configurations. We'll have to check out the 4K UHD SKU at a later date when stock becomes more readily available.
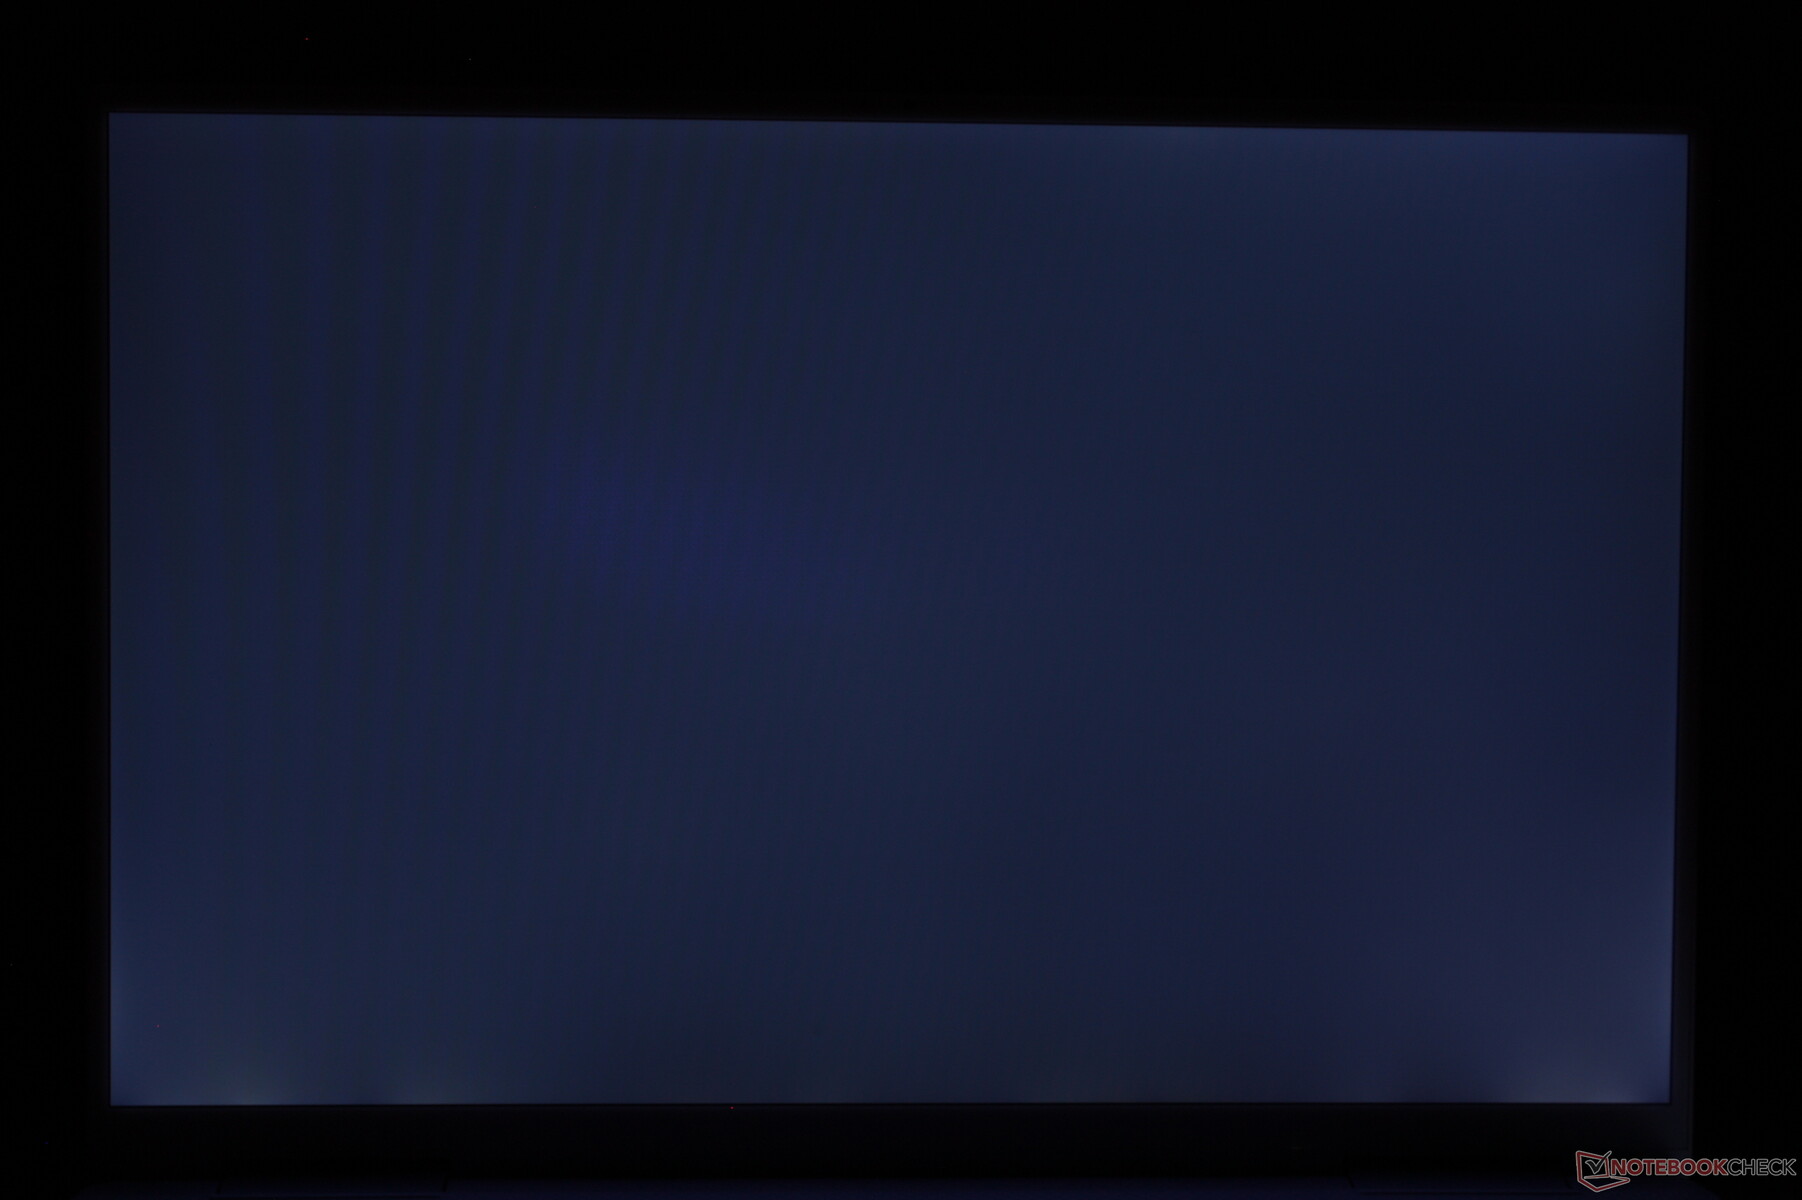
The one main difference we can notice between our Core i3 and Core i7 SKUs is that the latter suffers from slightly more uneven backlight bleeding. We recommend checking for this just in case if you happen to be on the receiving end of a particularly bad unit.

| |||||||||||||||||||||||||
Brightness Distribution: 86 %
Center on Battery: 549.8 cd/m²
Contrast: 1410:1 (Black: 0.39 cd/m²)
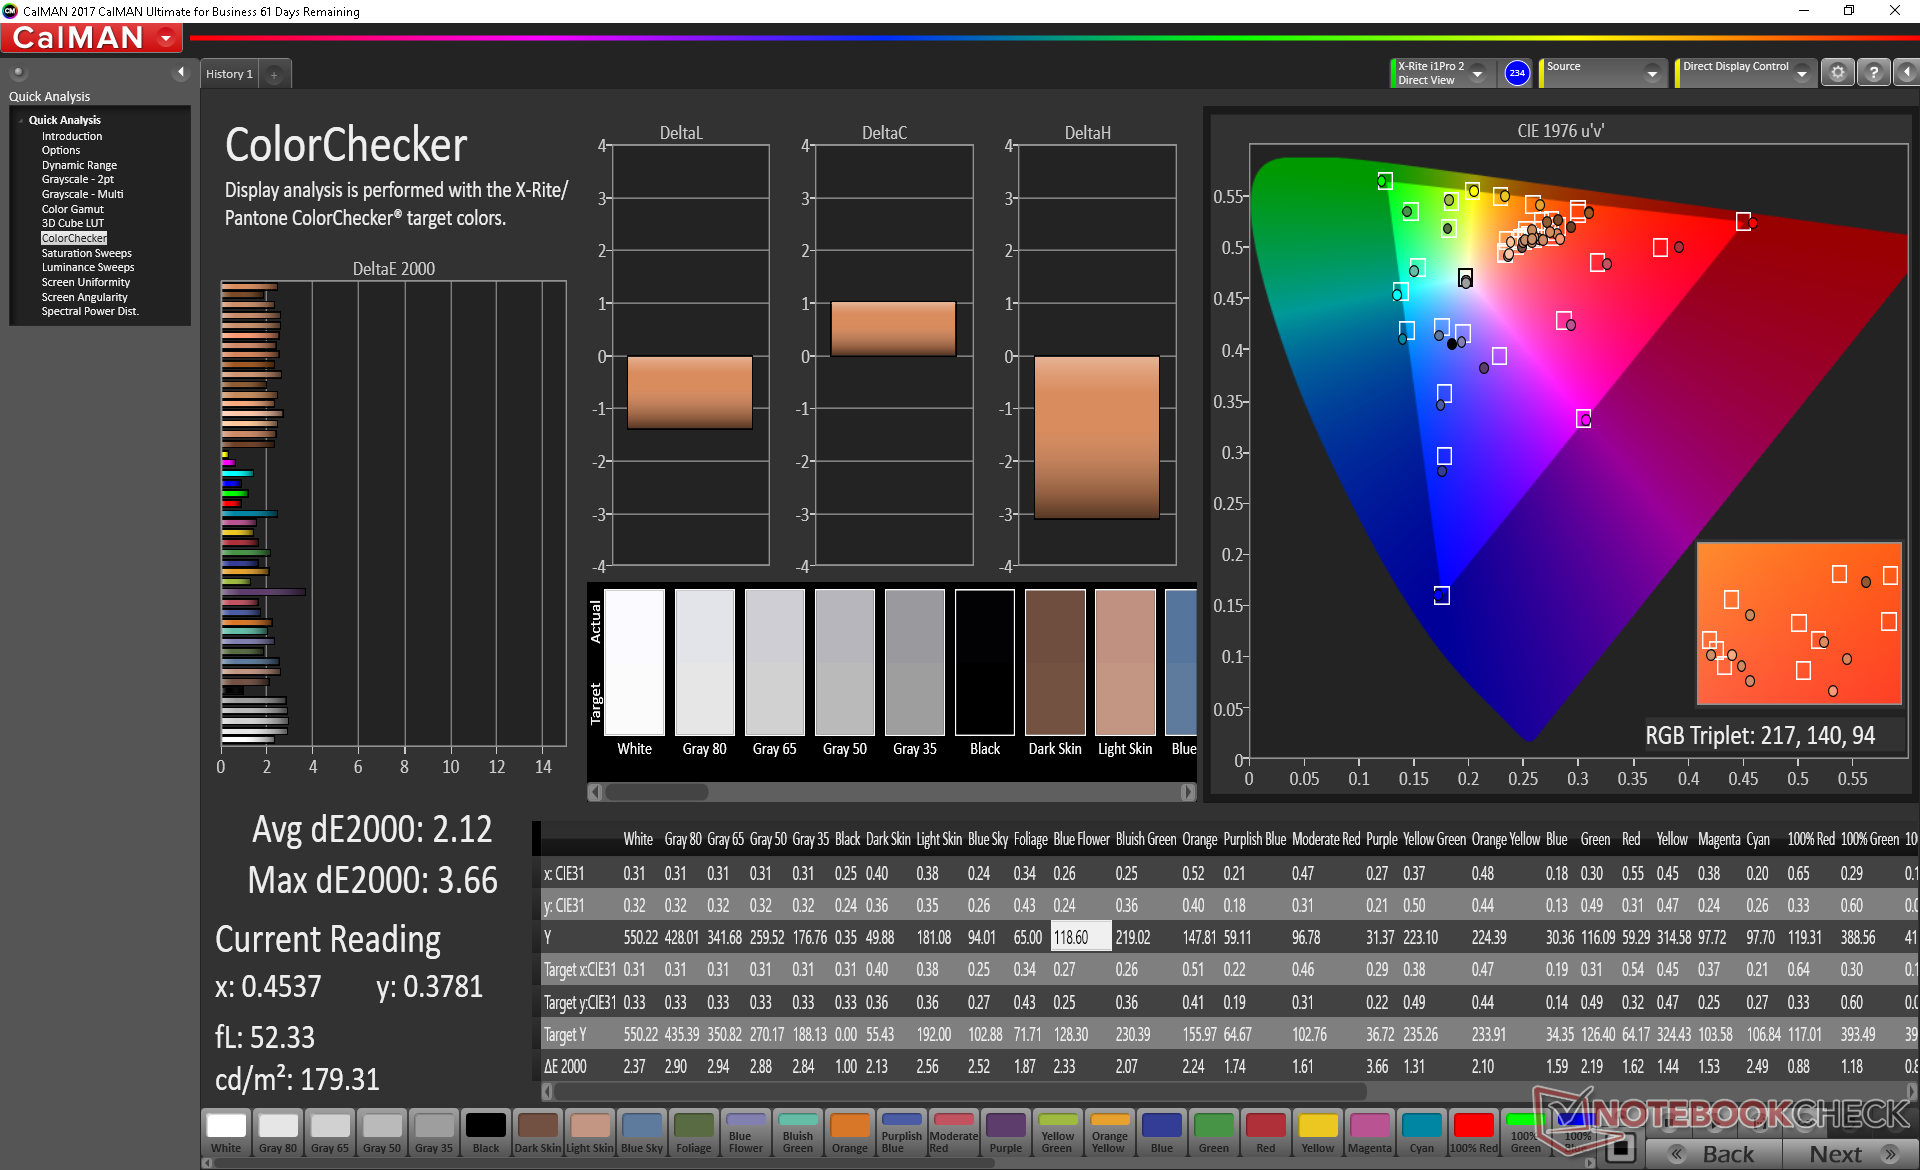
ΔE ColorChecker Calman: 2.12 | ∀{0.5-29.43 Ø4.72}
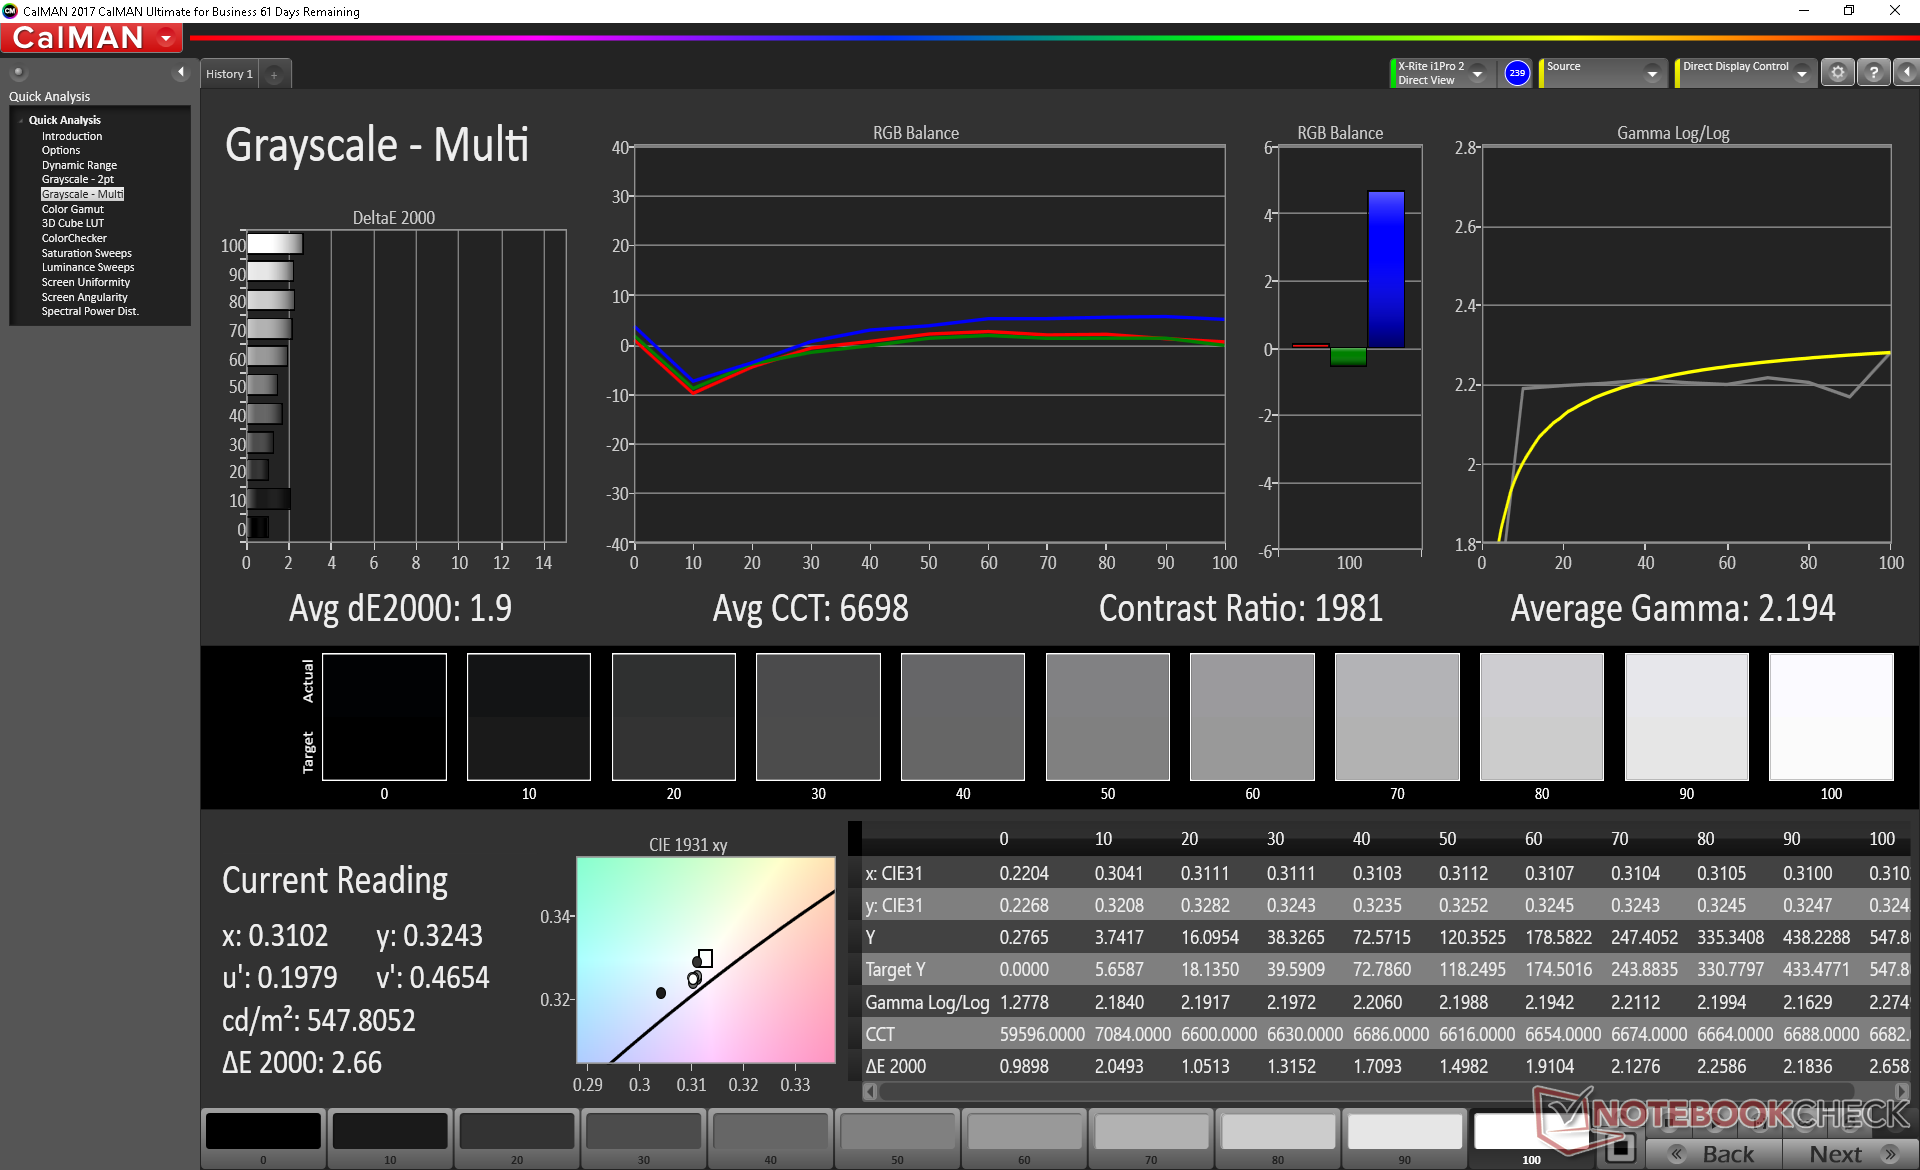
calibrated: 1.37
ΔE Greyscale Calman: 2.6 | ∀{0.09-98 Ø4.97}
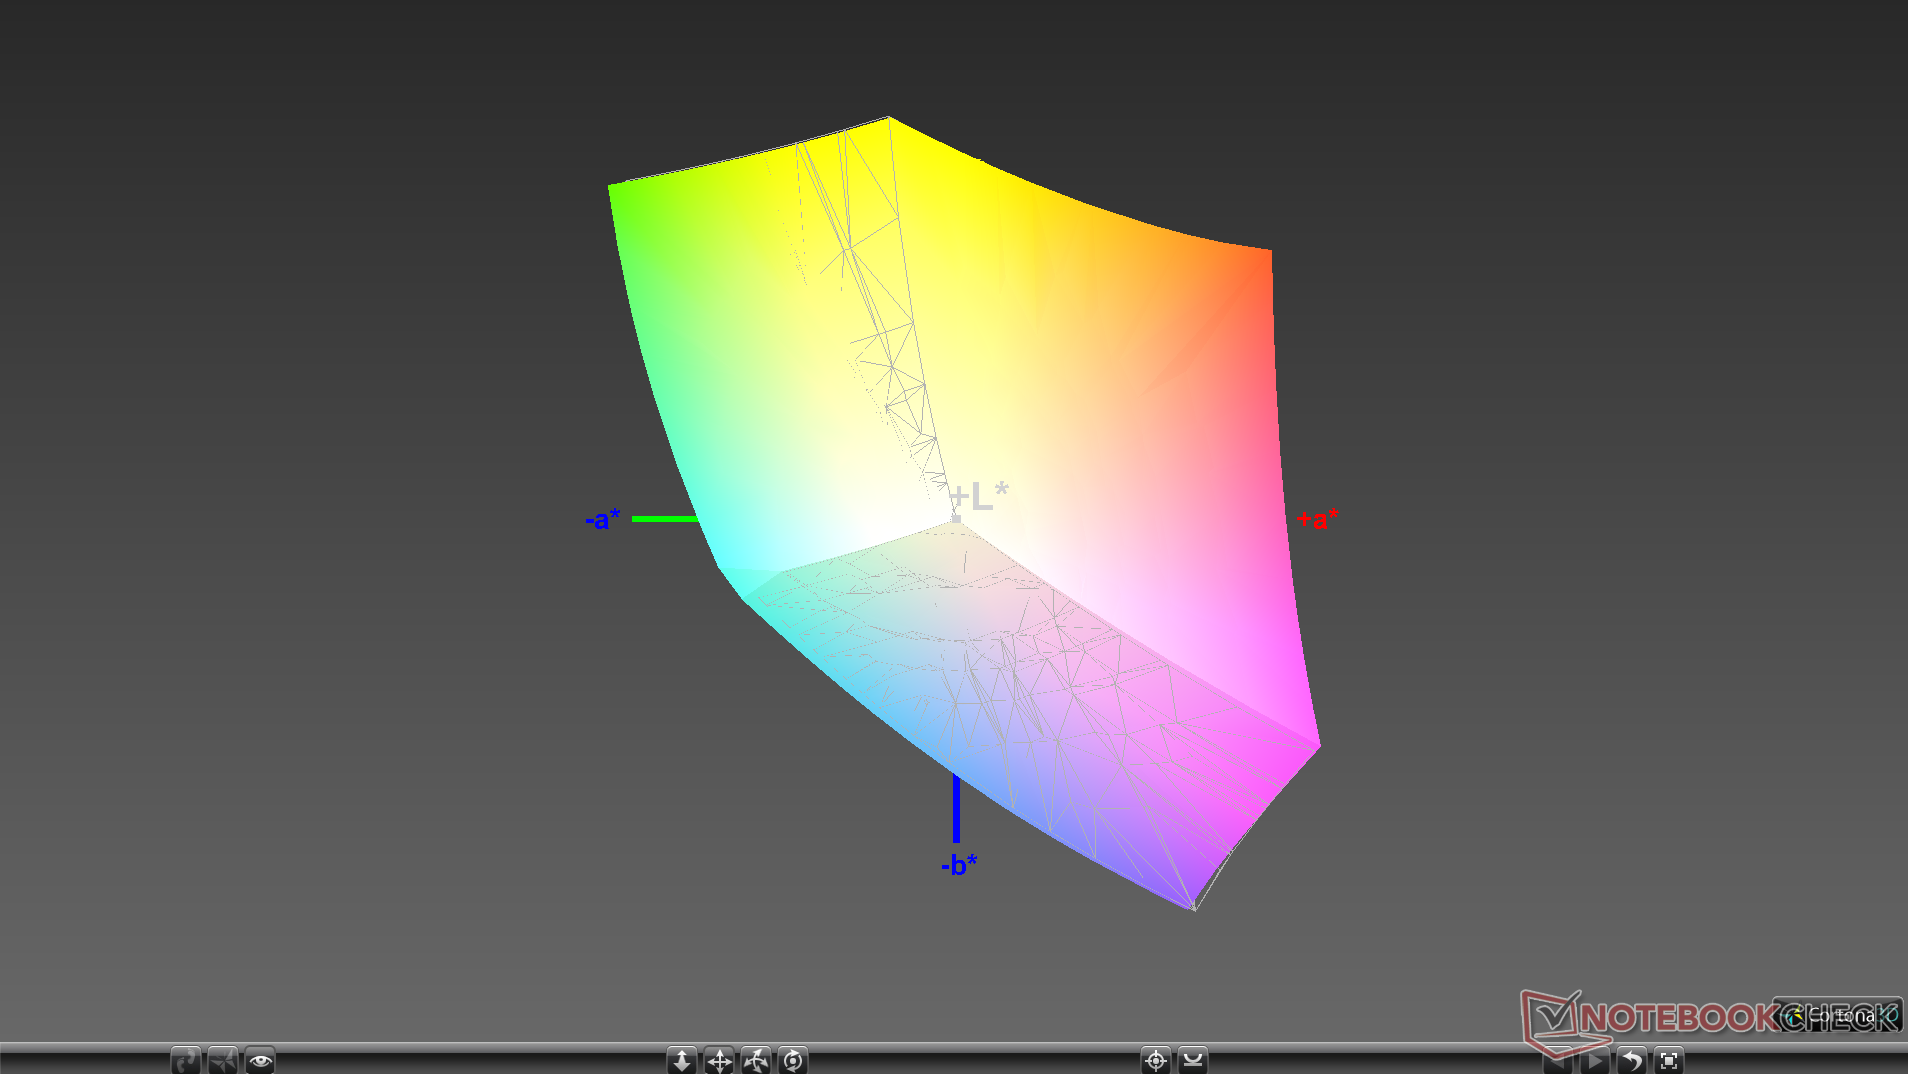
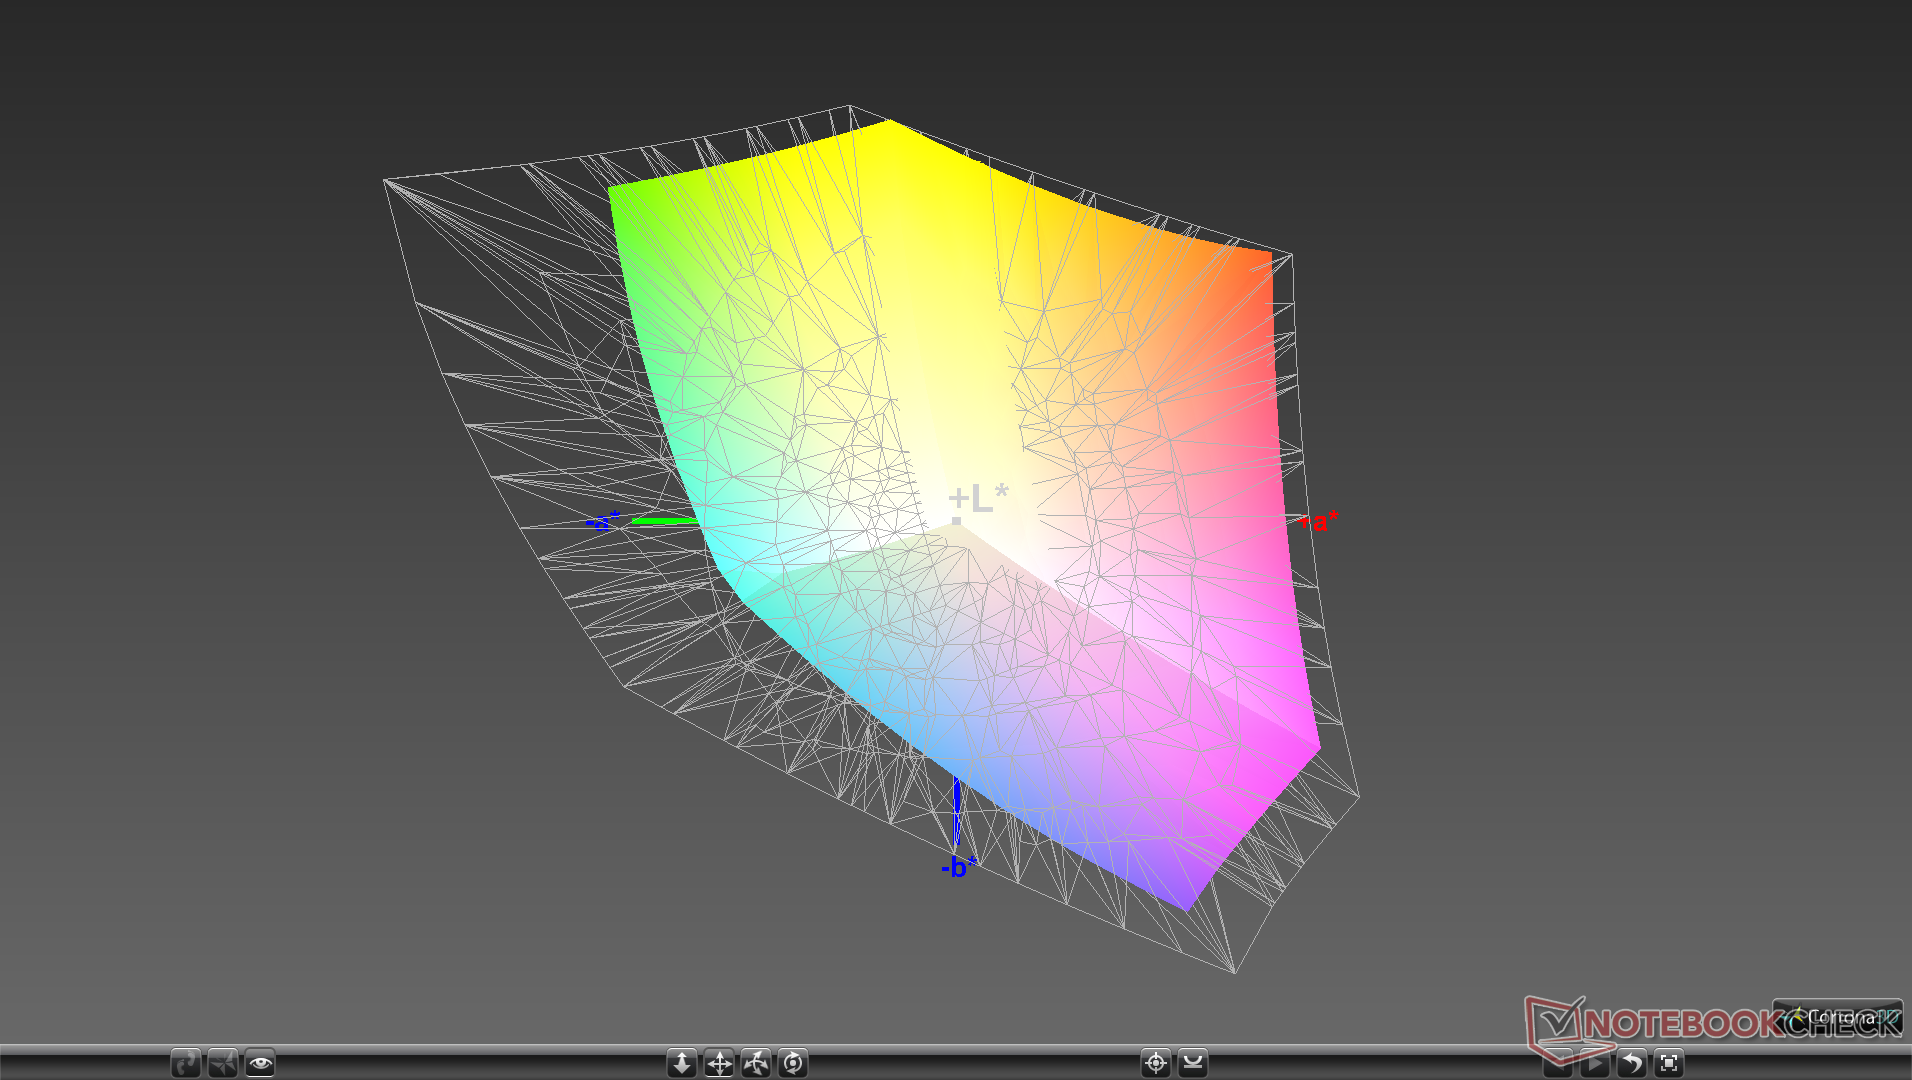
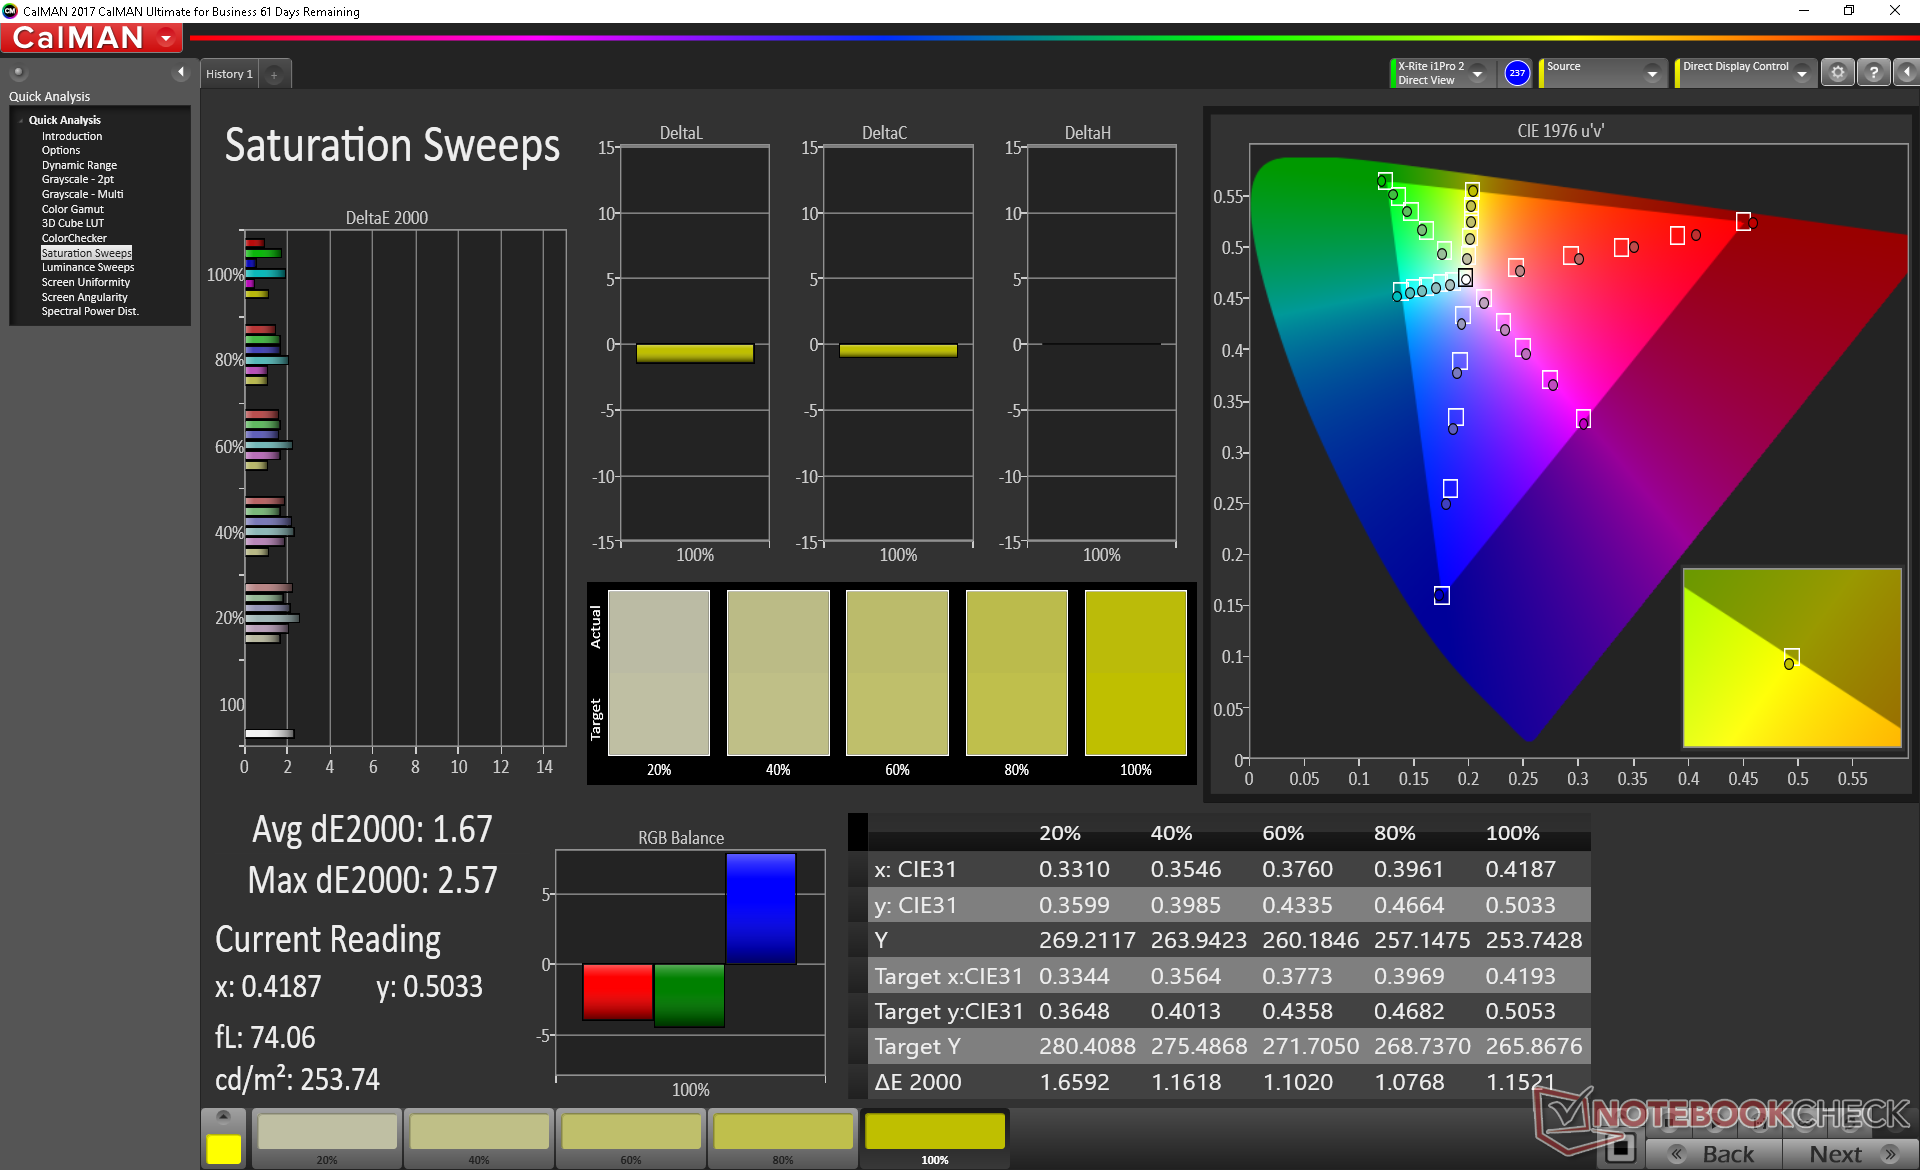
99.7% sRGB (Argyll 1.6.3 3D)
65.4% AdobeRGB 1998 (Argyll 1.6.3 3D)
71.5% AdobeRGB 1998 (Argyll 3D)
99.2% sRGB (Argyll 3D)
69.9% Display P3 (Argyll 3D)
Gamma: 2.3
CCT: 6884 K
| Dell XPS 13 7390 2-in-1 Core i7 Sharp LQ134N1, IPS, 13.4", 1920x1200 | Dell XPS 13 7390 2-in-1 Core i3 Sharp LQ134N1, IPS, 13.4", 1920x1200 | Dell XPS 13 9380 2019 ID: AUO 282B B133ZAN Dell: 90NTH, IPS, 13.3", 3840x2160 | Dell XPS 13 9370 FHD i5 SHP1484, IPS, 13.3", 1920x1080 | Dell XPS 13 9360 FHD i7 Iris SHP1449, IPS, 13.3", 1920x1080 | Dell XPS 13-9365 2-in-1 IPS, 13.3", 1920x1080 | |
|---|---|---|---|---|---|---|
| Display | -2% | -7% | -2% | -24% | -31% | |
| Display P3 Coverage (%) | 69.9 | 68.6 -2% | 64.7 -7% | 68.9 -1% | 51.6 -26% | 47.32 -32% |
| sRGB Coverage (%) | 99.2 | 98.2 -1% | 93.1 -6% | 96.6 -3% | 77.4 -22% | 71.1 -28% |
| AdobeRGB 1998 Coverage (%) | 71.5 | 70.4 -2% | 65.3 -9% | 69.6 -3% | 53.3 -25% | 48.83 -32% |
| Response Times | -6% | -23% | -44% | 5% | -7% | |
| Response Time Grey 50% / Grey 80% * (ms) | 47.6 ? | 46 ? 3% | 58 ? -22% | 62.4 ? -31% | 41.2 ? 13% | 48 ? -1% |
| Response Time Black / White * (ms) | 29.2 ? | 33.6 ? -15% | 36 ? -23% | 45.6 ? -56% | 30 ? -3% | 32.8 ? -12% |
| PWM Frequency (Hz) | 2500 ? | 2525 ? | 1008 ? | 19530 ? | 1042 ? | |
| Screen | 6% | -35% | -25% | -47% | -74% | |
| Brightness middle (cd/m²) | 549.8 | 576.3 5% | 404 -27% | 428 -22% | 461 -16% | 322.6 -41% |
| Brightness (cd/m²) | 520 | 555 7% | 389 -25% | 405 -22% | 418 -20% | 306 -41% |
| Brightness Distribution (%) | 86 | 88 2% | 85 -1% | 87 1% | 85 -1% | 91 6% |
| Black Level * (cd/m²) | 0.39 | 0.33 15% | 0.37 5% | 0.26 33% | 0.2 49% | 0.19 51% |
| Contrast (:1) | 1410 | 1746 24% | 1092 -23% | 1646 17% | 2305 63% | 1698 20% |
| Colorchecker dE 2000 * | 2.12 | 1.45 32% | 3.72 -75% | 3.8 -79% | 5.4 -155% | 7.7 -263% |
| Colorchecker dE 2000 max. * | 3.66 | 4.12 -13% | 7.38 -102% | 7.2 -97% | 12.2 -233% | 11.1 -203% |
| Colorchecker dE 2000 calibrated * | 1.37 | 1.19 13% | 2.06 -50% | |||
| Greyscale dE 2000 * | 2.6 | 3.1 -19% | 4.44 -71% | 4.4 -69% | 5.4 -108% | 7.9 -204% |
| Gamma | 2.3 96% | 2.27 97% | 2.34 94% | 2.21 100% | 2.15 102% | 2.88 76% |
| CCT | 6884 94% | 6931 94% | 7095 92% | 7067 92% | 7258 90% | 7044 92% |
| Color Space (Percent of AdobeRGB 1998) (%) | 65.4 | 64.2 -2% | 60 -8% | 62.8 -4% | 48.6 -26% | 44.1 -33% |
| Color Space (Percent of sRGB) (%) | 99.7 | 98.5 -1% | 93 -7% | 96.4 -3% | 76.9 -23% | 69.9 -30% |
| Total Average (Program / Settings) | -1% /
3% | -22% /
-28% | -24% /
-23% | -22% /
-36% | -37% /
-56% |
* ... smaller is better
Display Response Times
| ↔ Response Time Black to White | ||
|---|---|---|
| 29.2 ms ... rise ↗ and fall ↘ combined | ↗ 16 ms rise | 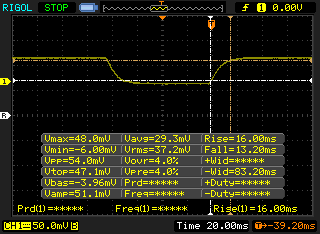 |
| ↘ 13.2 ms fall | ||
| The screen shows relatively slow response rates in our tests and may be too slow for gamers. In comparison, all tested devices range from 0.1 (minimum) to 240 (maximum) ms. » 78 % of all devices are better. This means that the measured response time is worse than the average of all tested devices (19.8 ms). | ||
| ↔ Response Time 50% Grey to 80% Grey | ||
| 47.6 ms ... rise ↗ and fall ↘ combined | ↗ 23.2 ms rise | 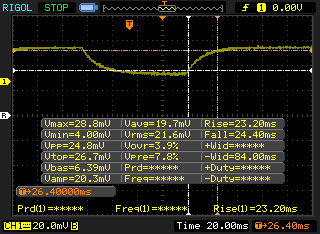 |
| ↘ 24.4 ms fall | ||
| The screen shows slow response rates in our tests and will be unsatisfactory for gamers. In comparison, all tested devices range from 0.165 (minimum) to 636 (maximum) ms. » 82 % of all devices are better. This means that the measured response time is worse than the average of all tested devices (31 ms). | ||
Screen Flickering / PWM (Pulse-Width Modulation)
| Screen flickering / PWM detected | 2500 Hz | ≤ 25 % brightness setting | 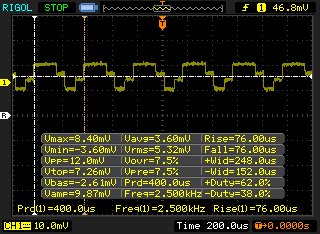 |
The display backlight flickers at 2500 Hz (worst case, e.g., utilizing PWM) Flickering detected at a brightness setting of 25 % and below. There should be no flickering or PWM above this brightness setting. The frequency of 2500 Hz is quite high, so most users sensitive to PWM should not notice any flickering. In comparison: 52 % of all tested devices do not use PWM to dim the display. If PWM was detected, an average of 7781 (minimum: 5 - maximum: 343500) Hz was measured. | |||

Performance
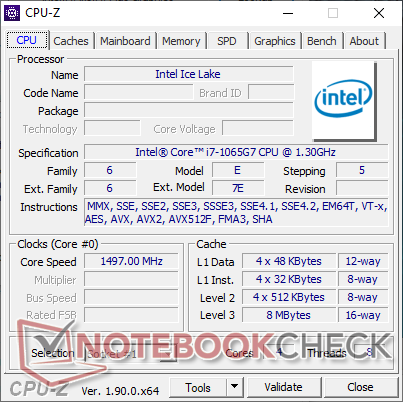
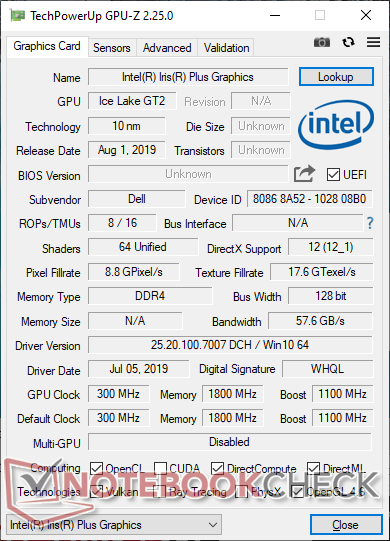
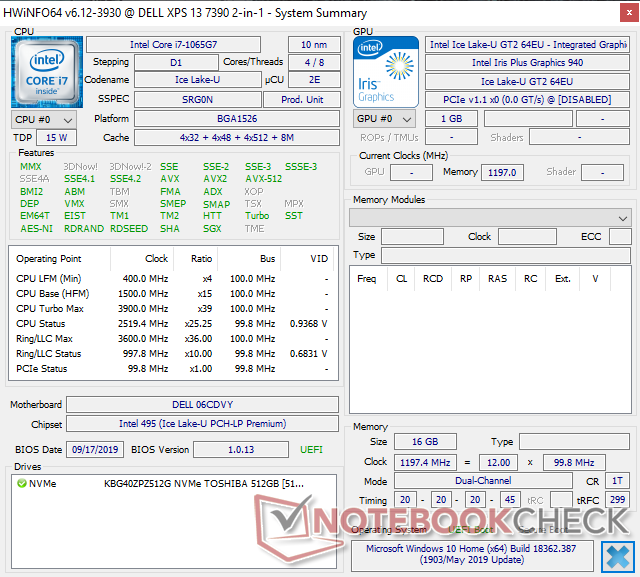
The 10th gen Core i7-1065G7 succeeds the 9th gen Core i7-8565U by offering both faster CPU performance and significantly faster integrated graphics performance. The Dell convertibles utilizes the faster 25 W version of the i7-1065G7 instead of the 15 W version to better exploit what the processor is capable of. See our overview of the Core i7-1065G7 to find out more about Intel's latest CPU.
Users crossing their fingers for Comet Lake-U options in the future will be out of luck as the XPS 13 7390 2-in-1 was designed specifically for Ice Lake. Dell has stated that there are no plans at the moment to introduce hexa-core Comet Lake-U options to the XPS 13 2-in-1 and so it remains exclusive to the XPS 13 7390 clamshell.
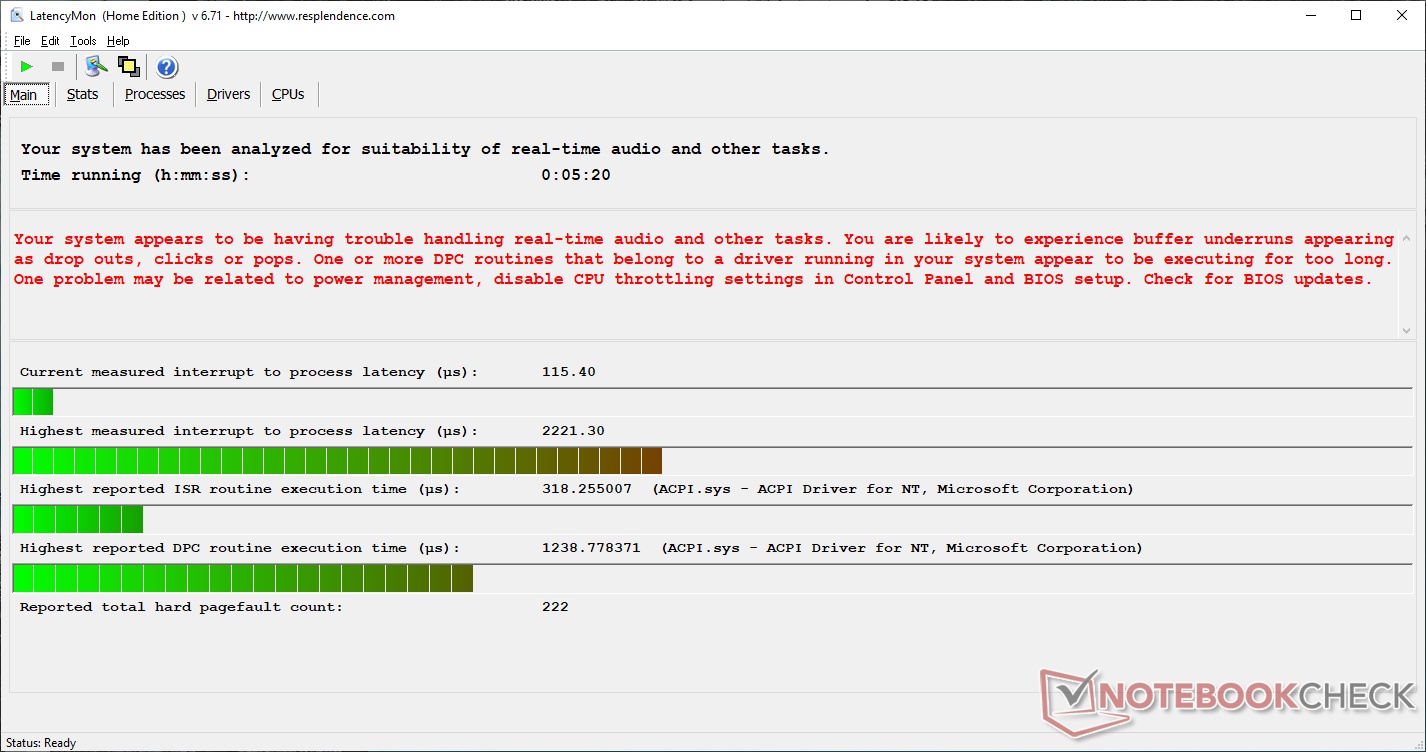
LatencyMon continues to show DPC latency issues even when the wireless is disabled.
Processor: A Leap Over 9th Generation Whiskey Lake-U
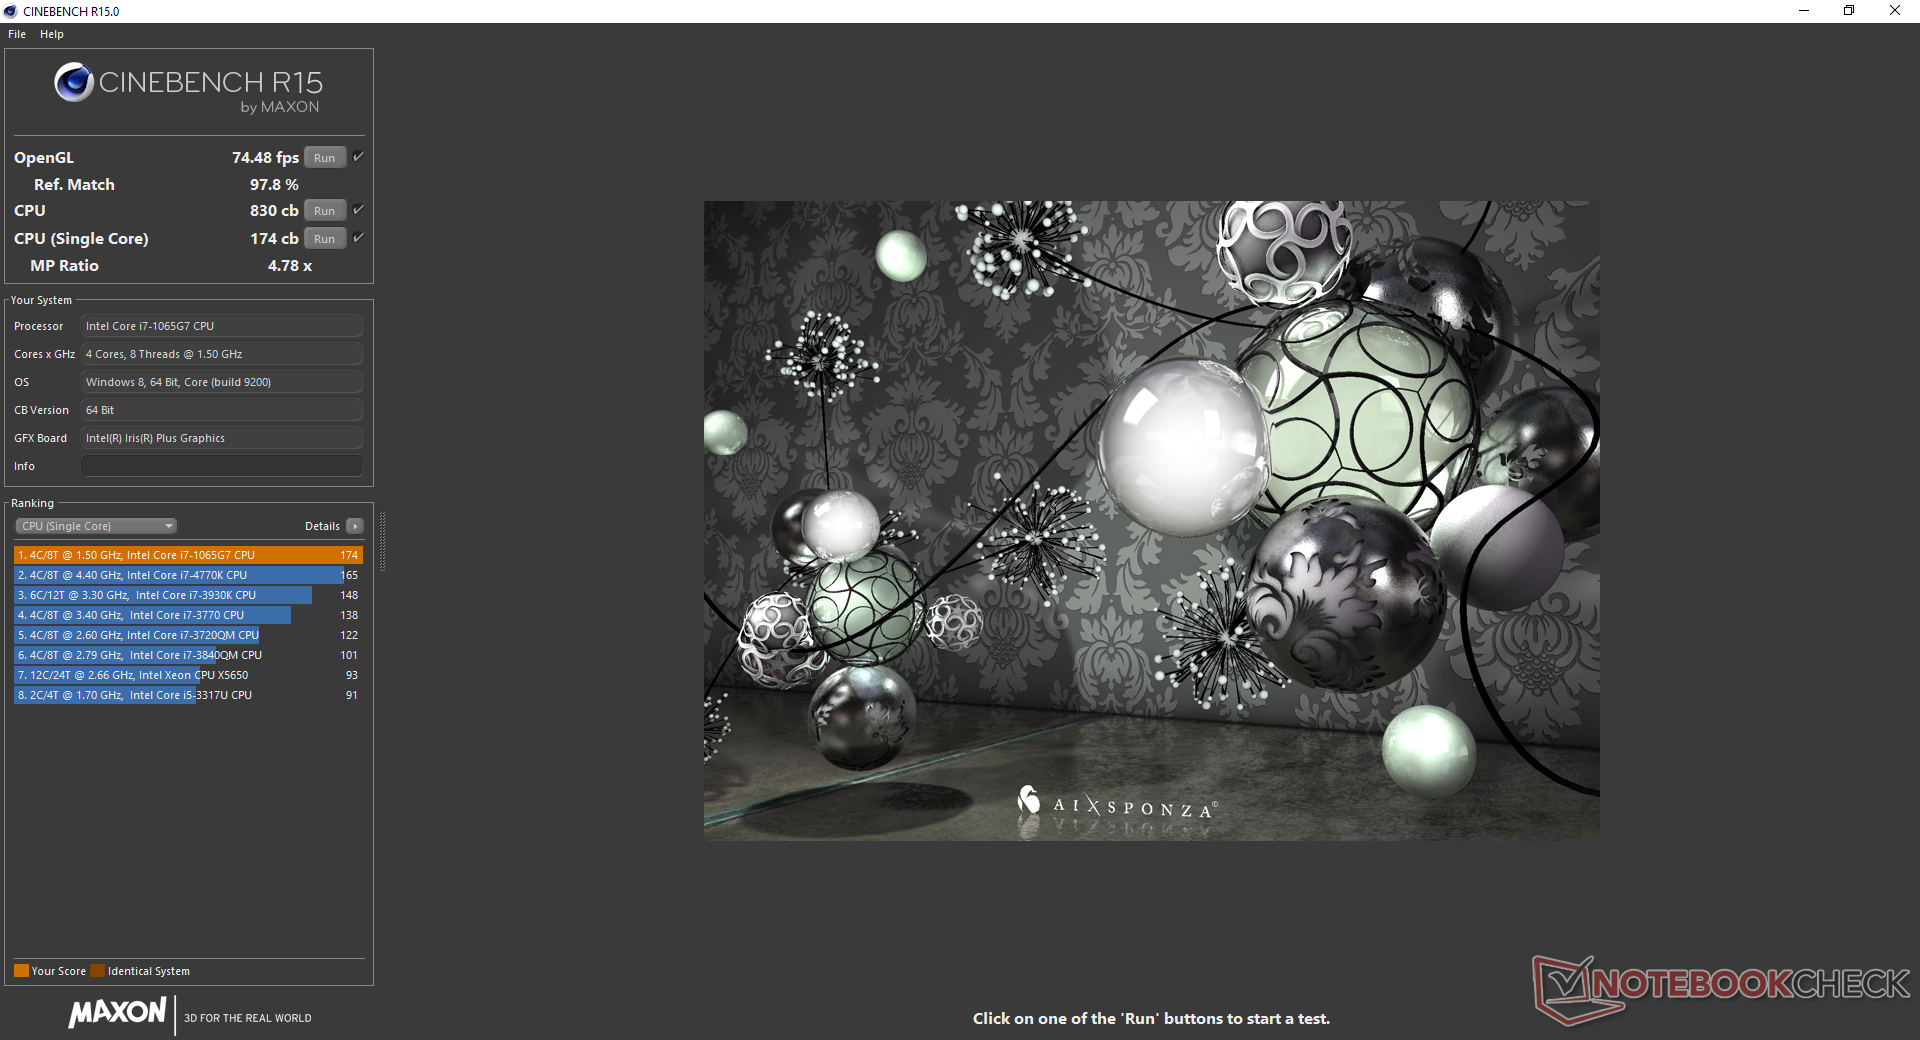
Raw processor performance is very high relative to the chassis size. When running CineBench R15 Multi-Thread in a loop, results are essentially on par with the Core i5-9300H in the XPS 15 for the first four loops when Turbo Boost clock rates are highest. Eventually, however, clock rates will drop in order to maintain acceptable temperatures for a performance decrease of almost 20 percent. In other words, processor performance starts out very fast for excellent first impressions before falling rather steeply to be just below the pre-production Core i7-1065G7 unit we tested a few months ago. In contrast, the XPS 13 7390 2-in-1 Core i3-1005G1 SKU does not experience any sharp drops in performance over time since its Turbo Boost clock rates are more modest.
Even after accounting for any throttling, the 25 W Core i7 Ice Lake is still faster than its 15 W Whiskey Lake-U predecessor. Raw performance is about 35 percent faster than the Core i7-8565U as found on the less expensive Dell Inspiron 7390 2-in-1 while being more stable than on the XPS 13 9380.
Beyond just raw performance, Ice Lake also introduces AI acceleration and Deep Learning Boost not found on any previous generation Core U series CPU or even the latest 2nd generation AMD Zen+ series. Nonetheless. the practicality of this feature has yet to be fully explored in Windows to really impact any day-to-day usage scenarios.
See our dedicated page on the Core i7-1065G7 for more technical information and benchmark comparisons.
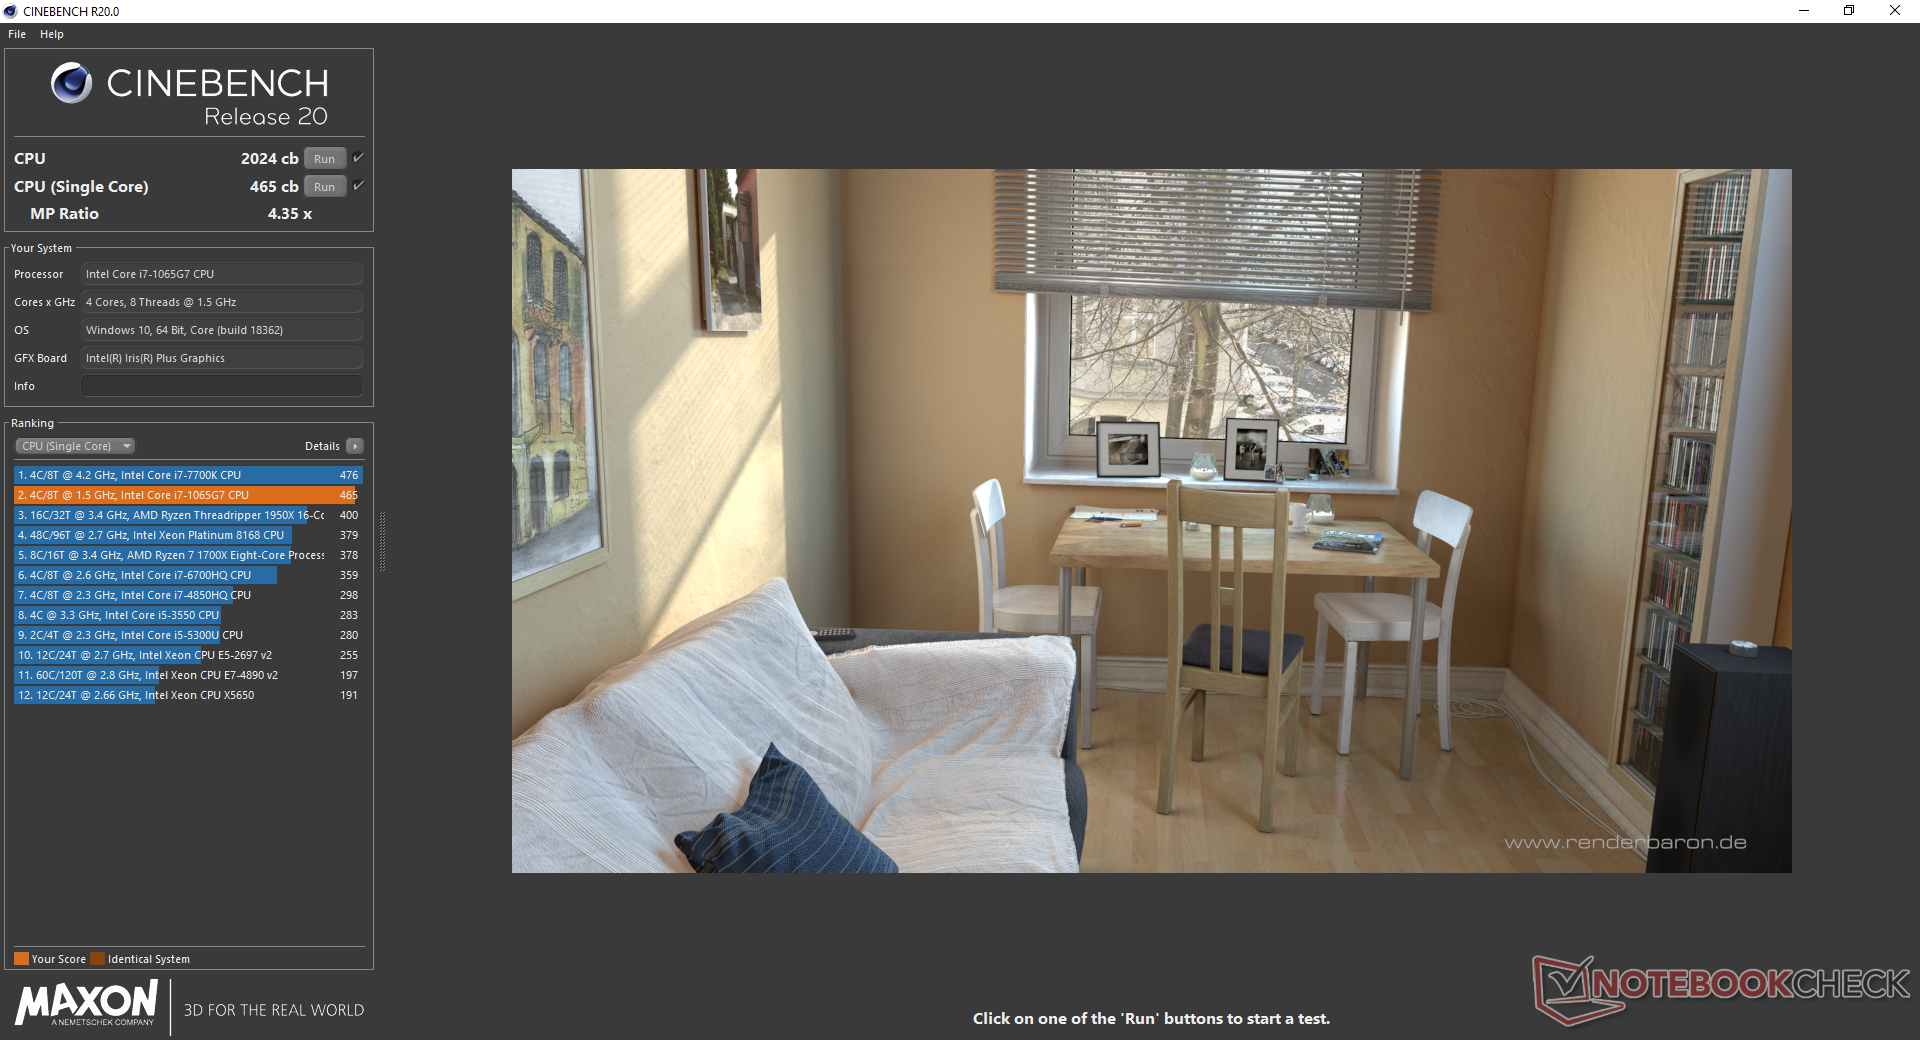
| Cinebench R20 | |
| CPU (Single Core) | |
| Dell XPS 13 7390 2-in-1 Core i7 | |
| Intel SDS Core i7-1065G7 Preliminary Sample 25 W | |
| Dell XPS 15 7590 9980HK GTX 1650 | |
| Intel SDS Core i7-1065G7 Preliminary Sample 15 W | |
| Average Intel Core i7-1065G7 (358 - 474, n=31) | |
| Dell G5 15 5590 | |
| Dell XPS 13 7390 2-in-1 Core i3 | |
| Dell Latitude 14 5495 | |
| Dell Inspiron 15 5000 5585 | |
| CPU (Multi Core) | |
| Dell XPS 15 7590 9980HK GTX 1650 | |
| Dell G5 15 5590 | |
| Dell XPS 13 7390 2-in-1 Core i7 | |
| Intel SDS Core i7-1065G7 Preliminary Sample 25 W | |
| Average Intel Core i7-1065G7 (1081 - 2024, n=31) | |
| Dell Inspiron 15 5000 5585 | |
| Dell Latitude 14 5495 | |
| Intel SDS Core i7-1065G7 Preliminary Sample 15 W | |
| Dell XPS 13 7390 2-in-1 Core i3 | |
System Performance: Faster Than It Looks
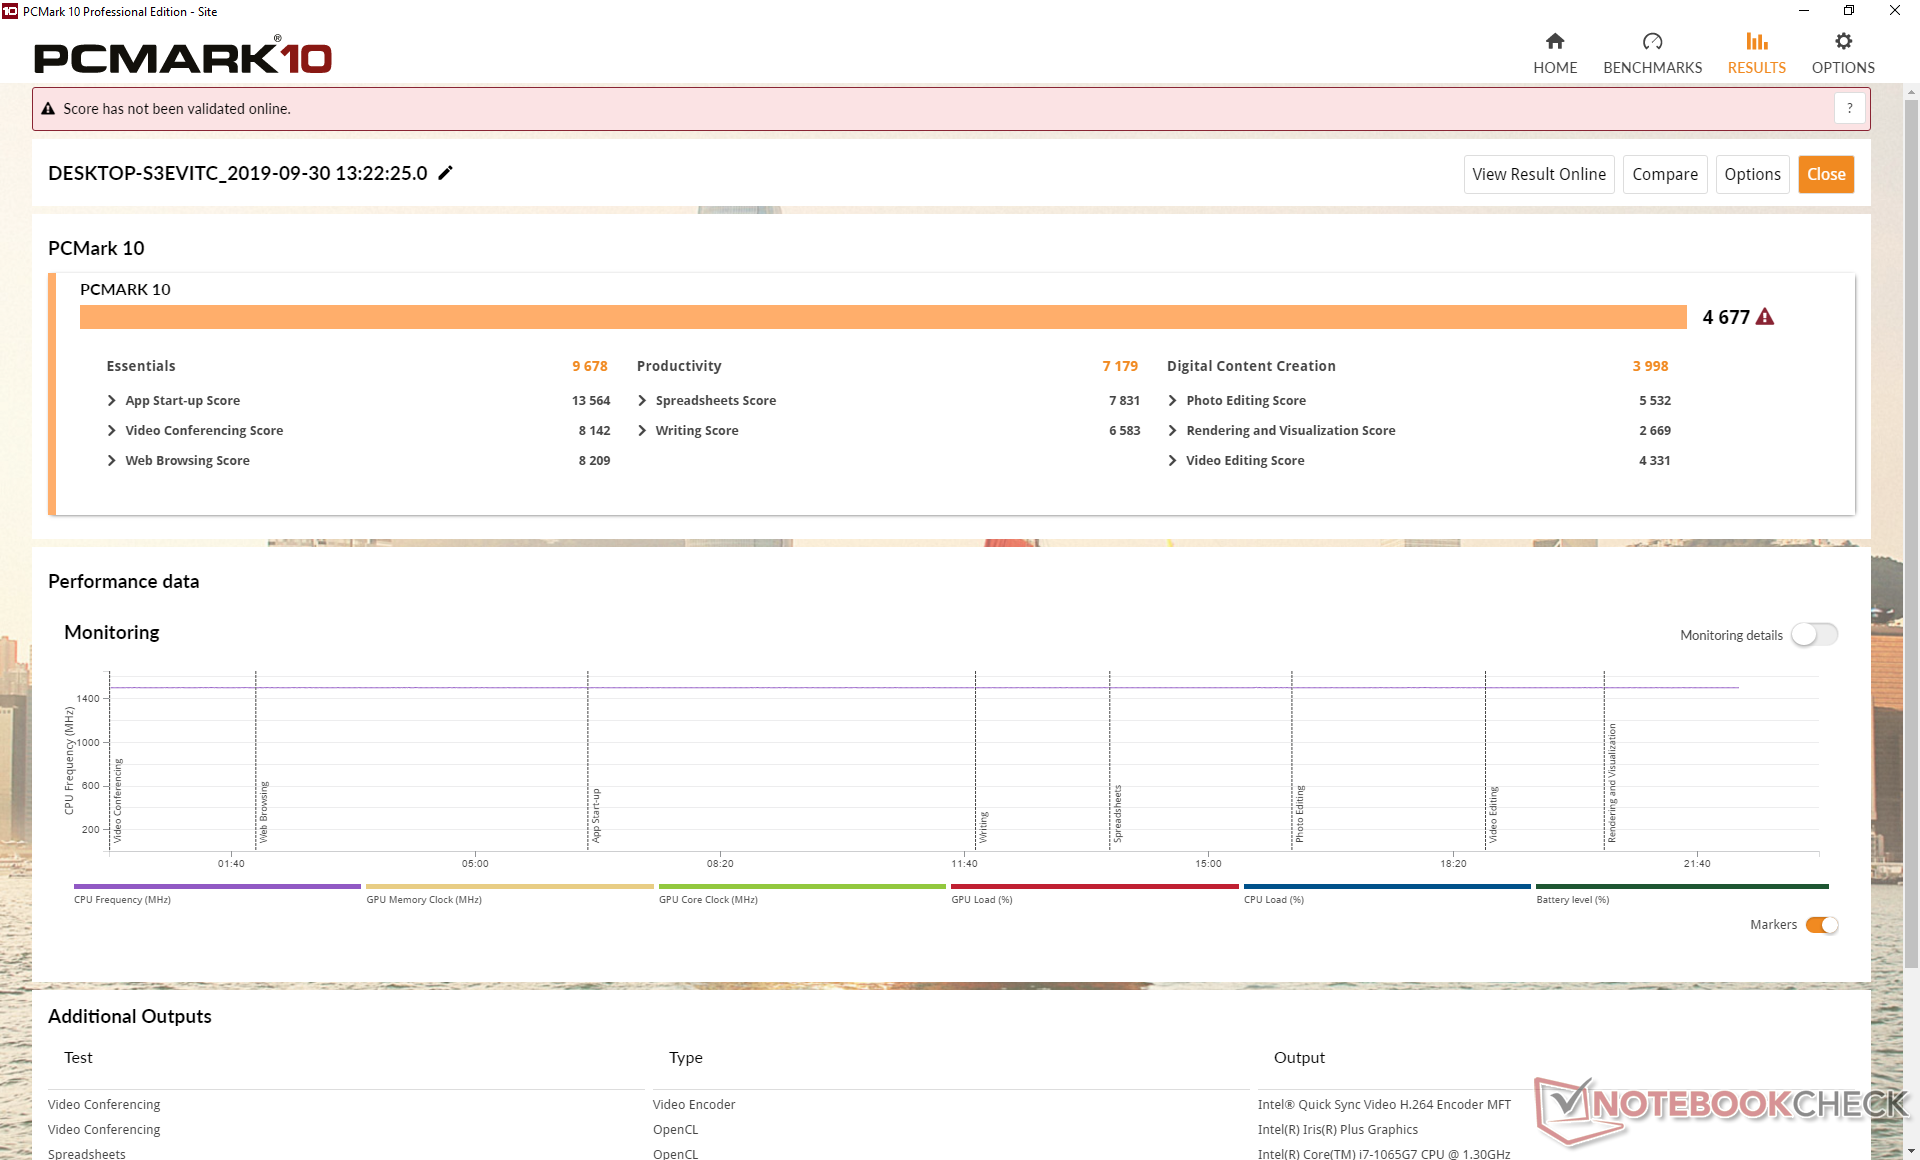
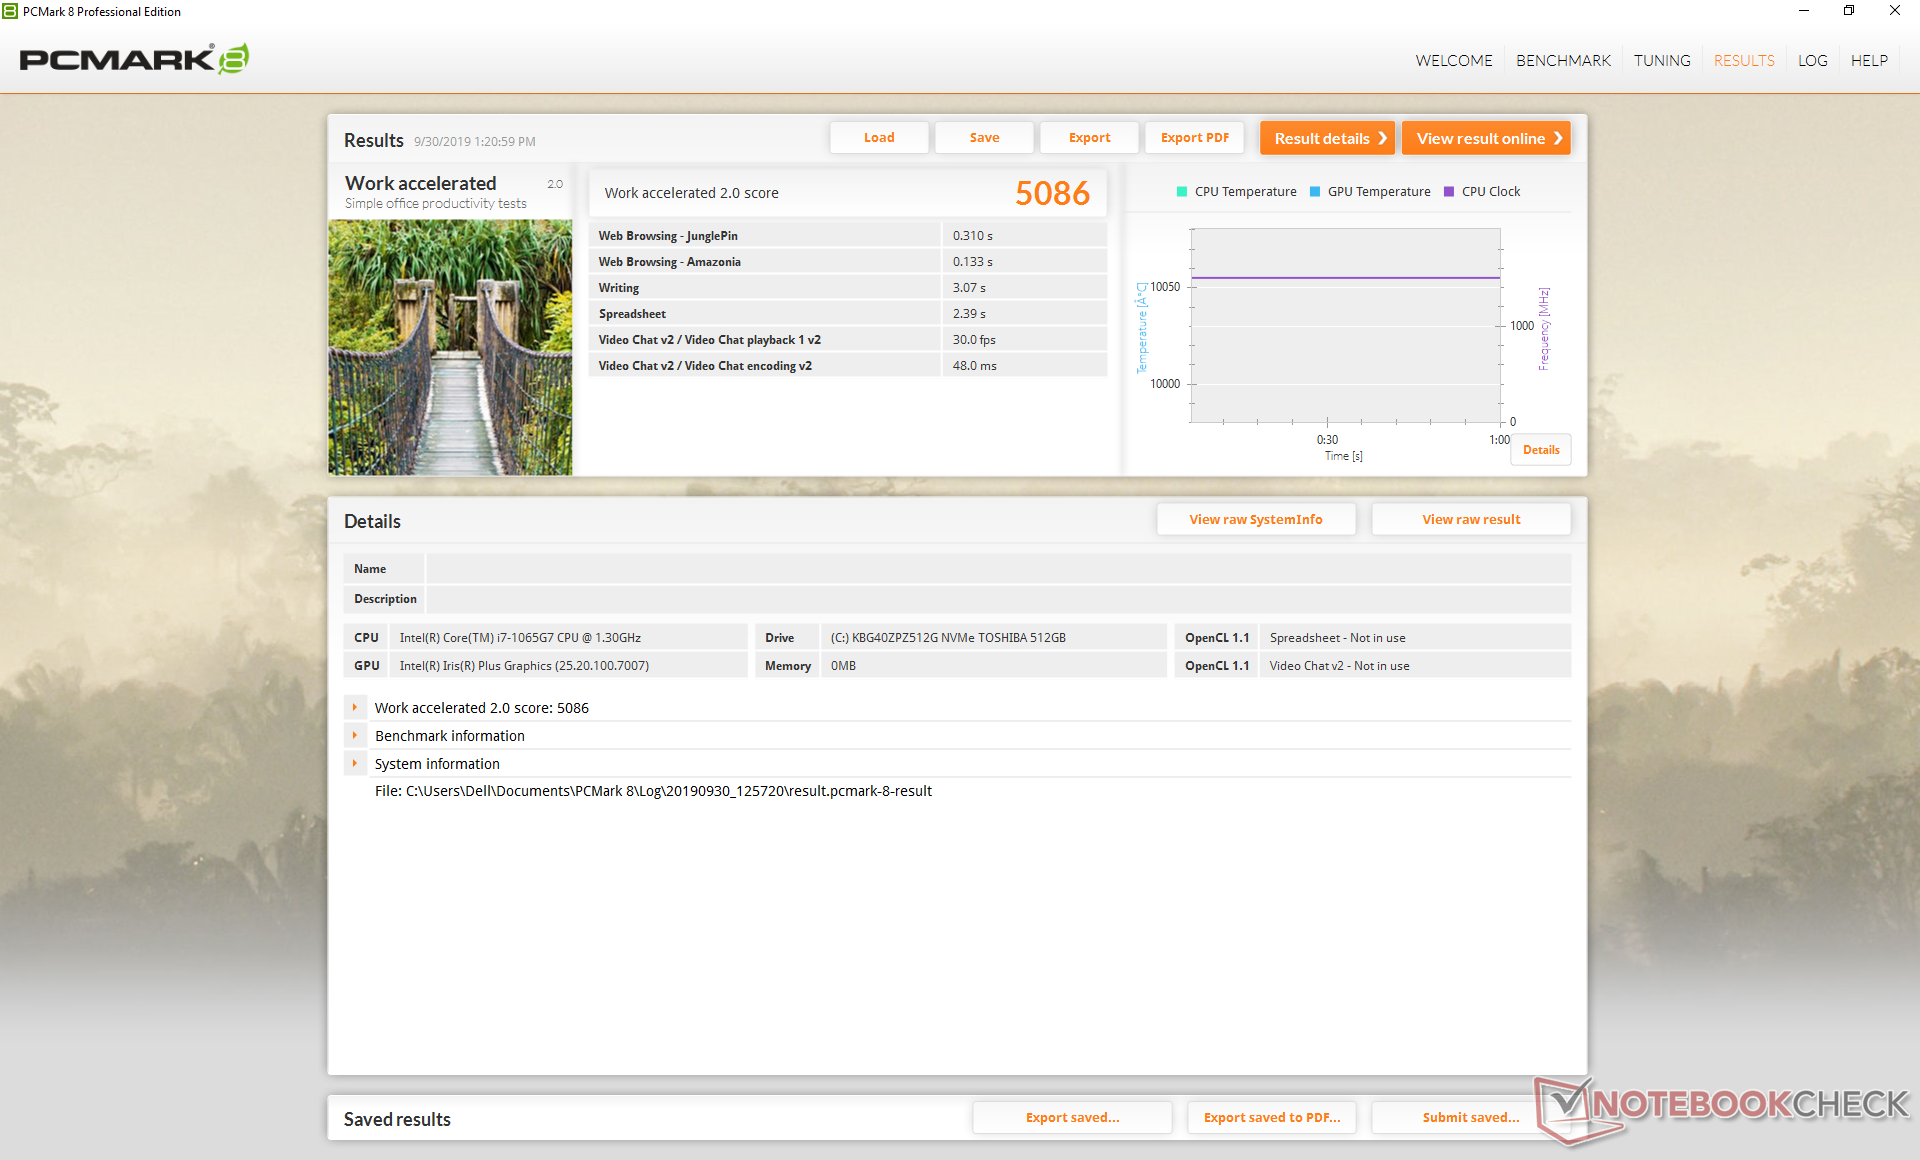
PCMark benchmarks show our XPS 13 7390 2-in-1 Core i7 outperforming the Core i3 SKU by 20 to 50 percent. The biggest advantage is in the GPU-intensive Digital Creation benchmark where the integrated Iris Plus GPU is able to flex its muscles over the UHD Graphics G1 of the Core i3 SKU. In fact, overall results are faster than even the fastest XPS 13 9380 configuration available.
The unit doesn't exhibit any audio or USB problems that our last Core i3 unit did.
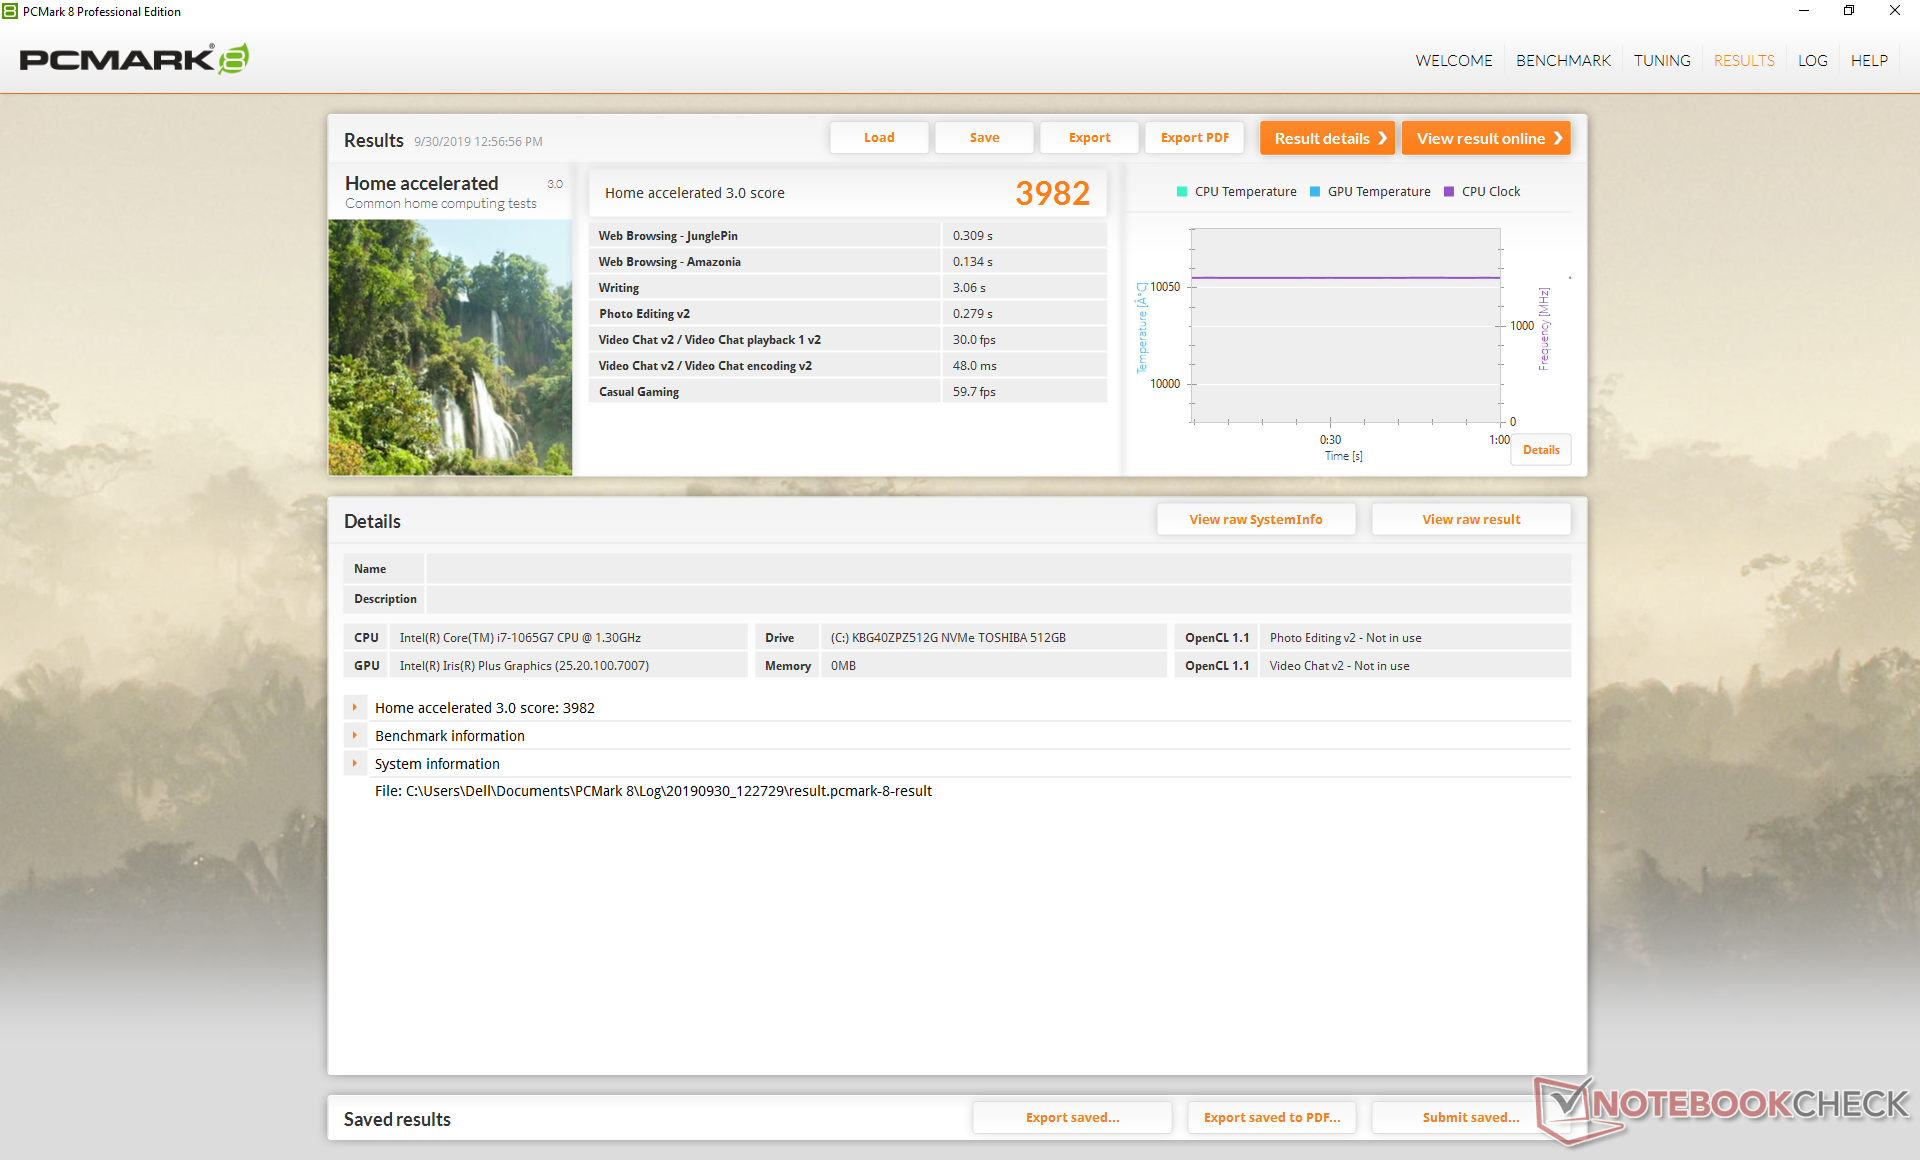
| PCMark 8 Home Score Accelerated v2 | 3982 points | |
| PCMark 8 Work Score Accelerated v2 | 5086 points | |
| PCMark 10 Score | 4677 points | |
Help | ||
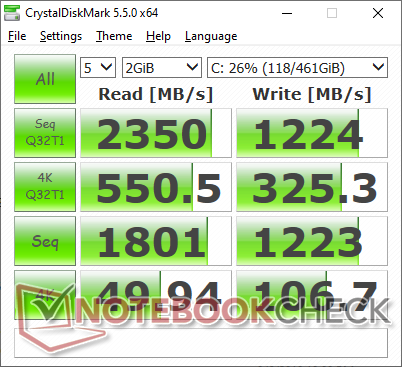
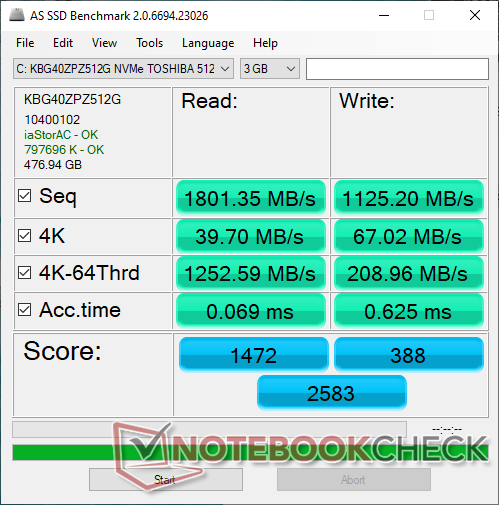
Storage Devices: Everything Is Soldered
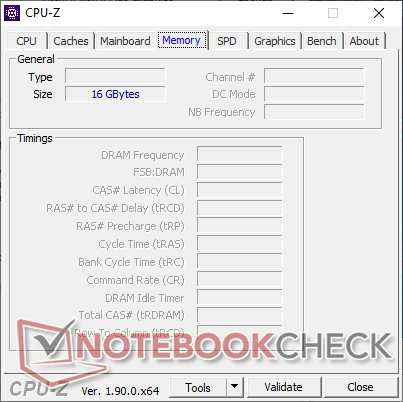
Our Core i7 unit comes with a 512 GB Toshiba BG4 NVMe SSD to be very similar to the 256 GB Toshiba BG4 NVMe SSD in the Core i3 configuration. Users ought to choose both RAM and storage carefully as these components are soldered.
| Dell XPS 13 7390 2-in-1 Core i7 Toshiba BG4 KBG40ZPZ512G | Dell XPS 13 7390 2-in-1 Core i3 Toshiba BG4 KBG40ZPZ256G | Dell XPS 13 9380 2019 SK hynix PC401 HFS256GD9TNG | Dell XPS 13-9365 2-in-1 Toshiba NVMe THNSN5256GPUK | Dell Latitude 7200 WDC PC SN520 SDAPNUW-512G | Dell Latitude 13 5300 2-in-1 SK hynix PC401 HFS256GD9TNG | |
|---|---|---|---|---|---|---|
| AS SSD | -11% | -5% | -10% | 63% | -4% | |
| Seq Read (MB/s) | 1801 | 1558 -13% | 2035 13% | 1283 -29% | 1294 -28% | 1236 -31% |
| Seq Write (MB/s) | 1125 | 1103 -2% | 658 -42% | 735 -35% | 856 -24% | 500 -56% |
| 4K Read (MB/s) | 39.7 | 37.52 -5% | 39.74 0% | 37.69 -5% | 42.52 7% | 40.1 1% |
| 4K Write (MB/s) | 67 | 59 -12% | 105.7 58% | 96.9 45% | 141 110% | 115.7 73% |
| 4K-64 Read (MB/s) | 1253 | 1684 34% | 461 -63% | 586 -53% | 983 -22% | 474.1 -62% |
| 4K-64 Write (MB/s) | 209 | 198.9 -5% | 300.1 44% | 204.7 -2% | 1183 466% | 350.4 68% |
| Access Time Read * (ms) | 0.069 | 0.099 -43% | 0.061 12% | 0.045 35% | 0.057 17% | 0.04 42% |
| Access Time Write * (ms) | 0.625 | 0.722 -16% | 0.051 92% | 0.037 94% | 0.026 96% | 0.051 92% |
| Score Read (Points) | 1472 | 1877 28% | 704 -52% | 752 -49% | 1155 -22% | 638 -57% |
| Score Write (Points) | 388 | 368 -5% | 471 21% | 375 -3% | 1410 263% | 516 33% |
| Score Total (Points) | 2583 | 3180 23% | 1479 -43% | 1495 -42% | 3142 22% | 1456 -44% |
| Copy ISO MB/s (MB/s) | 1293 | 677 -48% | 893 -31% | 950 -27% | 1387 7% | 818 -37% |
| Copy Program MB/s (MB/s) | 560 | 298.4 -47% | 287.9 -49% | 263.8 -53% | 449.5 -20% | 395.5 -29% |
| Copy Game MB/s (MB/s) | 927 | 496.1 -46% | 618 -33% | 726 -22% | 1059 14% | 452.5 -51% |
* ... smaller is better

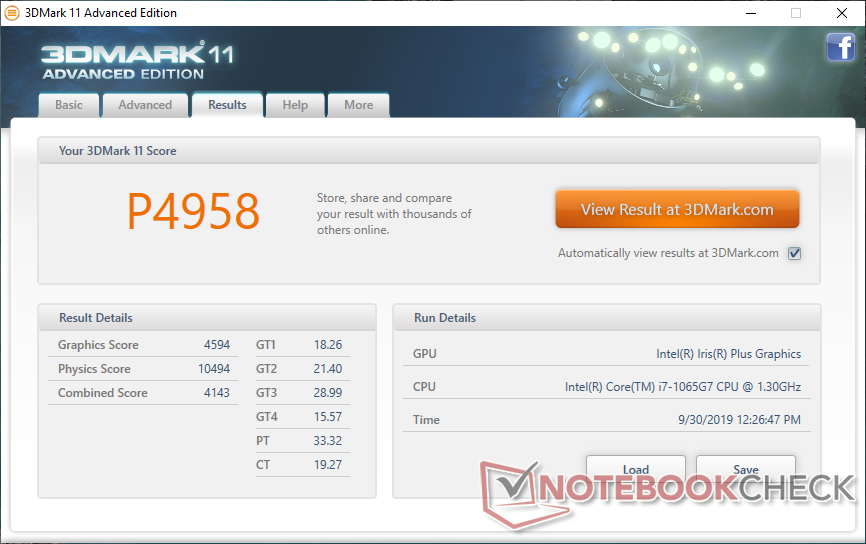
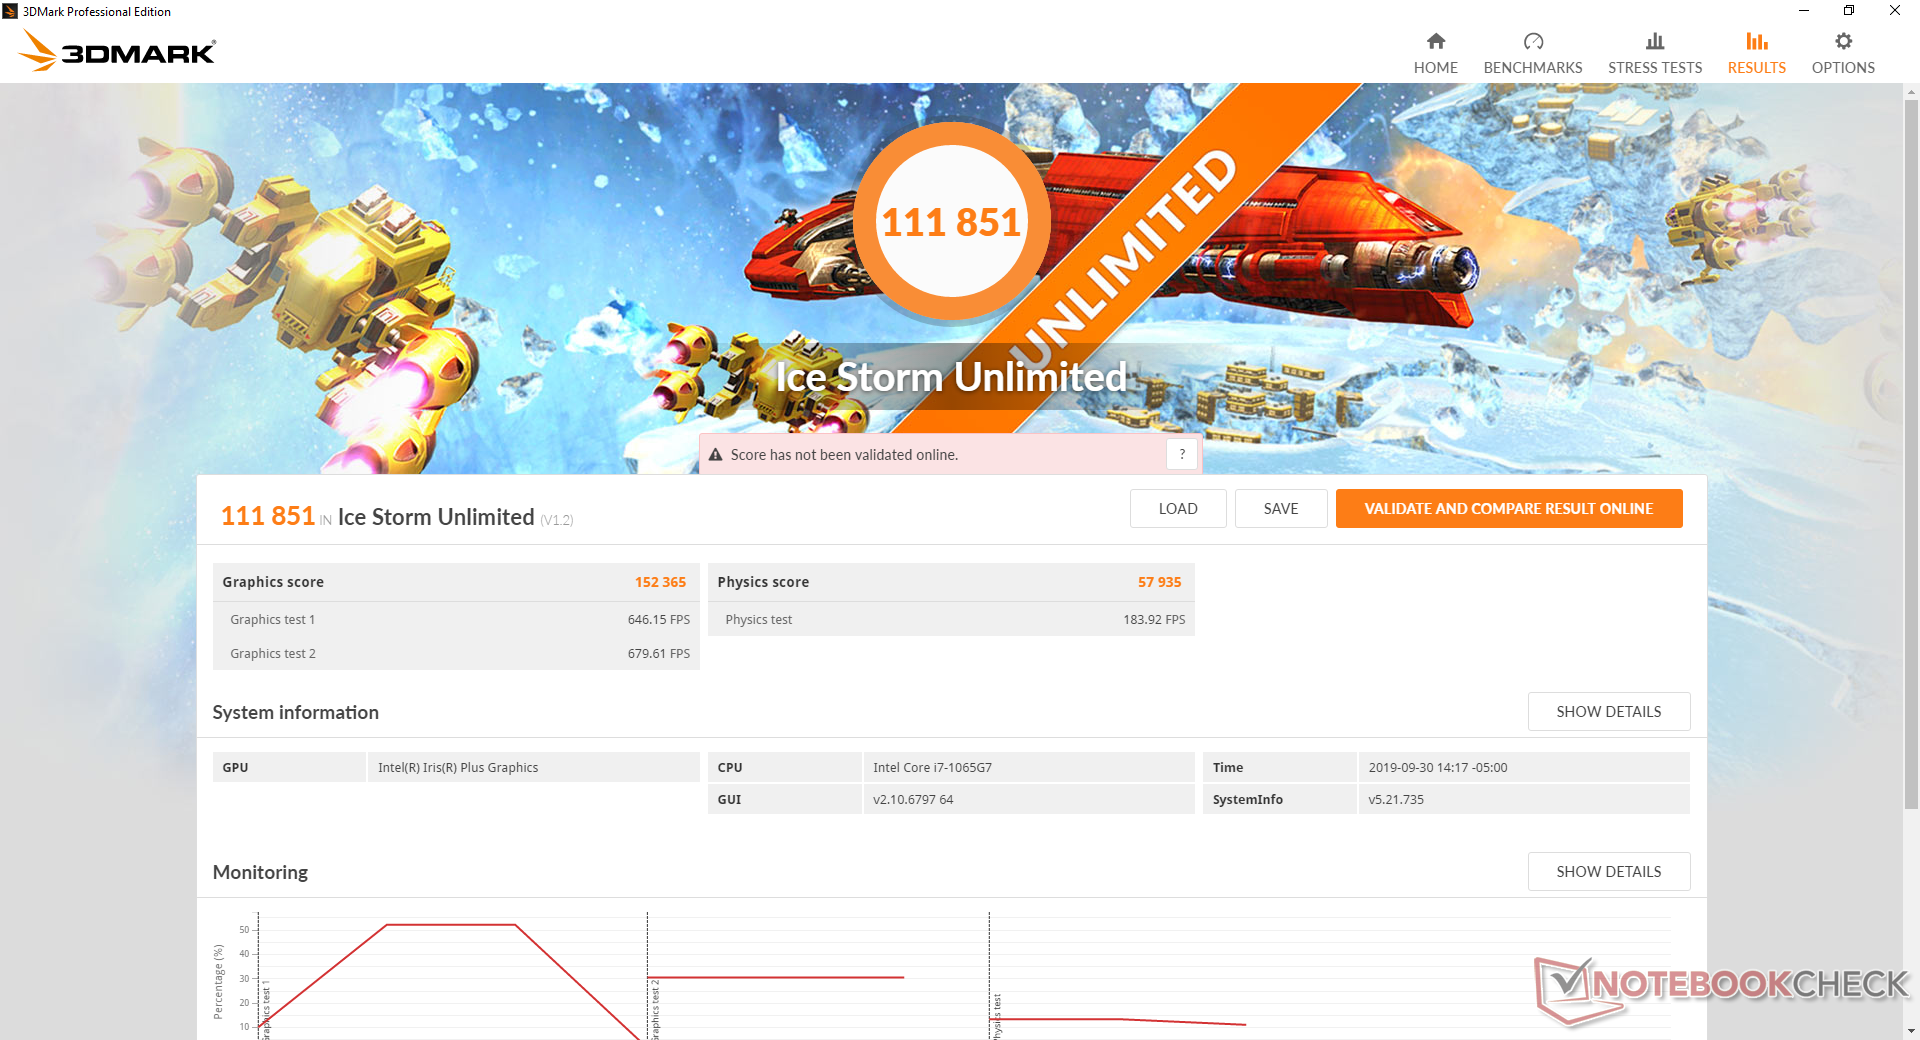
GPU Performance: Good Enough For Undemanding Multiplayer Games
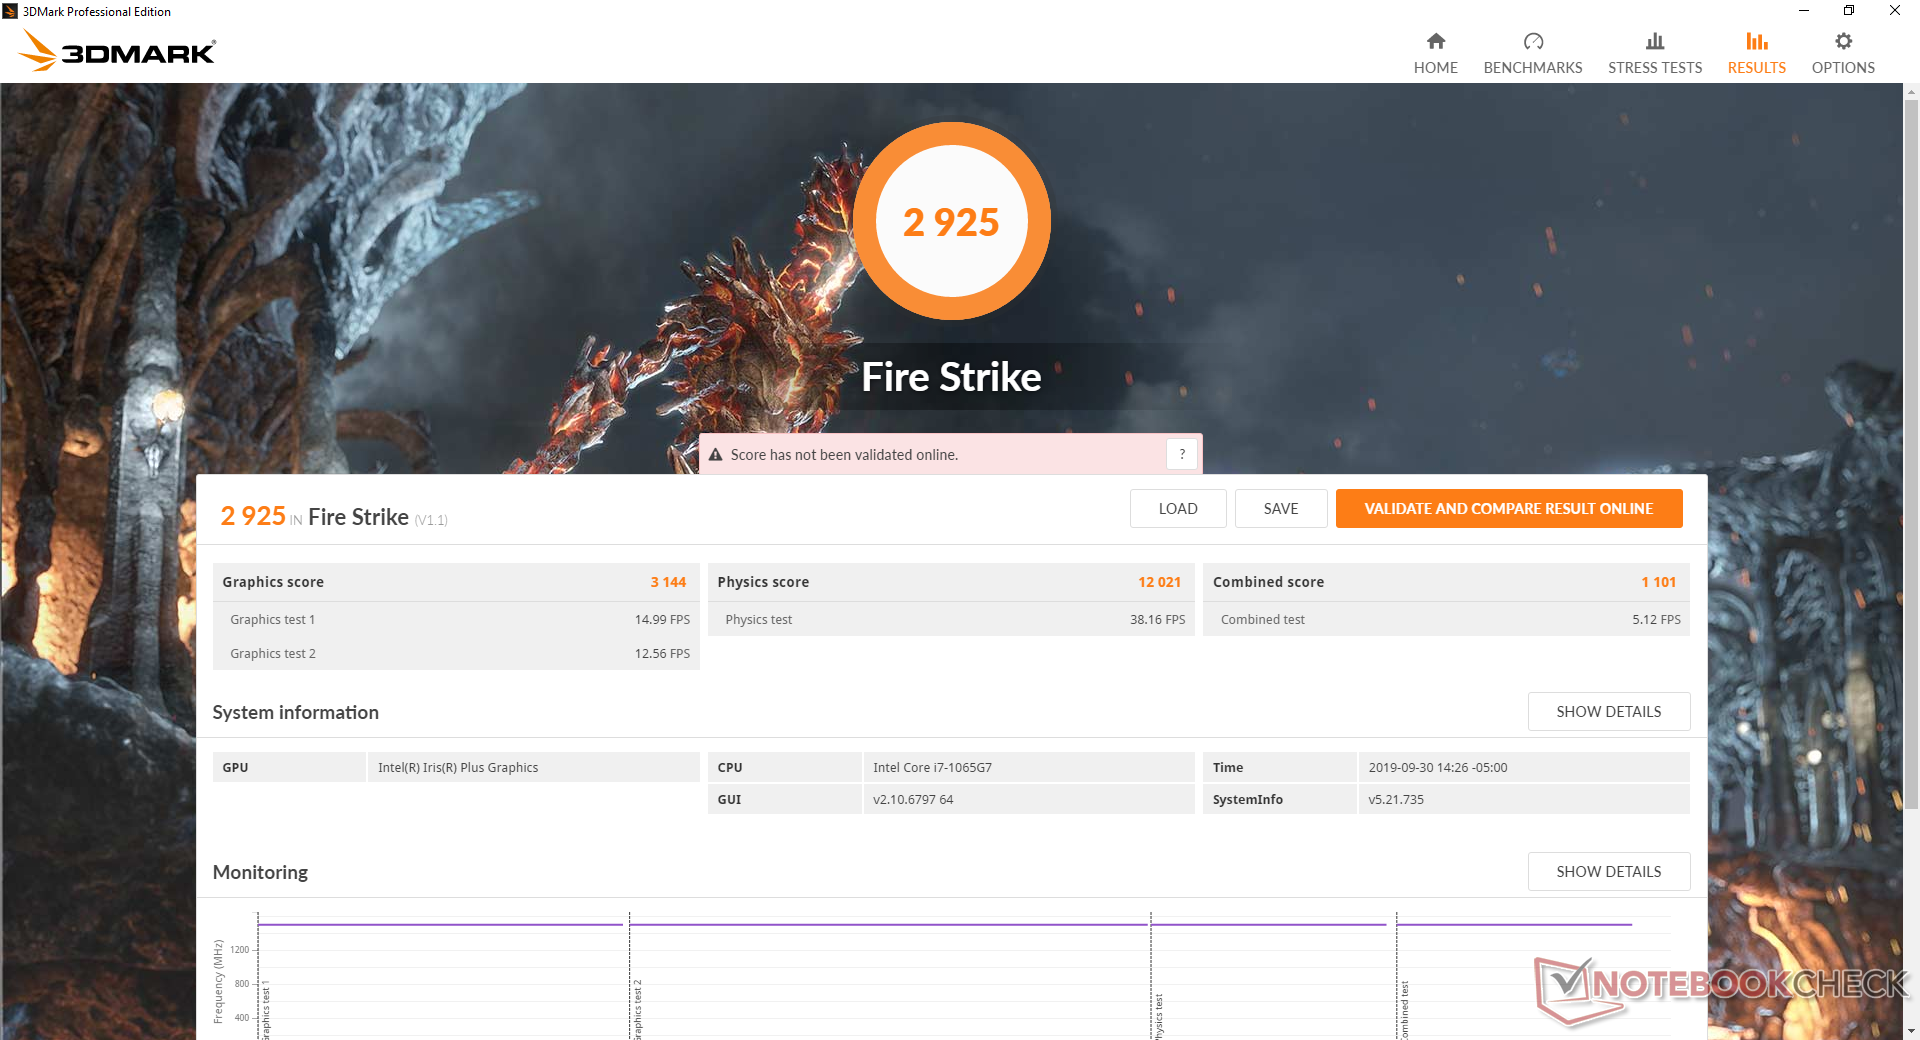
Graphics performance is where things get tricky. It's true that the new integrated Iris Plus is leagues beyond the UHD Graphics 620, but real-world performance is much more variable depending on the game, API or application. As mentioned here, 3DMark results translate poorly to real-world gaming performance especially when comparing two different GPU families. The GeForce MX250, for example, is about 17 to 36 percent faster than our Iris Plus according to 3DMark benchmarks. In reality, the MX250 can offer 50 to 70 percent faster frame rates over the Iris Plus depending on the title.
If you're a casual player of CS:GO, Fortnite, Rocket League, or DOTA 2, then the Iris Plus can get the job done at 1080p or 720p at worse. For more demanding titles like Overwatch or Destiny 2, you'd be much better off with a GeForce MX150 or MX250 instead.
| 3DMark 06 Standard Score | 17752 points | |
| 3DMark 11 Performance | 4958 points | |
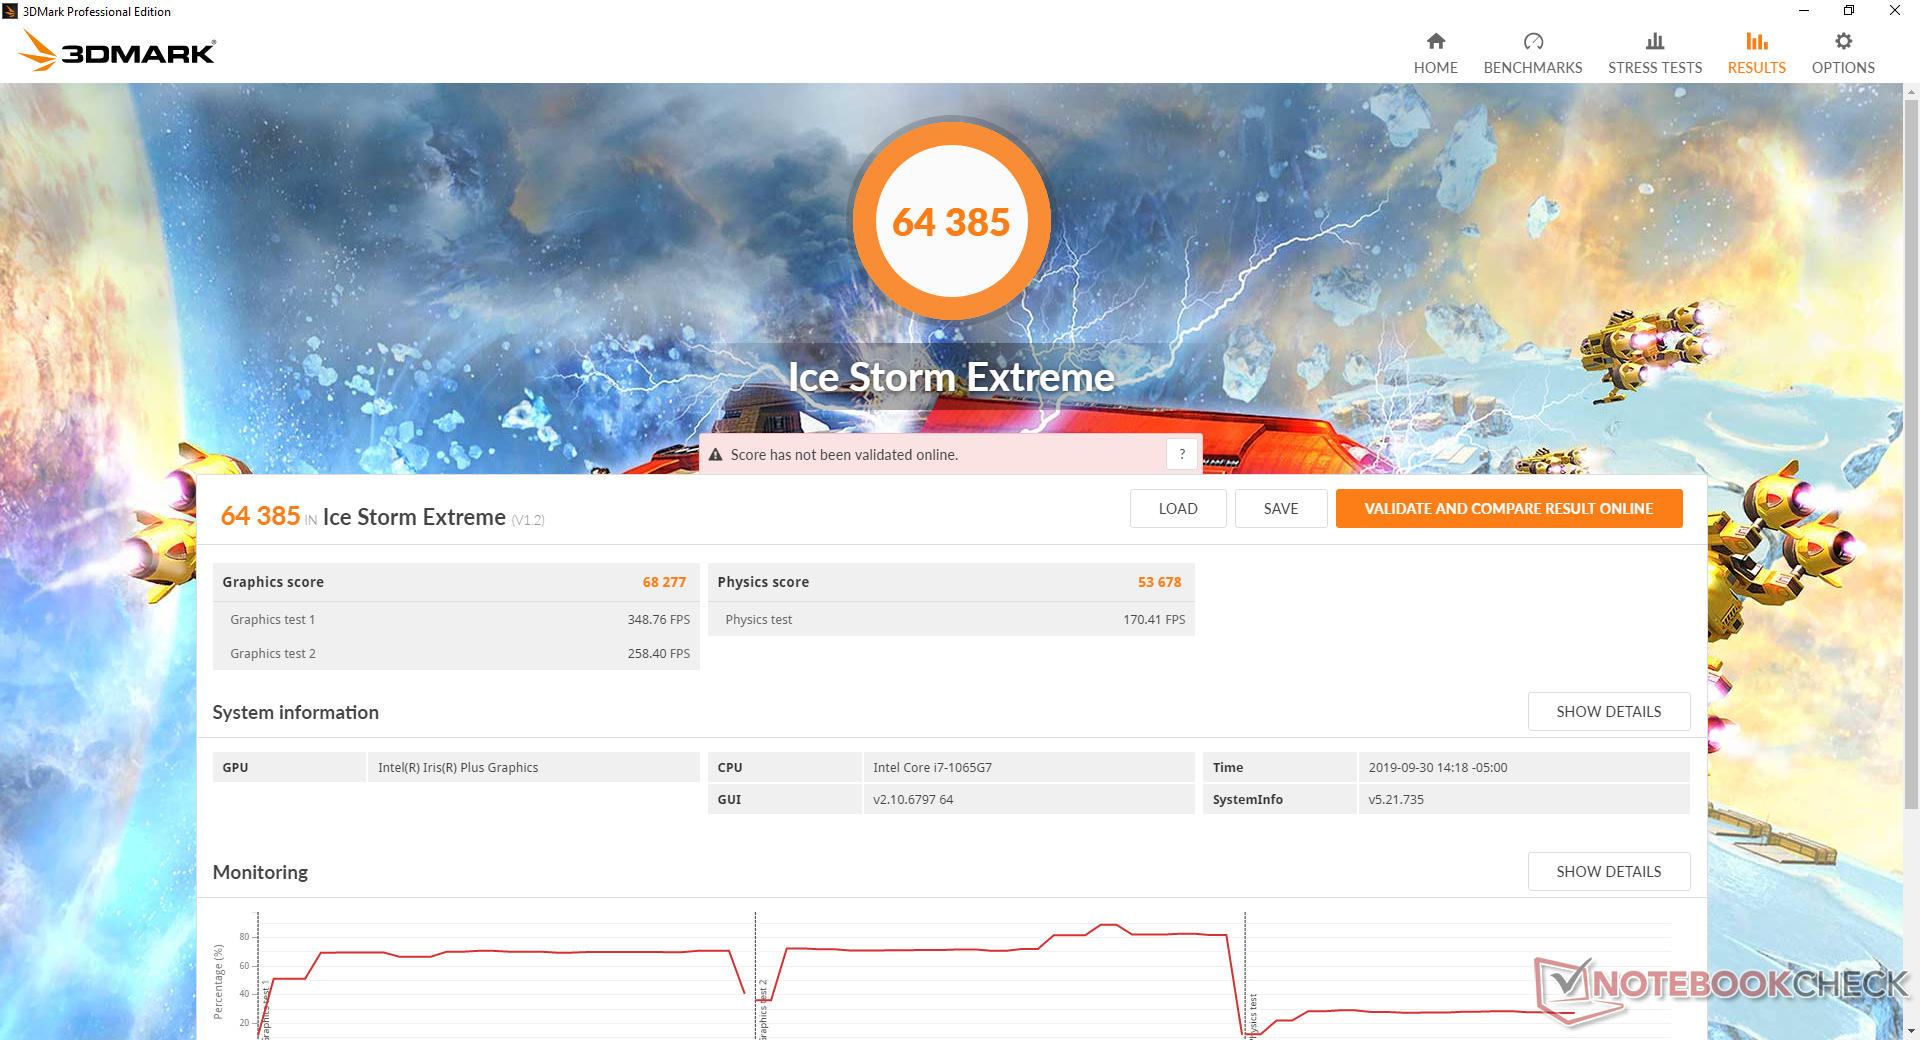
| 3DMark Ice Storm Standard Score | 77789 points | |
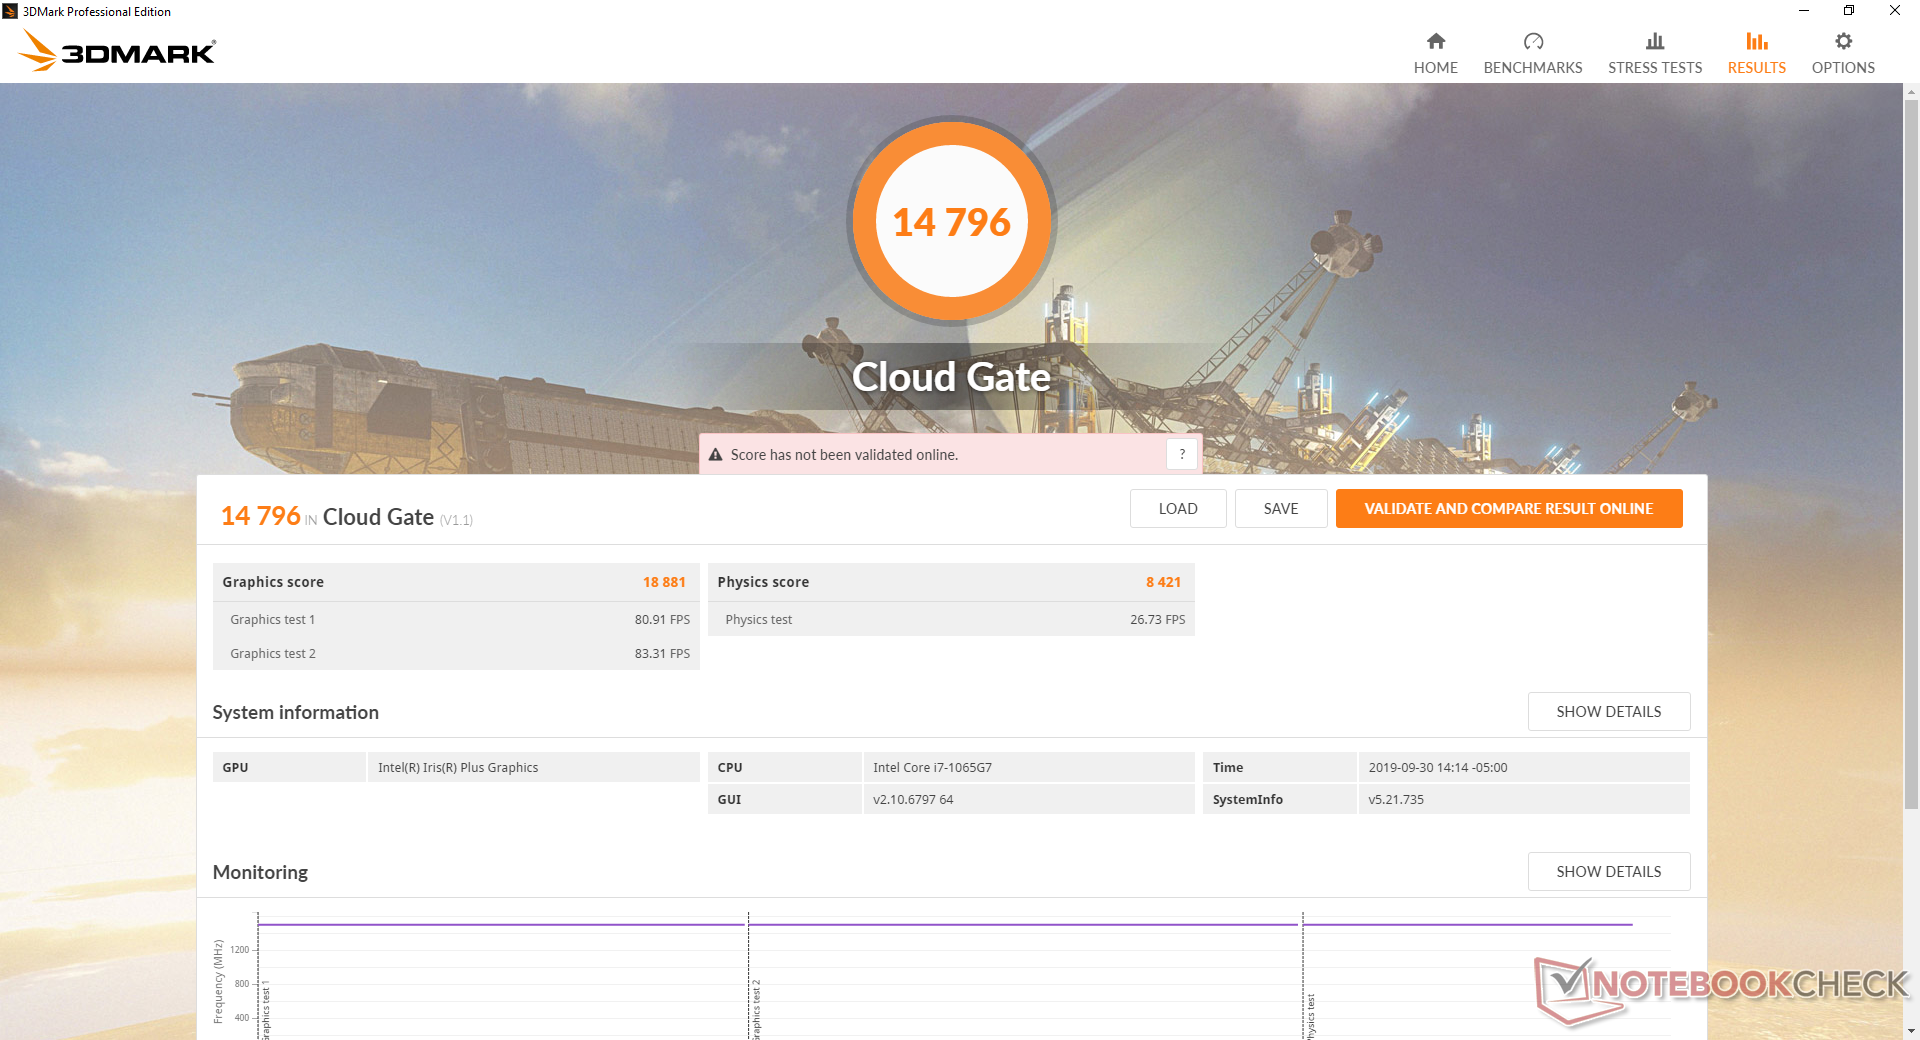
| 3DMark Cloud Gate Standard Score | 14796 points | |
| 3DMark Fire Strike Score | 2925 points | |
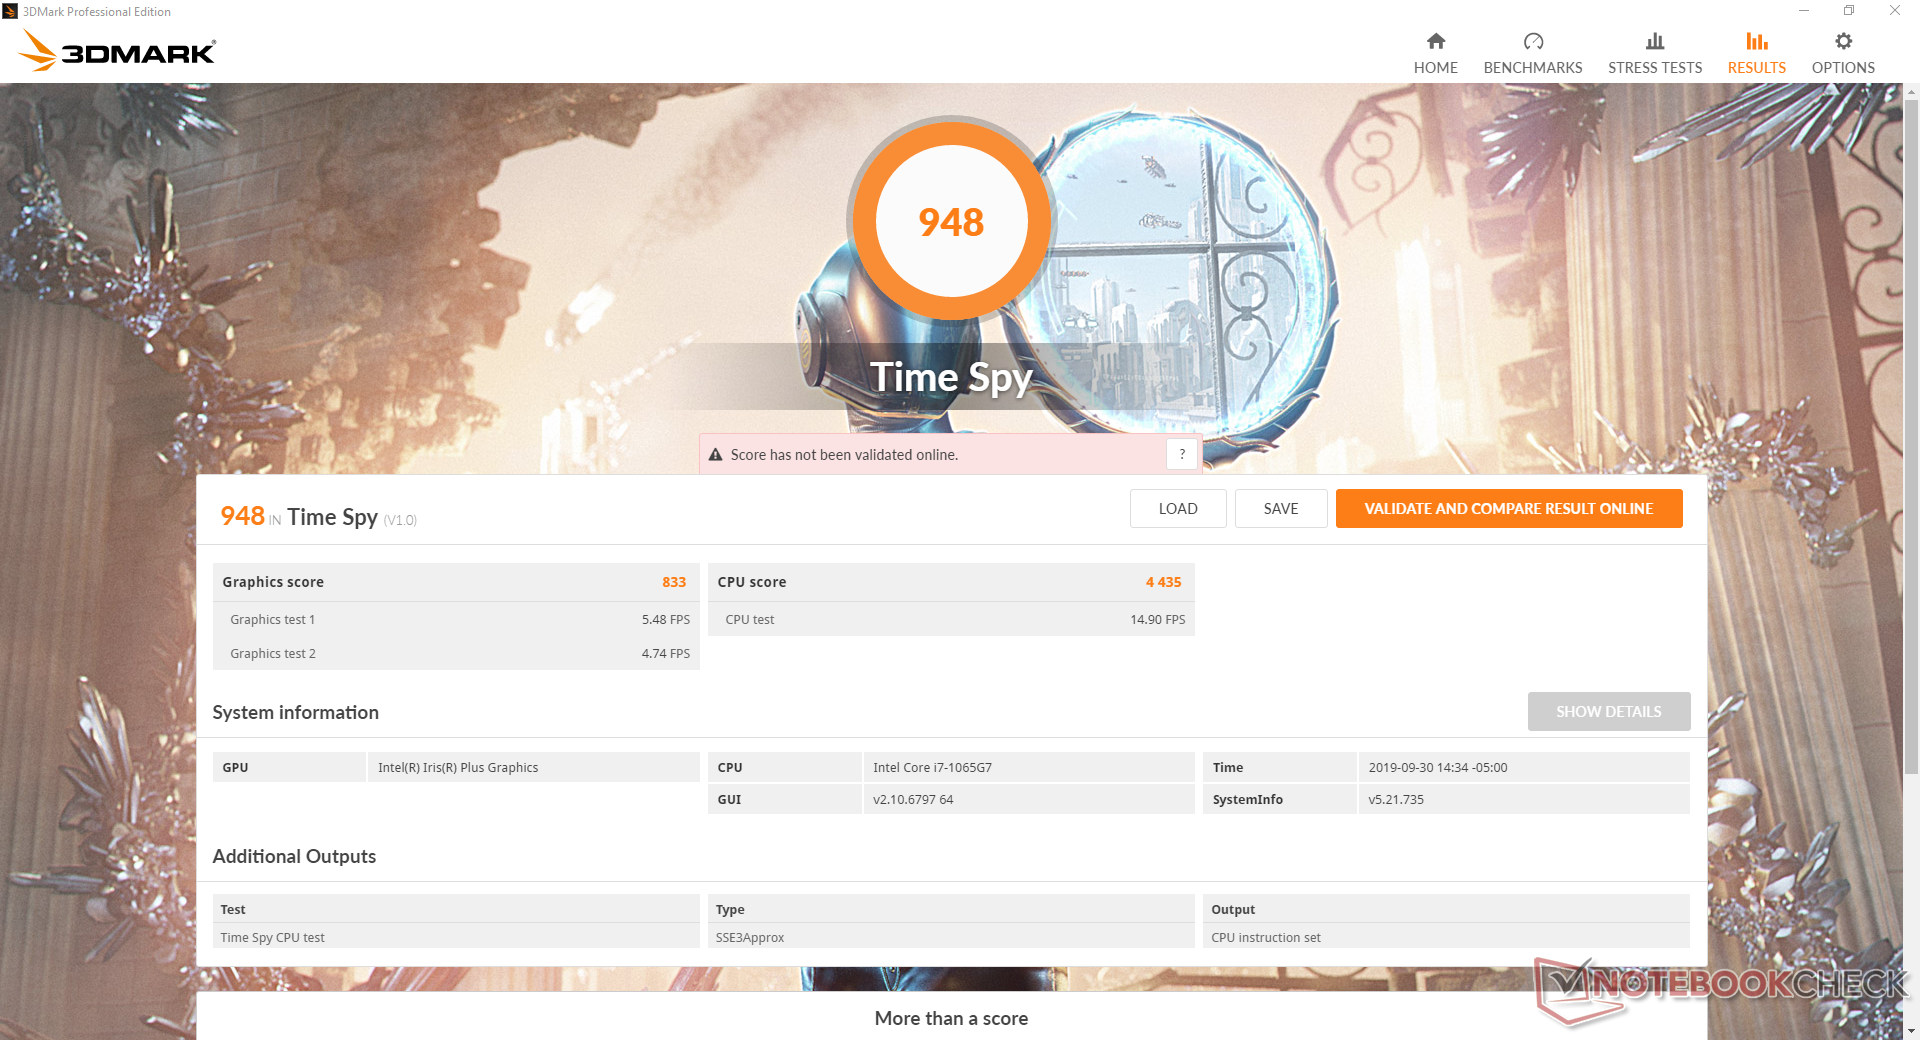
| 3DMark Time Spy Score | 948 points | |
Help | ||
| Rocket League | |
| 1920x1080 High Quality AA:High FX | |
| Dell XPS 15 7590 9980HK GTX 1650 | |
| Acer Aspire 5 A515-52G-723L | |
| Intel SDS Core i7-1065G7 Preliminary Sample 25 W | |
| Intel SDS Core i7-1065G7 Preliminary Sample 15 W | |
| Dell Inspiron 15 5000 5585 | |
| Dell XPS 13 7390 2-in-1 Core i7 | |
| Dell XPS 13 9360 FHD i7 Iris | |
| Dell XPS 13 7390 2-in-1 Core i3 | |
| Dell XPS 13 9370 FHD i5 | |
| Asus ZenBook 14 UX433FA | |
| 1920x1080 Performance | |
| Dell XPS 15 7590 9980HK GTX 1650 | |
| Dell Inspiron 15 5000 5585 | |
| Intel SDS Core i7-1065G7 Preliminary Sample 25 W | |
| Intel SDS Core i7-1065G7 Preliminary Sample 15 W | |
| Dell XPS 13 7390 2-in-1 Core i3 | |
| Dell XPS 13 7390 2-in-1 Core i7 | |
| Asus ZenBook 14 UX433FA | |
| The Witcher 3 - 1920x1080 High Graphics & Postprocessing (Nvidia HairWorks Off) | |
| Dell G5 15 5590 | |
| Dell XPS 15 7590 9980HK GTX 1650 | |
| Dell XPS 15 9575 i5-8305G | |
| Dell Inspiron 15 7000 7577 | |
| Dell XPS 15 2018 i5 FHD 97Wh | |
| Huawei MateBook 14 KLV-W29 | |
| Acer Aspire 5 A515-52G-723L | |
| Dell Inspiron 15 5000 5585 | |
| Intel SDS Core i7-1065G7 Preliminary Sample 15 W | |
| Huawei Matebook X Pro i5 | |
| Intel SDS Core i7-1065G7 Preliminary Sample 25 W | |
| Dell XPS 13 7390 2-in-1 Core i7 | |
| Dell Latitude 14 5495 | |
| Dell XPS 13 7390 2-in-1 Core i3 | |
| Shadow of the Tomb Raider - 1280x720 Lowest Preset | |
| Dell XPS 15 7590 9980HK GTX 1650 | |
| Acer Aspire 5 A515-52G-723L | |
| Dell Inspiron 15 5000 5585 | |
| Intel SDS Core i7-1065G7 Preliminary Sample 15 W | |
| Intel SDS Core i7-1065G7 Preliminary Sample 25 W | |
| Dell XPS 13 7390 2-in-1 Core i7 | |
| Dell XPS 13 9380 2019 | |
Idling on Witcher 3 shows no frame dips over time for consistent performance and no throttling. We recommend engaging v-sync for more even frame pacing since Iris Plus tends to run between 30 FPS and 60 FPS where screen tearing is noticeable.
| low | med. | high | ultra | |
|---|---|---|---|---|
| Guild Wars 2 (2012) | 105 | 33.2 | 13.9 | |
| StarCraft II: Heart of the Swarm (2013) | 321.1 | 98.1 | 61.6 | 30.6 |
| BioShock Infinite (2013) | 112.6 | 68.6 | 58.1 | 21.3 |
| The Witcher 3 (2015) | 54.9 | 34.4 | 17 | 7.8 |
| Metal Gear Solid V (2015) | 60 | 60 | 31.1 | 18.1 |
| Rise of the Tomb Raider (2016) | 42.4 | 26.9 | 14.7 | 10.5 |
| Doom (2016) | 41.2 | 20.4 | ||
| Overwatch (2016) | 91.4 | 56 | 29.7 | |
| Rocket League (2017) | 114 | 62.6 | 33.8 | |
| Destiny 2 (2017) | 29.4 | 20.4 | ||
| Shadow of the Tomb Raider (2018) | 27 | |||
| F1 2019 (2019) | 35 | 22 | 20 | 13 |
| Borderlands 3 (2019) | 31.8 | 13.8 | 8.7 | 6.6 |
Emissions
System Noise: Silent When Browsing, High-pitched When Gaming
Fan noise and behavior remain essentially the same as on the Core i3 configuration despite their wide performance differences. The system is silent or very nearly so when browsing or streaming video. Meanwhile, gaming loads will slowly bump the fans until they reach a steady maximum of 43.4 dB(A) to be louder than a clamshell XPS 13. The high noise pitch in particular makes the fans more noticeable than they should be when the system is under stressful loads.
We're able to notice very slight coil whine or electronic noise when placing an ear near the keyboard keys on our unit. This becomes inaudible when sitting at a normal distance from the system.
| Dell XPS 13 7390 2-in-1 Core i7 Iris Plus Graphics G7 (Ice Lake 64 EU), i7-1065G7, Toshiba BG4 KBG40ZPZ512G | Dell XPS 13 7390 2-in-1 Core i3 UHD Graphics G1 (Ice Lake 32 EU), i3-1005G1, Toshiba BG4 KBG40ZPZ256G | Dell XPS 13 9380 2019 UHD Graphics 620, i5-8265U, SK hynix PC401 HFS256GD9TNG | Dell XPS 13 9370 FHD i5 UHD Graphics 620, i5-8250U, Toshiba XG5 KXG50ZNV256G | Dell XPS 13 9360 FHD i7 Iris Iris Plus Graphics 640, i7-7560U, Toshiba XG4 NVMe (THNSN5512GPUK) | Dell XPS 13-9365 2-in-1 HD Graphics 615, i7-7Y75, Toshiba NVMe THNSN5256GPUK | |
|---|---|---|---|---|---|---|
| Noise | 0% | -3% | -1% | -2% | ||
| off / environment * (dB) | 28.1 | 28 -0% | 30.4 -8% | 29.1 -4% | 29.9 -6% | |
| Idle Minimum * (dB) | 28.1 | 28 -0% | 30.4 -8% | 29.1 -4% | 29.9 -6% | |
| Idle Average * (dB) | 28.1 | 28 -0% | 30.4 -8% | 29.1 -4% | 29.9 -6% | |
| Idle Maximum * (dB) | 28.1 | 28 -0% | 30.4 -8% | 29.1 -4% | 30.3 -8% | |
| Load Average * (dB) | 31.7 | 31.7 -0% | 31.7 -0% | 32.2 -2% | 33.9 -7% | |
| Witcher 3 ultra * (dB) | 43.4 | |||||
| Load Maximum * (dB) | 43.4 | 43.5 -0% | 38.1 12% | 37.3 14% | 34.9 20% |
* ... smaller is better
Noise level
| Idle |
| 28.1 / 28.1 / 28.1 dB(A) |
| Load |
| 31.7 / 43.4 dB(A) |
 | ||
30 dB silent 40 dB(A) audible 50 dB(A) loud |
||
min: | ||
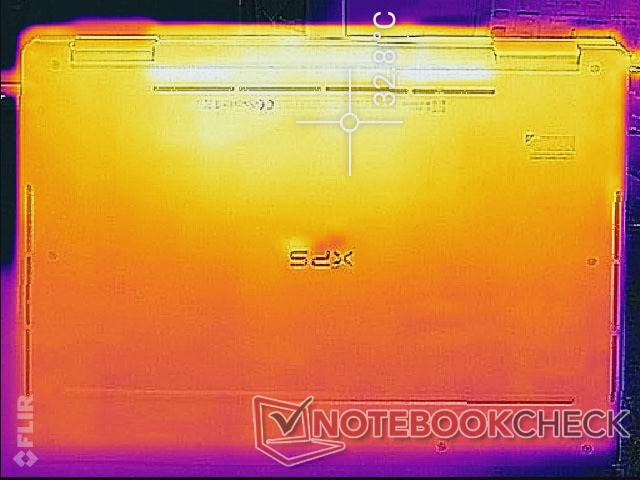
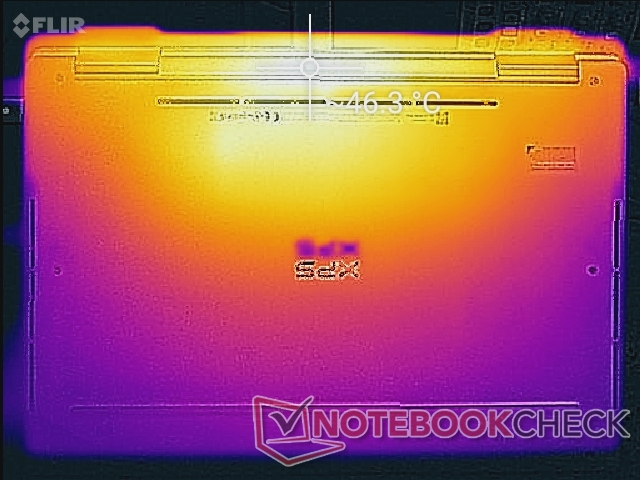
Temperature: Nearly Identical To The Core i3 SKU

Surface temperatures remain identical to what we observed on the Core i7 configuration. Surfaces can range anywhere between 30 C all the way up to 50 C depending on load. The hot spots are towards the rear of the unit to be far away from the clickpad and palm rests.
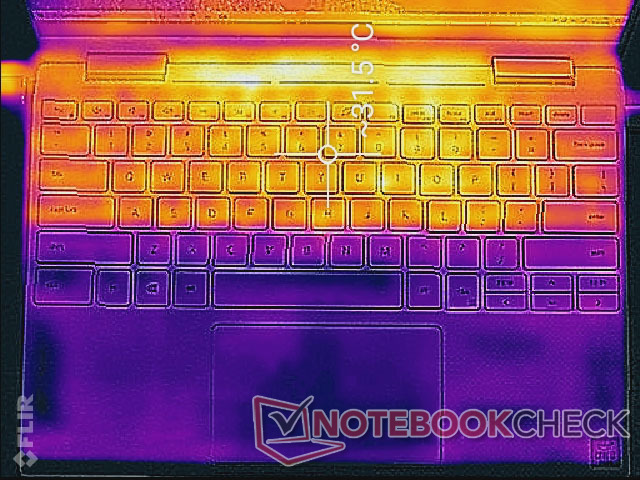
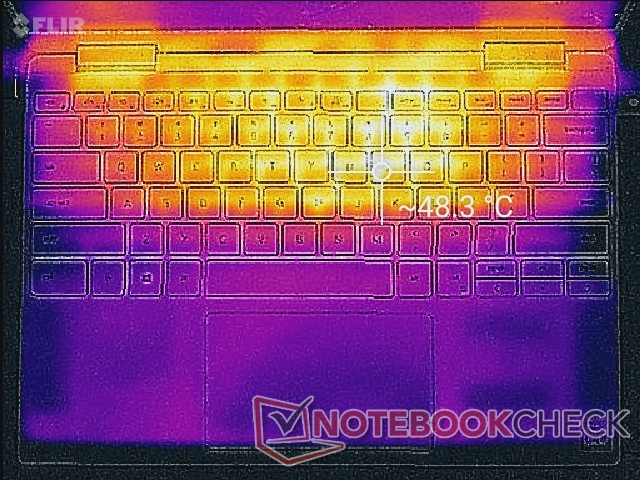


(-) The maximum temperature on the upper side is 51.4 °C / 125 F, compared to the average of 35.4 °C / 96 F, ranging from 19.6 to 60 °C for the class Convertible.
(-) The bottom heats up to a maximum of 46.4 °C / 116 F, compared to the average of 36.9 °C / 98 F
(+) In idle usage, the average temperature for the upper side is 30.3 °C / 87 F, compared to the device average of 30.3 °C / 87 F.
(±) Playing The Witcher 3, the average temperature for the upper side is 37.7 °C / 100 F, compared to the device average of 30.3 °C / 87 F.
(+) The palmrests and touchpad are reaching skin temperature as a maximum (33.8 °C / 92.8 F) and are therefore not hot.
(-) The average temperature of the palmrest area of similar devices was 28 °C / 82.4 F (-5.8 °C / -10.4 F).
Stress Test: Steady at >95 Degrees C
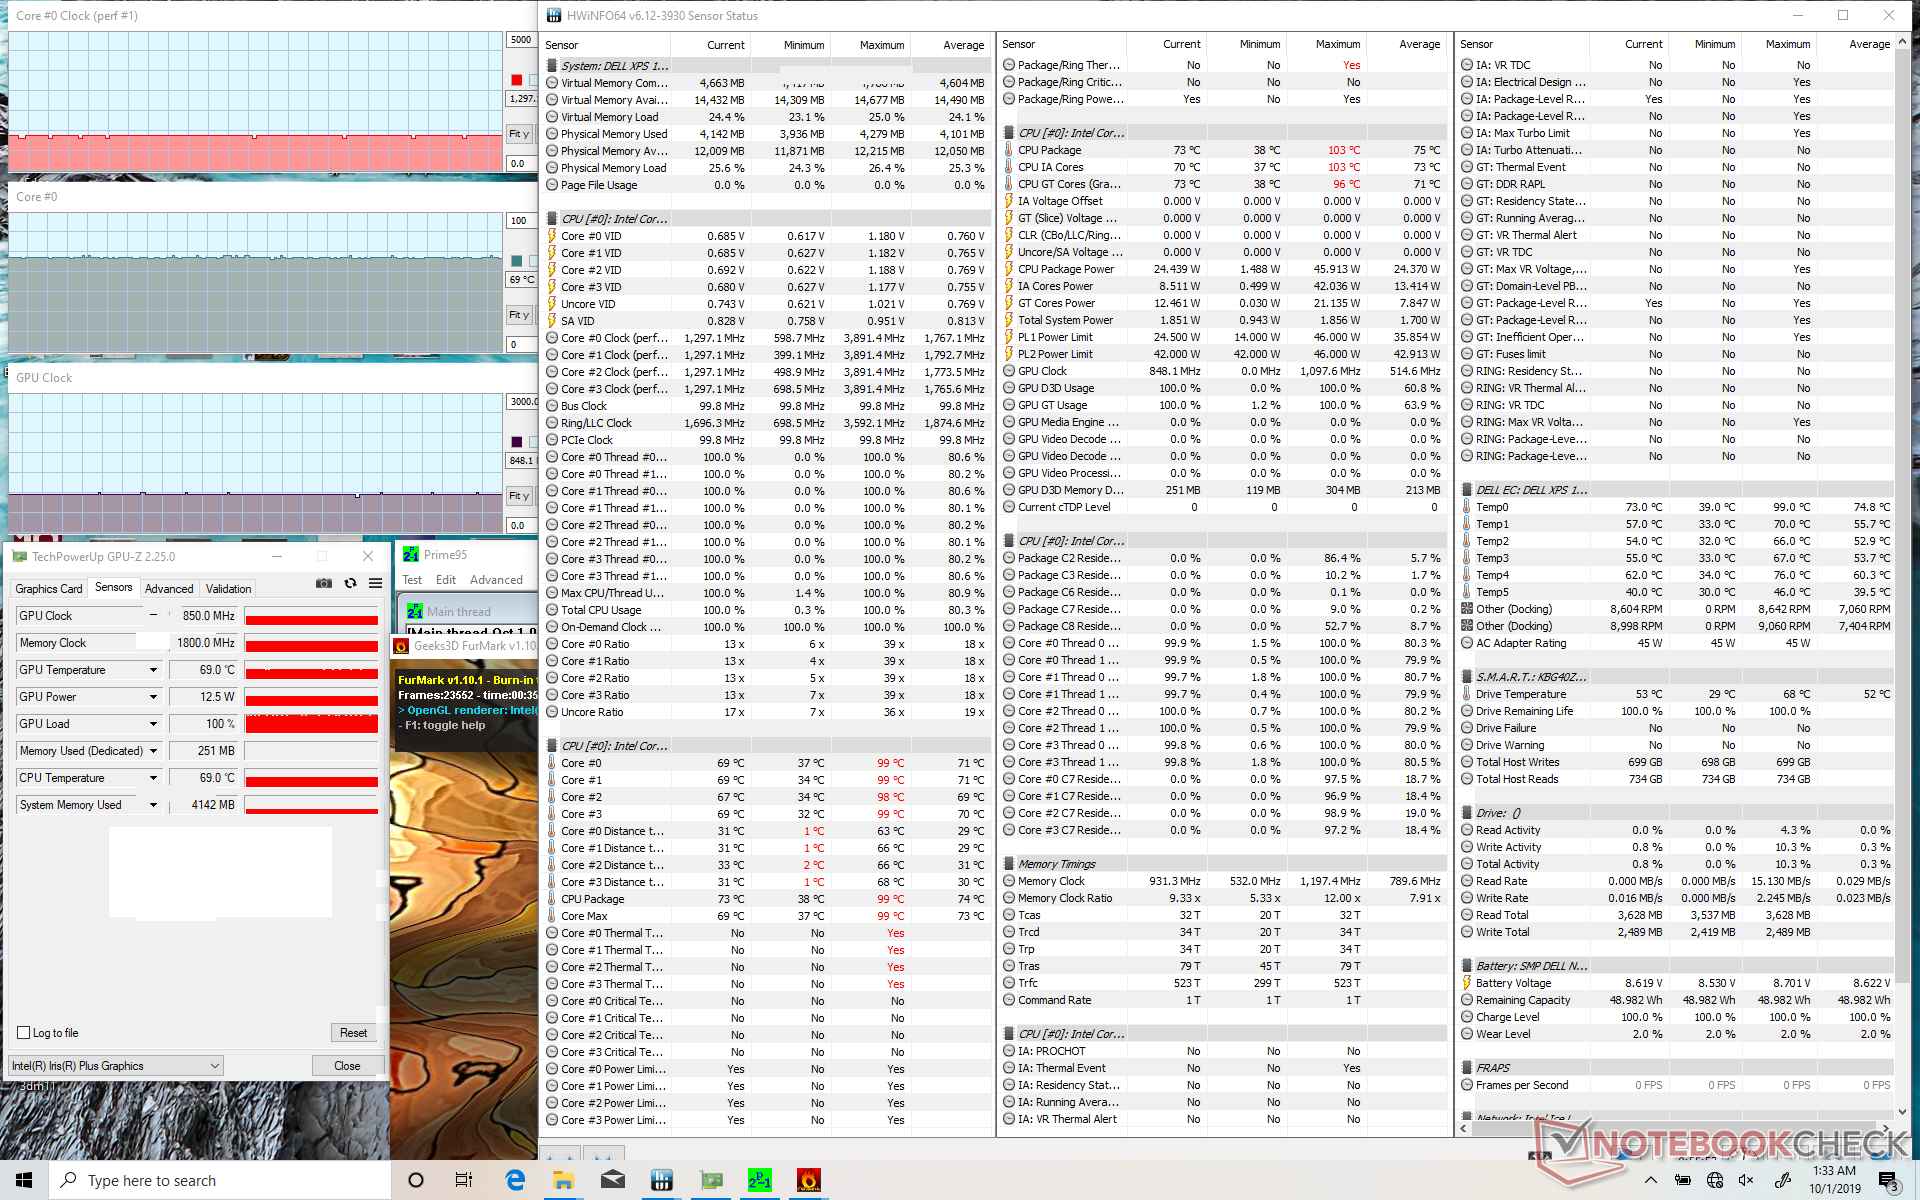
We stress the system with synthetic loads to observe processor behavior and identify for any potential throttling issues. When running Prime95, clock rates cycle between 2.9 and 3.5 GHz for the first minute or so before stabilizing at 3.0 to 3.1 GHz thereafter. Core temperature climbs slowly until it stabilizes at around 98 C to be much warmer than on most other Ultrabooks. This very high temperature is an intentional "feature" from Dell and Intel as it allows for faster sustained clock rates than usual. The Asus ZenBook S13 with the last generation Core i7-8565U, for example, stabilizes at a much cooler 60 C but at a slower 2.0 GHz clock rate when under similar Prime95 conditions. Running both Prime95 and FurMark simultaneously will throttle the processor to just 1.3 GHz and 69 C as it does its best to cope with both maximum CPU and GPU utilization.
Running Witcher 3 is more representative of real-world gaming conditions. GPU clock rate and temperature remain stable at 1097 MHz and 79 C to 85 C according to GPU-Z. The Core i7 Ice Lake CPU runs warmer than what we're used to seeing from the Kaby Lake-R or Whiskey Lake-U families.
Running on battery power will impact graphics performance. A 3DMark Cloud Gate test on batteries returns Physics and Graphics scores of 8365 and 13471 points, respectively, compared to 8421 and 18881 points when on mains.
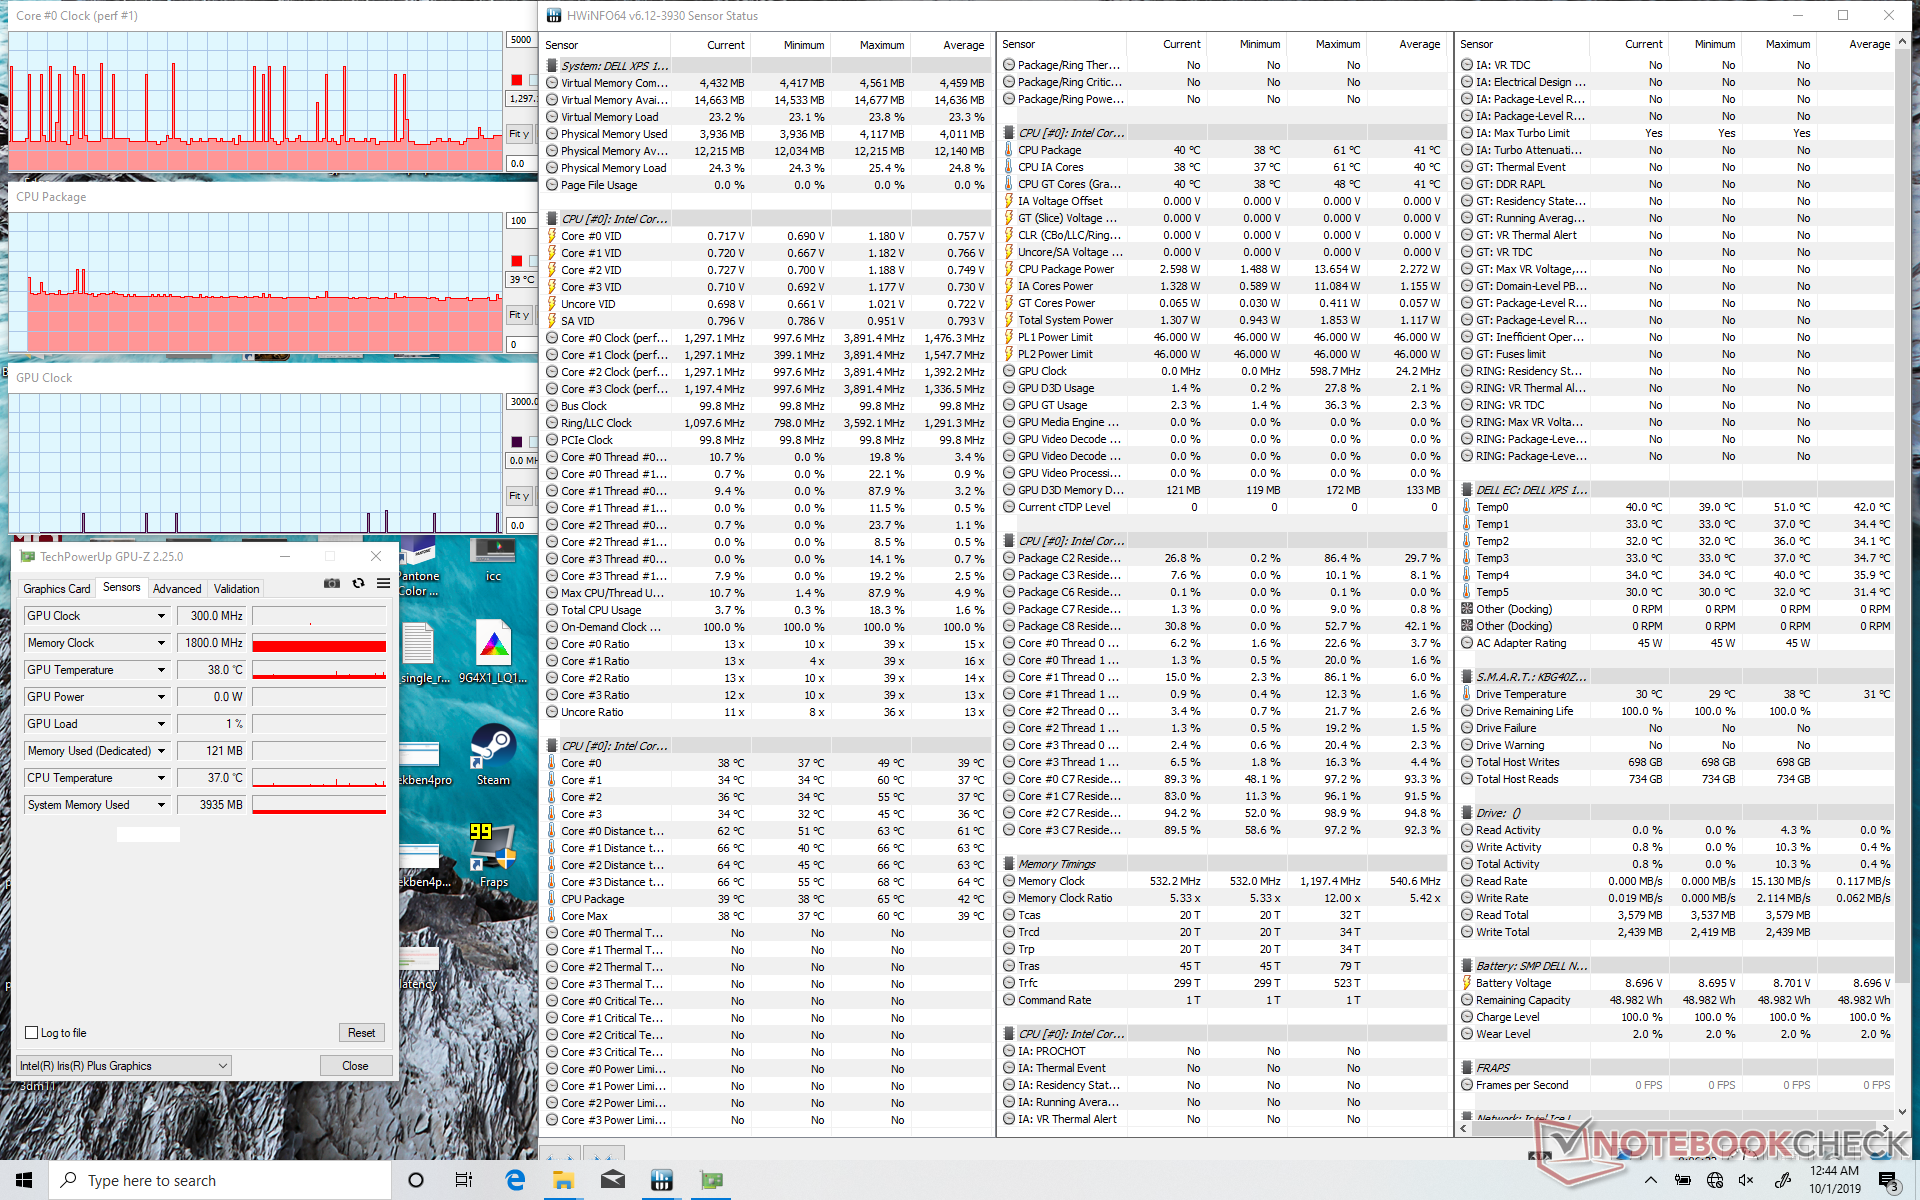
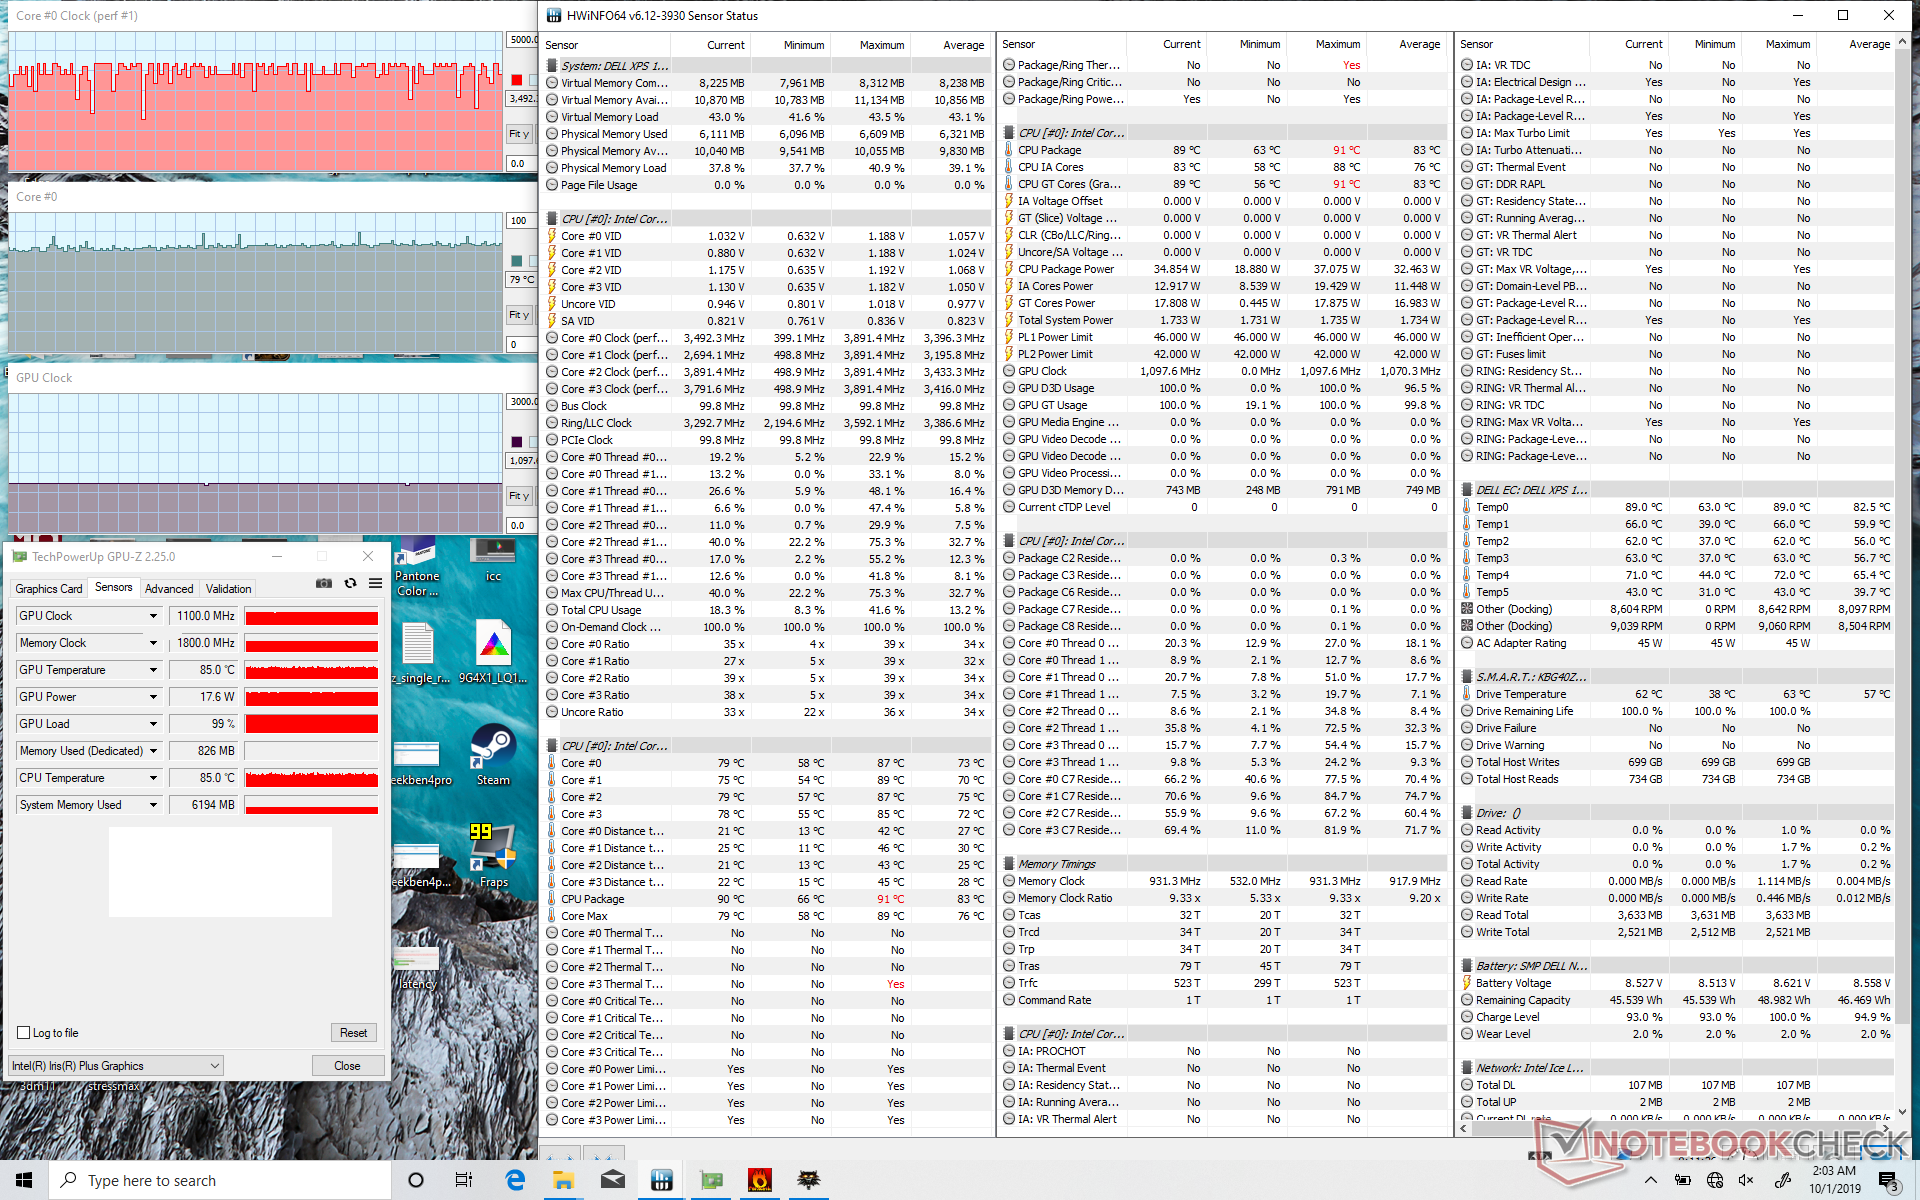
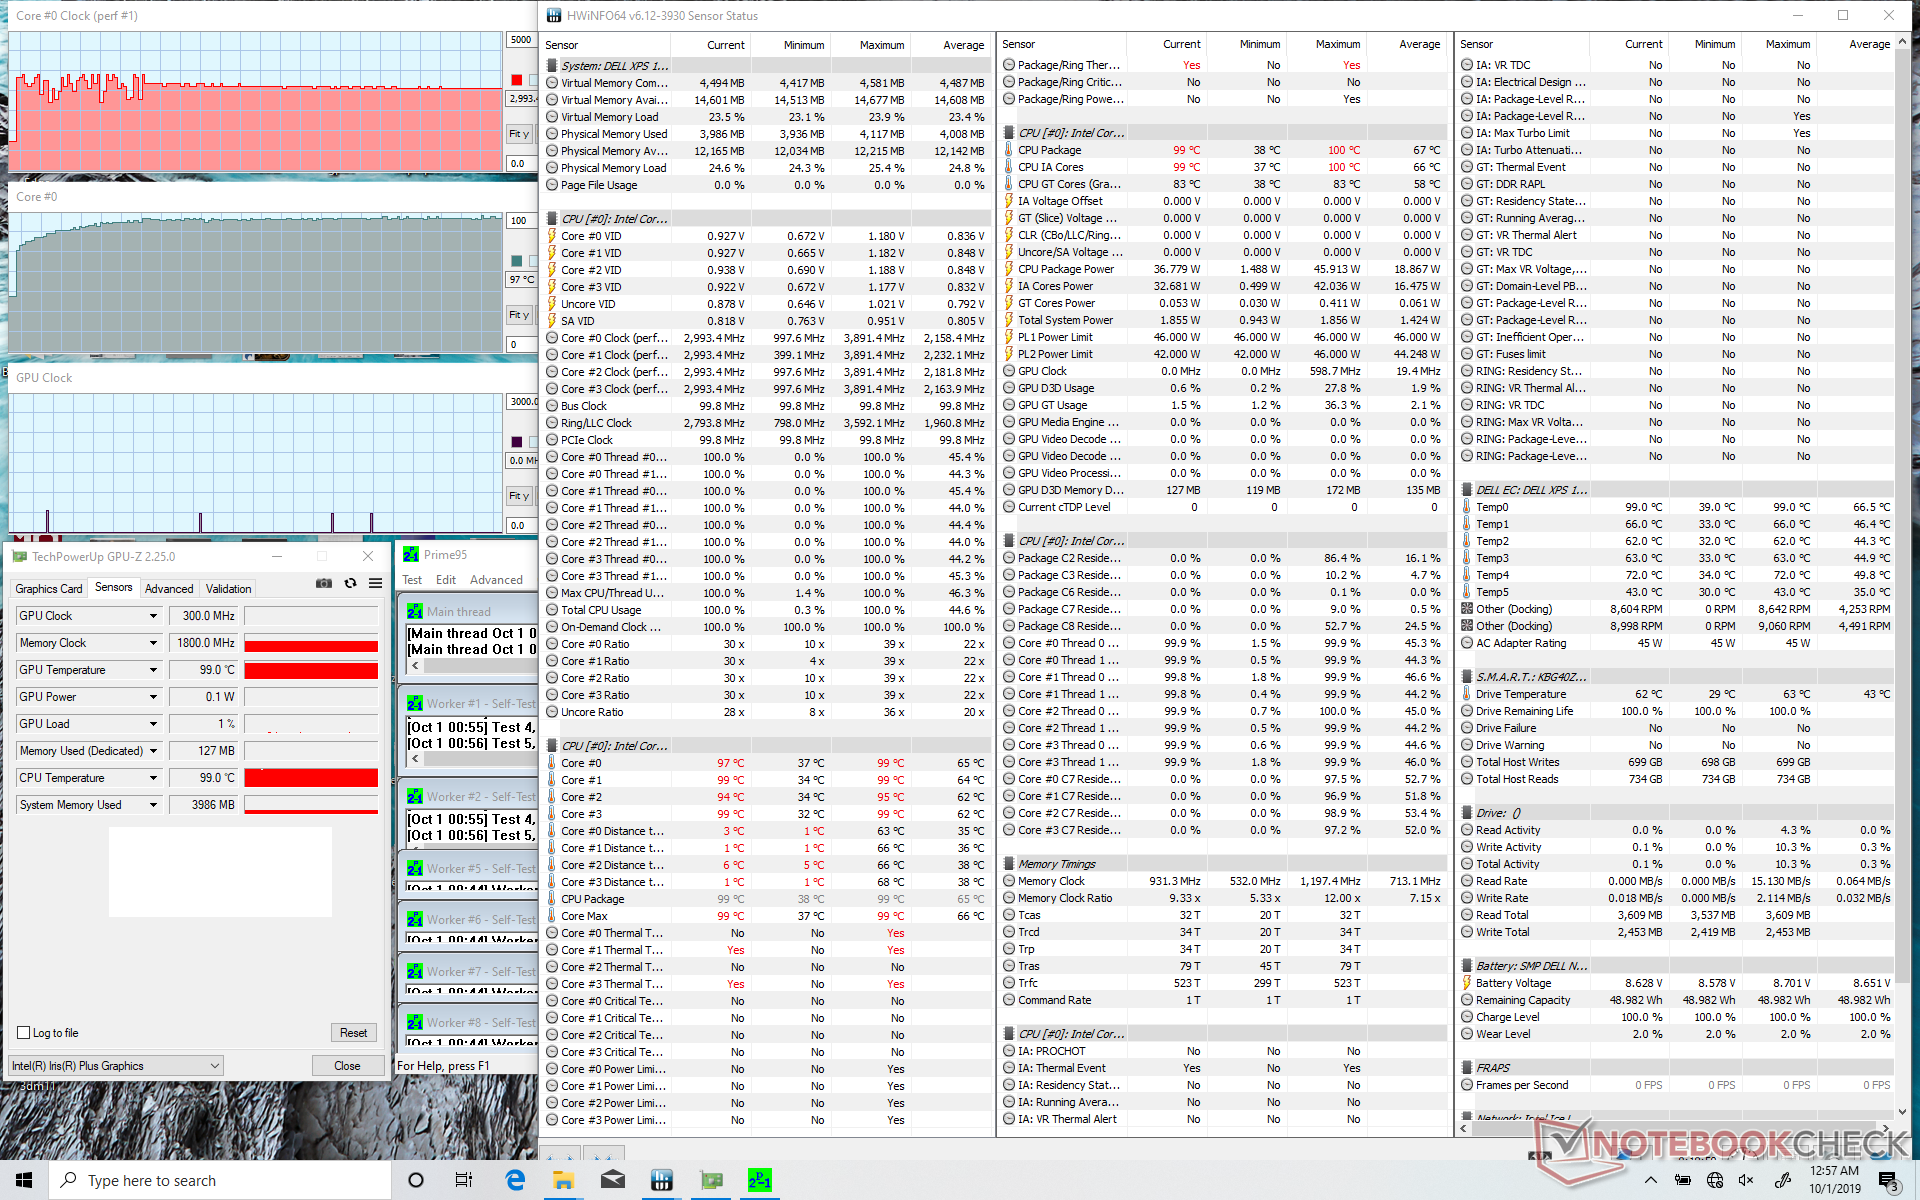
| CPU Clock (GHz) | GPU Clock (MHz) | Average CPU Temperature (°C) | |
| System Idle | -- | -- | 39 |
| Prime95 Stress | 3.0 | -- | ~99 |
| Prime95 + FurMark Stress | 1.3 | 848 | 69 |
| Witcher 3 Stress | ~3.5 | 1097 | 79 - 85 |
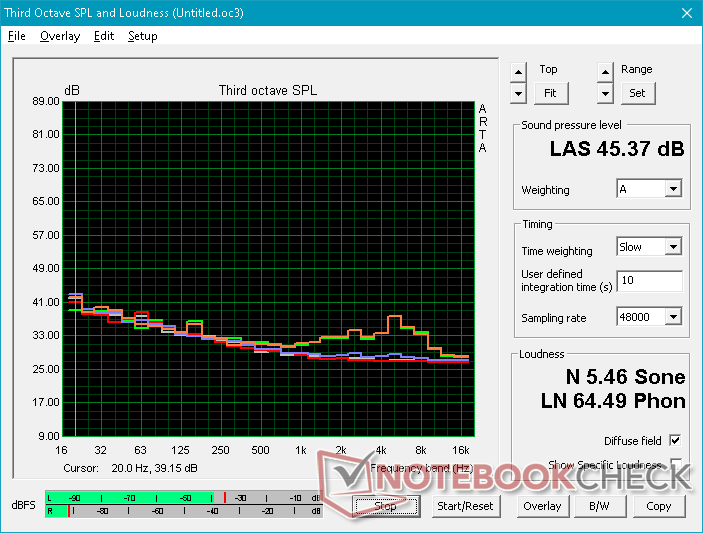
Speakers
The Waves MaxxAudio 2 x 2 W stereo speakers are actually working this time around unlike what we experienced on our Core i3 unit. Audio quality is better than expected from a convertible subnotebook with no steep roll-off until about 250 Hz. Treble and bass feel relatively balanced.


Dell XPS 13 7390 2-in-1 Core i7 audio analysis
(±) | speaker loudness is average but good (80.7 dB)
Bass 100 - 315 Hz
(±) | reduced bass - on average 7.8% lower than median
(±) | linearity of bass is average (12.5% delta to prev. frequency)
Mids 400 - 2000 Hz
(+) | balanced mids - only 4.5% away from median
(+) | mids are linear (6.2% delta to prev. frequency)
Highs 2 - 16 kHz
(+) | balanced highs - only 3.4% away from median
(±) | linearity of highs is average (10.5% delta to prev. frequency)
Overall 100 - 16.000 Hz
(+) | overall sound is linear (14.8% difference to median)
Compared to same class
» 23% of all tested devices in this class were better, 4% similar, 72% worse
» The best had a delta of 6%, average was 20%, worst was 57%
Compared to all devices tested
» 20% of all tested devices were better, 4% similar, 76% worse
» The best had a delta of 4%, average was 24%, worst was 134%
Apple MacBook 12 (Early 2016) 1.1 GHz audio analysis
(+) | speakers can play relatively loud (83.6 dB)
Bass 100 - 315 Hz
(±) | reduced bass - on average 11.3% lower than median
(±) | linearity of bass is average (14.2% delta to prev. frequency)
Mids 400 - 2000 Hz
(+) | balanced mids - only 2.4% away from median
(+) | mids are linear (5.5% delta to prev. frequency)
Highs 2 - 16 kHz
(+) | balanced highs - only 2% away from median
(+) | highs are linear (4.5% delta to prev. frequency)
Overall 100 - 16.000 Hz
(+) | overall sound is linear (10.2% difference to median)
Compared to same class
» 7% of all tested devices in this class were better, 2% similar, 91% worse
» The best had a delta of 5%, average was 18%, worst was 53%
Compared to all devices tested
» 5% of all tested devices were better, 1% similar, 94% worse
» The best had a delta of 4%, average was 24%, worst was 134%
Energy Management
Power Consumption
Consumption when idling is essentially the same as the Core i3 SKU at 3 W to 7 W depending on the brightness setting and power profile. We're instead interested in how consumption may differ when the system is stressed.
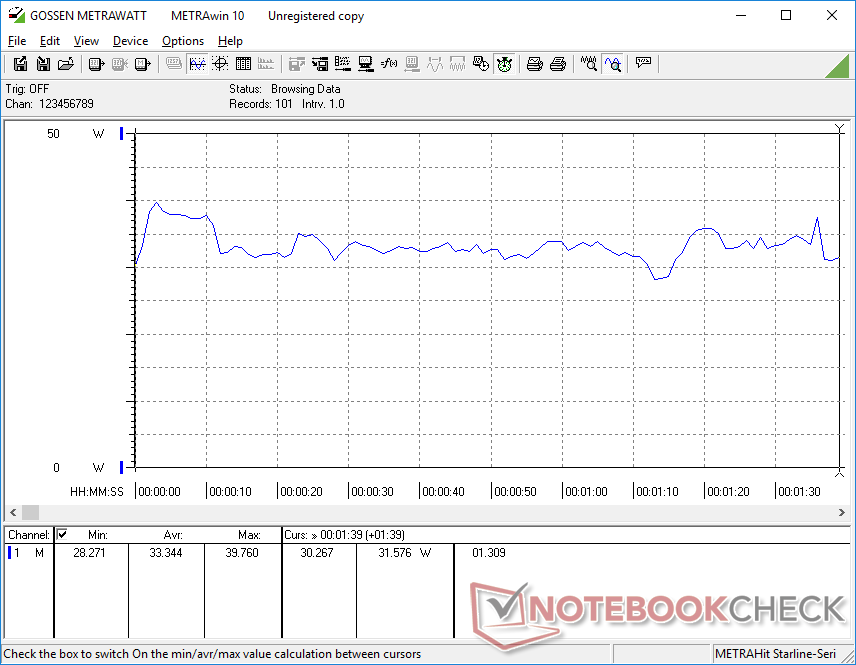
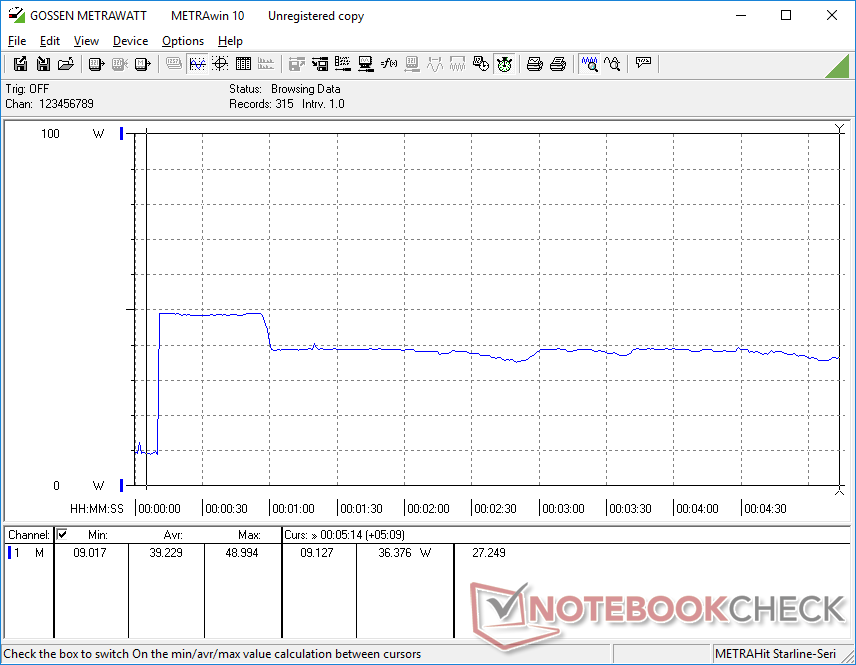
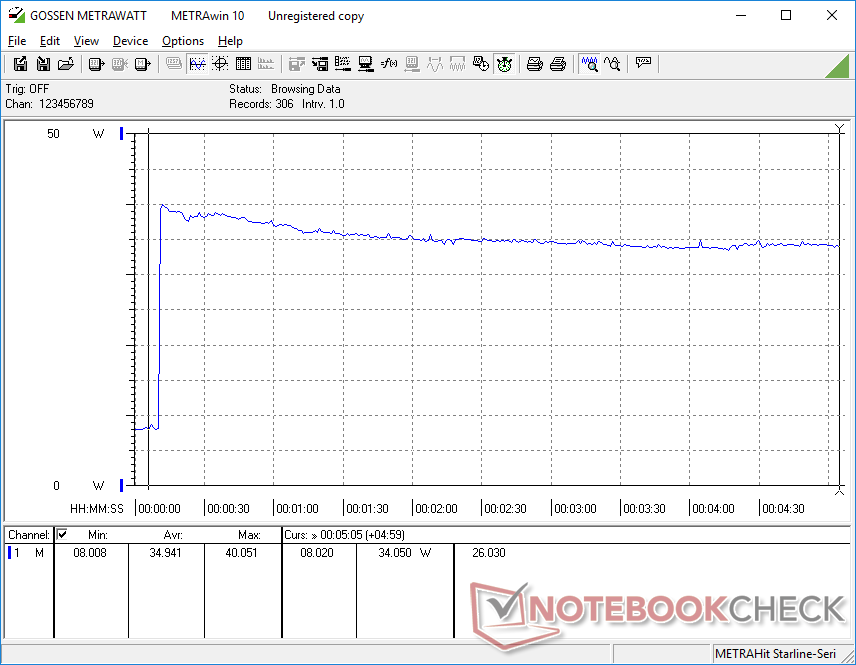
When running Prime95 on the Core i7 SKU, consumption spikes to 49 W for approximately 50 seconds before quickly dropping and stabilizing at about 36 W. In contrast, running Prime95 on the Core i3 SKU would cause consumption to spike to just 40 W before steadily dropping and stabilizing at about 34 W. The Core i7 SKU is able to maintain CPU Turbo Boost clock rates for longer than the Core i3 SKU and both our power consumption and CineBench loop test observations reflect this.
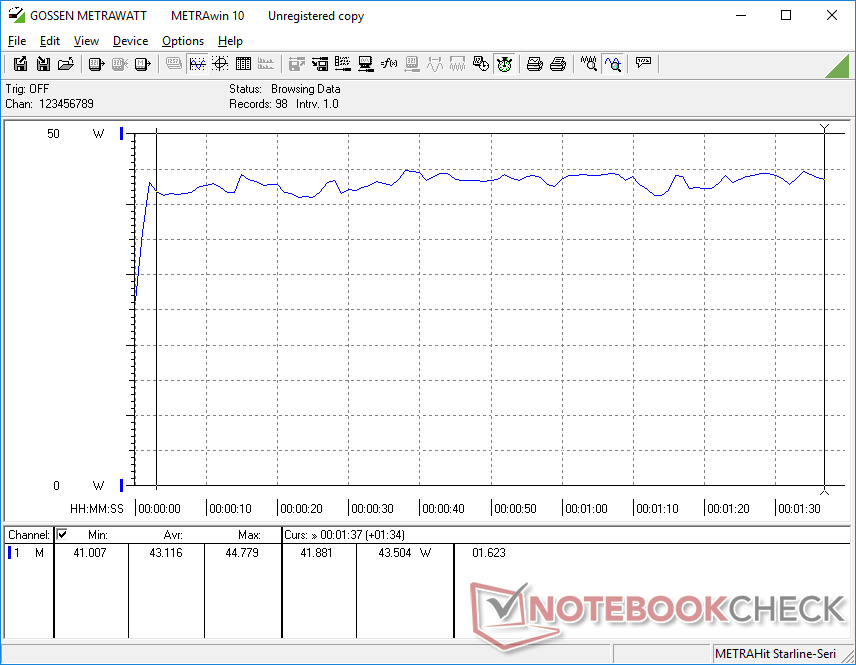
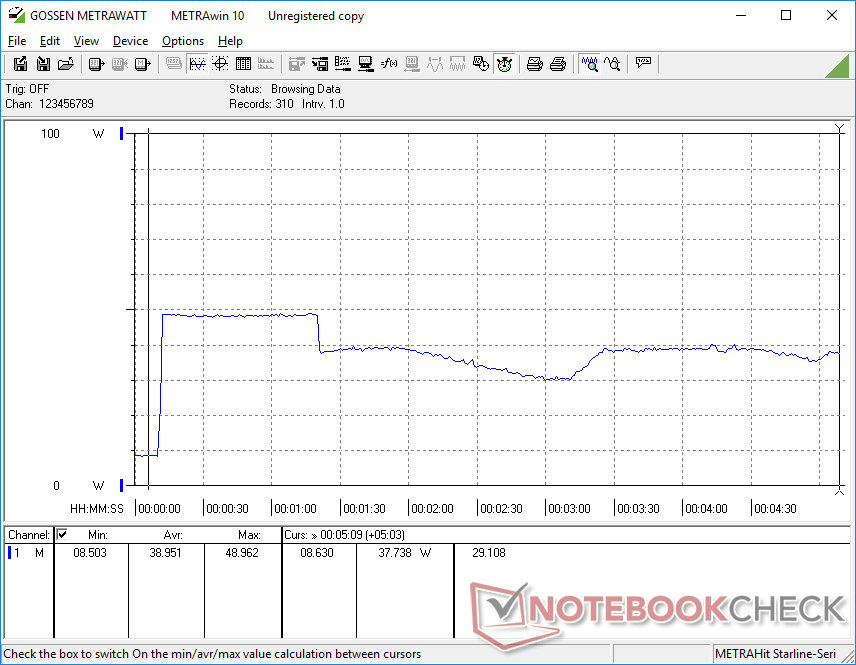
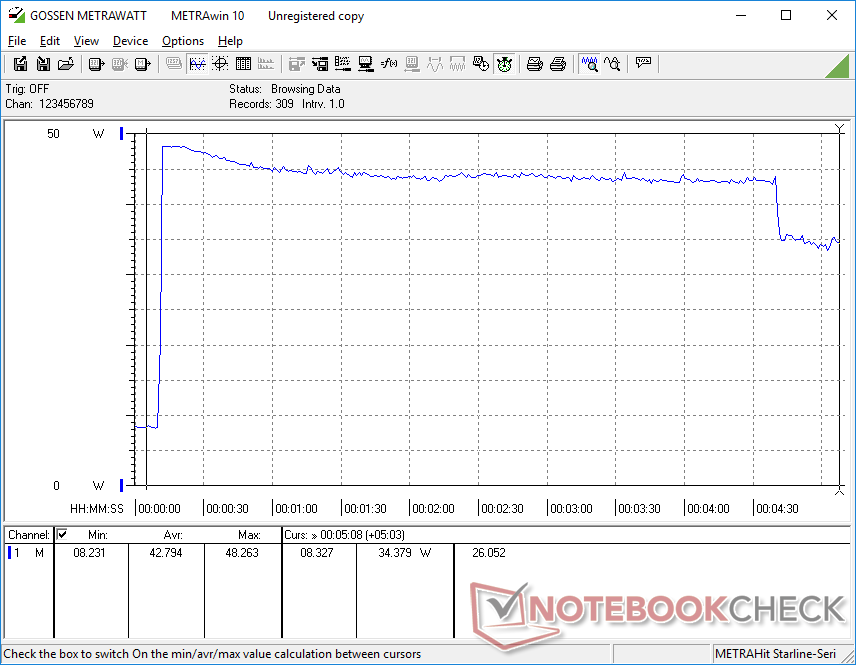
When subjected to 100 percent utilization (Prime95+FurMark), consumption spikes to about 49 W yet again from the very small (~6.0 x 5.5 x 2.3 cm) 45 AC adapter. This eventually drops to about 37 W after the first minute or so due to thermal limits as exemplified by the very high core temperatures in our Stress Test section above.
The graphs below compare the power consumption behaviors between the Core i7 and Core i3 SKUs under different scenarios. Note that their scales are not the same.
| Off / Standby | |
| Idle | |
| Load |
|
Key:
min: | |
| Dell XPS 13 7390 2-in-1 Core i7 i7-1065G7, Iris Plus Graphics G7 (Ice Lake 64 EU), Toshiba BG4 KBG40ZPZ512G, IPS, 1920x1200, 13.4" | HP Envy x360 13-ar0601ng R7 3700U, Vega 10, SK Hynix BC501 HFM512GDJTNG, IPS, 120 Hz, 1920x1080, 13.3" | Dell XPS 13 7390 2-in-1 Core i3 i3-1005G1, UHD Graphics G1 (Ice Lake 32 EU), Toshiba BG4 KBG40ZPZ256G, IPS, 1920x1200, 13.4" | Dell XPS 13 9380 2019 i5-8265U, UHD Graphics 620, SK hynix PC401 HFS256GD9TNG, IPS, 3840x2160, 13.3" | Dell XPS 13 9370 FHD i5 i5-8250U, UHD Graphics 620, Toshiba XG5 KXG50ZNV256G, IPS, 1920x1080, 13.3" | Dell XPS 13-9365 2-in-1 i7-7Y75, HD Graphics 615, Toshiba NVMe THNSN5256GPUK, IPS, 1920x1080, 13.3" | |
|---|---|---|---|---|---|---|
| Power Consumption | -2% | 1% | -37% | 1% | 25% | |
| Idle Minimum * (Watt) | 2.6 | 3.2 -23% | 3 -15% | 4.8 -85% | 3.14 -21% | 3.1 -19% |
| Idle Average * (Watt) | 5.3 | 2.8 47% | 5.4 -2% | 8.6 -62% | 5.22 2% | 4.3 19% |
| Idle Maximum * (Watt) | 7 | 12.4 -77% | 7.3 -4% | 10.4 -49% | 6 14% | 4.9 30% |
| Load Average * (Watt) | 43.1 | 24.2 44% | 33.4 23% | 37.9 12% | 38.5 11% | 24.3 44% |
| Witcher 3 ultra * (Watt) | 43.1 | |||||
| Load Maximum * (Watt) | 49 | 50 -2% | 48.3 1% | 48.5 1% | 50.4 -3% | 22.8 53% |
* ... smaller is better
Battery Life: All-day Browsing and More
We ran the same 150-nit WLAN test between the Core i3 and Core i7 SKUs of the XPS 13 7390 2-in-1 and their results are nearly identical. Users can expect just short of 9 hours of real-world browsing use regardless of the processor option. Setting the display brighter or opting for the 4K UHD SKU will invariably reduce battery life.
| Dell XPS 13 7390 2-in-1 Core i7 i7-1065G7, Iris Plus Graphics G7 (Ice Lake 64 EU), 51 Wh | Dell XPS 13 7390 2-in-1 Core i3 i3-1005G1, UHD Graphics G1 (Ice Lake 32 EU), 51 Wh | Dell XPS 13 9380 2019 i5-8265U, UHD Graphics 620, 52 Wh | Dell XPS 13 9370 FHD i5 i5-8250U, UHD Graphics 620, 52 Wh | Dell XPS 13 9360 FHD i7 Iris i7-7560U, Iris Plus Graphics 640, 60 Wh | Dell XPS 13-9365 2-in-1 i7-7Y75, HD Graphics 615, 46 Wh | |
|---|---|---|---|---|---|---|
| Battery runtime | -1% | -8% | 19% | 21% | 27% | |
| WiFi v1.3 (h) | 9 | 8.9 -1% | 8.3 -8% | 10.7 19% | 10.9 21% | 11.4 27% |
| Reader / Idle (h) | 35.7 | 17.2 | 23.6 | 25.4 | 16.2 | |
| Load (h) | 2.2 | 2.4 | 2 | 2.6 | 2.9 |
Pros
Cons
Verdict
There are two major attributes to consider for the XPS 13 7390 2-in-1: The brand new processor and then the laptop itself. The 25 W Ice Lake CPU is a measurable upgrade over the last generation 15 W Whiskey Lake-U series in both CPU and GPU horsepower. The deltas are wide enough that this convertible can actually outperform any XPS 13 model that has come before it. The fact that you can run most popular multiplayer titles on a subnotebook this thin and light is already a notable feat even if the CPU has to run much warmer than usual to do so. In this case, Ice Lake has achieved what Intel wanted it do: Offer comparable raw performance to the 35 W AMD Ryzen 7 3700U at a higher performance-per-Watt while integrating AI acceleration to better future-proof the series.
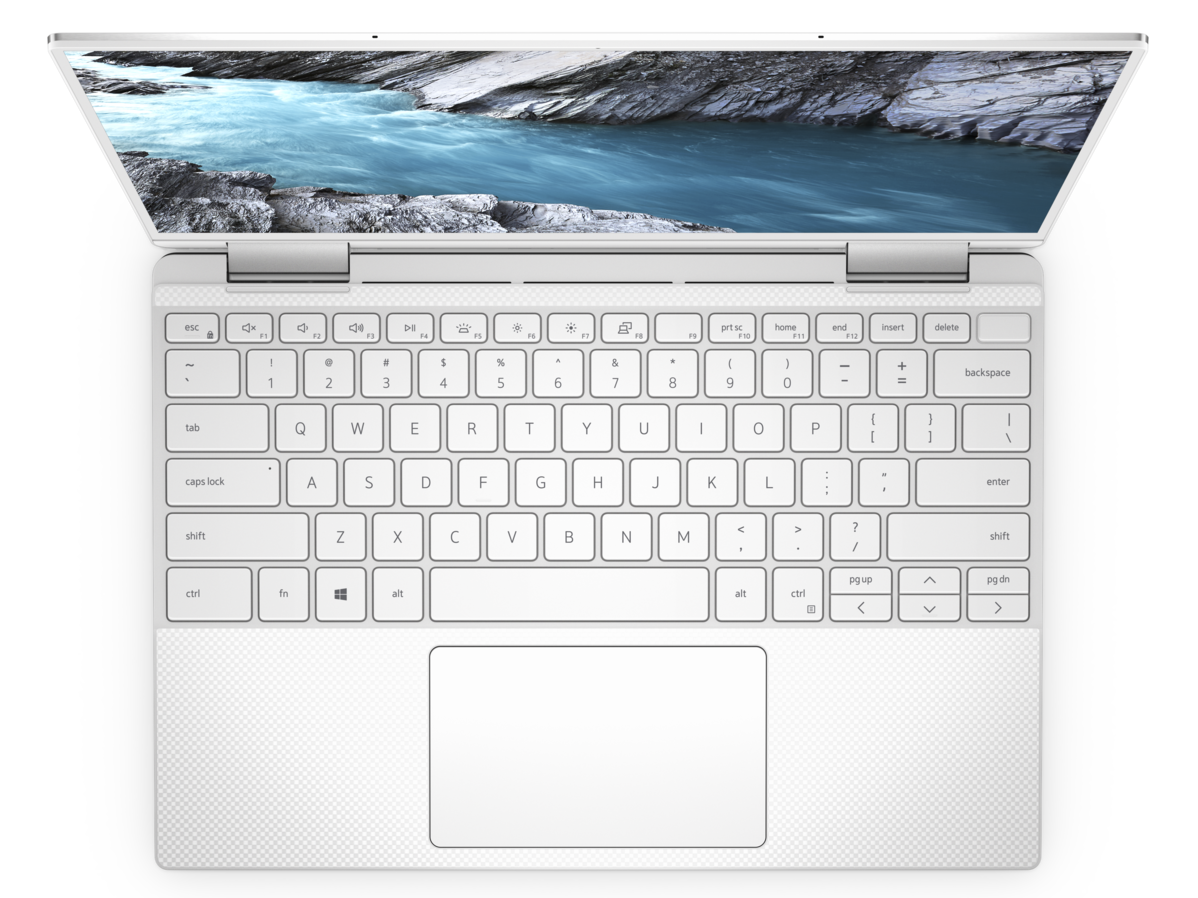
As for the actual XPS 13 7390 2-in-1 laptop, we think the fans could have been lower-pitched to be more inconspicuous during high loads and the cramped Arrow keys could have been larger. Otherwise, there's not much to dislike about it as we love the bright panel, wide color gamut, long battery life, and very small form factor. Battery life, fan behavior, and temperatures are similar to the Core i3 SKU despite their performance differences. Instead, it's what's not here that we don't like because the convertible feels barebones and stripped of features. HP is about to launch its own Ice Lake-powered Spectre x360 13 and refreshed EliteBook with a handful of features not found on the Dell including upgradeable storage, 4G LTE, eSIM, HDMI, USB Type-A, and an even brighter 1000-nit panel. You'll be giving up a lot of extras just for the thin aesthetics of the latest XPS 13 2-in-1.
The XPS 13 7390 2-in-1 runs faster than what its humble appearance may otherwise suggest. On the flip side, its super-thin design has omitted several end-user upgrade options and connectivity features that most competing Ultrabooks tend to offer as standard.
Dell XPS 13 7390 2-in-1 Core i7
- 05/15/2020 v7 (old)
Allen Ngo
Price comparison
