Huawei Matebook X Pro (i5-8250U, MX150) Laptop Review
(February 14, 2019 update: The MateBook X Pro does not have a full-lane Thunderbolt 3 port as detailed here. We've updated our Verdict to reflect this.)
When compared to the budget-mainstream MateBook D series, the MateBook X series competes directly with the best that Dell, Apple, Lenovo, and Asus have to offer in the high-end consumer space. Last year's model left a very positive impression in terms of design and build quality and it proved that Huawei was serious about breaking into the crowded laptop space.
Fast forward to 2018 and Huawei's second generation MateBook X is ready to hit store shelves. Called the MateBook X Pro, it brings massive updates to the MateBook X family including a larger screen size, a system fan, discrete Nvidia graphics, and even a pop-up webcam. Major differences between the MateBook X and MateBook X Pro are shown in the table below.
The MateBook X Pro is launching in two SKUs in North America as detailed here. $1200 USD will net users an i5-8250U CPU, integrated UHD 620 Graphics, 8 GB of RAM, and 256 GB NVMe SSD while $1500 USD will net users an i7-8550U, GeForce MX150 graphics, 16 GB of RAM, and 512 GB NVMe SSD. Our test unit today is a European model with the i5-8250U CPU, GeForce MX150 GPU, 16 GB of RAM, and 256 GB SSD. Unlike Dell's very wide range of XPS configurations, Huawei is concentrating on faster and fewer SKUs without the unattractive Core i3 and 4 GB options. Do the changes propel the system to be as enticing as a MacBook or XPS?
- Huawei MateBook X
- Huawei MateBook D
- Dell XPS 13 9370/9360
- Lenovo Yoga 920
- Asus Zenbook UX3430UN
- Apple MacBook Pro 15
| MateBook X | MateBook X Pro | |
|---|---|---|
| CPU | Intel 7th gen. Core i5-7200U or i7-7500U | Intel 8th gen. Core i5-8250U or i7-8550U |
| GPU | HD Graphics 620 | UHD Graphics 620 or GeForce MX150 w/ 2 GB GDDR5 VRAM and Optimus |
| RAM | 8 GB LPDDR3 soldered | 8 GB or 16 GB LPDDR3 soldered |
| Display | 13.3-inch 3:2, 2160 x 1440 pixel | 13.9-inch 3:2, 3000 x 2000 pixel |
| Ports | 3.5 mm audio, 2x USB Type-C Gen. 1 | 3.5 mm audio, USB 3.0 Type-A, USB Type-C Gen. 1, Thunderbolt 3 (20 Gbps only) |
| Dimensions | 12.5 x 286 x 211 mm | 14.6 x 304 x 217 mm |
| Battery | 40 Wh | 57.4 Wh |
| Weight | 1.05 kg | 1.33 kg |
Case
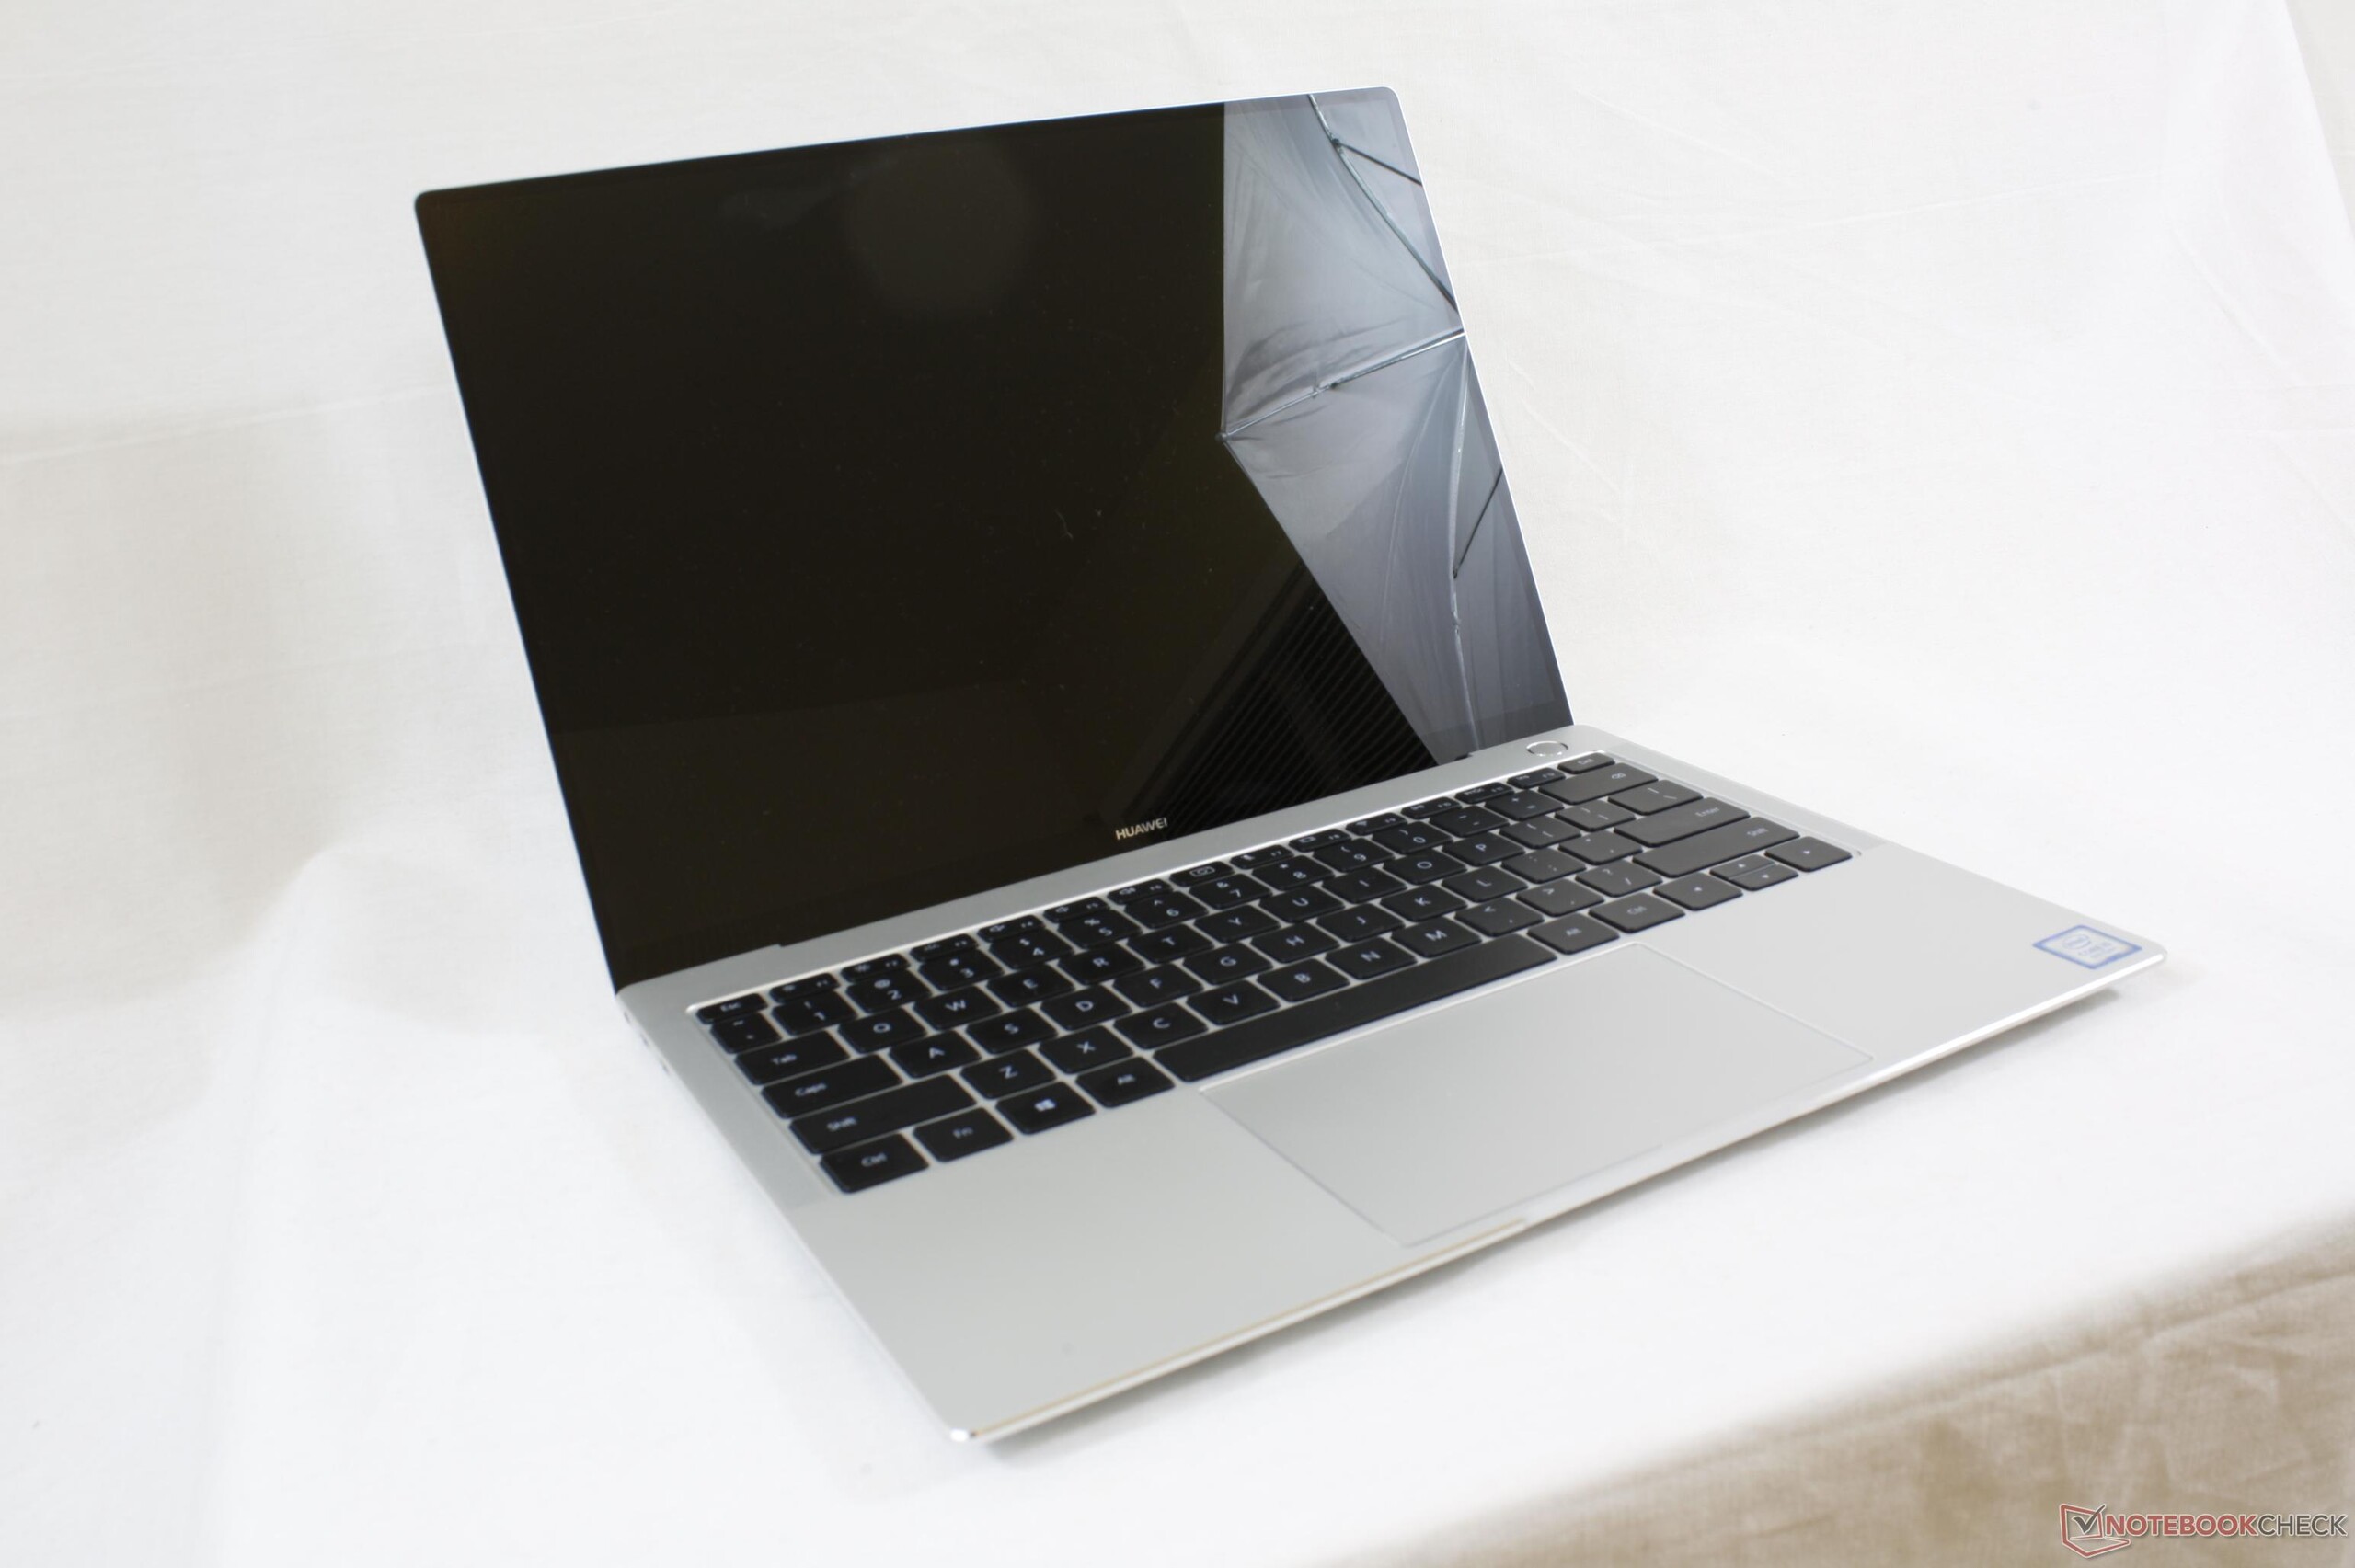
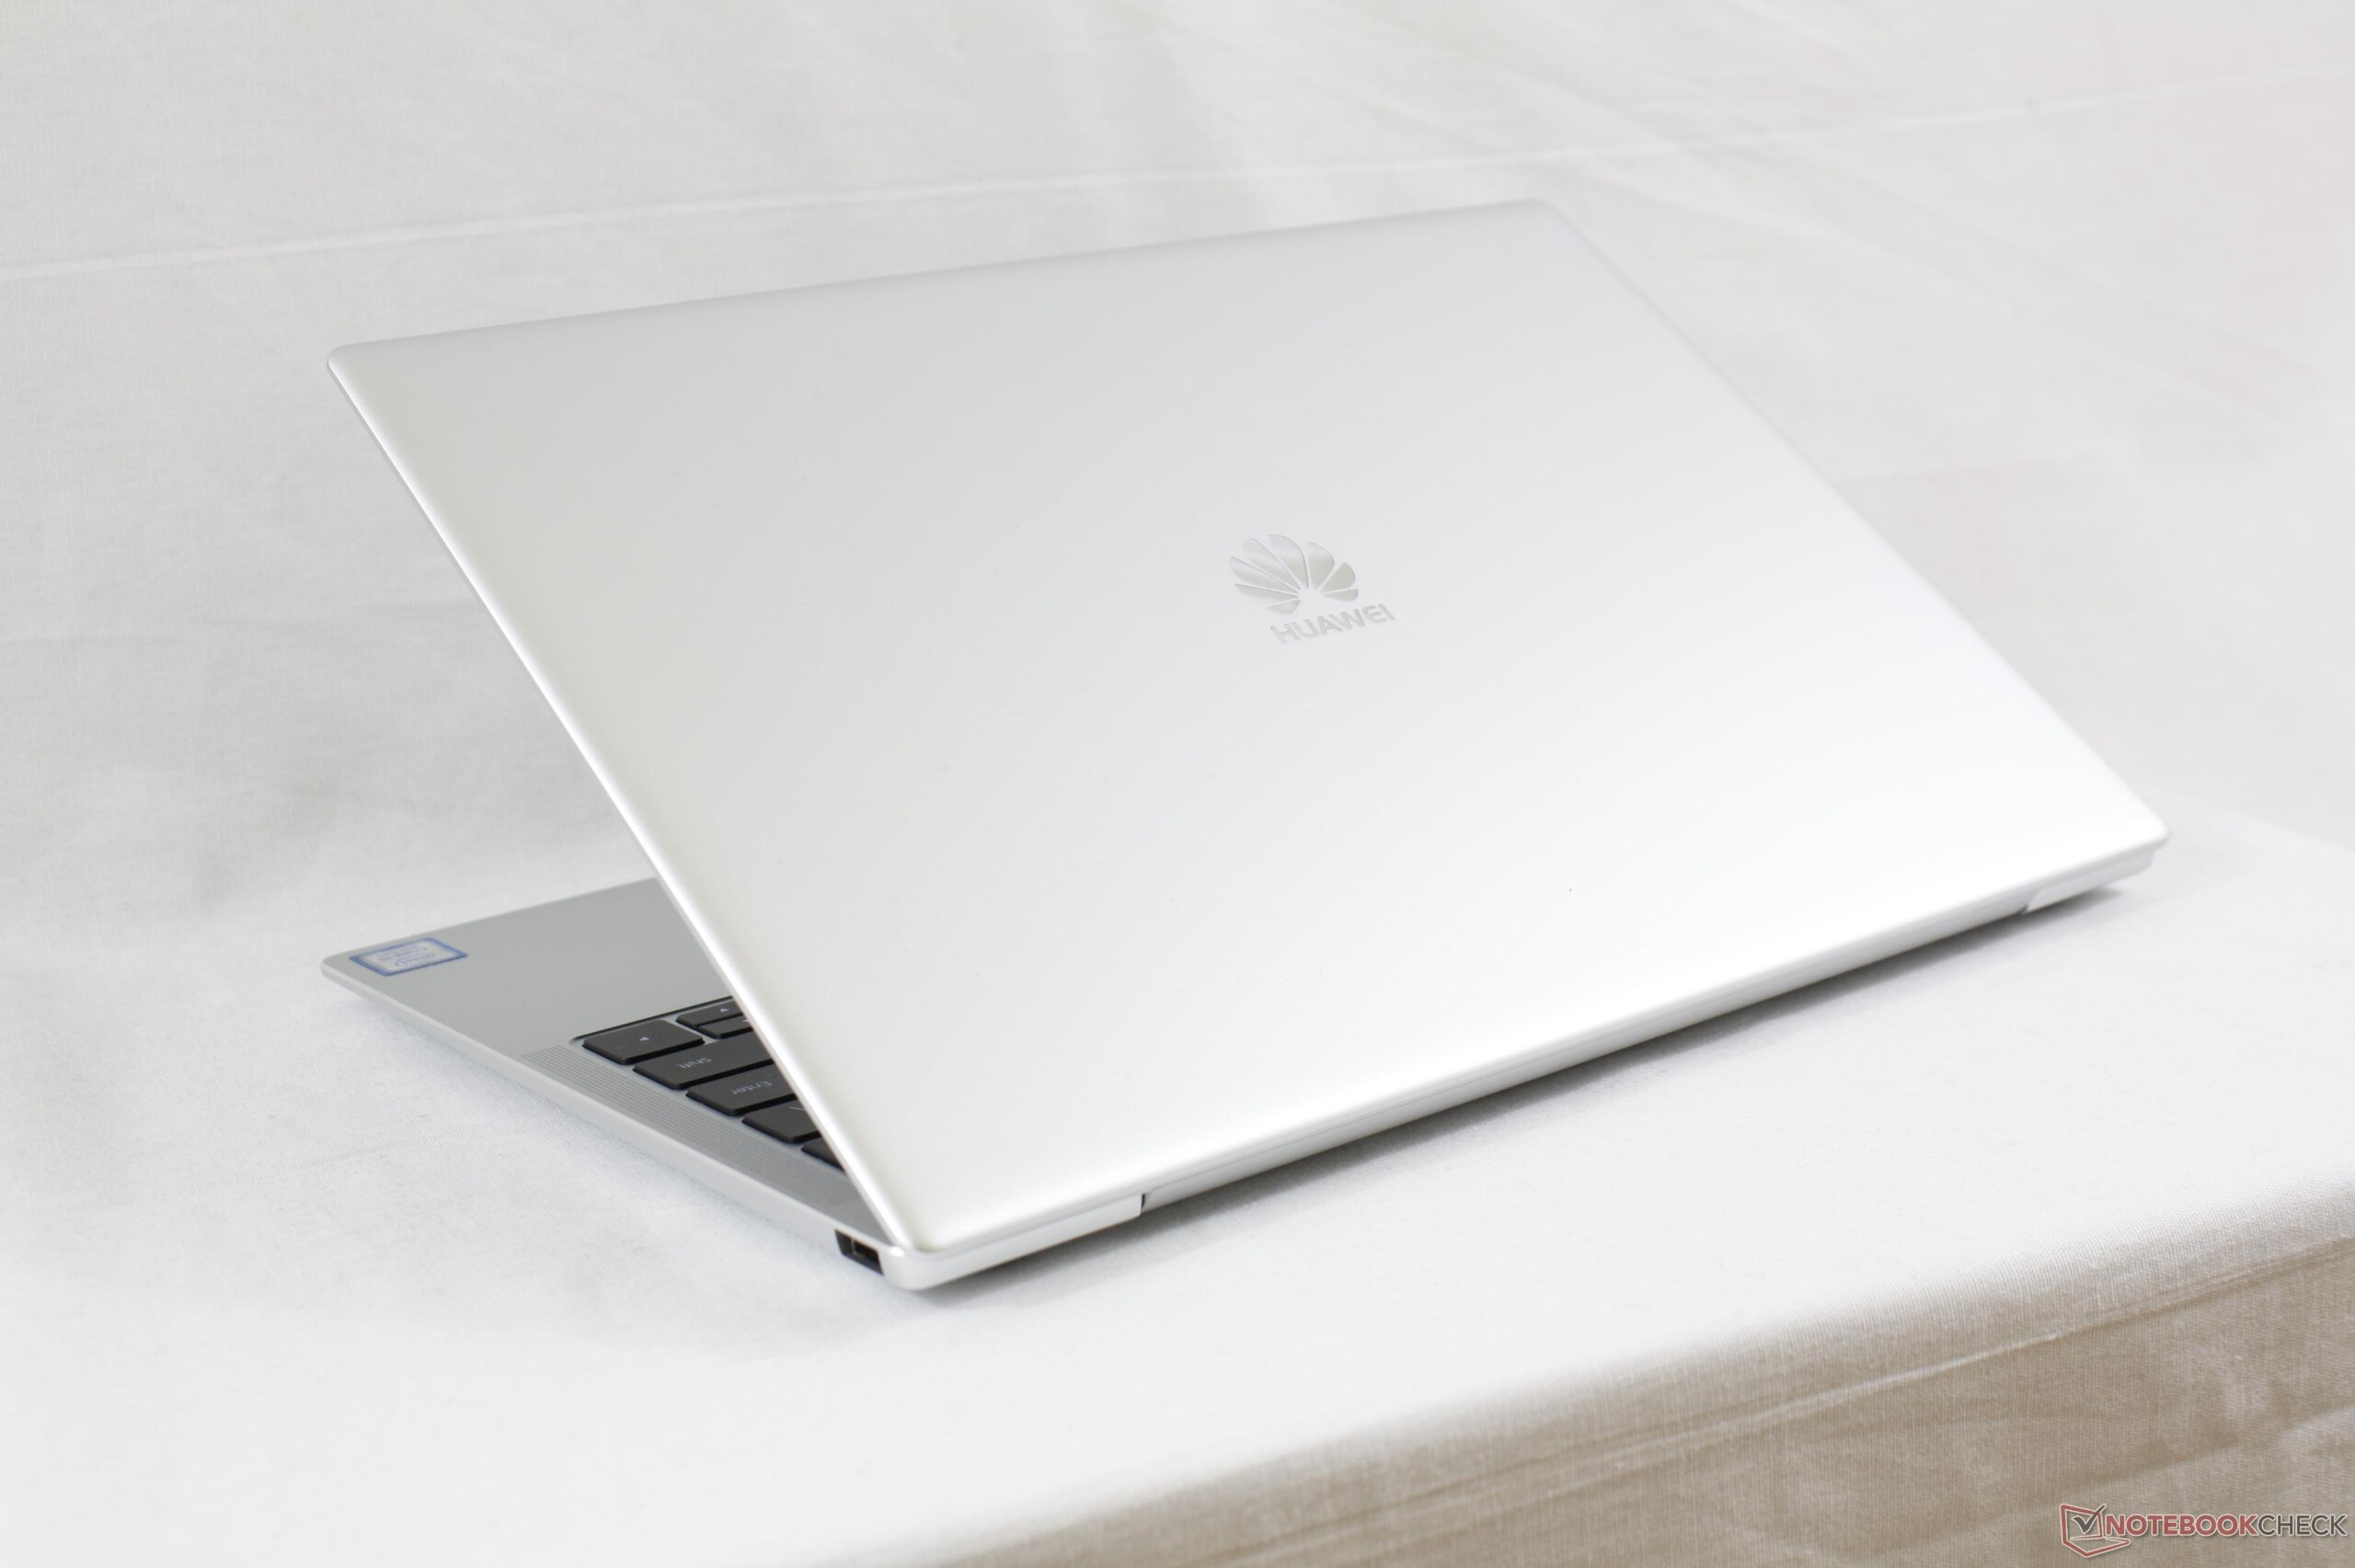
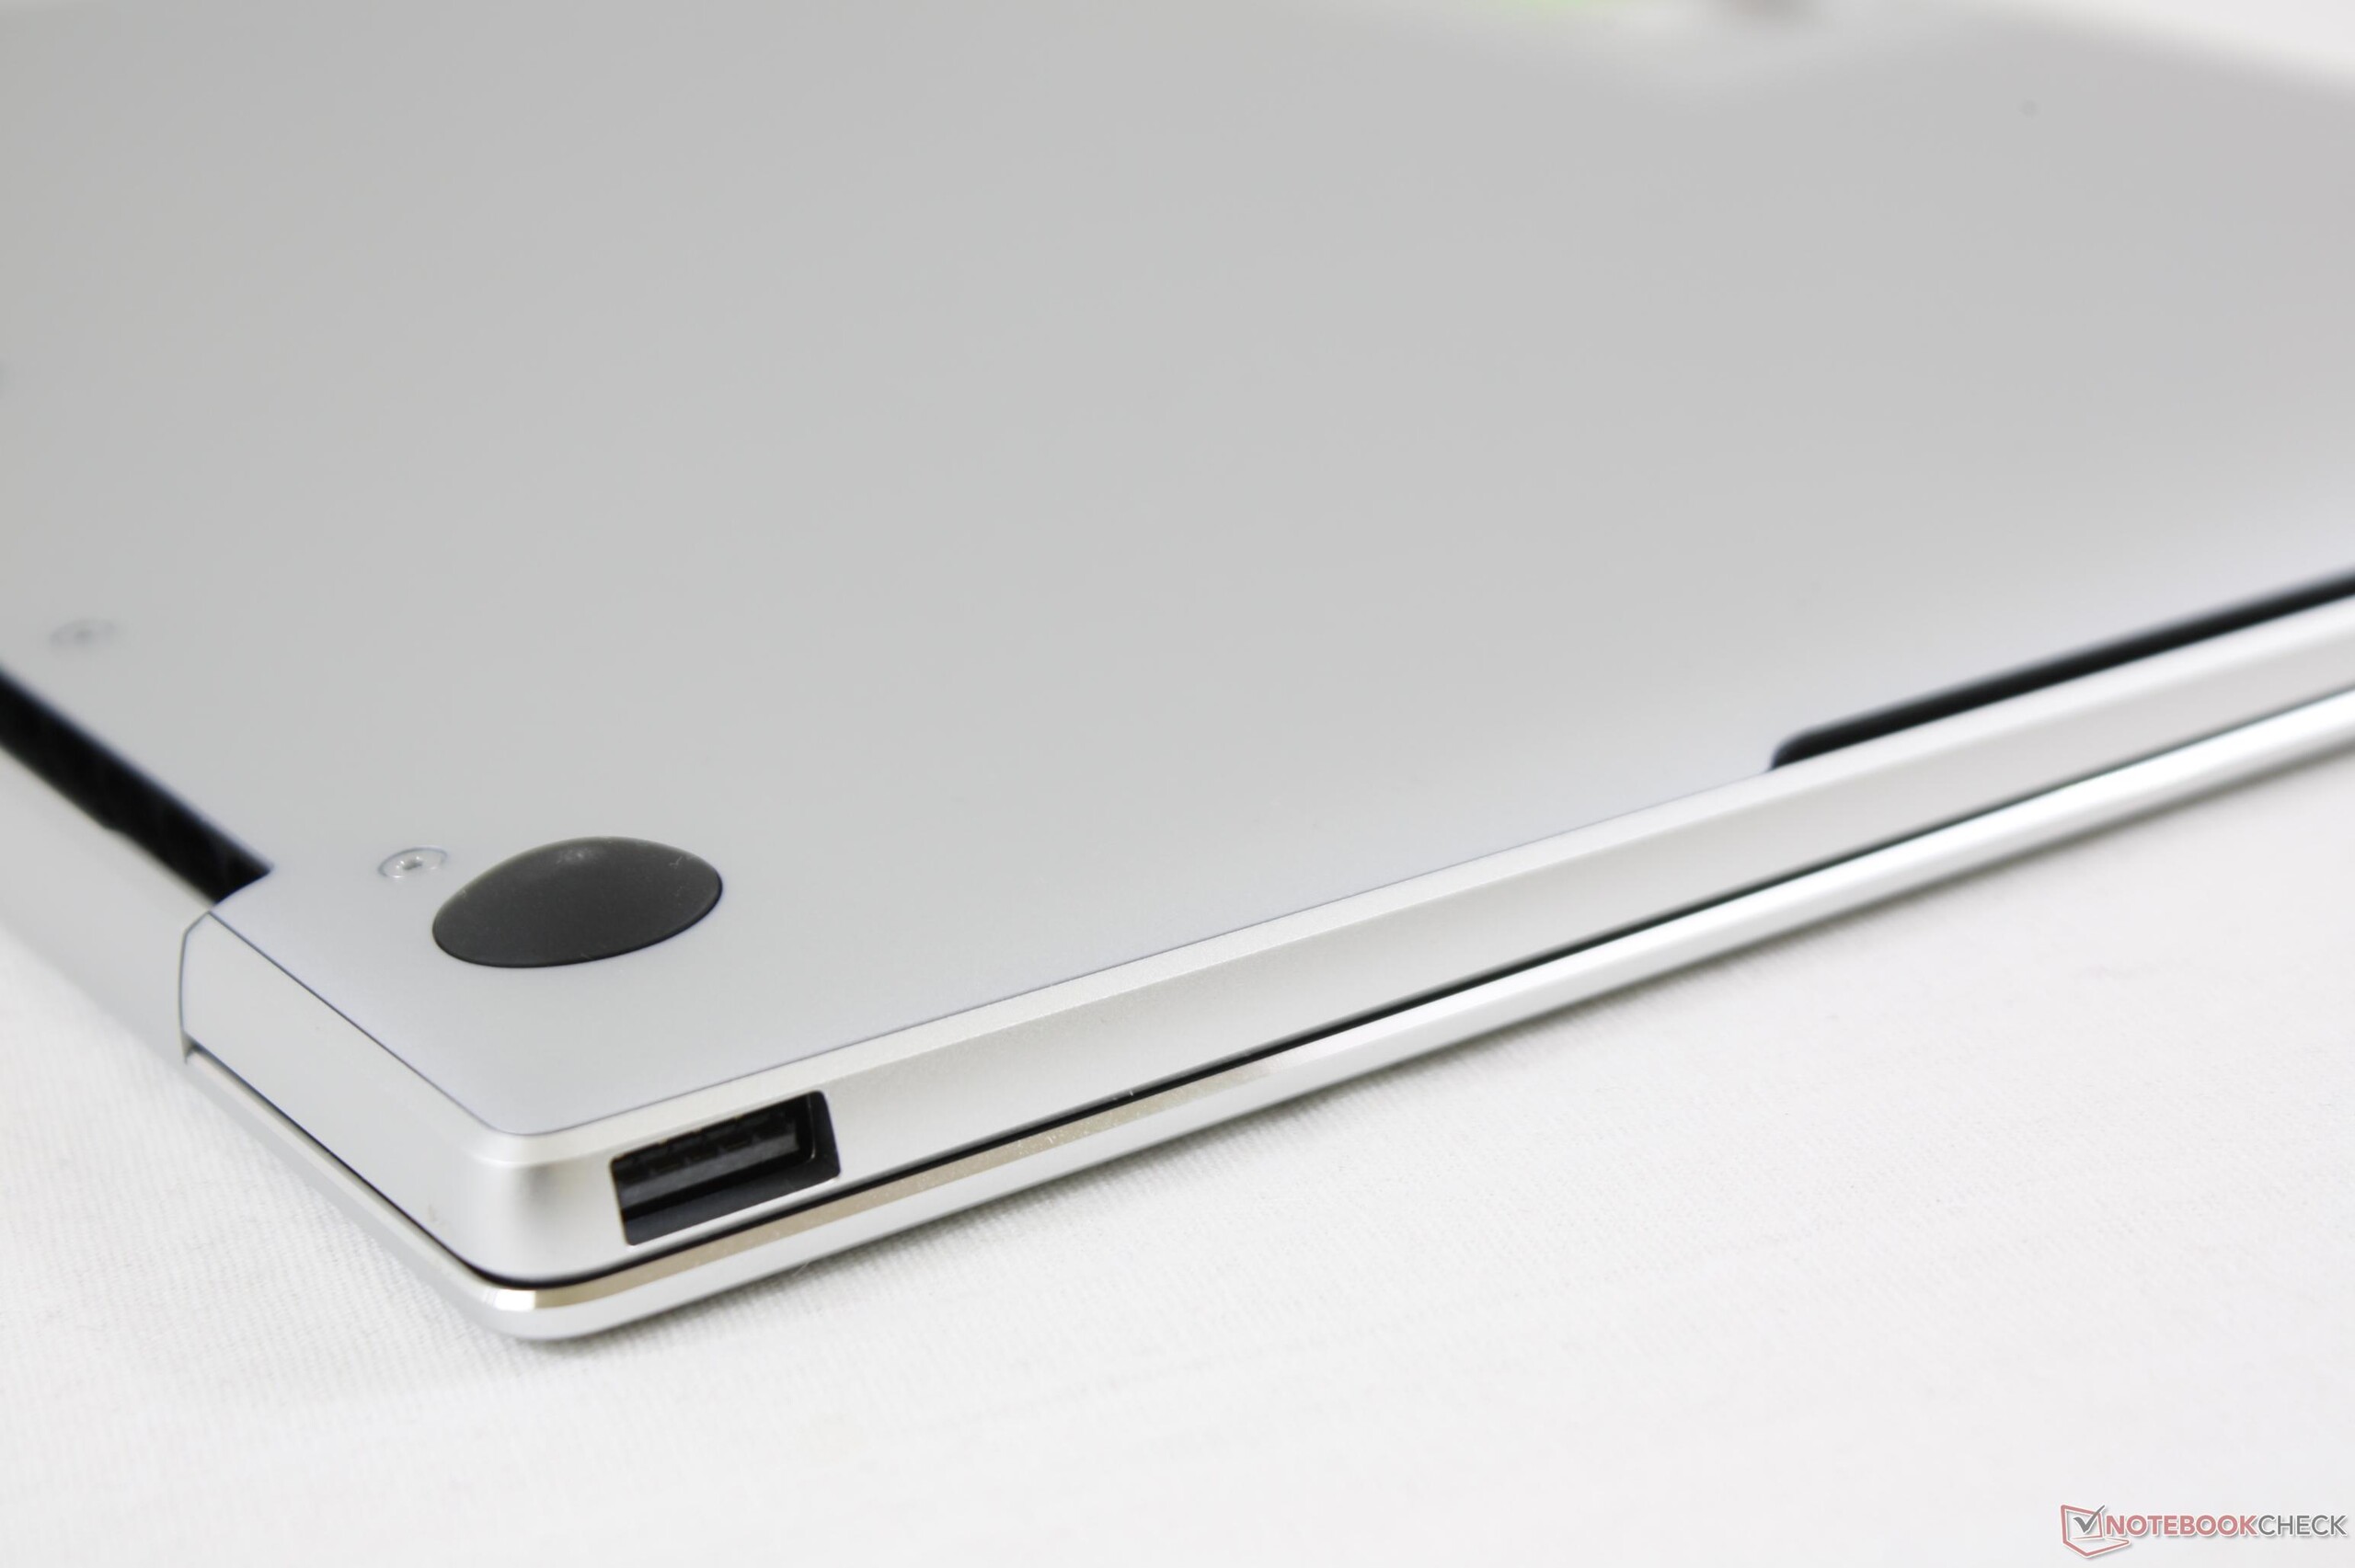
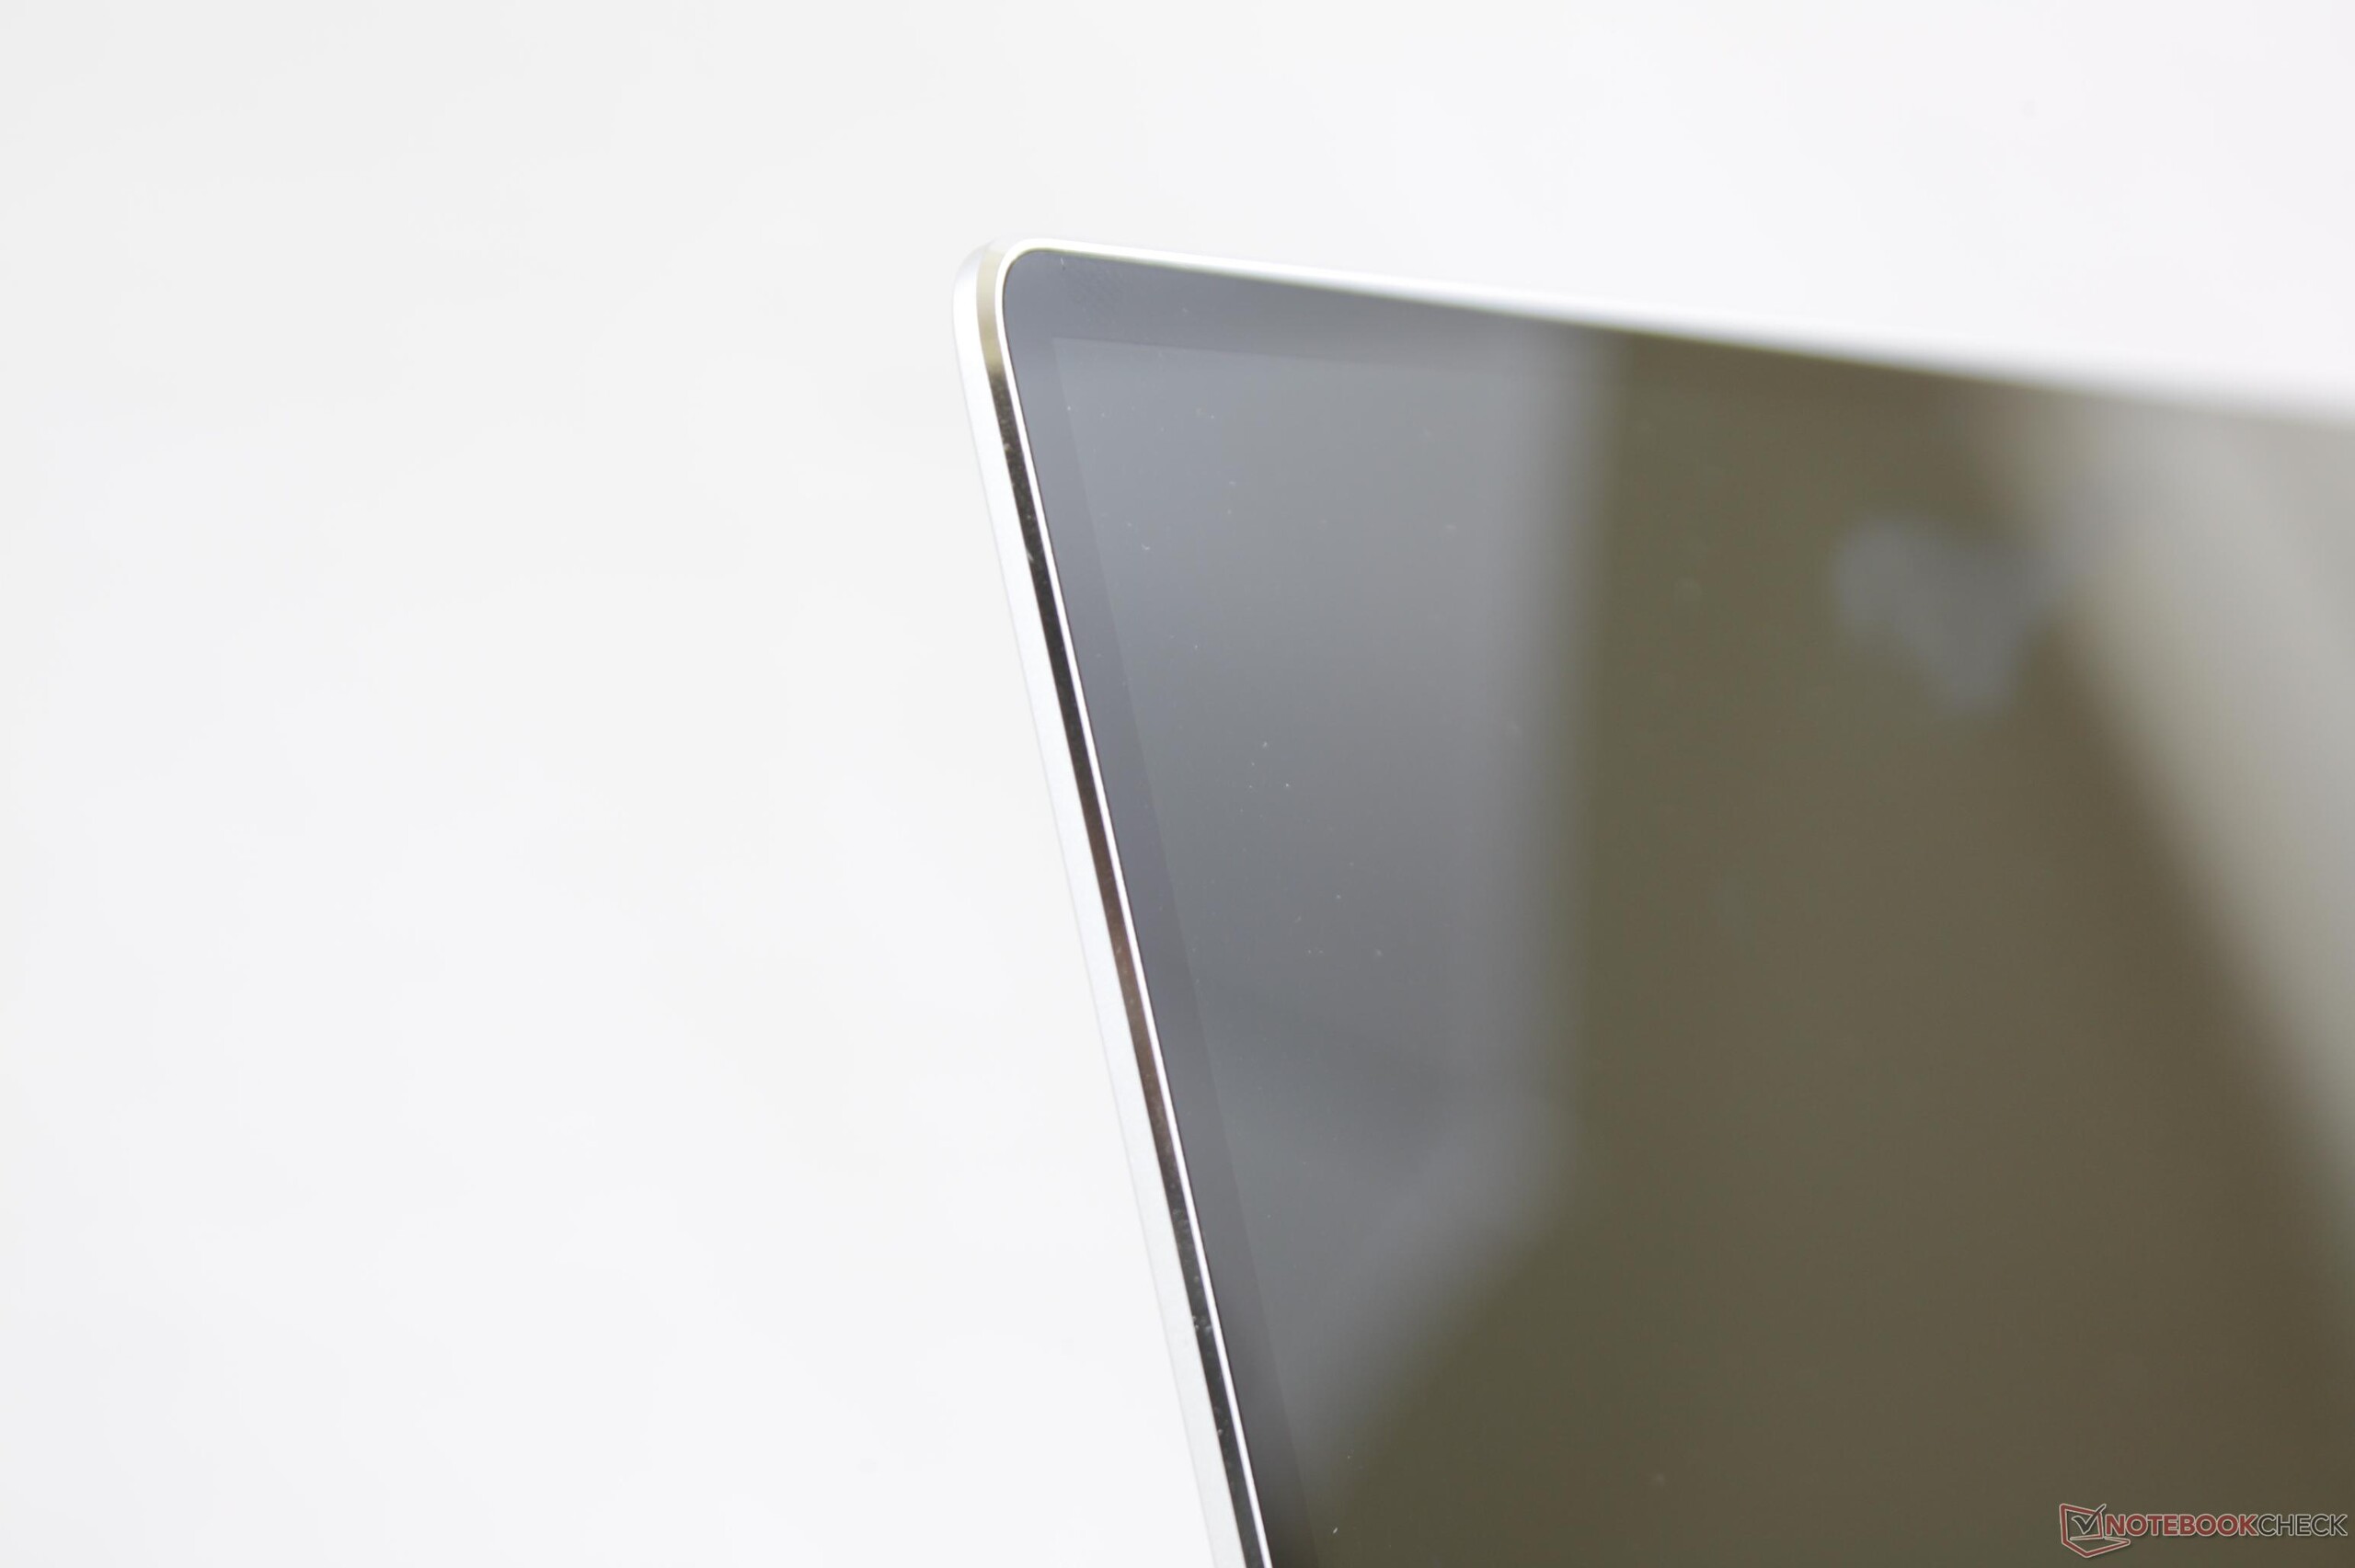
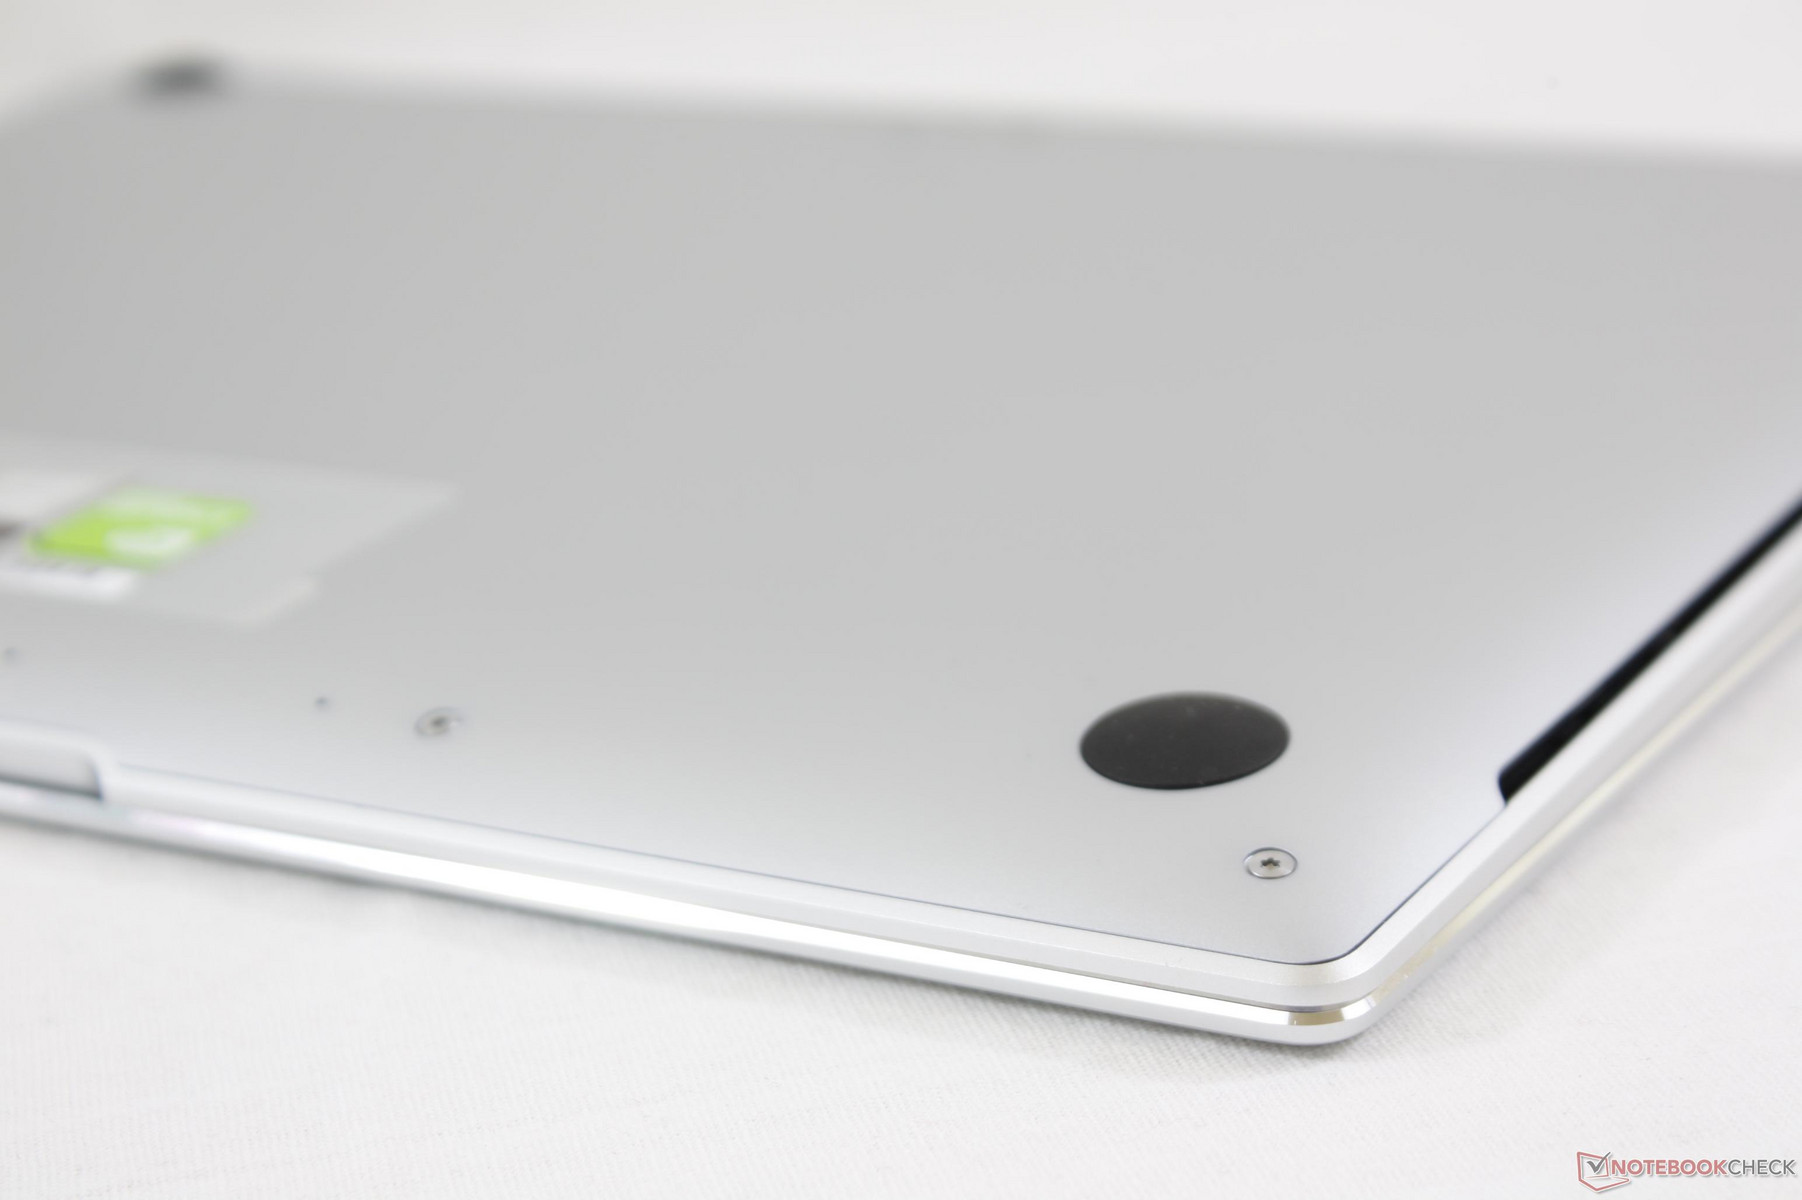
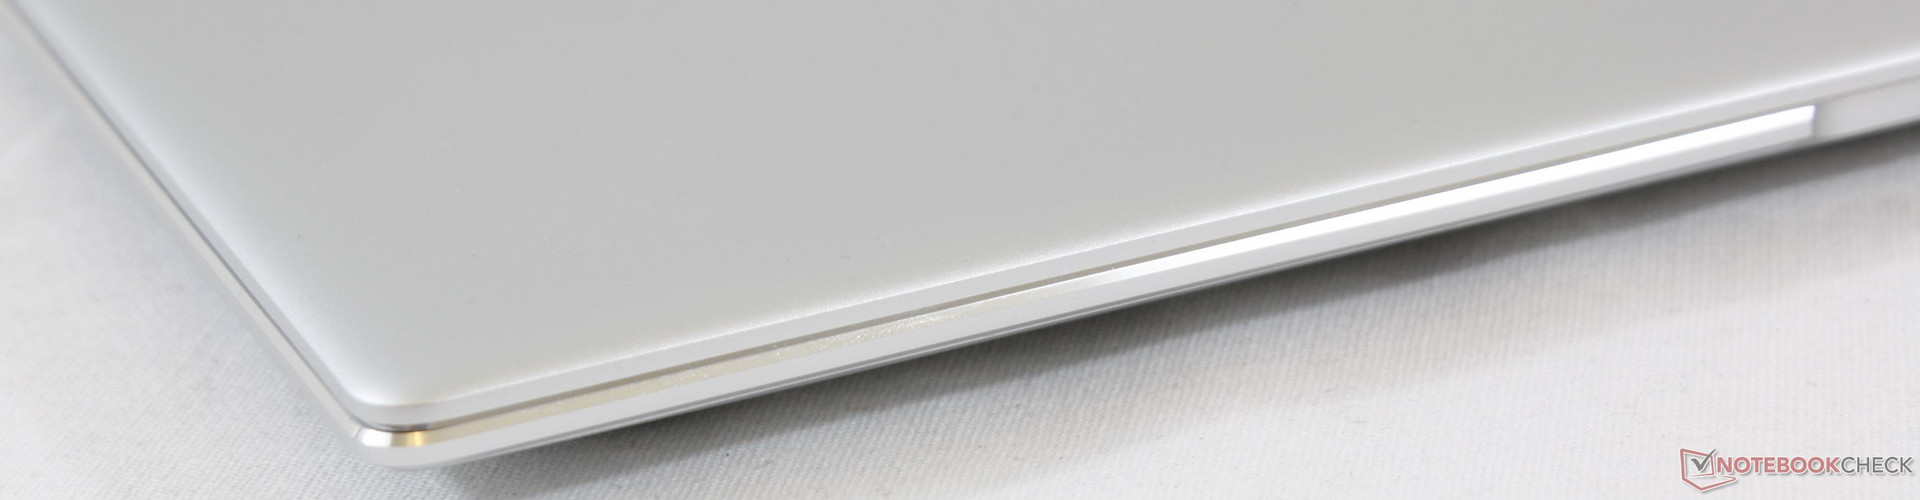
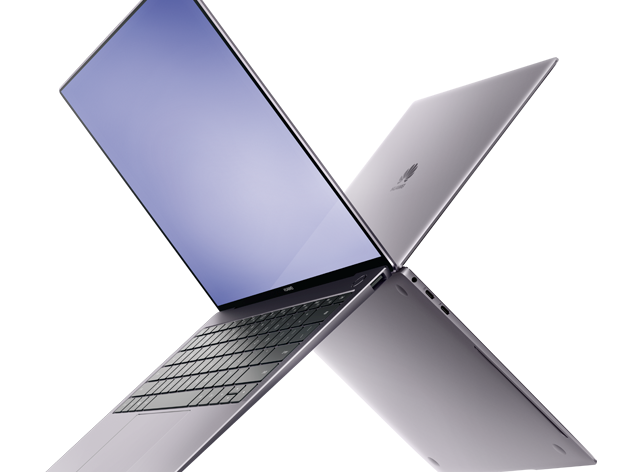
Much like the first MateBook X, the newer model has a high quality feel from top to bottom. The smooth matte aluminum surfaces return alongside the chrome-cut edges and corners and an even higher 91 percent screen-to-body ratio. Users can easily distinguish between the two generations by the pronounced Huawei logo found only on the MateBook X Pro.
Does the sleek design translate well to quality and rigidity? The MateBook X has set a standard for Huawei and we're glad to see that the manufacturer hasn't buckled or cut any corners. Flexing is minimal around the base and center of the keyboard and likewise for the lid despite the very narrow bezels. The display is significantly firmer than on both the Samsung NP900X3N and LG Gram 13 but still weaker overall compared to the XPS 13, Razer Blade Stealth, and MacBook Pro 13. The bar hinge is sufficiently firm and uniform with minimal teetering up to its maximum of about 150 degrees.
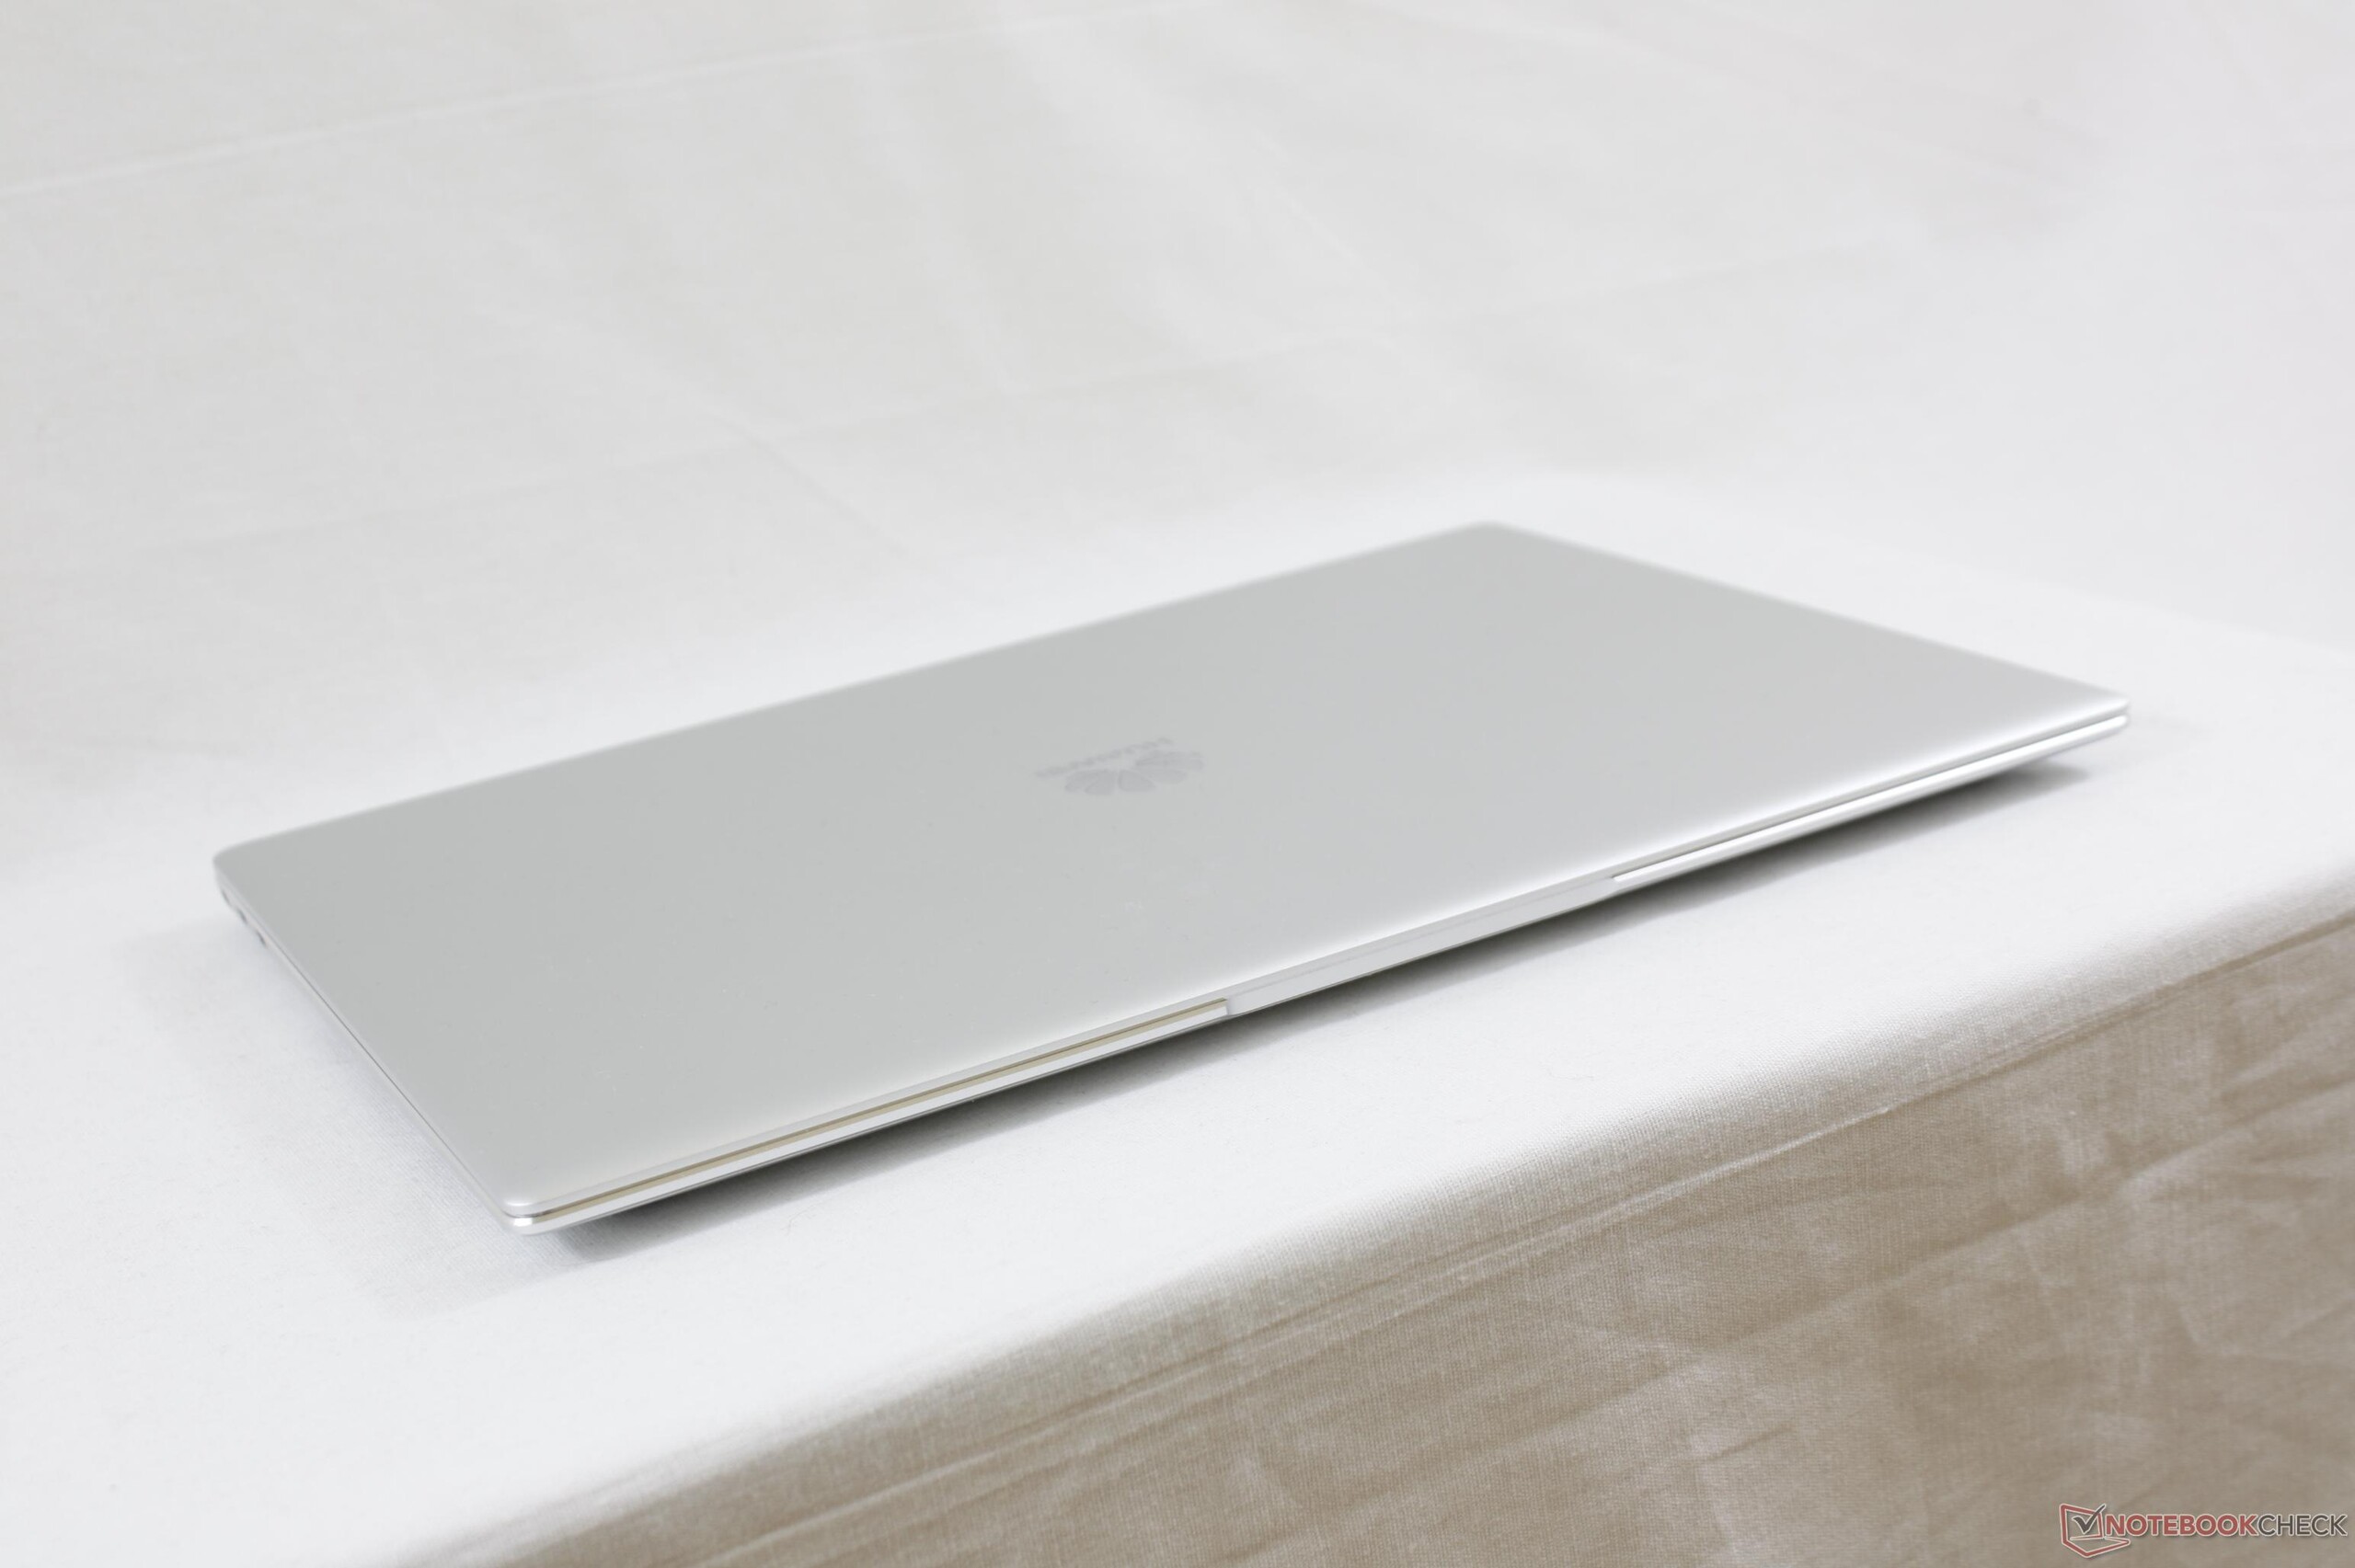
Stuffing in all those new features come at a cost. The MateBook X Pro is thicker, larger, and heavier than the original as shown by the comparison tool below. In fact, the Huawei notebook is now closer than ever to the dimensions and weight of the MacBook Pro 13 and comparable to competing 13-inch Ultrabooks in terms of portability. To Huawei's advantage, the extremely narrow bezels mean a slightly larger screen size (13.9-inch vs. 13.3-inch) without necessarily contributing to a larger footprint.
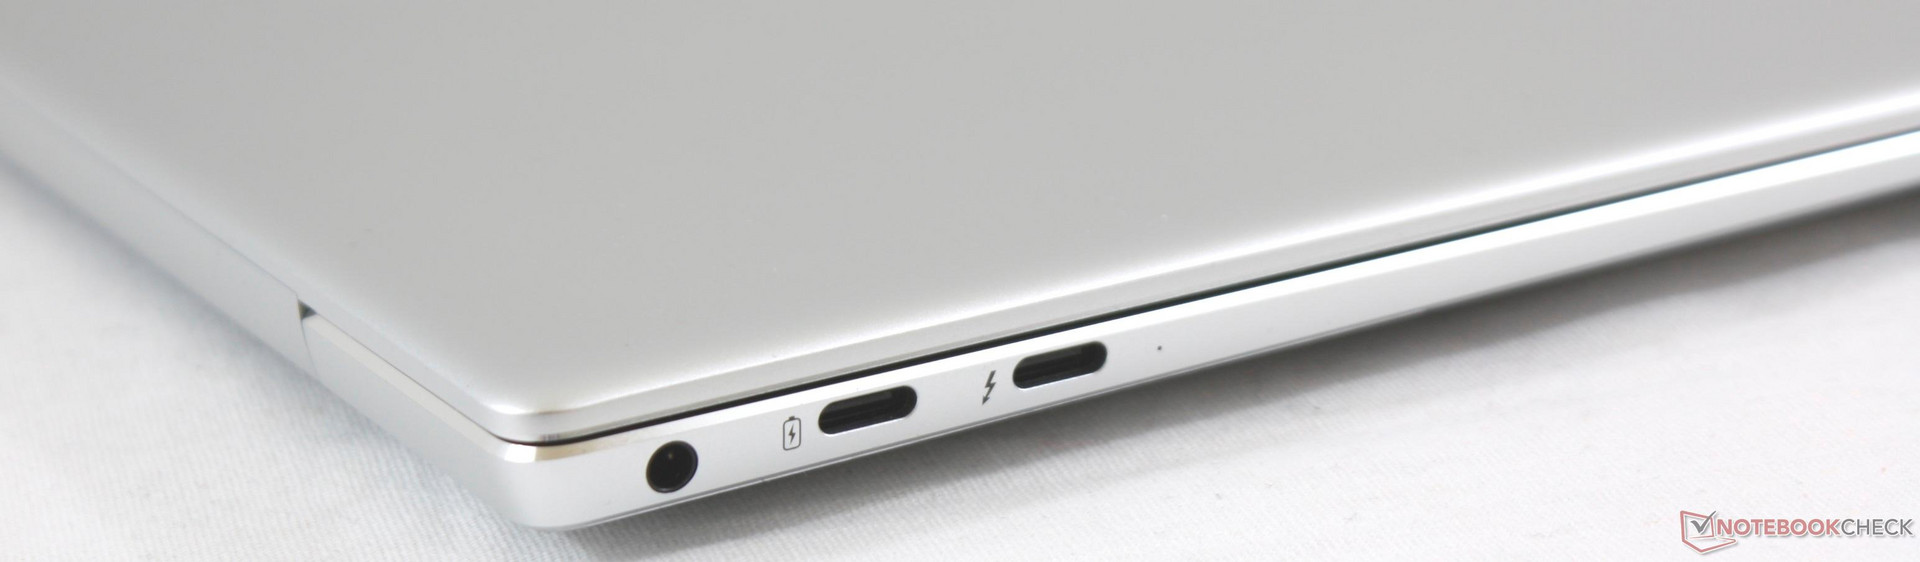
Connectivity
(July 16, 2018 update): We've since discovered that the Thunderbolt 3 port may only offer a maximum of 20 Gbps (PCIe x2) instead of 40 Gbps (PCIe x4). See our investigation here for more details.
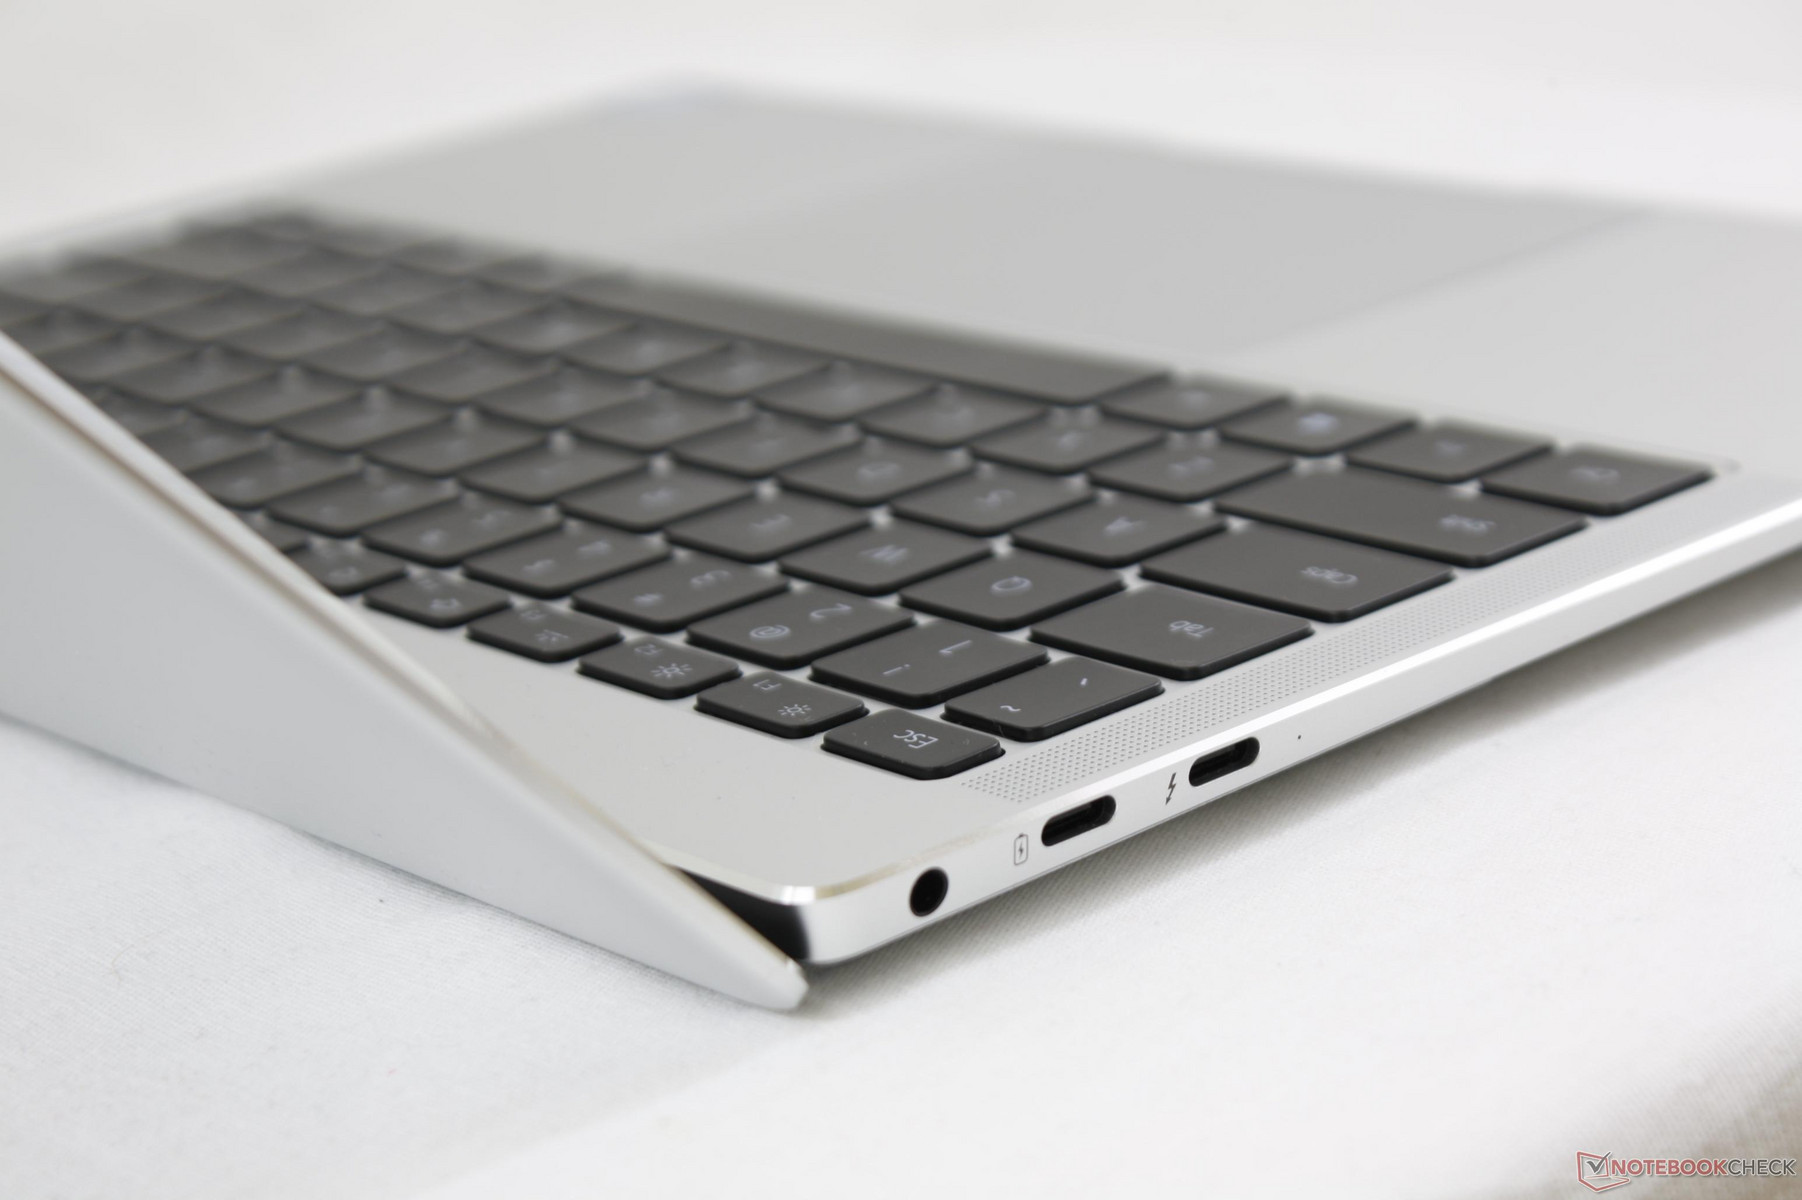
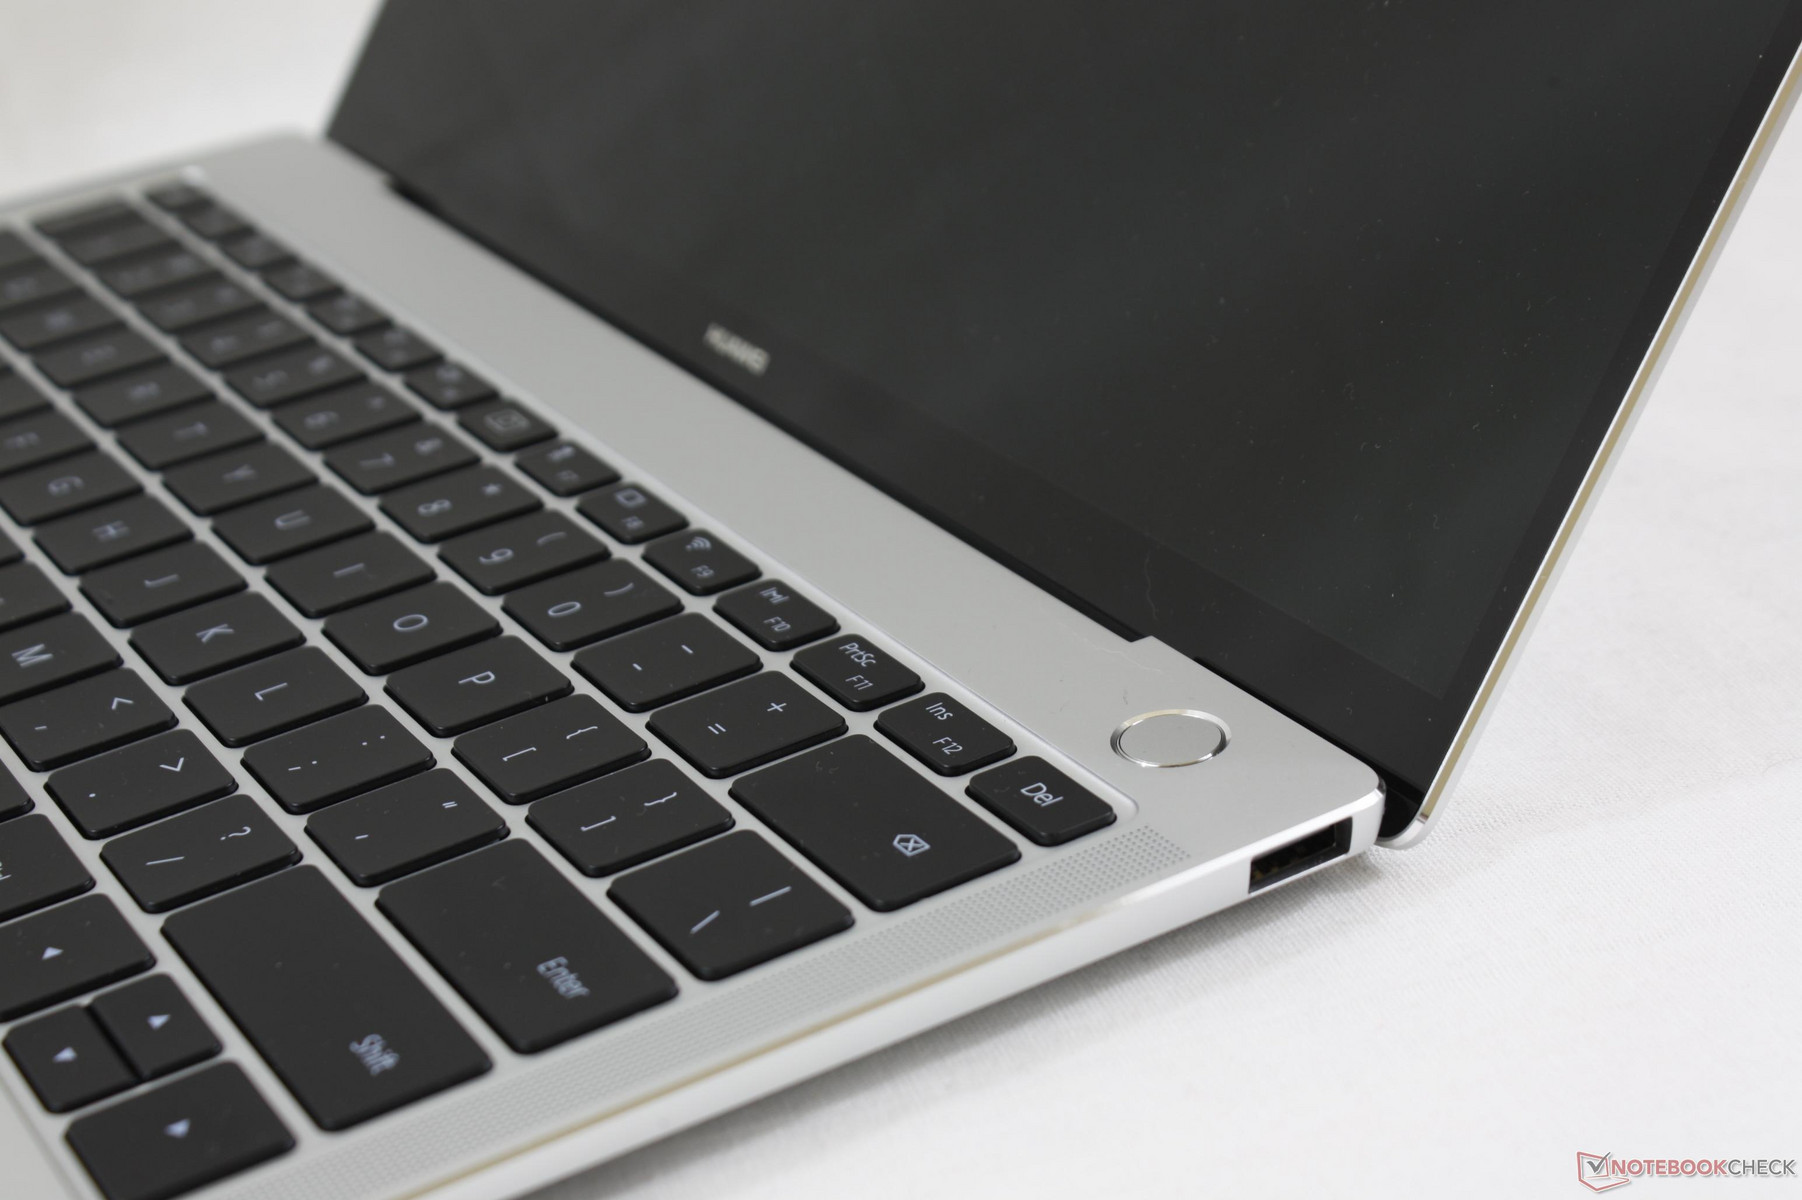
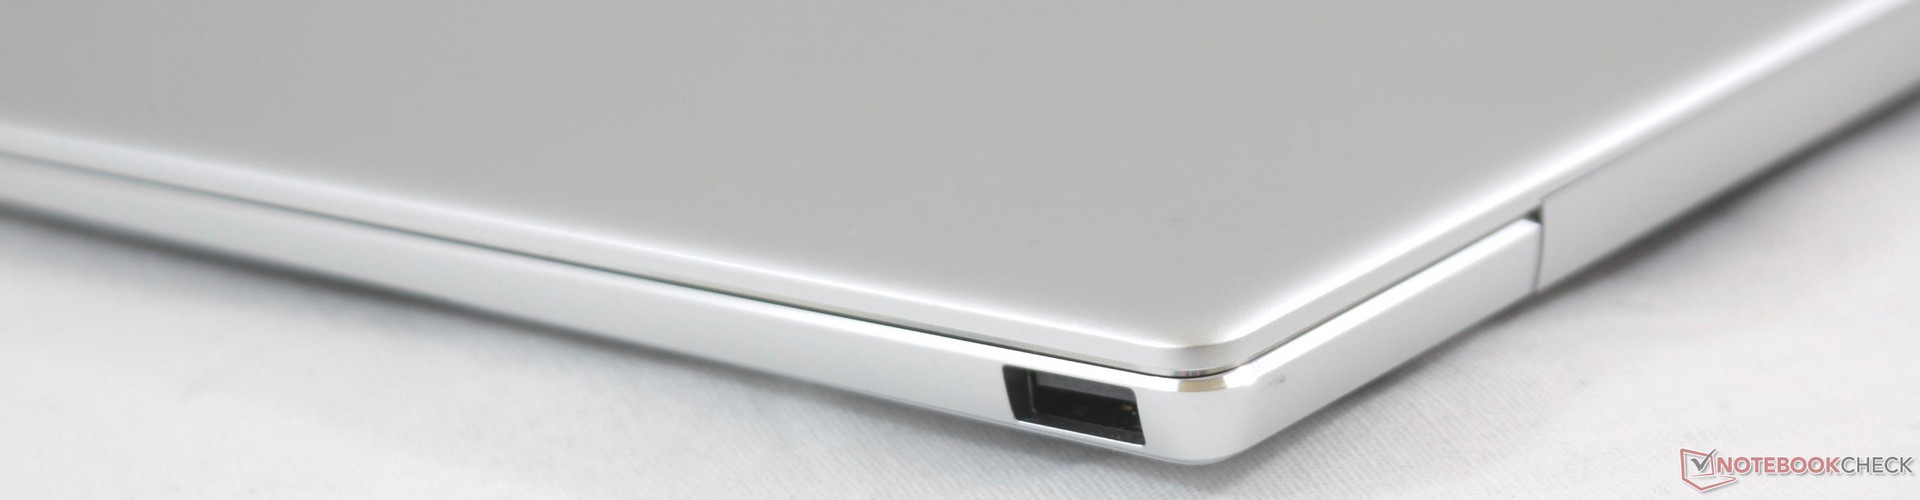
Unlike the Spectre 13, XPS 13 9370, or Zenbook 3, the MateBook X Pro includes a full-fledged USB 3.0 Type-A port. Huawei says its decision to bring back the port was a direct response to consumer demand and the growing annoyance of having to carry Type-C adapters. A full Thunderbolt 3 port (4x lane) resides on the opposite edge for connecting docking stations, displays, and eGPUs. Omitted are the SD card reader and SIM slot as found on certain business-centric laptops and tablets. Even a MicroSD slot would have been useful like on the 13-inch Samsung NP900X3N.
Communication
We experienced no connectivity issues with the Intel 8265 WLAN module. Theoretical WiFi speeds of up to 867 Mbps are supported along with Bluetooth 4.2.
| Networking | |
| iperf3 transmit AX12 | |
| Huawei MateBook X | |
| Microsoft Surface Laptop i5 | |
| Huawei Matebook X Pro i5 | |
| Dell XPS 13 9370 i7 UHD | |
| iperf3 receive AX12 | |
| Dell XPS 13 9370 i7 UHD | |
| Huawei Matebook X Pro i5 | |
| Microsoft Surface Laptop i5 | |
| Huawei MateBook X | |
Accessories
Included extras are an AC adapter and a USB Type-C to Type-C cable. A cleaning cloth or carrying case would have been nice extras similar to Asus and its ZenBooks. Unlike the XPS 13 or Spectre 13, however, there is no USB Type-C to Type-A adapter in the box.
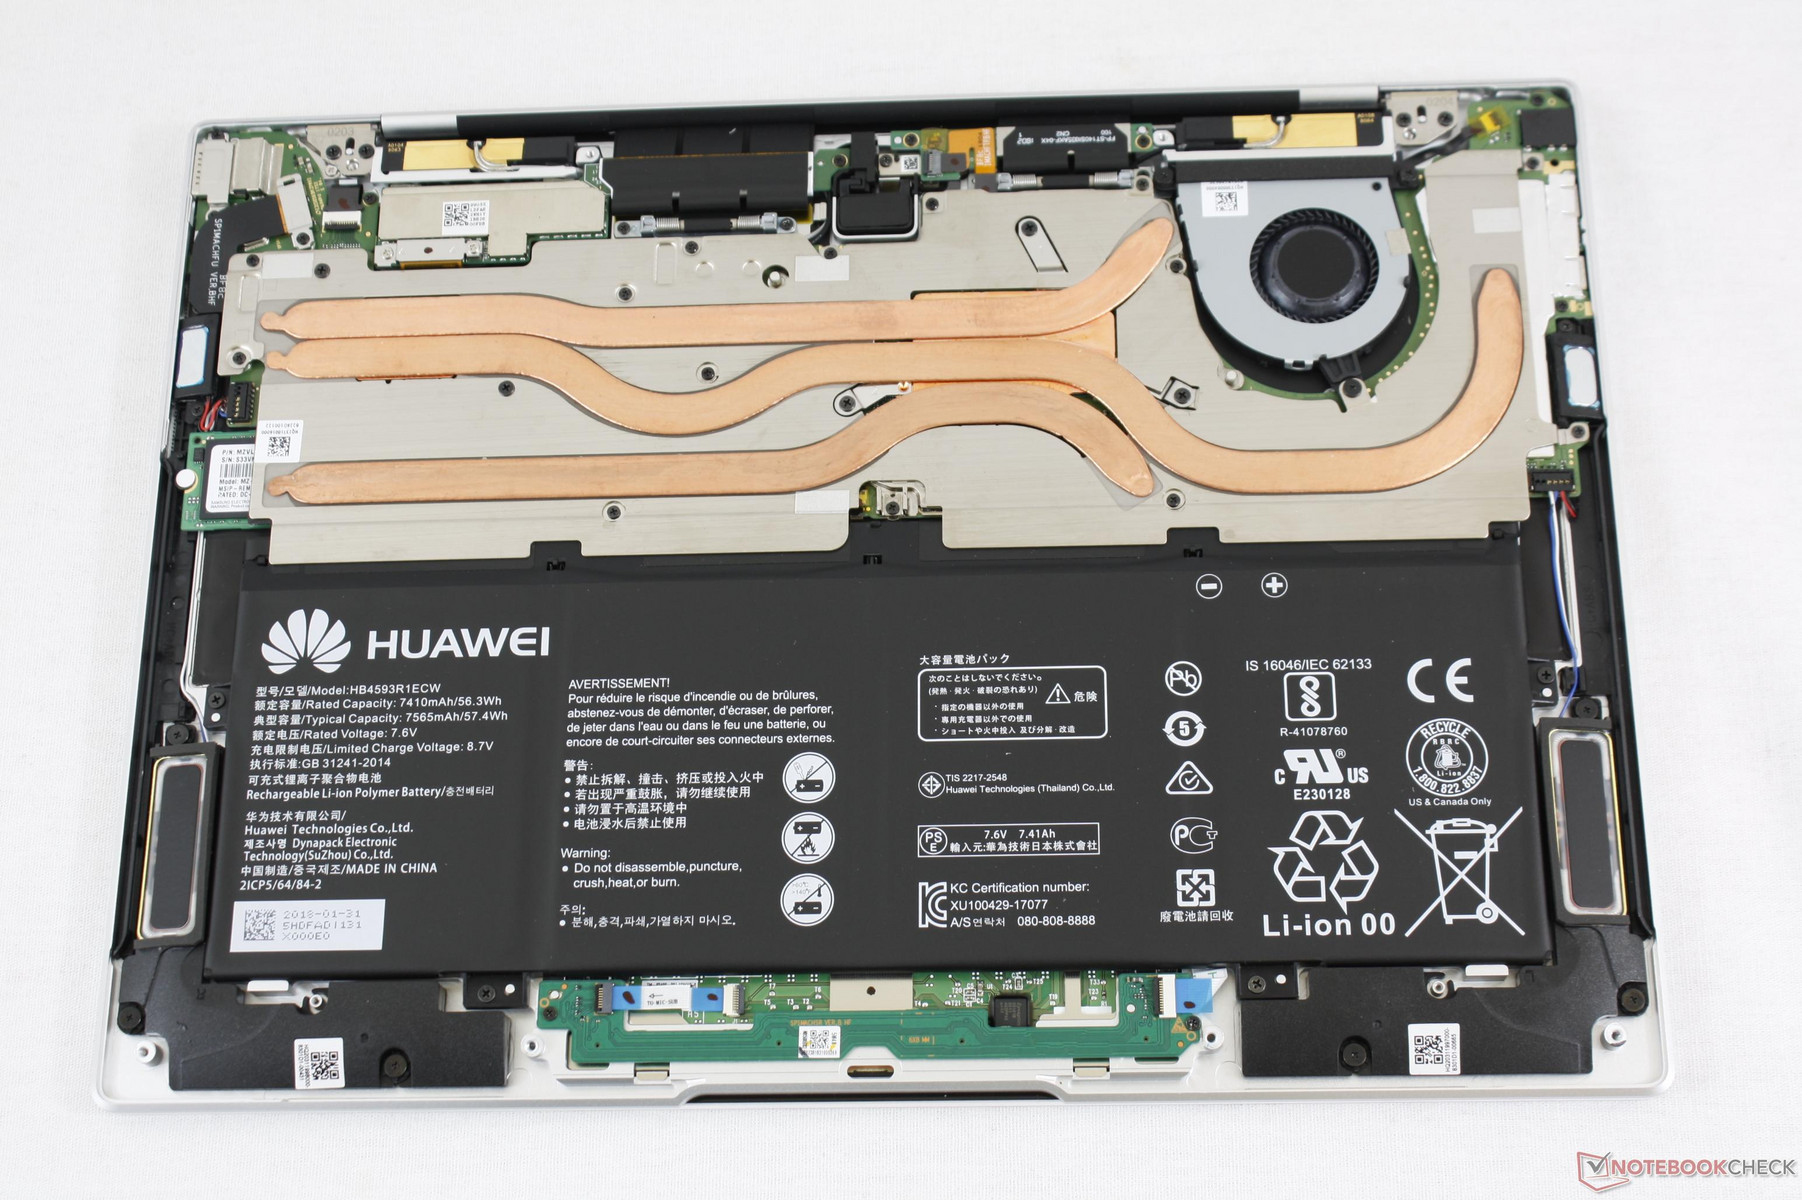
Maintenance
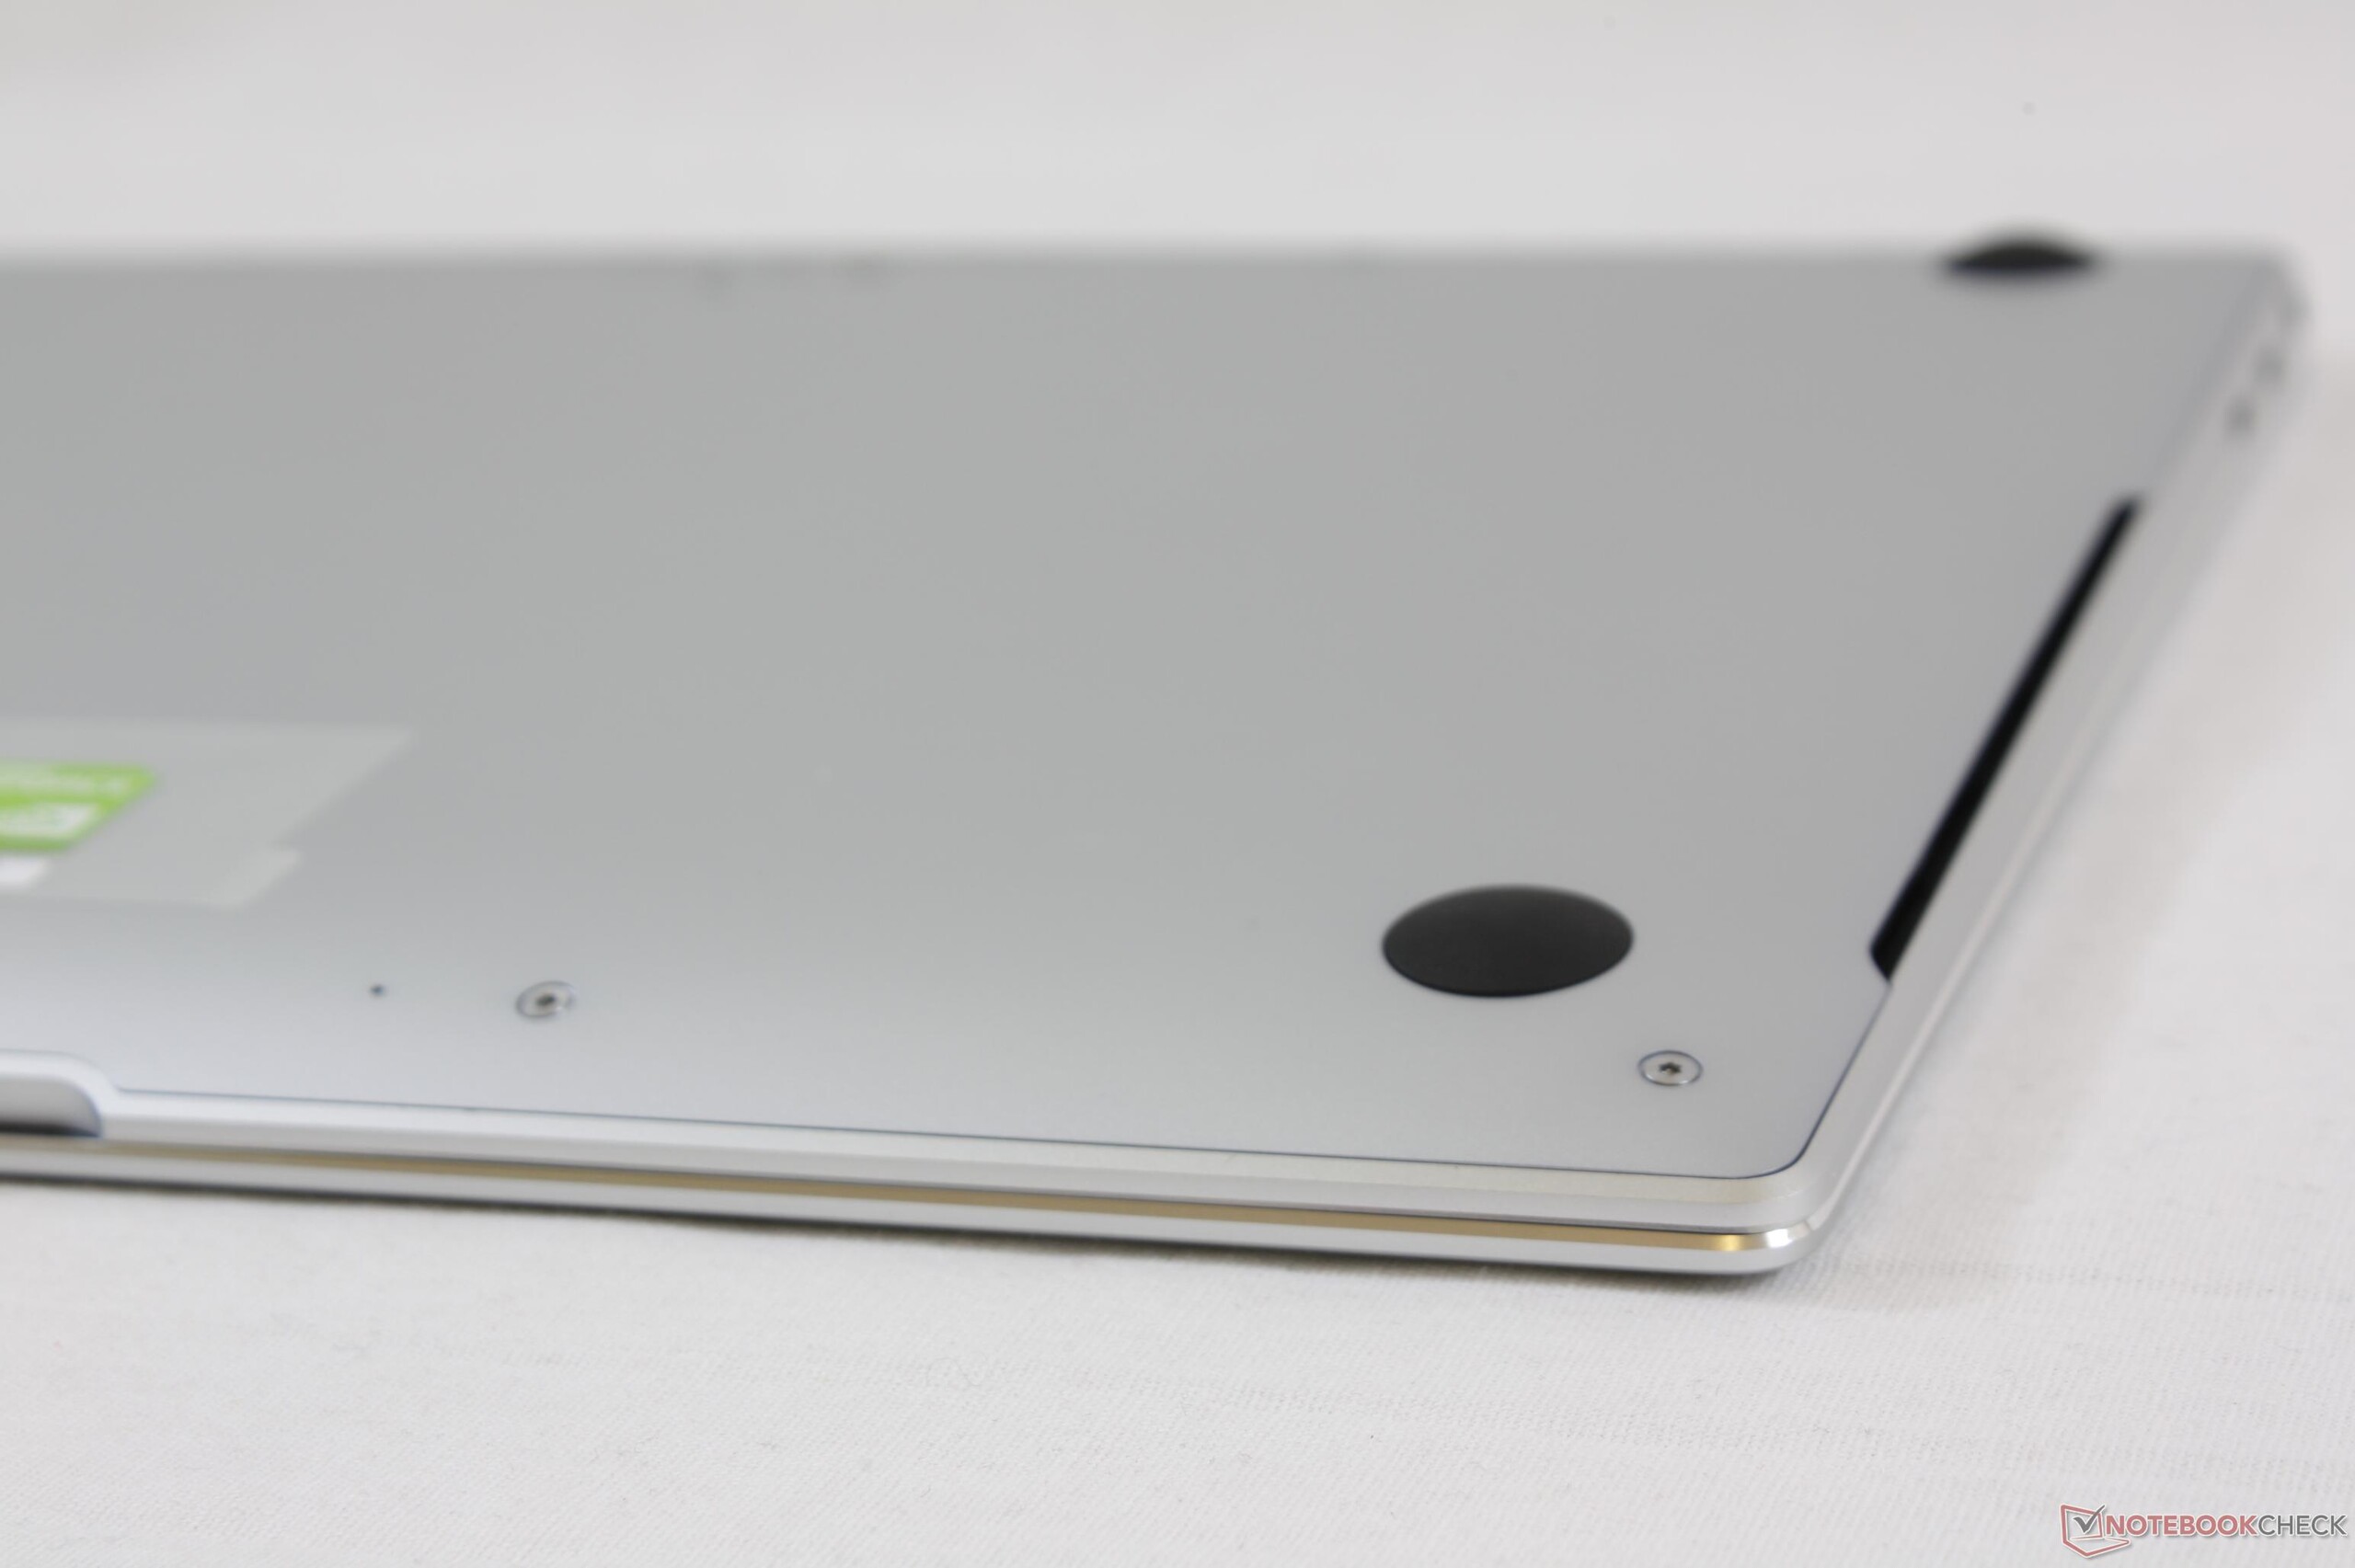
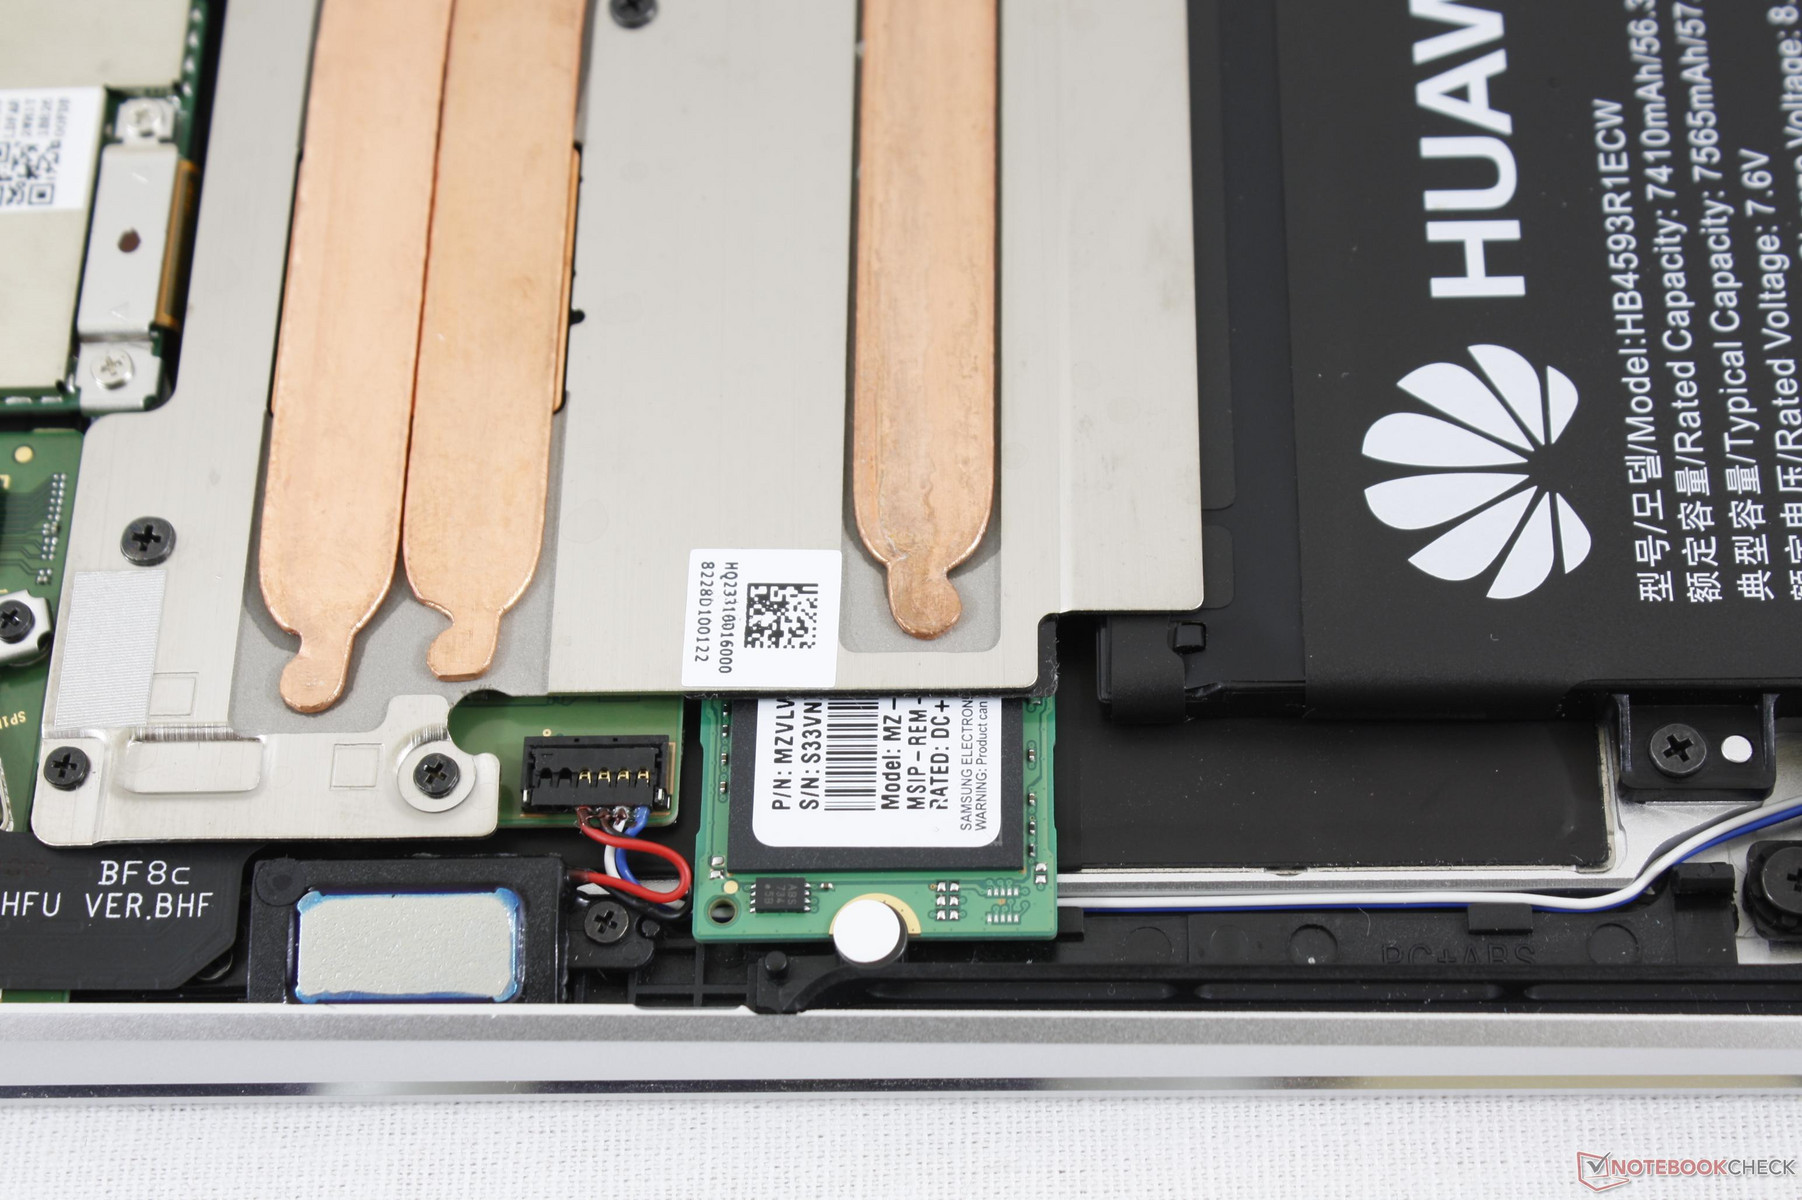
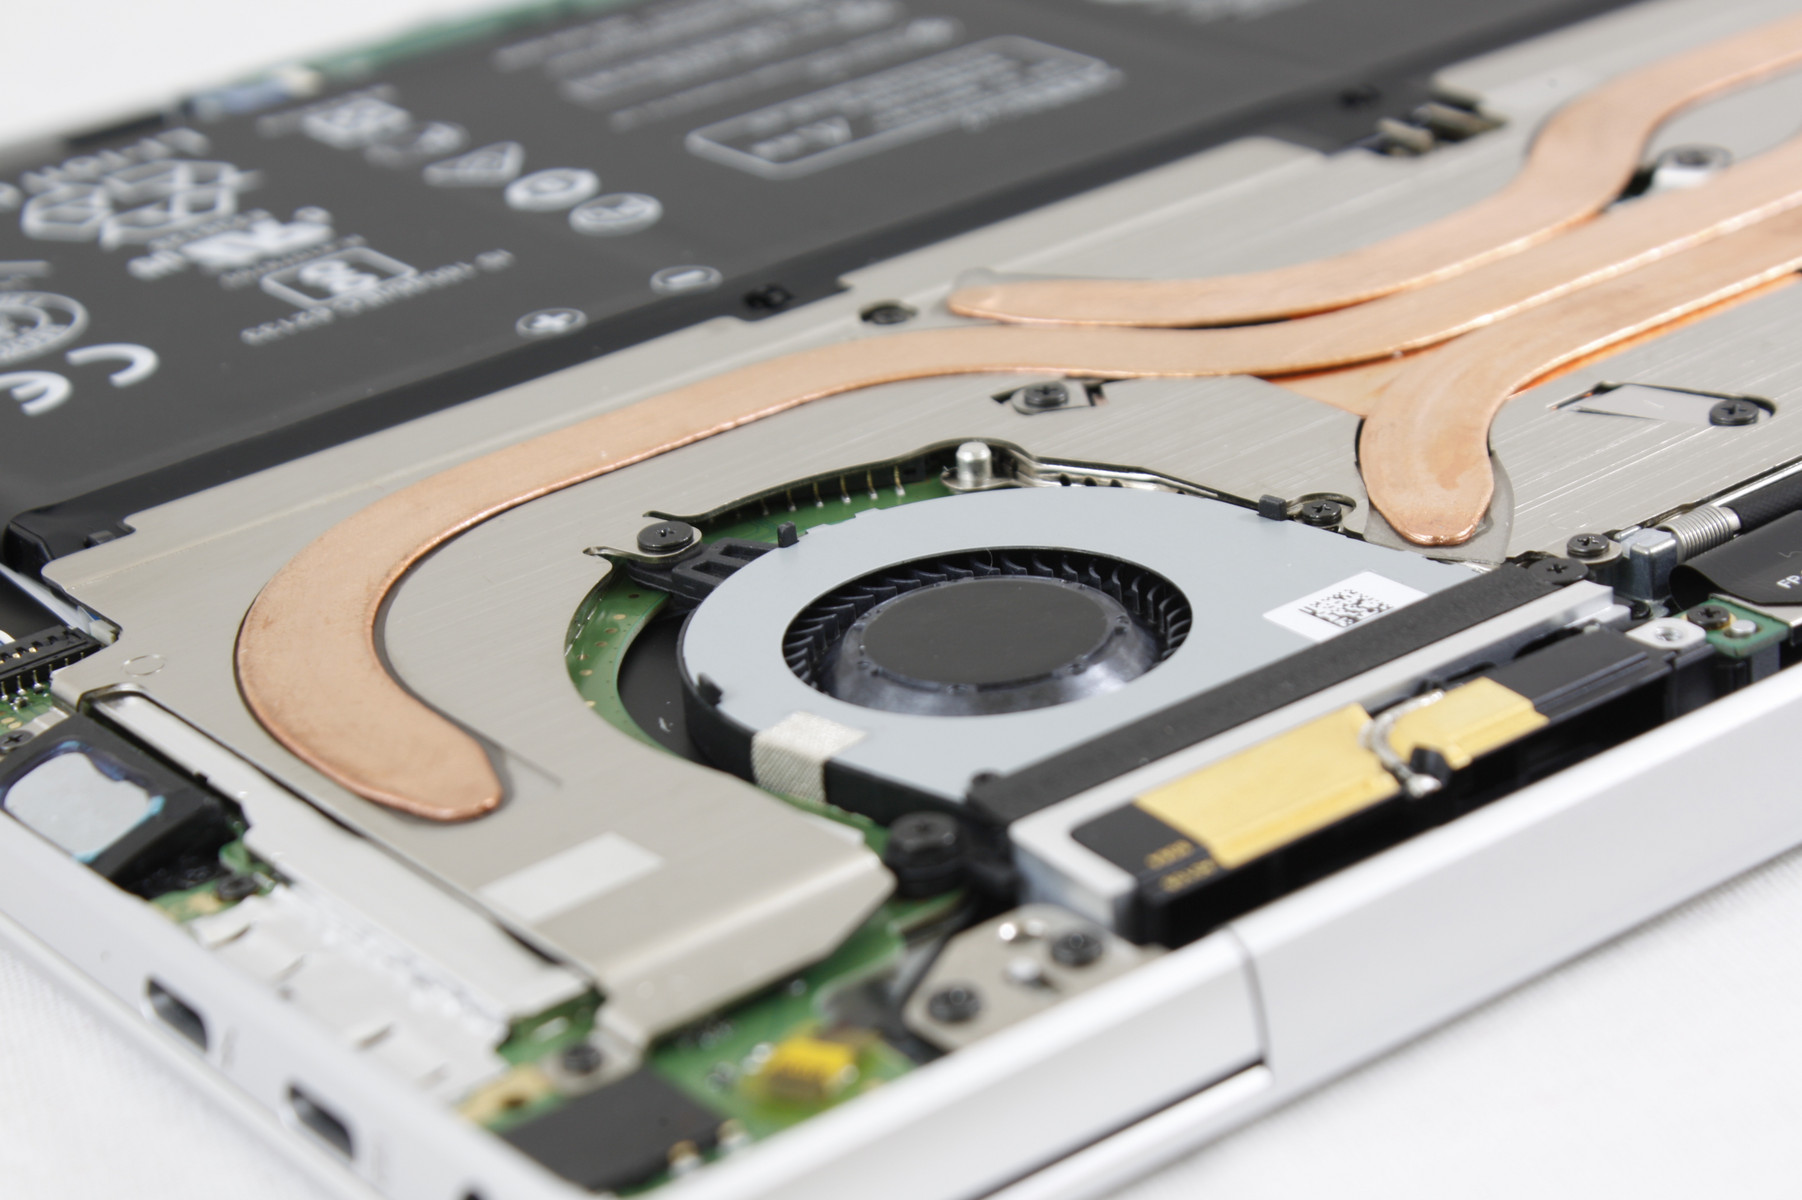
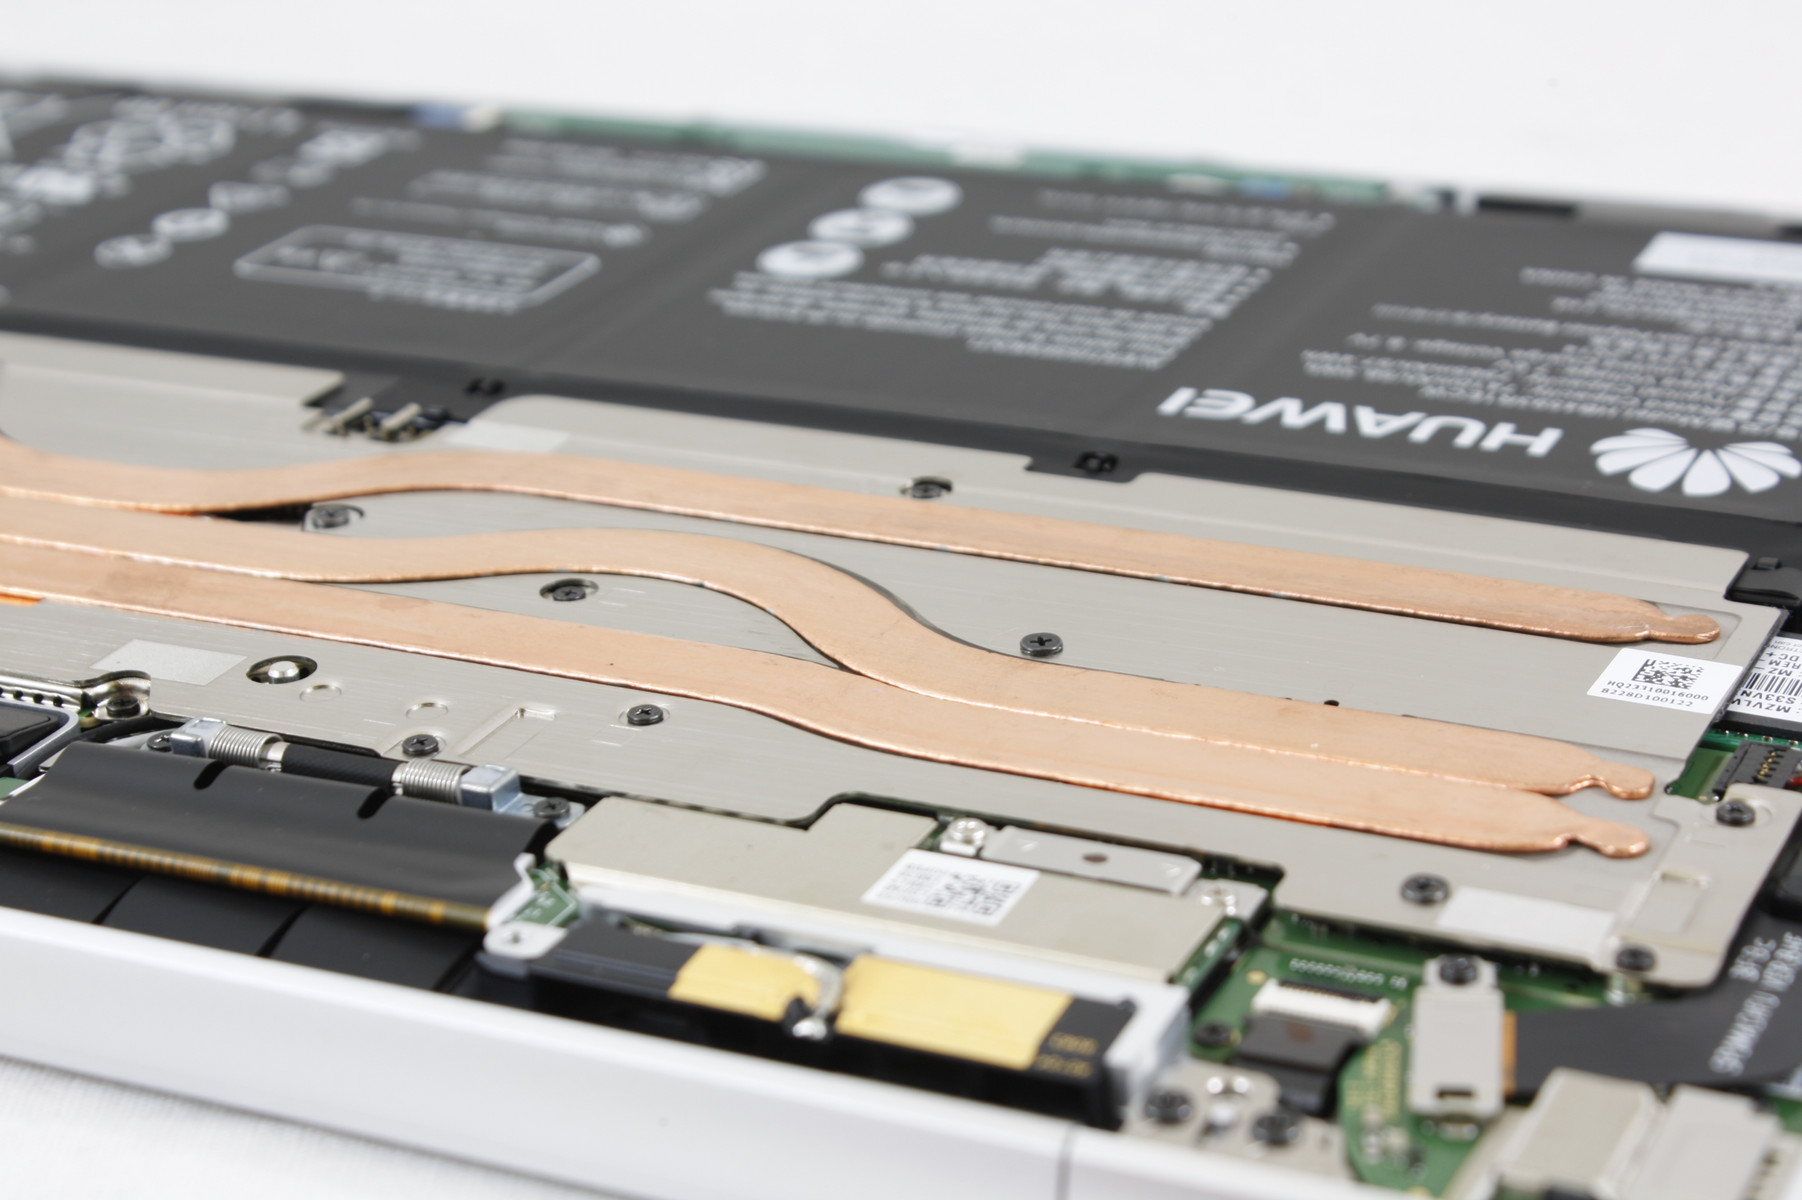
The bottom panel is relatively easy to remove with a T6 Hex wrench. The eight screws are exposed with none hiding underneath the rubber footing. Care must be taken around the edges and corners since the bottom plate is sharp.
Tinkerers will be disappointed to find that there is almost nothing upgradeable. Most of the volume is dedicated to the battery and heat sink and so RAM is fixed. Additional effort is required to remove the M.2 SSD as it is underneath a heat pipe.
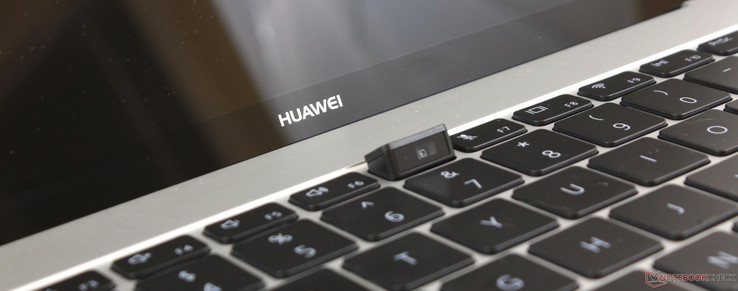
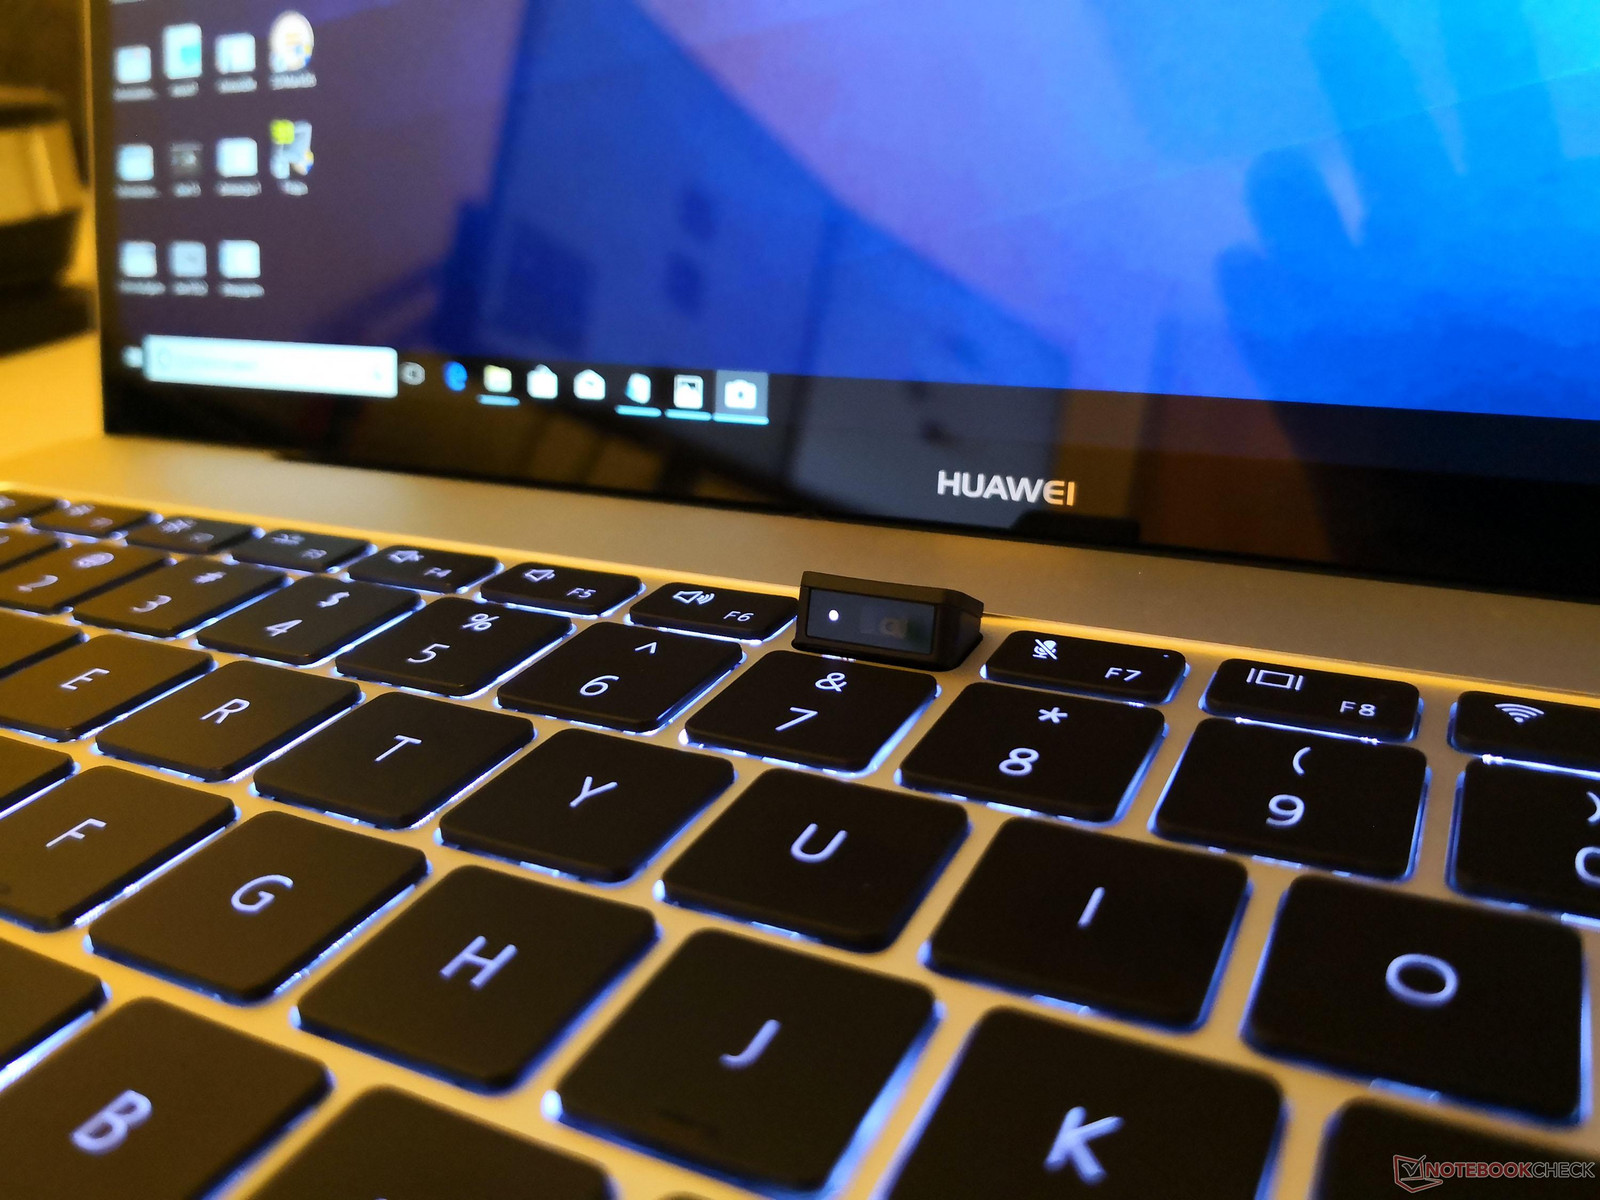
Webcam
Thin bezel laptops like the XPS 13 and LG Gram have to be creative with where to place the webcam and this remains true for the MateBook X Pro. Unfortunately, incorporating the camera onto a keyboard key doesn't solve the issues related to subpar angles. Huawei didn't even bother to up the quality or resolution of the wecam. Perhaps its one saving grace is that the camera can be closed for privacy concerns without needing to resort to tape.

Warranty
The standard one-year limited warranty applies for both the laptop and its internal battery. Users may need to submit proof of purchase if needing to claim warranty. The coverage details can be found here. Please see our Guarantees, Return policies and Warranties FAQ for country-specific information.
Input Devices
Keyboard
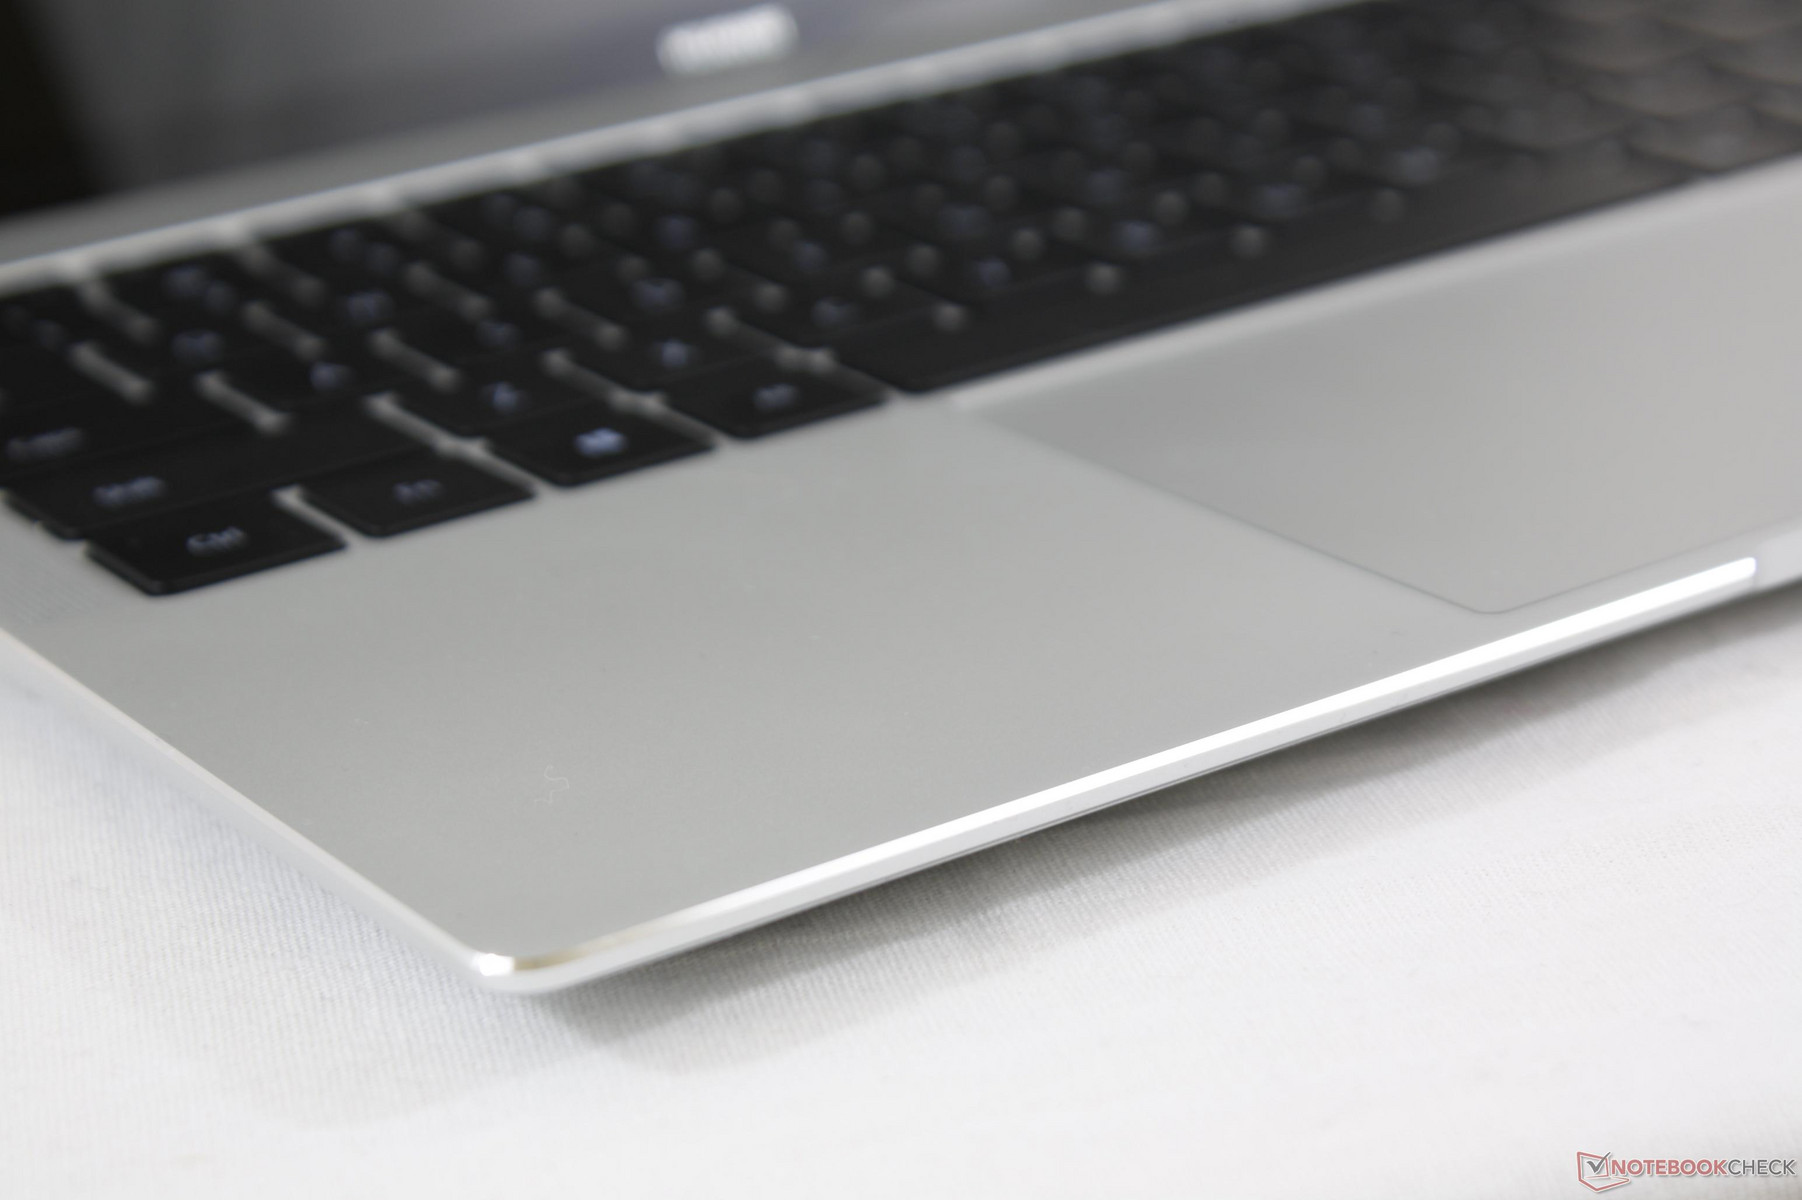
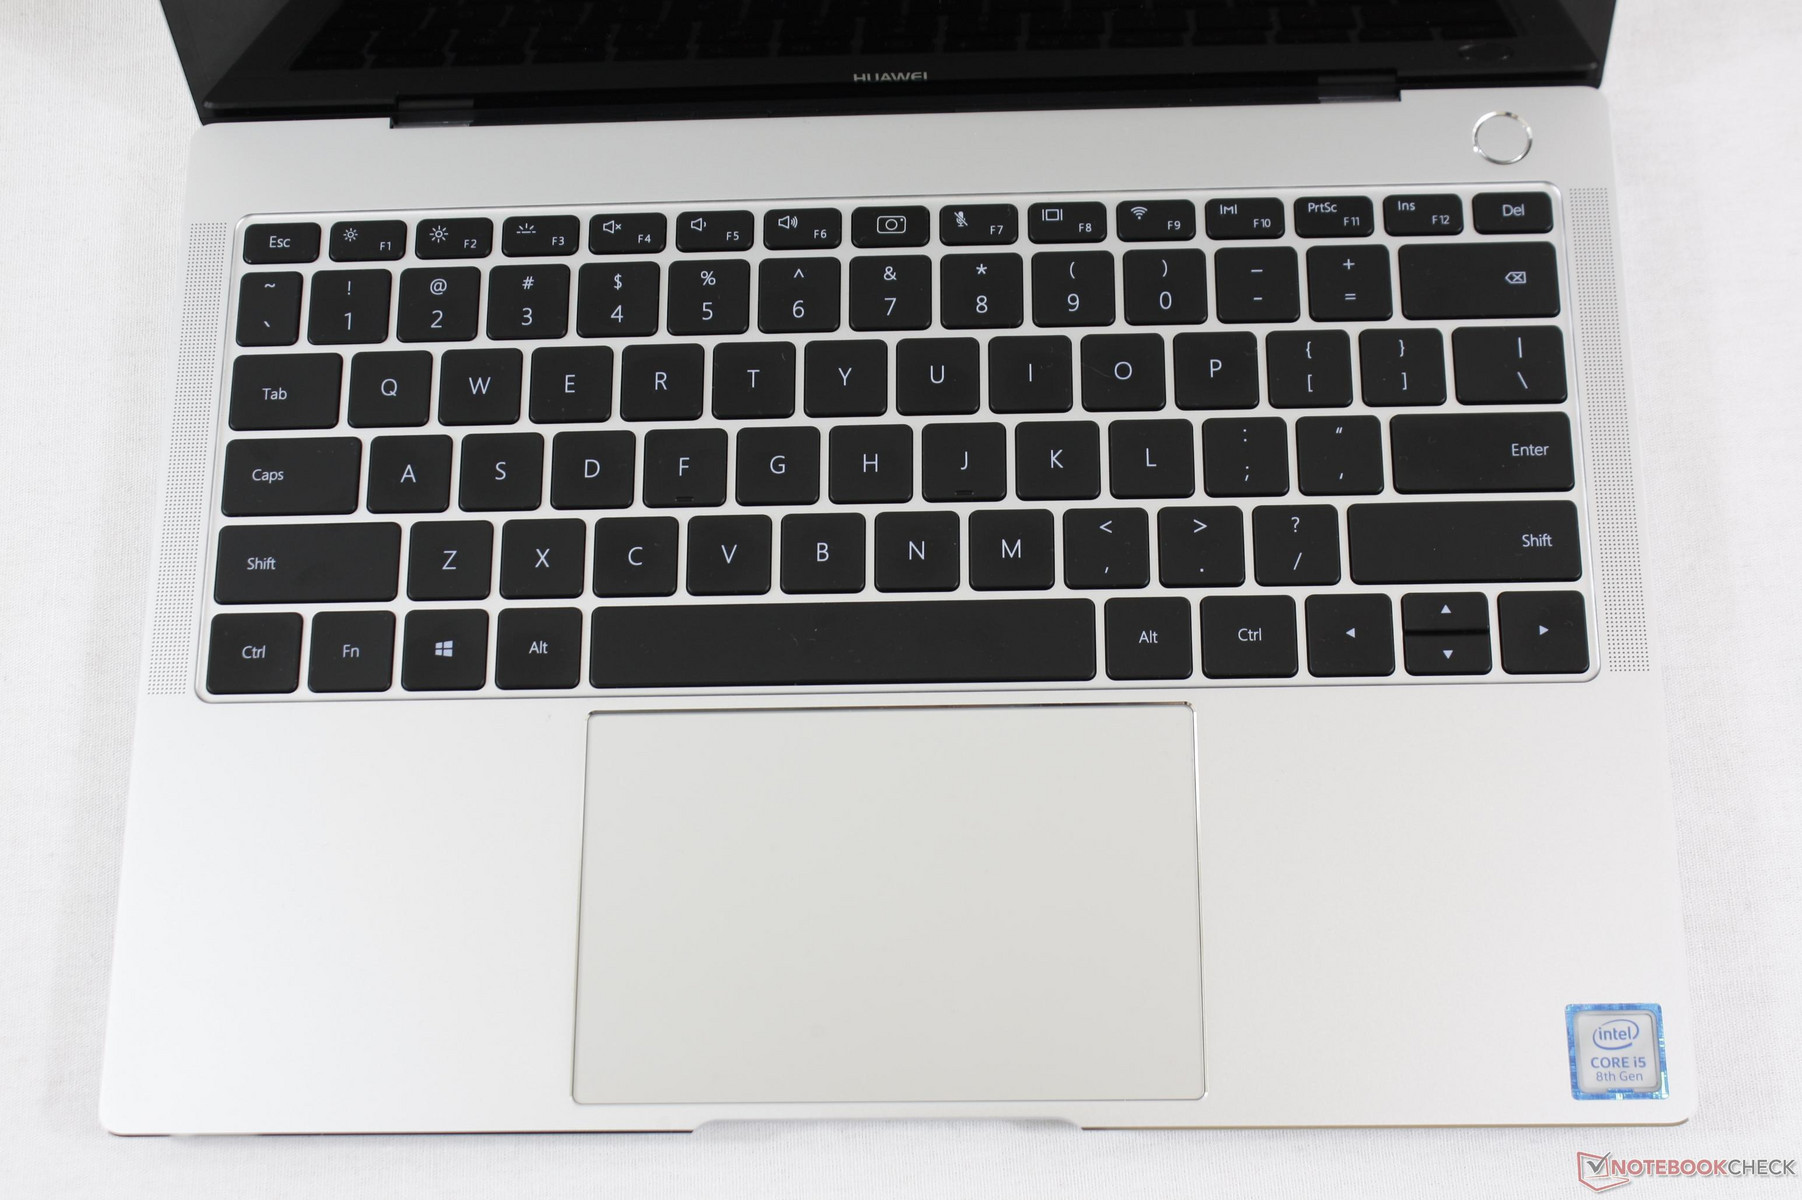
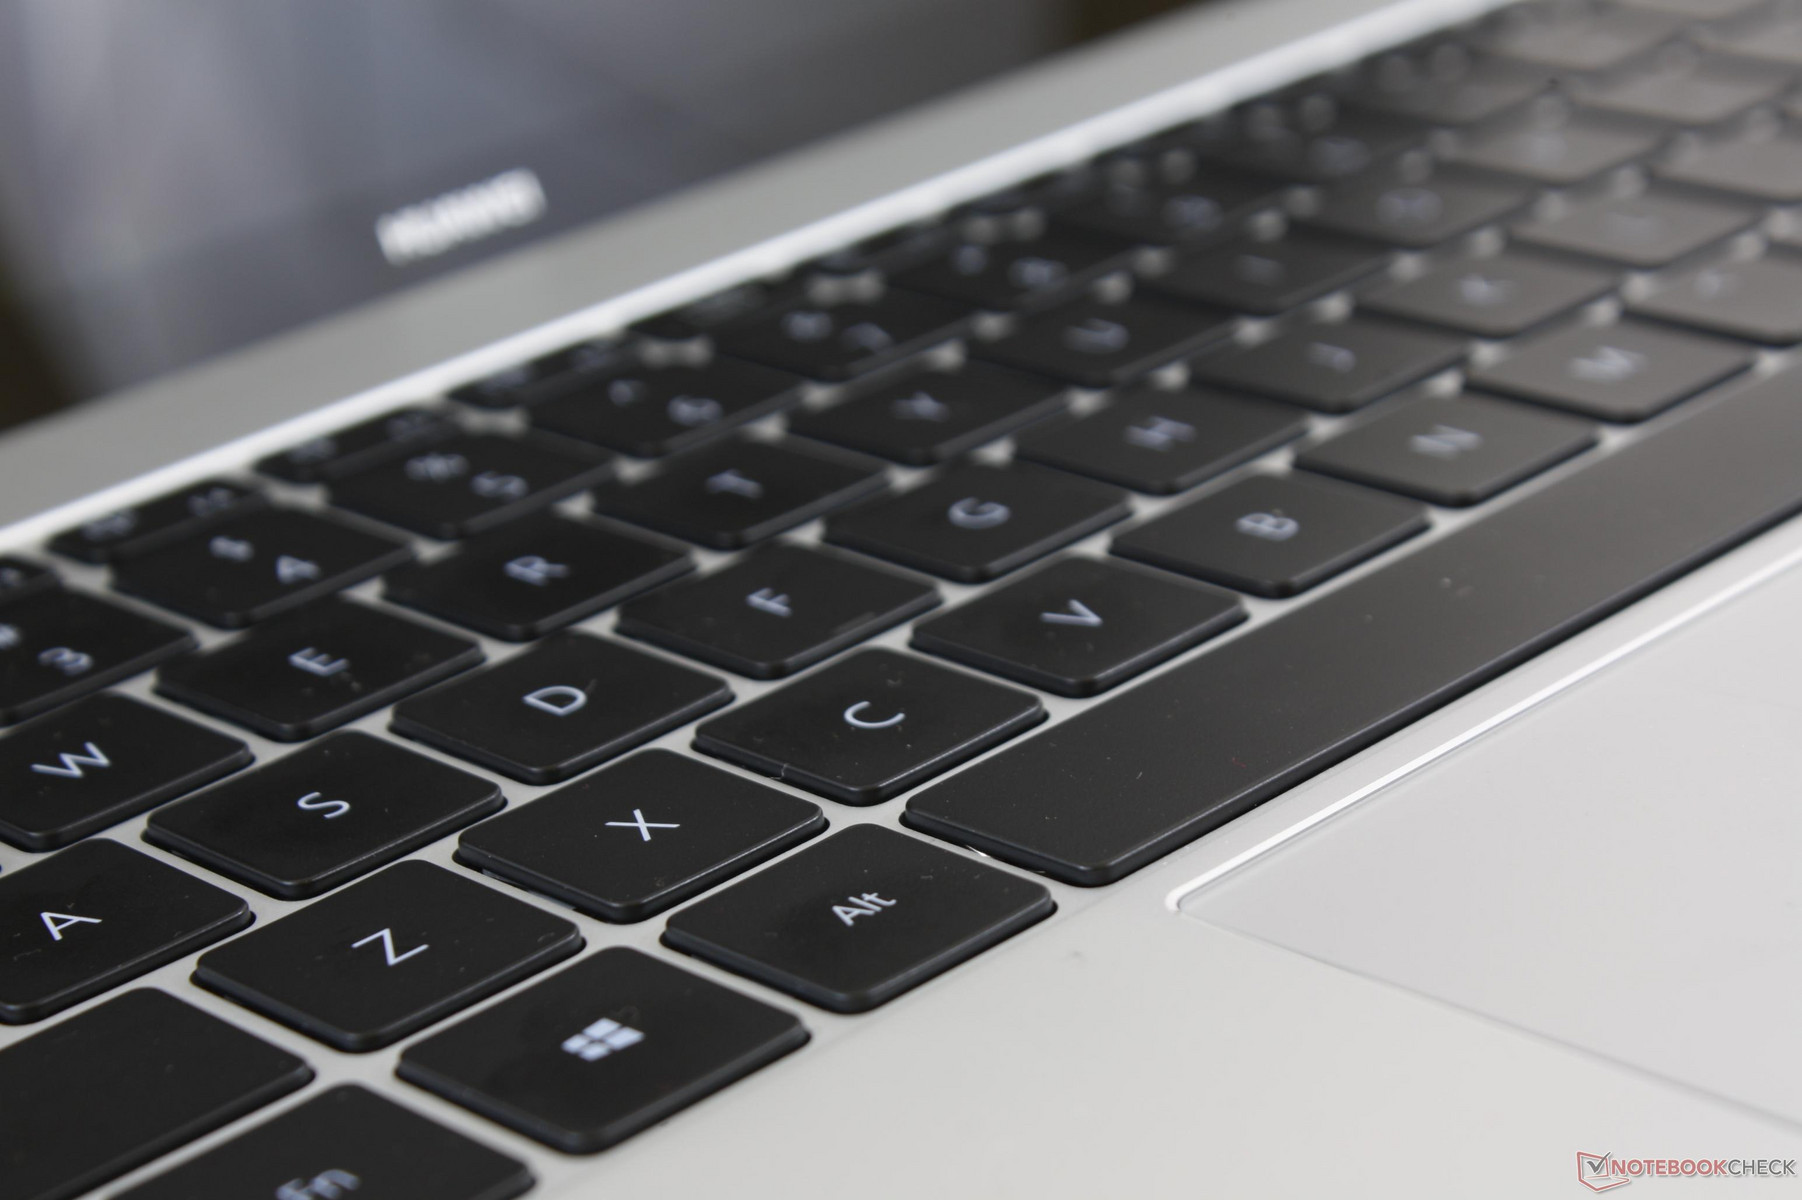
The spill-proof chiclet keyboard (~27.6 x 10.5 cm) is shallow in travel like for most Ultrabooks. Feedback is adequate if not slightly on the soft side to be reminiscent of the MateBook X. The Space key in particular could have benefited from firmer feedback and the Arrow keys are too small yet again. Clatter is minimal as a result for a quieter typing experience. Users accustomed to shallow key travel will find nothing out of the ordinary here. ThinkPads and Spectres offer deeper travel than our Huawei.
White backlighting comes standard in two levels of brightness intensities. The light is applies evenly across all keys save for the special camera key at the center.
Touchpad
The trackpad is very large at 12.0 x 7.8 cm compared to 10.5 x 6.0 cm on the XPS 13 9370. Glide is smooth and responsive from all corners with no cursor jitter. Multi-touch gestures via Windows are easier to use owning to the wide surface area.
The same can't be said for the integrated mouse keys. While we didn't experience any responsiveness issues like on the original MateBook X, feedback is softer and spongier than we would like. It takes a fair amount of force to input a click even when on the bottom half of the surface. We find it easier to tap on the trackpad or touchscreen for inputting mouse clicks in quick succession.
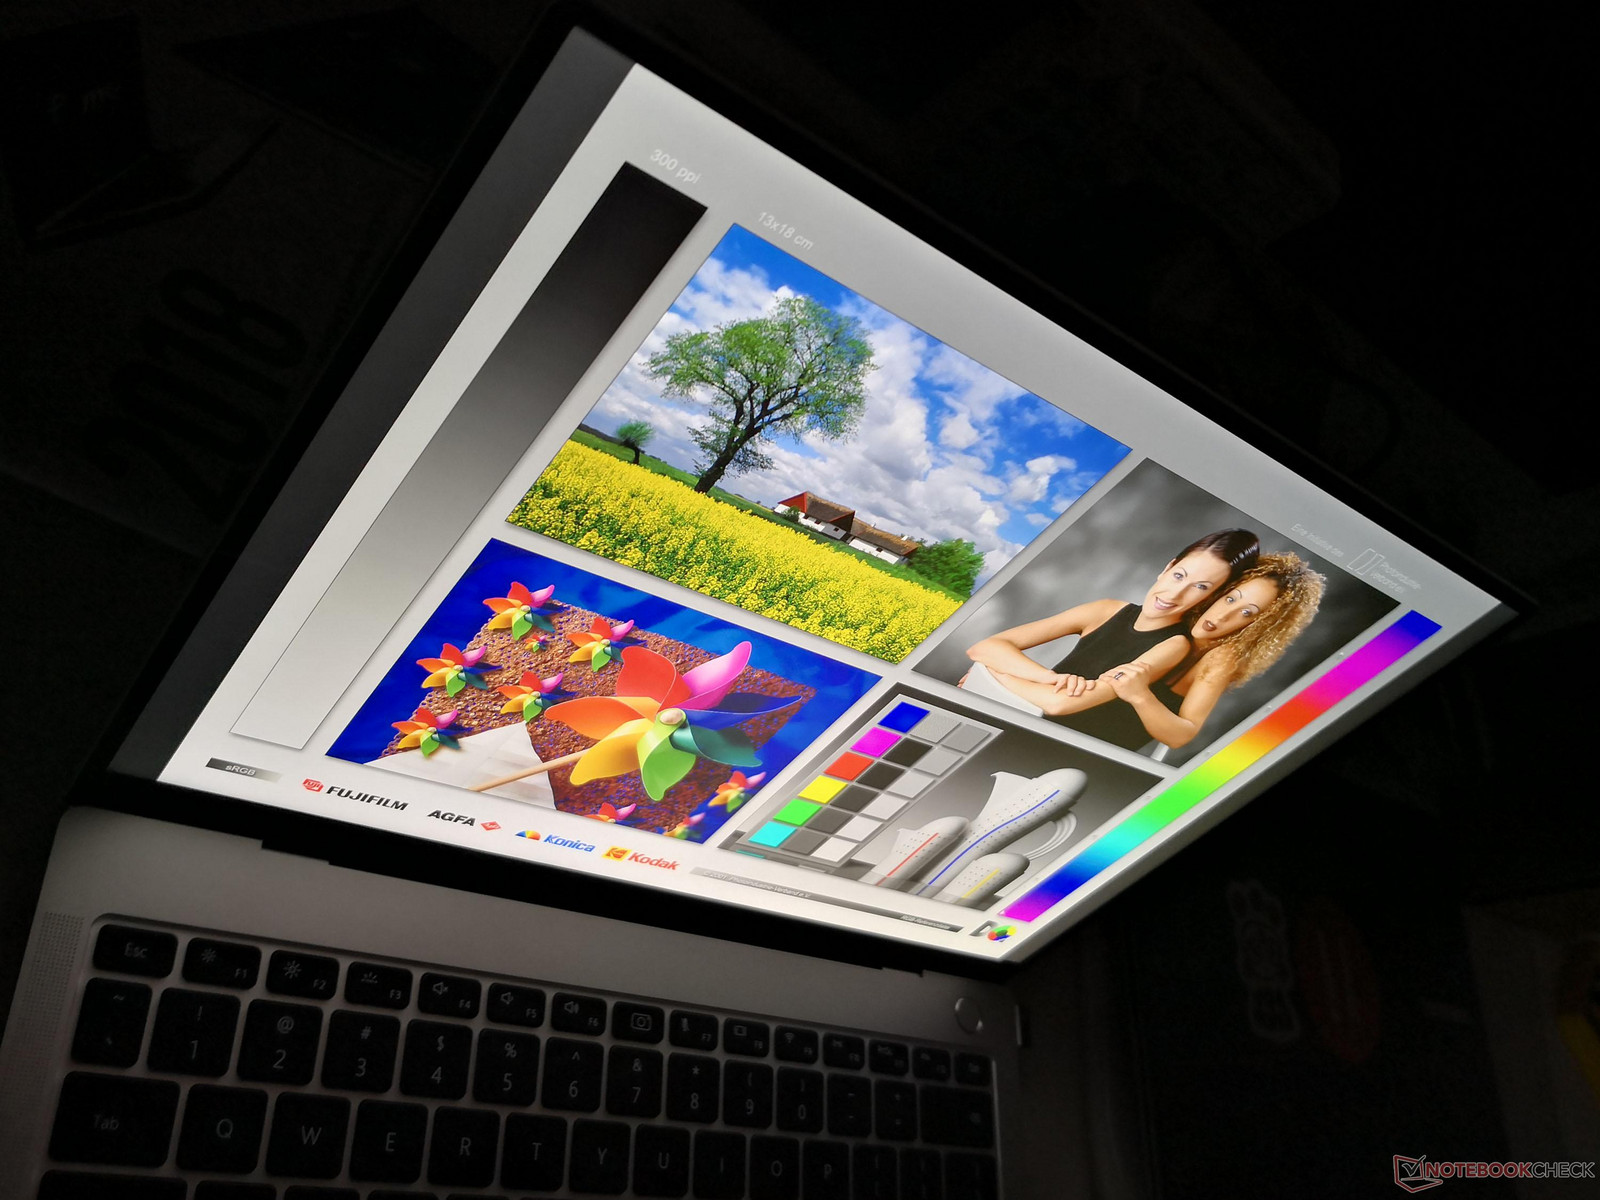
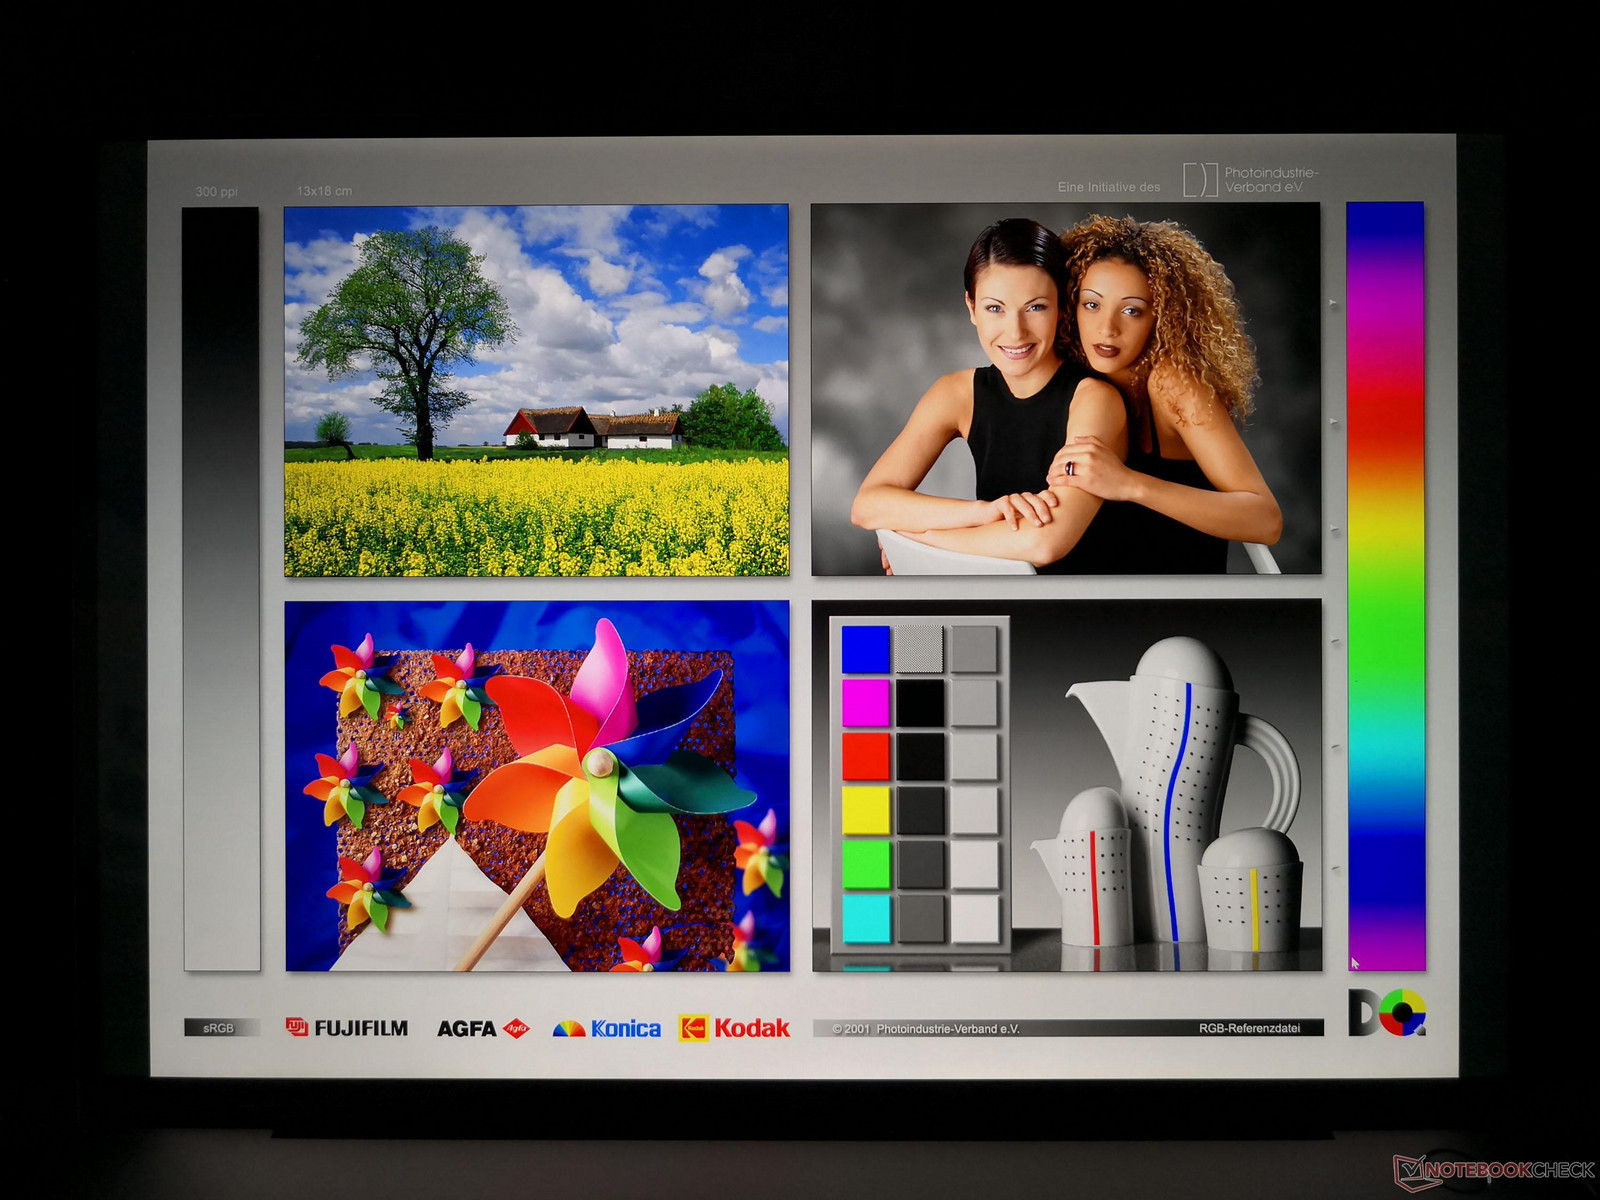
Display
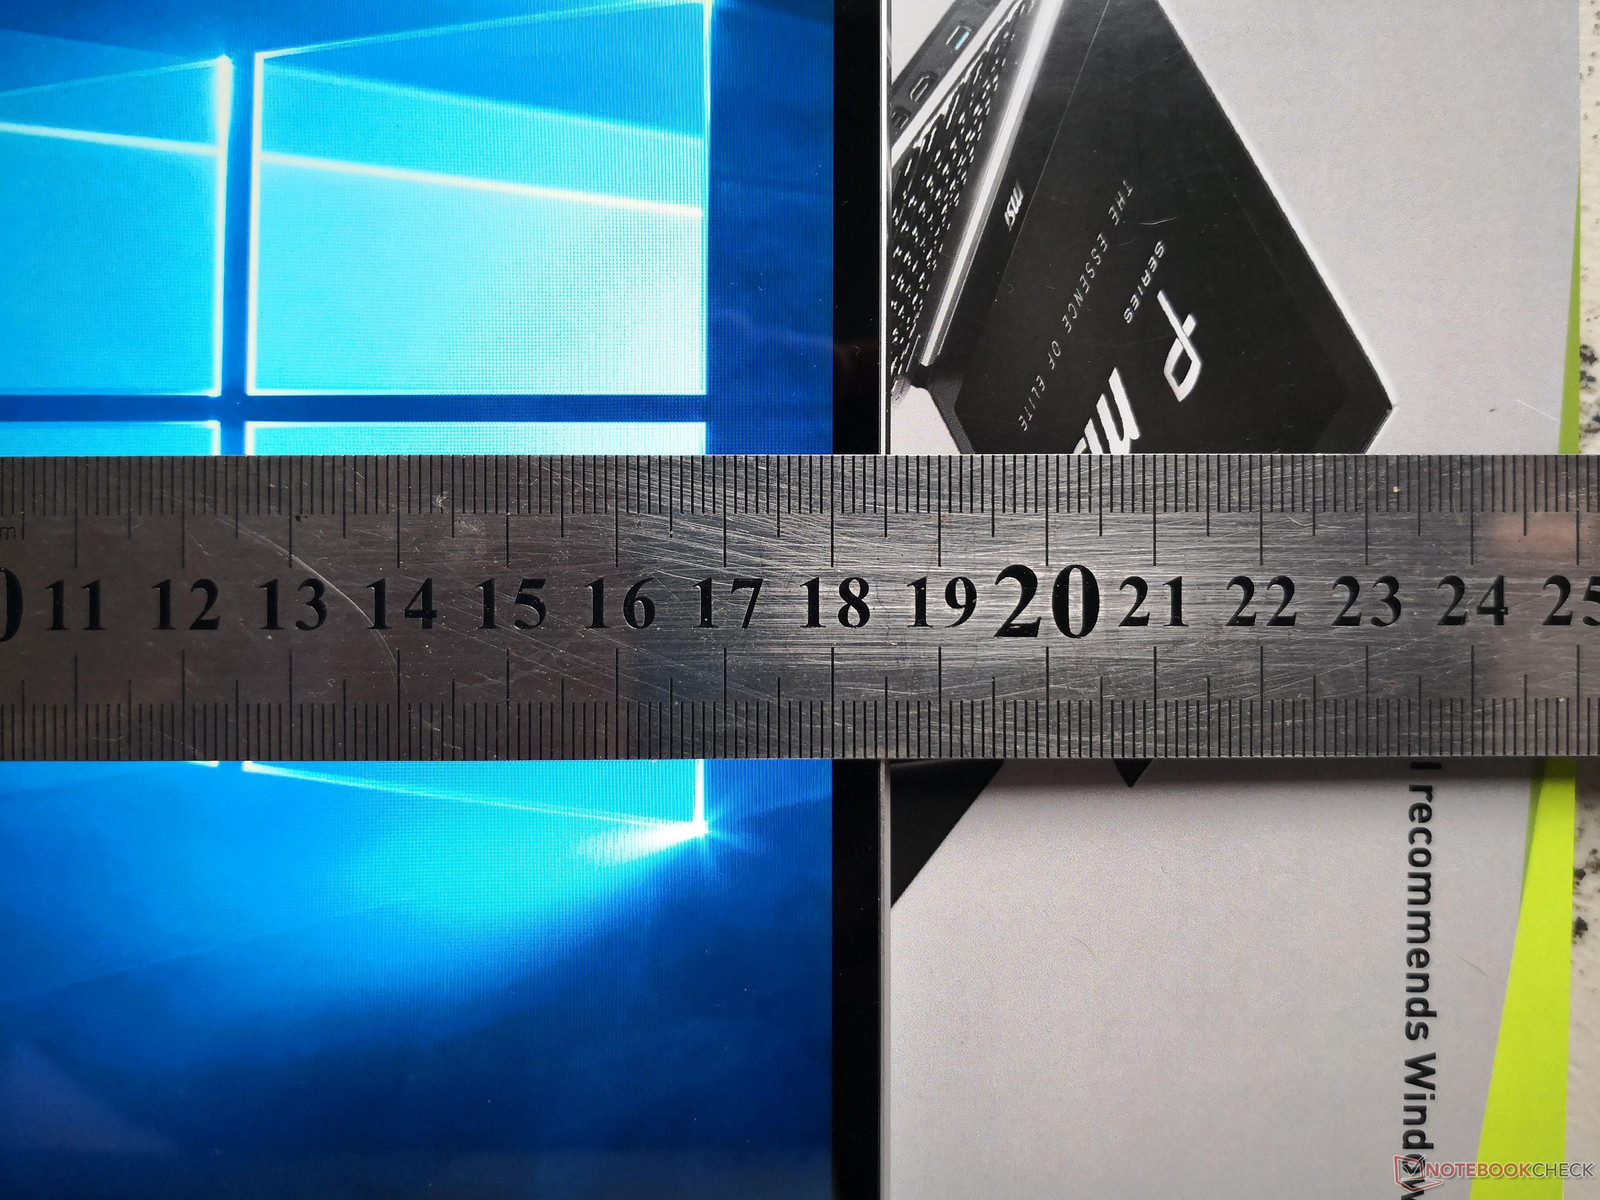
Huawei is doubling down on the 3:2 aspect ratio as the manufacturer believes it to be more productive than the common 16:9. The squarer dimensions give the 13.9-inch screen more real estate than both a 16:9 14-inch notebook and the 16:9 13.9-inch Lenovo ThinkPad X380 Yoga (i7-8550U, FHD) Convertible ReviewLenovo Yoga 920. Web pages, presentations, and full frame images benefit from having native 3:2.
The MateBook X Pro is advertised with a backlight of 450 nits and a contrast ratio of 1500:1. Our independent measurements confirm both claims with a center backlight of 442.7 nits and a contrast ratio of 1428:1. Brightness is comparable to the XPS 13 and brighter than the panels of the Yoga 920 and Surface Laptop, but both the Samsung NP900X3N and MacBook Pro 13 are even brighter for better outdoor visibility.
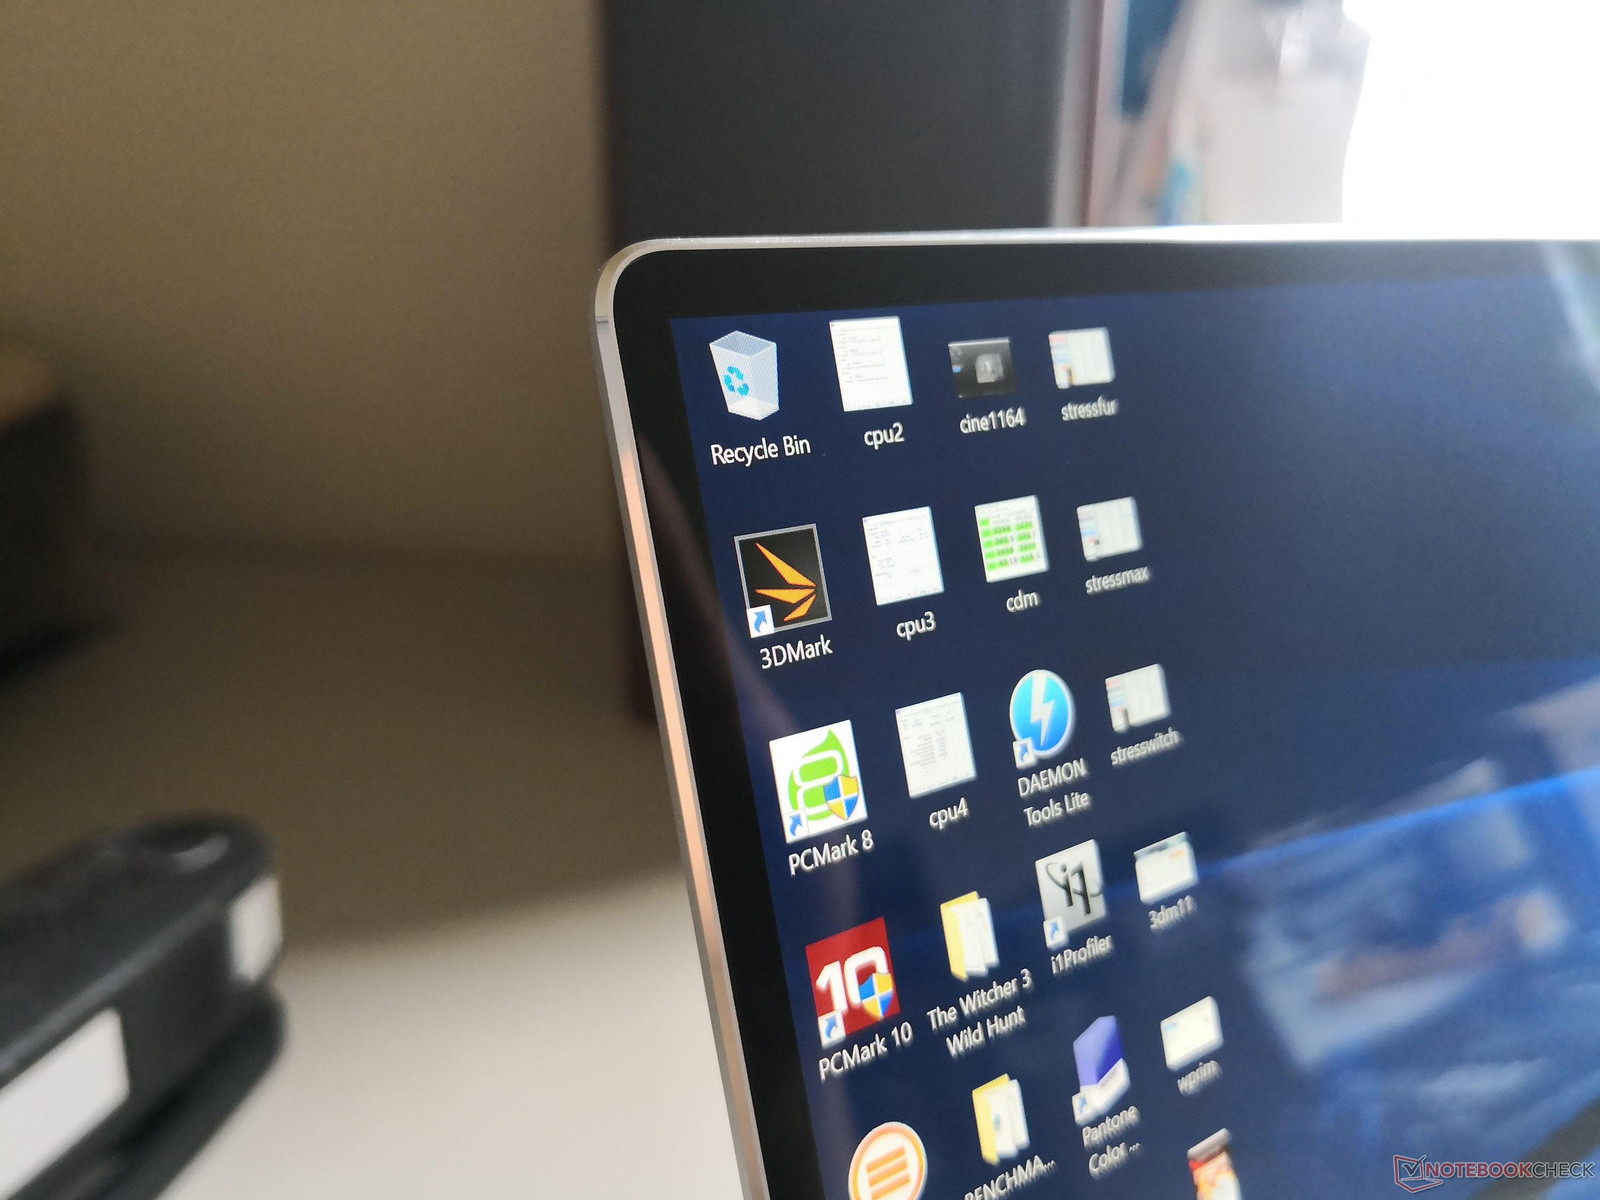
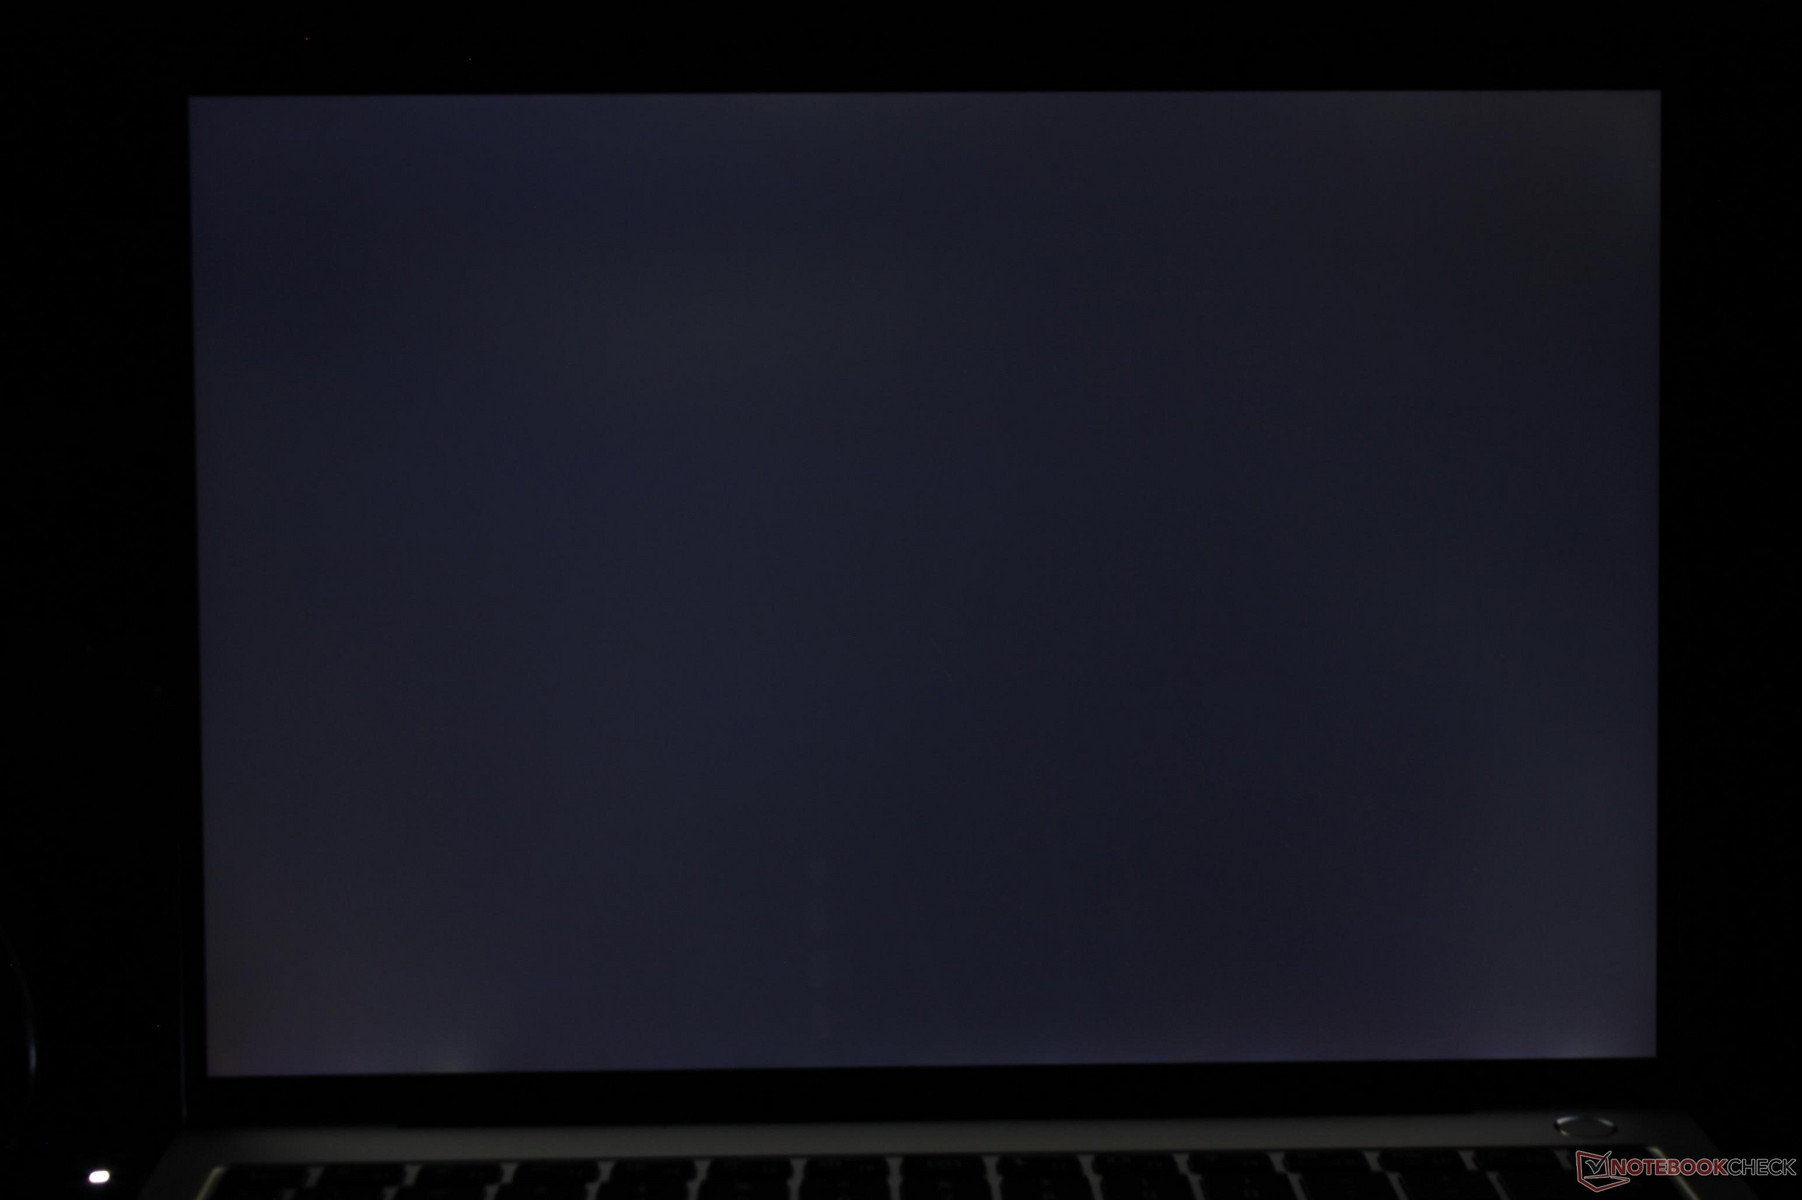
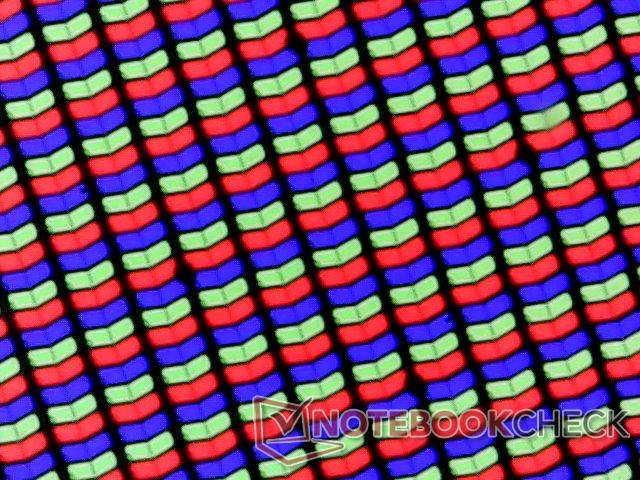
Subjectively, the screen looks representative of the 4-digit price point. Colors pop and texts appear very close to the surface of the thin glass. HWiNFO identifies the IPS panel with the name TIANMA XM and the ID TLX1388 whereas the original MateBook X utilizes a Chi Mei panel. Onscreen content is still extremely crisp even though its pixels are not as dense as a true 13.3-inch or 15.6-inch 4K UHD display. A slight amount of backlight bleeding is present on the bottom edge of our unit that is easy to ignore.
Black-white and gray-gray response times are very similar to that of the MacBook Pro 13 and original MateBook X. The 4K panel of the XPS 13 9370 is notorious for its slower response times and significantly more noticeable ghosting in comparison.
| |||||||||||||||||||||||||
Brightness Distribution: 84 %
Center on Battery: 442.7 cd/m²
Contrast: 1428:1 (Black: 0.31 cd/m²)
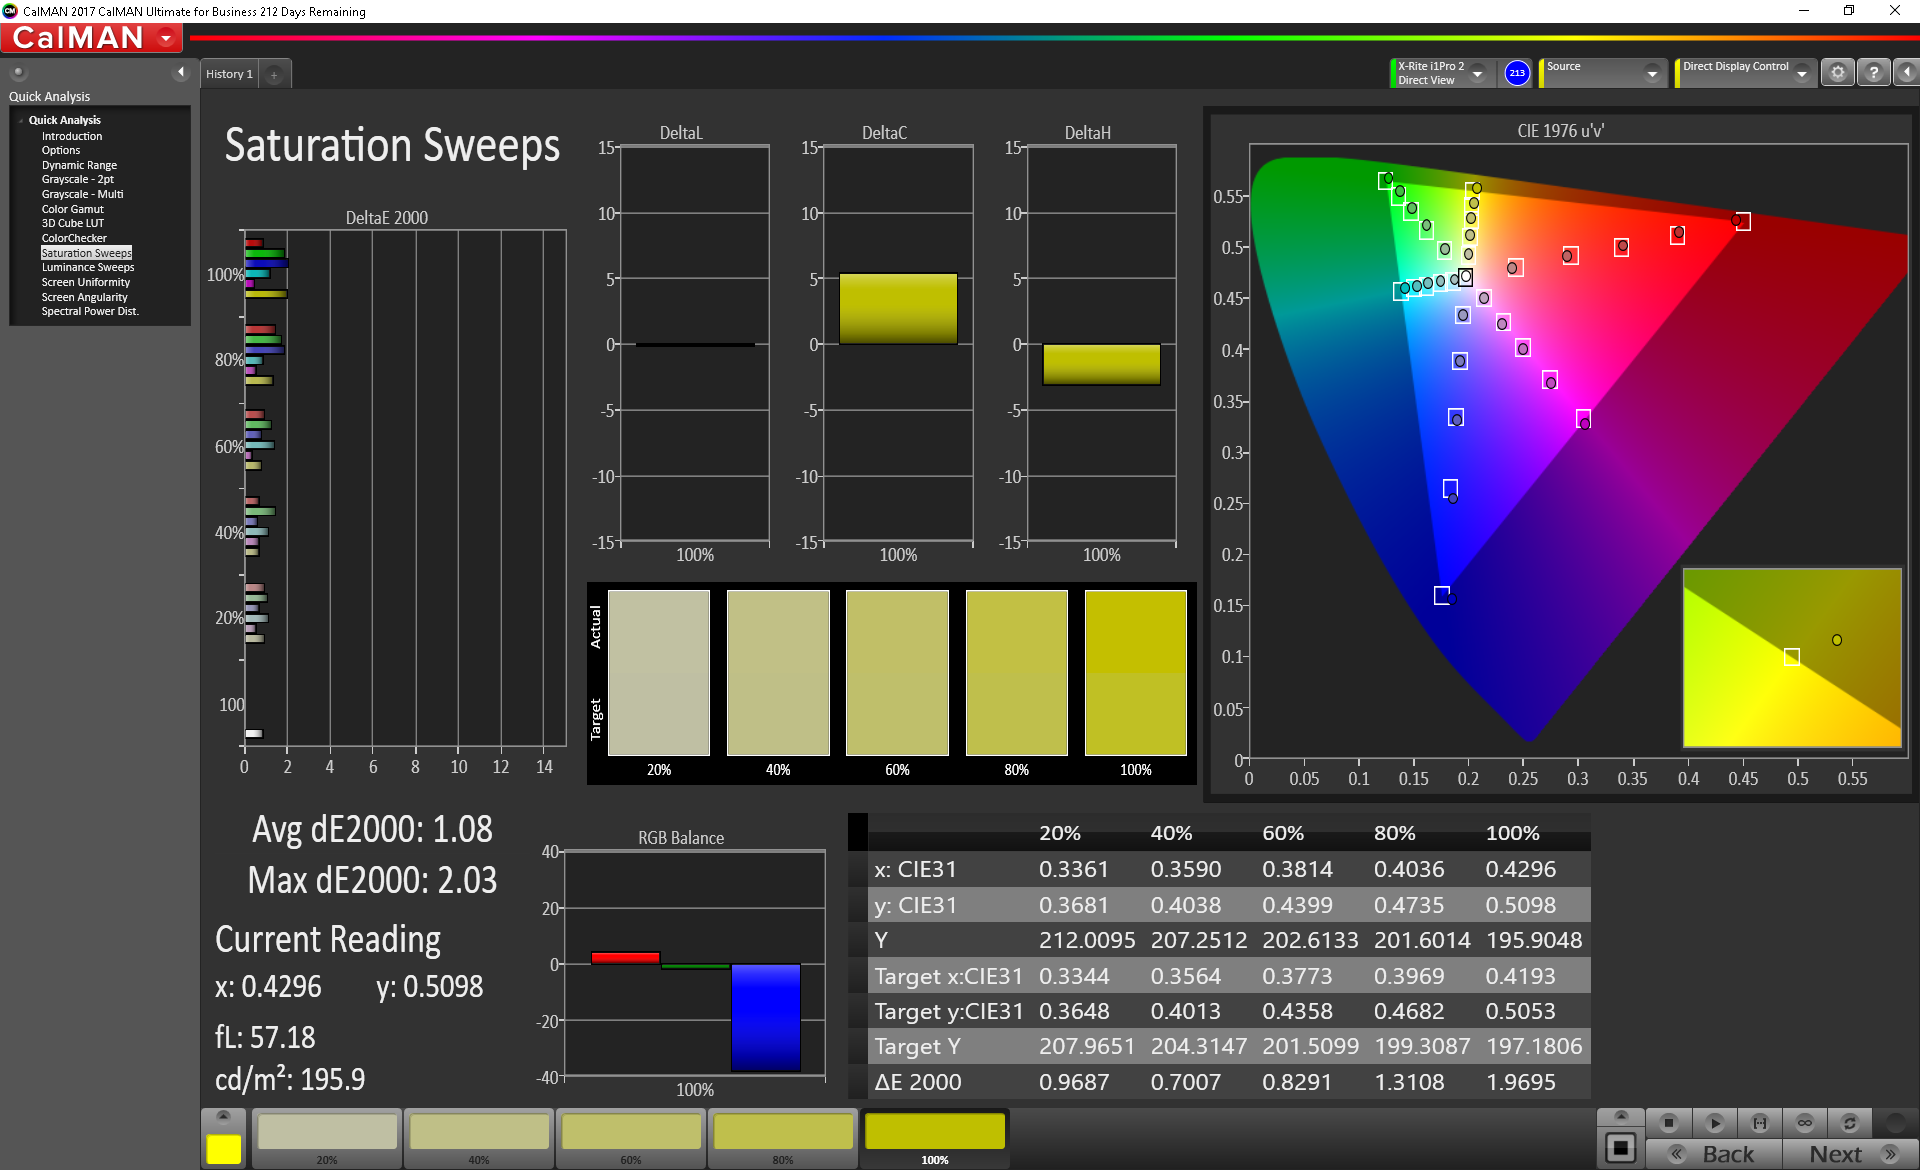
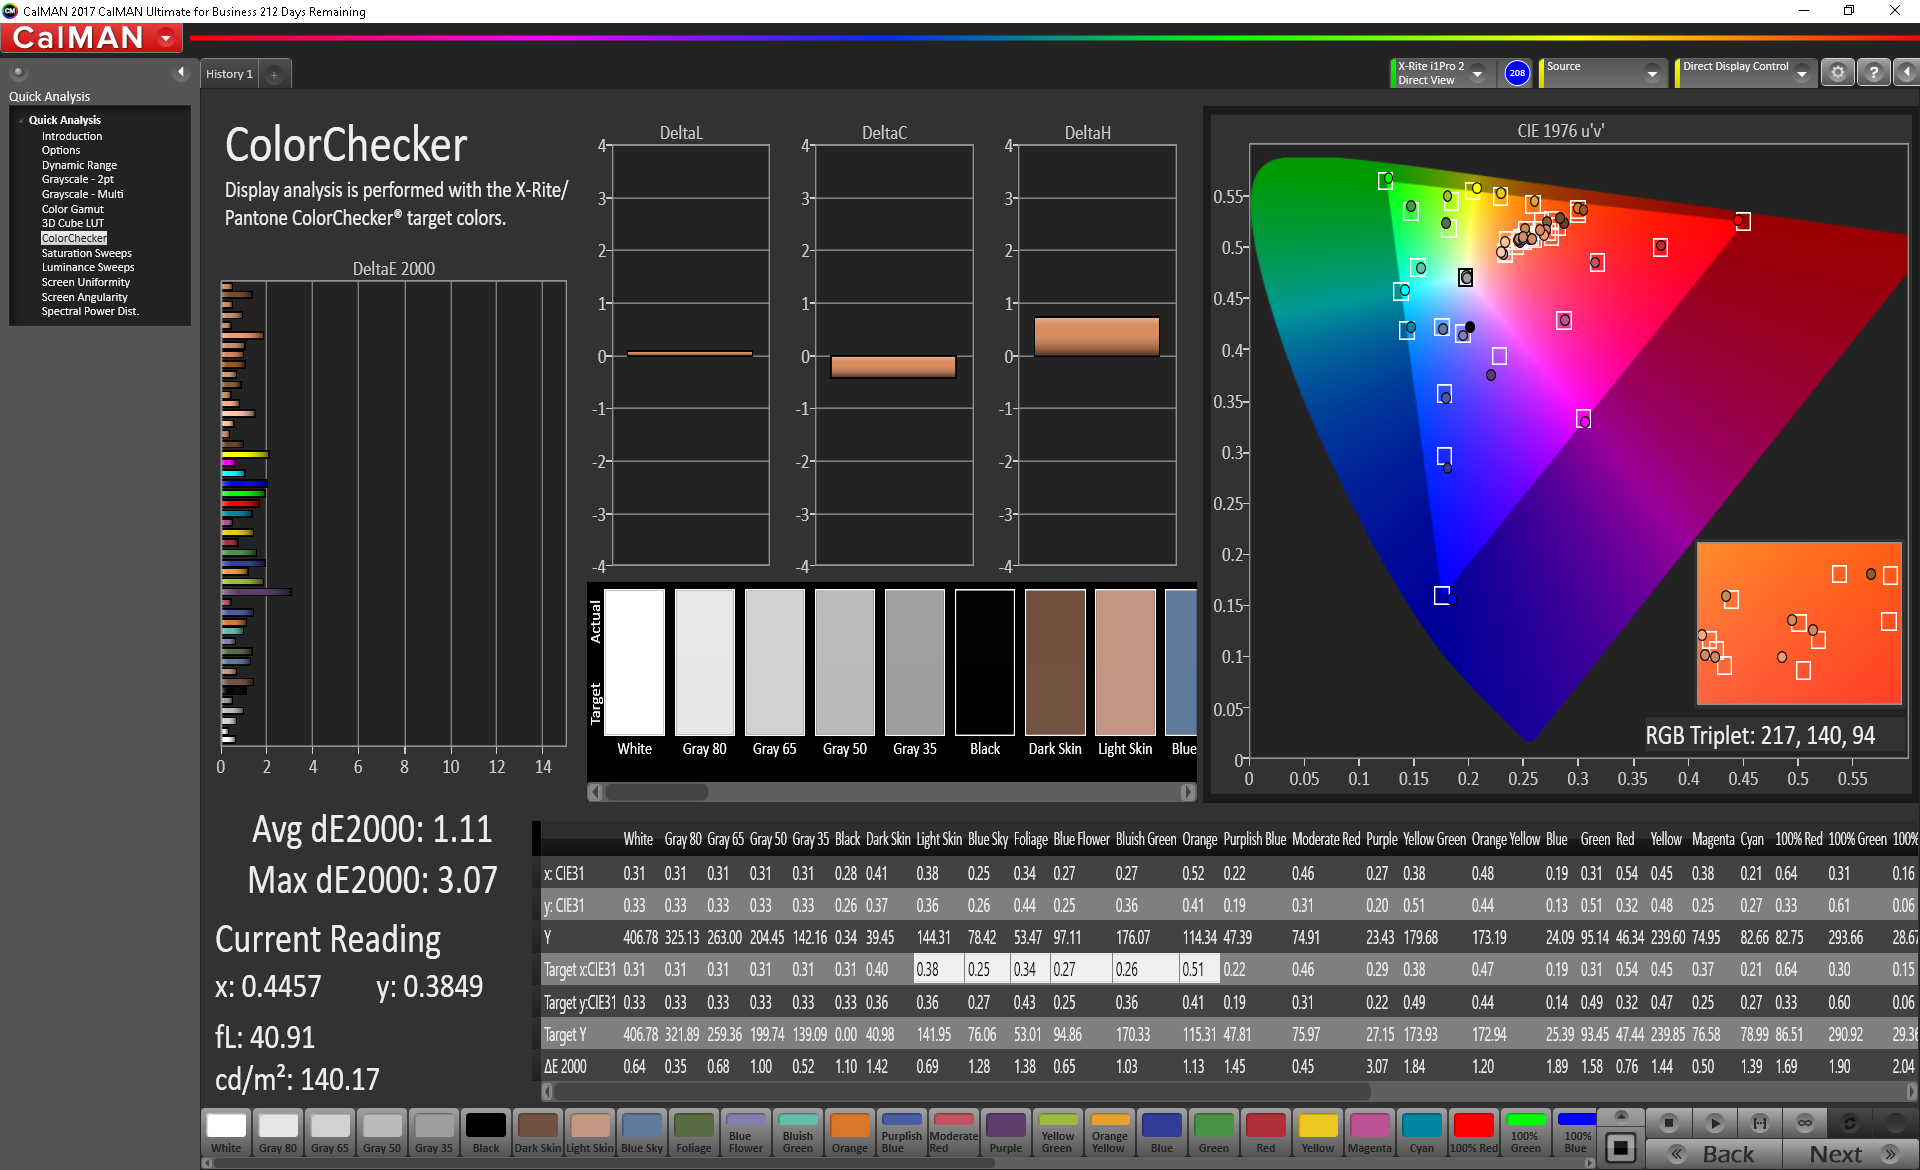
ΔE ColorChecker Calman: 2.24 | ∀{0.5-29.43 Ø4.71}
calibrated: 1.11
ΔE Greyscale Calman: 9.7 | ∀{0.09-98 Ø4.96}
95% sRGB (Argyll 1.6.3 3D)
61.6% AdobeRGB 1998 (Argyll 1.6.3 3D)
67.6% AdobeRGB 1998 (Argyll 3D)
95.2% sRGB (Argyll 3D)
65.9% Display P3 (Argyll 3D)
Gamma: 1.42
CCT: 6227 K
| Huawei Matebook X Pro i5 Tianma XM, IPS, 13.9", 3000x2000 | Huawei MateBook X Chi Mei CMN8201 / P130ZDZ-EF1, , 13.3", 2160x1440 | Dell XPS 13 9370 i7 UHD ID: Sharp SHP148B, Name: LQ133D1, Dell P/N: 8XDHY, IPS, 13.3", 3840x2160 | Asus Zenbook UX3430UN-GV174T Chi Mei CMN14D2 / N140HCE-EN1, IPS, 14", 1920x1080 | Apple MacBook Pro 13 2017 APPA033, IPS, 13.3", 2560x1600 | Microsoft Surface Laptop i5 ID: MEI96A2, Name: Panasonic VVX14T092N00, IPS, 13.5", 2256x1504 | |
|---|---|---|---|---|---|---|
| Display | 0% | 4% | 1% | 28% | 2% | |
| Display P3 Coverage (%) | 65.9 | 65.8 0% | 68.9 5% | 65.6 0% | 99.2 51% | 67.8 3% |
| sRGB Coverage (%) | 95.2 | 96.2 1% | 98.4 3% | 97.4 2% | 99.9 5% | 94.3 -1% |
| AdobeRGB 1998 Coverage (%) | 67.6 | 66.8 -1% | 69.5 3% | 67.8 0% | 87.1 29% | 69.5 3% |
| Response Times | 12% | -72% | 14% | -10% | -36% | |
| Response Time Grey 50% / Grey 80% * (ms) | 40.4 ? | 33 ? 18% | 69.6 ? -72% | 30 ? 26% | 42.8 ? -6% | 50.8 ? -26% |
| Response Time Black / White * (ms) | 25.6 ? | 24 ? 6% | 44 ? -72% | 25 ? 2% | 28.8 ? -13% | 37.2 ? -45% |
| PWM Frequency (Hz) | 3759 ? | |||||
| Screen | 9% | -5% | -30% | 21% | 9% | |
| Brightness middle (cd/m²) | 442.7 | 408 -8% | 478.5 8% | 377 -15% | 588 33% | 384.2 -13% |
| Brightness (cd/m²) | 428 | 395 -8% | 466 9% | 339 -21% | 561 31% | 378 -12% |
| Brightness Distribution (%) | 84 | 88 5% | 86 2% | 76 -10% | 92 10% | 90 7% |
| Black Level * (cd/m²) | 0.31 | 0.45 -45% | 0.43 -39% | 0.4 -29% | 0.45 -45% | 0.36 -16% |
| Contrast (:1) | 1428 | 907 -36% | 1113 -22% | 943 -34% | 1307 -8% | 1067 -25% |
| Colorchecker dE 2000 * | 2.24 | 1.55 31% | 3.09 -38% | 3.33 -49% | 1.7 24% | 1.8 20% |
| Colorchecker dE 2000 max. * | 7.19 | 2.19 70% | 5.94 17% | 8.02 -12% | 3.5 51% | 4.2 42% |
| Colorchecker dE 2000 calibrated * | 1.11 | 2.06 -86% | 3.5 -215% | |||
| Greyscale dE 2000 * | 9.7 | 1.91 80% | 2.4 75% | 4.89 50% | 1.9 80% | 1.2 88% |
| Gamma | 1.42 155% | 2.34 94% | 2.063 107% | 2.37 93% | 2.33 94% | 2.21 100% |
| CCT | 6227 104% | 6491 100% | 6883 94% | 7620 85% | 6738 96% | 6708 97% |
| Color Space (Percent of AdobeRGB 1998) (%) | 61.6 | 61 -1% | 69.47 13% | 62 1% | 77.92 26% | 63.7 3% |
| Color Space (Percent of sRGB) (%) | 95 | 96 1% | 98.36 4% | 98 3% | 99.94 5% | 94.2 -1% |
| Total Average (Program / Settings) | 7% /
8% | -24% /
-12% | -5% /
-19% | 13% /
18% | -8% /
2% |
* ... smaller is better
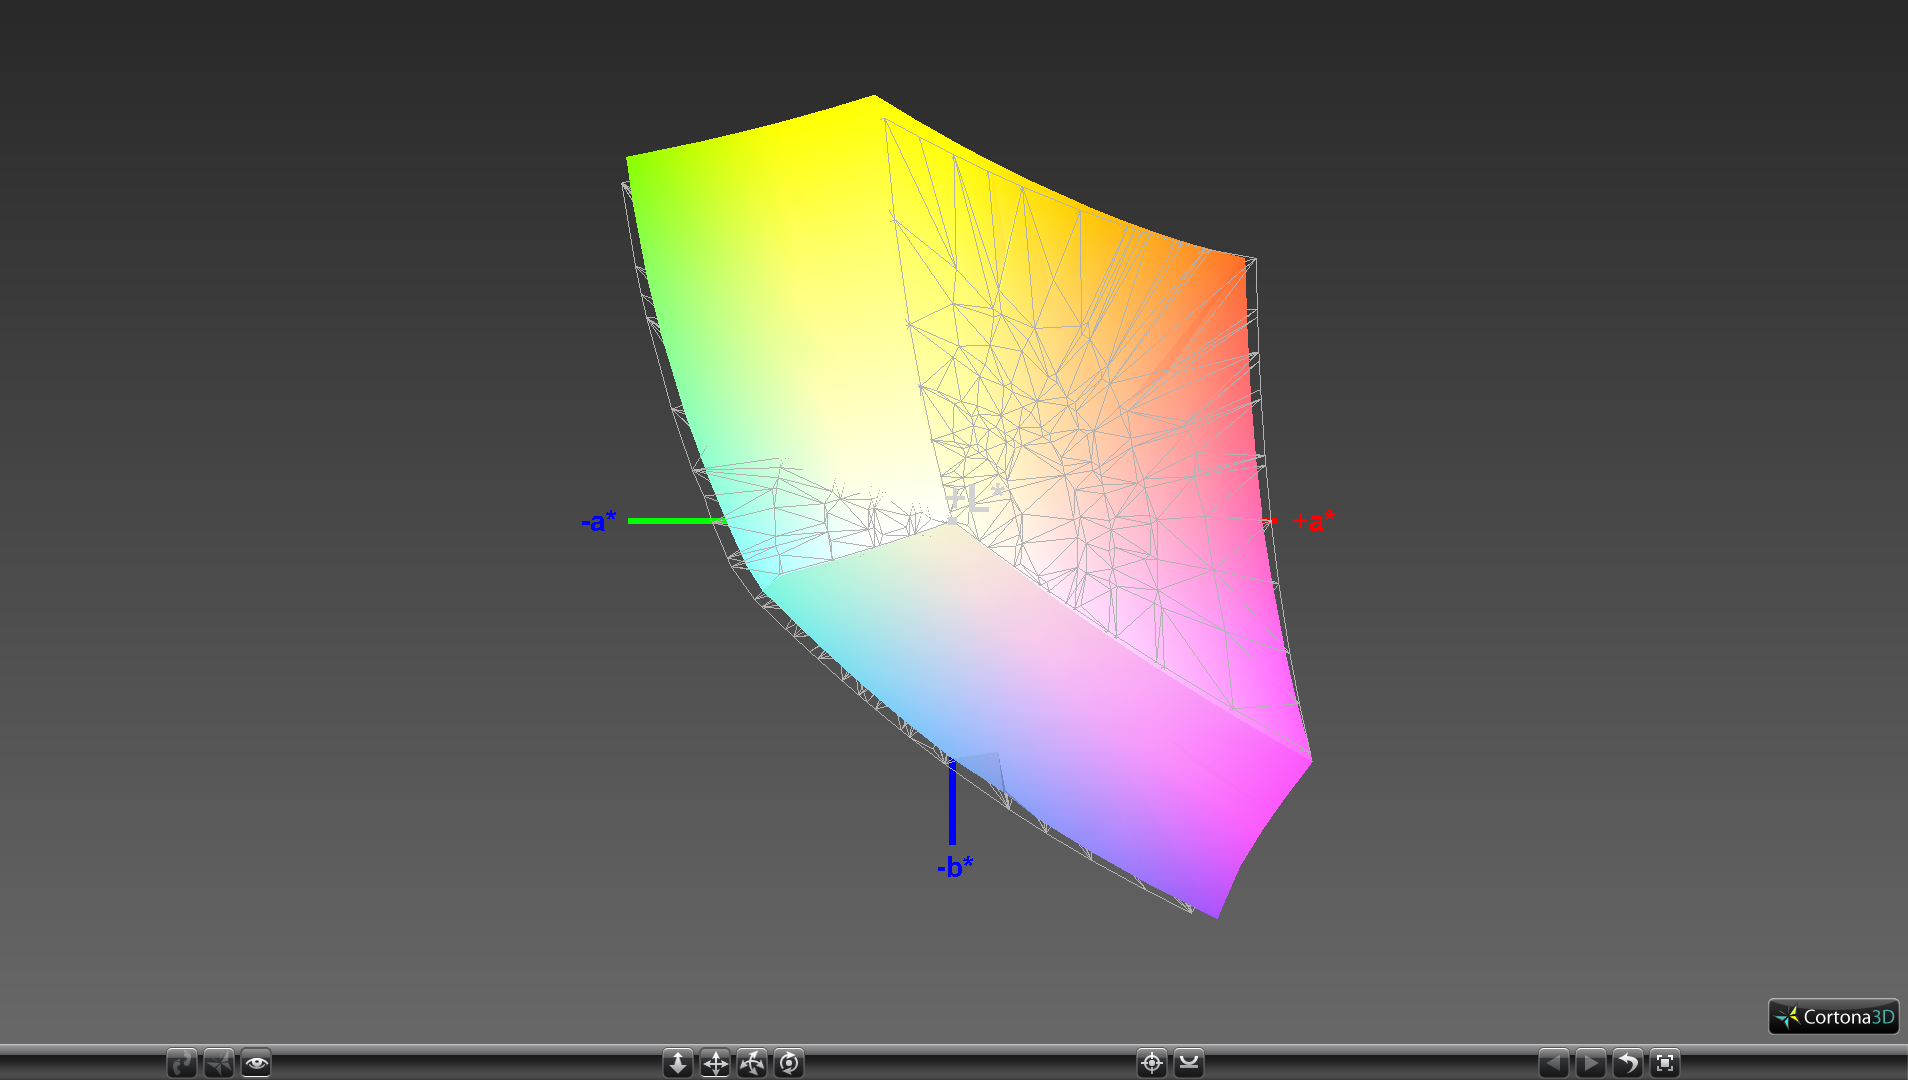
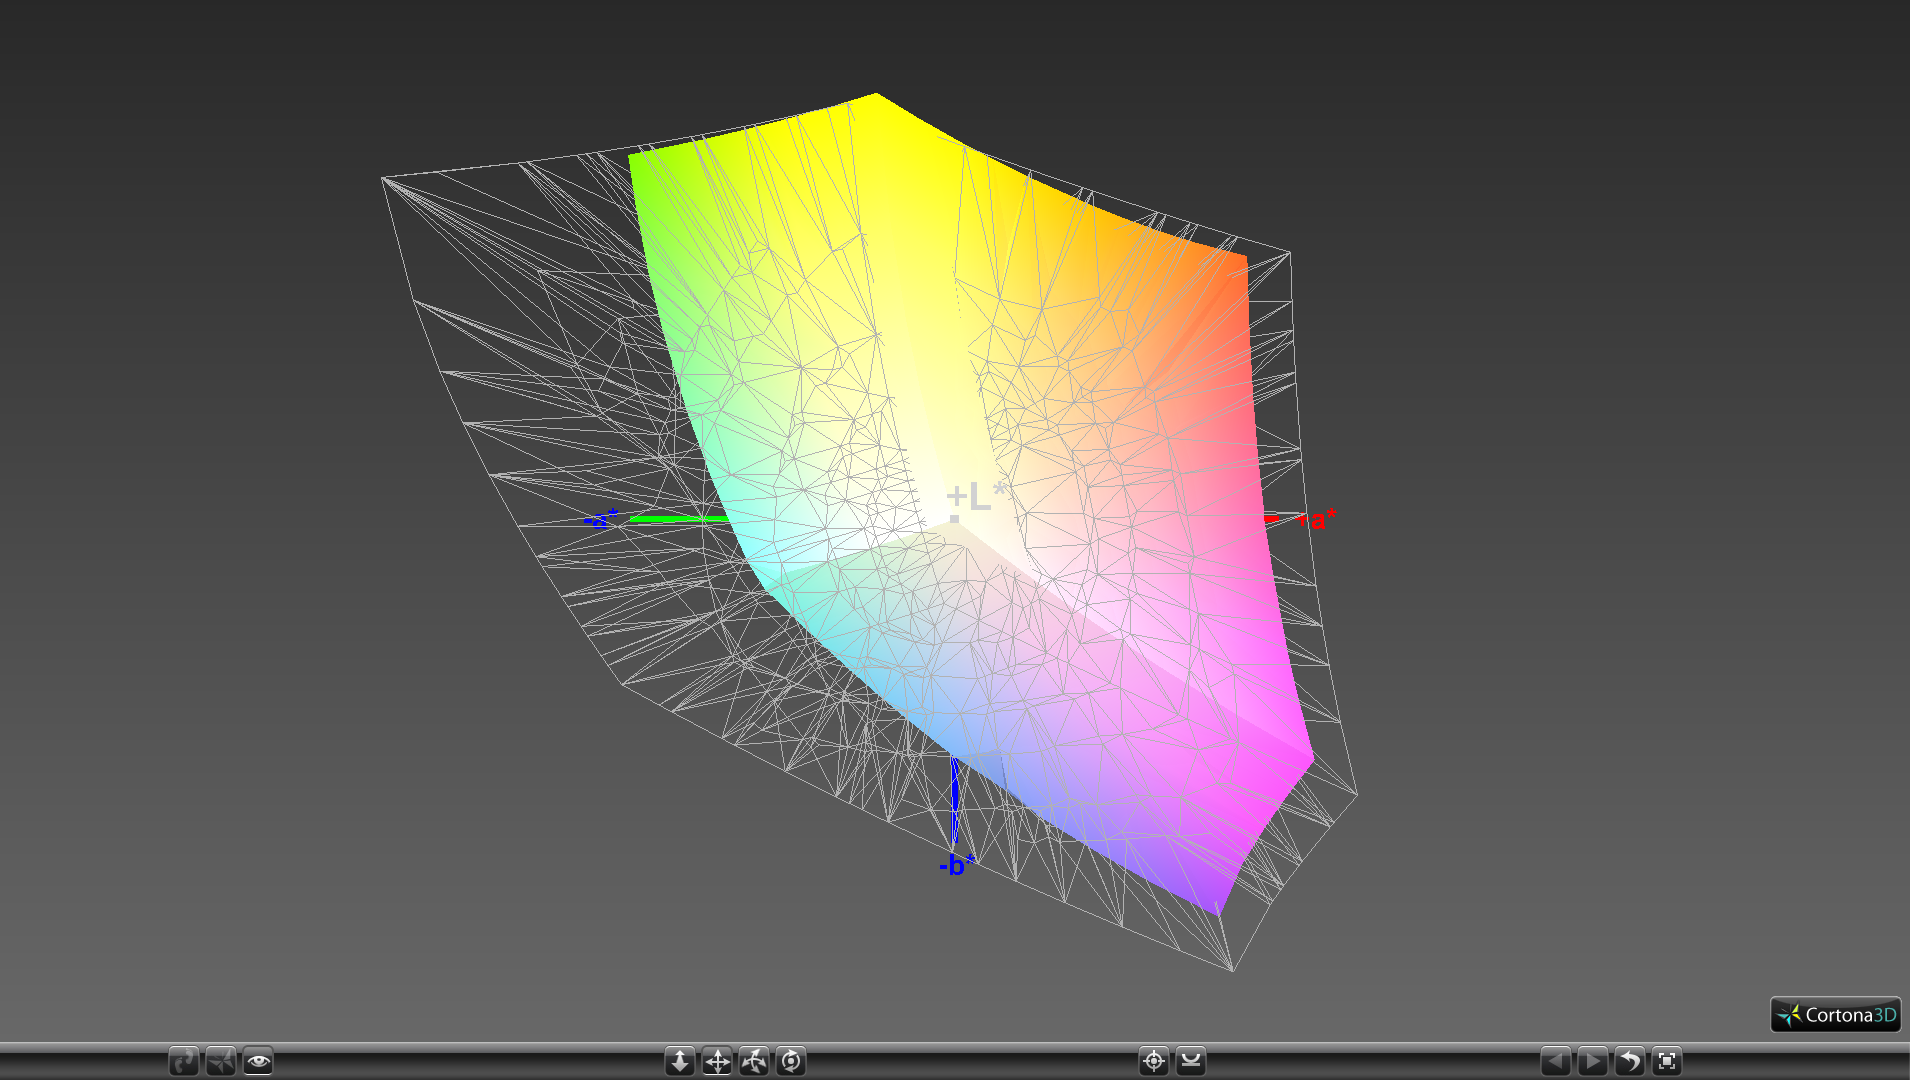
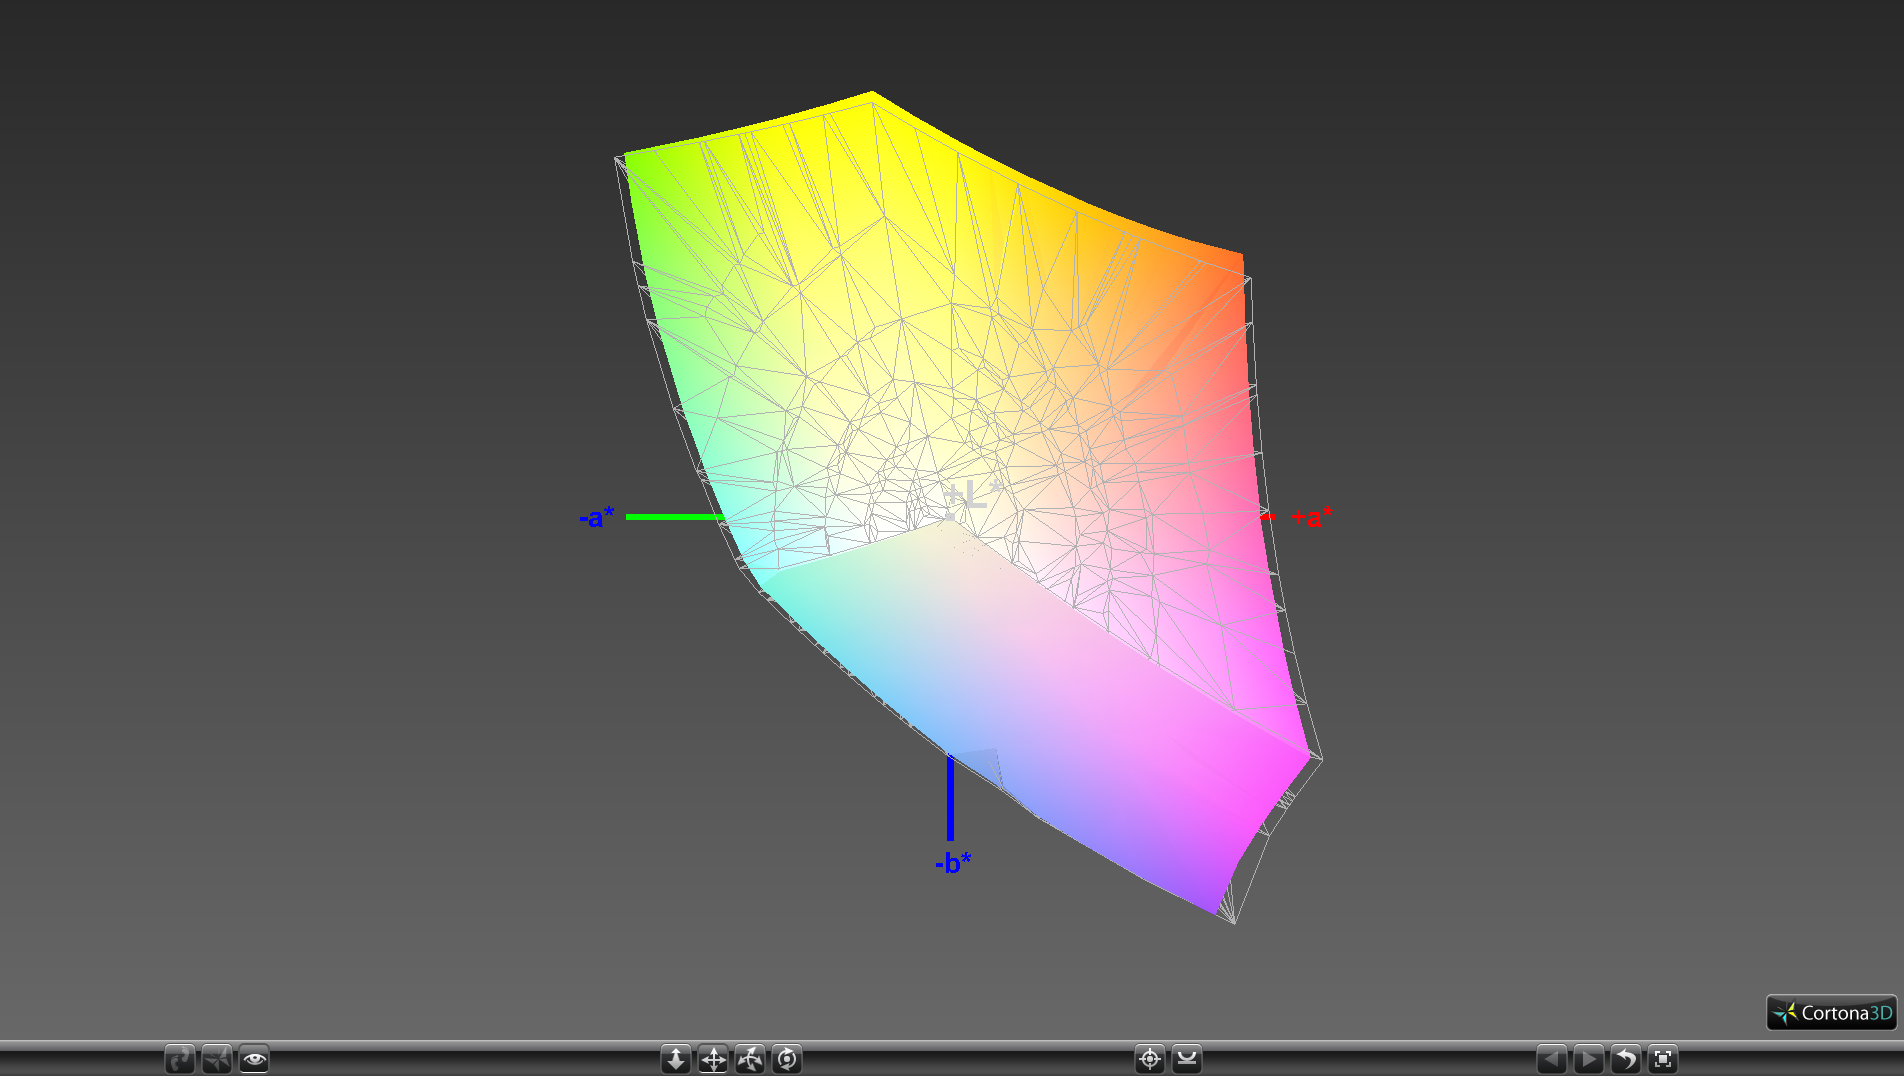
Color space is essentially identical to the MateBook X at approximately 95 percent and 62 percent of the sRGB and AdobeRGB standards, respectively. This is comparable to the panels of the XPS 13 and Asus Zenbook UX3430UN but still narrower than the panel on the MacBook Pro 13. Nonetheless, digital artists will appreciate the near complete sRGB coverage that Huawei offers.
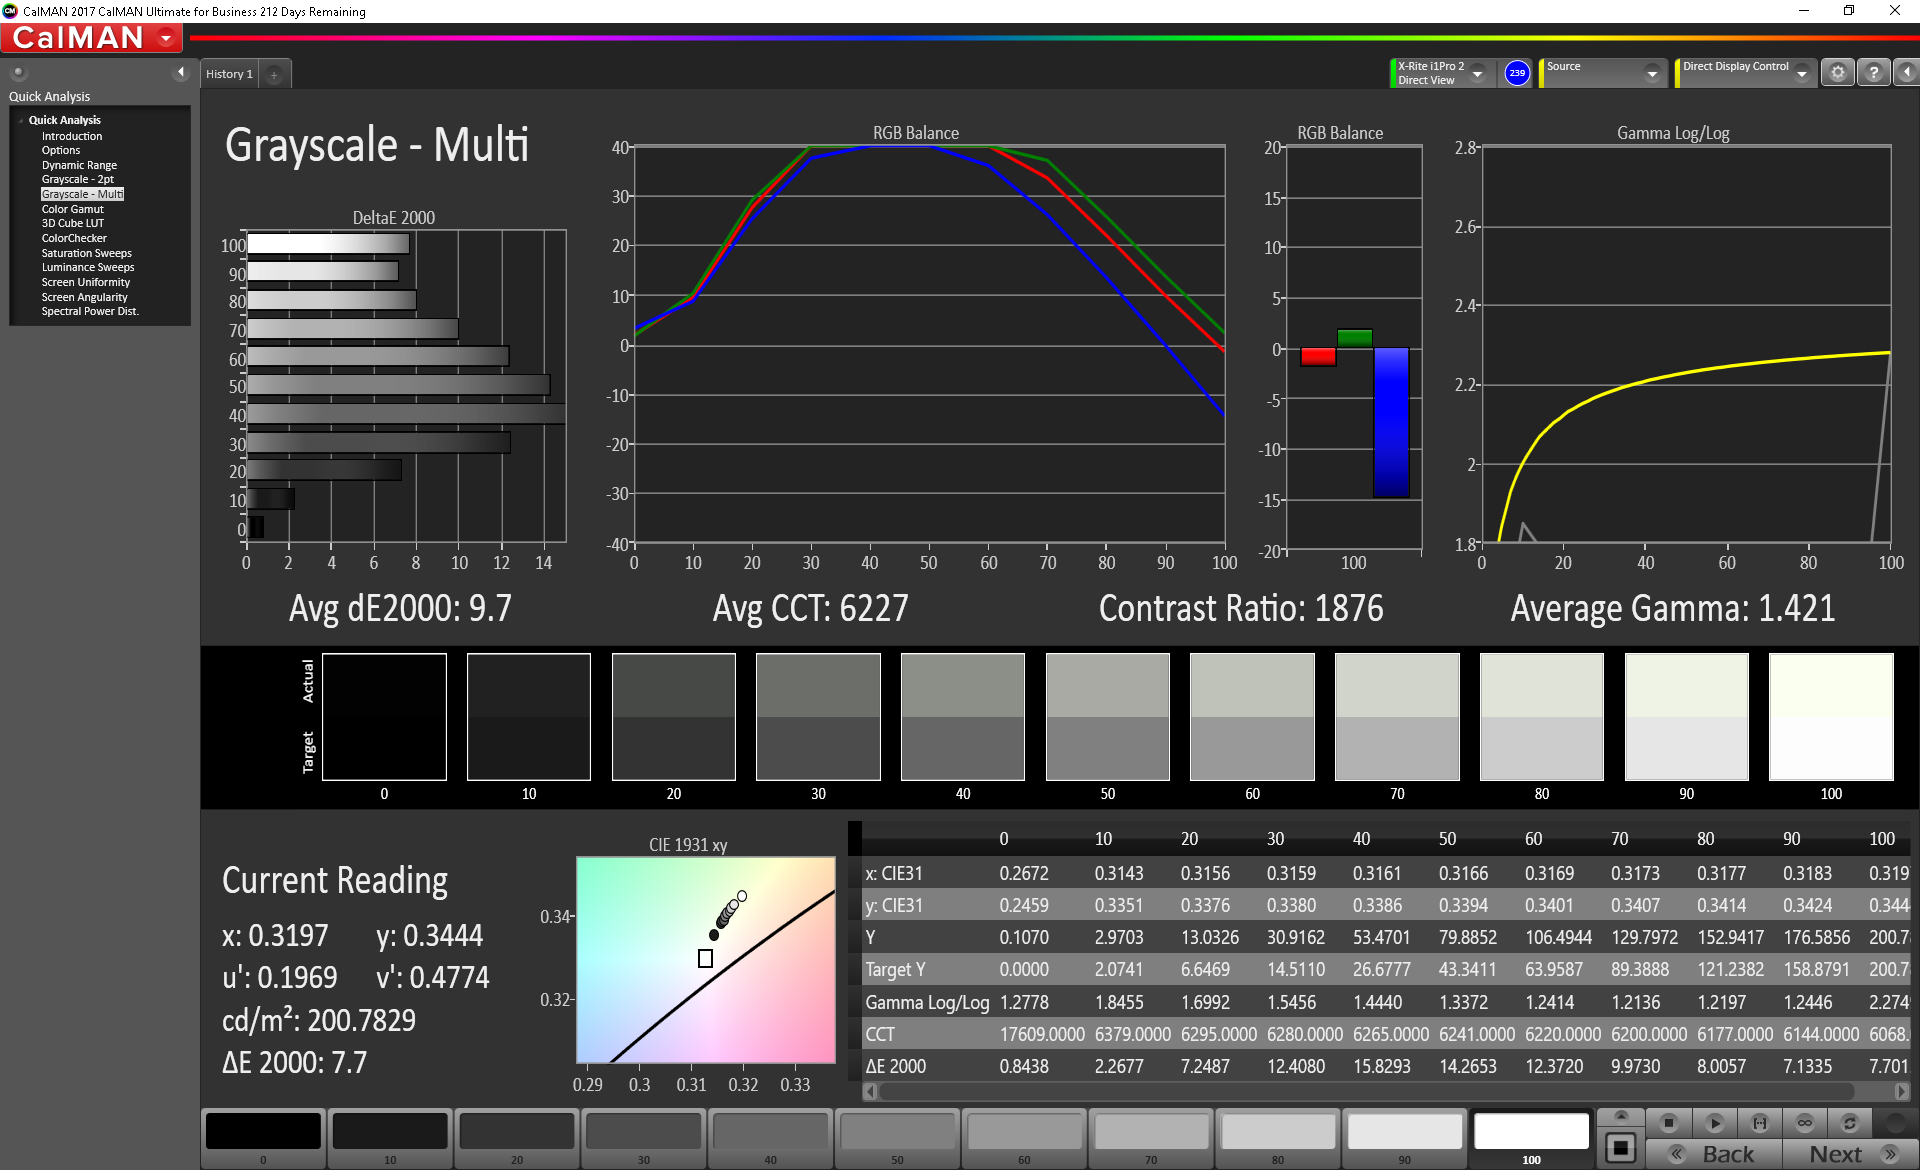
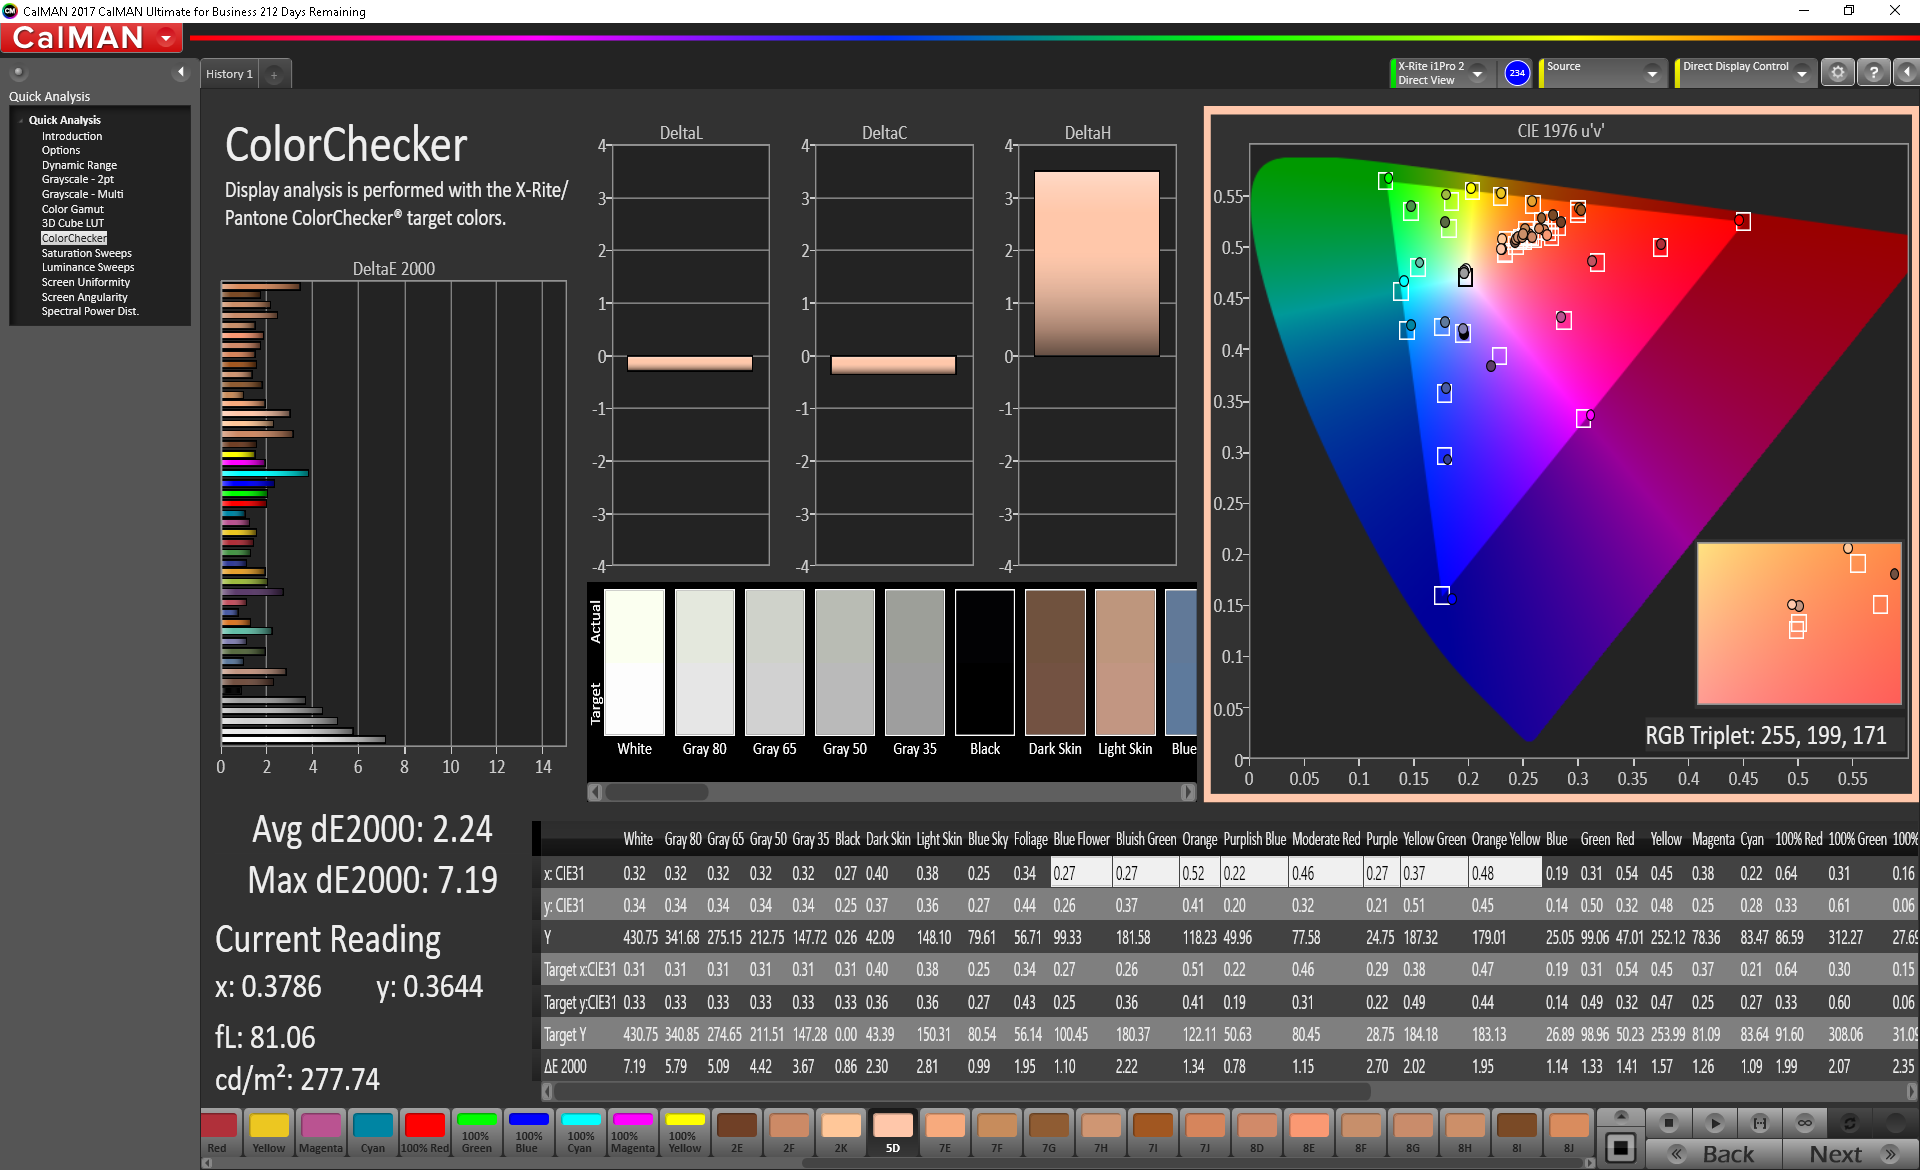
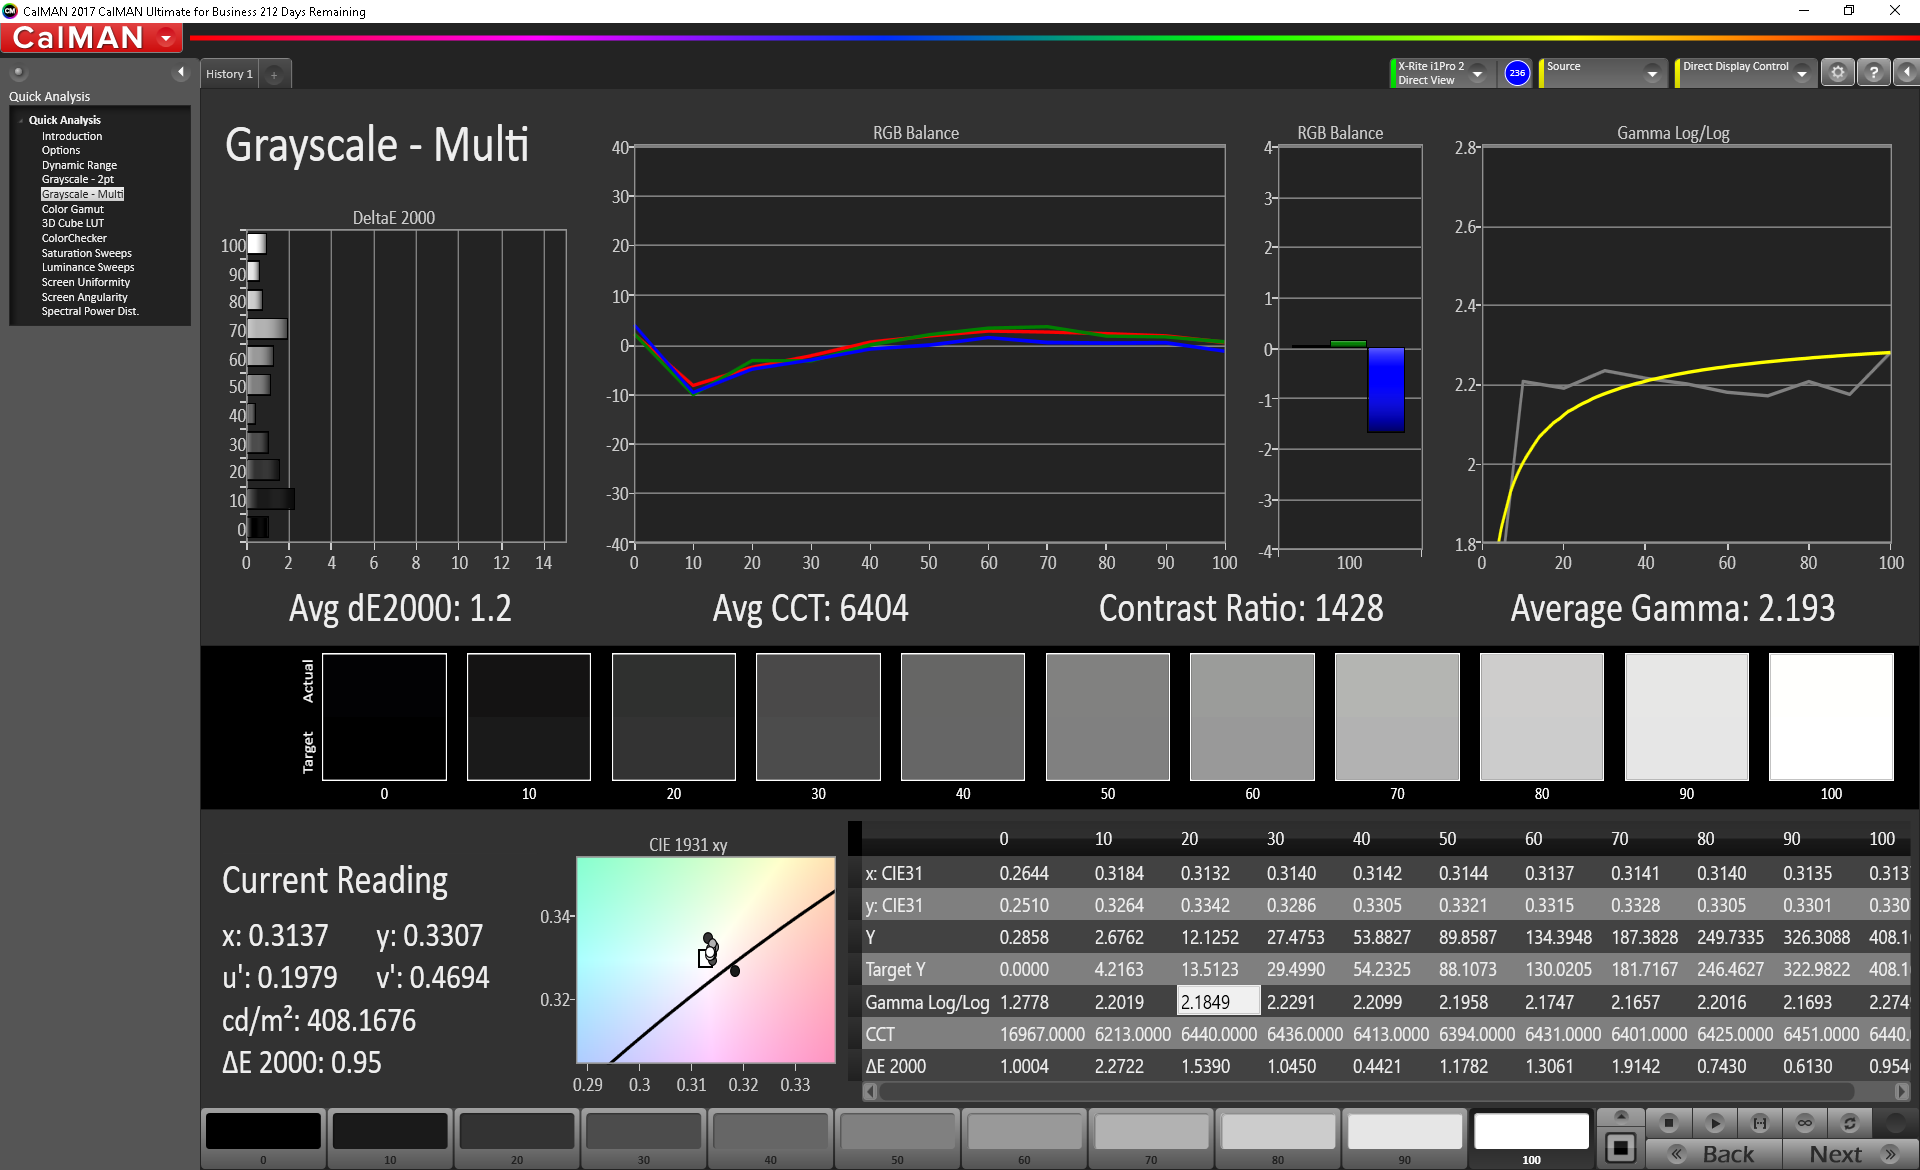
Further measurements with a X-Rite spectrophotometer reveal accurate colors but an unusually low gamma of just 1.4. In comparison, most notebooks in this price range are much closer to the 2.2 ideal. Grayscale is extremely inaccurate as a result with most dark grays appearing more beige than they should be. Fortunately, our calibration attempts are able to fix this and push gamma closer to 2.2 for a significantly improved grayscale. We highly recommend applying our ICC profile above if an end-user calibration is not possible.

Display Response Times
| ↔ Response Time Black to White | ||
|---|---|---|
| 25.6 ms ... rise ↗ and fall ↘ combined | ↗ 11.6 ms rise | 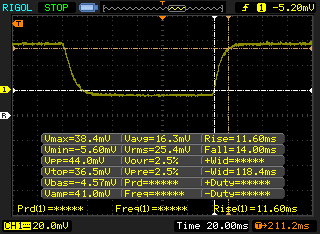 |
| ↘ 14 ms fall | ||
| The screen shows relatively slow response rates in our tests and may be too slow for gamers. In comparison, all tested devices range from 0.1 (minimum) to 240 (maximum) ms. » 61 % of all devices are better. This means that the measured response time is worse than the average of all tested devices (19.8 ms). | ||
| ↔ Response Time 50% Grey to 80% Grey | ||
| 40.4 ms ... rise ↗ and fall ↘ combined | ↗ 19.2 ms rise | 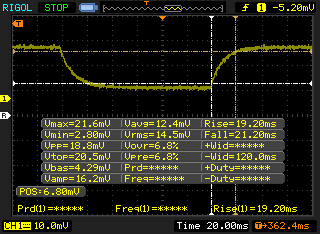 |
| ↘ 21.2 ms fall | ||
| The screen shows slow response rates in our tests and will be unsatisfactory for gamers. In comparison, all tested devices range from 0.165 (minimum) to 636 (maximum) ms. » 64 % of all devices are better. This means that the measured response time is worse than the average of all tested devices (31 ms). | ||
Screen Flickering / PWM (Pulse-Width Modulation)
| Screen flickering / PWM not detected | 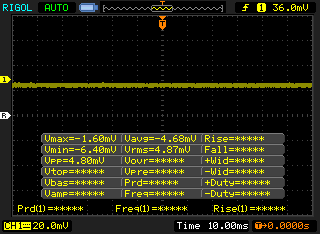 | ||
In comparison: 52 % of all tested devices do not use PWM to dim the display. If PWM was detected, an average of 7754 (minimum: 5 - maximum: 343500) Hz was measured. | |||
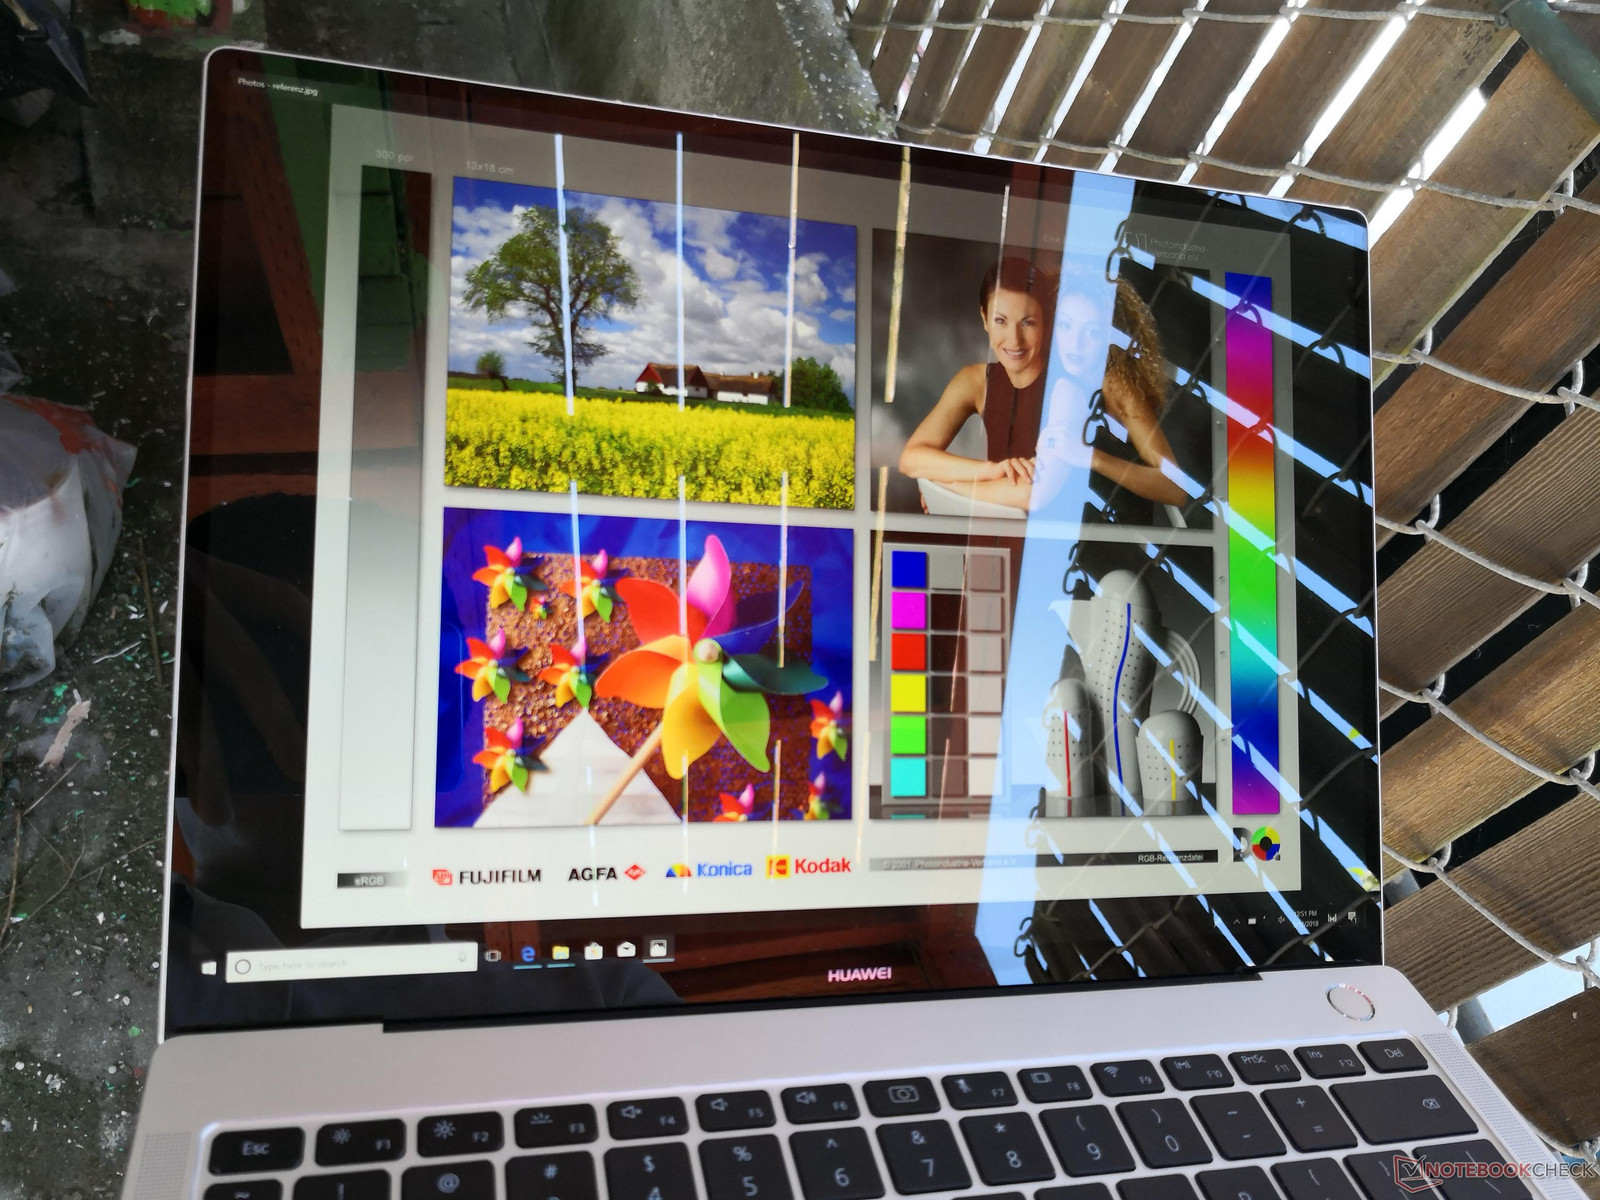
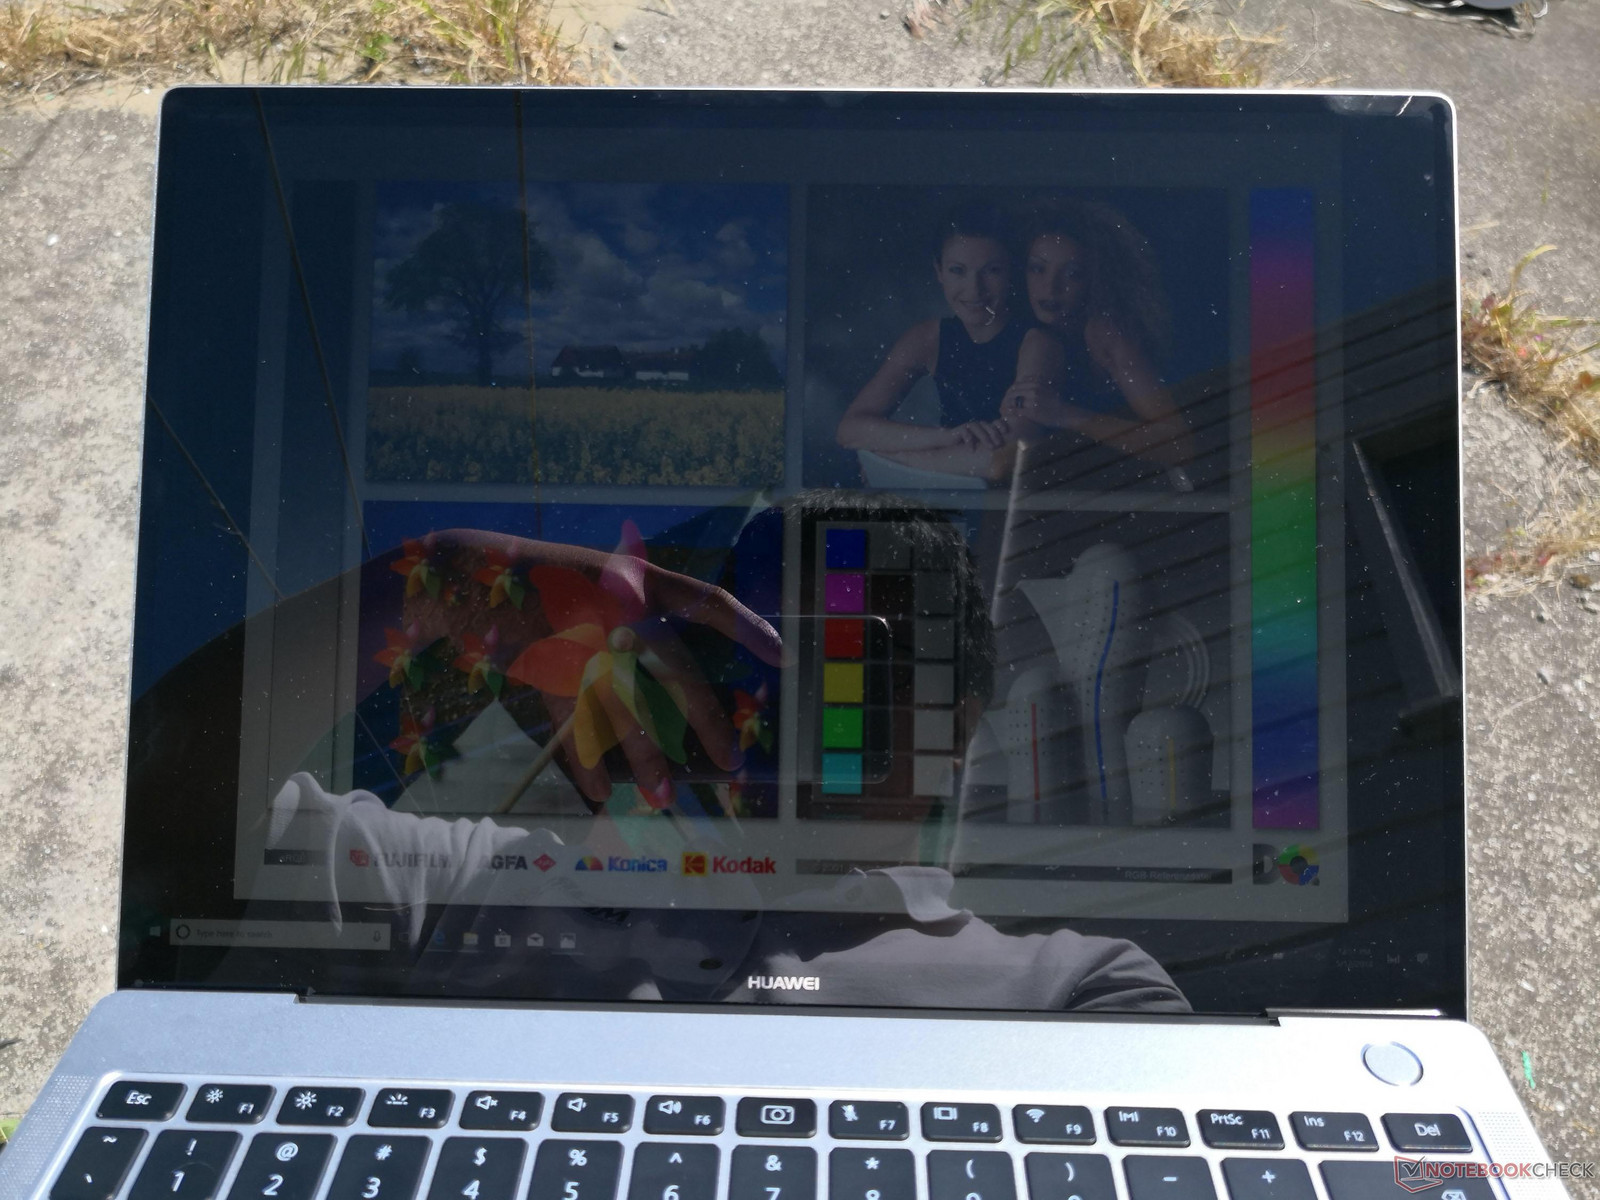
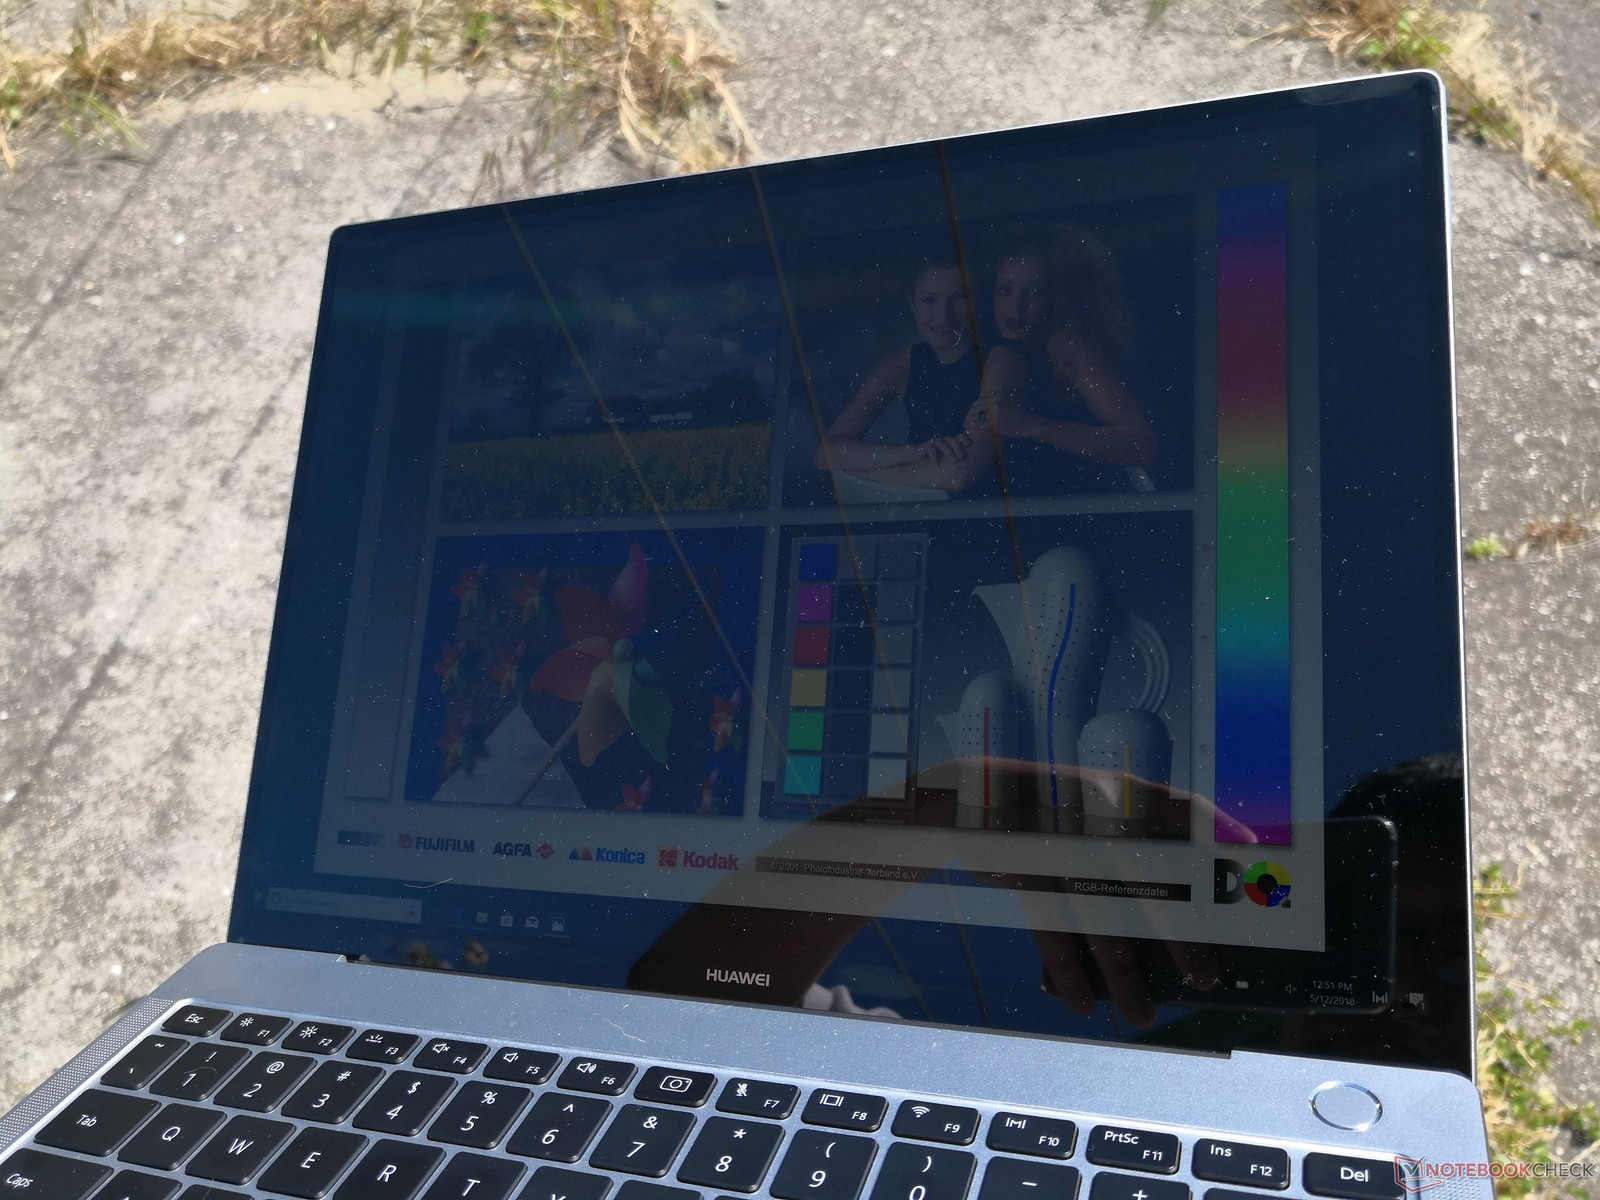
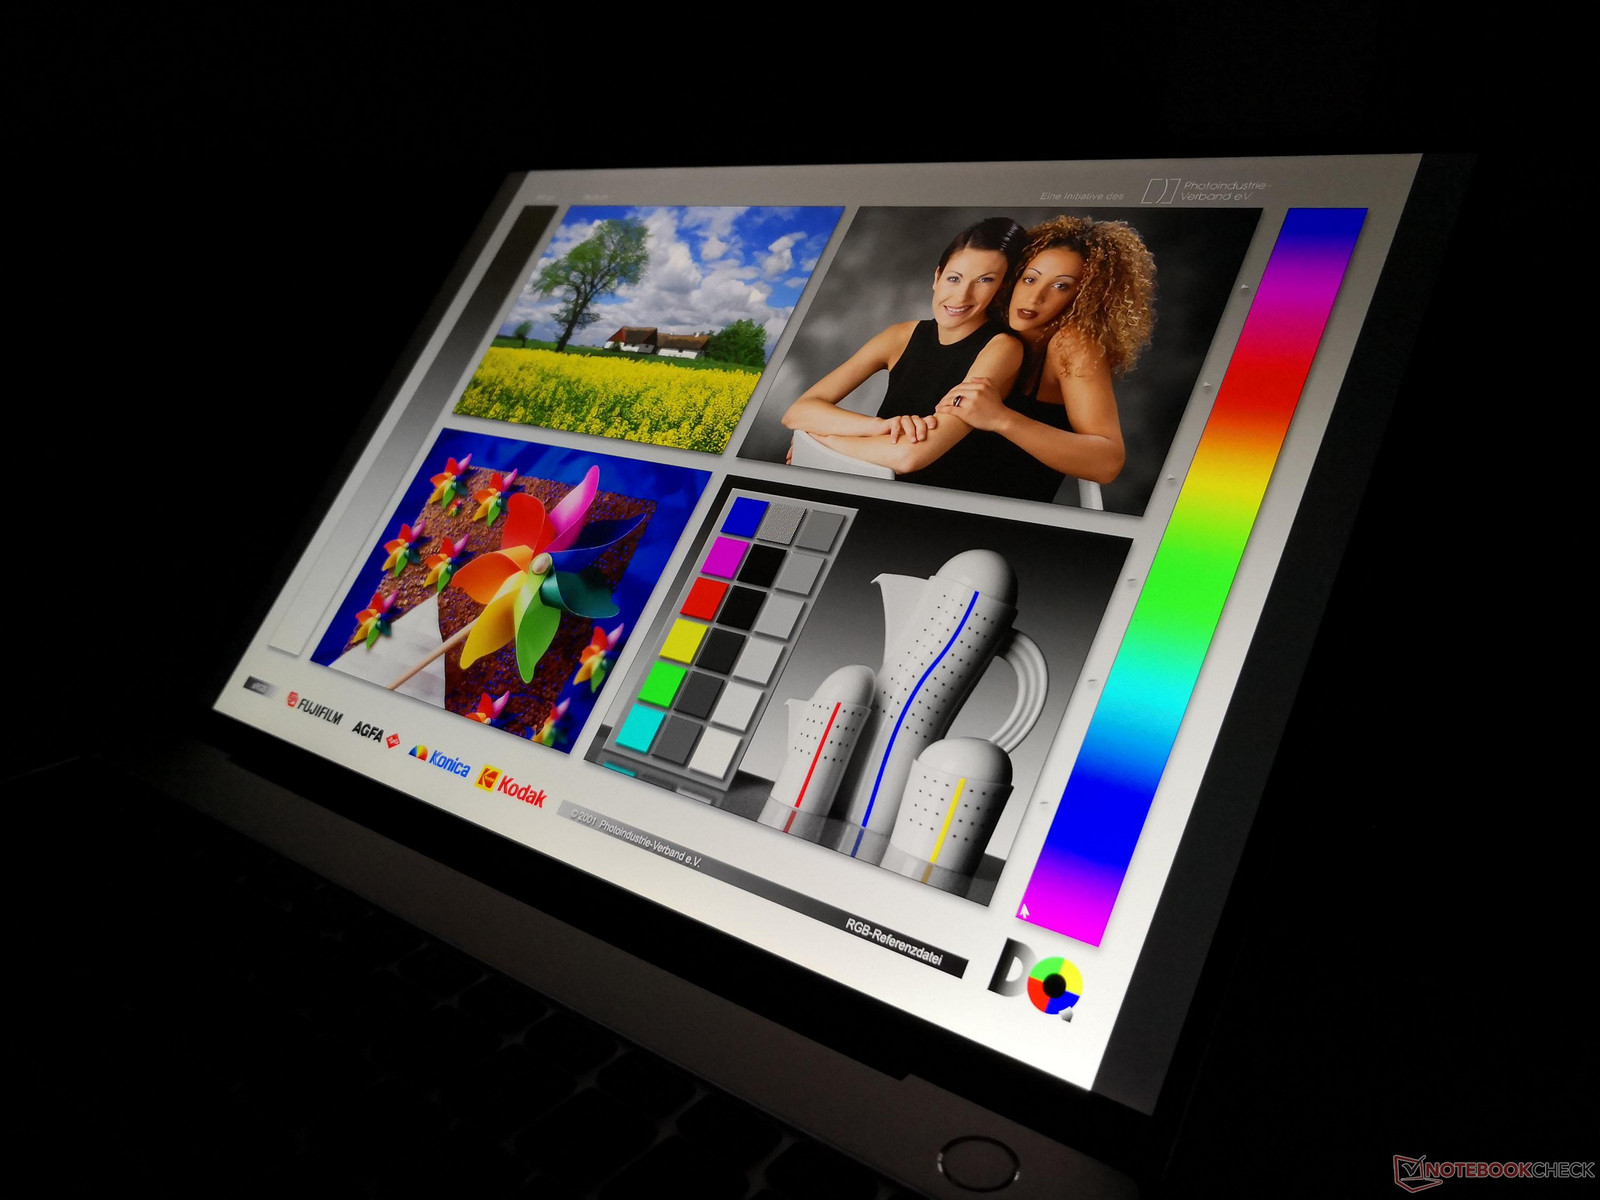
Outdoor usability is above average when under shade owing to the bright display backlight. The glossy Gorilla Glass overlay, however, accentuates glare no matter the ambient lighting. The maximum brightness setting is unable to overcome direct sunlight. Viewing angles are wide as one would expect from an IPS panel with no major changes to contrast or colors from extreme angles.
Performance
The >95 percent sRGB coverage, 3:2 display, Intel U-class CPU, and discrete Nvidia GPU are all designed to target students, graphic designers, and office workers alike. Heavy multi-taskers may want to invest in the higher-end SKU with 16 GB of fixed RAM and a dedicated Nvidia GPU.
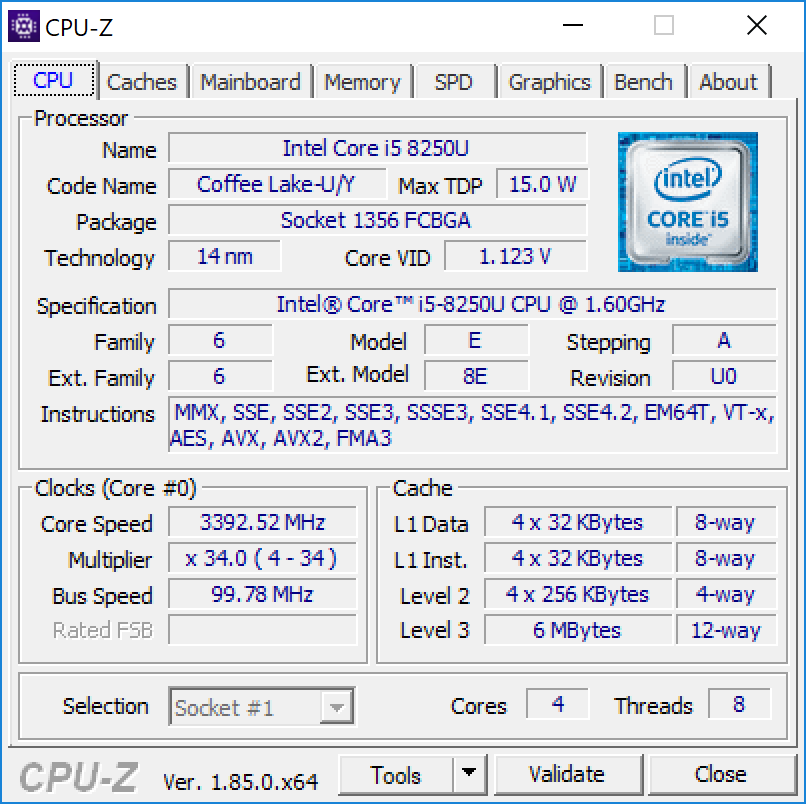
Processor
The original MateBook X was notable for its approach to passively cool an Intel U-series CPU. While this resulted in a very thin and light design, processor performance suffered from steep throttling over long periods of stress.
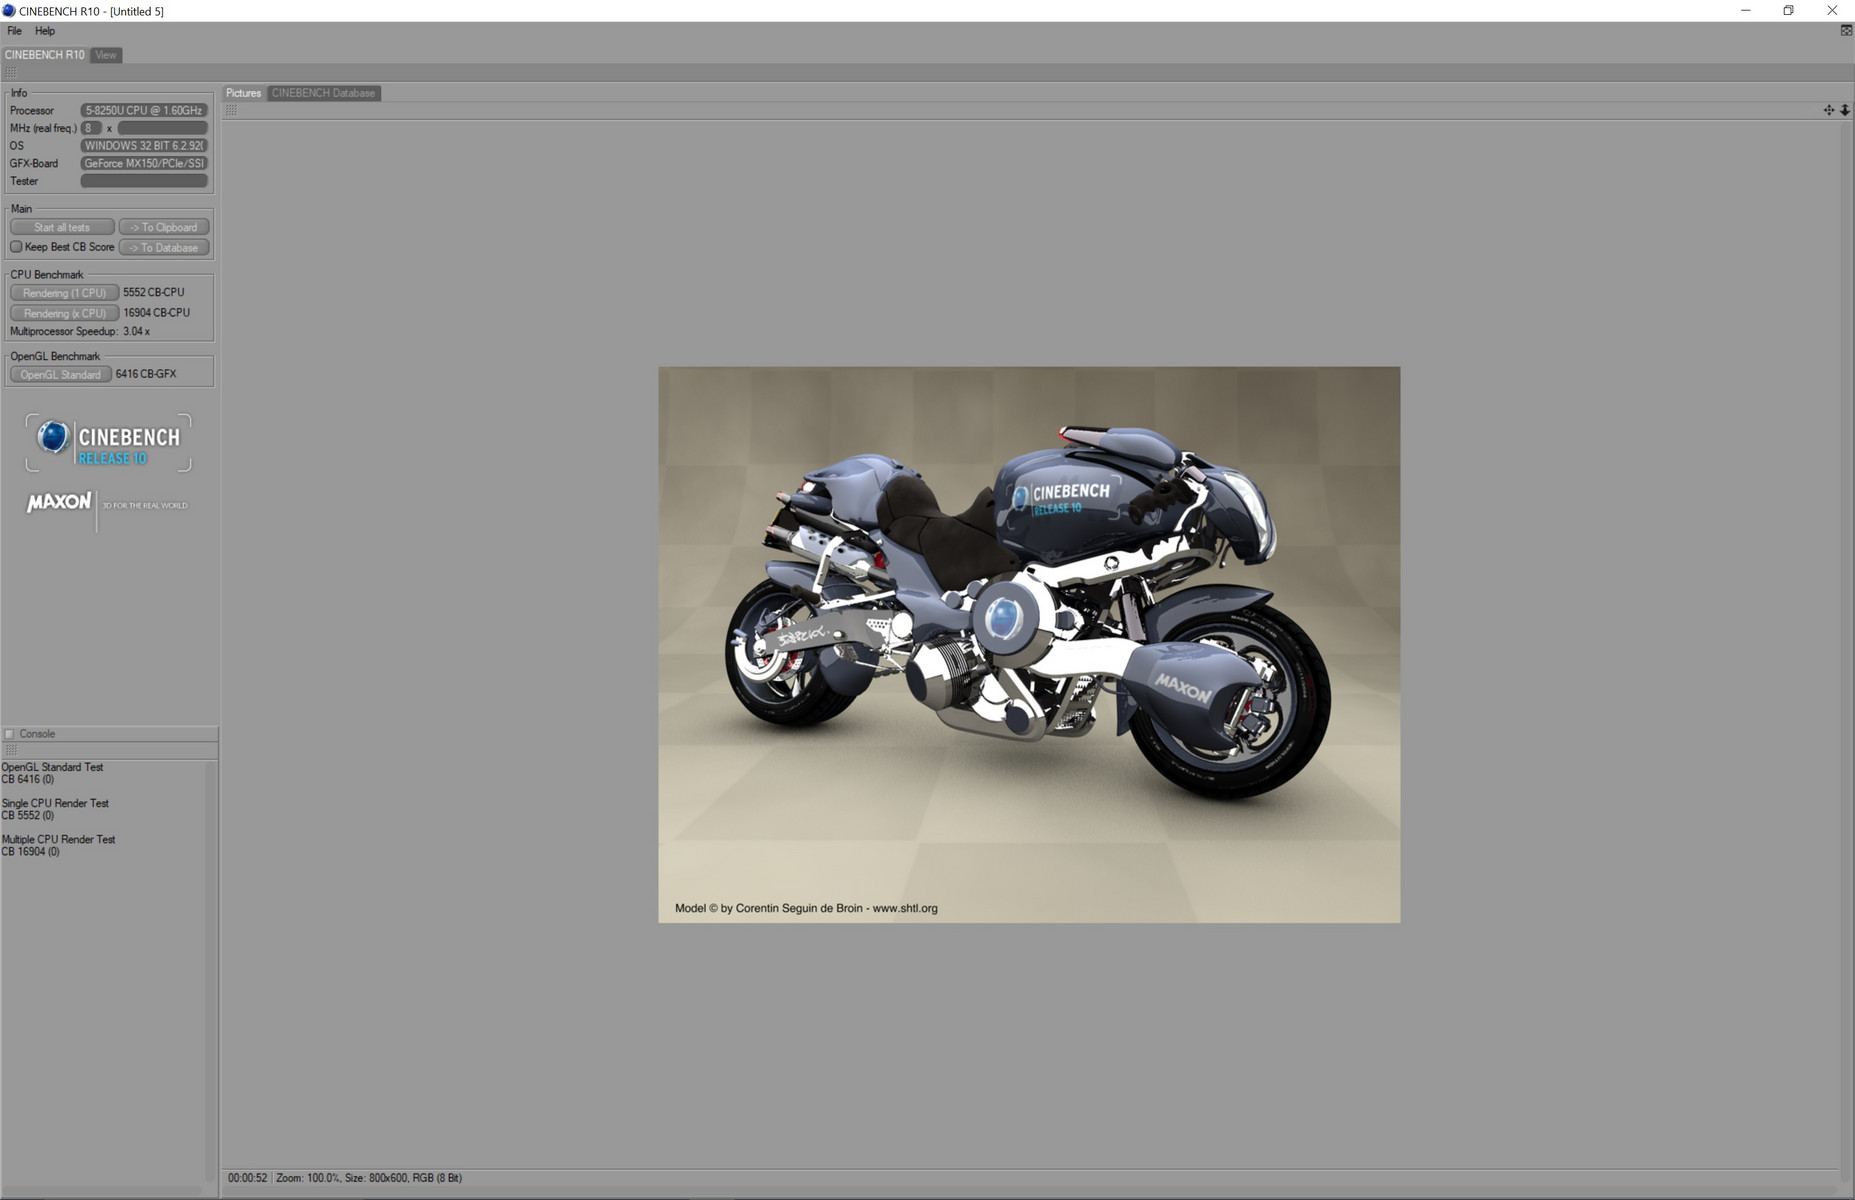
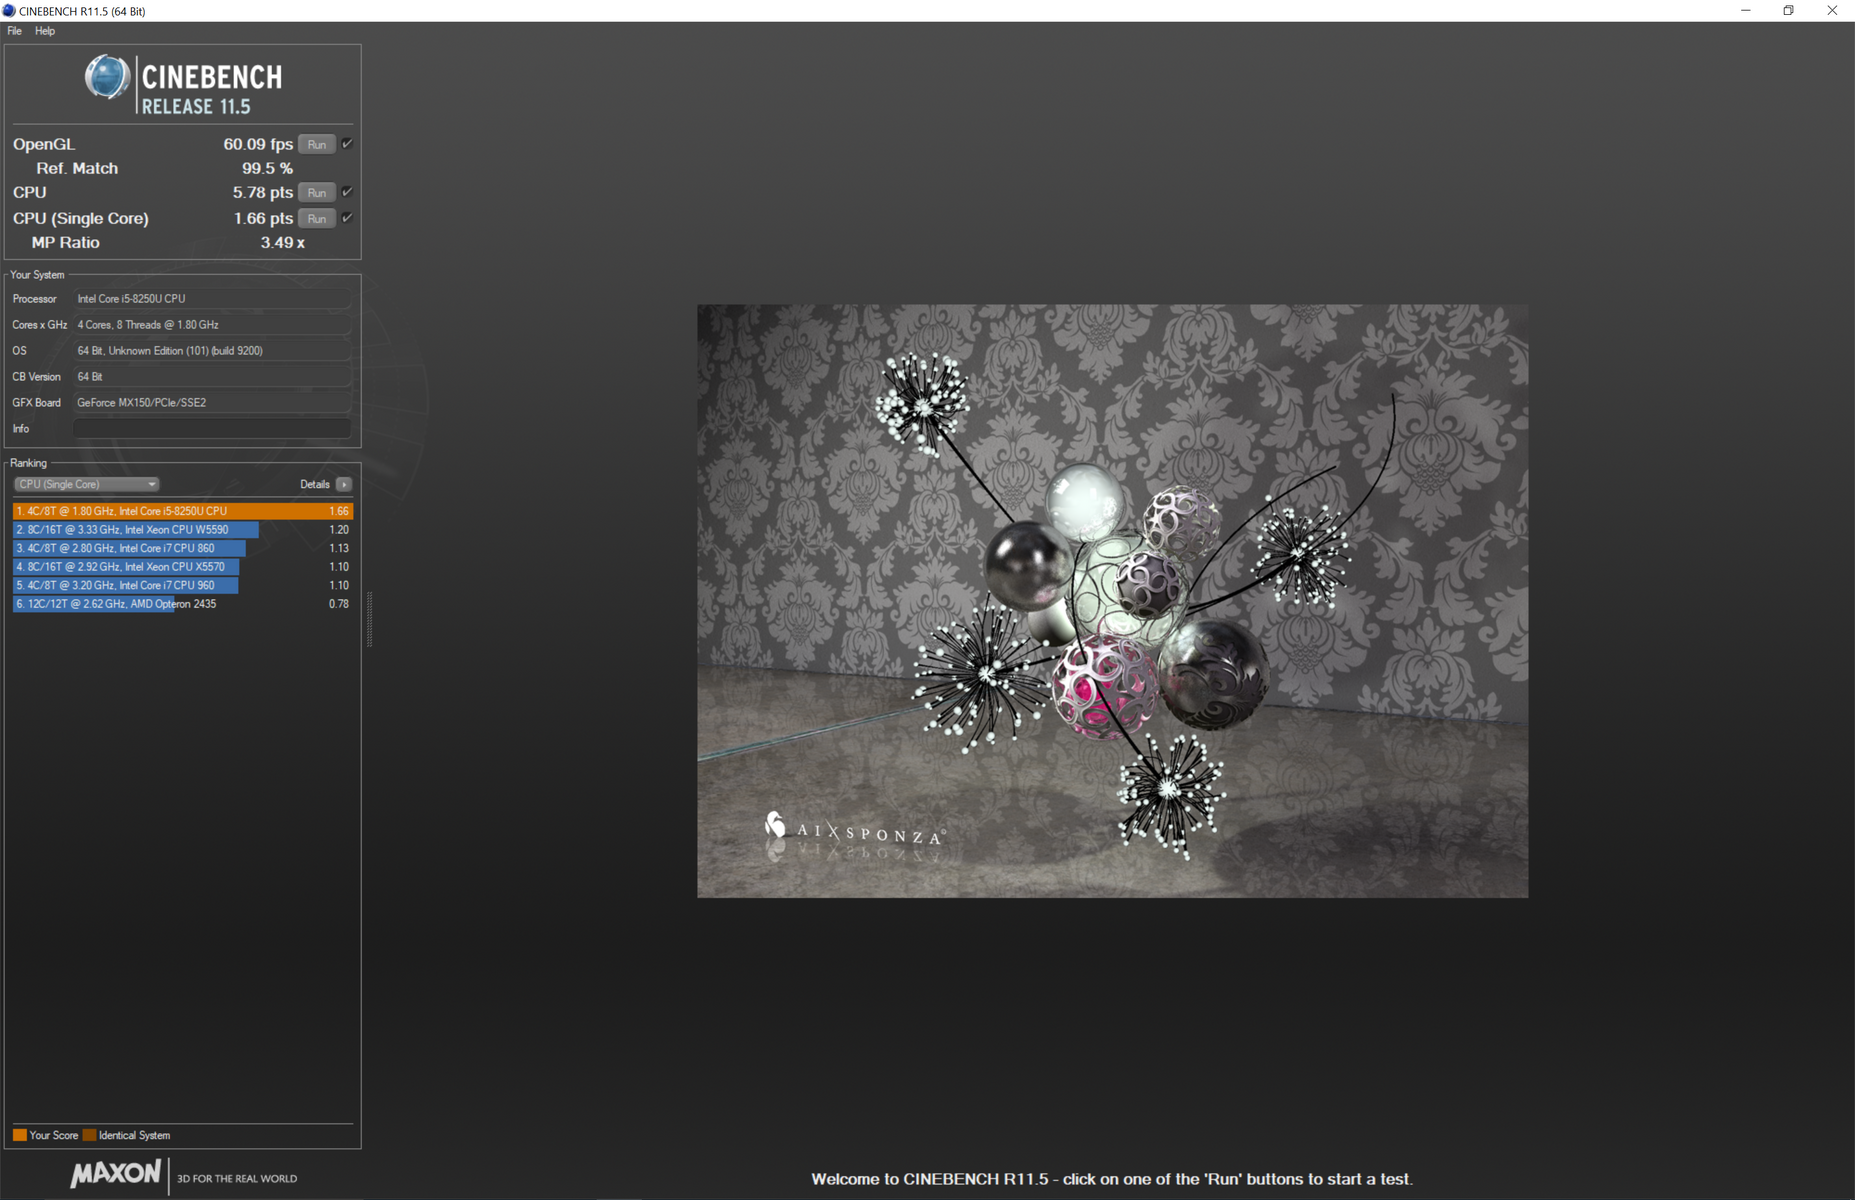
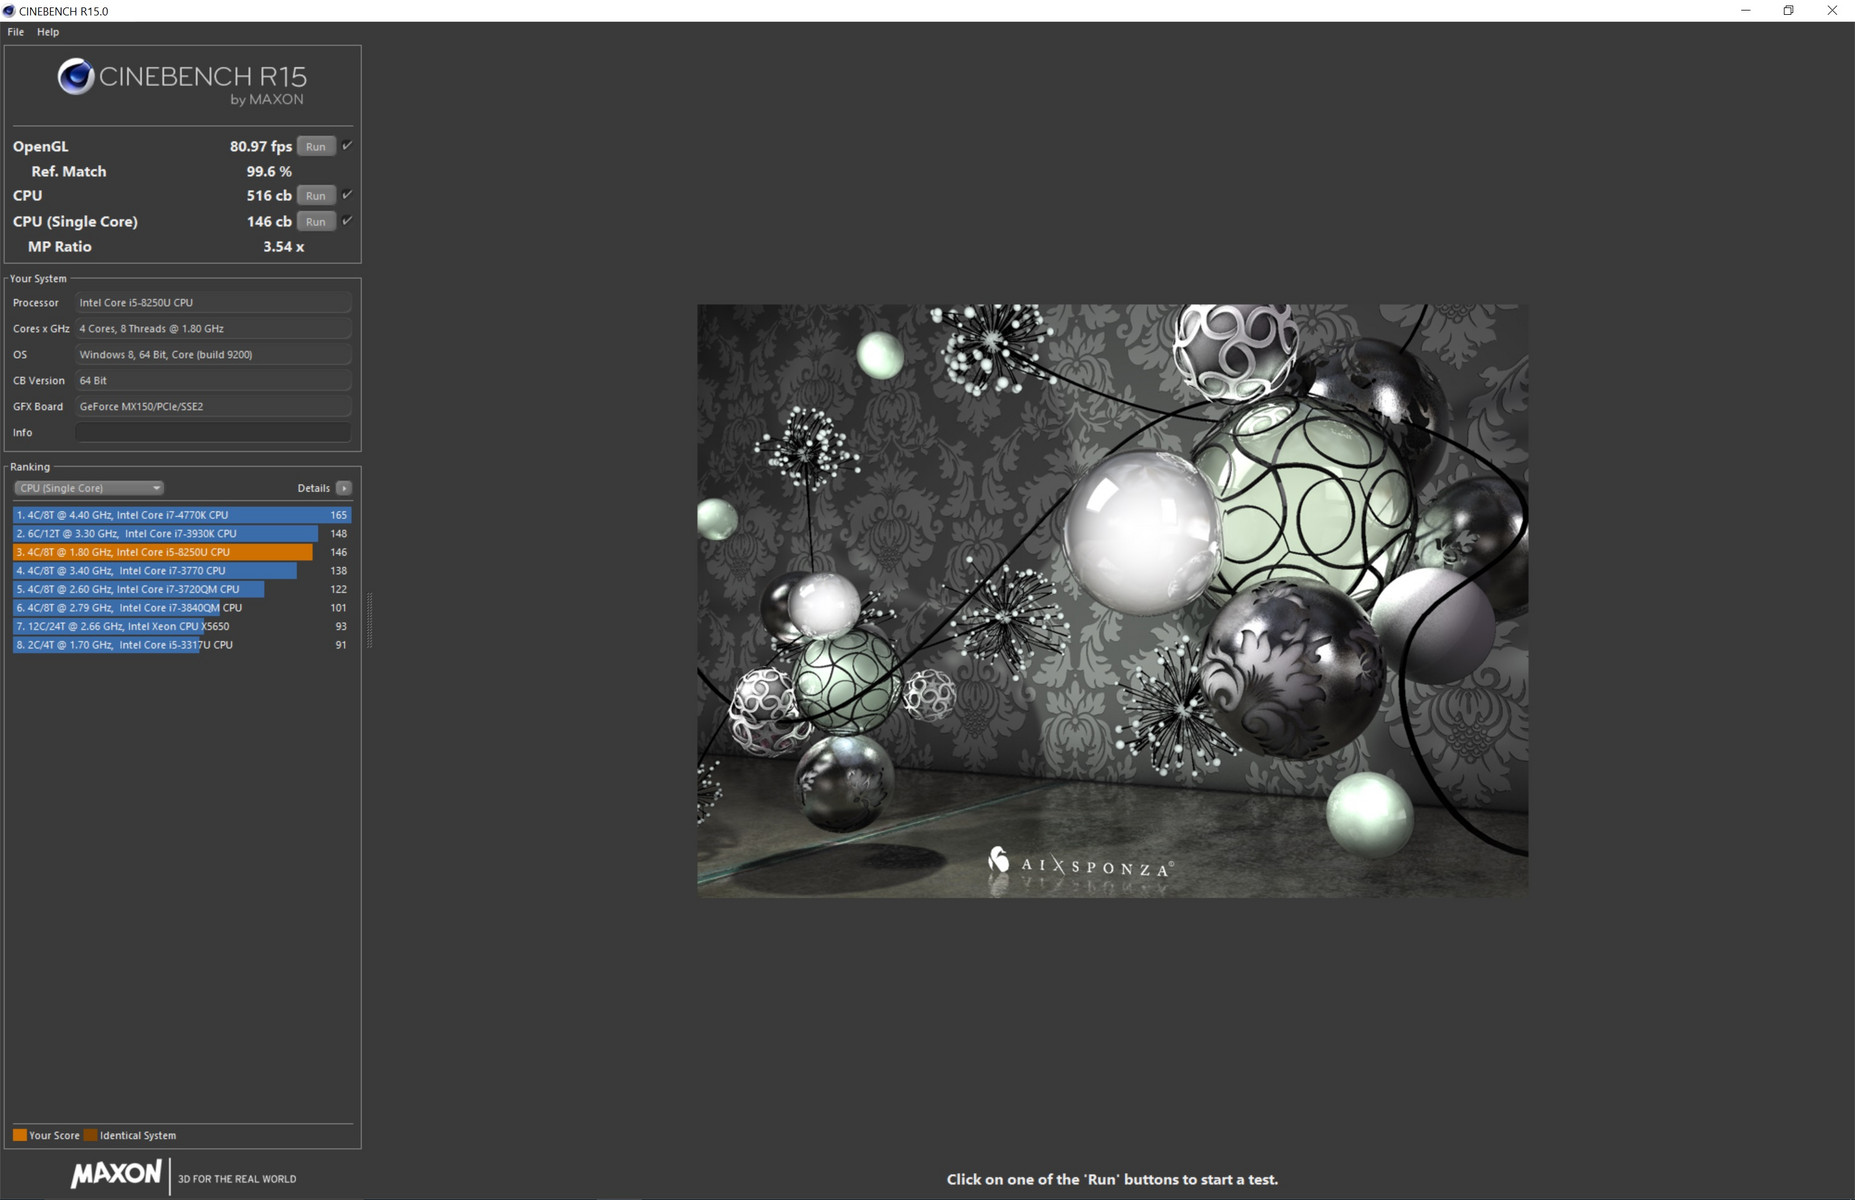
Huawei wisely decided to go with the traditional active cooling route on the MateBook X Pro to avoid excessive throttling. When subjected to a continuous CineBench R15 Multi-Thread loop, performance can be observed steadily dropping before finally plateauing at about 15 percent from the original score (537 vs. 458 points) compared to almost 40 percent on last year's MateBook X. As a result, the system is better at maintaining Turbo Boost than the previous generation, albeit still imperfect. Users can still expect a performance level similar to the Core i5-7300HQ or about 25 to 60 percent faster than the Core i5-7200U in the original MateBook X.
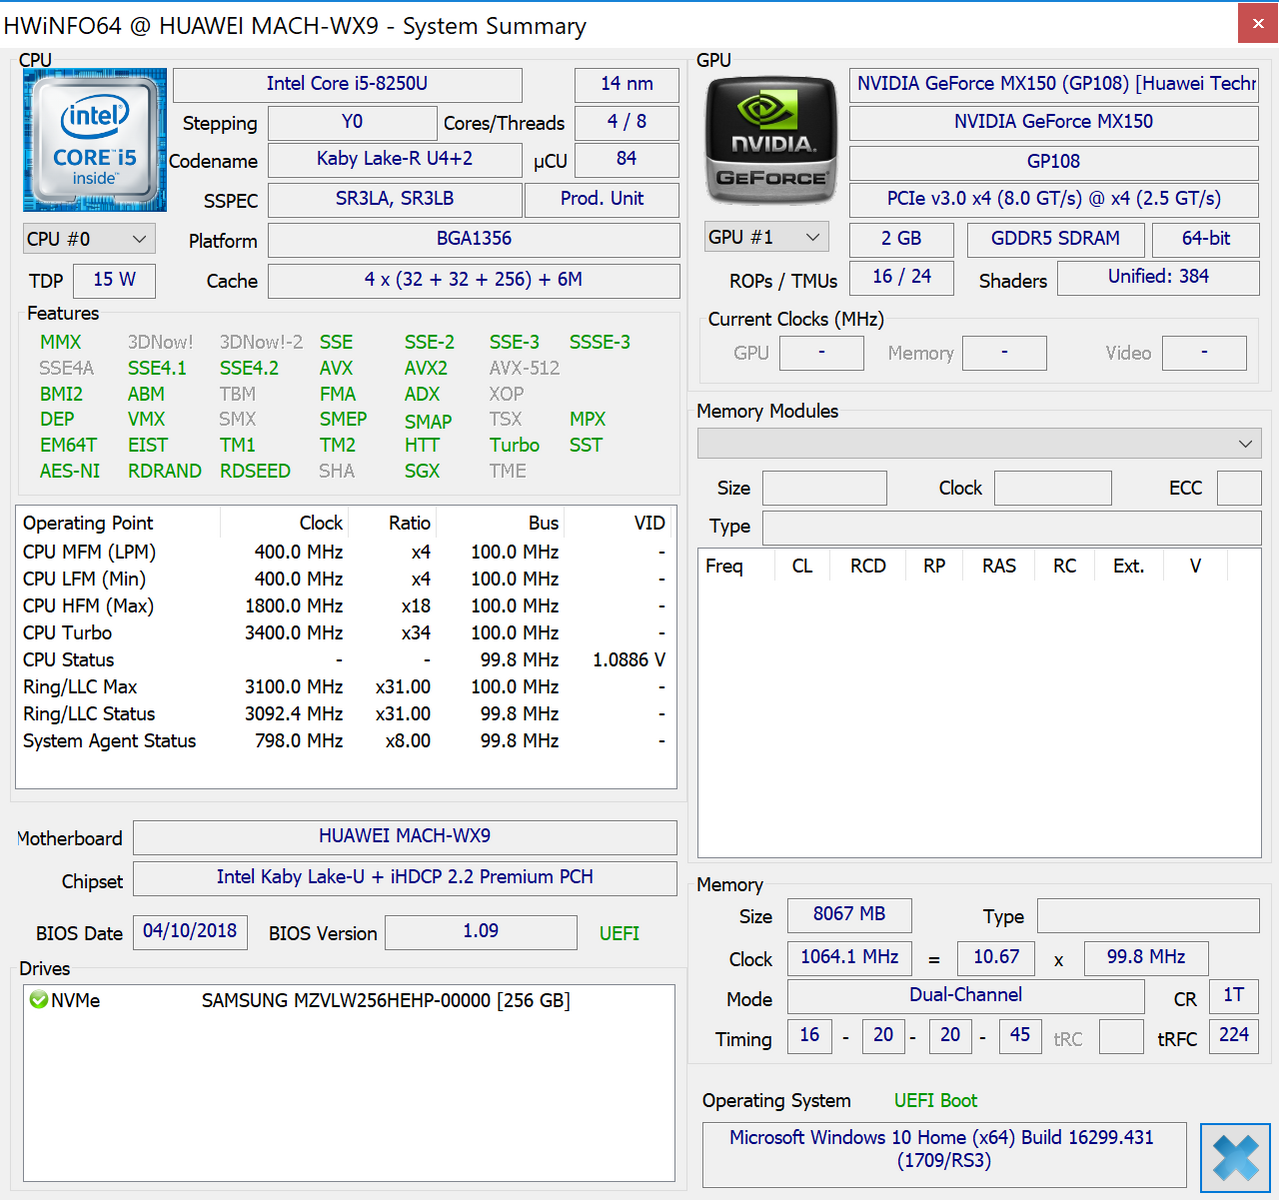
See our dedicated page on the Core i5-8250U for more technical information and benchmarks.
* ... smaller is better
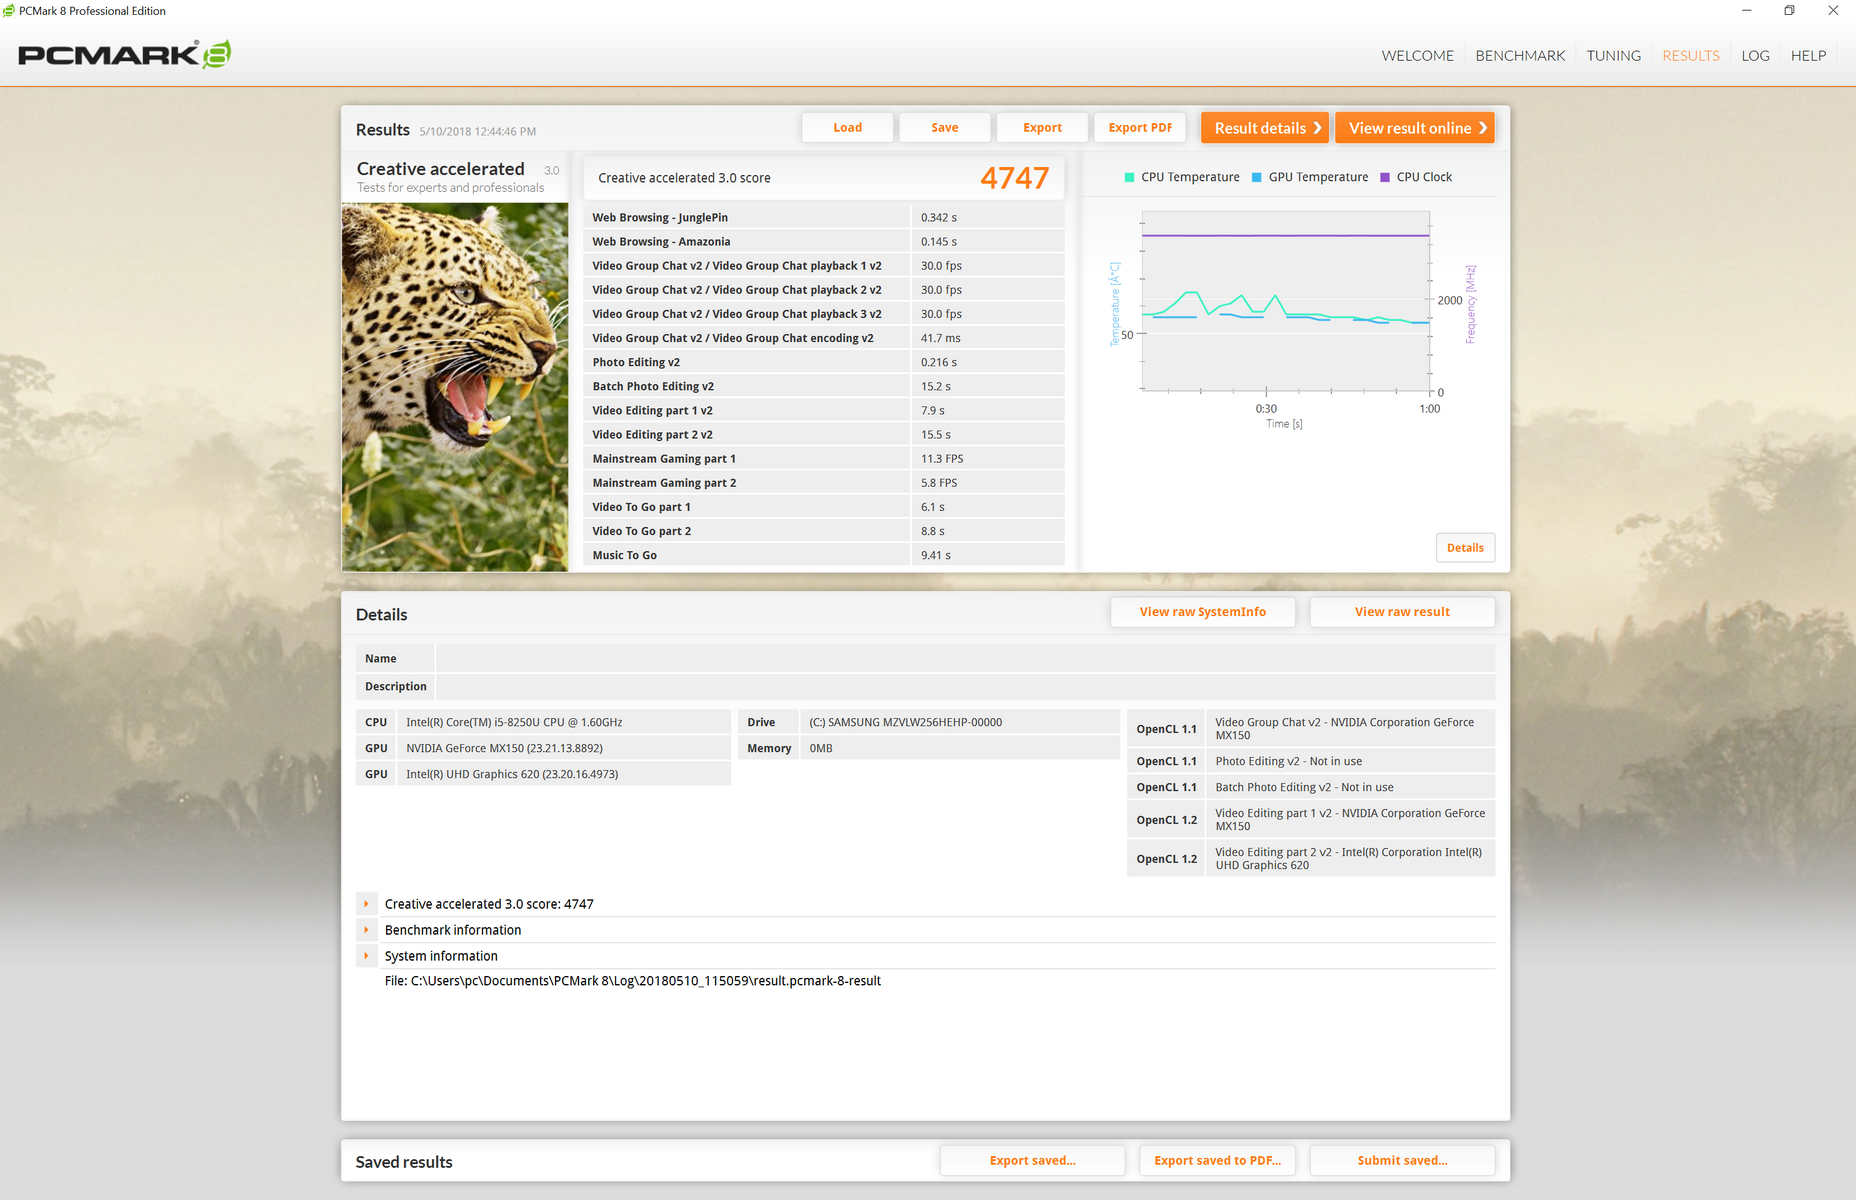
System Performance
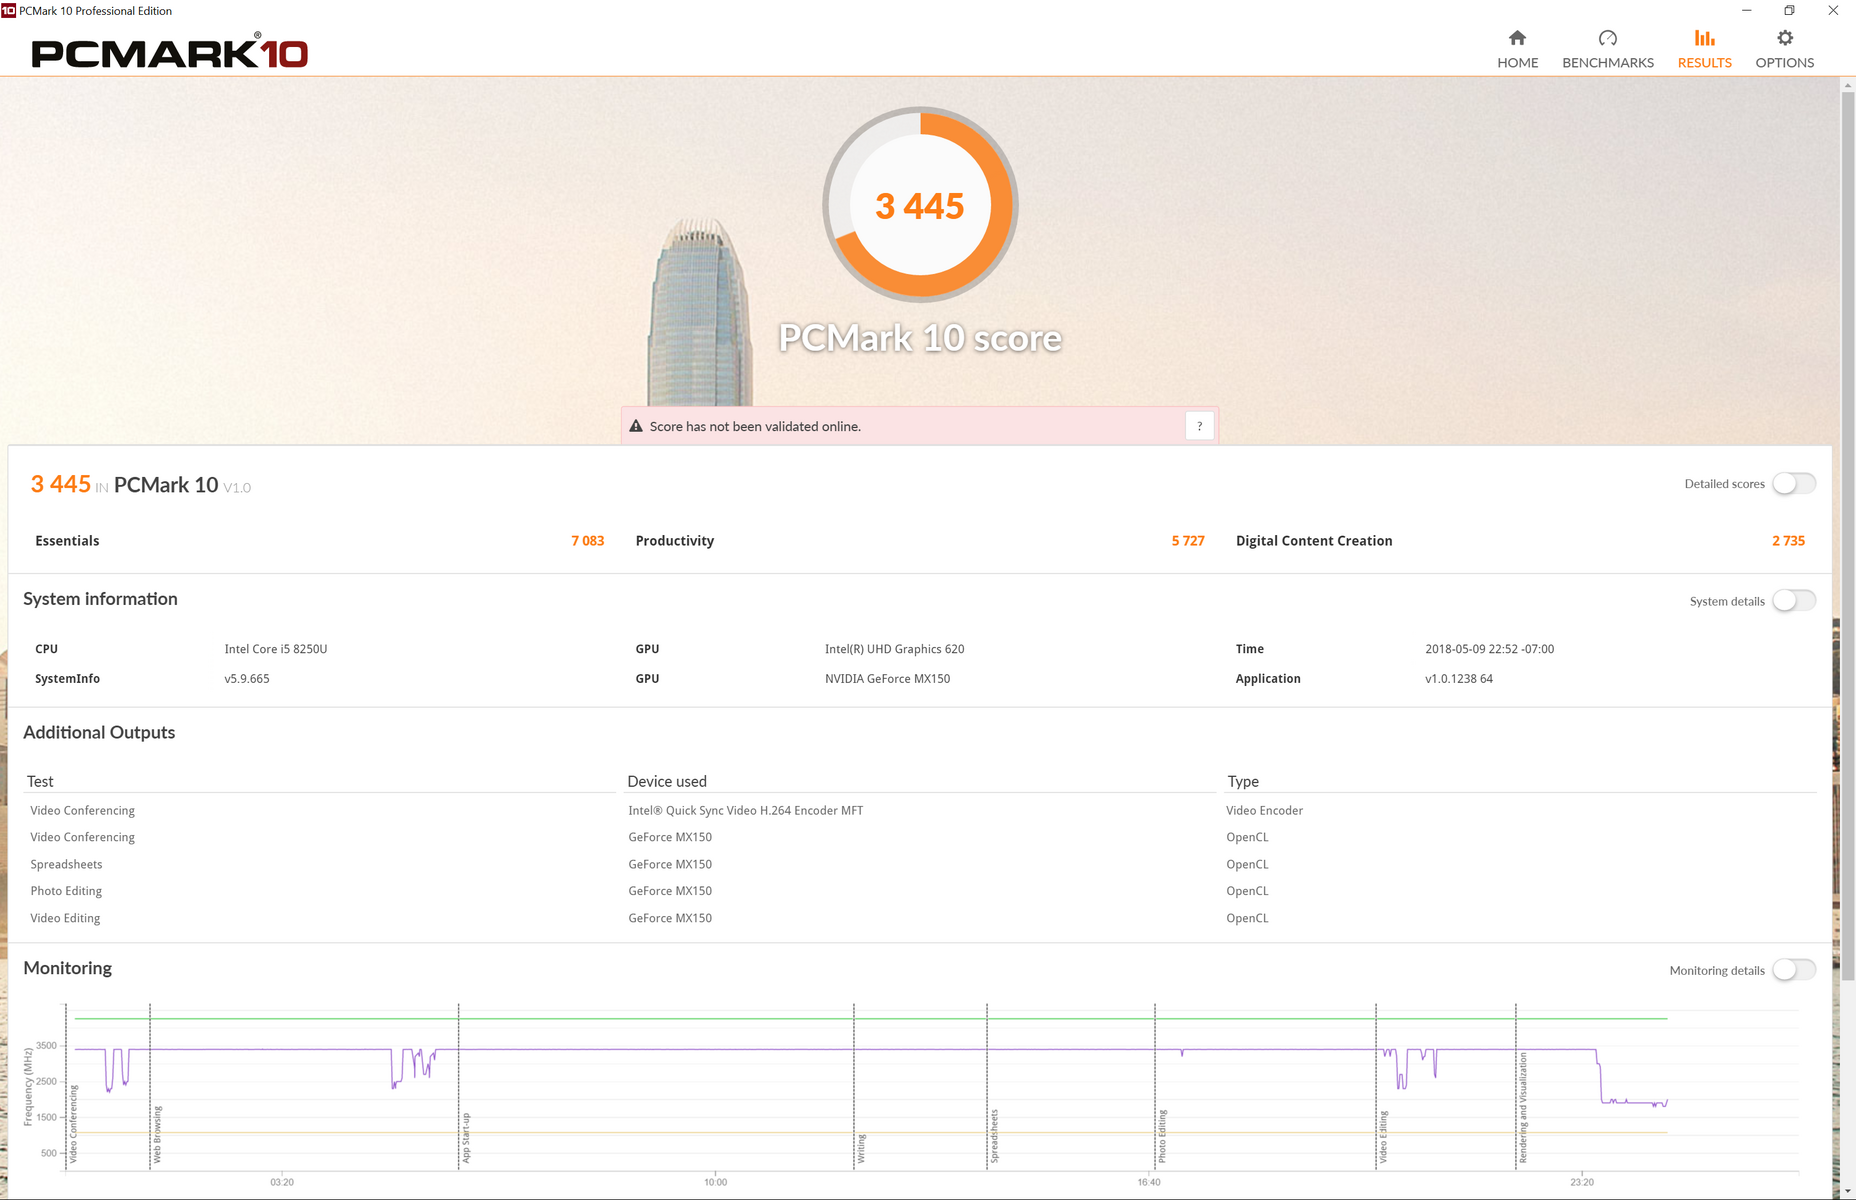
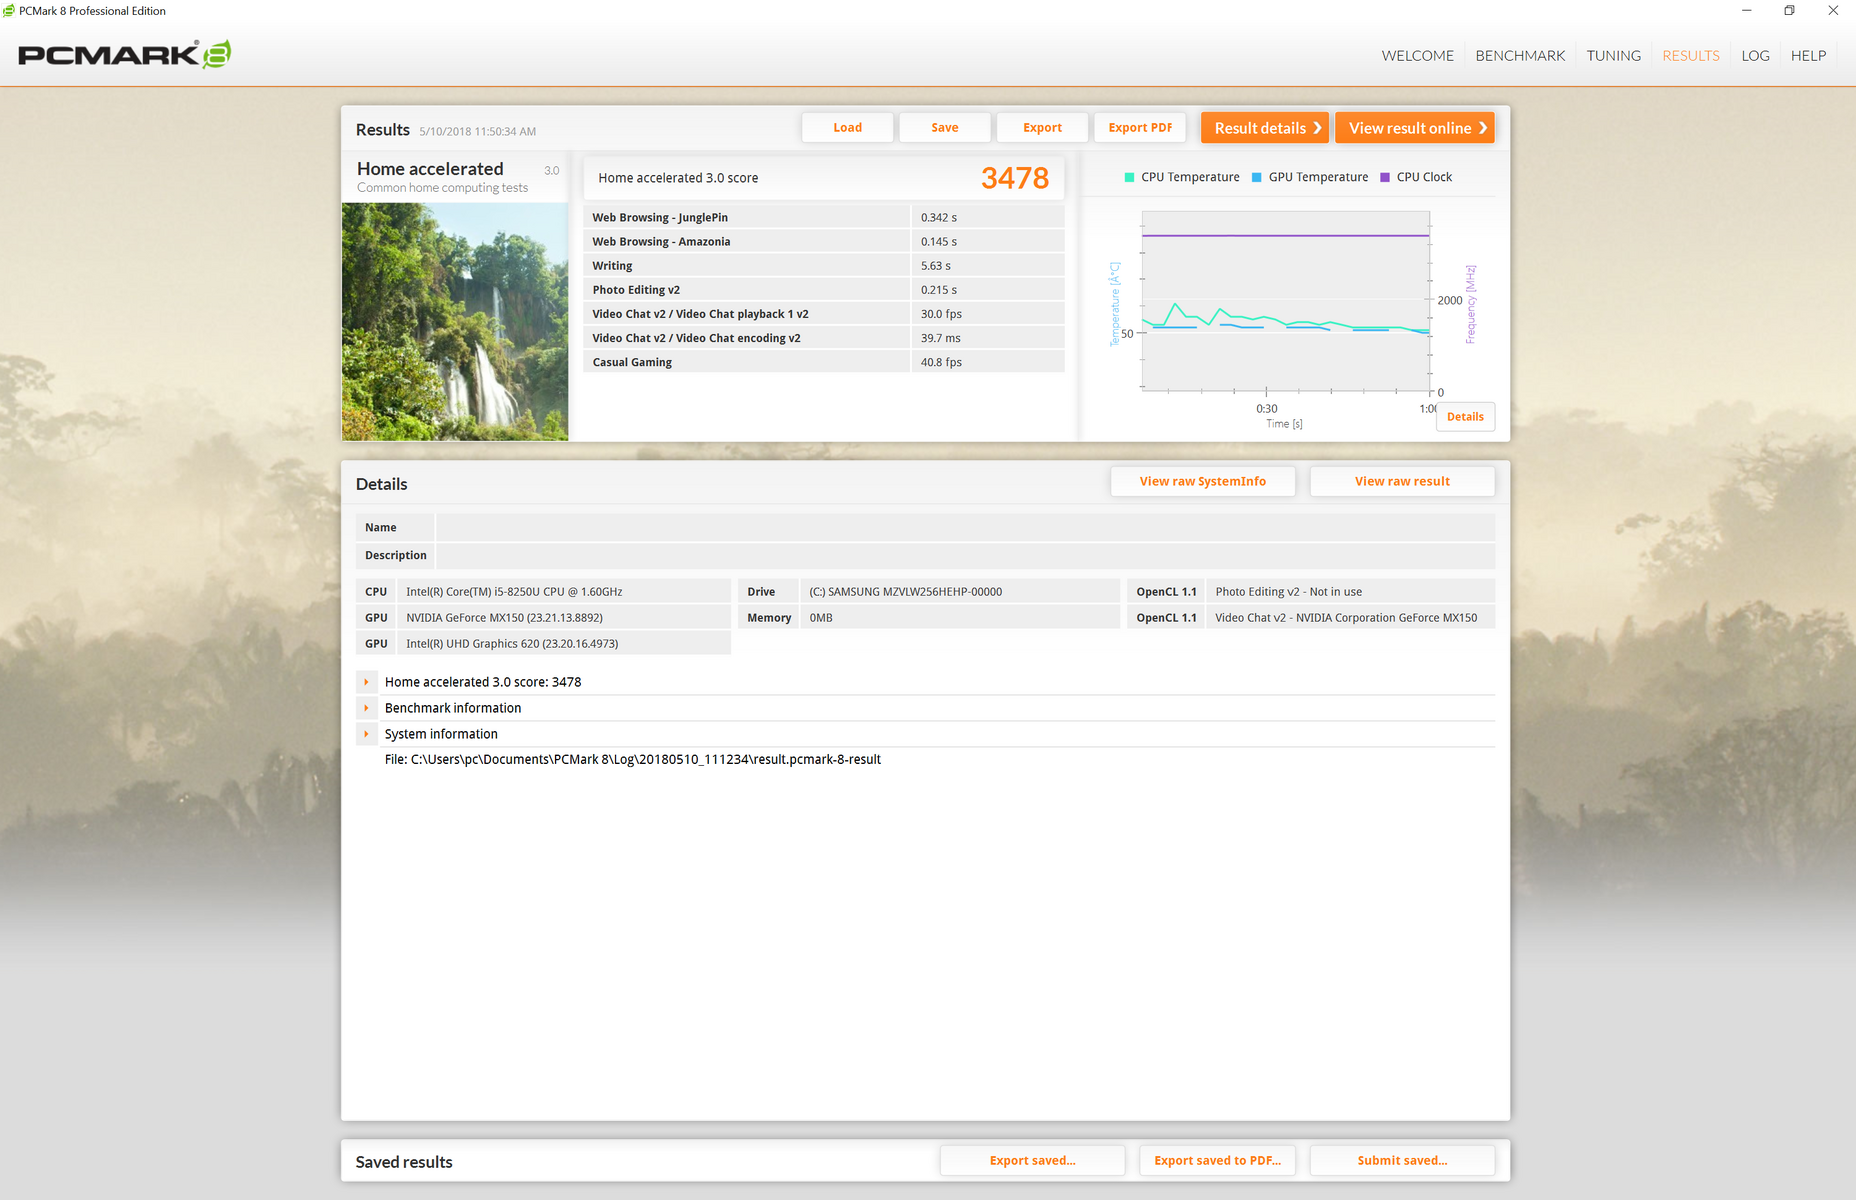
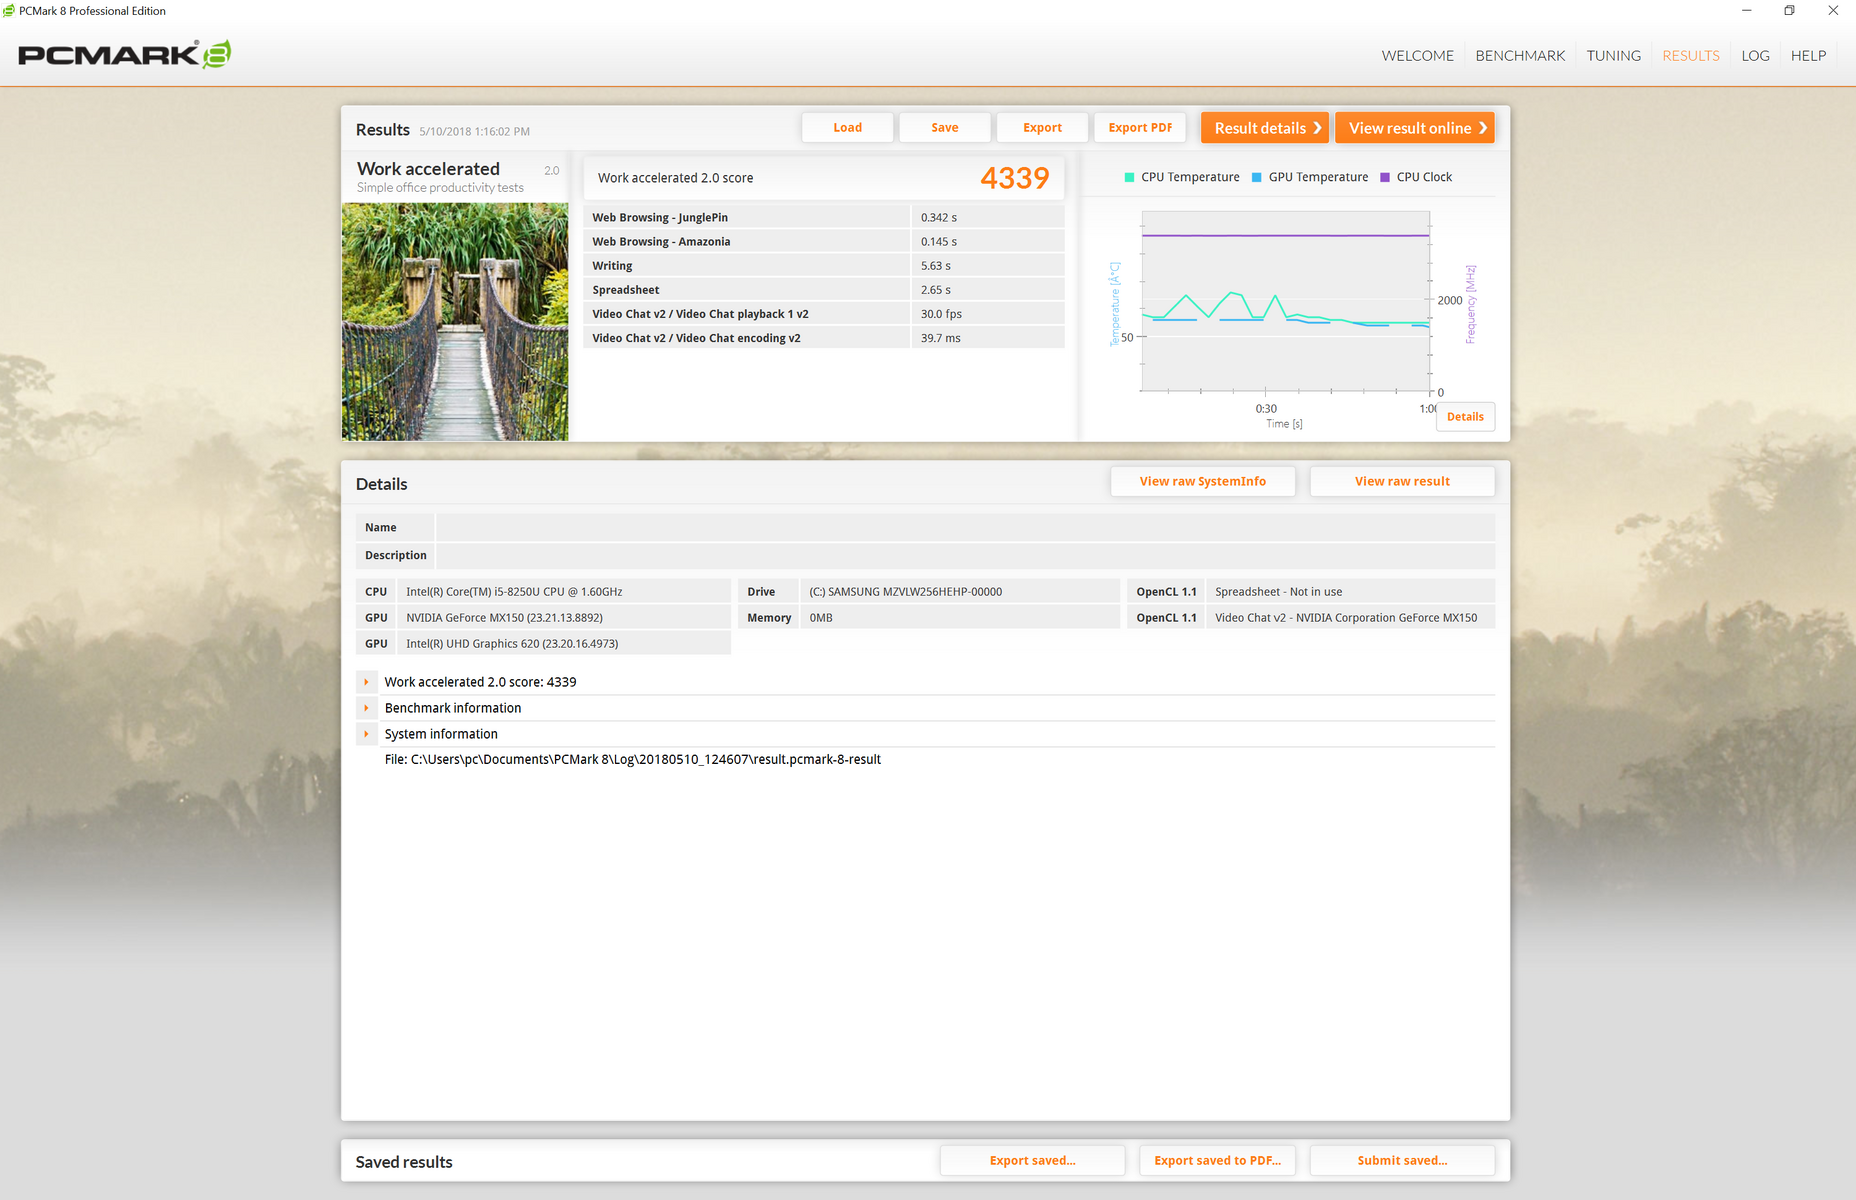
PCMark benchmarks rank the MateBook X Pro in the same ballpark as competing Ultrabooks like the XPS 13 9370 and Asus Zenbook UX3430UN. It's interesting to note that final scores are not significantly different than on last year's MateBook X despite the faster specifications of the MateBook X Pro.
We experienced no software issues during our time with the test unit.
| PCMark 10 - Score | |
| Apple MacBook Pro 13 2017 | |
| Dell XPS 13 9370 i7 UHD | |
| HP EliteBook x360 1020 G2 | |
| Asus Zenbook UX3430UN-GV174T | |
| Huawei Matebook X Pro i5 | |
| PCMark 8 Home Score Accelerated v2 | 3478 points | |
| PCMark 8 Creative Score Accelerated v2 | 4747 points | |
| PCMark 8 Work Score Accelerated v2 | 4339 points | |
| PCMark 10 Score | 3445 points | |
Help | ||
Storage Devices
Internal storage is limited to a single M.2 2280 slot compatible with NVMe SSDs. The system utilizes a Samsung PM961 256 GB SSD with faster transfer rates than the Lite-On SSD on the MateBook X. Performance is comparable to the 256 GB Toshiba XG5 found on the XPS 13 9370. Our data is only representative of the 256 GB SKU as we do not know who Huawei is sourcing for its 512 GB configuration.
See our table of HDDs and SSDs for more benchmark comparisons.
| Huawei Matebook X Pro i5 Samsung PM961 MZVLW256HEHP | Huawei MateBook X LITEON CB1-SD256 | HP EliteBook x360 1020 G2 Samsung PM961 NVMe MZVLW512HMJP | Microsoft Surface Book 2 Samsung PM961 MZVLW256HEHP | Apple MacBook Pro 13 2017 Apple SSD AP0128 | Dell XPS 13 9370 i5 UHD Toshiba XG5 KXG50ZNV256G | |
|---|---|---|---|---|---|---|
| CrystalDiskMark 5.2 / 6 | -22% | 32% | 2% | 3% | 8% | |
| Write 4K (MB/s) | 116.5 | 68.1 -42% | 142.4 22% | 140.6 21% | 16.02 -86% | 121.4 4% |
| Read 4K (MB/s) | 42.18 | 28.95 -31% | 44.08 5% | 43.62 3% | 22.9 -46% | 33.42 -21% |
| Write Seq (MB/s) | 1079 | 529 -51% | 1520 41% | 343.3 -68% | 722 -33% | 385.3 -64% |
| Read Seq (MB/s) | 1030 | 711 -31% | 1351 31% | 1452 41% | 1807 75% | 1958 90% |
| Write 4K Q32T1 (MB/s) | 225.7 | 306.4 36% | 436.6 93% | 344.4 53% | 416.5 85% | 375.7 66% |
| Read 4K Q32T1 (MB/s) | 302.9 | 501 65% | 426.6 41% | 457.2 51% | 538 78% | 364.1 20% |
| Write Seq Q32T1 (MB/s) | 1174 | 496.9 -58% | 1572 34% | 344.3 -71% | 733 -38% | 1069 -9% |
| Read Seq Q32T1 (MB/s) | 3394 | 1297 -62% | 3112 -8% | 2885 -15% | 3121 -8% | 2564 -24% |

GPU Performance
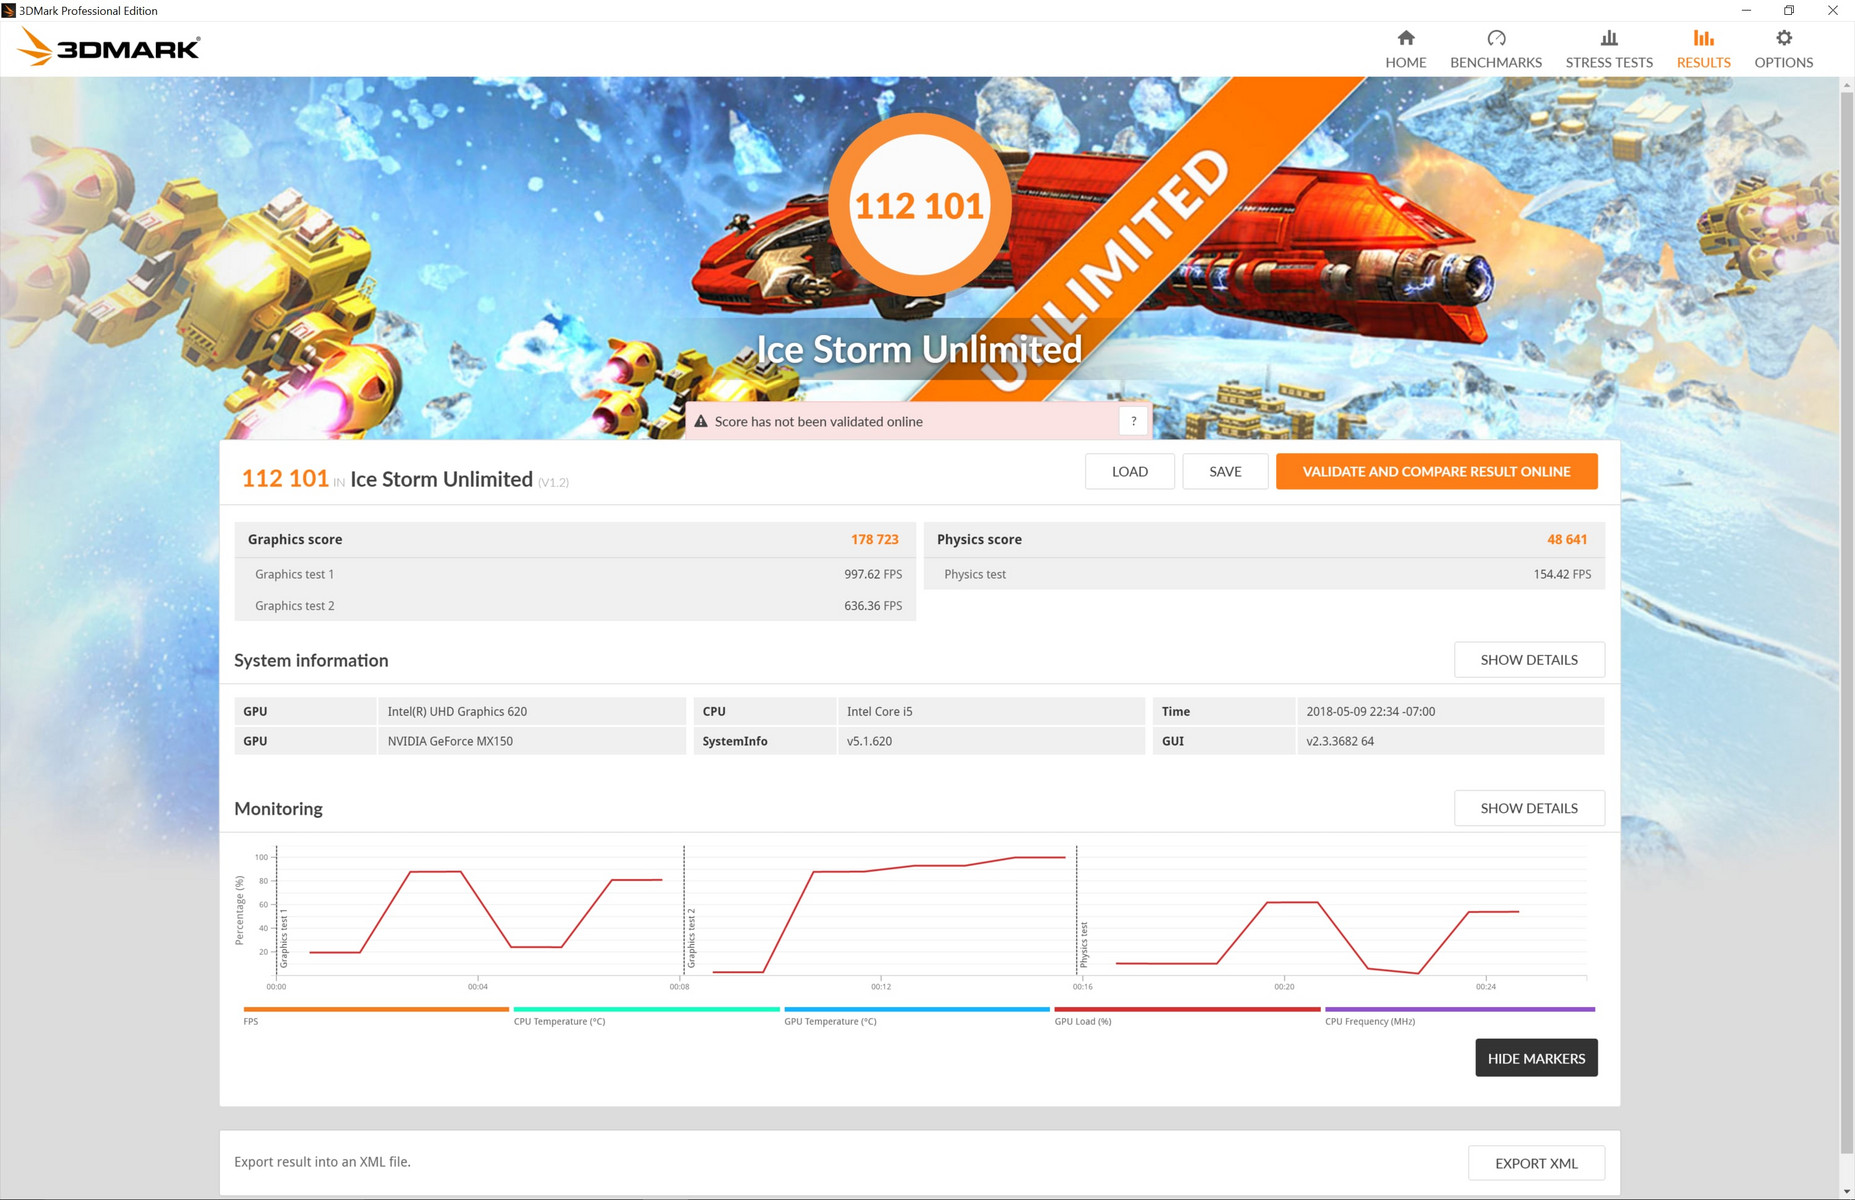
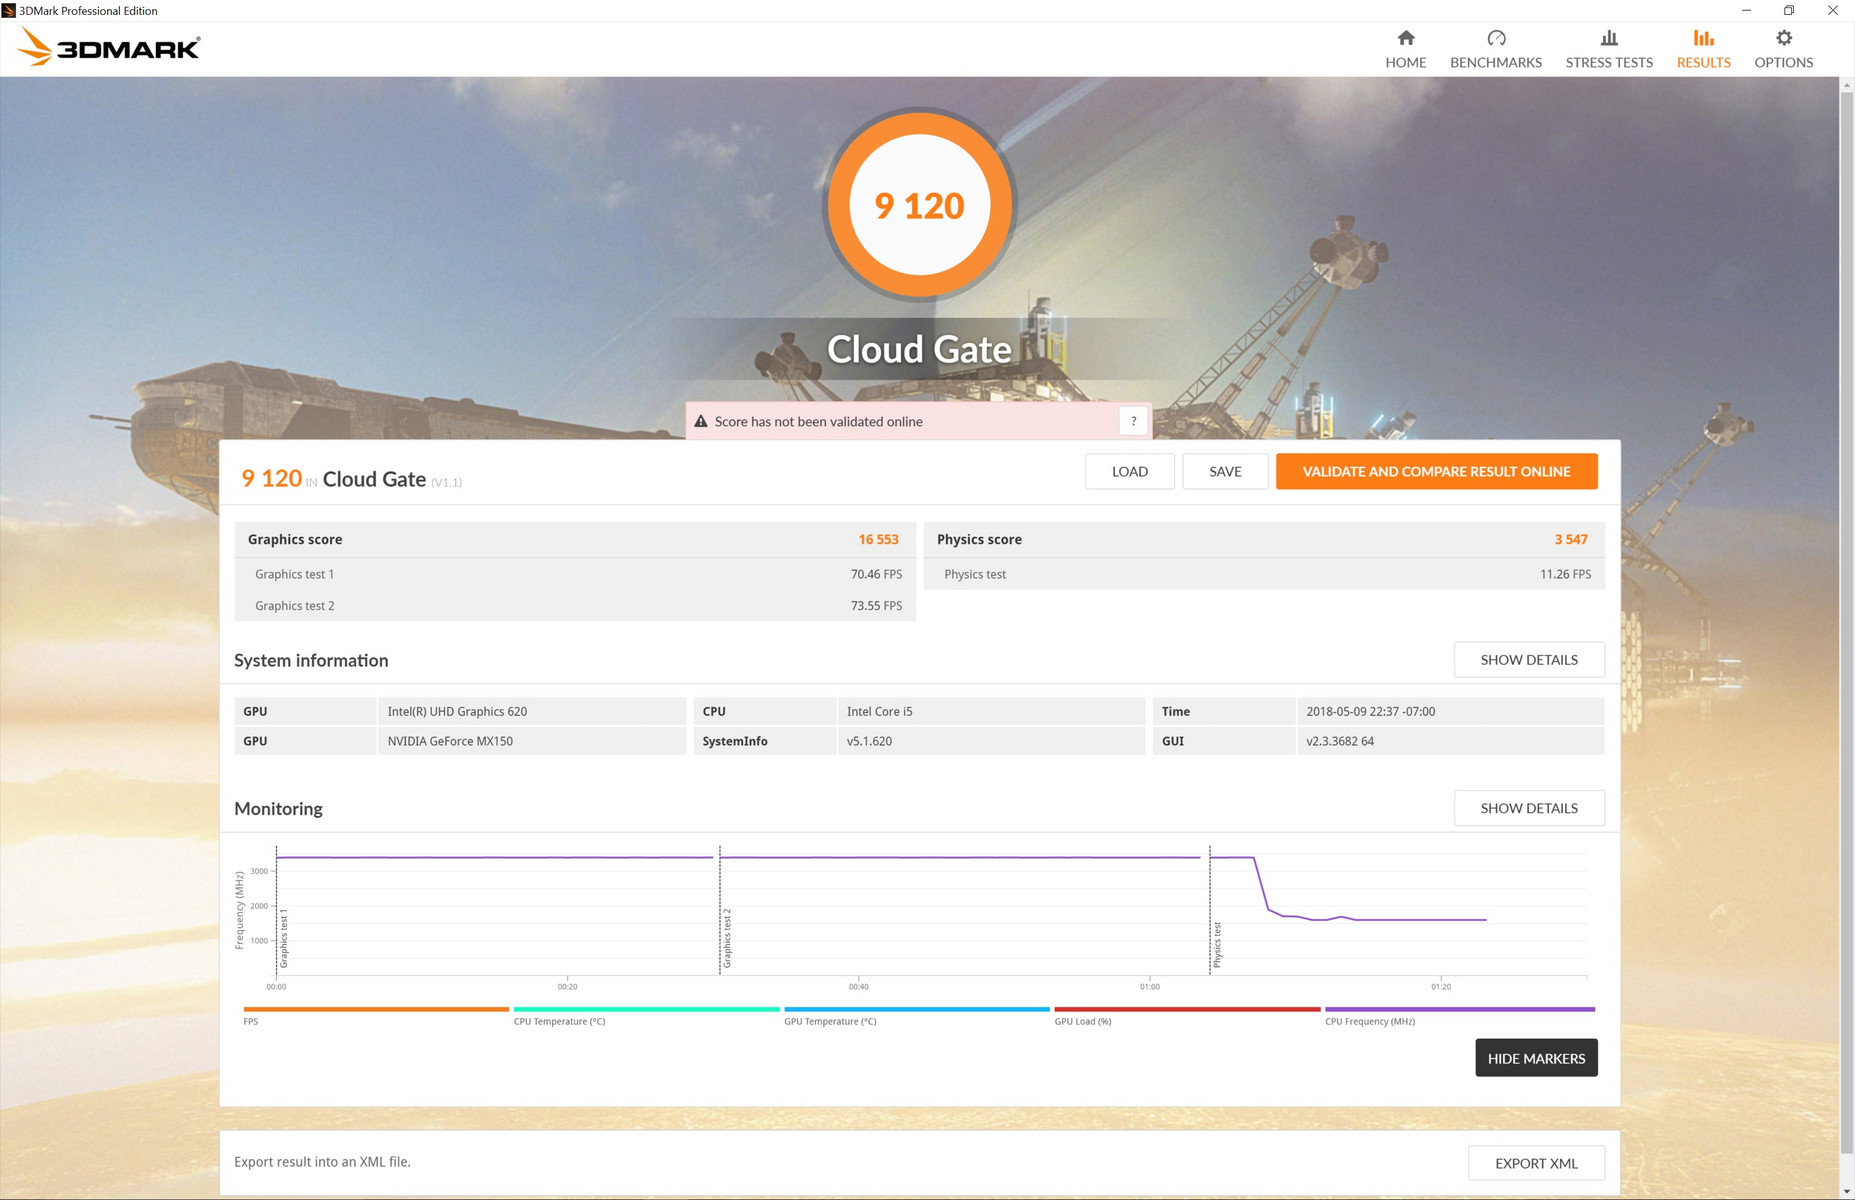
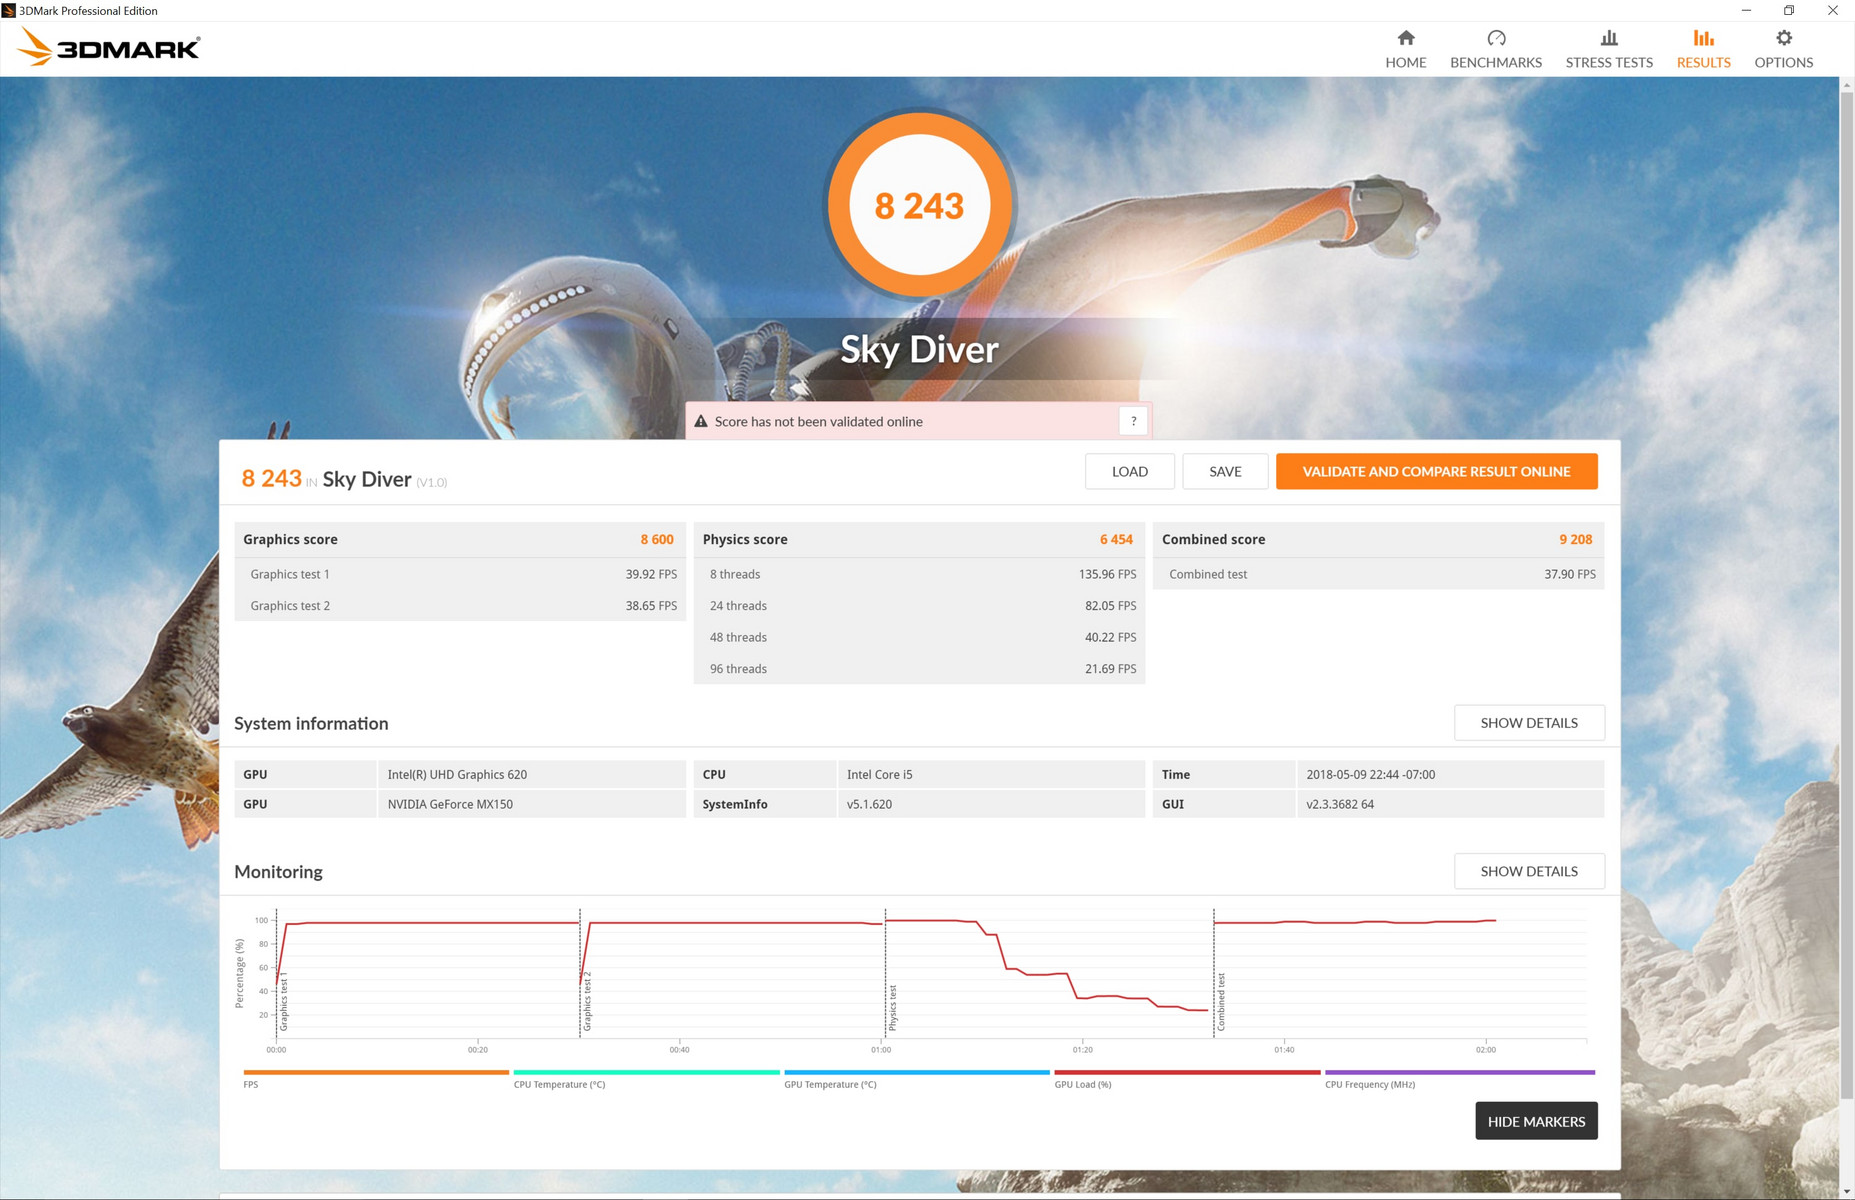
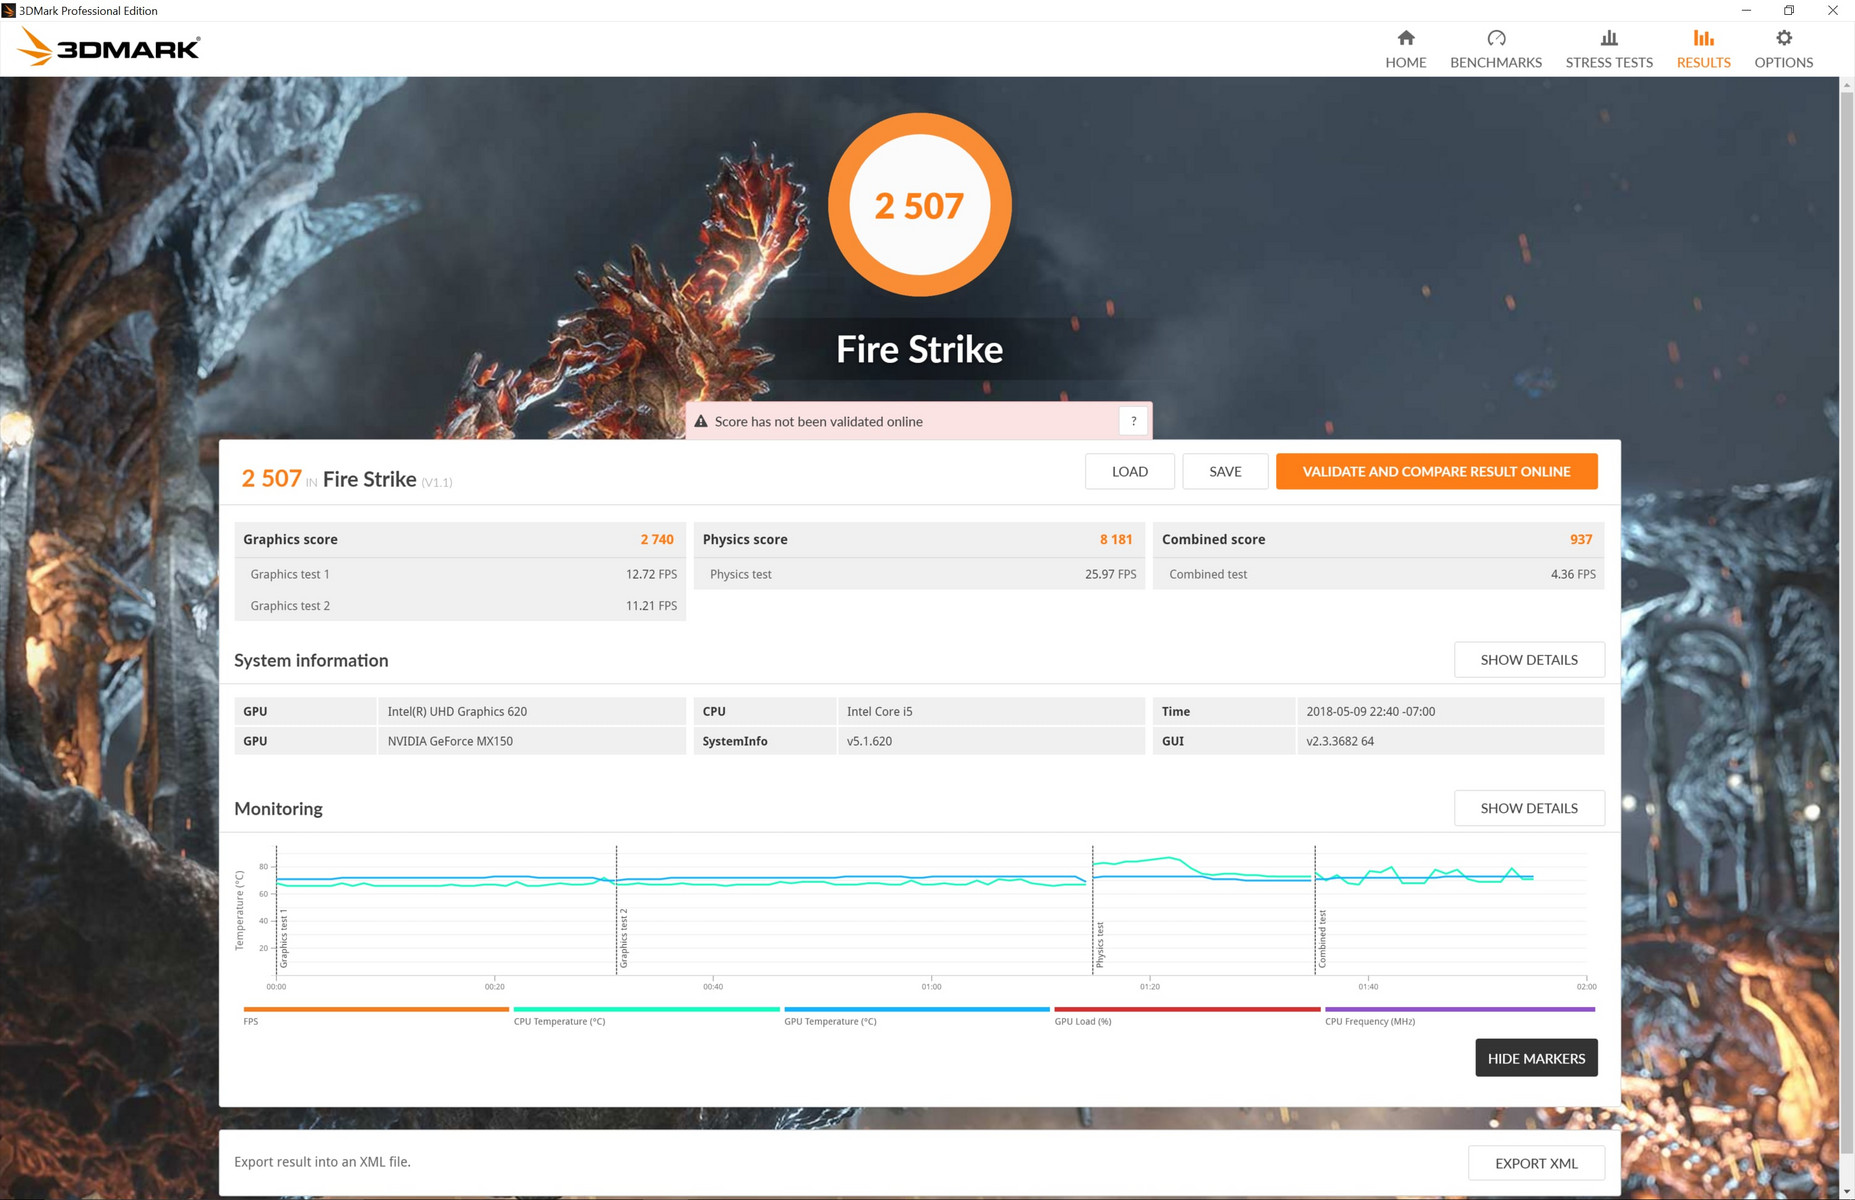
Graphics performance is unquestionably faster than the HD Graphics solution found on most Ultrabooks. The HD graphics 620 in the MateBook X, for example, can be 60 to 70 percent slower than the GeForce MX150 in our newer model depending on the 3DMark benchmark. Raw performance is about 30 percent faster than the older GeForce 940MX while being comparable to the newer Vega 8 and Vega 10 iGPUs found on the latest mobile Ryzen APUs.
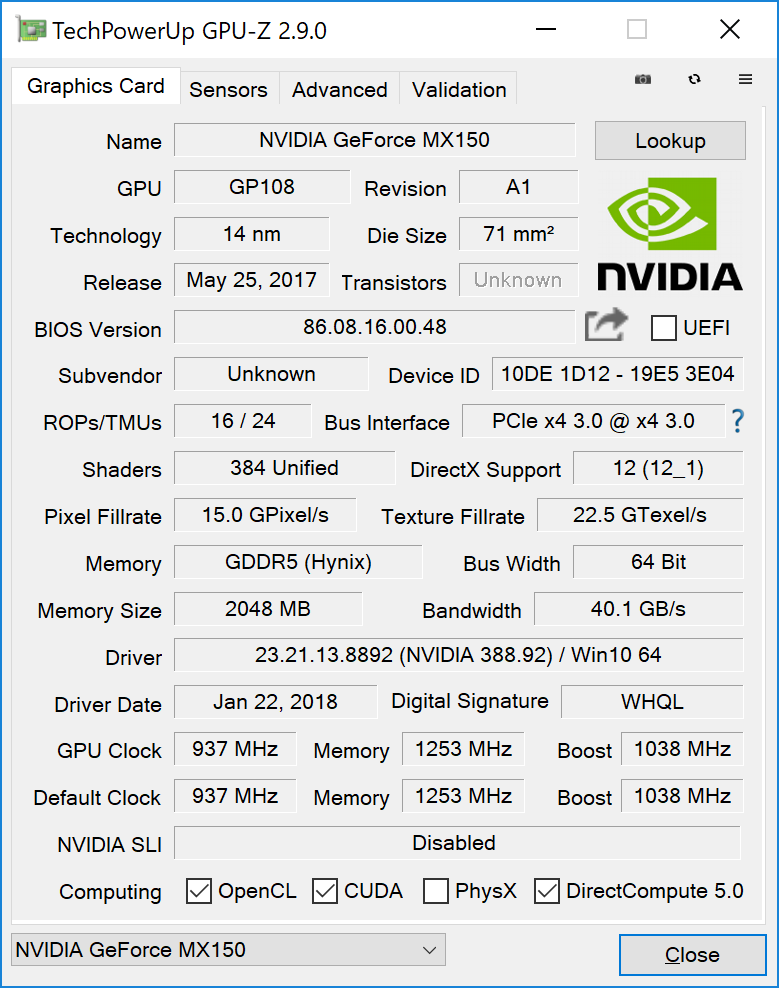
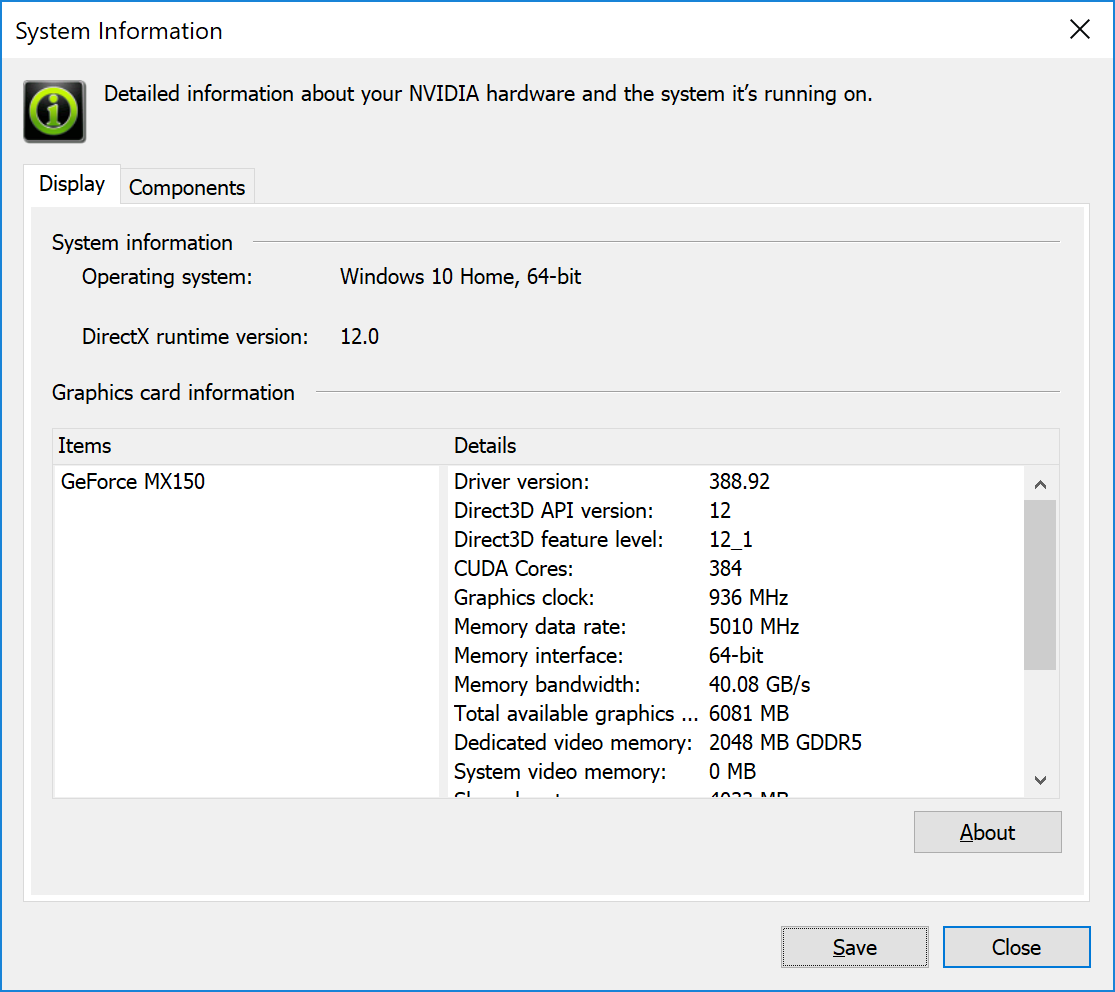
It's important to note, however, that the MateBook X Pro is utilizing the slower '1D12' variant of the GeForce MX150 instead of the faster '1D10' variant. Thus, its GPU is about 20 percent slower than the average GeForce MX150 in our database. While home and light office users are unlikely to notice the slower GPU, casual gamers and video editors will be most affected as these types of users benefit from every ounce of GPU power available.
See our dedicated page on the GeForce MX150 for more technical information on the series and our list of notebooks equipped with the MX150.
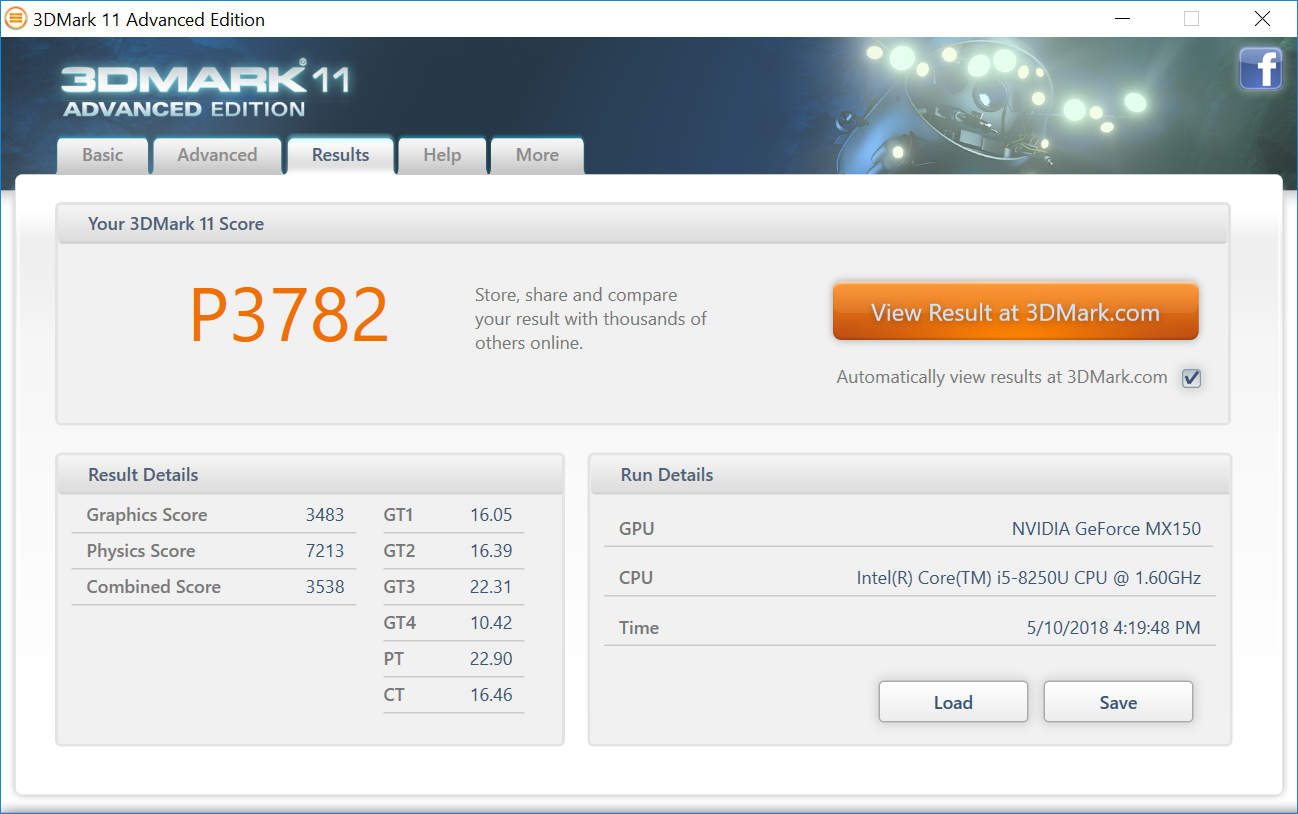
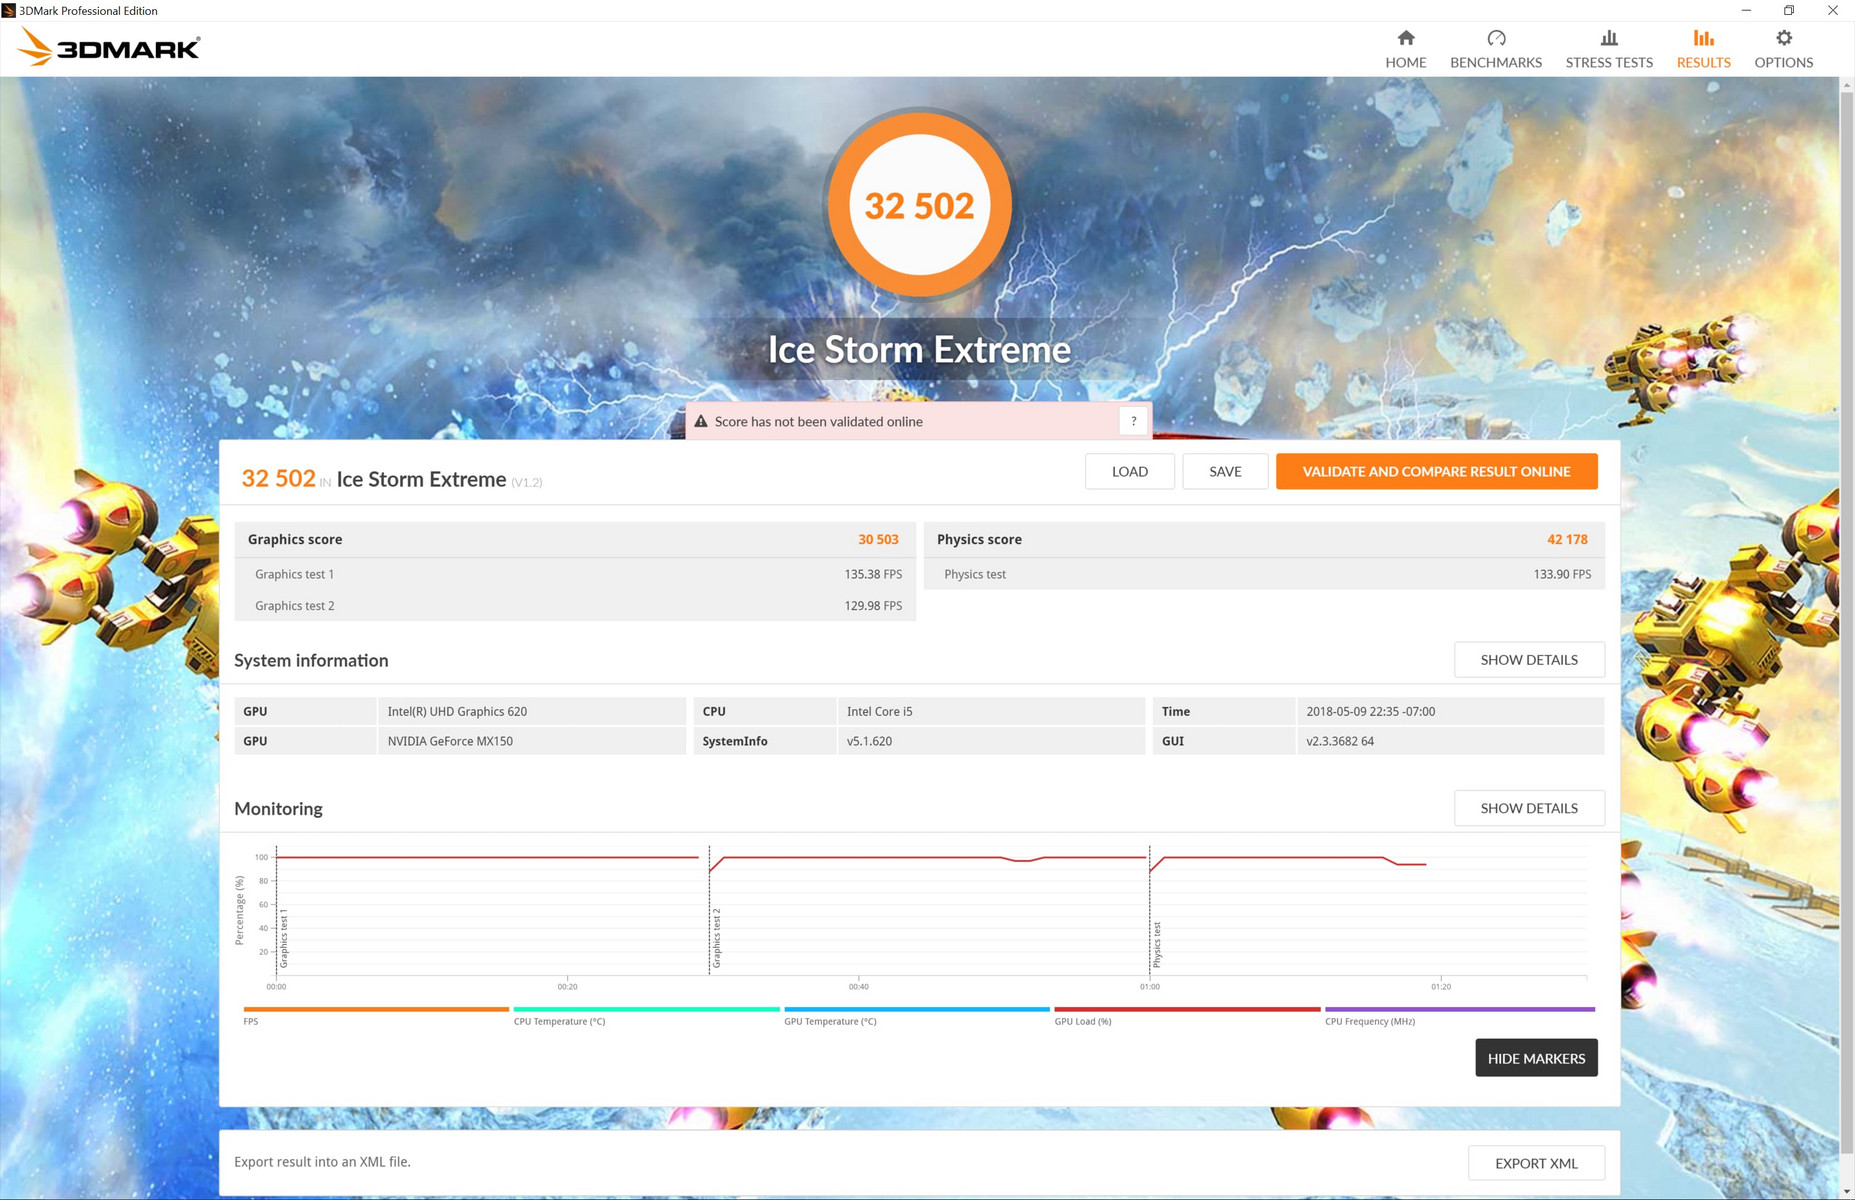
| 3DMark 11 Performance | 3782 points | |
| 3DMark Ice Storm Standard Score | 33063 points | |
| 3DMark Cloud Gate Standard Score | 9120 points | |
| 3DMark Fire Strike Score | 2507 points | |
Help | ||
| low | med. | high | ultra | |
|---|---|---|---|---|
| BioShock Infinite (2013) | 162 | 86.2 | 74.2 | 27.9 |
| The Witcher 3 (2015) | 18 | |||
| Batman: Arkham Knight (2015) | 43 | 38 | 20 | 17 |
| Overwatch (2016) | 95.2 | 43 | 25.1 |
Stress Test
We stress the notebook to identify for any throttling or stability issues. When subjected to Prime95 to stress the CPU, the processor can be observed running at 2.9 to 3.0 GHz for the first few seconds before hitting 74 C and stabilizing at 1.9 GHz to keep core temperatures in check. Thus, the system is unable to sustain high Turbo Boost clock rates for very long. Nonetheless, 1.9 GHz is 300 MHz faster than the base clock rate of the i5-8250U and so at least some Turbo Boost is preserved. Running both Prime95 and FurMark simultaneously can cause core temperatures to reach as high as 80 C. Impressively, however, the CPU will not dip below its base 1.6 GHz clock rate which is uncommon for an Ultrabook.
Witcher 3 stress is more representative of real-world gaming loads. The CPU and GPU can be observed running steadily at 3.0 GHz and 1038 MHz, respectively, with core temperatures in the mid 70 C range each. Performance degrades slightly over time.
Running on battery power will not throttle CPU or GPU performance. A 3DMark 11 run on batteries returns physics and graphics scores of 7471 and 3481 points, respectively, compared to 7213 and 3483 points when on mains.
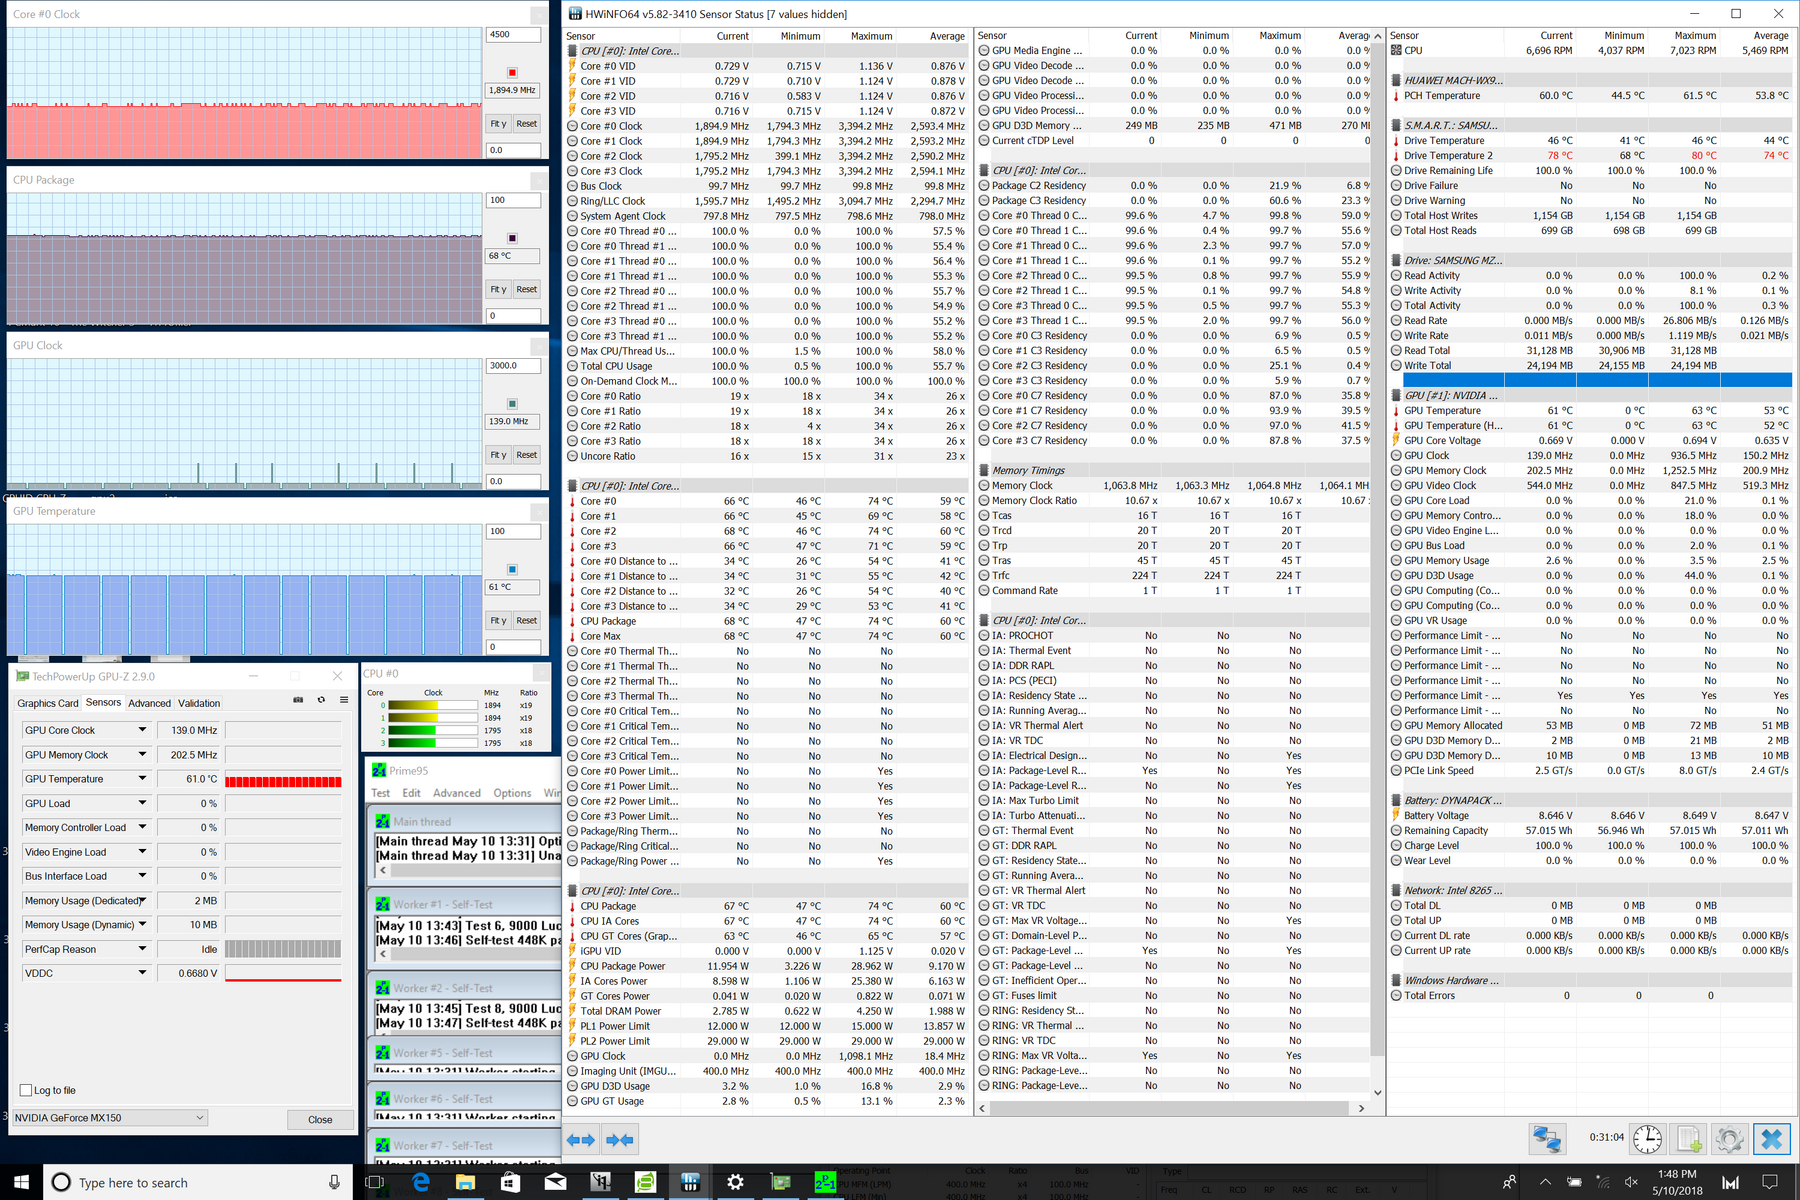
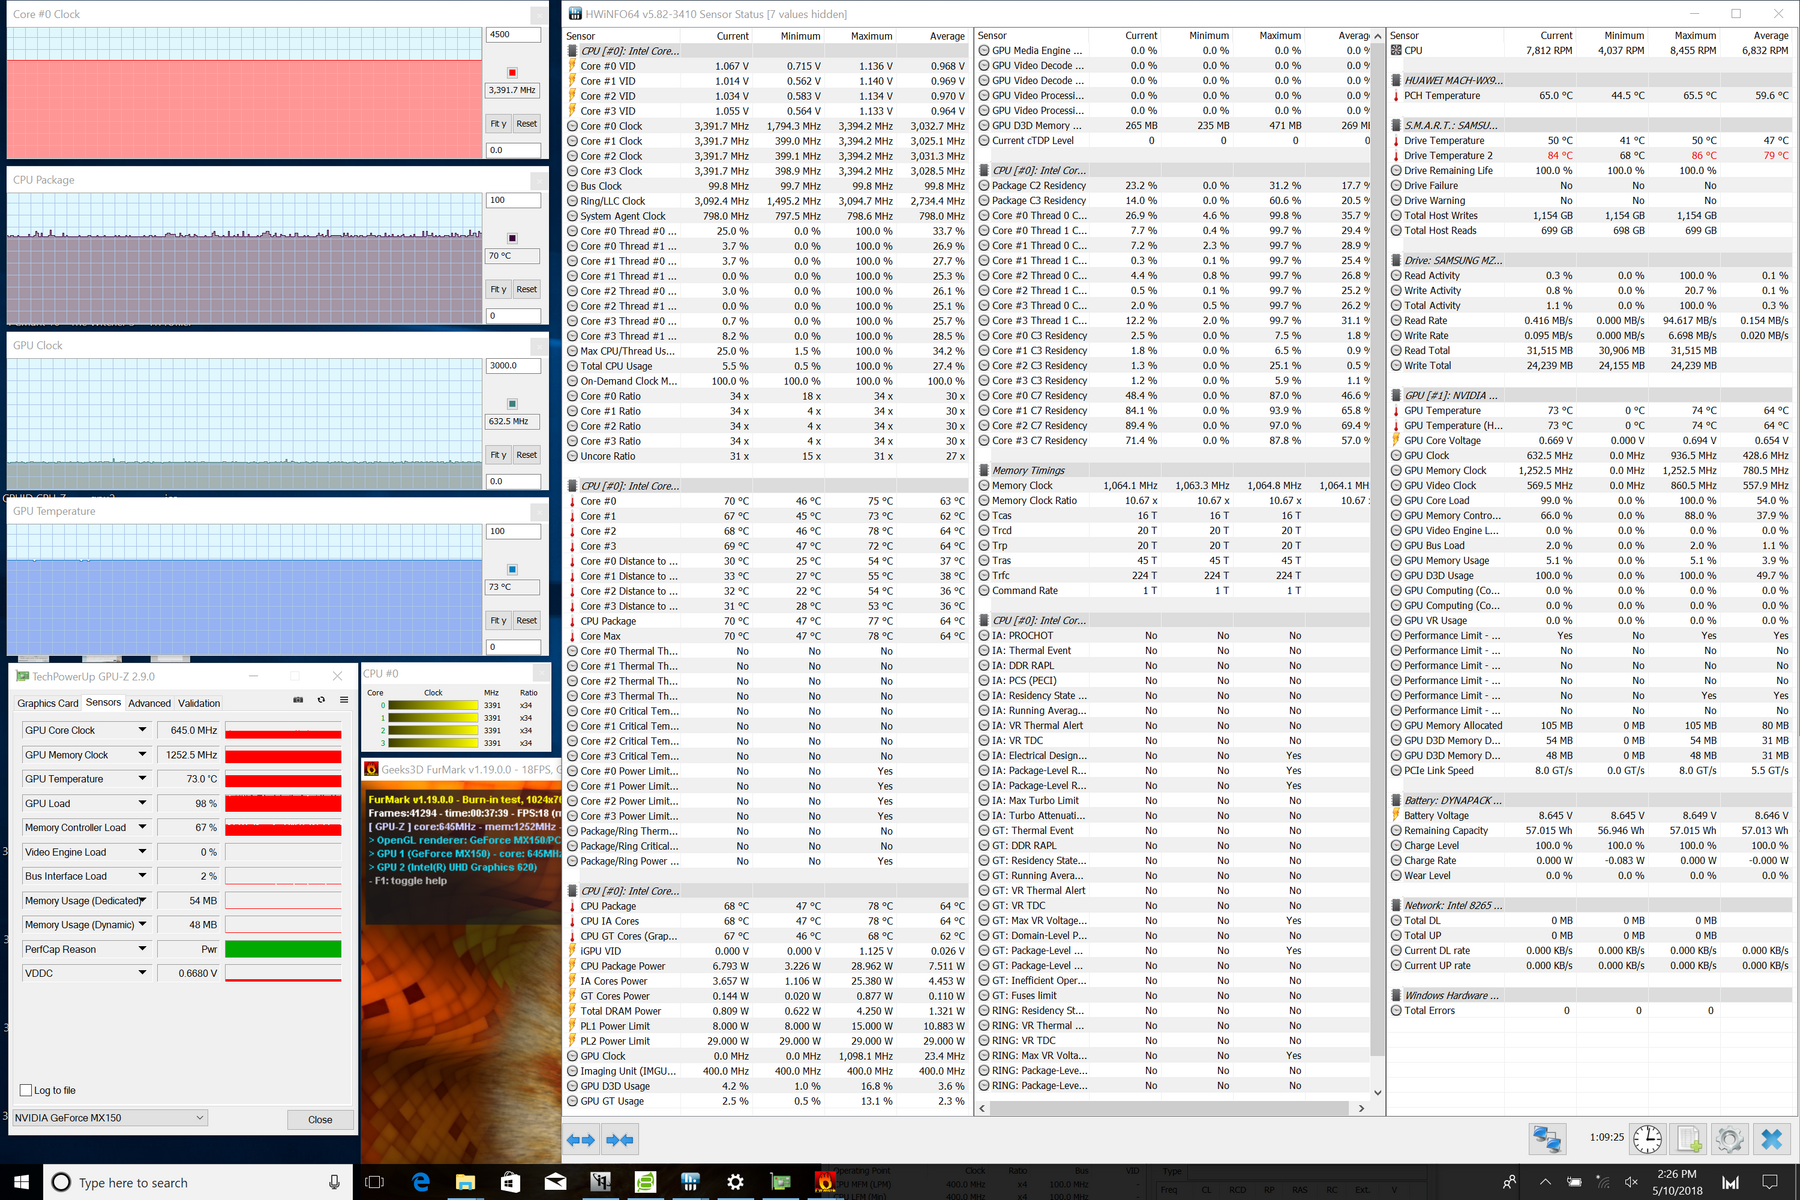
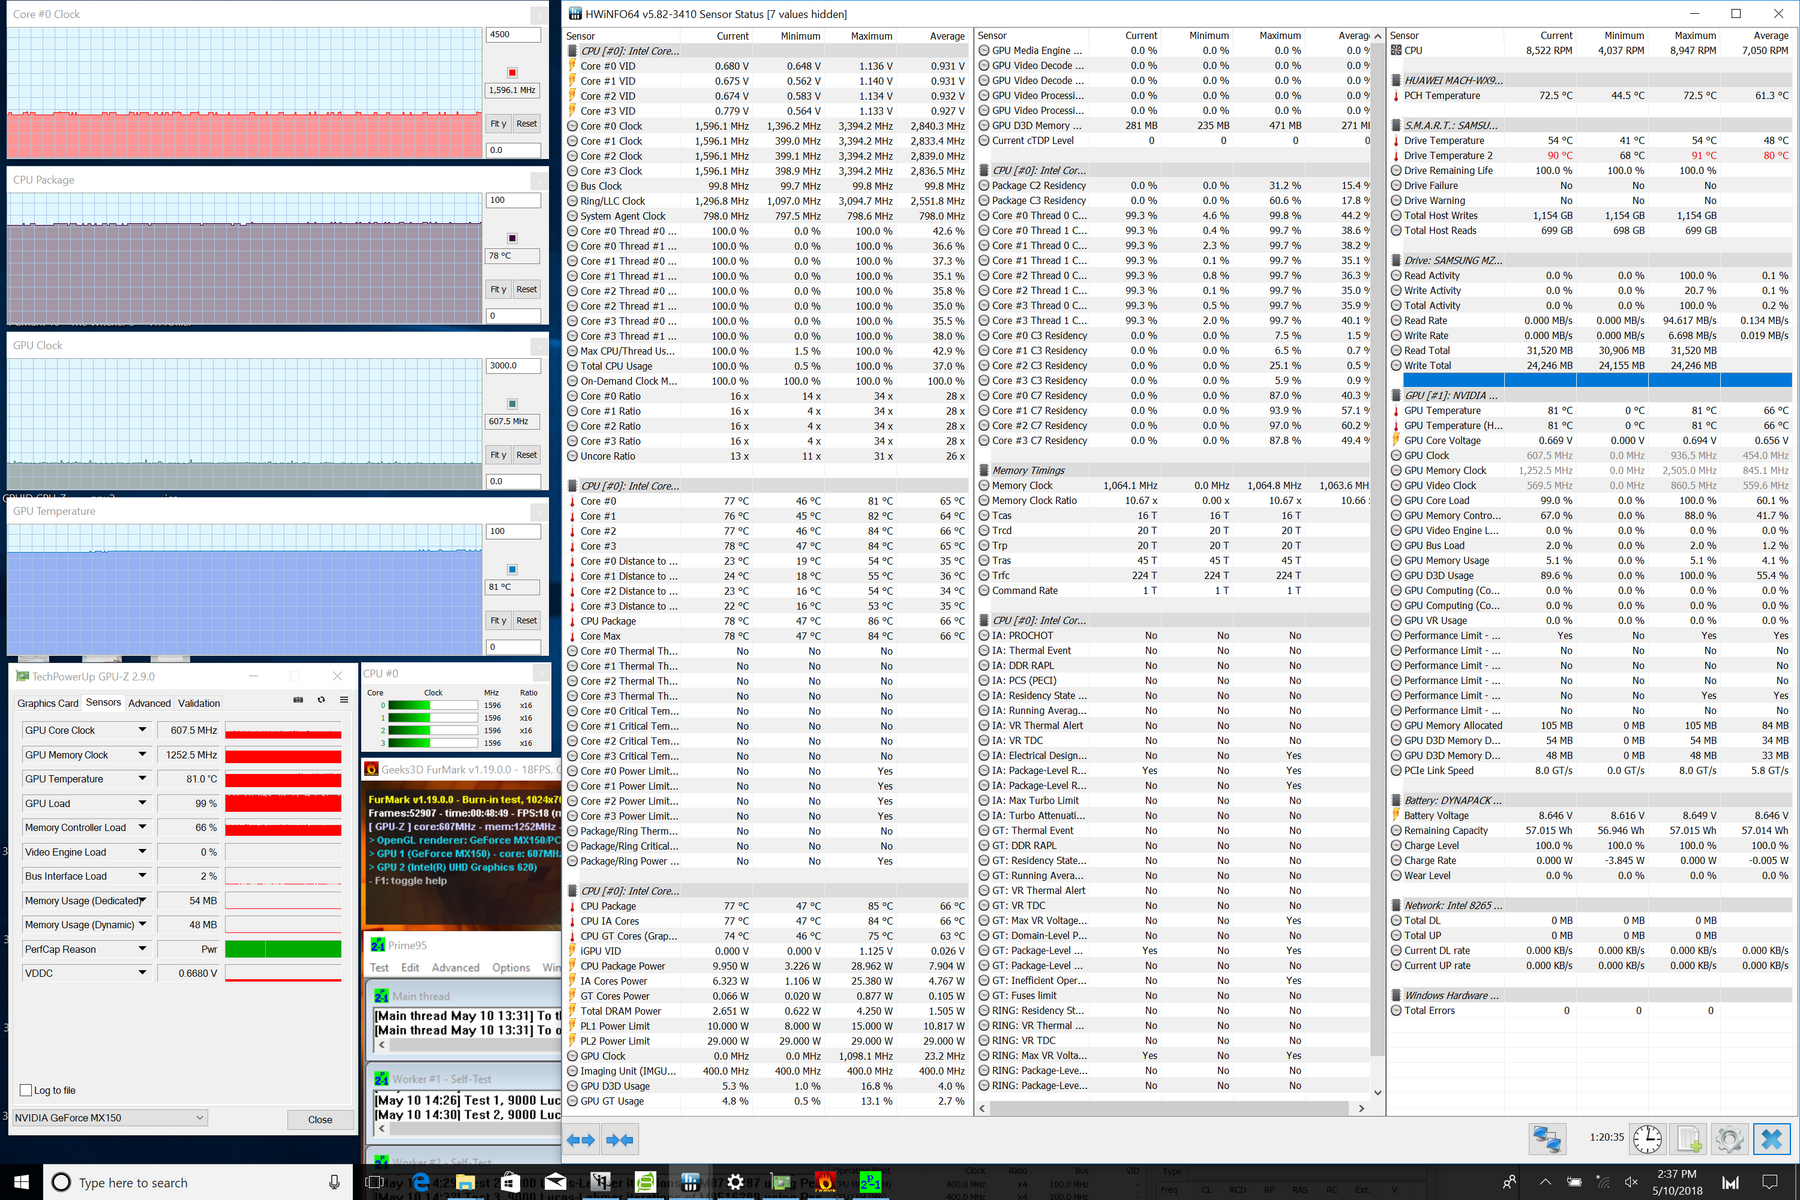
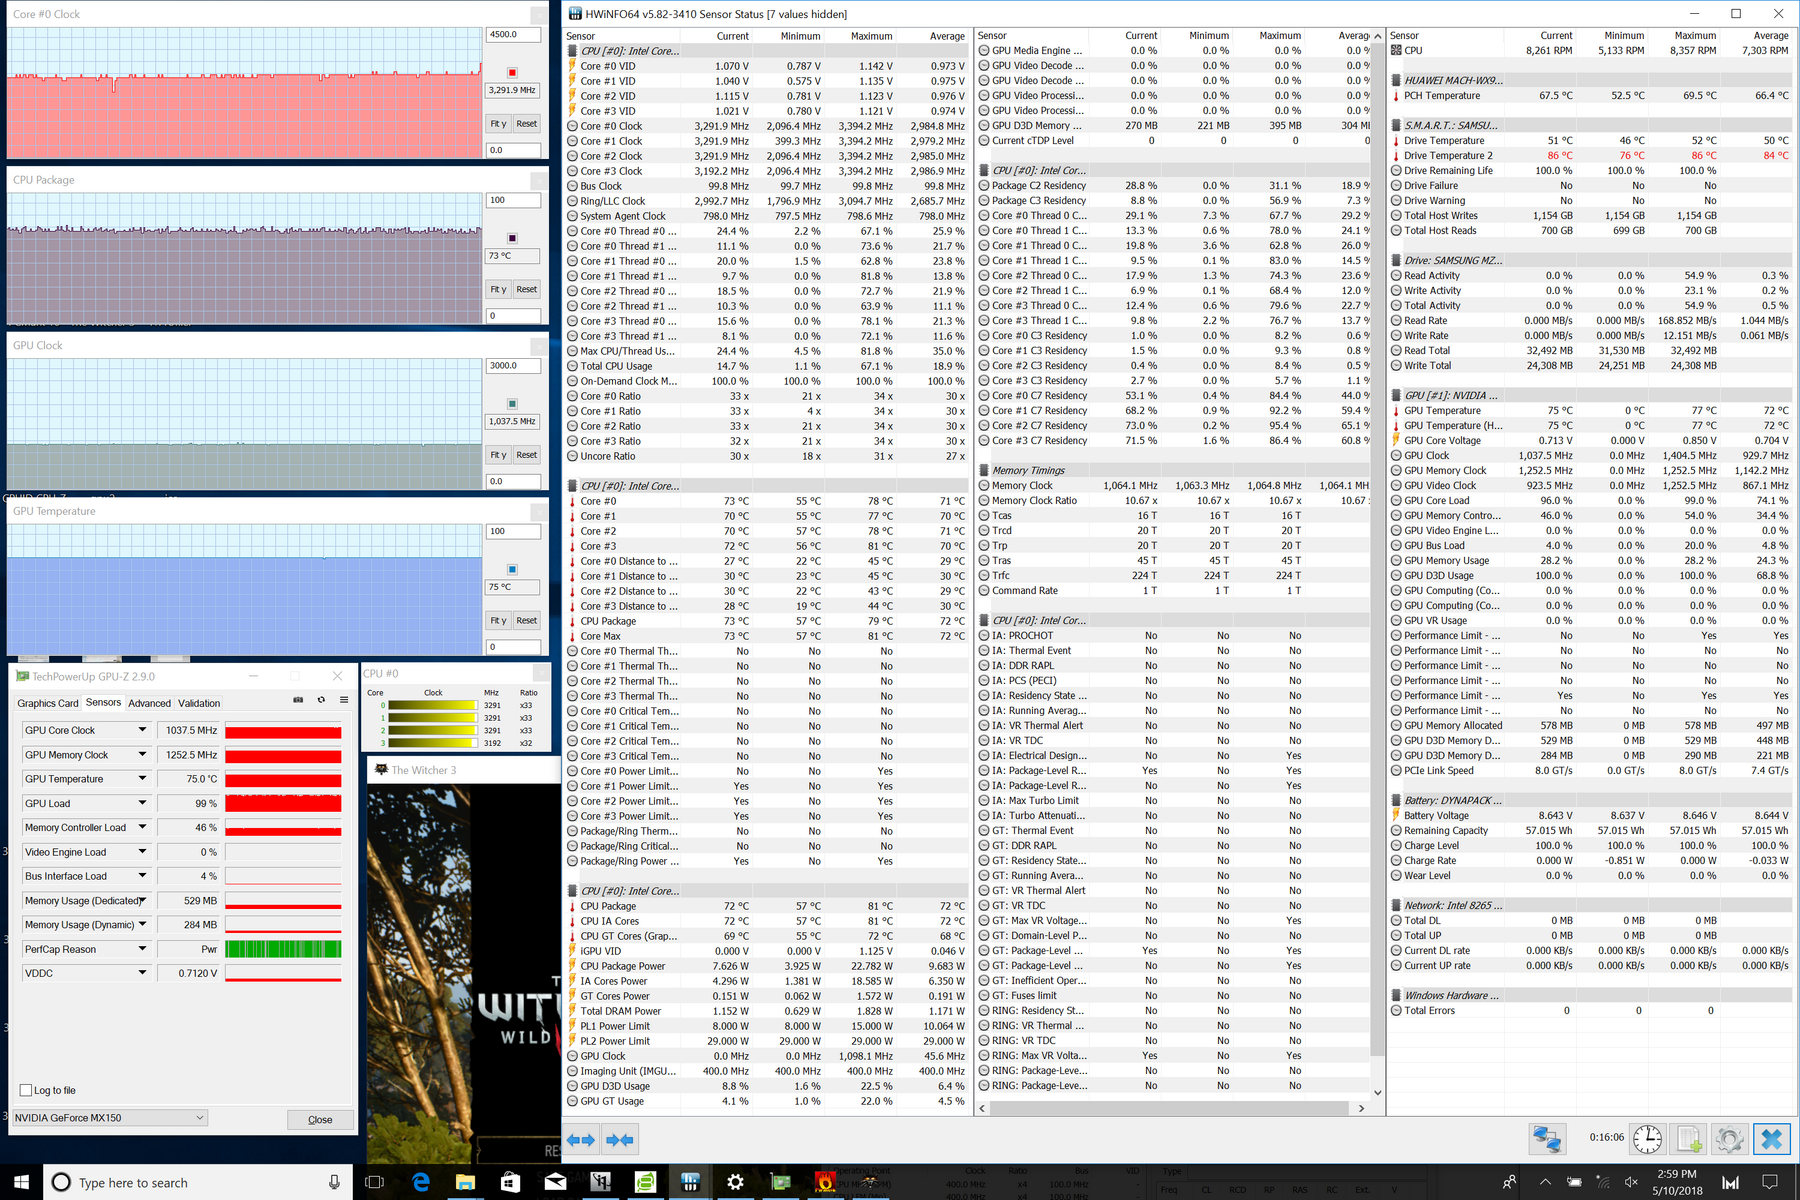
| CPU Clock (GHz) | GPU Clock (MHz) | Average CPU Temperature (°C) | Average GPU Temperature (°C) | |
| Prime95 Stress | 1.9 | -- | 68 | 61 |
| FurMark Stress | -- | 633 | 70 | 73 |
| Prime95 + FurMark Stress | 1.6 | 608 | 78 | 81 |
| Witcher 3 Stress | 3.0 | 1038 | 73 | 75 |
Emissions
System Noise
In order to get the performance desired from a thin design, Huawei had to incorporate a fan this time with longer and more heat pipes than on most Ultrabooks. Fan noise and pulsing are fortunately kept to a minimum and users can expect the same silent experience during low processing loads. Gaming can induce a fan noise of 45 dB(A) to be comparable to many gaming laptops.
Our test unit exhibits no electronic noise or coil whine. Dell can certainly learn a thing or two from this latest MateBook.
Noise level
| Idle |
| 27.9 / 27.9 / 27.9 dB(A) |
| Load |
| 36.2 / 45.2 dB(A) |
 | ||
30 dB silent 40 dB(A) audible 50 dB(A) loud |
||
min: | ||
| Huawei Matebook X Pro i5 GeForce MX150, i5-8250U, Samsung PM961 MZVLW256HEHP | Asus Zenbook UX3430UN-GV174T GeForce MX150, i5-8250U, SK Hynix HFS256G39TND-N210A | Dell XPS 13 9370 FHD i5 UHD Graphics 620, i5-8250U, Toshiba XG5 KXG50ZNV256G | Apple MacBook Pro 13 2017 Iris Plus Graphics 640, i5-7360U, Apple SSD AP0128 | Microsoft Surface Laptop i5 HD Graphics 620, i5-7200U, Toshiba THNSN0128GTYA | HP EliteBook x360 1020 G2 HD Graphics 620, i7-7600U, Samsung PM961 NVMe MZVLW512HMJP | |
|---|---|---|---|---|---|---|
| Noise | -5% | 2% | -2% | 4% | 5% | |
| off / environment * (dB) | 27.9 | 30 -8% | 29.1 -4% | 30.2 -8% | 28.2 -1% | 28.3 -1% |
| Idle Minimum * (dB) | 27.9 | 30 -8% | 29.1 -4% | 30.2 -8% | 28.2 -1% | 28.3 -1% |
| Idle Average * (dB) | 27.9 | 30 -8% | 29.1 -4% | 30.2 -8% | 28.2 -1% | 28.3 -1% |
| Idle Maximum * (dB) | 27.9 | 33.1 -19% | 29.1 -4% | 30.2 -8% | 29 -4% | 29.3 -5% |
| Load Average * (dB) | 36.2 | 37.6 -4% | 32.2 11% | 32.9 9% | 30.3 16% | 32.2 11% |
| Witcher 3 ultra * (dB) | 45 | |||||
| Load Maximum * (dB) | 45.2 | 37.6 17% | 37.3 17% | 39.3 13% | 39.3 13% | 34.5 24% |
* ... smaller is better
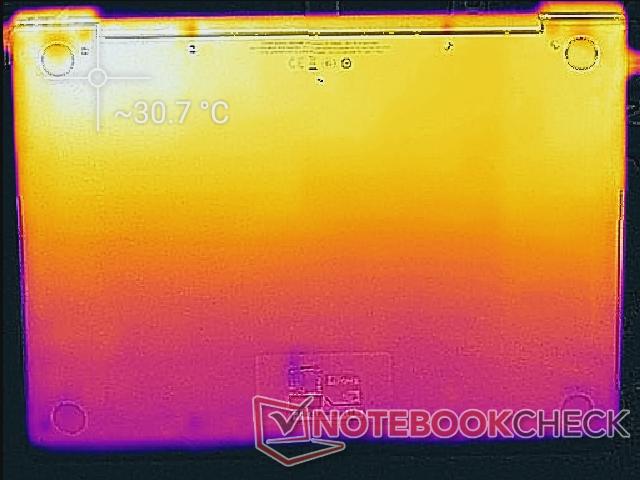
Temperature
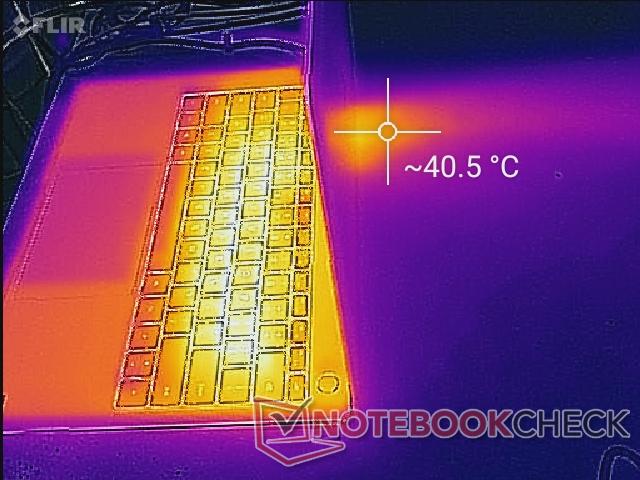
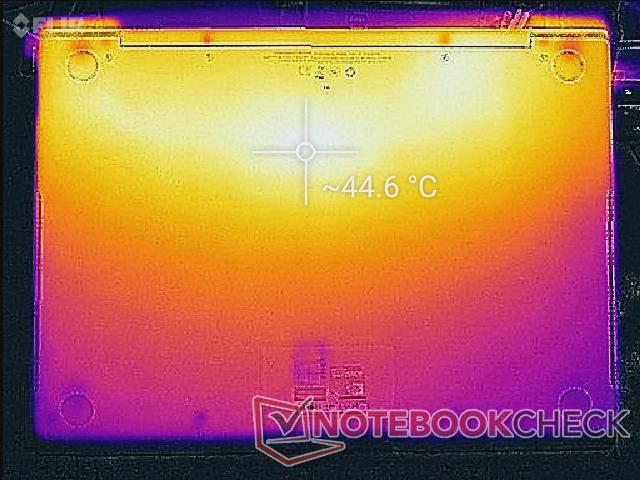
Surface temperatures are generally warmer on the MateBook X Pro compared to the MateBook X despite the more capable cooling solution. The bottom of the notebook is already reasonably warm at around 30 C when idling. When gaming, surfaces can be as warm as 48 C compared to just 41 C on last year's model. We can definitely see why Huawei had to thicken the design and incorporate a fan with larger heat sinks. The palm rests and trackpad remain relatively cool no matter the workload, but we recommend a flat desk if gaming because surfaces heat up very quickly. Be sure to leave ample room for ventilation through the rear corner of the unit.
Dell's XPS 13 runs cooler than the MateBook X Pro since it utilizes dual fans in a tighter formation and with no dedicated GPU. Its graphics performance, of course, is much slower. Thicker systems with smaller cooling solutions like the ThinkPad X1 Carbon can be even warmer at over 50 C.
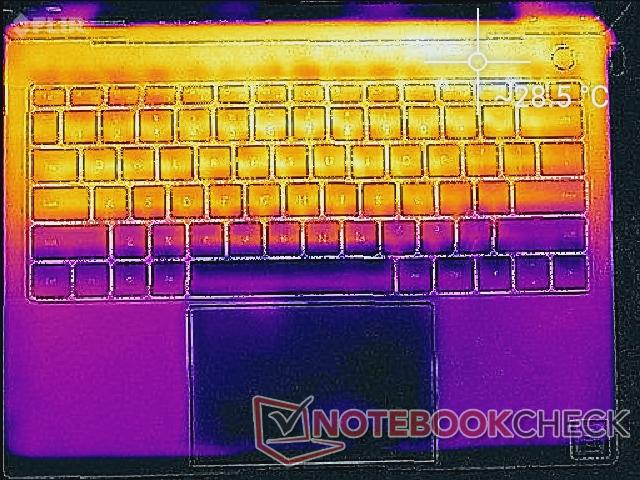
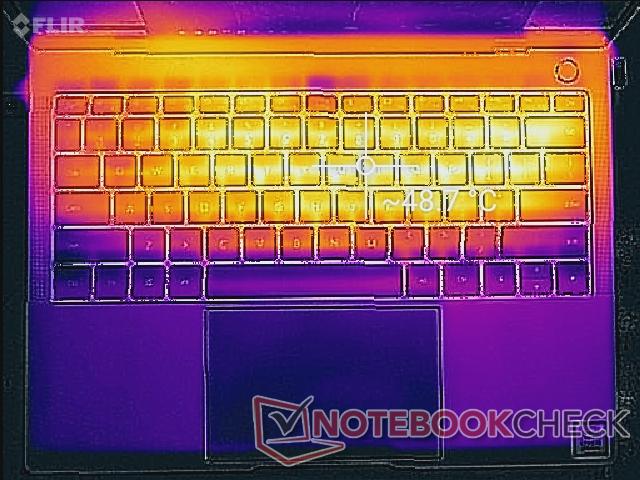
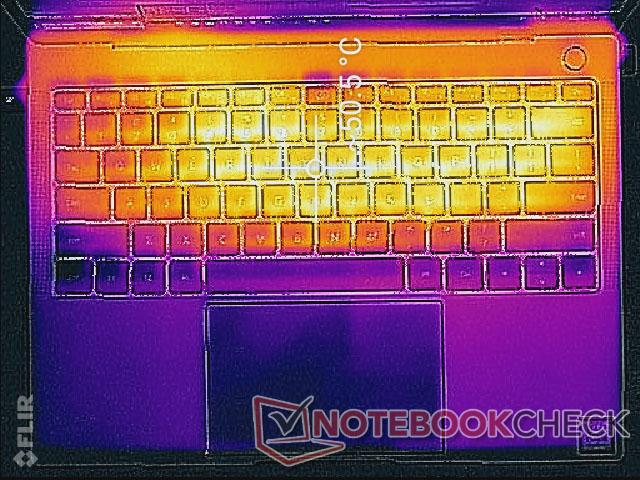
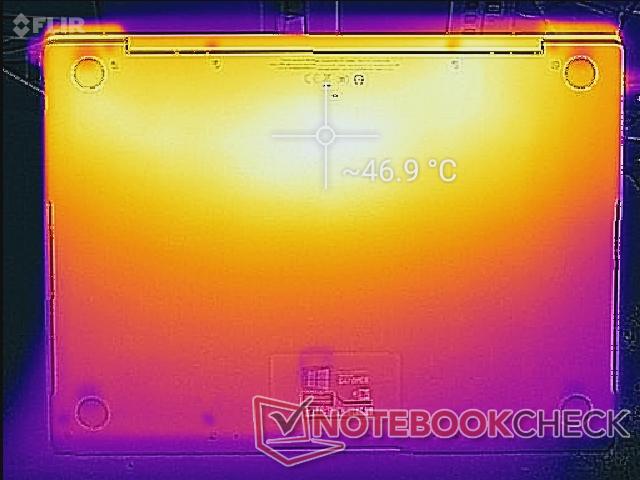
(-) The maximum temperature on the upper side is 48.6 °C / 119 F, compared to the average of 35.9 °C / 97 F, ranging from 21.4 to 59 °C for the class Subnotebook.
(-) The bottom heats up to a maximum of 47 °C / 117 F, compared to the average of 39.2 °C / 103 F
(+) In idle usage, the average temperature for the upper side is 3.2 °C / 38 F, compared to the device average of 30.8 °C / 87 F.
(+) Playing The Witcher 3, the average temperature for the upper side is 5.3 °C / 42 F, compared to the device average of 30.8 °C / 87 F.
(+) The palmrests and touchpad are reaching skin temperature as a maximum (34.4 °C / 93.9 F) and are therefore not hot.
(-) The average temperature of the palmrest area of similar devices was 28.2 °C / 82.8 F (-6.2 °C / -11.1 F).
Speakers
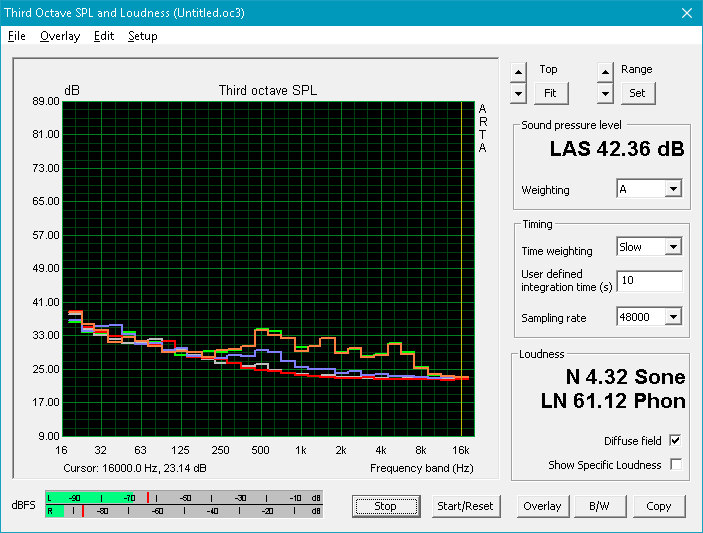
The quad speaker arrangement includes two front-facing speakers on each side of the keyboard plus two more facing the bottom corners. Sound quality is good enough for conferences and reasonably loud on higher settings. Media playback is less impressive due to weak bass and the tendency for the chassis to reverberate when at 50 percent volume or higher.


Huawei Matebook X Pro i5 audio analysis
(±) | speaker loudness is average but good (73.3 dB)
Bass 100 - 315 Hz
(±) | reduced bass - on average 9.7% lower than median
(±) | linearity of bass is average (13.3% delta to prev. frequency)
Mids 400 - 2000 Hz
(+) | balanced mids - only 4.7% away from median
(±) | linearity of mids is average (7.4% delta to prev. frequency)
Highs 2 - 16 kHz
(+) | balanced highs - only 3% away from median
(±) | linearity of highs is average (9.2% delta to prev. frequency)
Overall 100 - 16.000 Hz
(±) | linearity of overall sound is average (17.7% difference to median)
Compared to same class
» 49% of all tested devices in this class were better, 7% similar, 44% worse
» The best had a delta of 5%, average was 18%, worst was 53%
Compared to all devices tested
» 35% of all tested devices were better, 8% similar, 57% worse
» The best had a delta of 4%, average was 23%, worst was 134%
Apple MacBook 12 (Early 2016) 1.1 GHz audio analysis
(+) | speakers can play relatively loud (83.6 dB)
Bass 100 - 315 Hz
(±) | reduced bass - on average 11.3% lower than median
(±) | linearity of bass is average (14.2% delta to prev. frequency)
Mids 400 - 2000 Hz
(+) | balanced mids - only 2.4% away from median
(+) | mids are linear (5.5% delta to prev. frequency)
Highs 2 - 16 kHz
(+) | balanced highs - only 2% away from median
(+) | highs are linear (4.5% delta to prev. frequency)
Overall 100 - 16.000 Hz
(+) | overall sound is linear (10.2% difference to median)
Compared to same class
» 7% of all tested devices in this class were better, 2% similar, 90% worse
» The best had a delta of 5%, average was 18%, worst was 53%
Compared to all devices tested
» 5% of all tested devices were better, 1% similar, 94% worse
» The best had a delta of 4%, average was 23%, worst was 134%
Energy Management
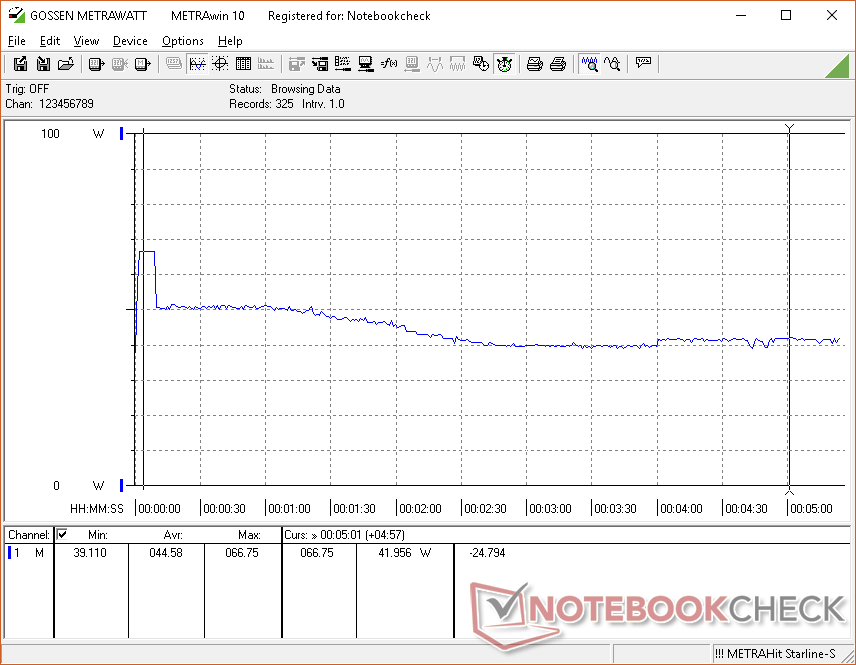
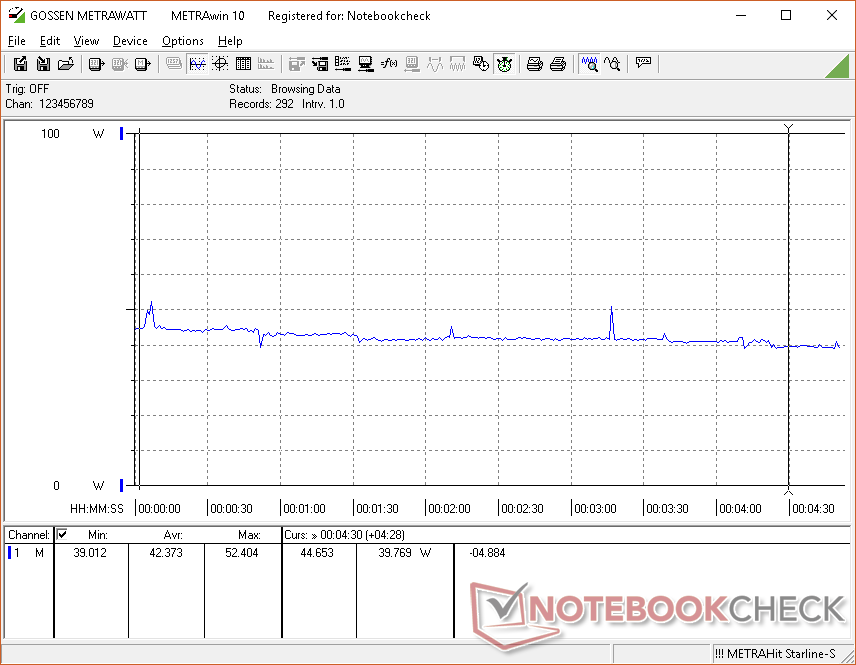
Power Consumption
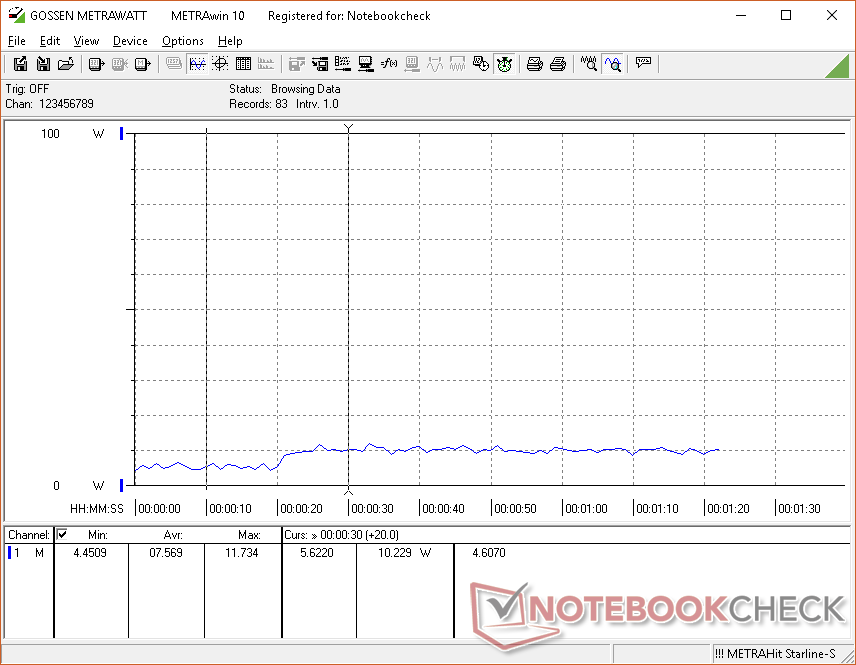
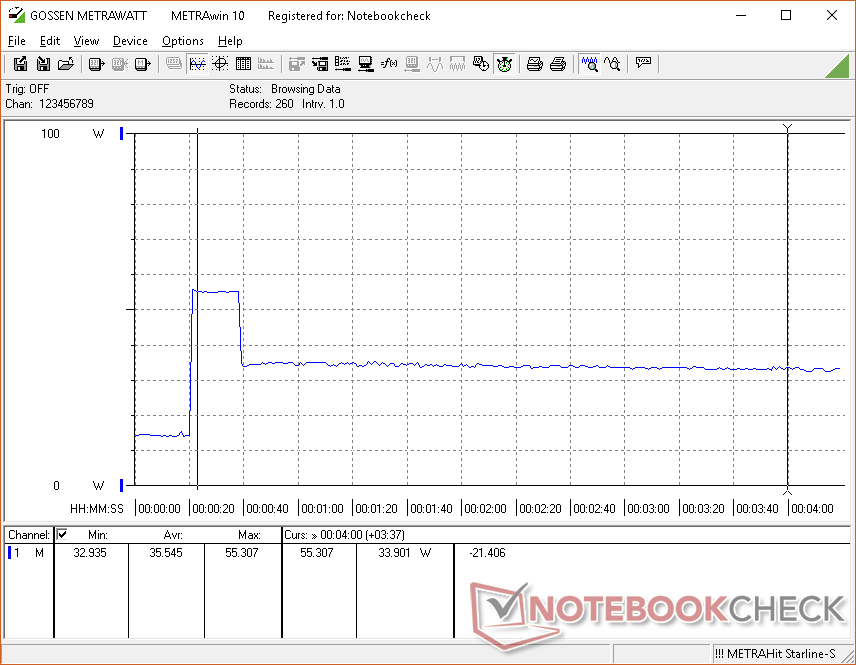
The MateBook X Pro consumes more power than last year's MateBook X largely due to the higher display resolution, larger screen, active cooling solution, and dedicated GPU. Idling on desktop will demand anywhere between 3 W and 12 W depending on the Power profile and brightness setting. If running extreme processing loads, we are able to record a power draw of almost 67 W for only the first few seconds before dropping and stabilizing to around 42 W as shown by our graphs below. Power consumption is always highest during the start of stress tests where throttling has yet to occur. Our results here mirror the results from the CineBench loop test above.
The small (~50 x 28 x 28 mm) 65 W adapter is sufficient as the system will still charge even when gaming. The notebook can indeed draw the full 65 W for very short periods, albeit the 40 W to 50 W range will be more common when under realistic loads. Smaller 45 W USB Type-C chargers are also compatible with the system.
| Off / Standby | |
| Idle | |
| Load |
|
Key:
min: | |
| Huawei Matebook X Pro i5 i5-8250U, GeForce MX150, Samsung PM961 MZVLW256HEHP, IPS, 3000x2000, 13.9" | Huawei MateBook X i5-7200U, HD Graphics 620, LITEON CB1-SD256, , 2160x1440, 13.3" | Dell XPS 13 9370 i7 UHD i5-8550U, UHD Graphics 620, Toshiba XG5 KXG50ZNV512G, IPS, 3840x2160, 13.3" | Microsoft Surface Laptop i5 i5-7200U, HD Graphics 620, Toshiba THNSN0128GTYA, IPS, 2256x1504, 13.5" | Apple MacBook Pro 13 2017 i5-7360U, Iris Plus Graphics 640, Apple SSD AP0128, IPS, 2560x1600, 13.3" | Asus Zenbook UX3430UN-GV174T i5-8250U, GeForce MX150, SK Hynix HFS256G39TND-N210A, IPS, 1920x1080, 14" | |
|---|---|---|---|---|---|---|
| Power Consumption | 2% | 3% | 32% | 20% | 2% | |
| Idle Minimum * (Watt) | 3.5 | 4.6 -31% | 5 -43% | 3.2 9% | 3.7 -6% | 4.5 -29% |
| Idle Average * (Watt) | 8.9 | 11 -24% | 8.3 7% | 6.5 27% | 5.2 42% | 7.8 12% |
| Idle Maximum * (Watt) | 12.3 | 12 2% | 8.8 28% | 6.8 45% | 7.6 38% | 8.1 34% |
| Load Average * (Watt) | 54.2 | 39.5 27% | 46.4 14% | 28.2 48% | 41.6 23% | 52 4% |
| Witcher 3 ultra * (Watt) | 42.4 | |||||
| Load Maximum * (Watt) | 52.1 | 34.6 34% | 48.6 7% | 36 31% | 50.5 3% | 59 -13% |
* ... smaller is better
Battery Life
Huawei has upped the battery capacity from 40 Wh on the original MateBook X to 57 Wh on this latest revision. The 43 percent increase far outweighs the higher power demands of the MateBook X Pro and so the notebook is both more powerful and longer-lasting than its predecessor. Users can expect around 9 hours of continuous WLAN usage compared to 5.5 hours on the older MateBook X. This is also around 2 hours longer and shorter than the XPS 13 9370 and MacBook Pro 13, respectively.
Charging from near empty to full capacity with the default 65 W adapter takes about 1.5 to 2 hours. Note that the charger can also be used on other laptops and to Quick Charge compatible smartphones.
| Huawei Matebook X Pro i5 i5-8250U, GeForce MX150, 57.4 Wh | Huawei MateBook X i5-7200U, HD Graphics 620, 40 Wh | Dell XPS 13 9370 i7 UHD i5-8550U, UHD Graphics 620, 52 Wh | Microsoft Surface Laptop i5 i5-7200U, HD Graphics 620, 45 Wh | Apple MacBook Pro 13 2017 i5-7360U, Iris Plus Graphics 640, 54.5 Wh | Asus Zenbook UX3430UN-GV174T i5-8250U, GeForce MX150, 48 Wh | |
|---|---|---|---|---|---|---|
| Battery runtime | -25% | -23% | 4% | -9% | -7% | |
| Reader / Idle (h) | 20.7 | 8.5 -59% | 13.7 -34% | 22.5 9% | 22.8 10% | |
| WiFi v1.3 (h) | 9.3 | 5.6 -40% | 7.8 -16% | 10 8% | 11.4 23% | 8.1 -13% |
| Load (h) | 2.2 | 2.7 23% | 1.8 -18% | 2.1 -5% | 1.3 -41% | 1.8 -18% |
Pros
Cons
Verdict
Huawei has been able to carve itself a significant slice of the smartphone market with its well-received smartphones and we're beginning to see this same level of quality and care on the second generation MateBook X. Instead of blindly going thinner for the sake of looks, the MateBook X Pro dares to be slightly thicker than its predecessor in return for discrete graphics, a larger battery, and faster performance that users can actually feel. The end result is a system that is very well balanced in both design and power. Huawei only recently entered the worldwide laptop market merely a year ago but this already feels like a product from a veteran manufacturer on par with the XPS, Spectre, and Zenbook families.
Of course, Huawei has to do more than just be comparable to the competition. This is where the very aggressive pricing comes into play as the entry-level MateBook X Pro with i5-8250U CPU and integrated graphics retails for $1200 USD plus a $300 gift card. Altogether, users would be saving hundreds when compared to the XPS 13 or Spectre 13. The $900 range is populated by mainstream laptops like the IdeaPad, Yoga 700 series, VivoBook, Inspiron, or Envy where the MateBook X Pro is indubitably a stronger option than all the above in terms of quality. Users who want dedicated Nvidia graphics, however, will have to put down $1500 to get everything that the flagship notebook offers.
There is still a lot of room for improvement in what we hope will happen for a theoretical third generation MateBook X. For one, the narrow bezels, light weight, and Gorilla Glass touchscreen are just screaming for a 360-degree form factor a la the XPS 2-in-1 or Yoga 920. Webcam positioning is not any better than on the XPS series, either. There have also been some hidden cut corners in terms of performance as shown by our CPU stress tests above and the sly use of a slower GeForce MX150 'Max-Q' GPU instead of the fully-featured GeForce MX150. The lack of any card readers may irk content creators while the integrated trackpad keys are soft and inferior to the same solution on the MacBook series. Had Huawei included NFC, IR, and SIM features, the MateBook X Pro could have appealed even more to business users who value the added security and convenience.
Solid design worthy of the flagship title and an immense improvement over the original MateBook X in terms of power. The heavy promotions from the manufacturer make the MateBook X Pro very compelling for anyone considering an Ultrabook for under $1000 USD. It is essentially a high-end laptop for a mid-range price.
Huawei Matebook X Pro i5
- 05/20/2018 v6 (old)
Allen Ngo
