Dell Inspiron 15 7000 7577 (i5-7300HQ, GTX 1060 Max-Q) Laptop Review
It hasn't even been a full year since we first published on the Inspiron 15 7567 and Dell has already refreshed the chassis with key component changes. The new Inspiron 15 7577 is the late 2017 successor that brings Max-Q technology to the most affordable price range we've seen yet. This notable change should theoretically deliver faster graphics performance at quieter noise levels over the 7567 series where the GTX 1050 Ti was the highest available option. Our review page will compare and contrast the advantages that this latest redesign brings to the budget Inspiron gaming family.
The Inspiron 7577 starts at just under $900 USD with an i5-7300HQ CPU, GTX 1060 Max-Q GPU, FHD IPS matte display, and 128 GB SSD + 1 TB HDD while the highest-end SKU will cost $1600 USD with an i7-7700HQ, GTX 1060 Max-Q GPU, 4K UHD IPS display, and up to a 512 GB NVMe SSD. The fact that Dell includes the exact same GPU across the entire lineup is a notable change from the Inspiron 7567 where there were multiple GPU options. Competitors in this price range are plentiful including the Asus ROG GL503, Lenovo Legion Y520, Acer Nitro 5, Gigabyte Sabre 15, Samsung Odyssey, HP Omen 15, and the MSI GF62VR to name a few.
Case
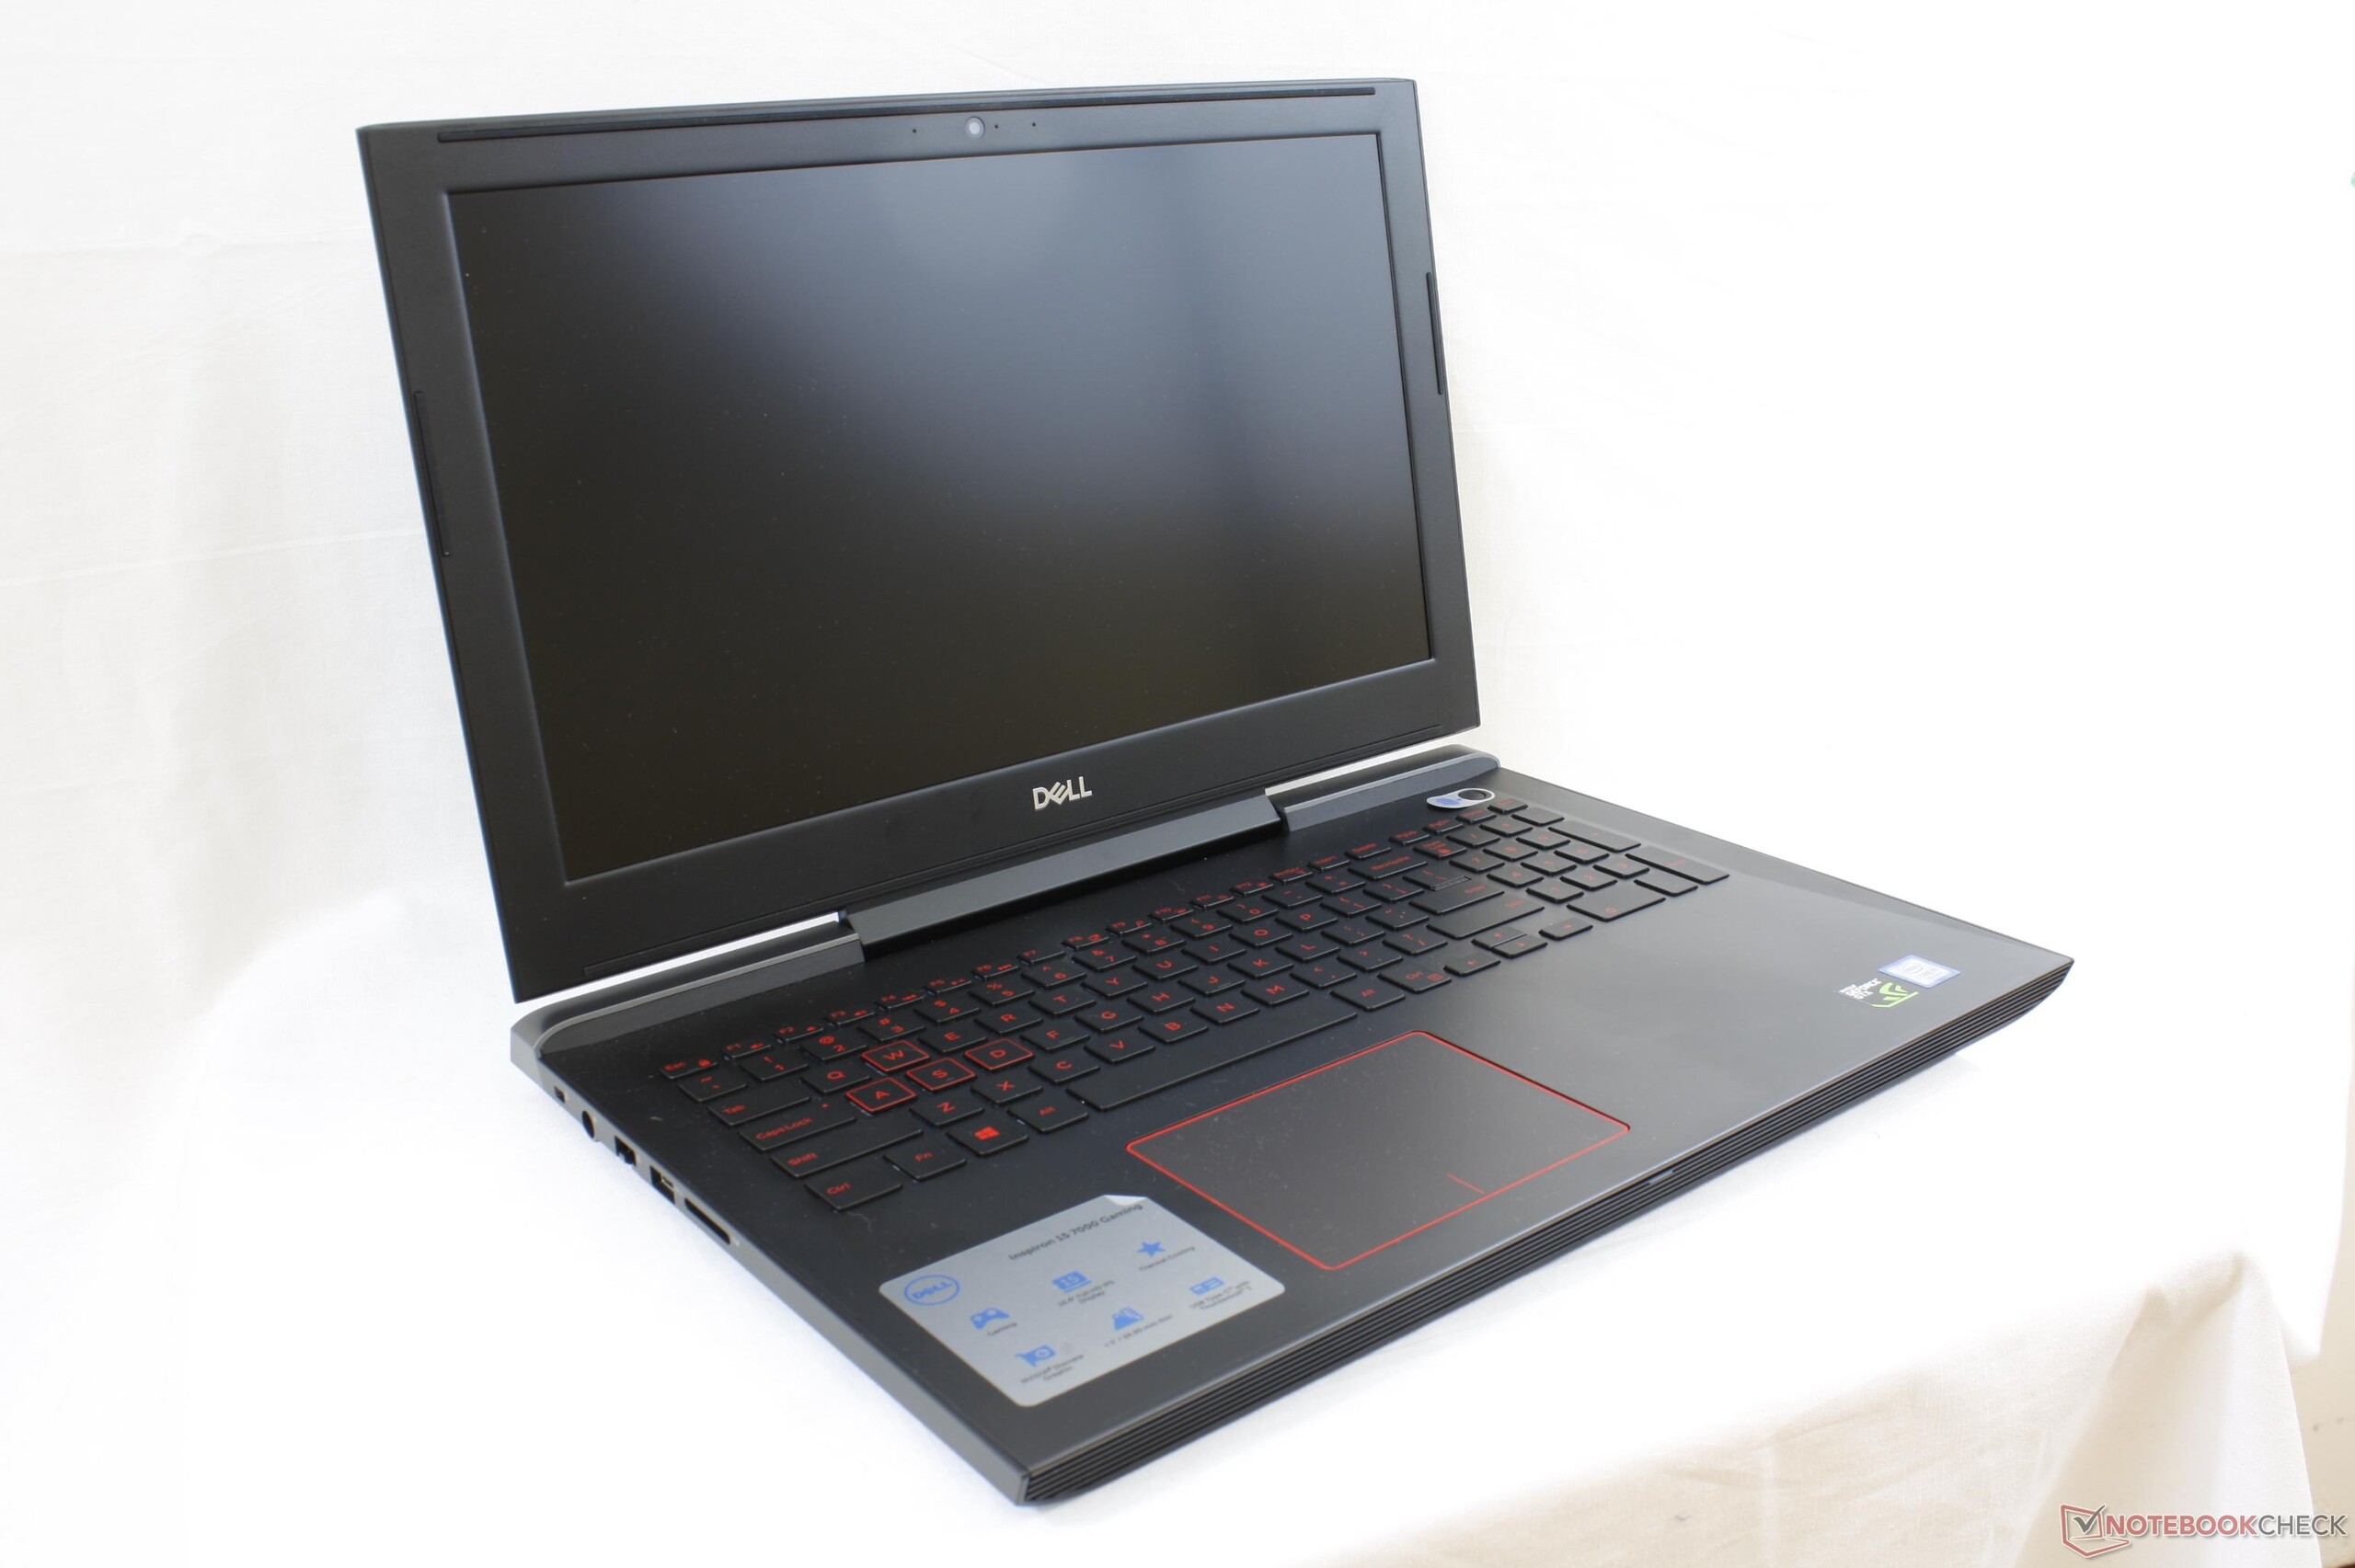
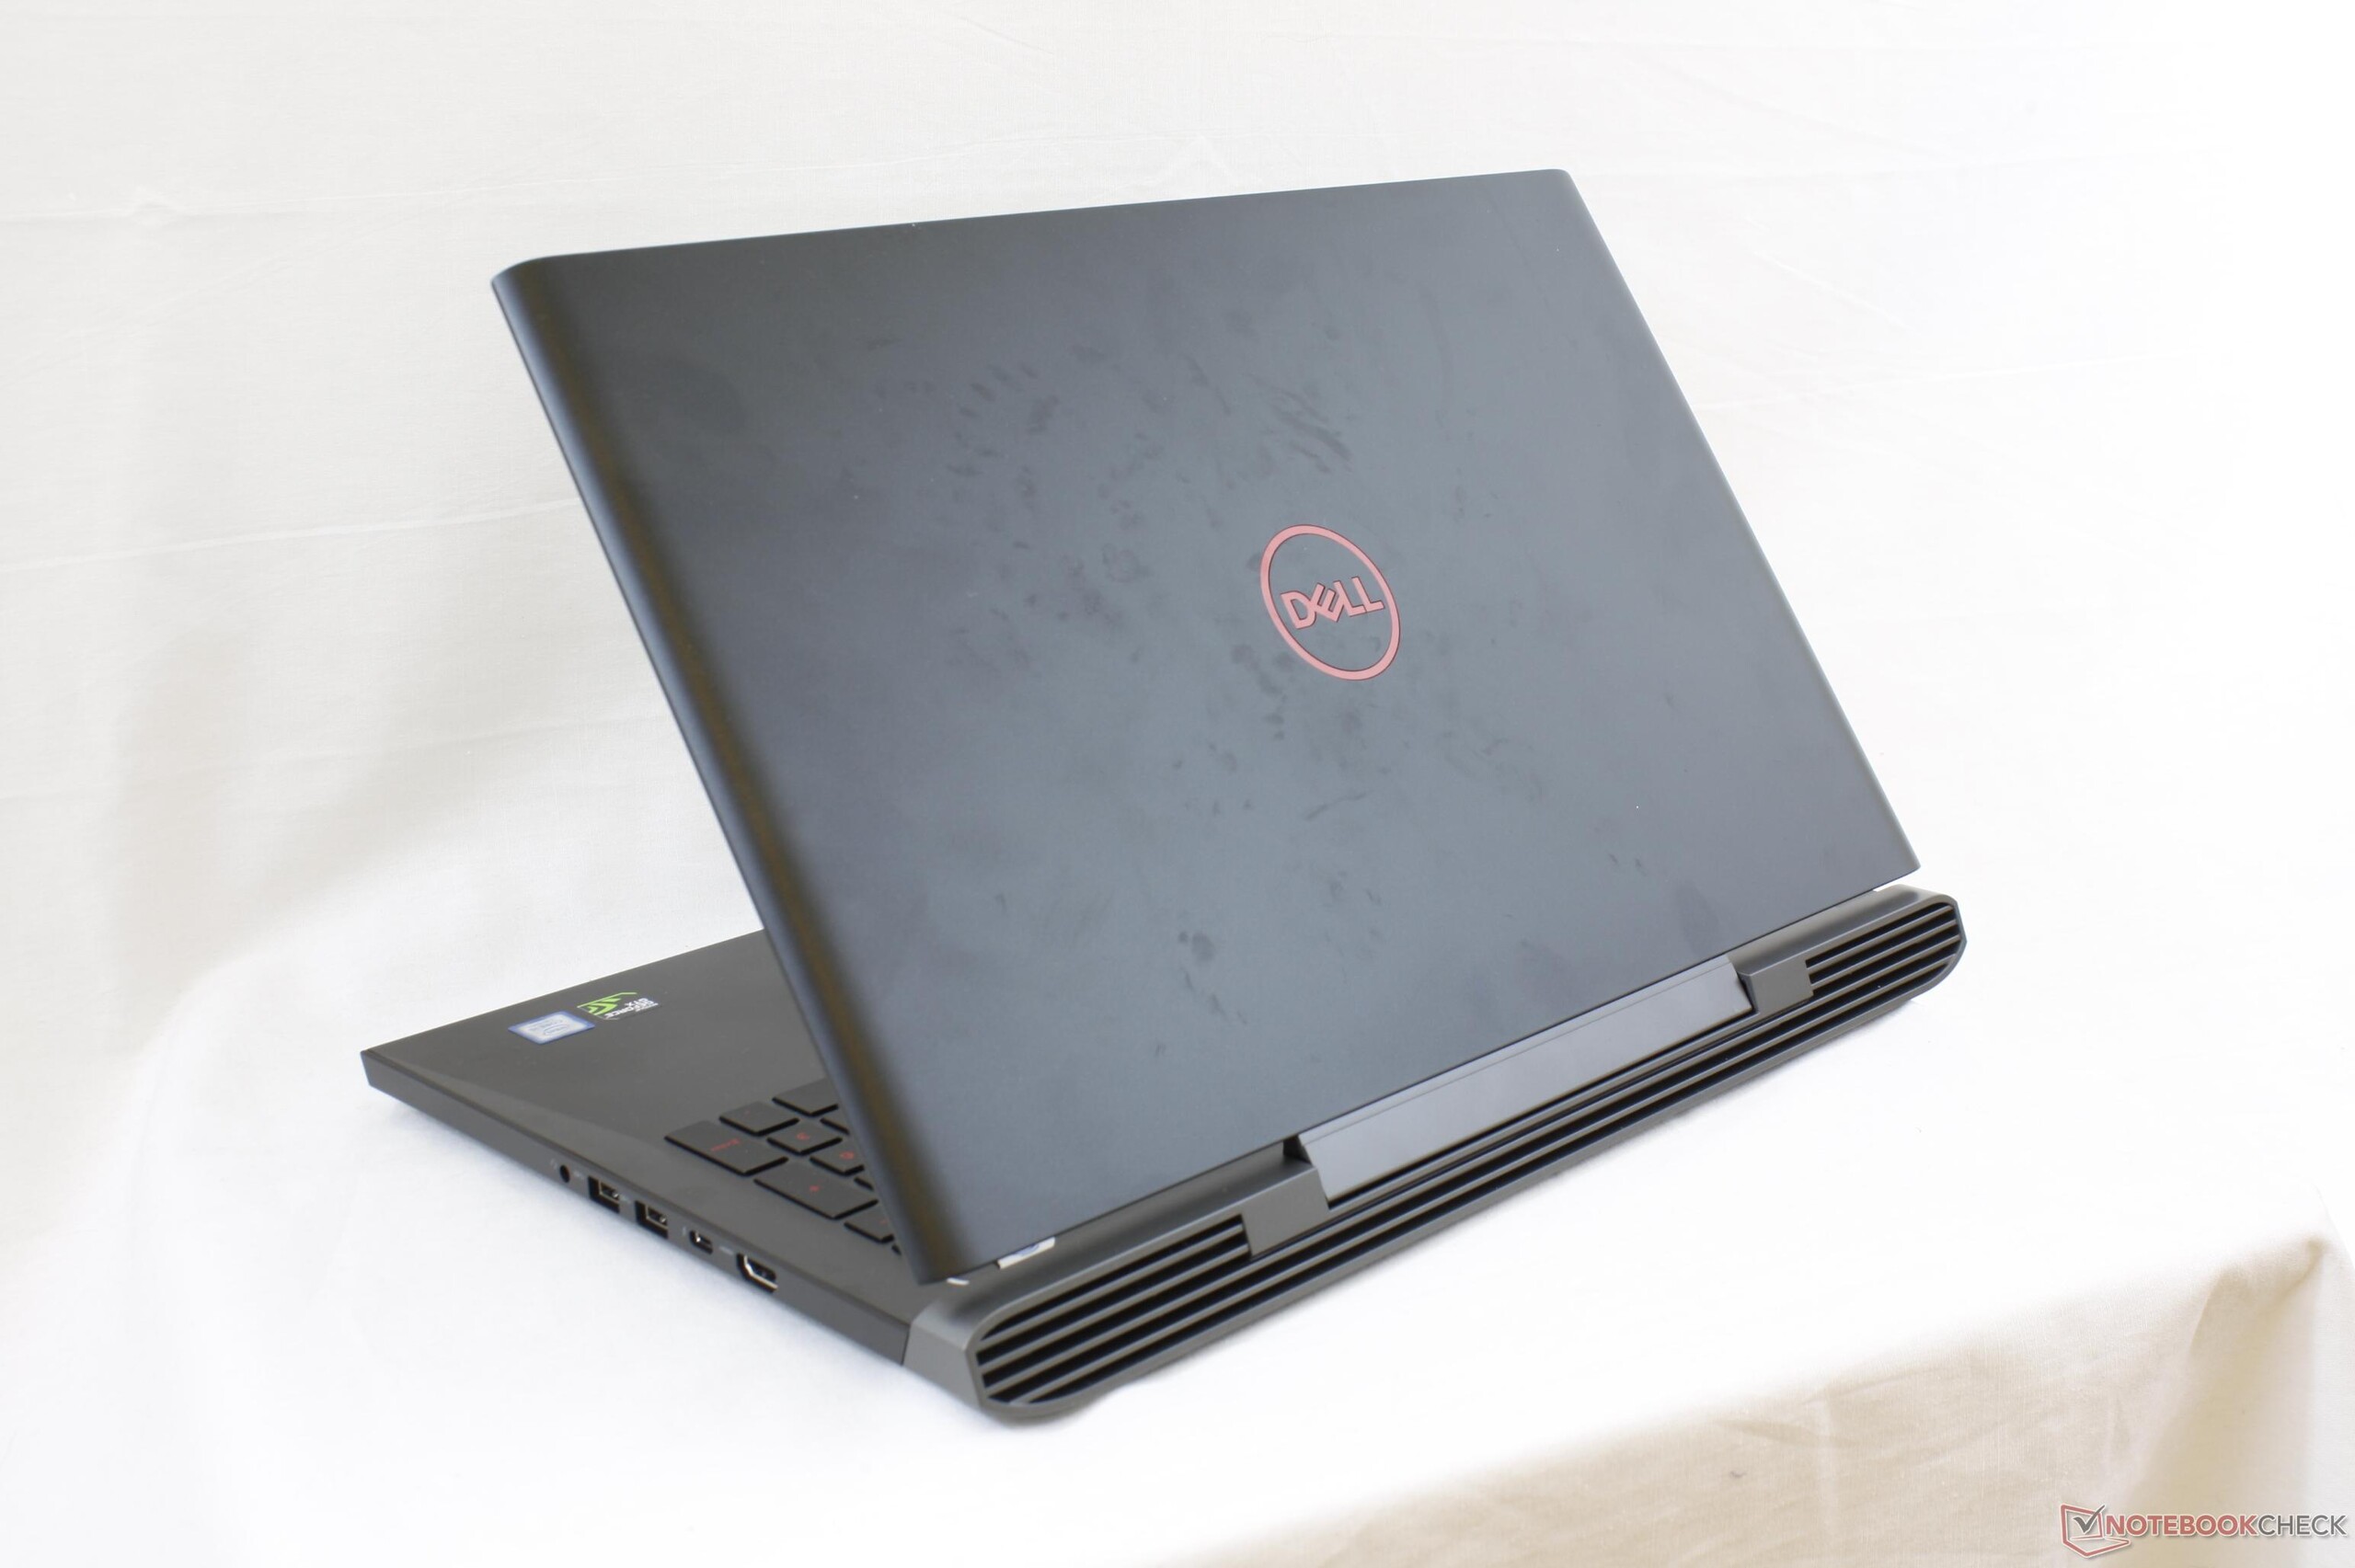
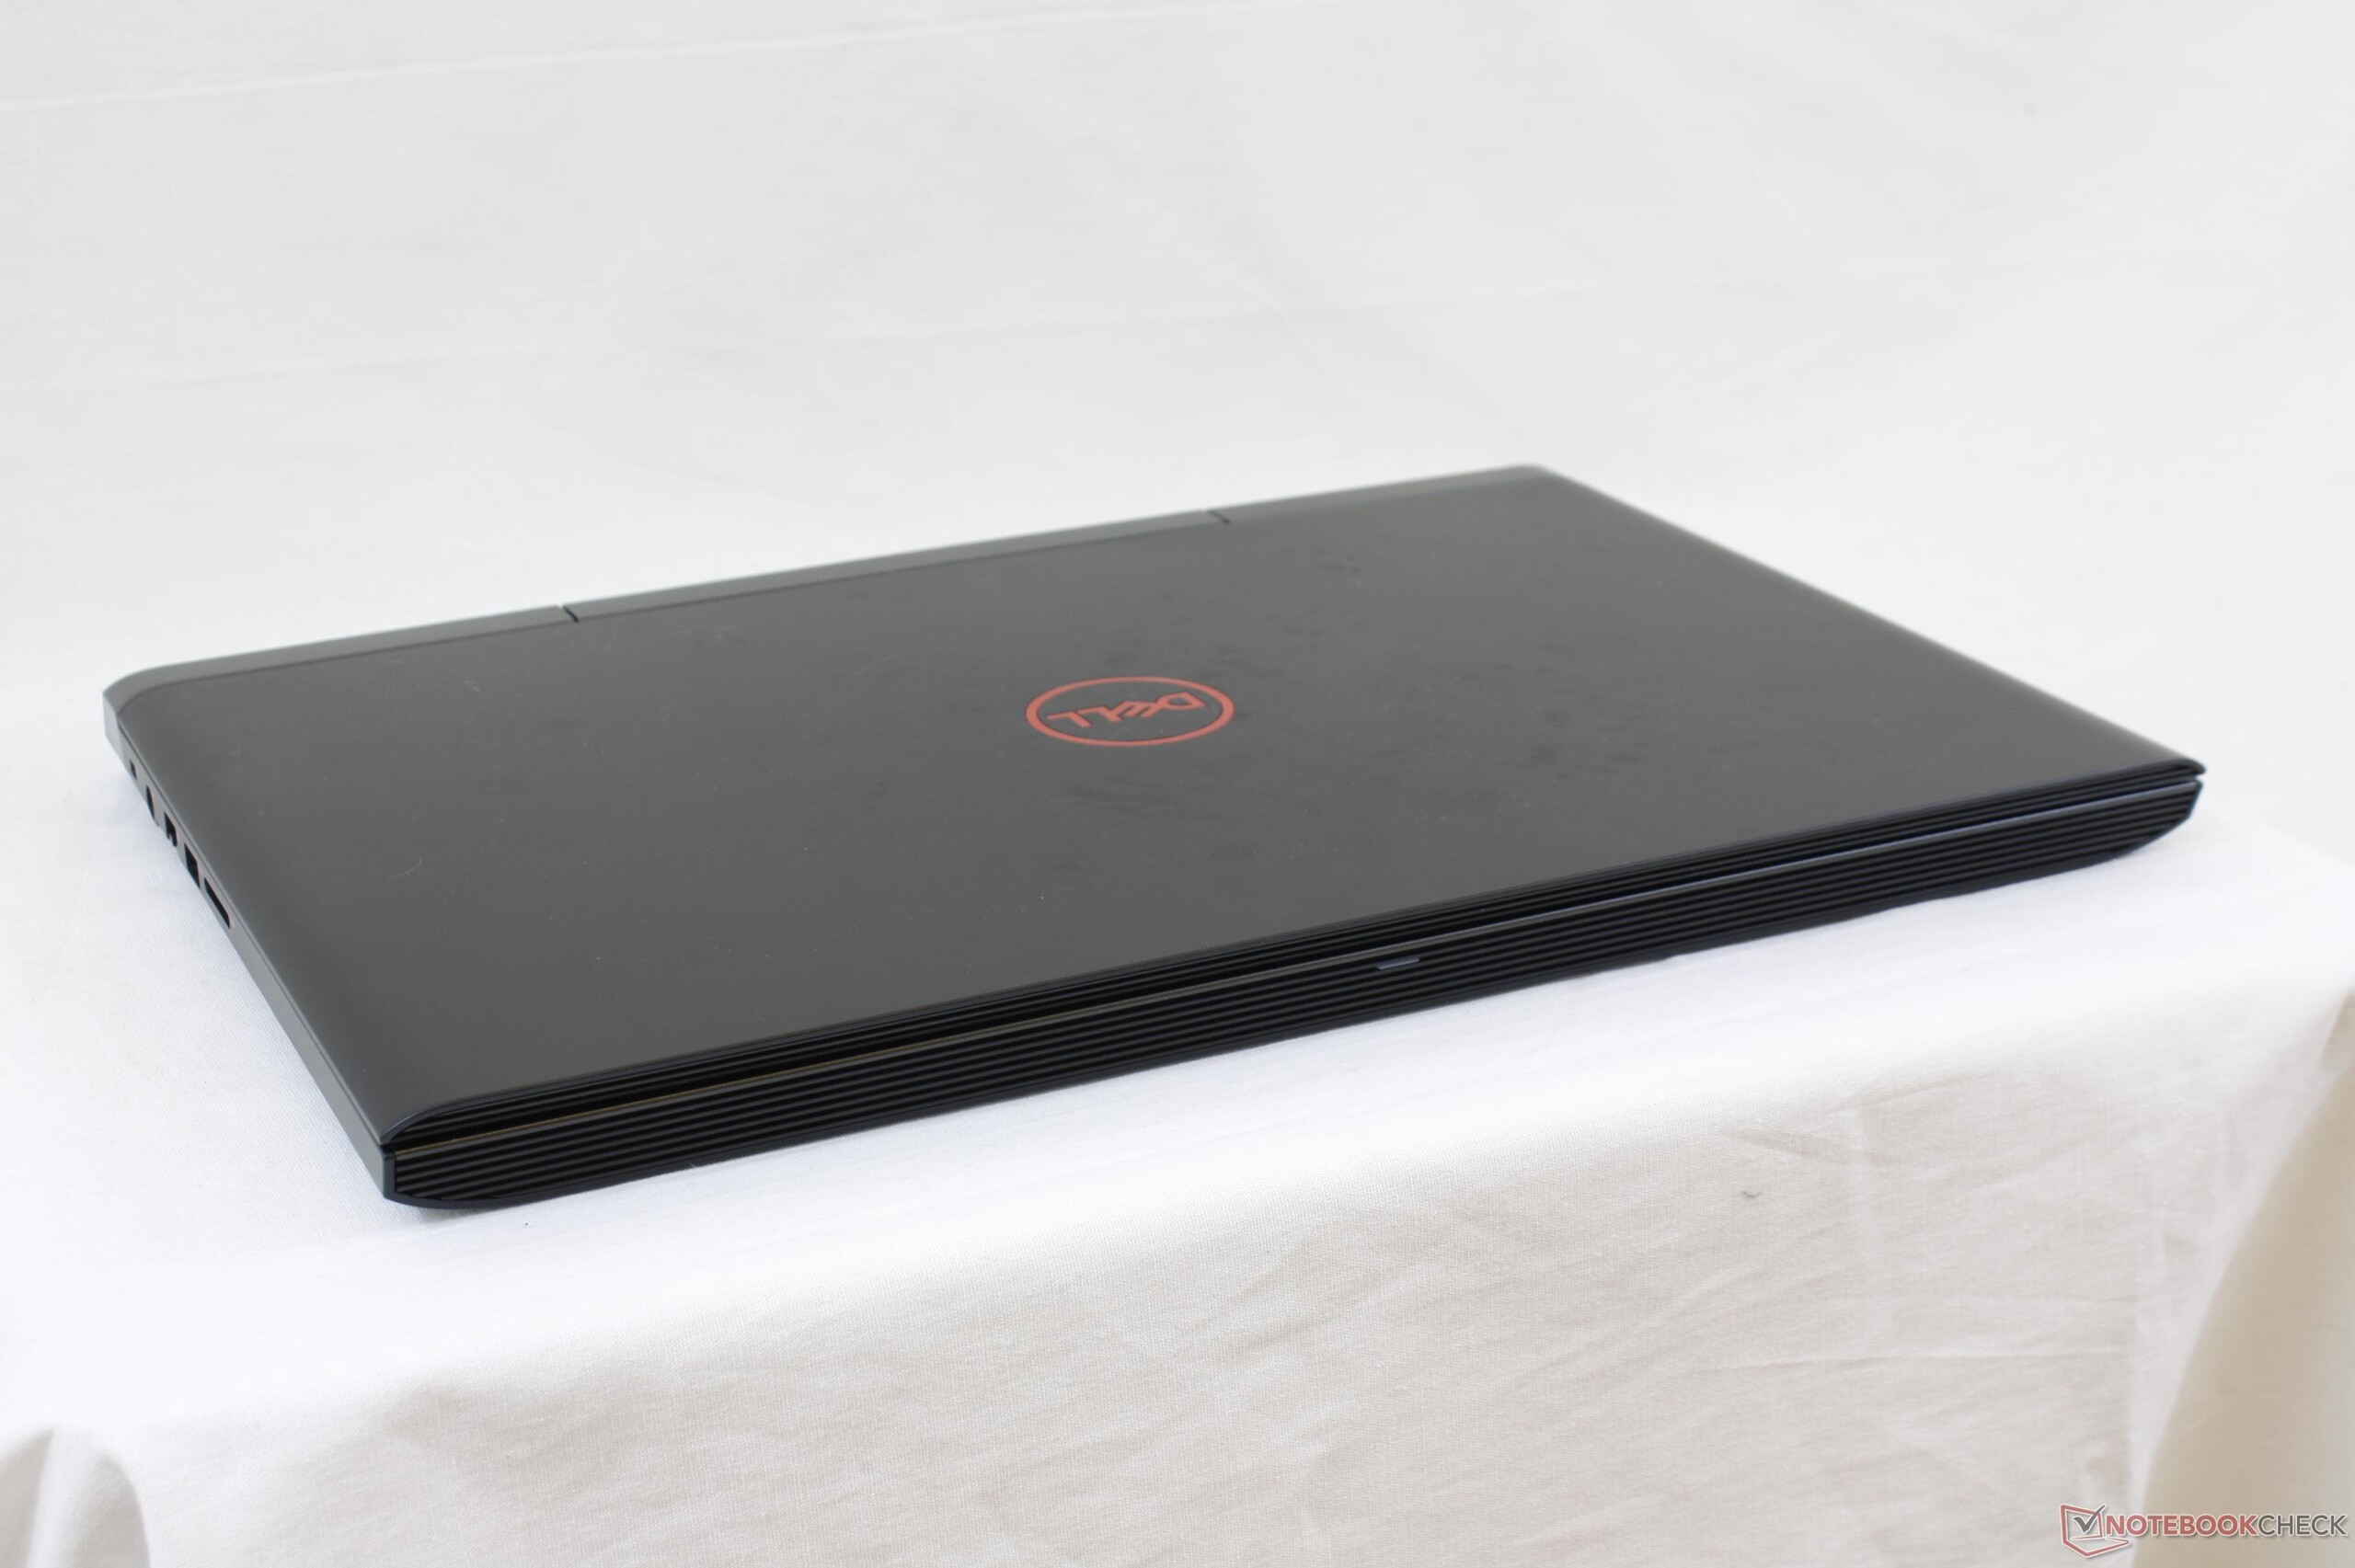
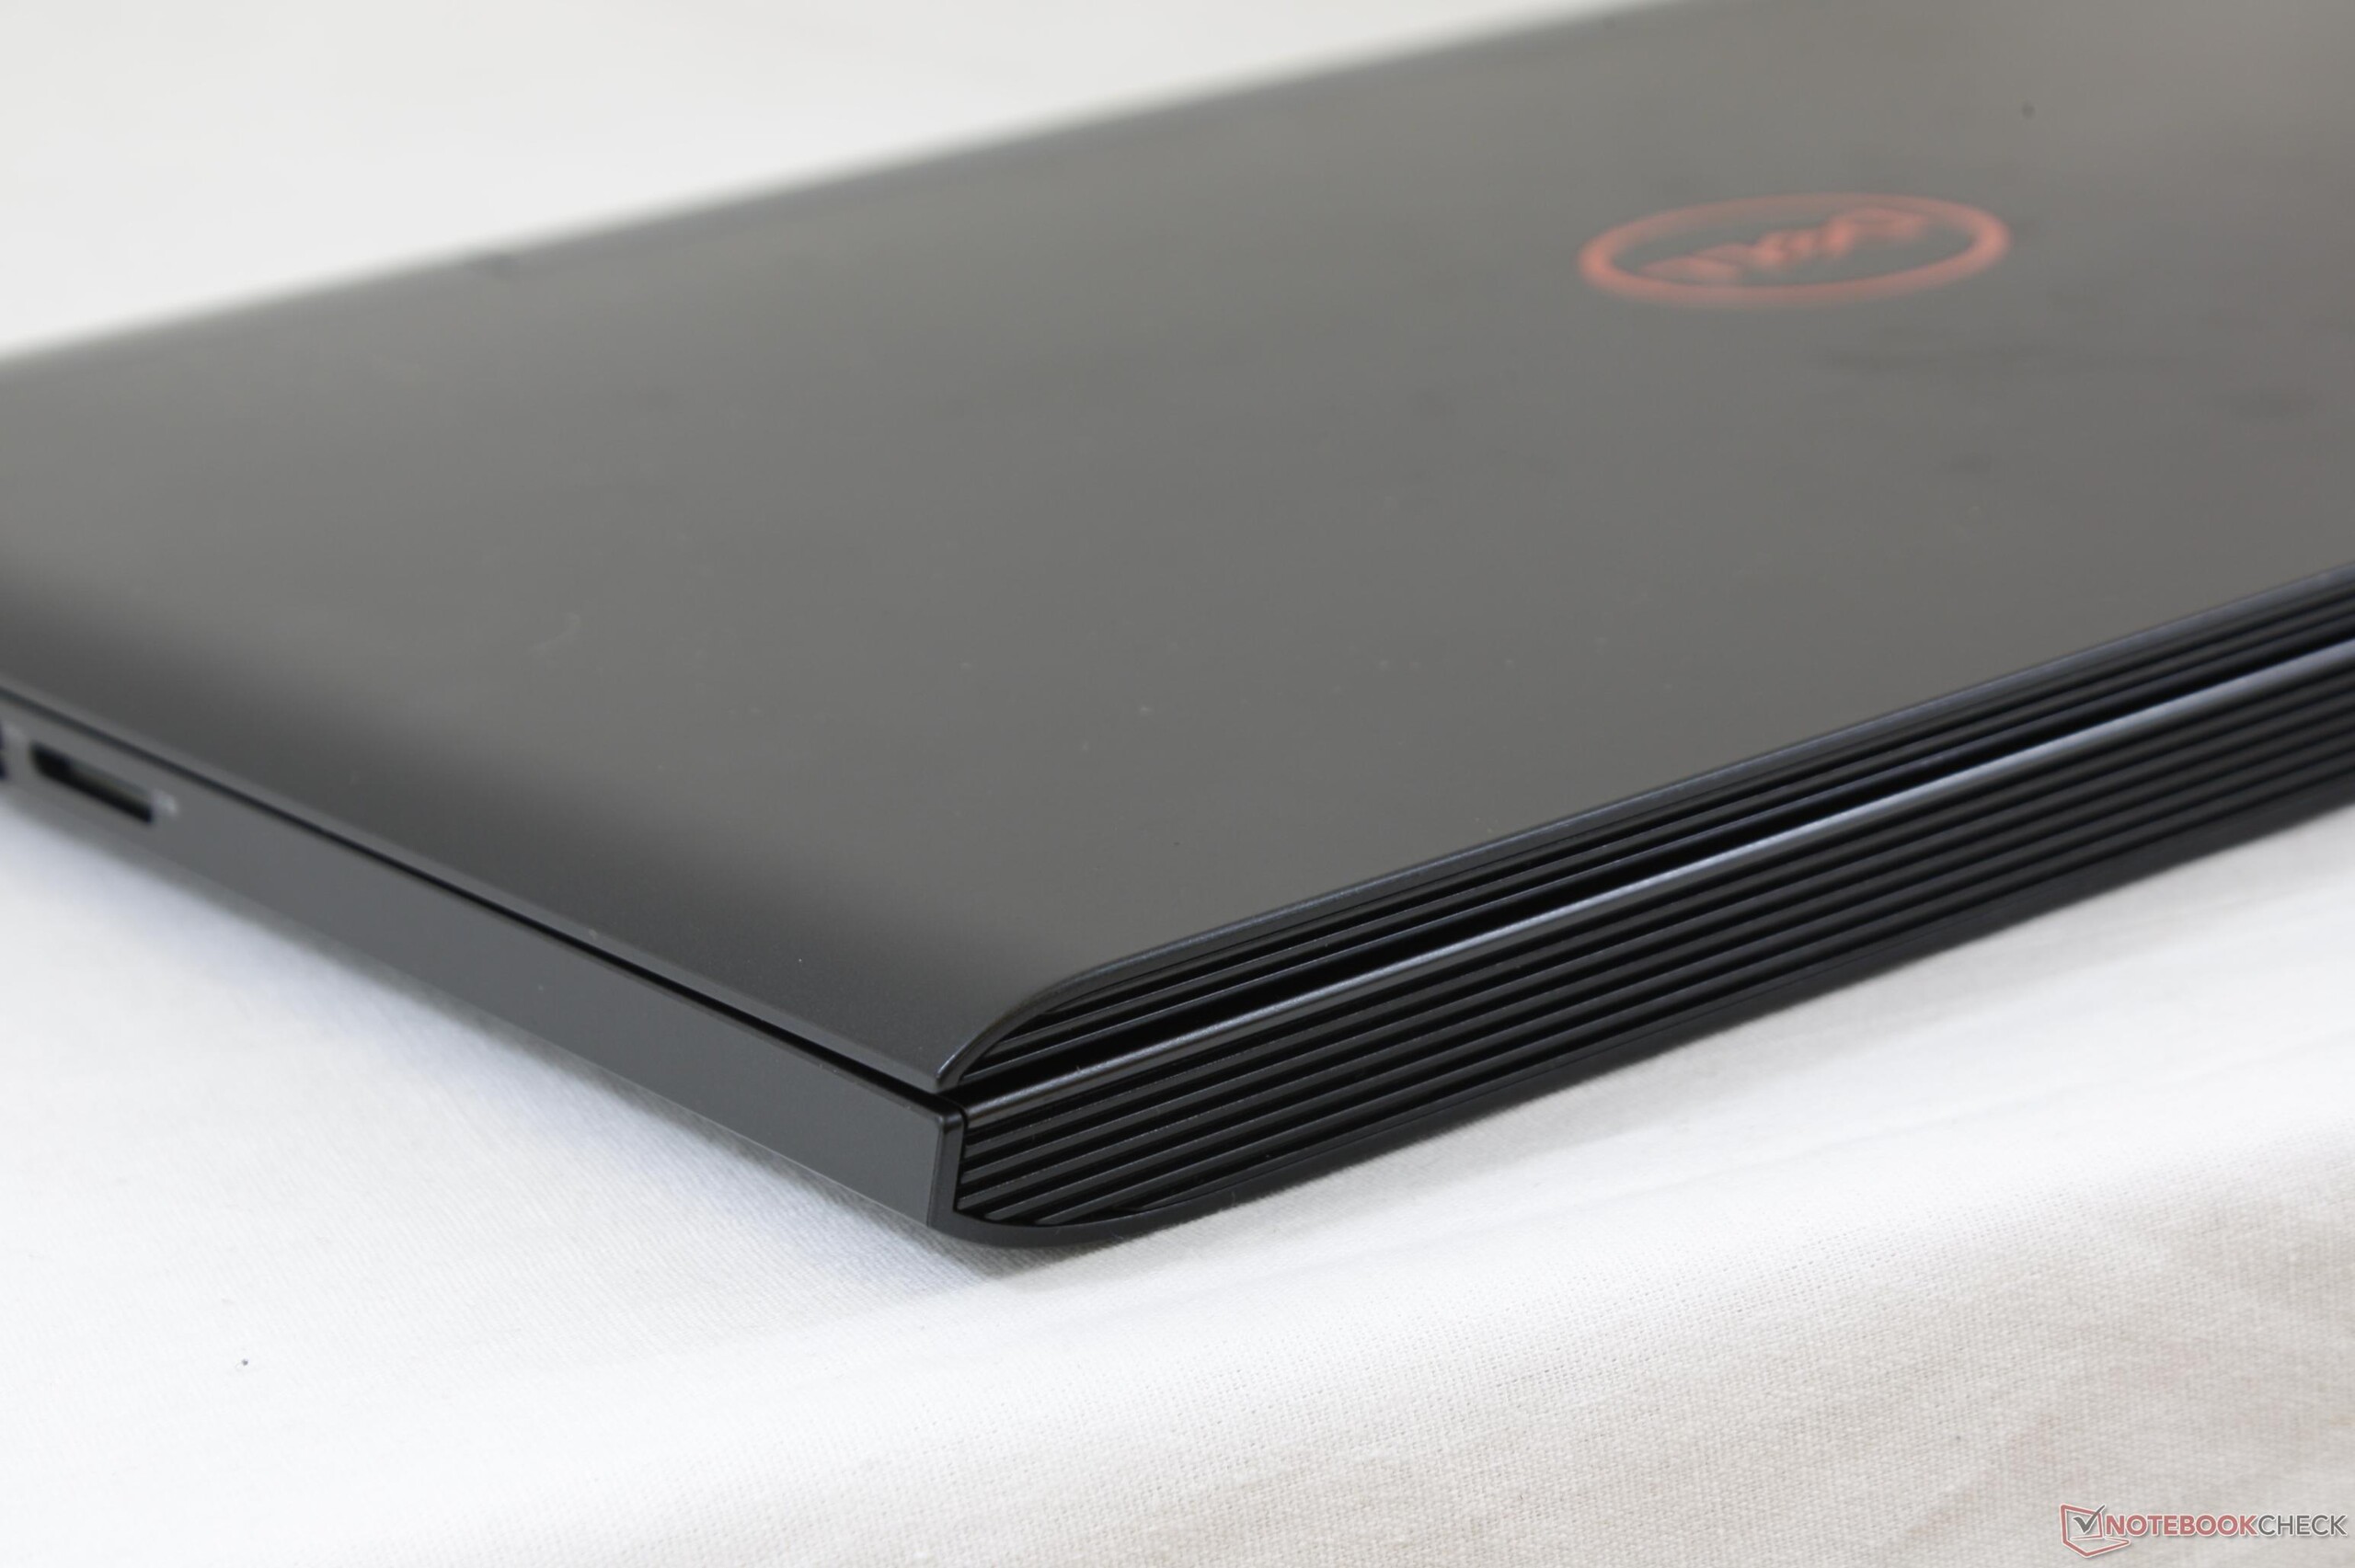
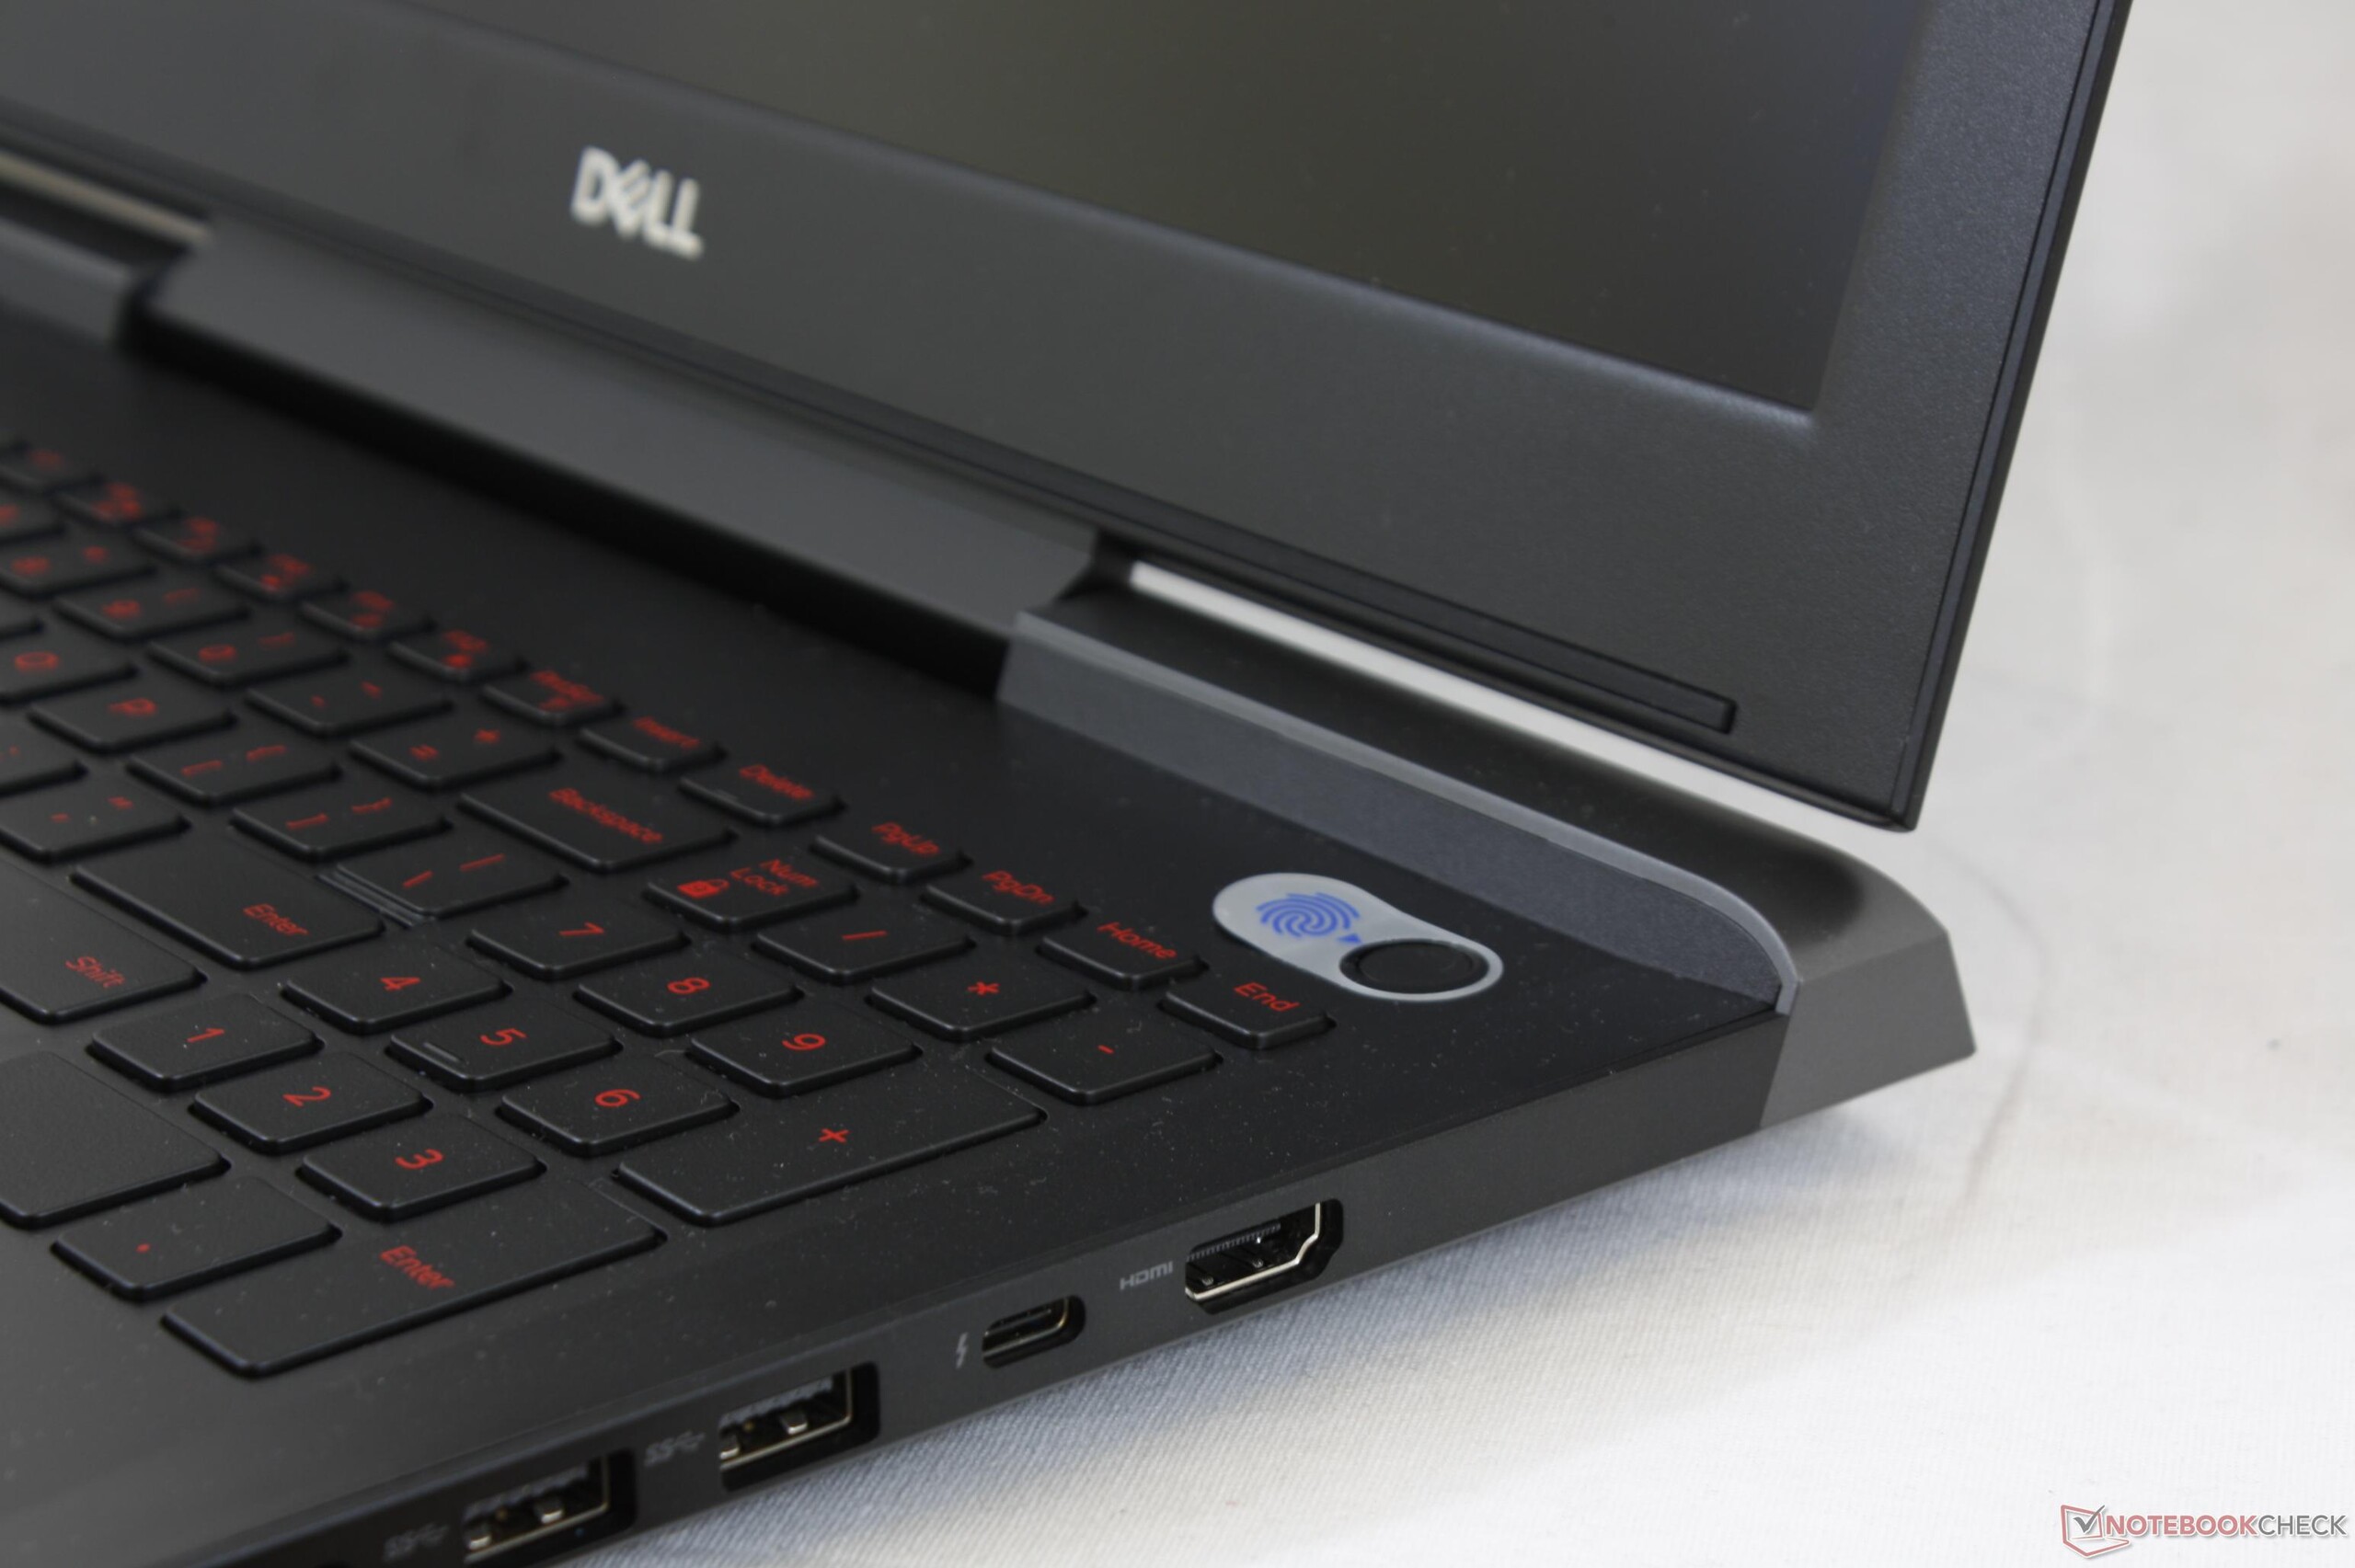
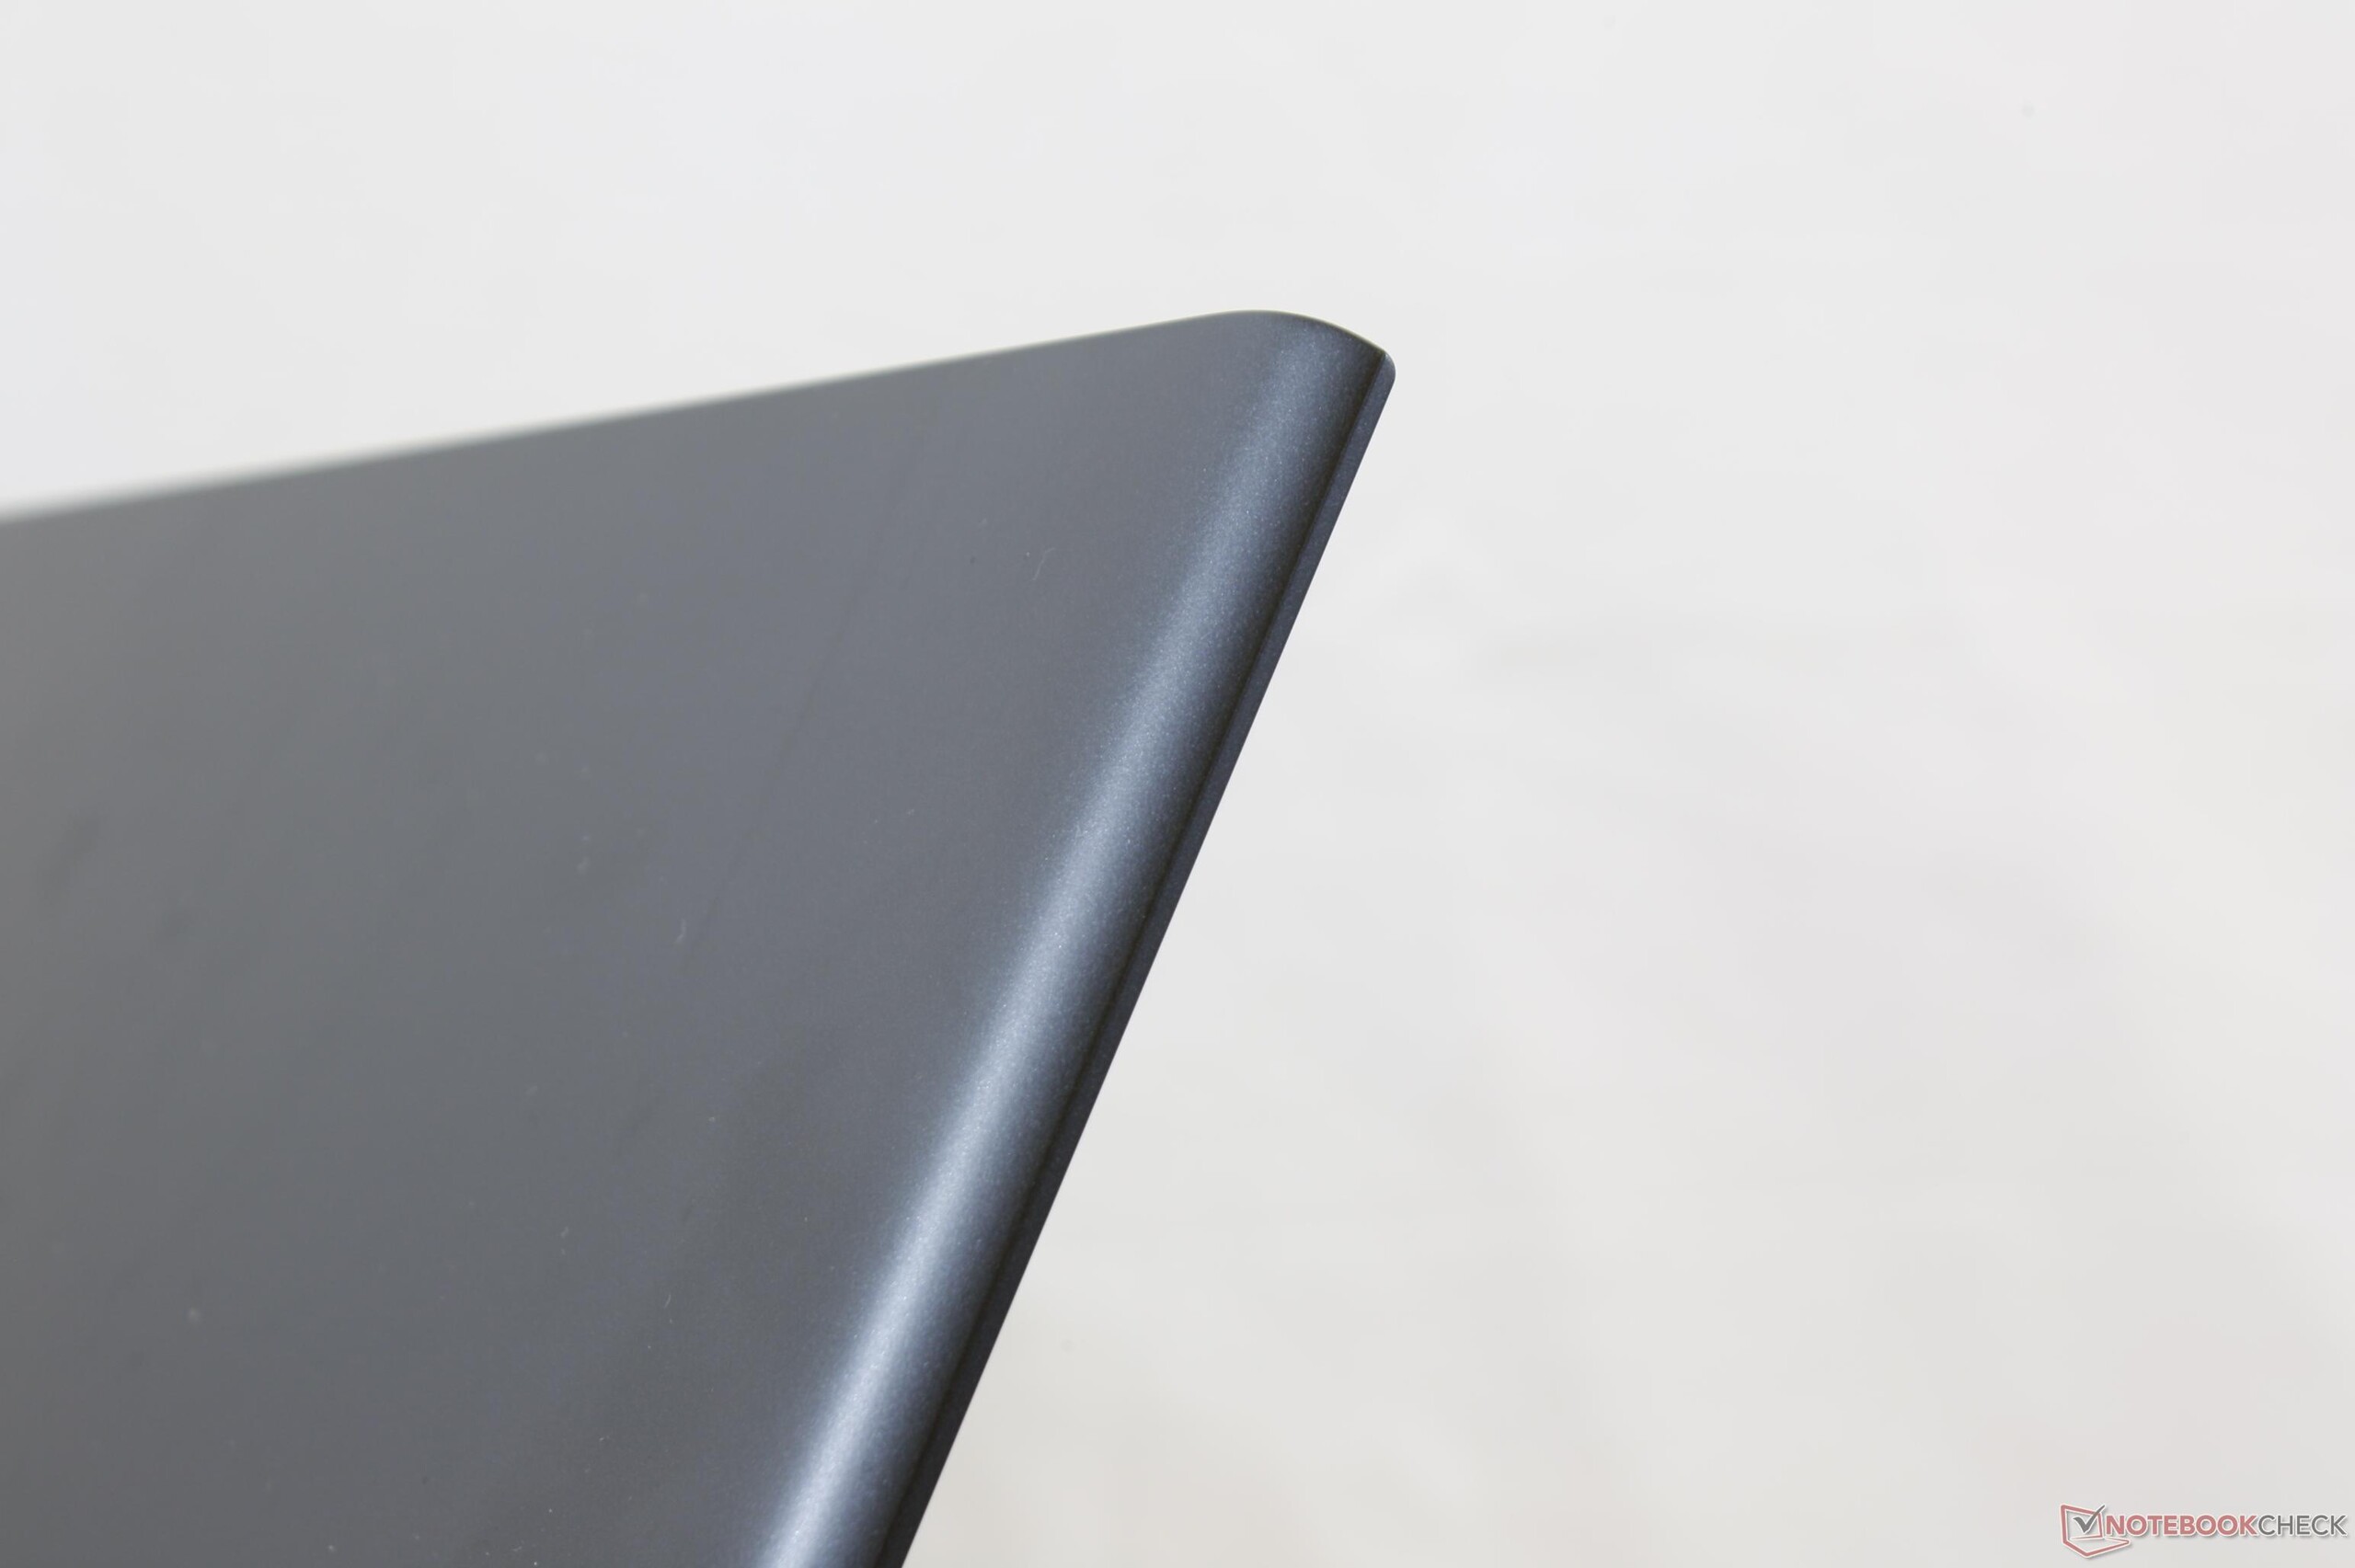
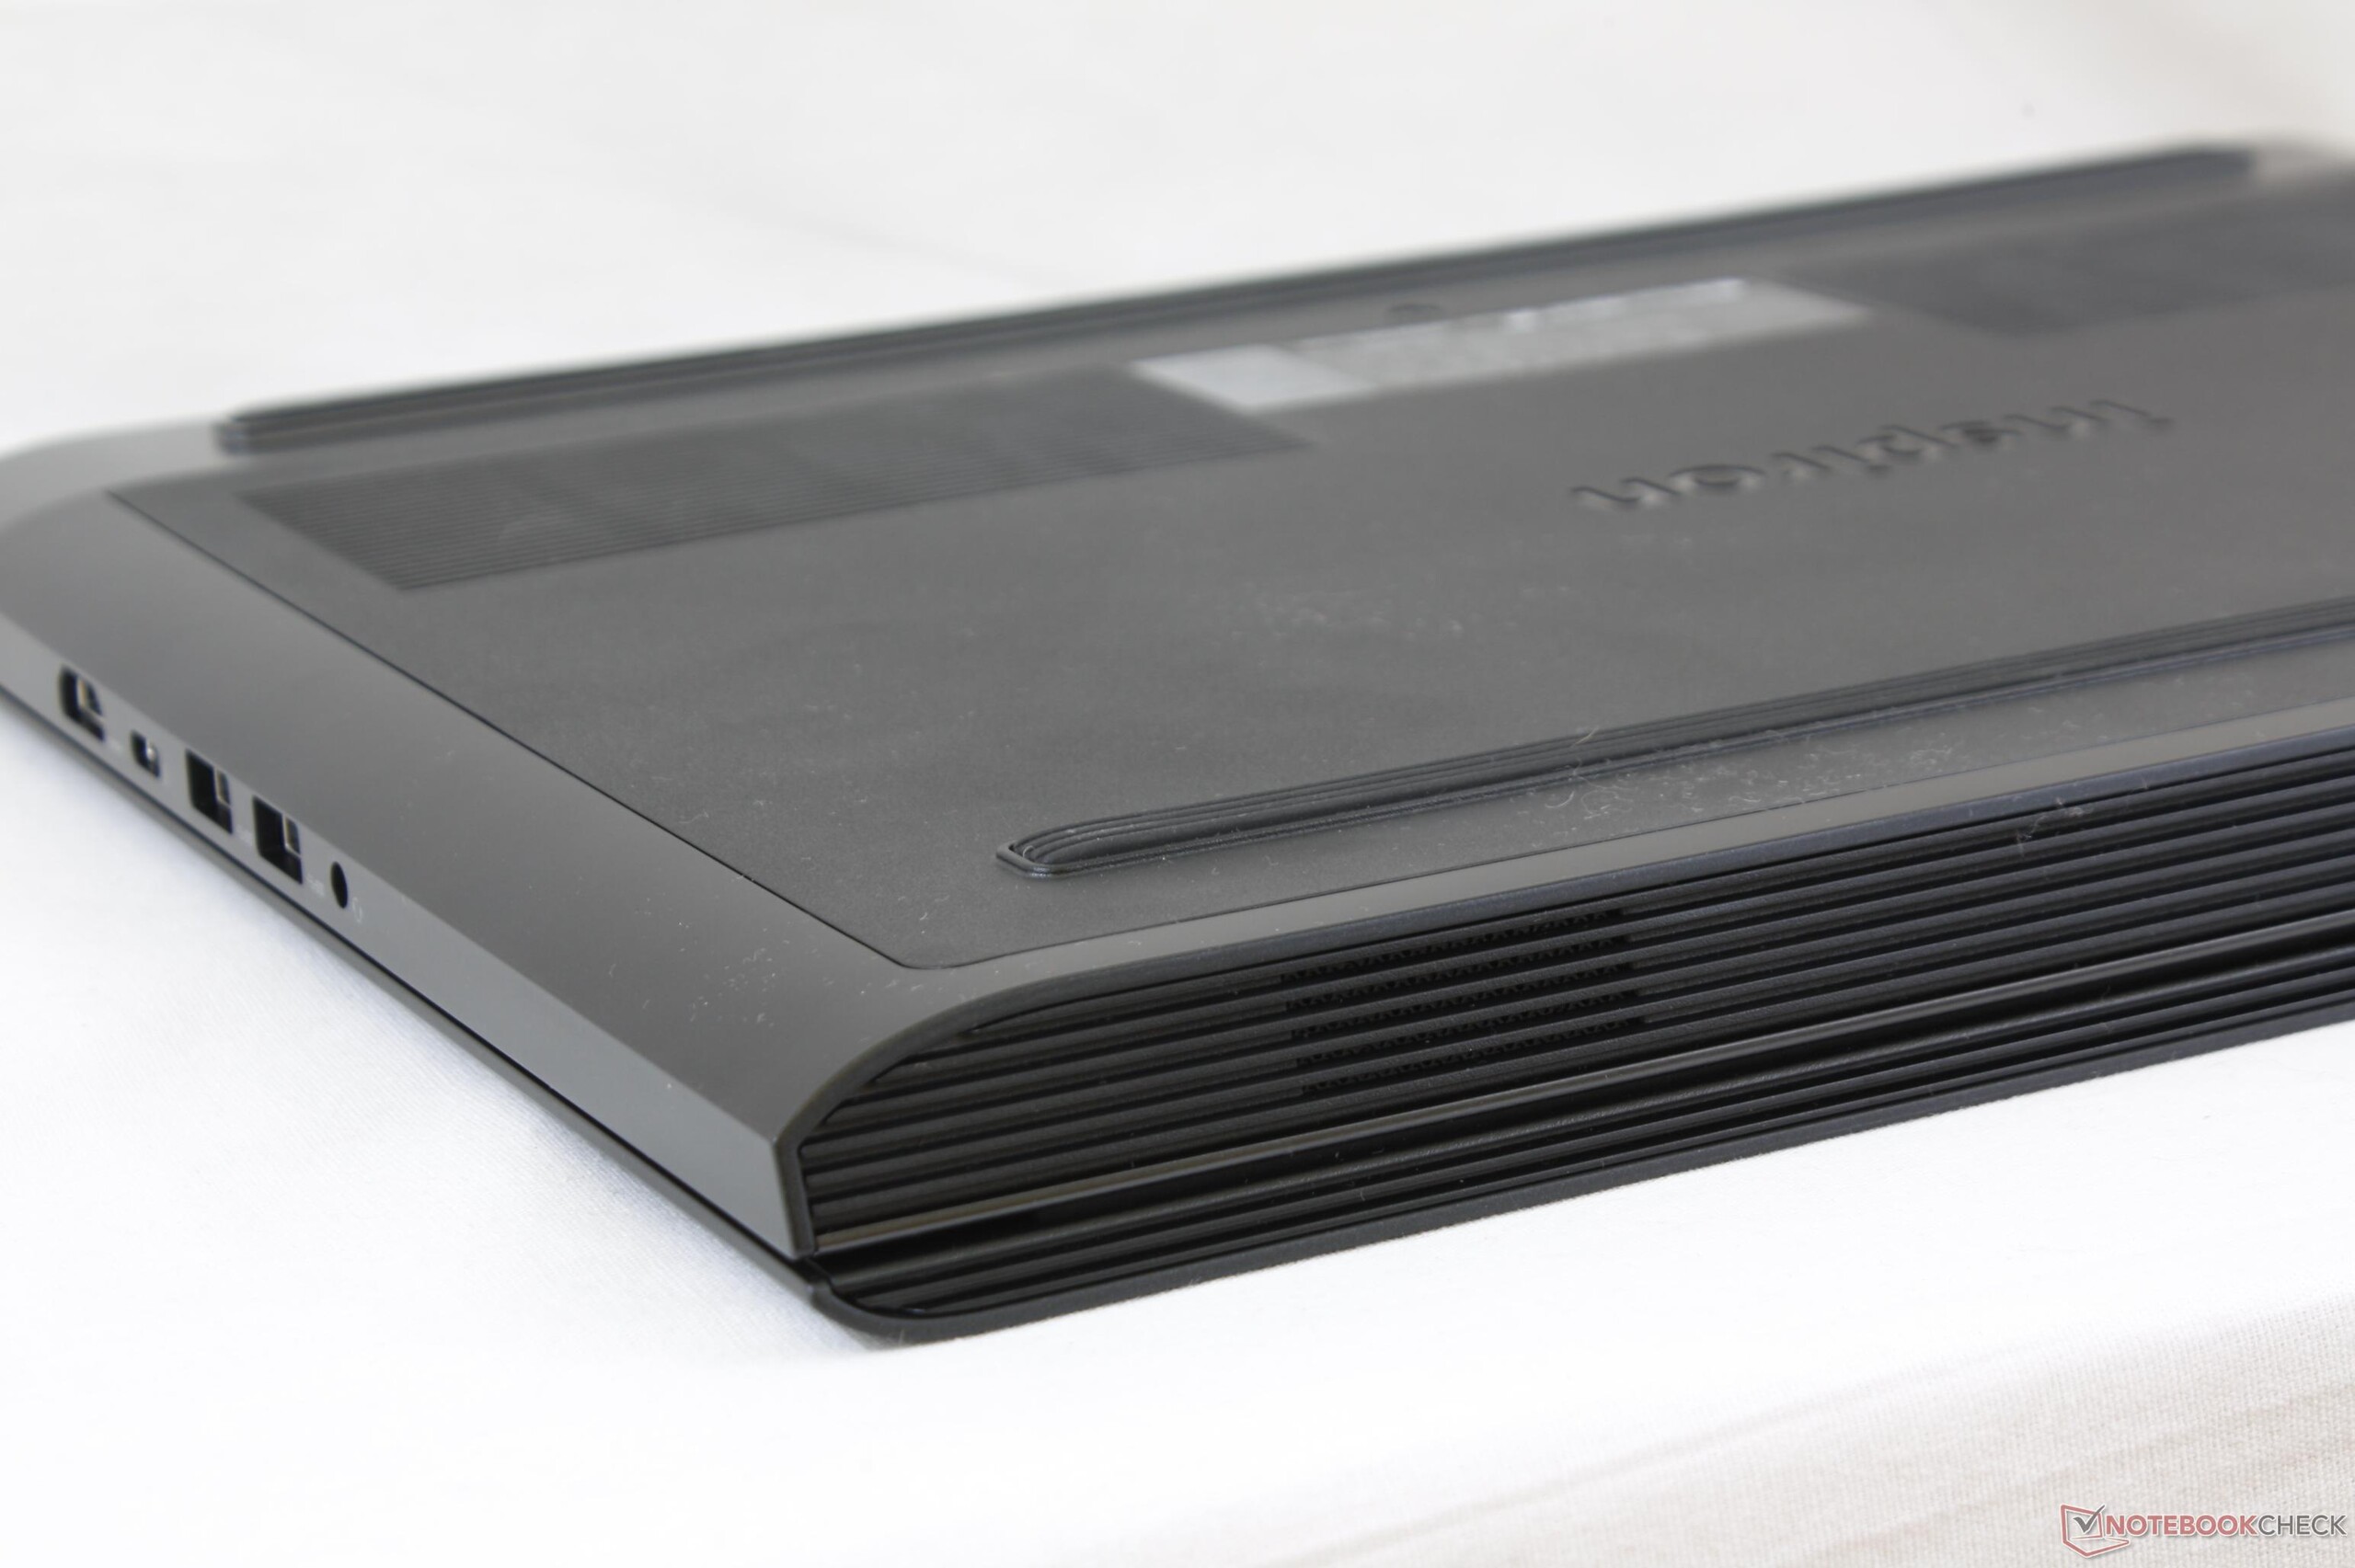
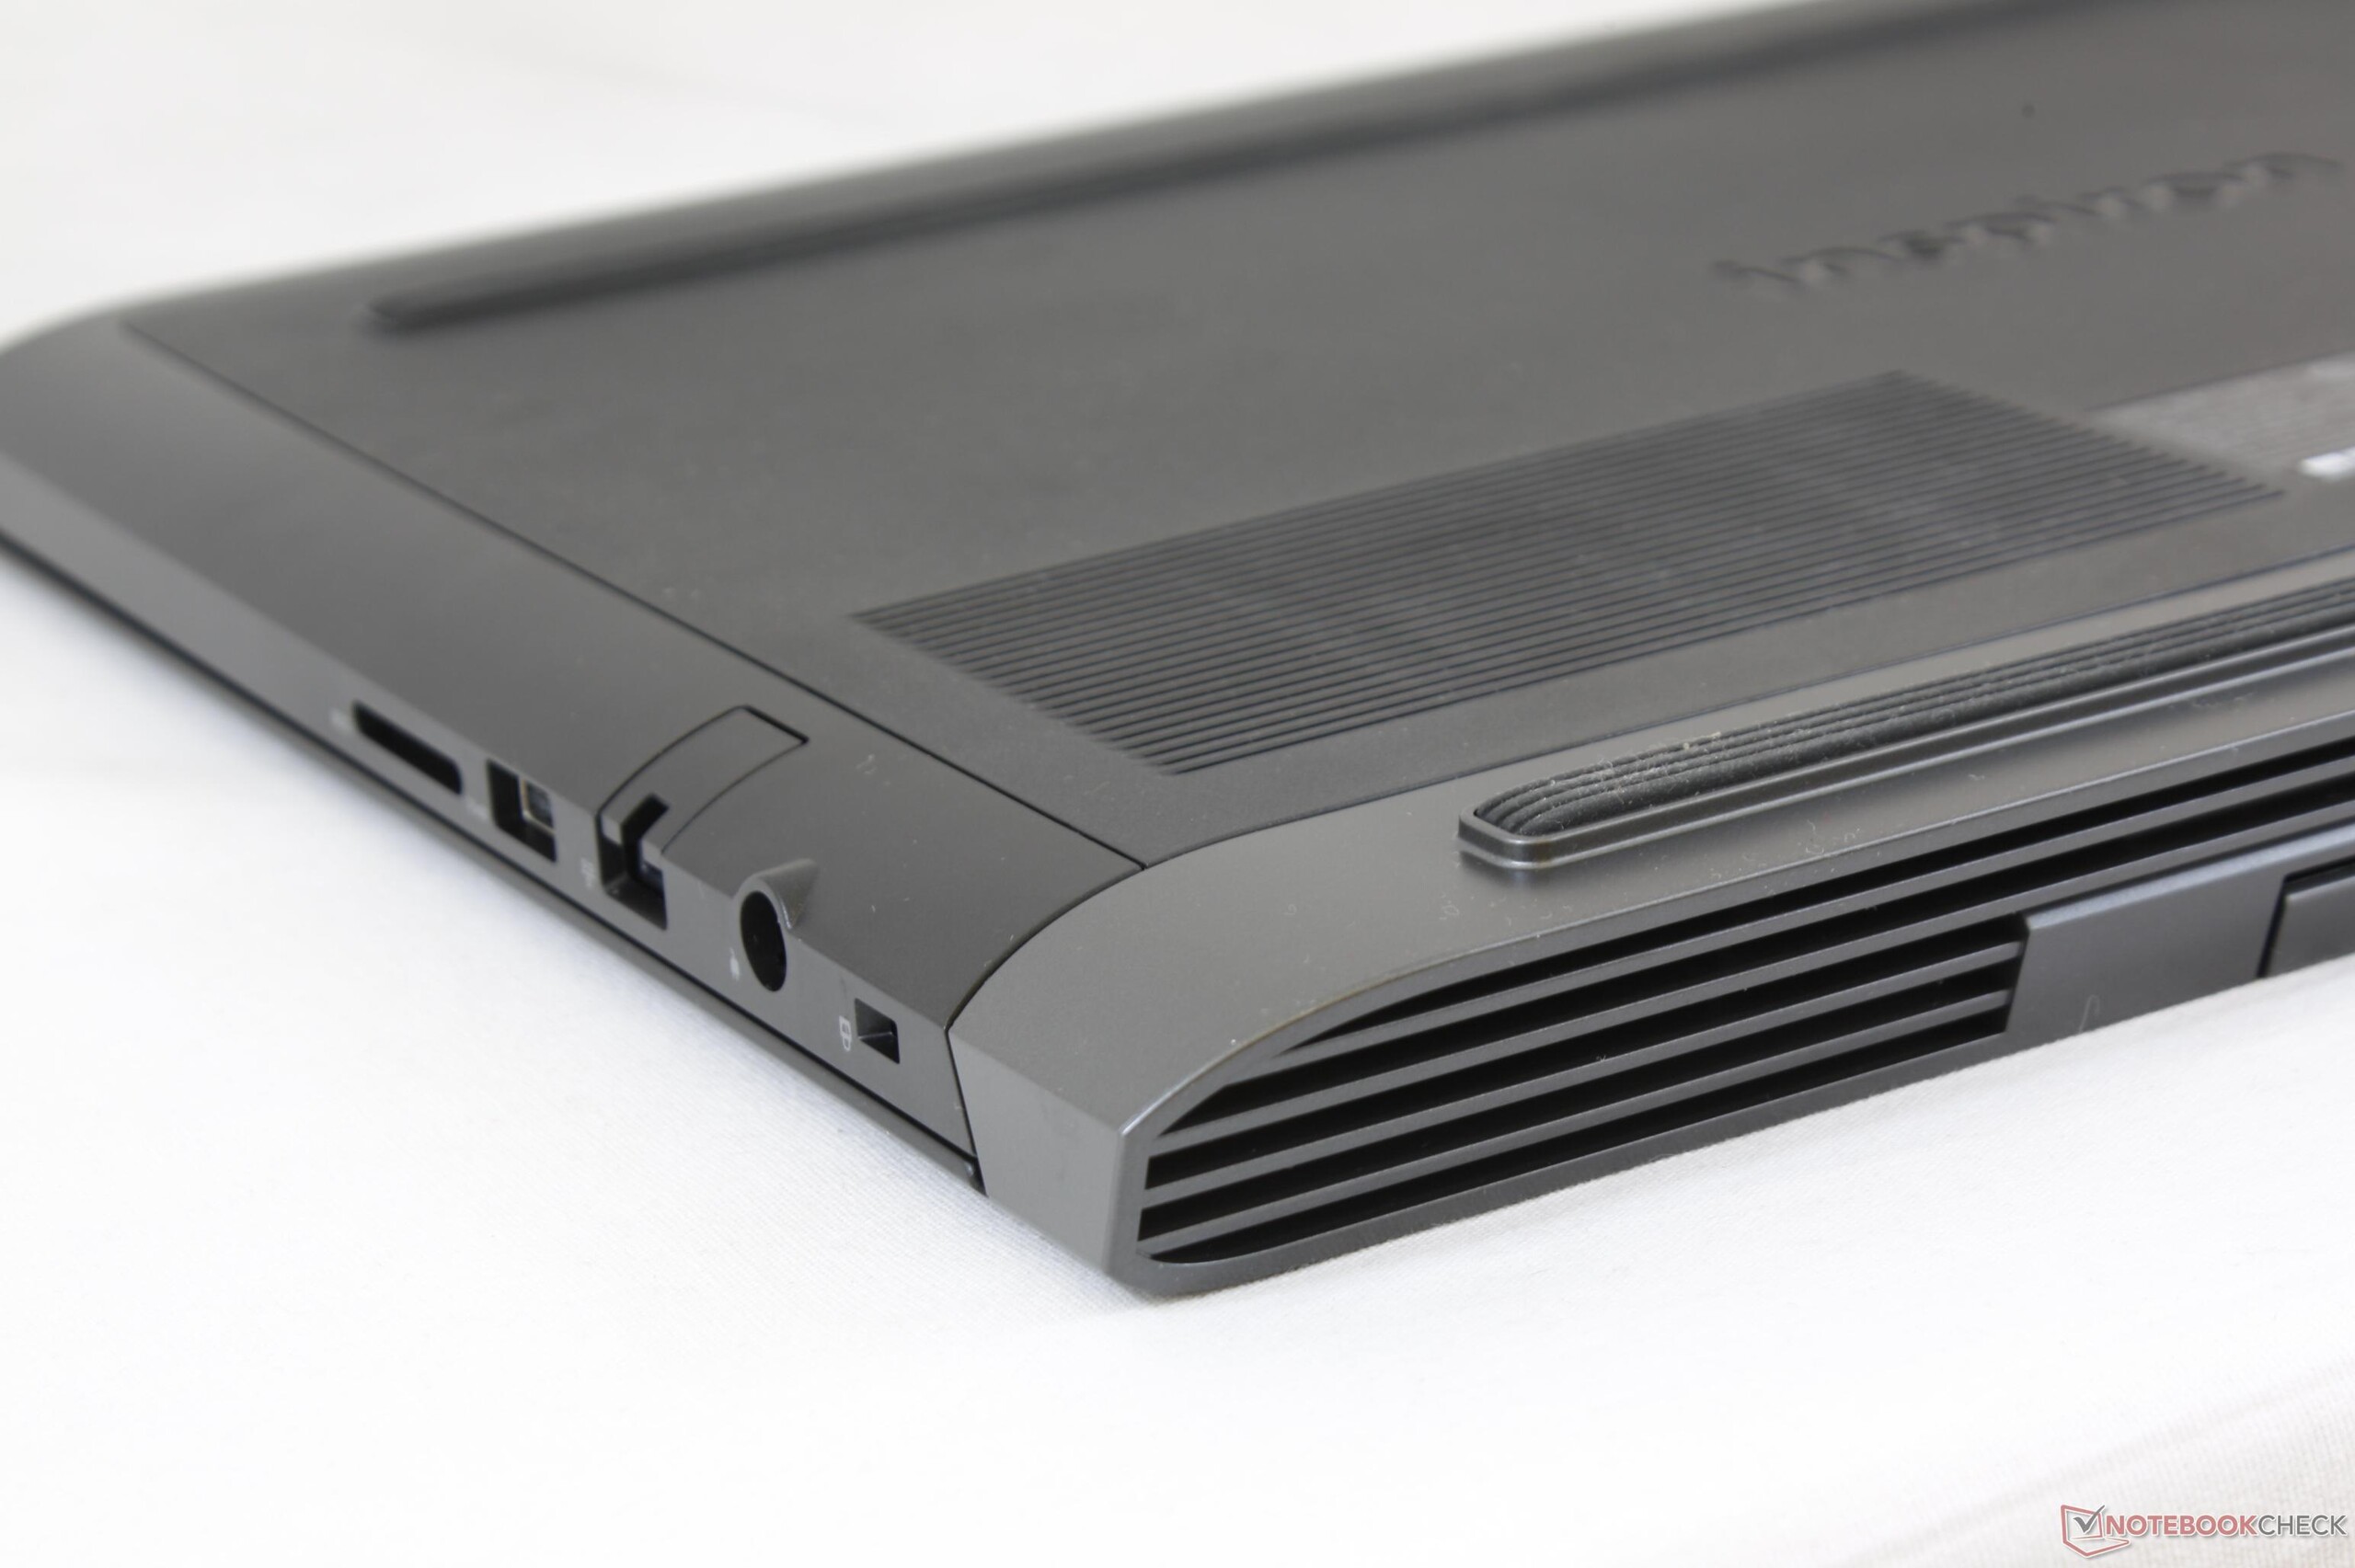
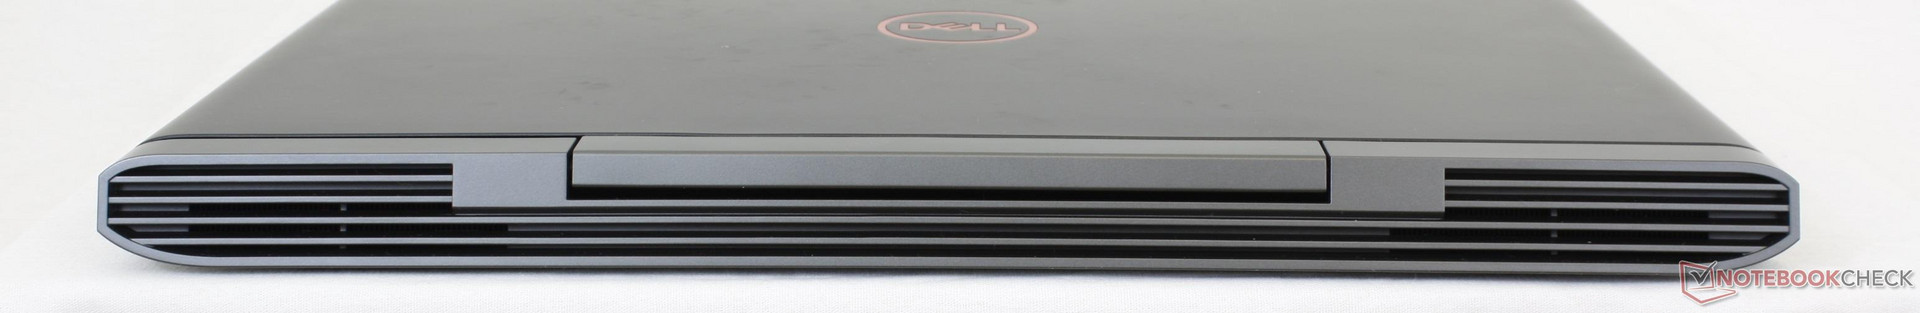
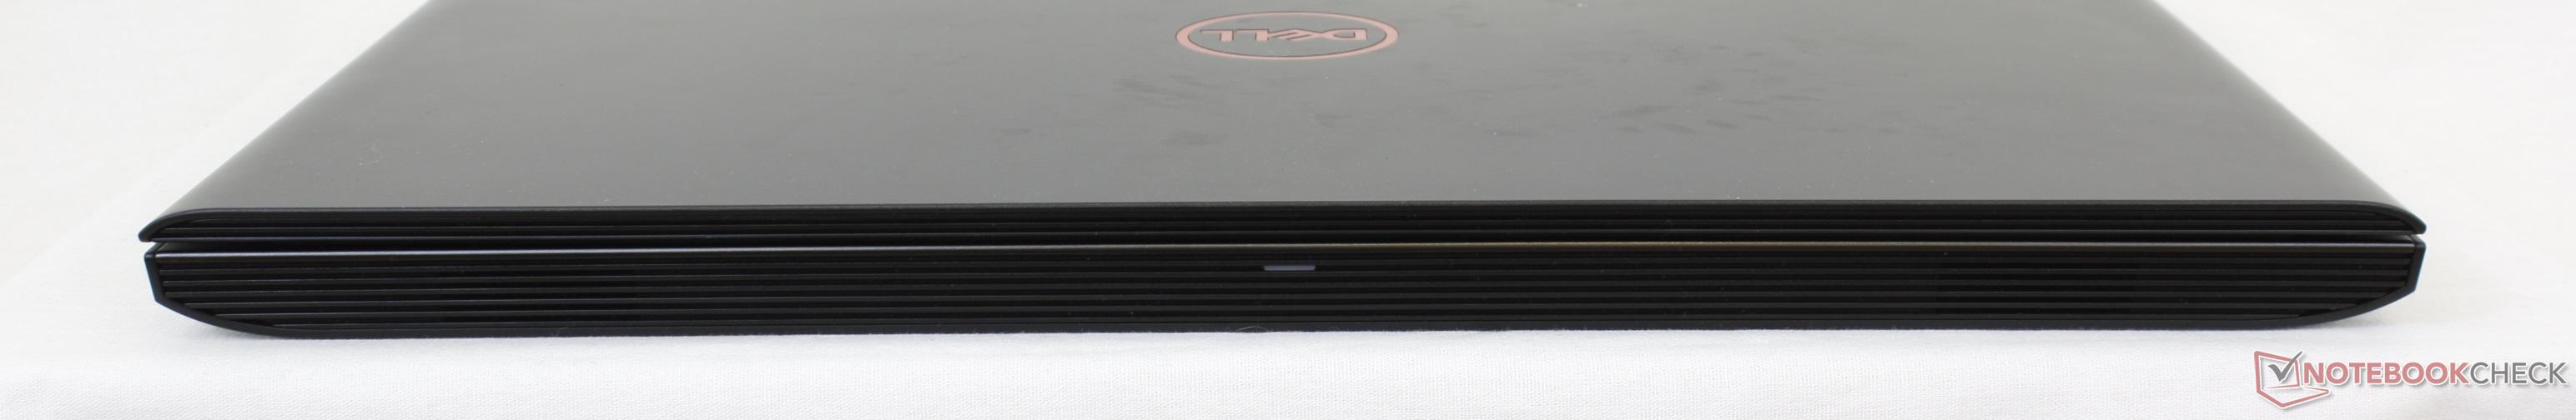
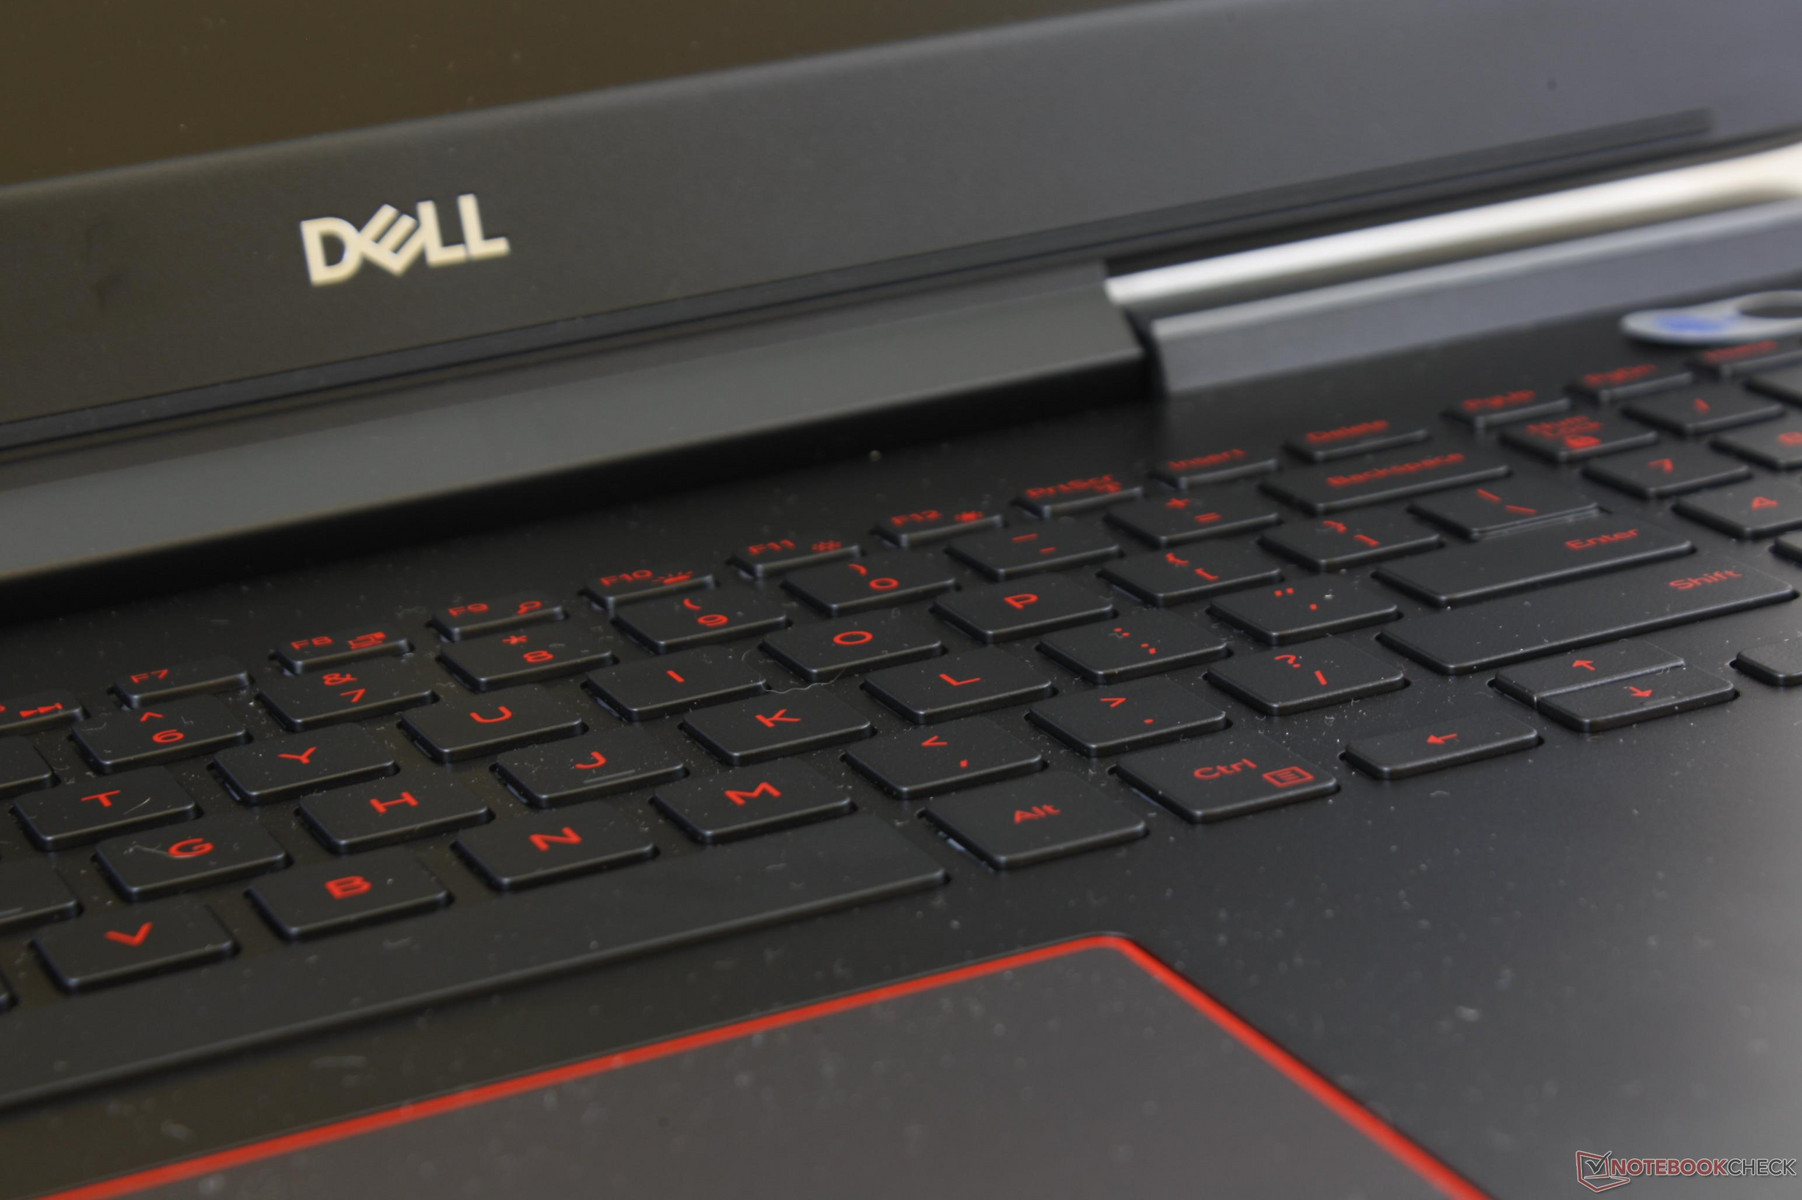
The new chassis retains the core outline of the Inspiron 7567. For example, the tapered front and back edges remain while the tacky red grilles are now gone for more neutral gray-colored grilles. Visually, the changes make the notebook stand out in the ever-growing crowd of budget gaming notebooks even if users may not like the Ruffles-inspired grilles. The dark gray magnesium alloy surfaces are smooth and uniform from top to bottom and will attract fingerprints just as well as on the Inspiron 7567. The front corners of the notebook are unfortunately still quite sharp to the touch compared to the rounded corners of most other notebooks.
Looks aside, build quality is excellent around the base. The center of the keyboard remains absolutely rigid when applying pressure and side-to-side twisting is nigh impossible unless if twisting vigorously. There is almost no creaking and gaps between materials are even throughout. The Inspiron 7577 is certainly one of the stronger gaming notebooks available in its price category.
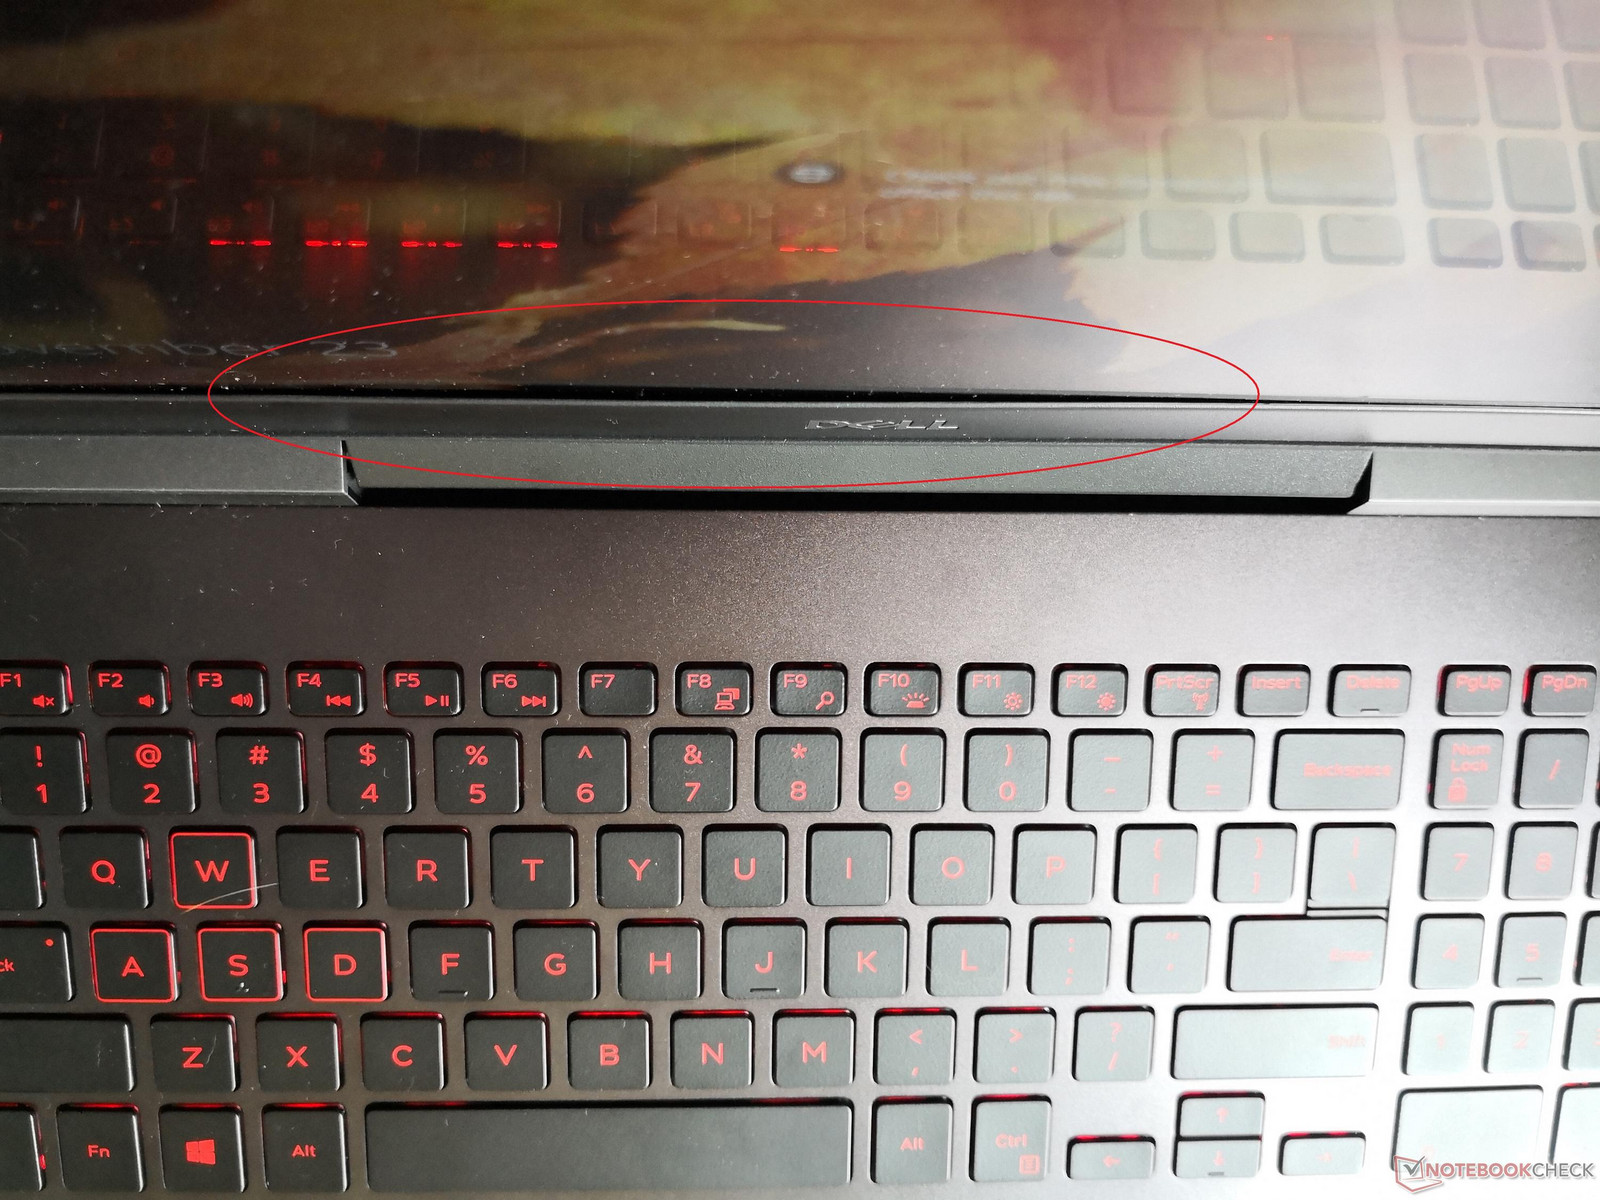
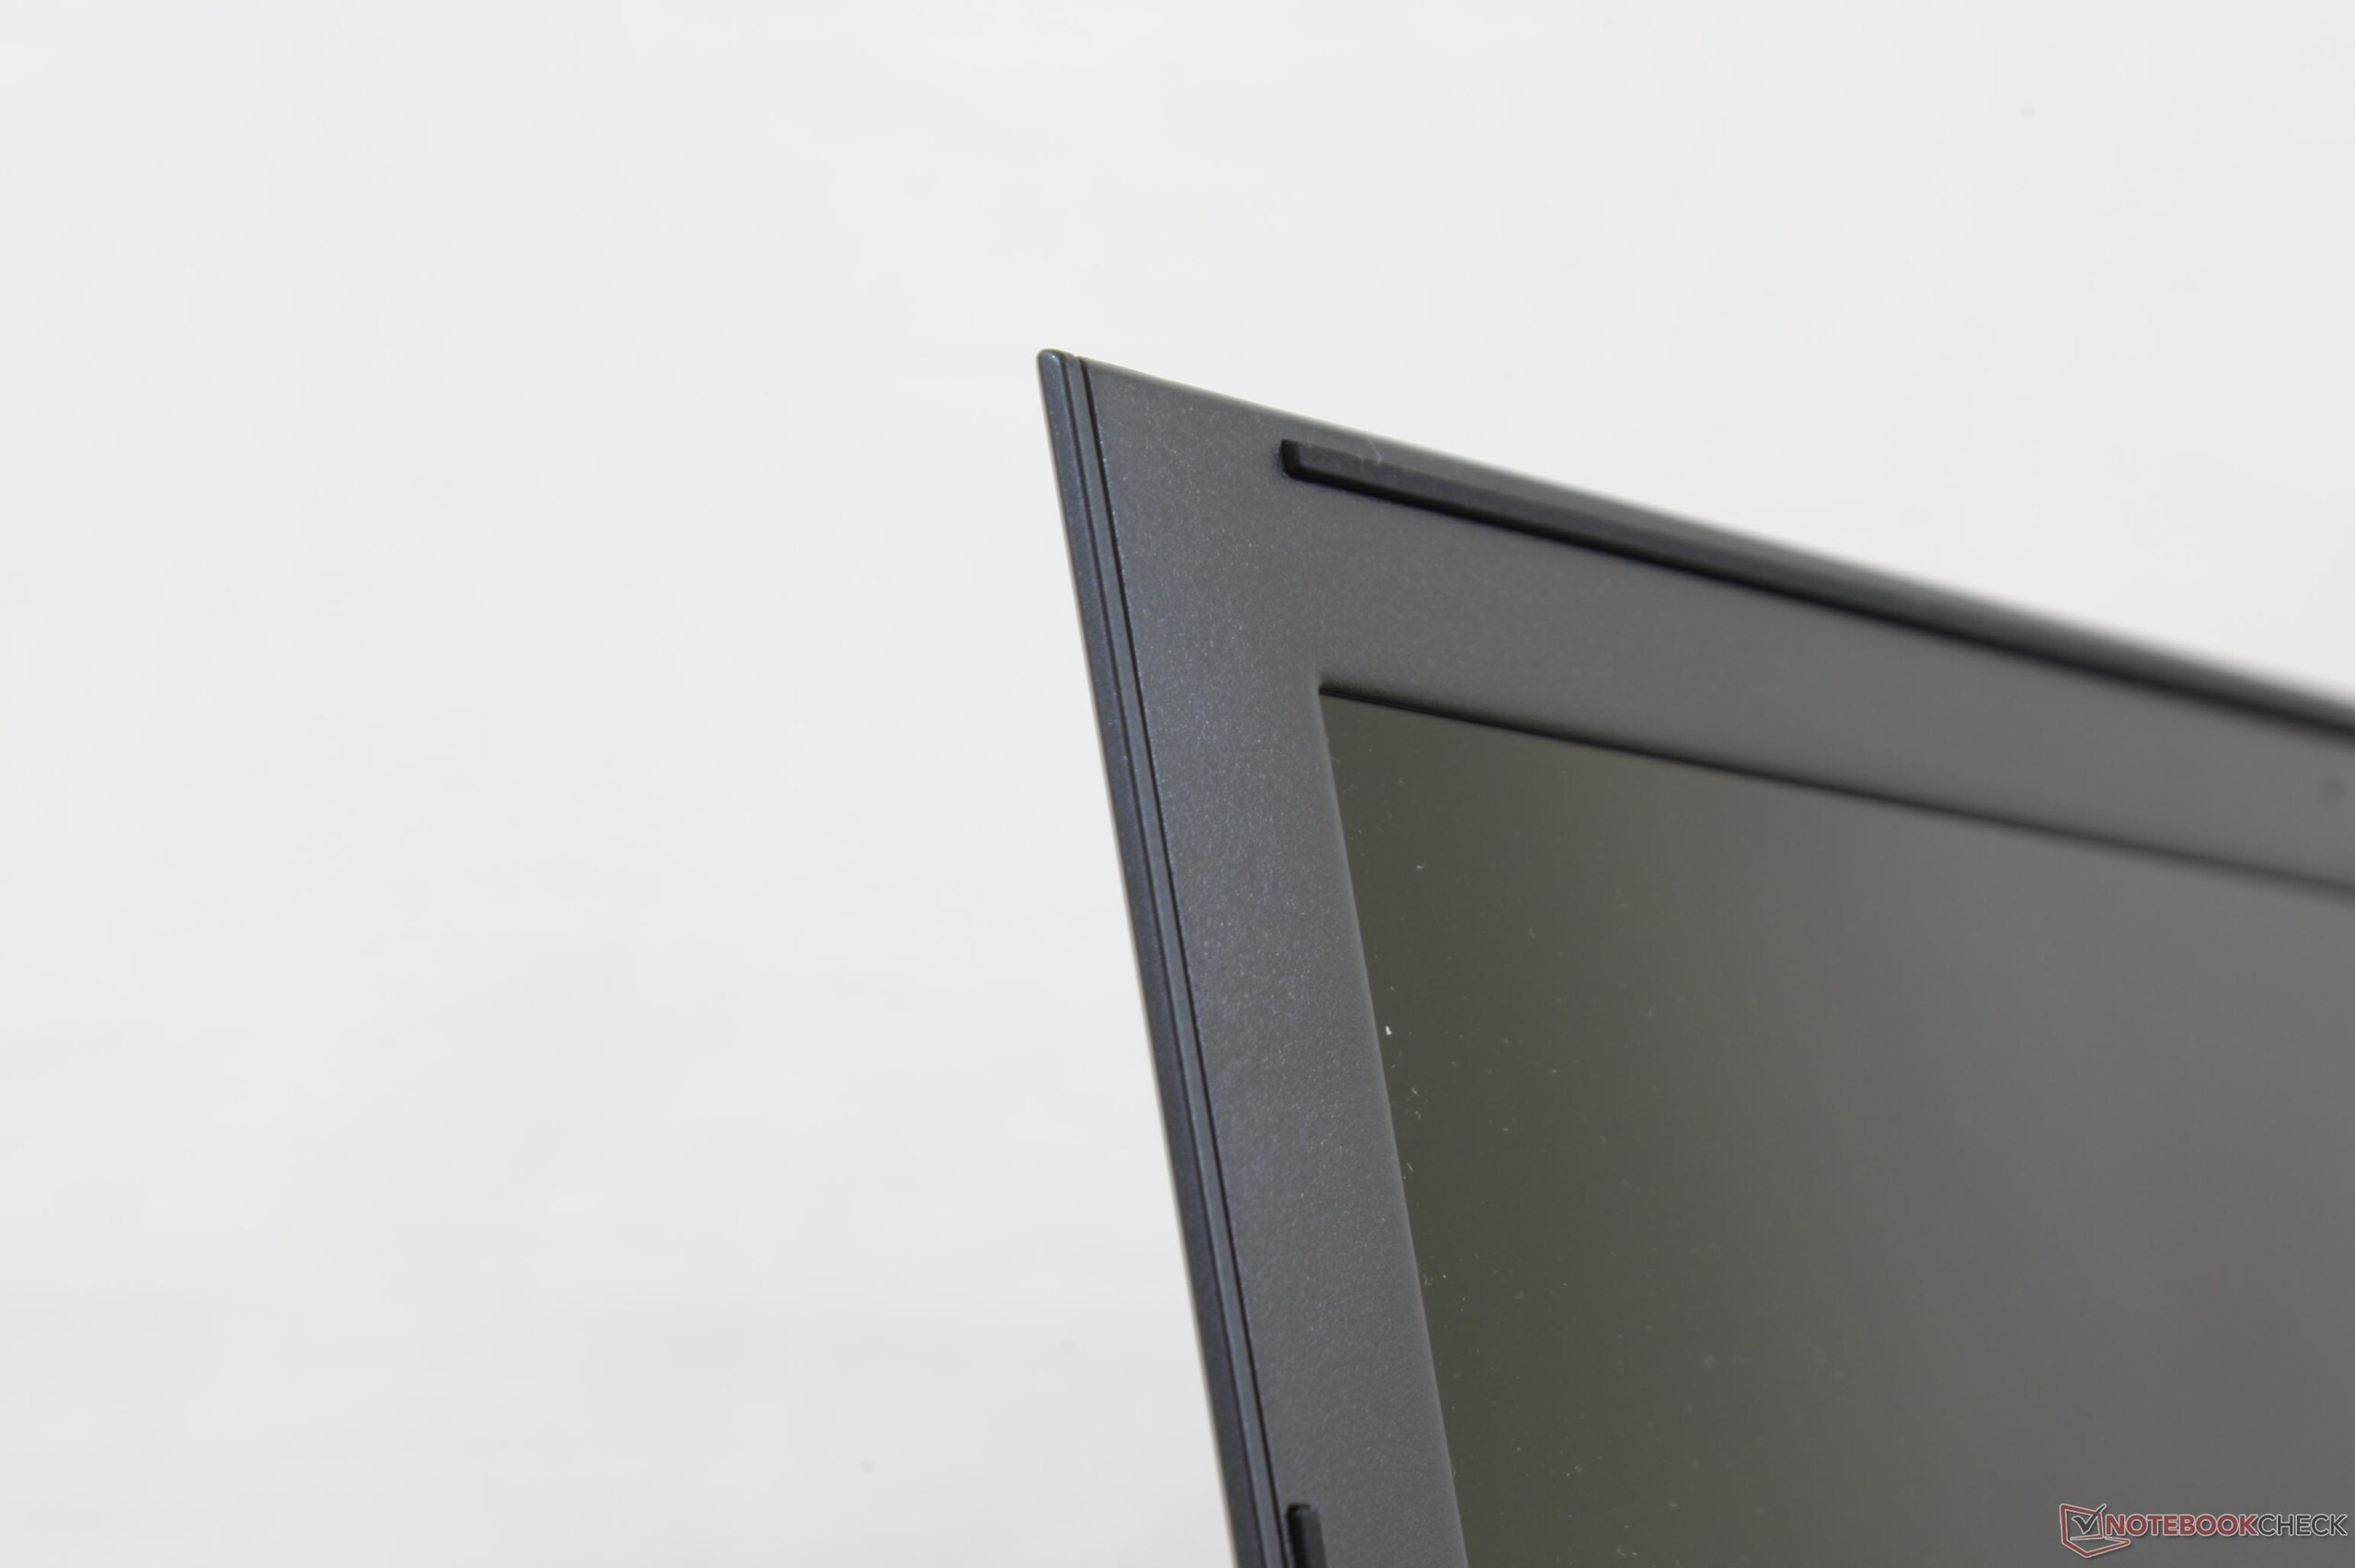
Where the system falters is on its display as costlier Dell systems like the XPS 15 and Alienware 15 series have the advantage in terms of rigidity and quality. The lid of the Inspiron 7577 exhibits more creaking when opening and closing than do most other gaming notebooks and is more susceptible to side-to-side twisting as well. The center of the outer lid warps slightly to pressure and the inner bezel is not perfectly aligned to the edge of the screen on our unit as shown by the image to the right. If there's one area to improve upon for future revisions, then it would definitely be the display. The single-bar hinge is otherwise evenly firm up to its maximum of 140 degrees with no teetering when typing.
The new design is ever-so-slightly thinner and smaller than the outgoing Inspiron 7567, but the changes in dimensions are so minimal that they are essentially irrelevant to making the system any more portable in practice. As shown by our comparison chart below, the Dell is still very nearly the same size as many of its closest competitors and is slightly heavier than them as well. Users who want a more travel-friendly gaming notebook may want to consider the thinner MSI GS63VR or the lighter Asus GL503VD.
Connectivity
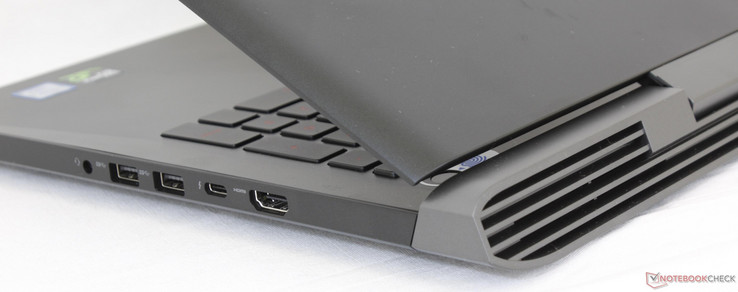
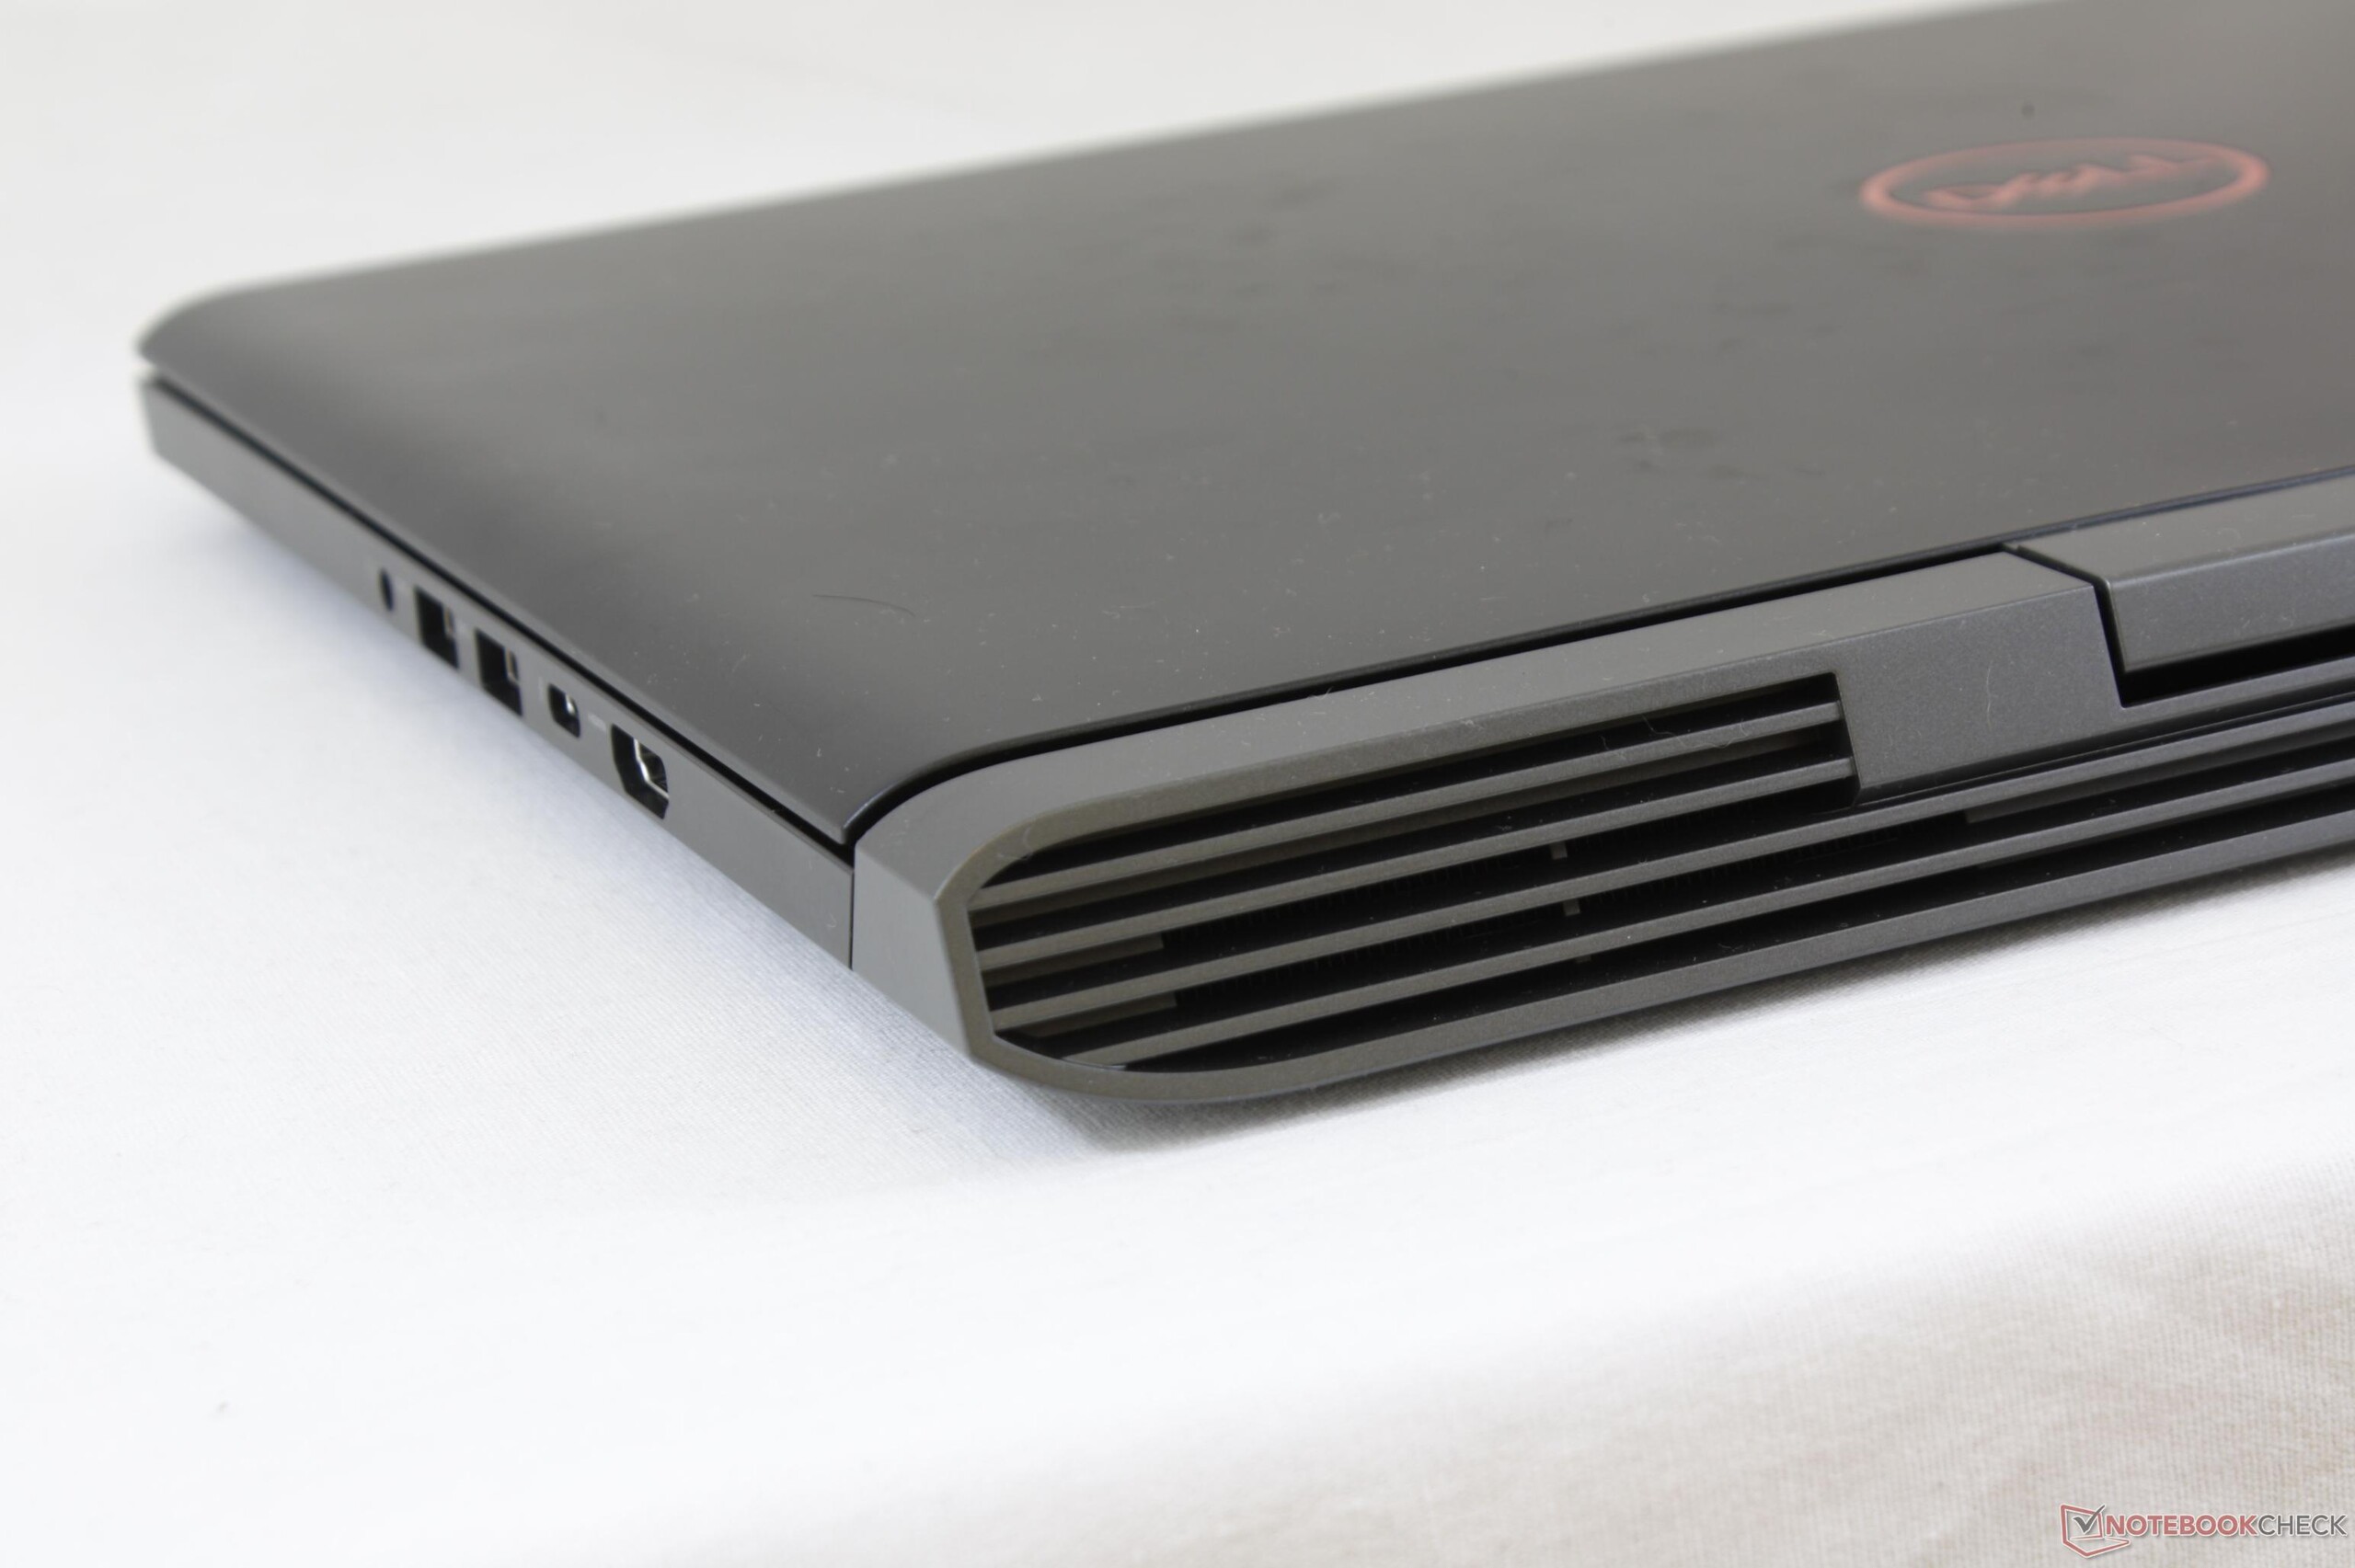
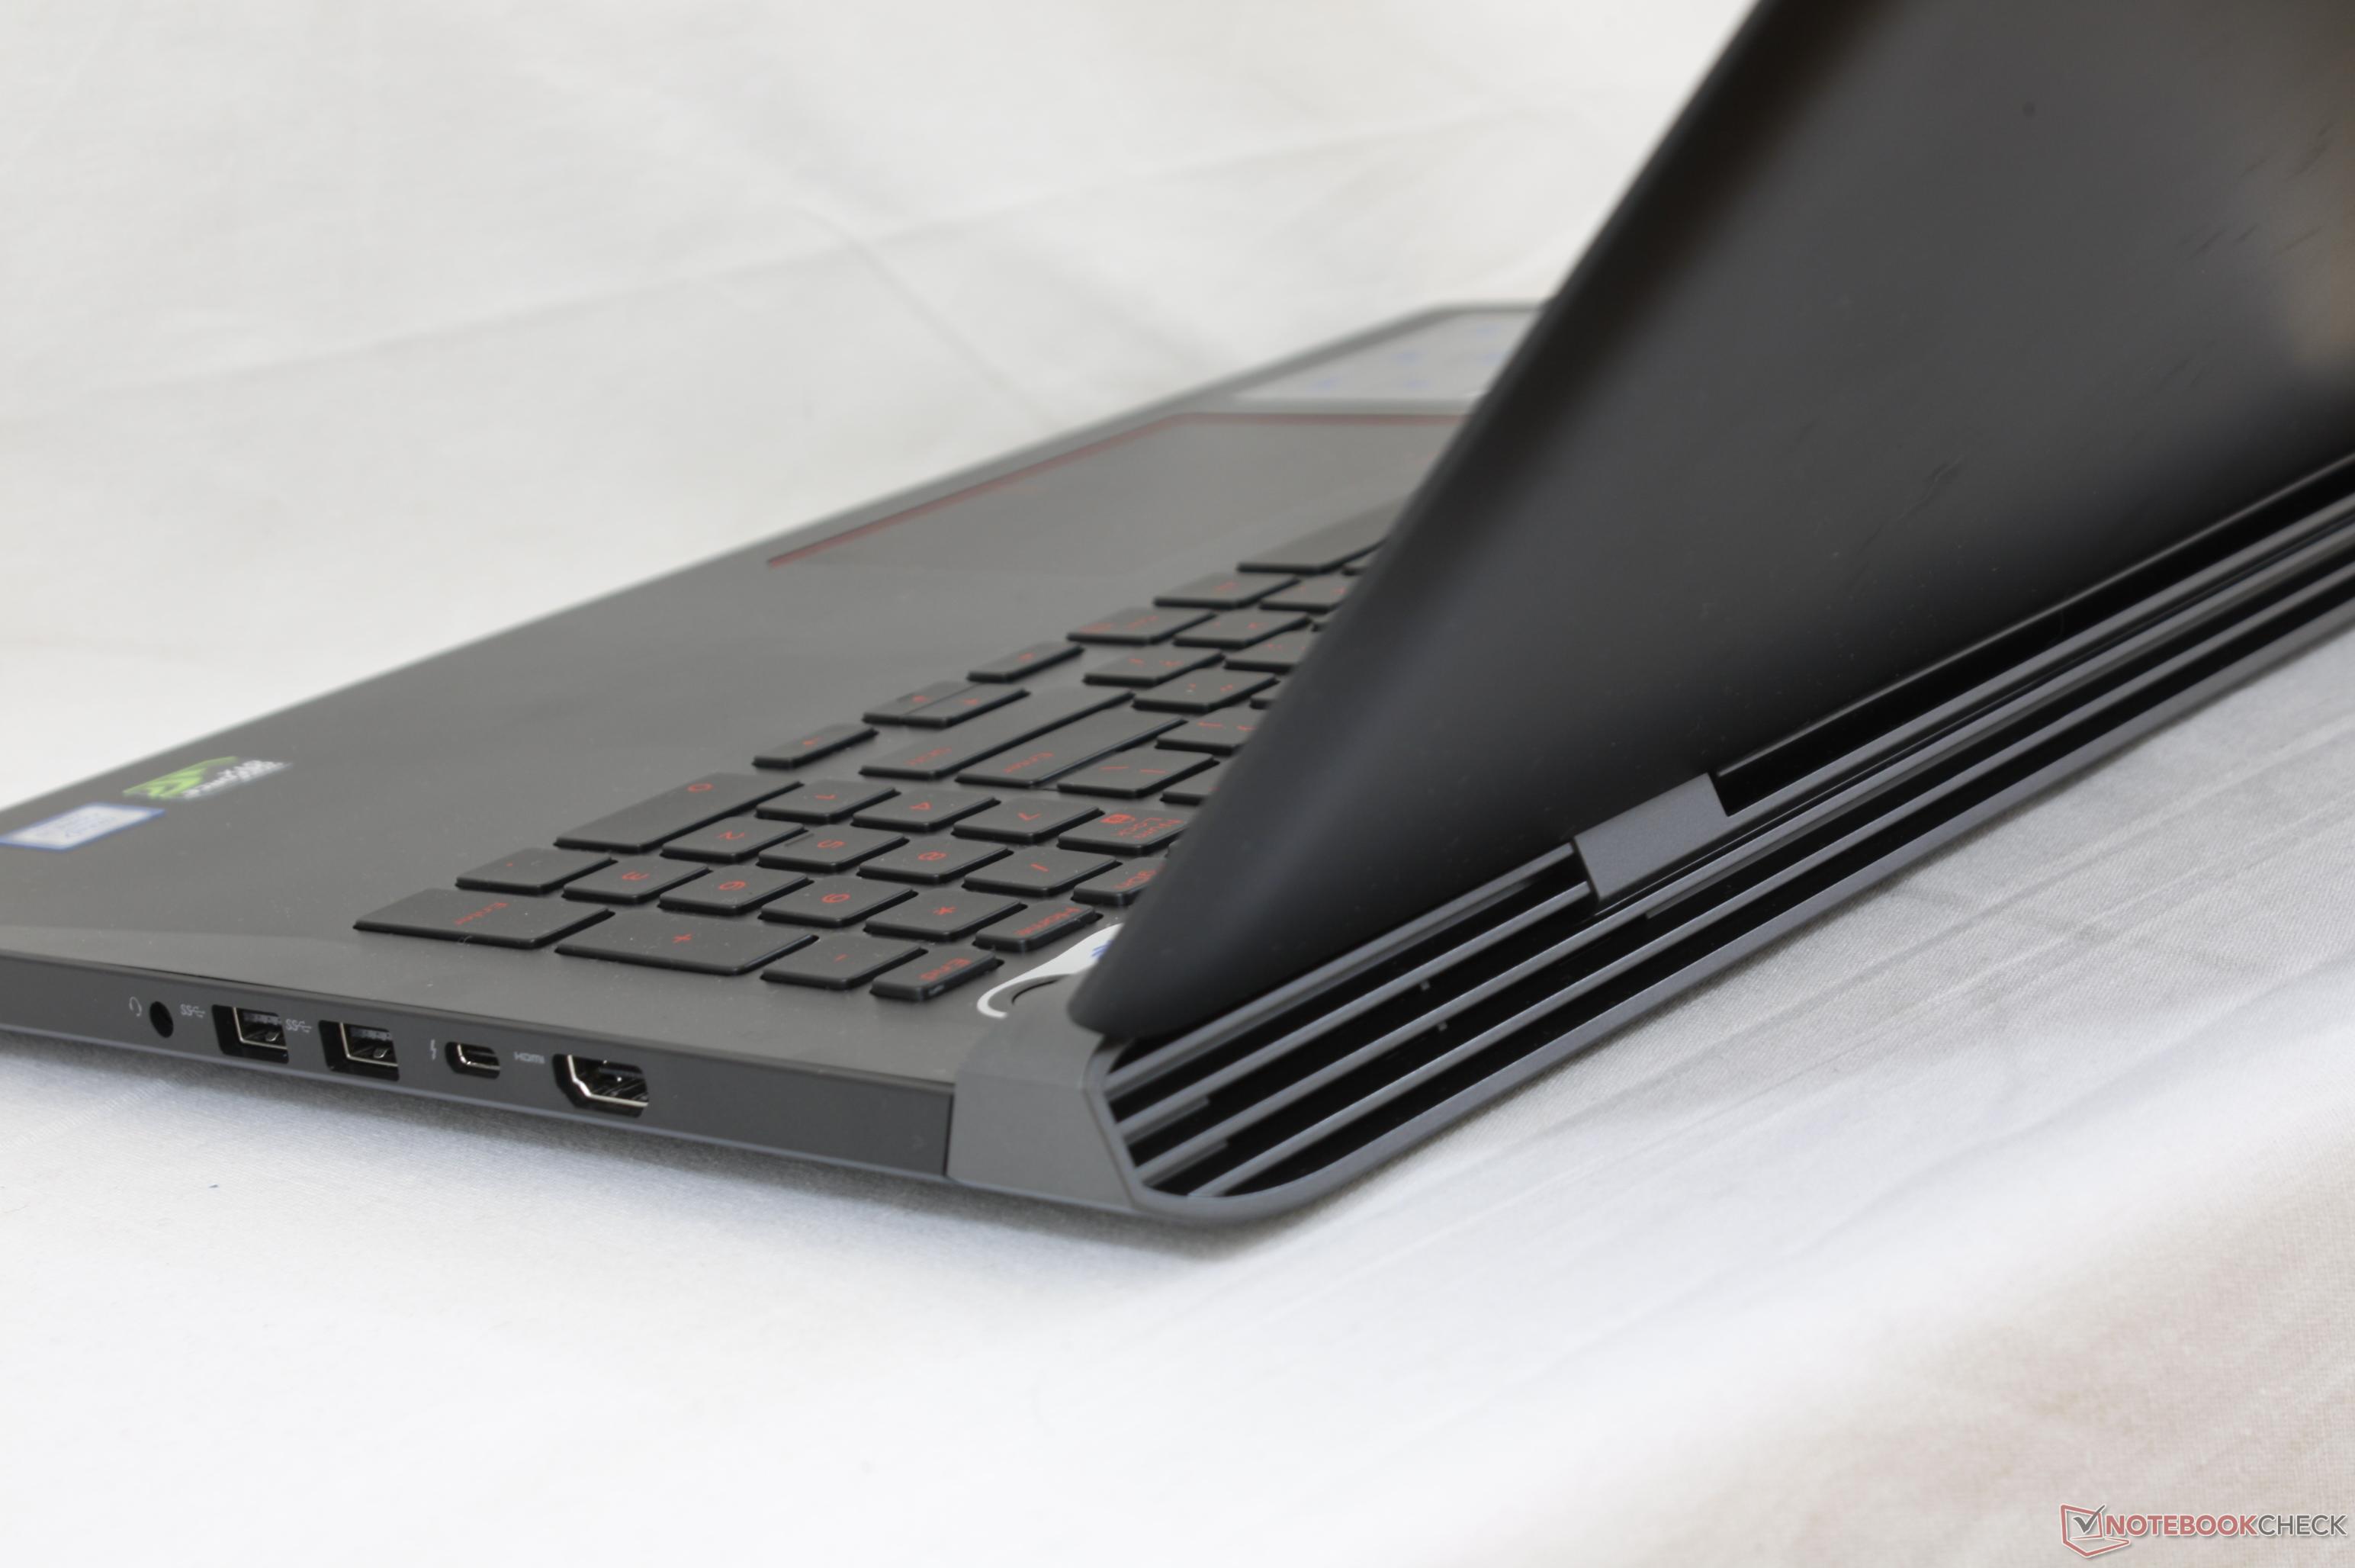
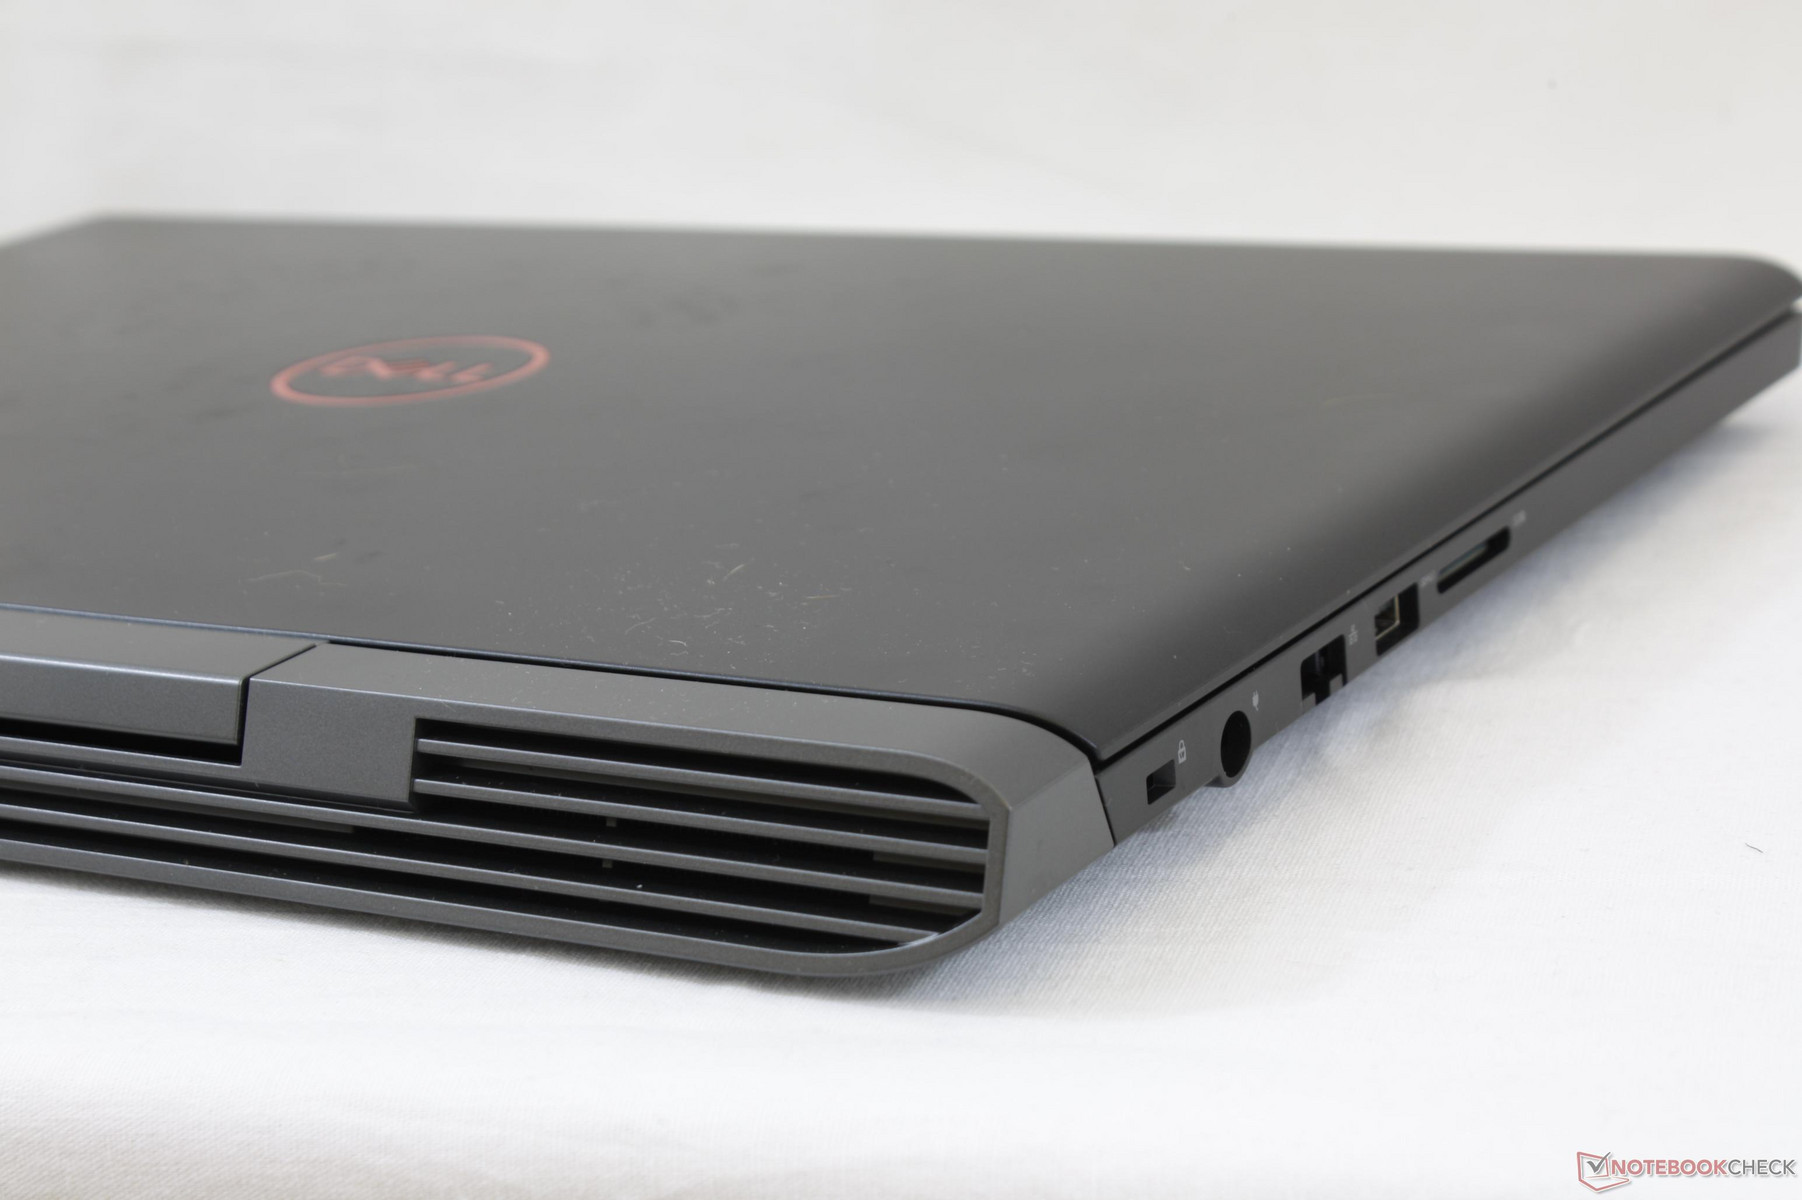
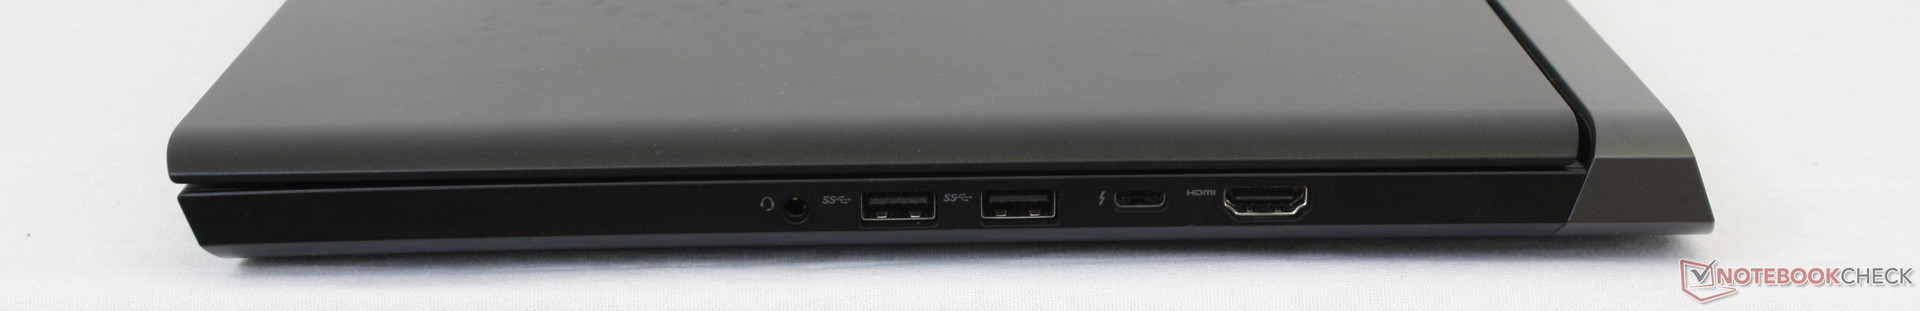
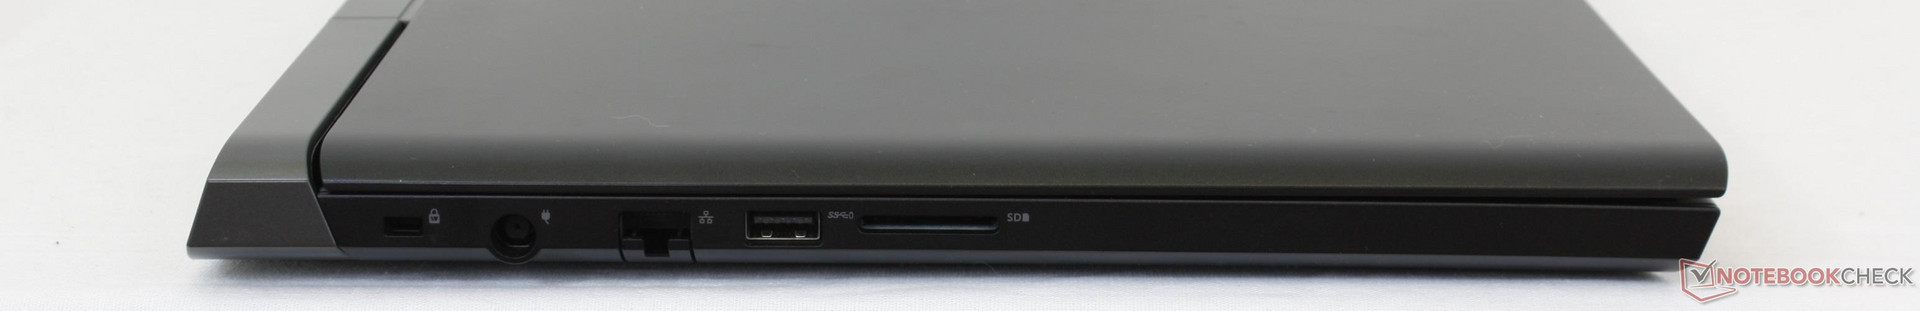
The most important update in terms of connectivity is the addition of Thunderbolt 3. In comparison, systems in this category like the Sabre 15 include USB Type-C with no Thunderbolt 3 support while others like the Samsung Odyssey omit USB Type-C completely. All other ports from the Inspiron 7567 have returned on the Inspiron 7577 albeit slightly rearranged.
Port positioning and spacing are perfect given what is available. All ports are on the left- and right-hand edges towards the rear of the unit with USB Type-A readily available on both sides. MSI should definitely take note as we can't say the same for the tightly-packed ports on the GS series.
SD Card Reader
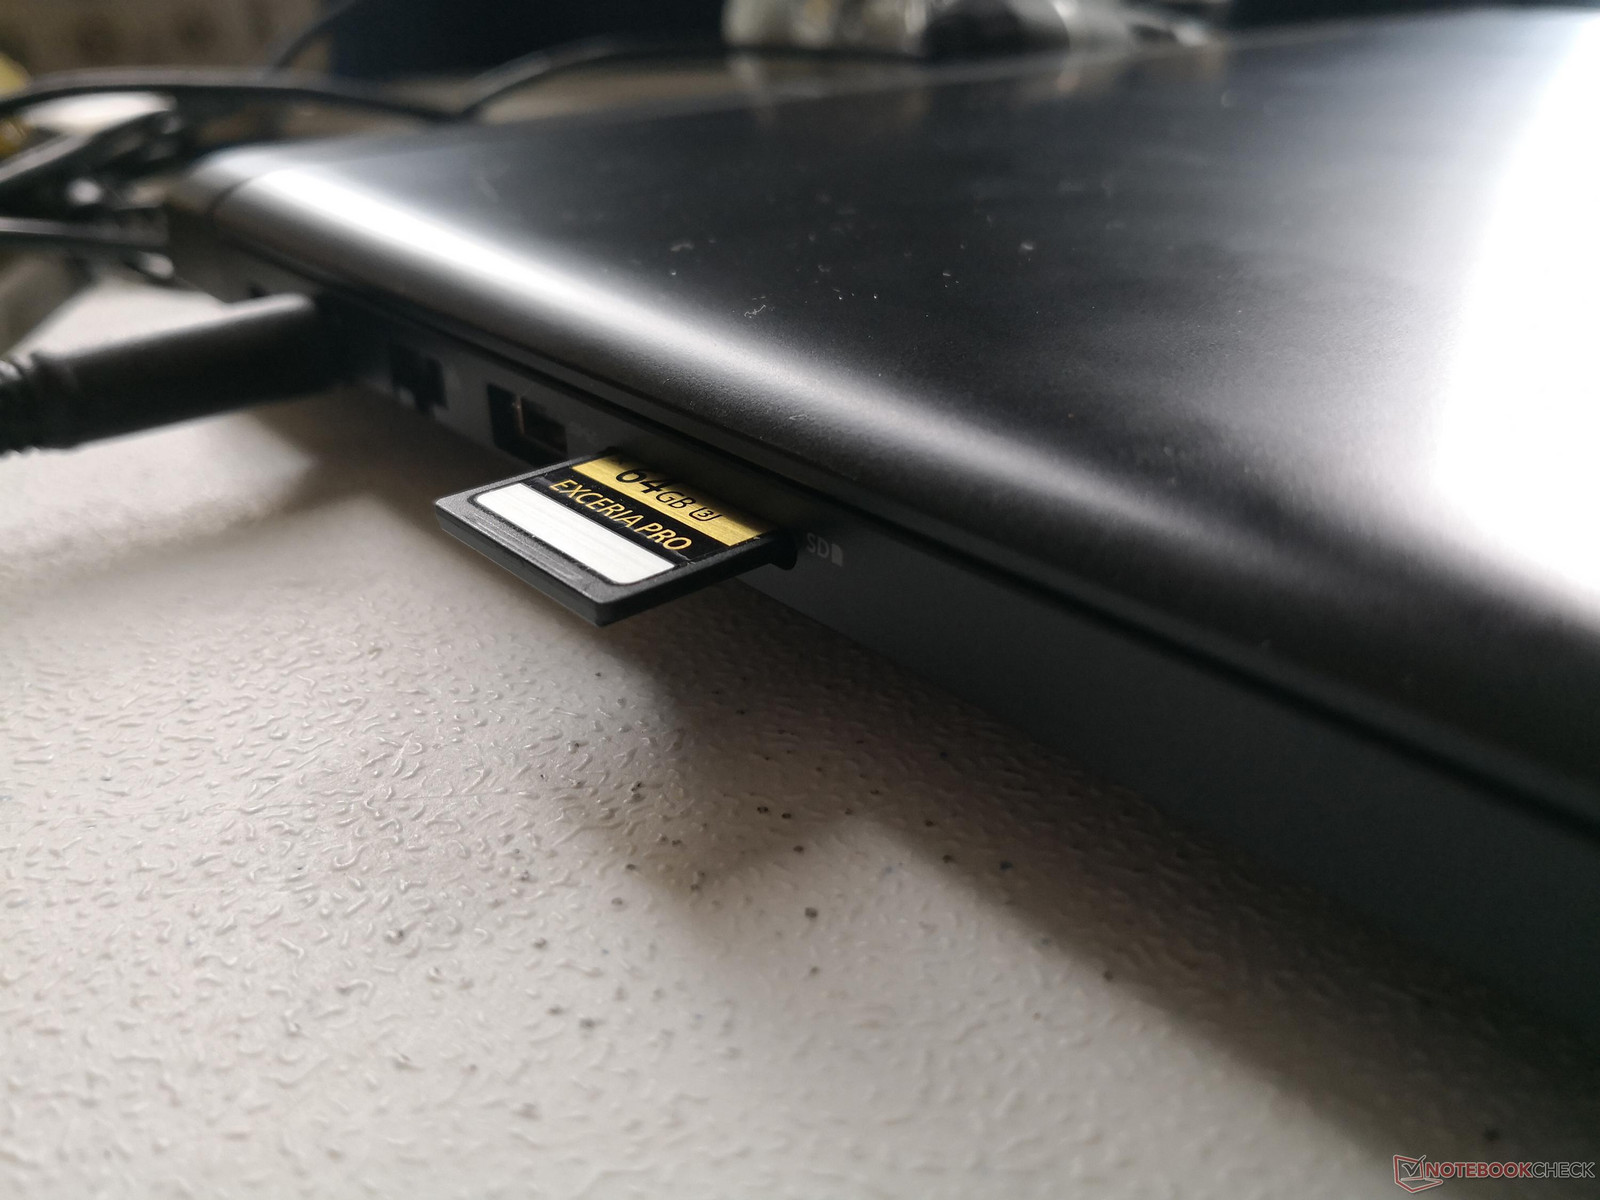
Dell has not upgraded the integrated SD card reader despite the chassis redesign. Read rates are still very slow at about 29 MB/s with our Toshiba Exceria Pro SDXC UHS-II test card whereas the card reader on the XPS 15 tops out at over 252 MB/s. Transferring 1 GB worth of images from the card to desktop will take about 38 seconds.
The card reader is not spring-loaded unlike on most other notebooks, either. A fully inserted SD card will protrude by about half its length and is thus unsafe for transport without first removing it from the notebook.
| SD Card Reader | |
| average JPG Copy Test (av. of 3 runs) | |
| Dell XPS 15 9560 (i7-7700HQ, UHD) | |
| Dell Inspiron 15 7000 7577 | |
| Dell Inspiron 15 7000 7567 | |
| maximum AS SSD Seq Read Test (1GB) | |
| Dell XPS 15 9560 (i7-7700HQ, UHD) | |
| Dell Inspiron 15 7000 7577 | |
| Dell Inspiron 15 7000 7567 | |
Communication
All SKUs come equipped with a 2x2 Intel 8265 M.2 module as the sole option. We would have liked to see the gaming-centric Killer 1535 as an upgrade since it is so prevalent on the costlier XPS series, but we suppose that Dell wants to keep it as an exclusive to the higher tier family. Average transmit and receive rates are essentially the same as on the XPS 15 9560, so Inspiron users will only be missing out on specific Killer 1535 software features.
| Networking | |
| iperf3 transmit AX12 | |
| Dell XPS 15 9560 (i7-7700HQ, UHD) | |
| Dell Inspiron 15 7000 7577 | |
| Dell Inspiron 15 7000 7567 (jseb) | |
| iperf3 receive AX12 | |
| Dell Inspiron 15 7000 7577 | |
| Dell XPS 15 9560 (i7-7700HQ, UHD) | |
| Dell Inspiron 15 7000 7567 (jseb) | |
Accessories
There are no included extras outside of the AC adapter and small Quick Start guide. Even a cleaning cloth would have been a nice addition for wiping off the inevitable grime on the matte surfaces of the notebook. Optional accessories like the Dell DA200 or other USB-based docking stations can make use of the new Thunderbolt 3 port.
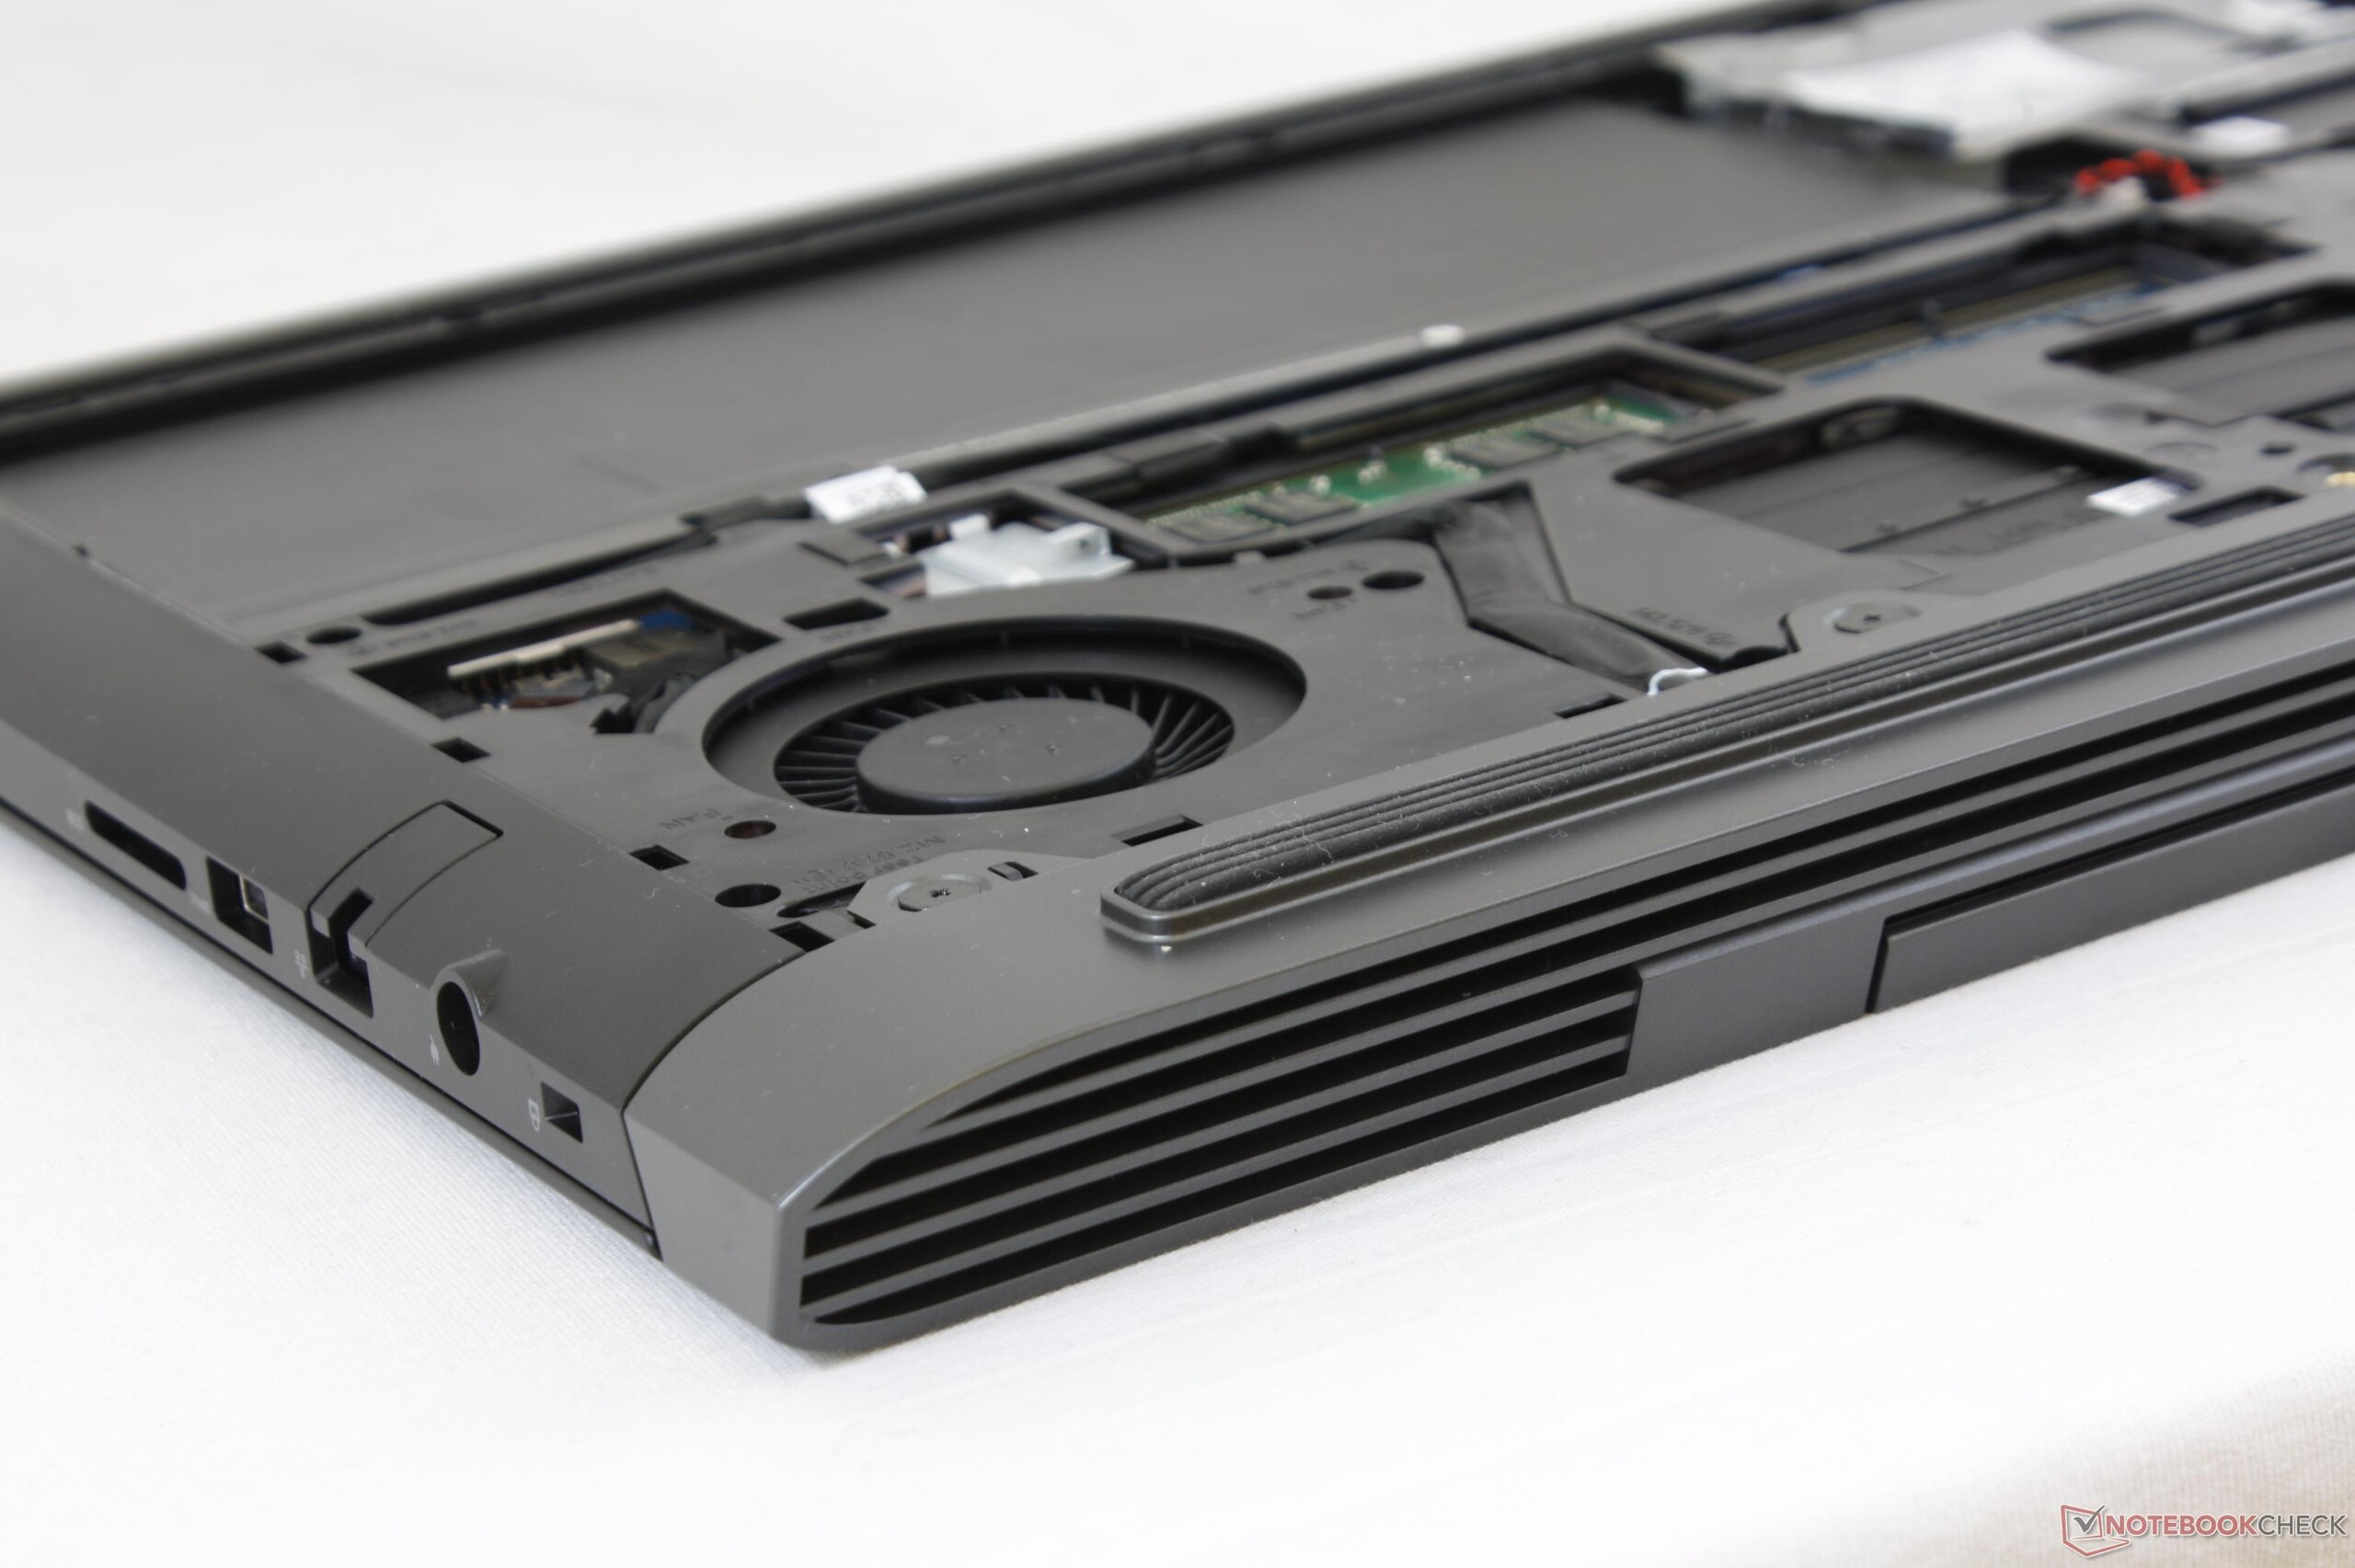
Maintenance
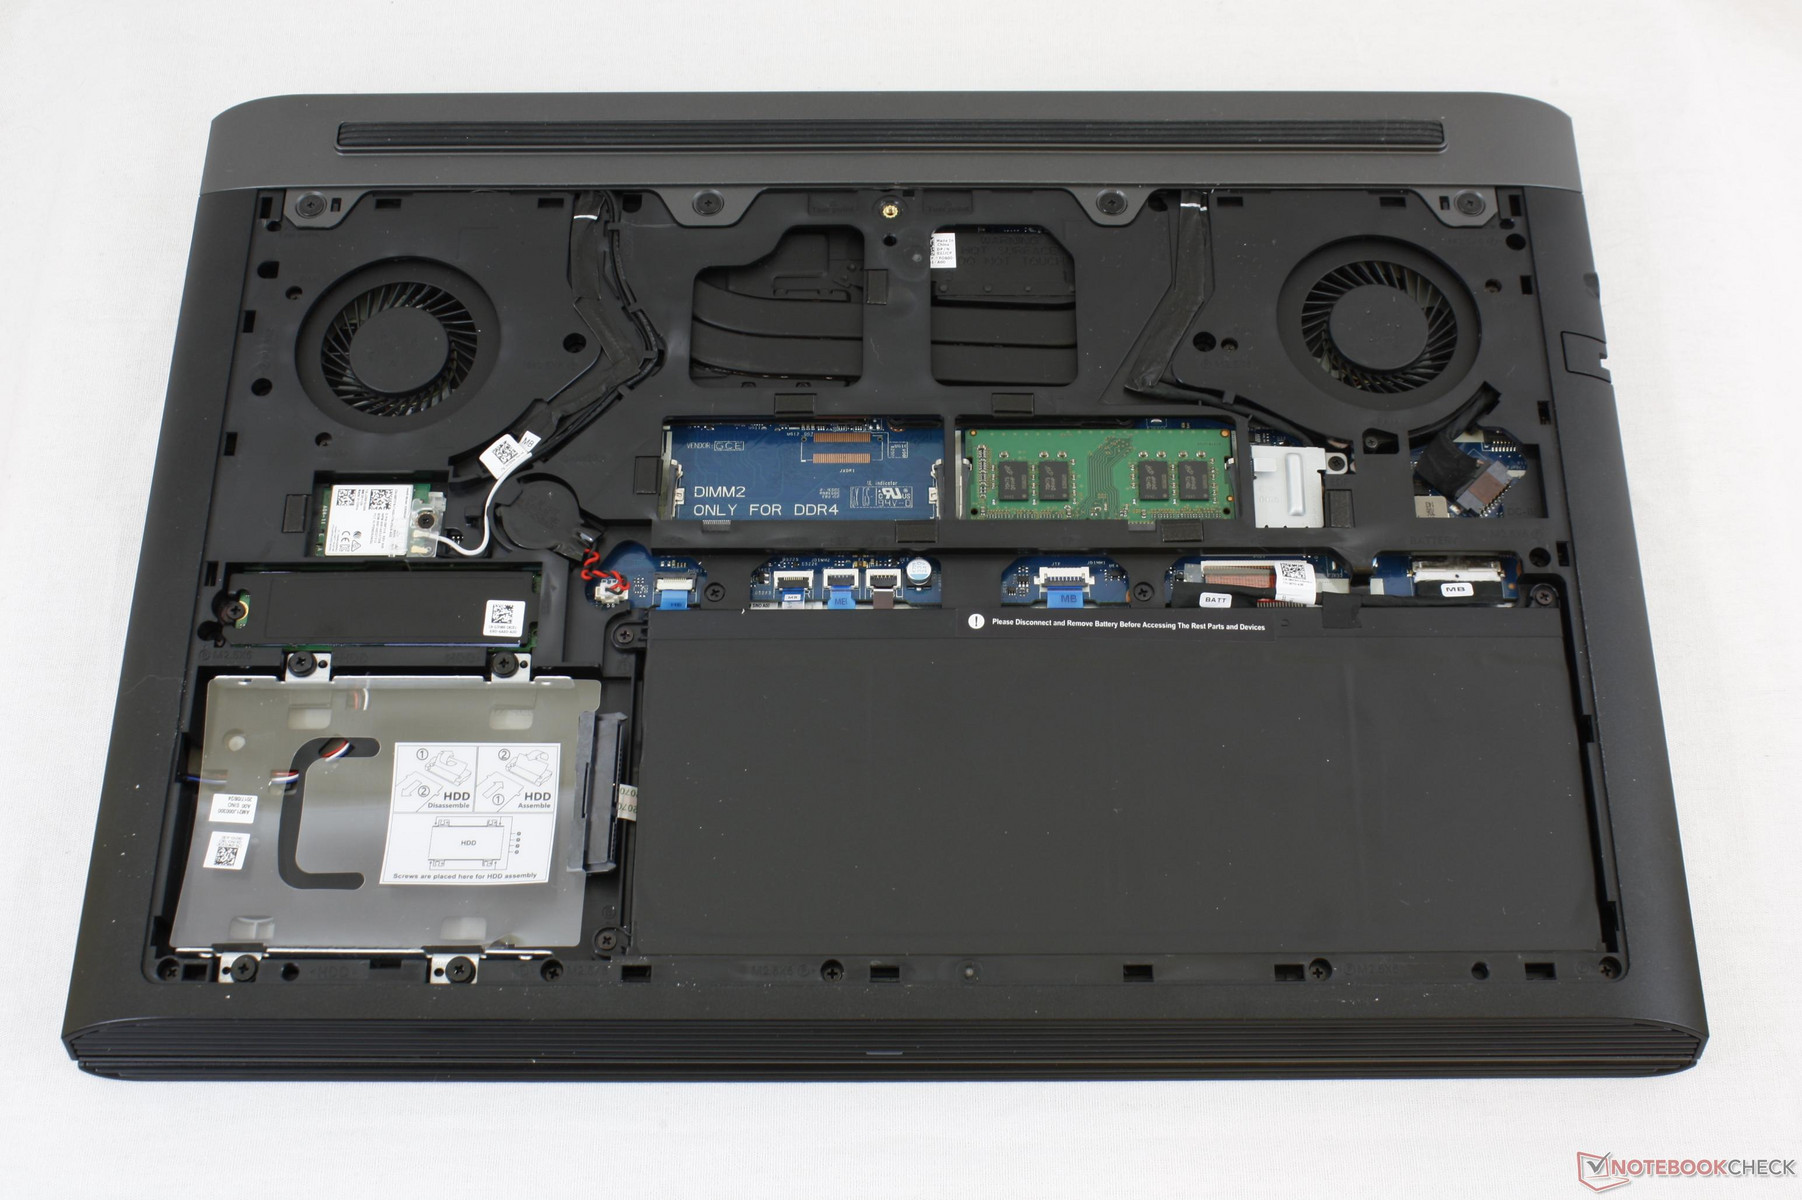
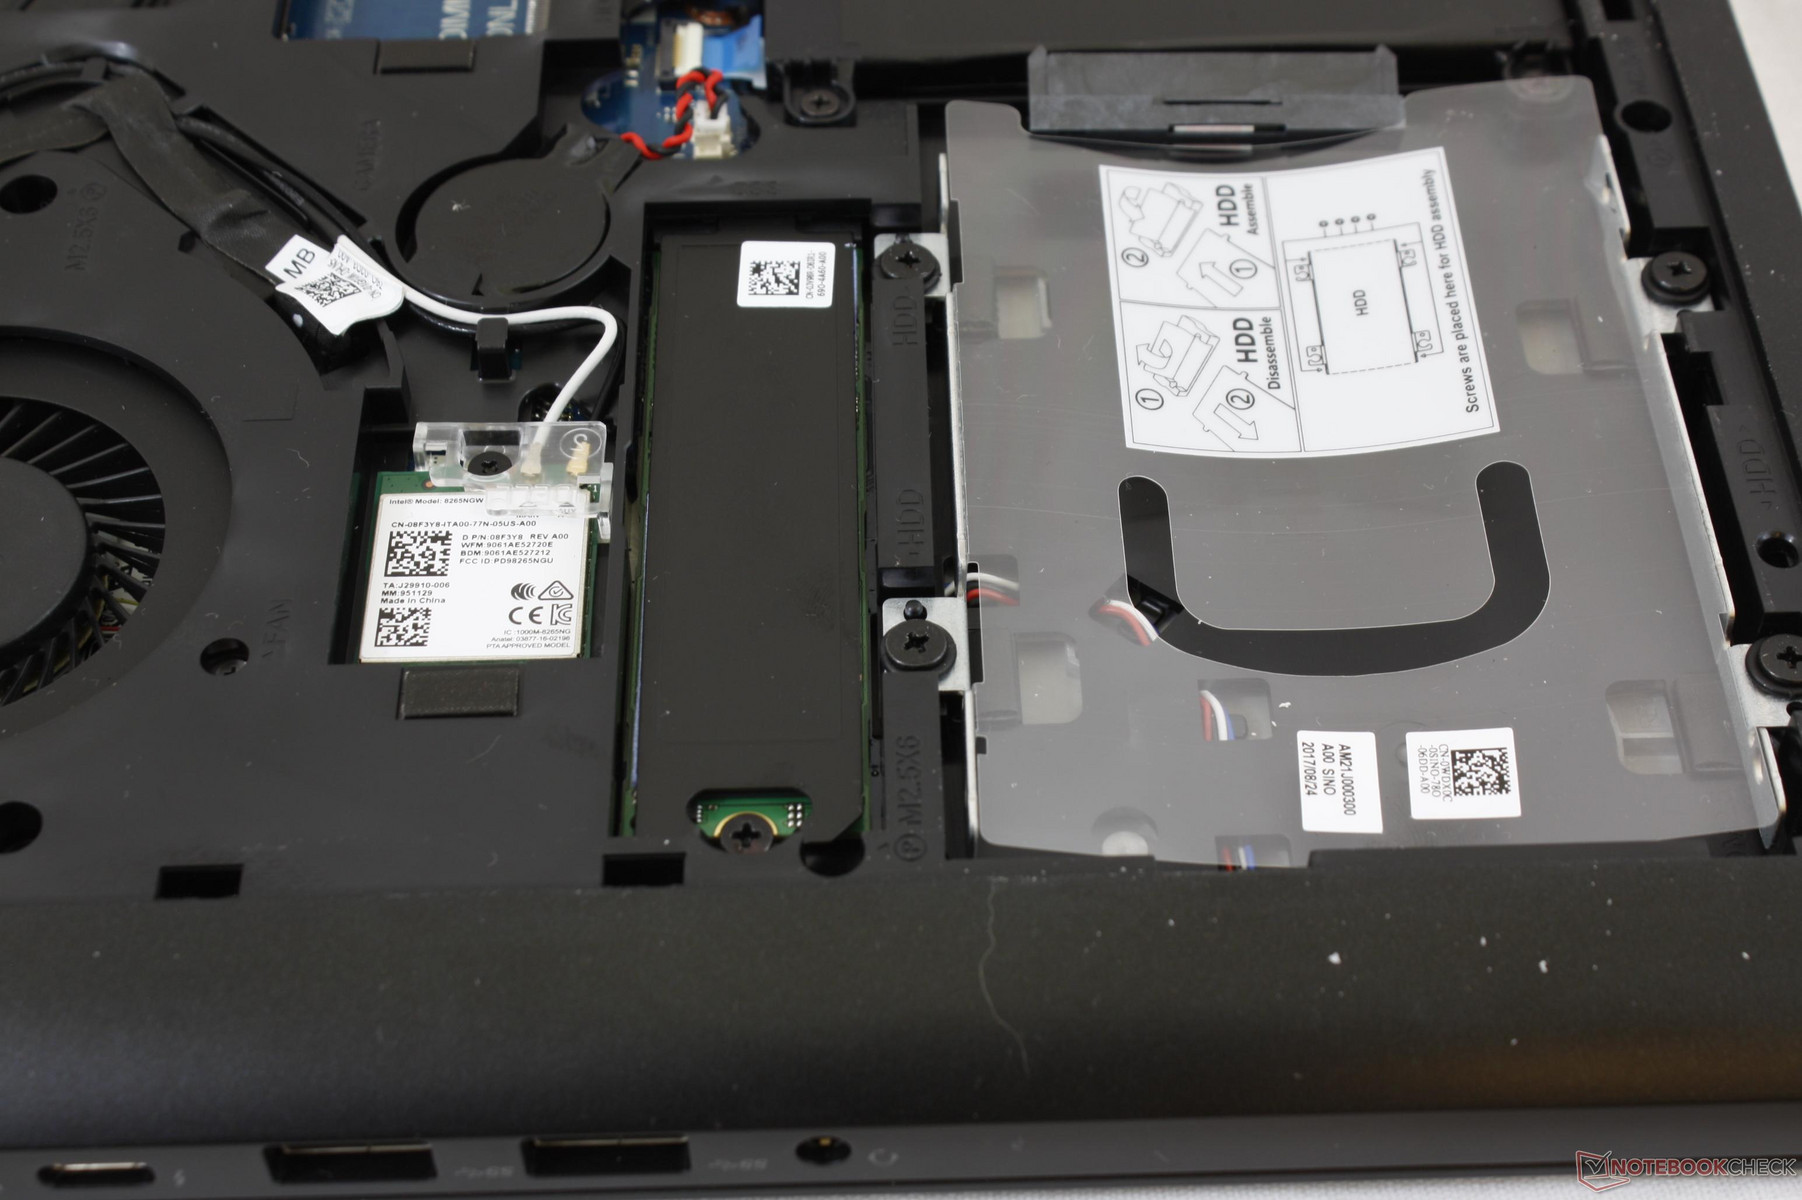
Similar to the older Inspiron 7567, the bottom panel of the 7577 is held in place by only a single Philips screw. The main problem is that the hooks around the edges and corners are very tight when compared to other notebooks. A sharp edge or an old credit card is absolutely recommended for an easier time servicing.
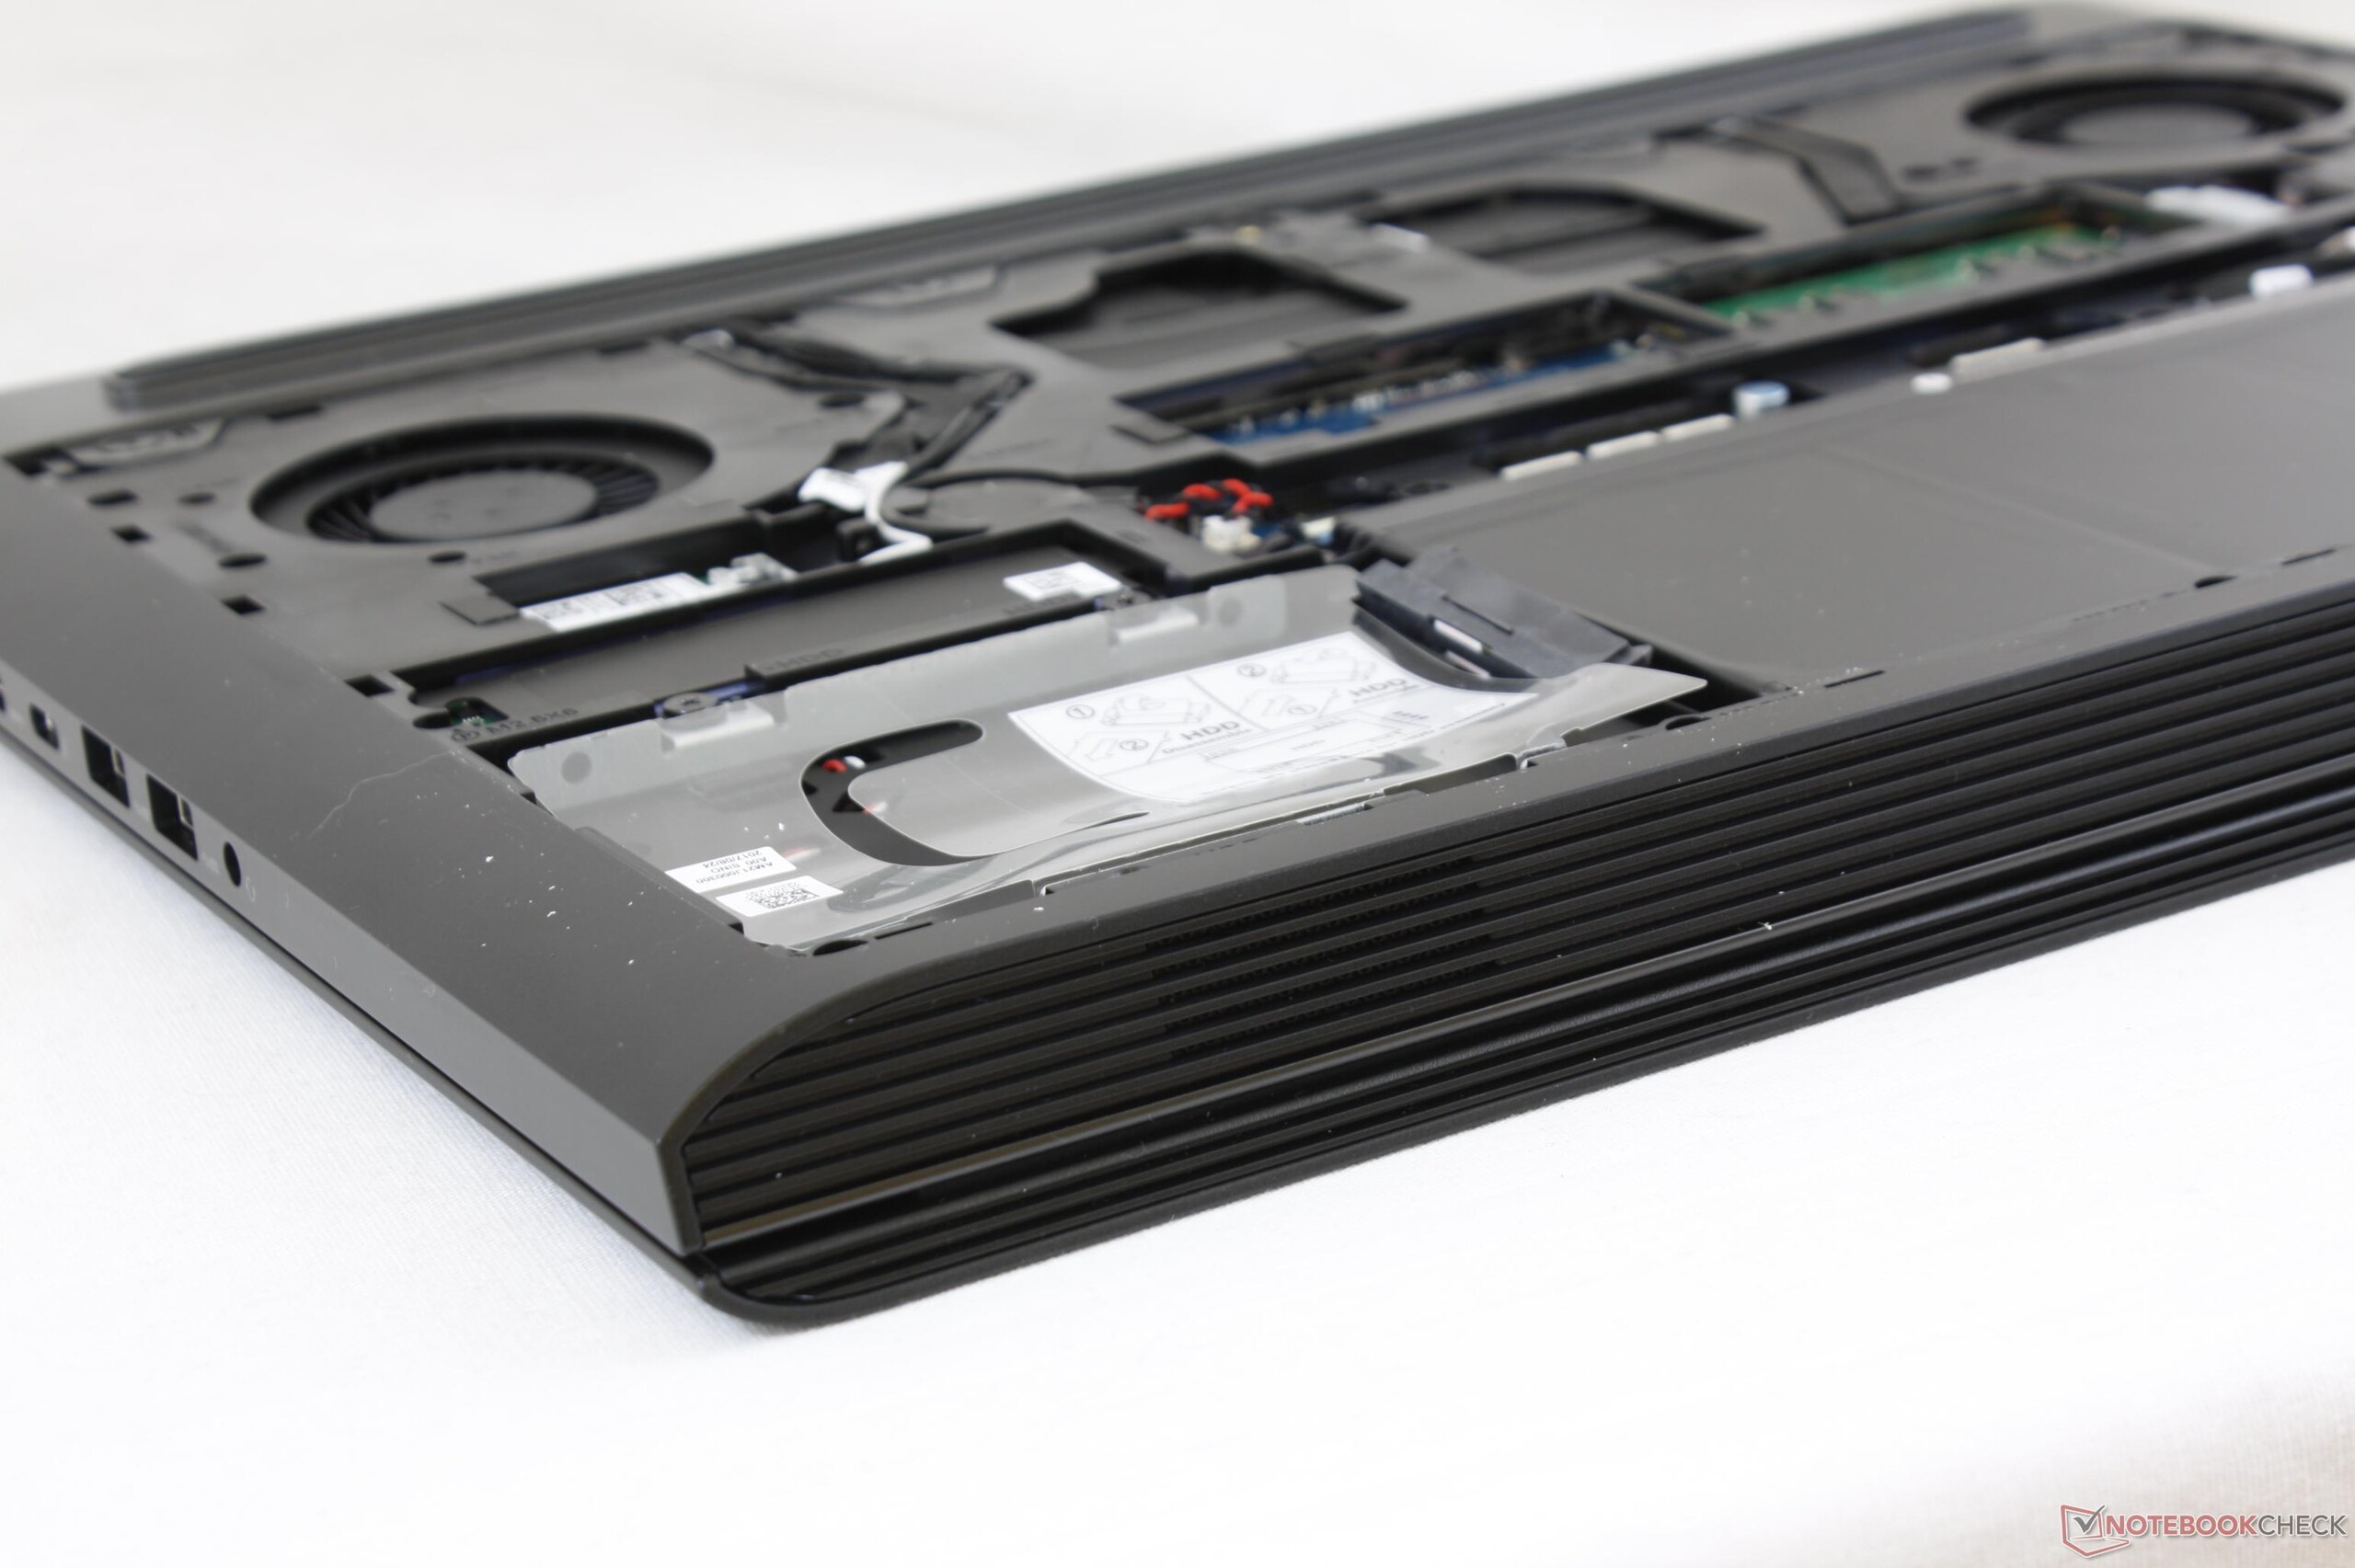
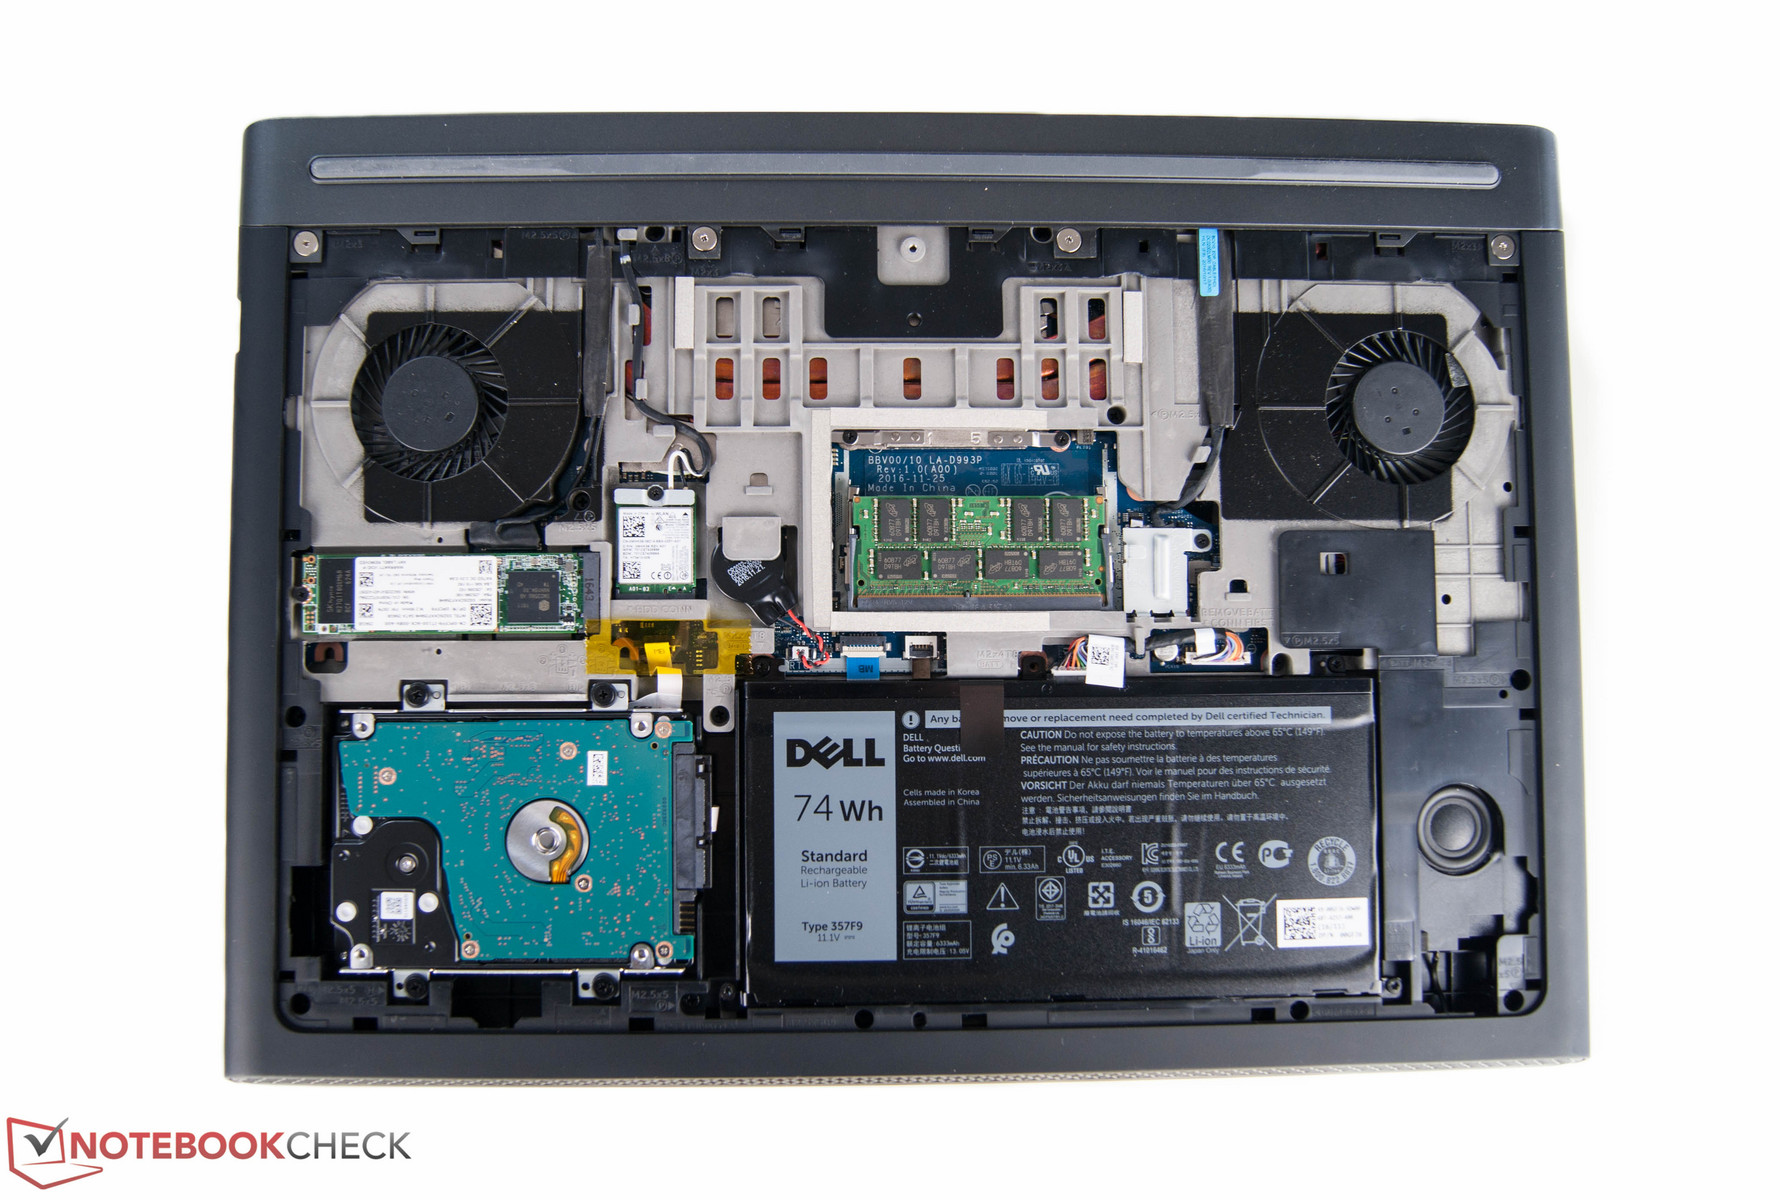
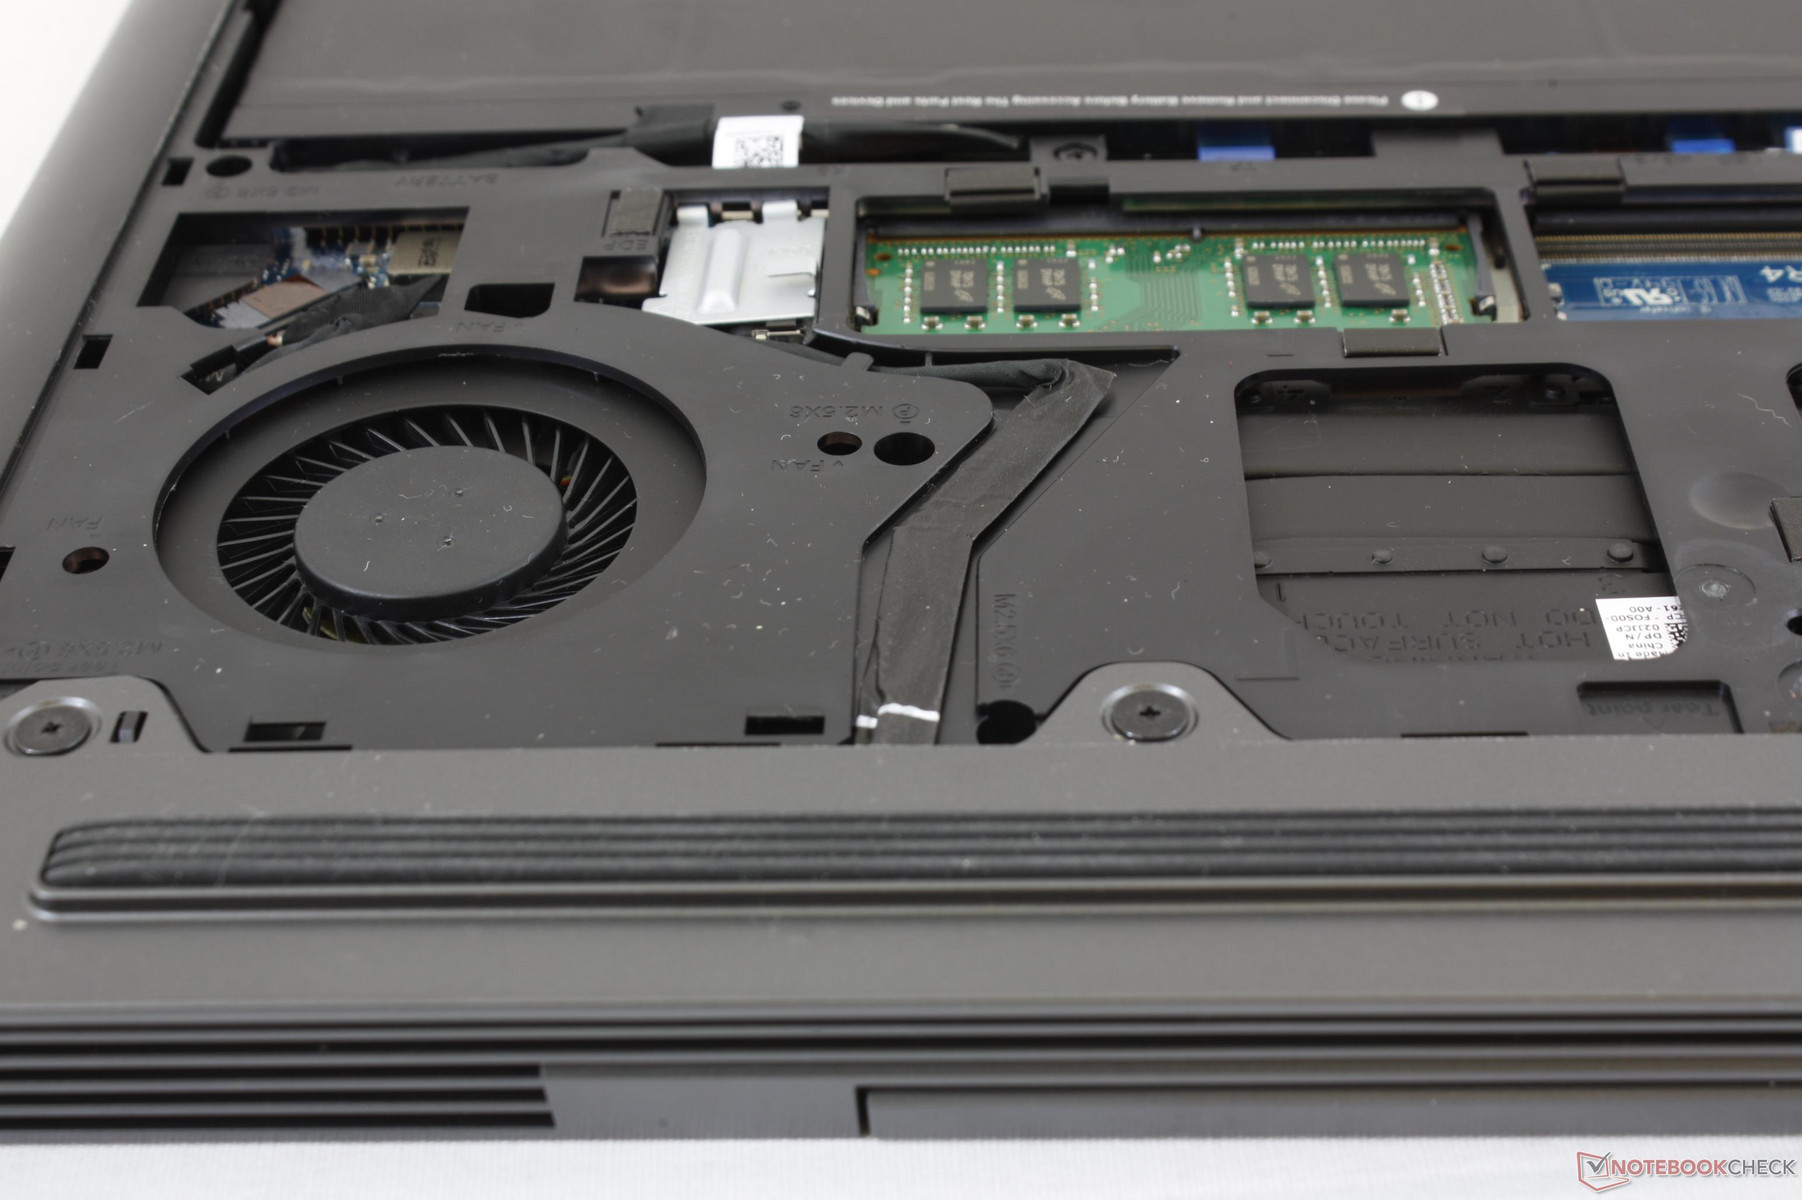
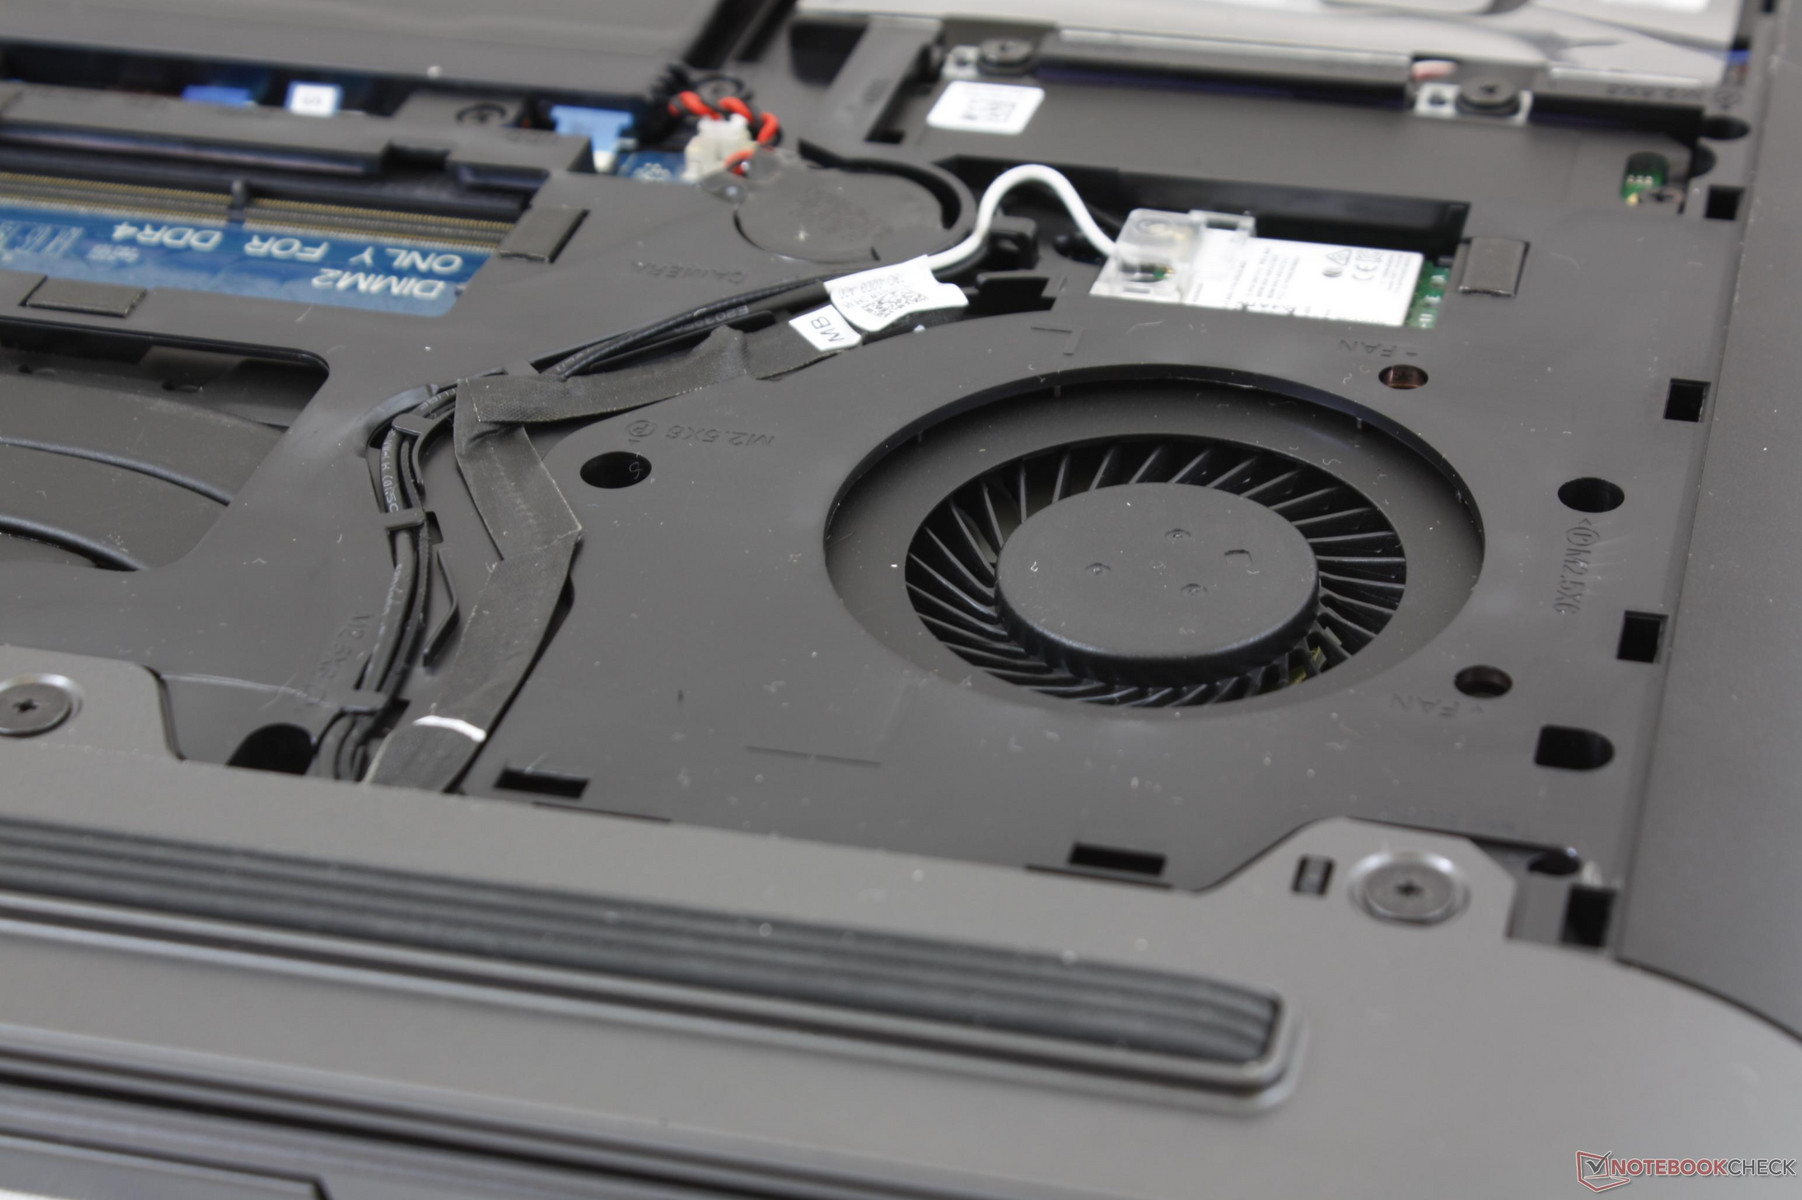
Once the panel is removed, we can begin to see some differences between the 7567 and 7577 as shown by the images below. The most easily noticeable omission on the newer model is perhaps the dedicated subwoofer in favor of a thinner and leaner battery.
Warranty
The standard one-year limited warranty applies with options to extend up to four years of Premium Support Plus. Dell offers a wider range of warranty options compared to smaller specialized gaming manufacturers like MSI, Gigabyte, or Razer because of its wide-reaching Latitude notebooks for businesses. Please see our Guarantees, Return Policies & Warranties FAQ for country-specific information.
Input Devices
Keyboard
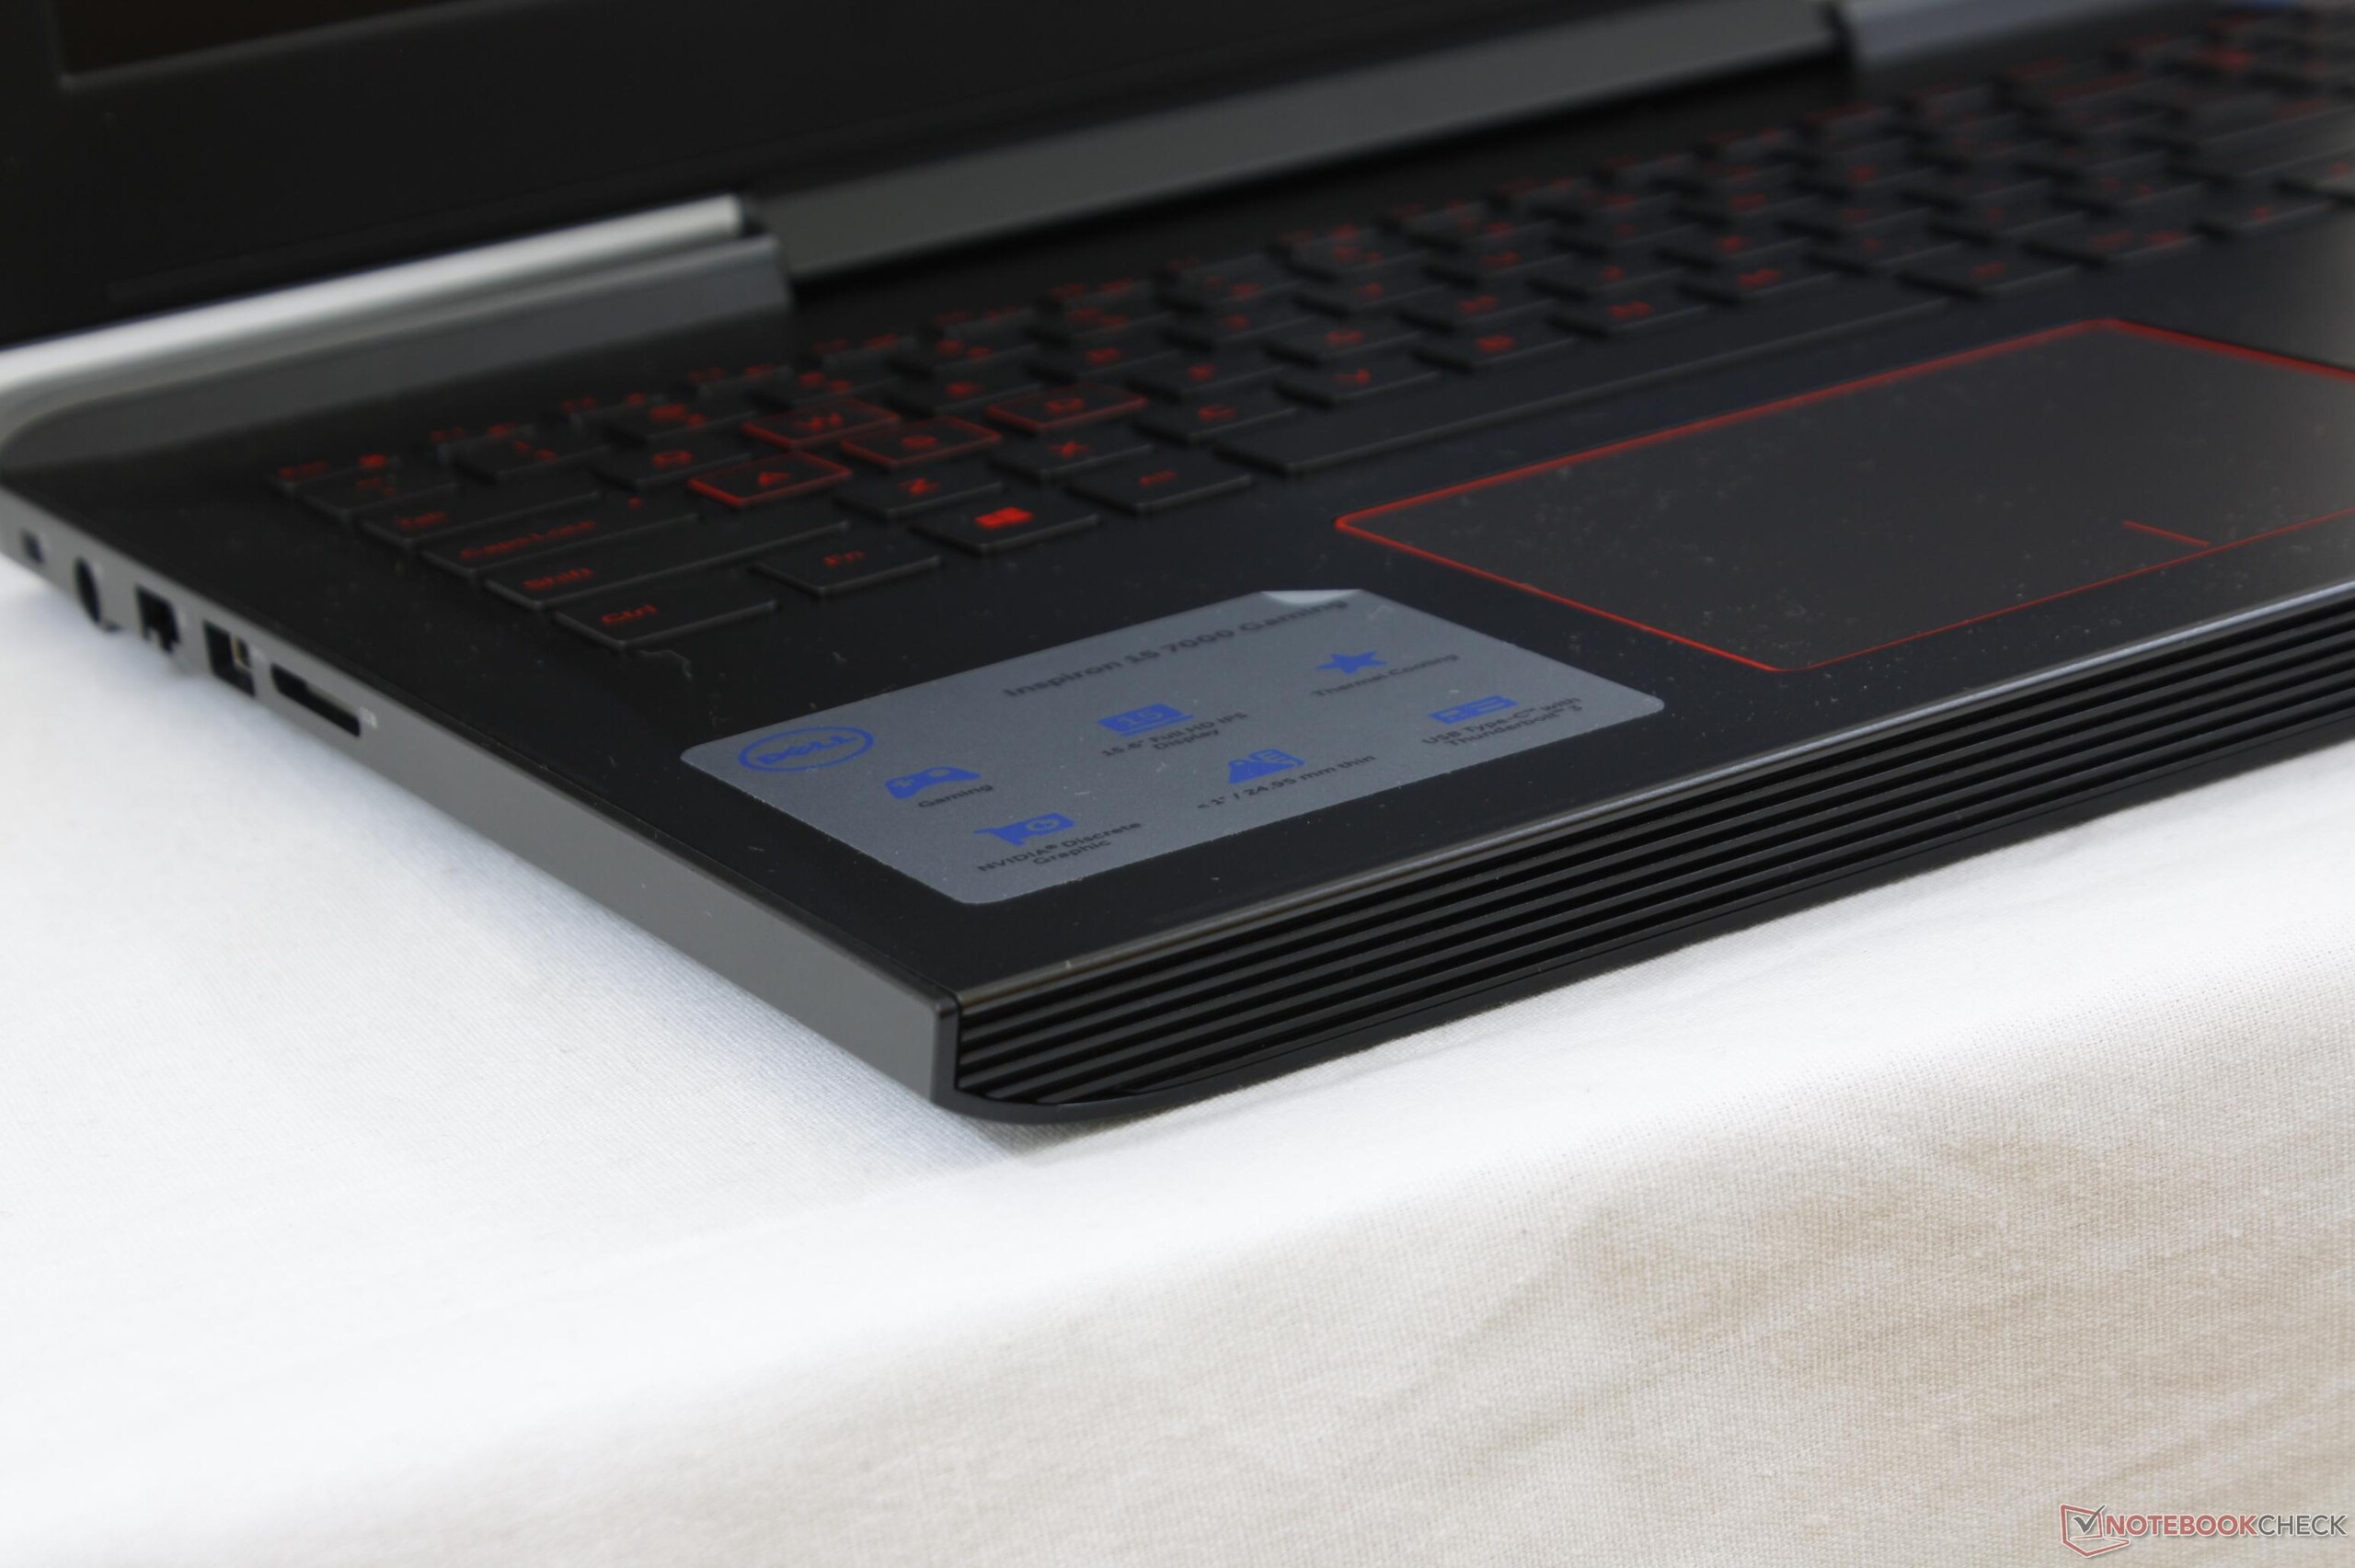
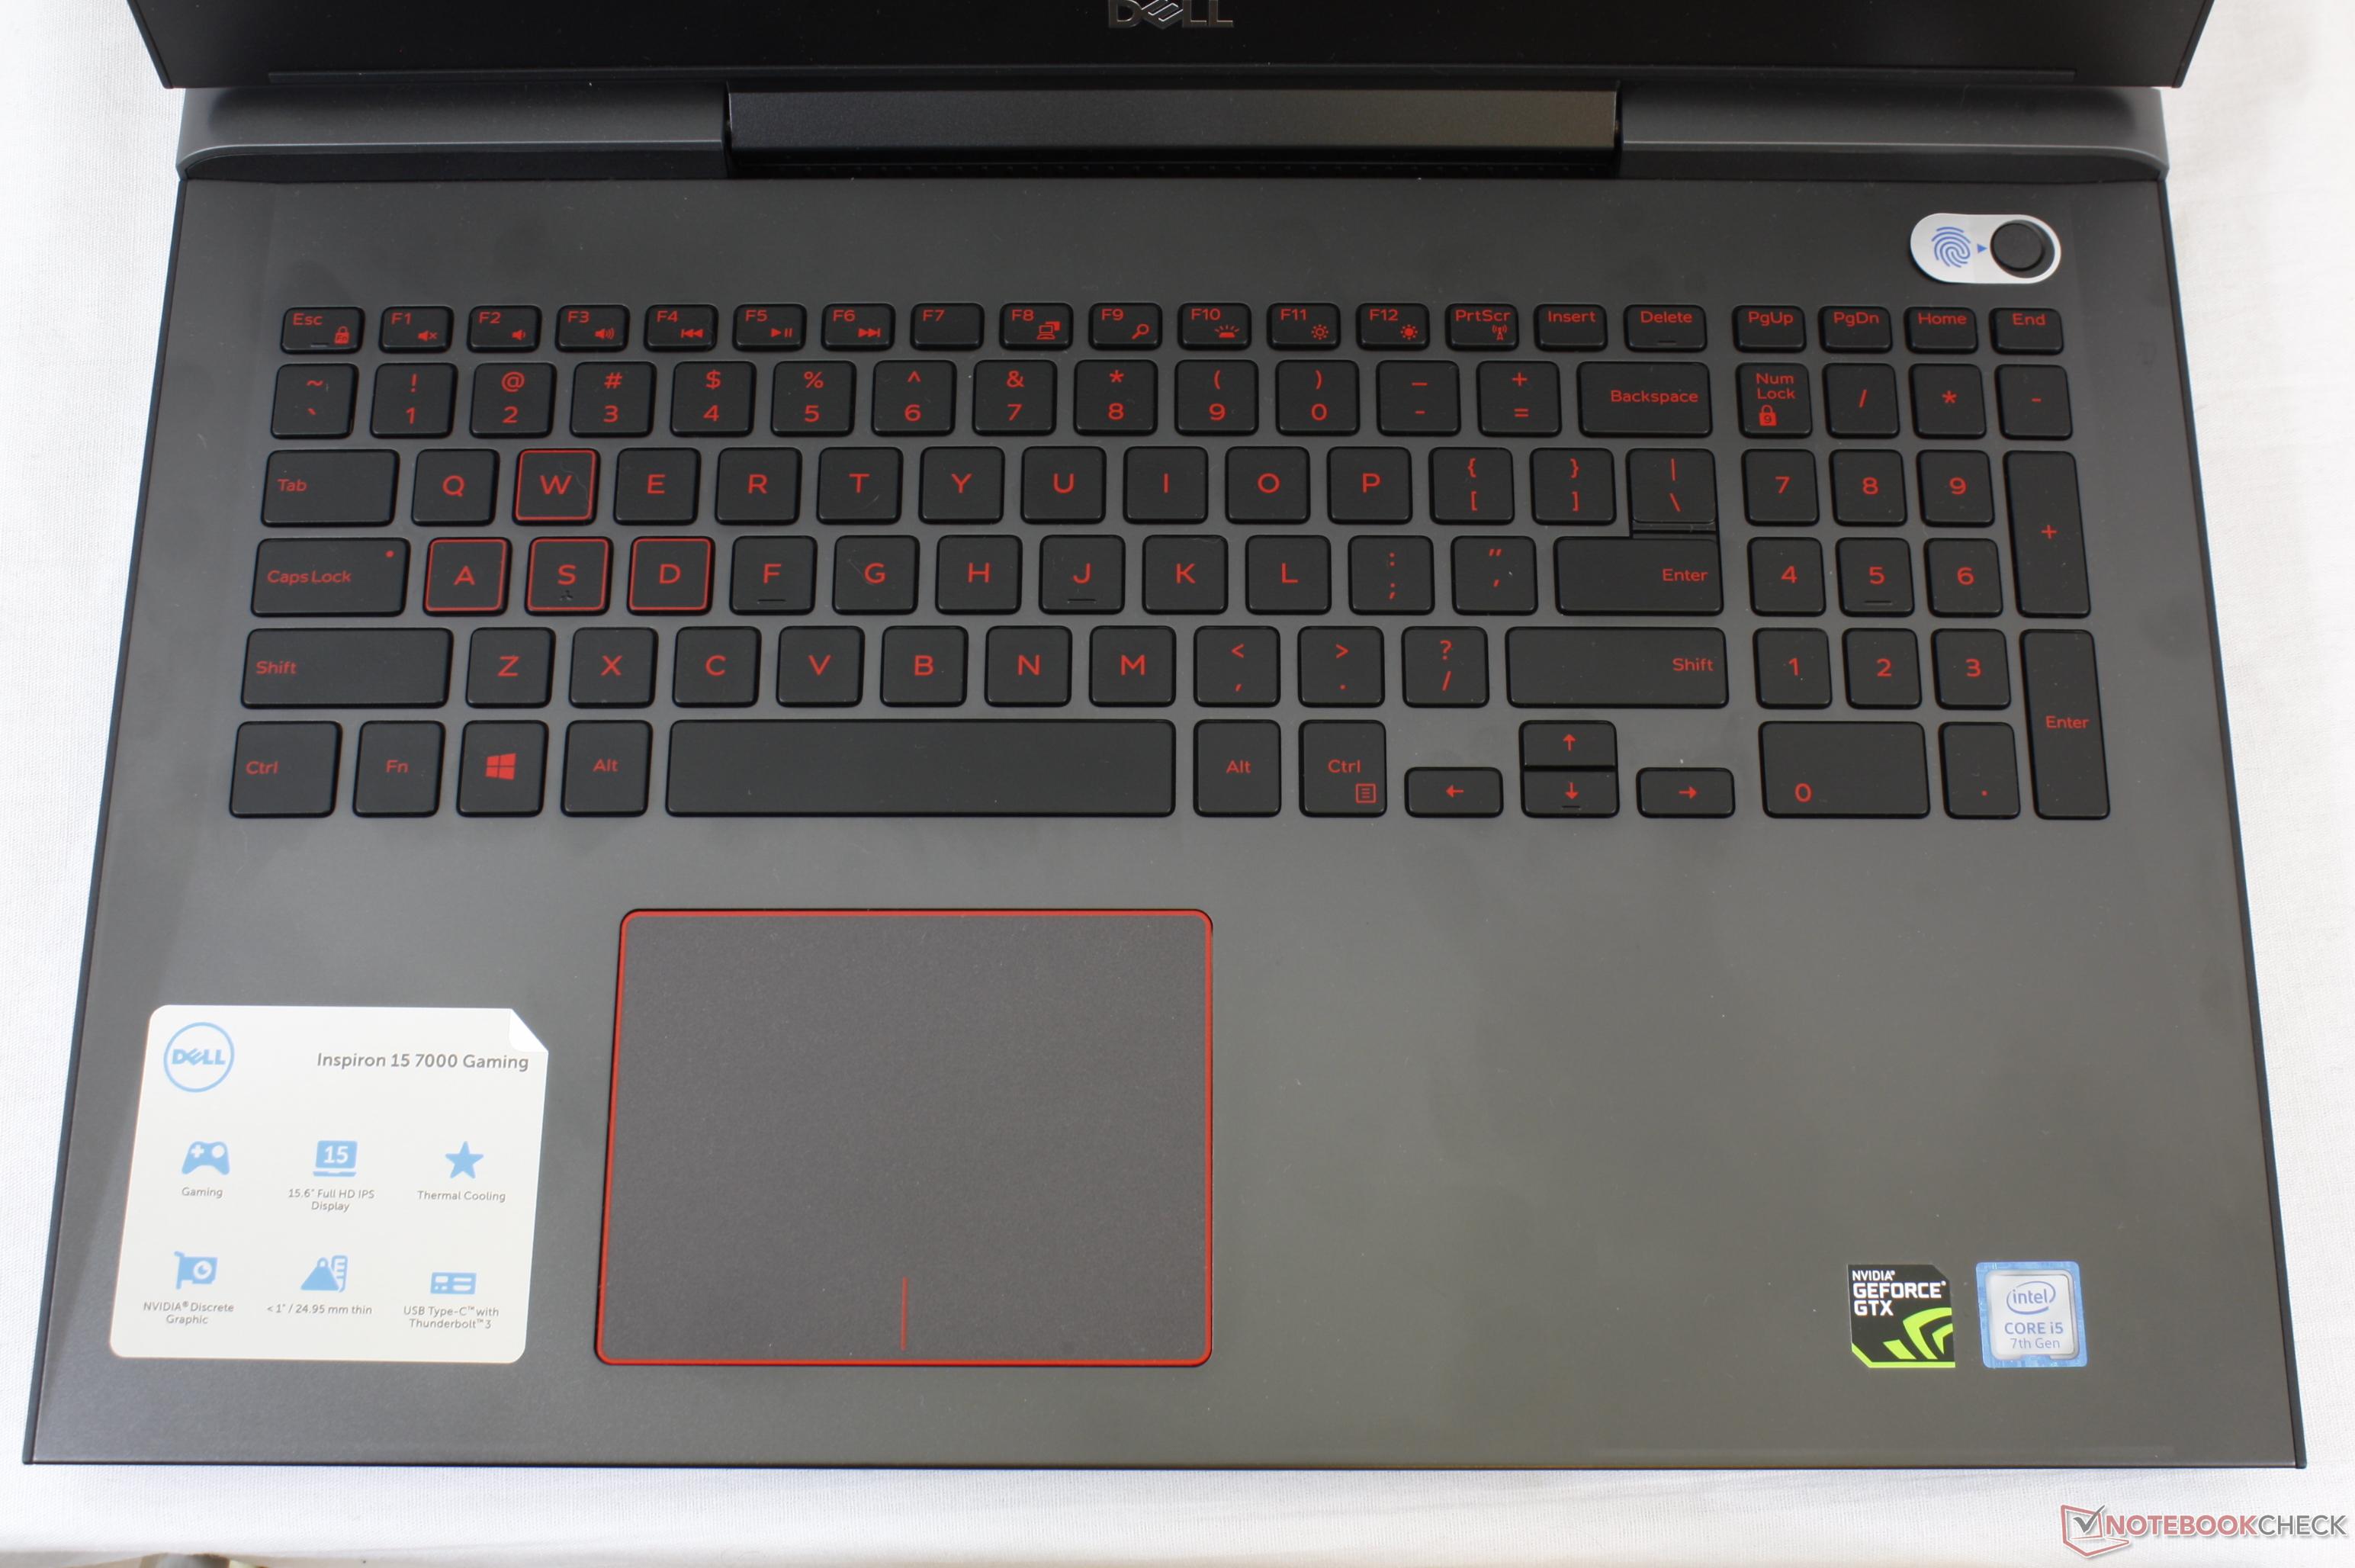
The chiclet keyboard (~34.4 x 10.4 cm) is perhaps the worst aspect of the notebook. When we previewed a pre-production unit of the Inspiron 7577 back in August, we felt that the keyboard keys were much too flat and lacking in feedback. We had given the system the benefit of the doubt since the chassis was not final, but the keyboard has not really improved on the shipped design. The 1.4 mm key travel feels lighter and spongier compared to the keyboards on the MSI GS/GE series, the Asus ROG series, and the Lenovo Legion series. The keys of the XPS 15 series are firmer and more satisfying than what has been provided here on the Inspiron. This is somewhat disappointing because the underlying chassis base is otherwise rigid and does not yield whilst typing.
Other than the weak key feedback, clatter is low-moderate and slightly louder than on the SteelSeries keys on MSI notebooks. The half-sized Arrow keys are even softer in feedback and feel like an afterthought. The optional two-level red backlight is highly recommended when working under dimmer lighting conditions since the dark red lettering of the keys do not contrast perfectly against the plastic black key caps.
Touchpad
The trackpad is exactly the same size as it was on the Inspiron 7567 at 10.6 x 8 cm. Its surface is textured very slightly to provide a smooth glide, but can stick a bit if gliding across very slowly for more accurate cursor movements. The trackpad is firm, does not warp to pressure, and is reliably consistent for both cursor control and multi-touch gestures.
The integrated mouse keys are shallow in travel and easier to click on the bottom- and left-hand corners than on the center surface. Feedback is adequate and with a loud auditory click when pressed not unlike on most Ultrabooks. We still prefer the dedicated mouse keys on the MSI GT/GE series as they are firmer and more accurate than the integrated solution found here. The drawback, of course, is the smaller trackpad (10.9 x 6.1 cm) on the MSI.
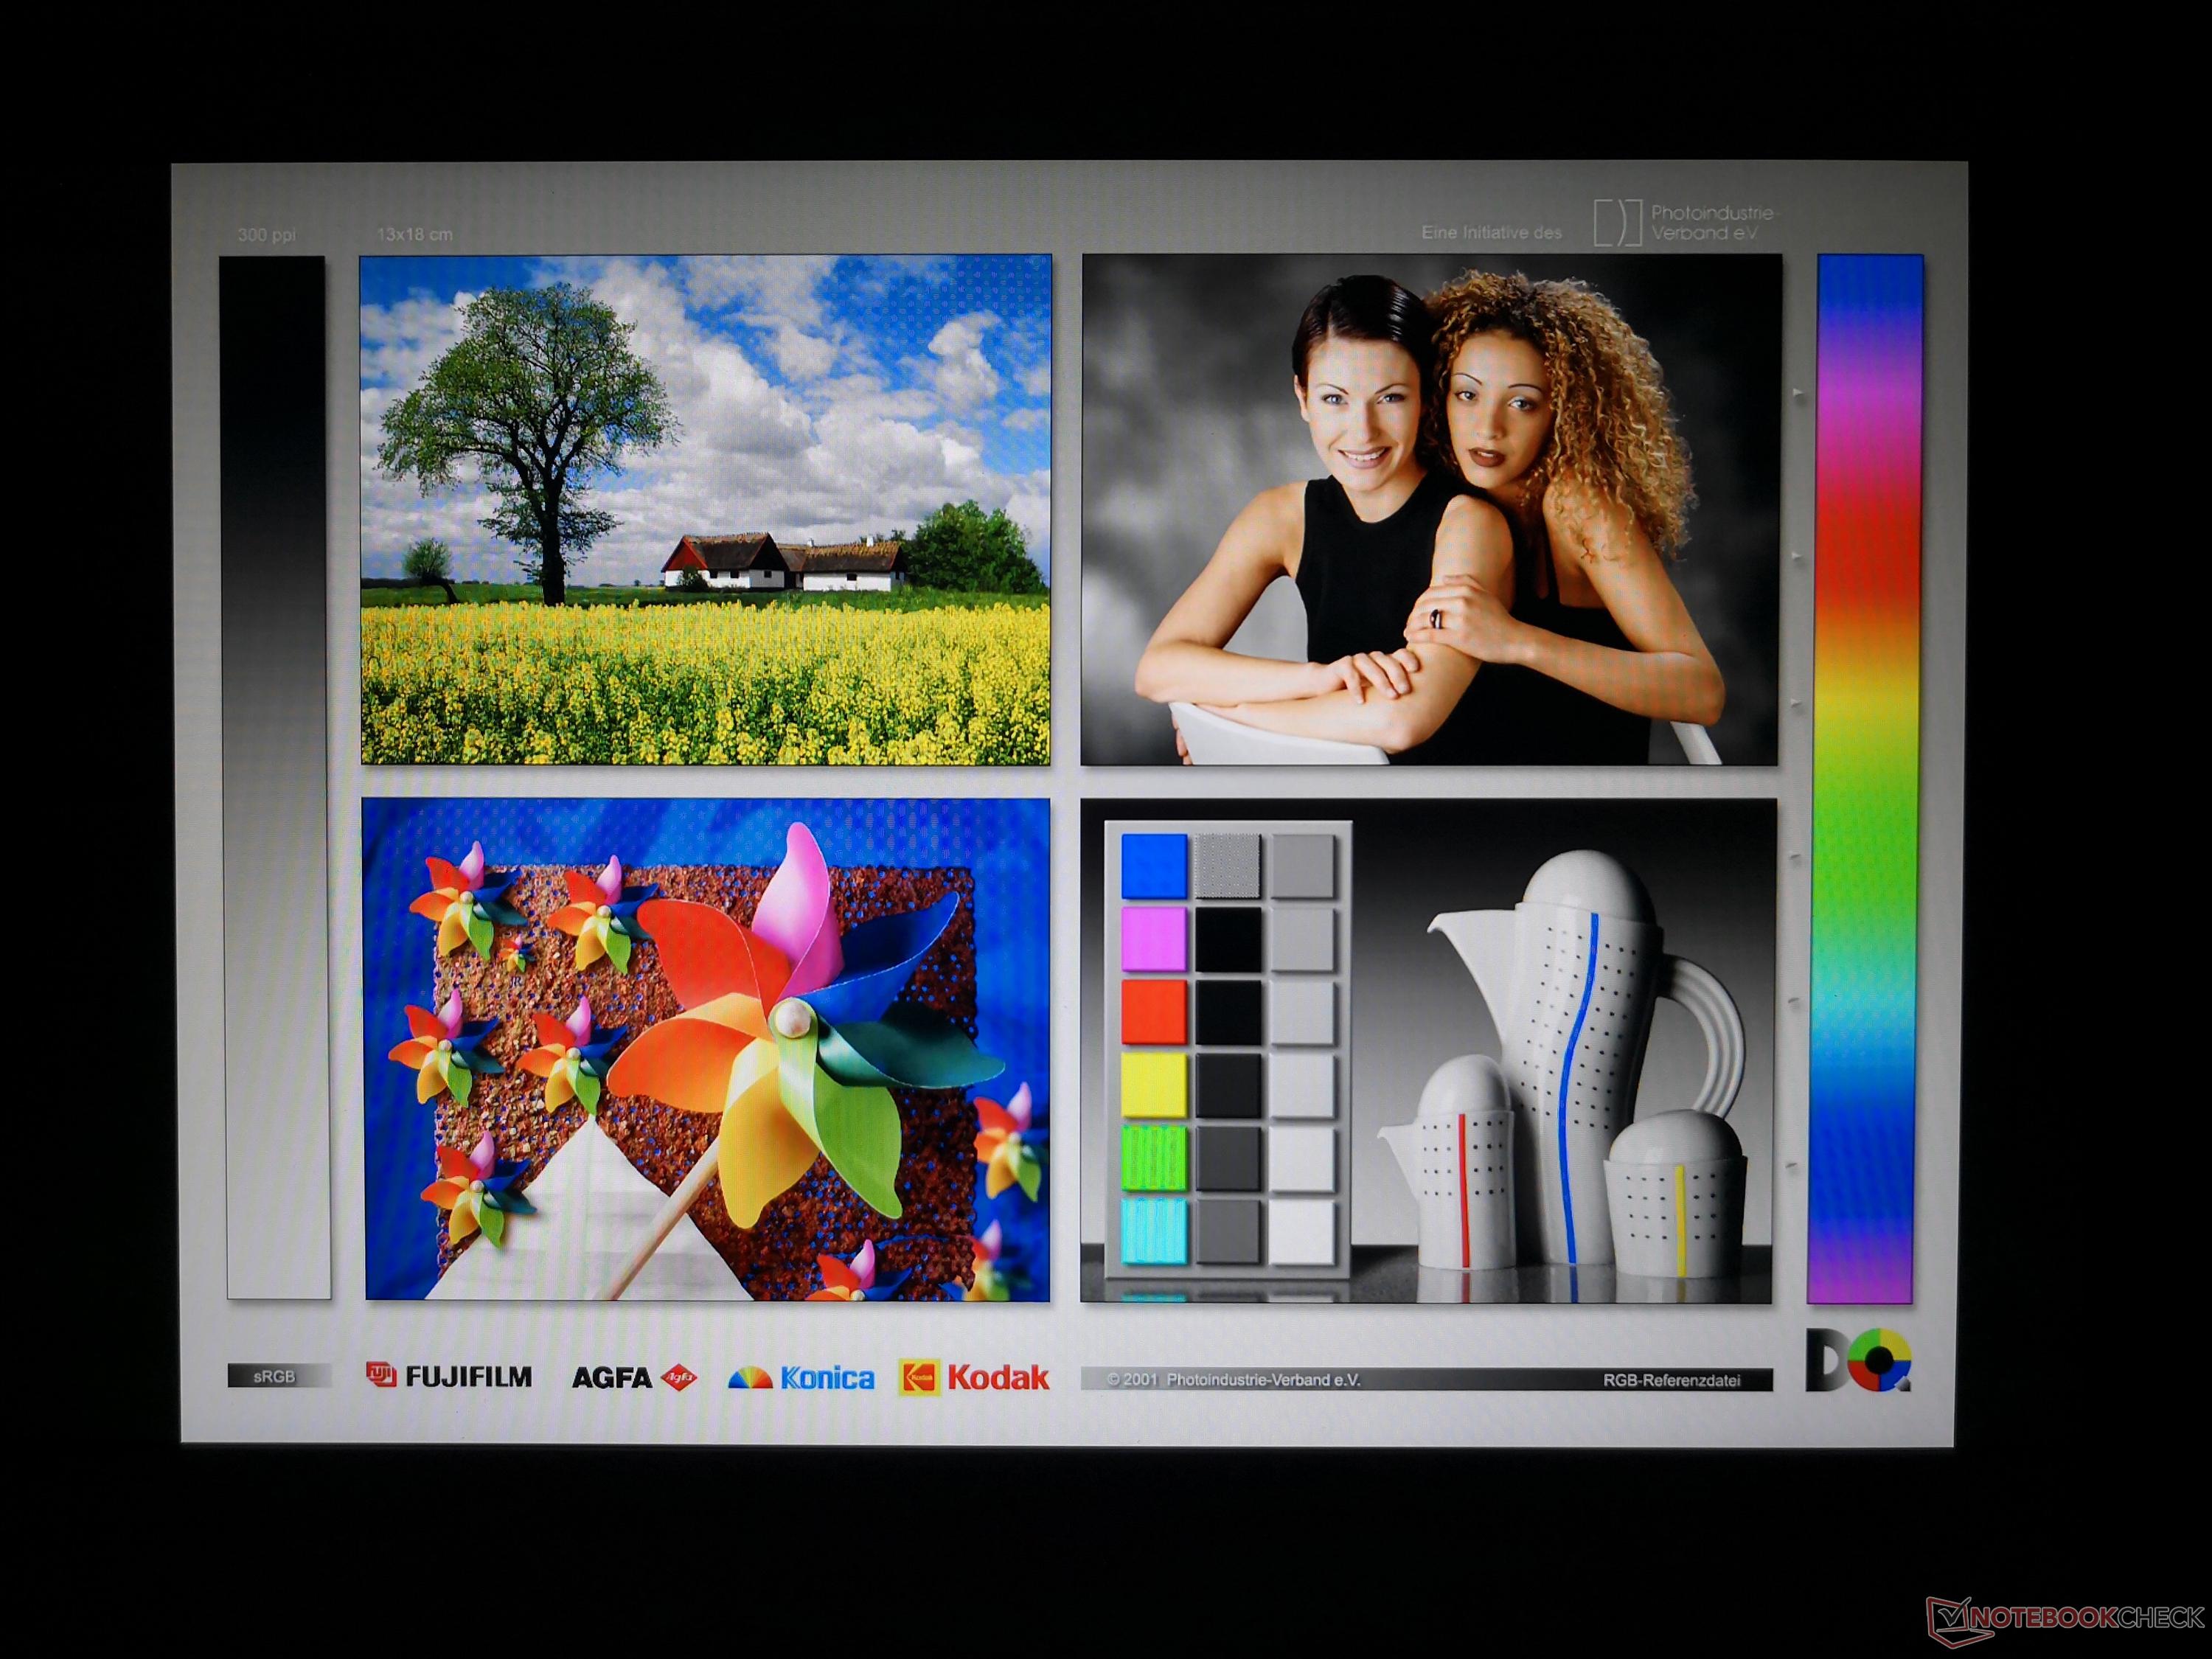
Display
Available display options include matte FHD IPS and 4K UHD IPS with no TN options for US customers. We see this as a definite upgrade as we found the TN panel on certain Inspiron 7567 SKUs to be subpar for a gaming notebook. Note that Dell is sourcing the exact same LG Philips LGD053F IPS FHD panel from the older 7567 series for the newer 7577 series and so users can expect very nearly the same display quality and colors between them.
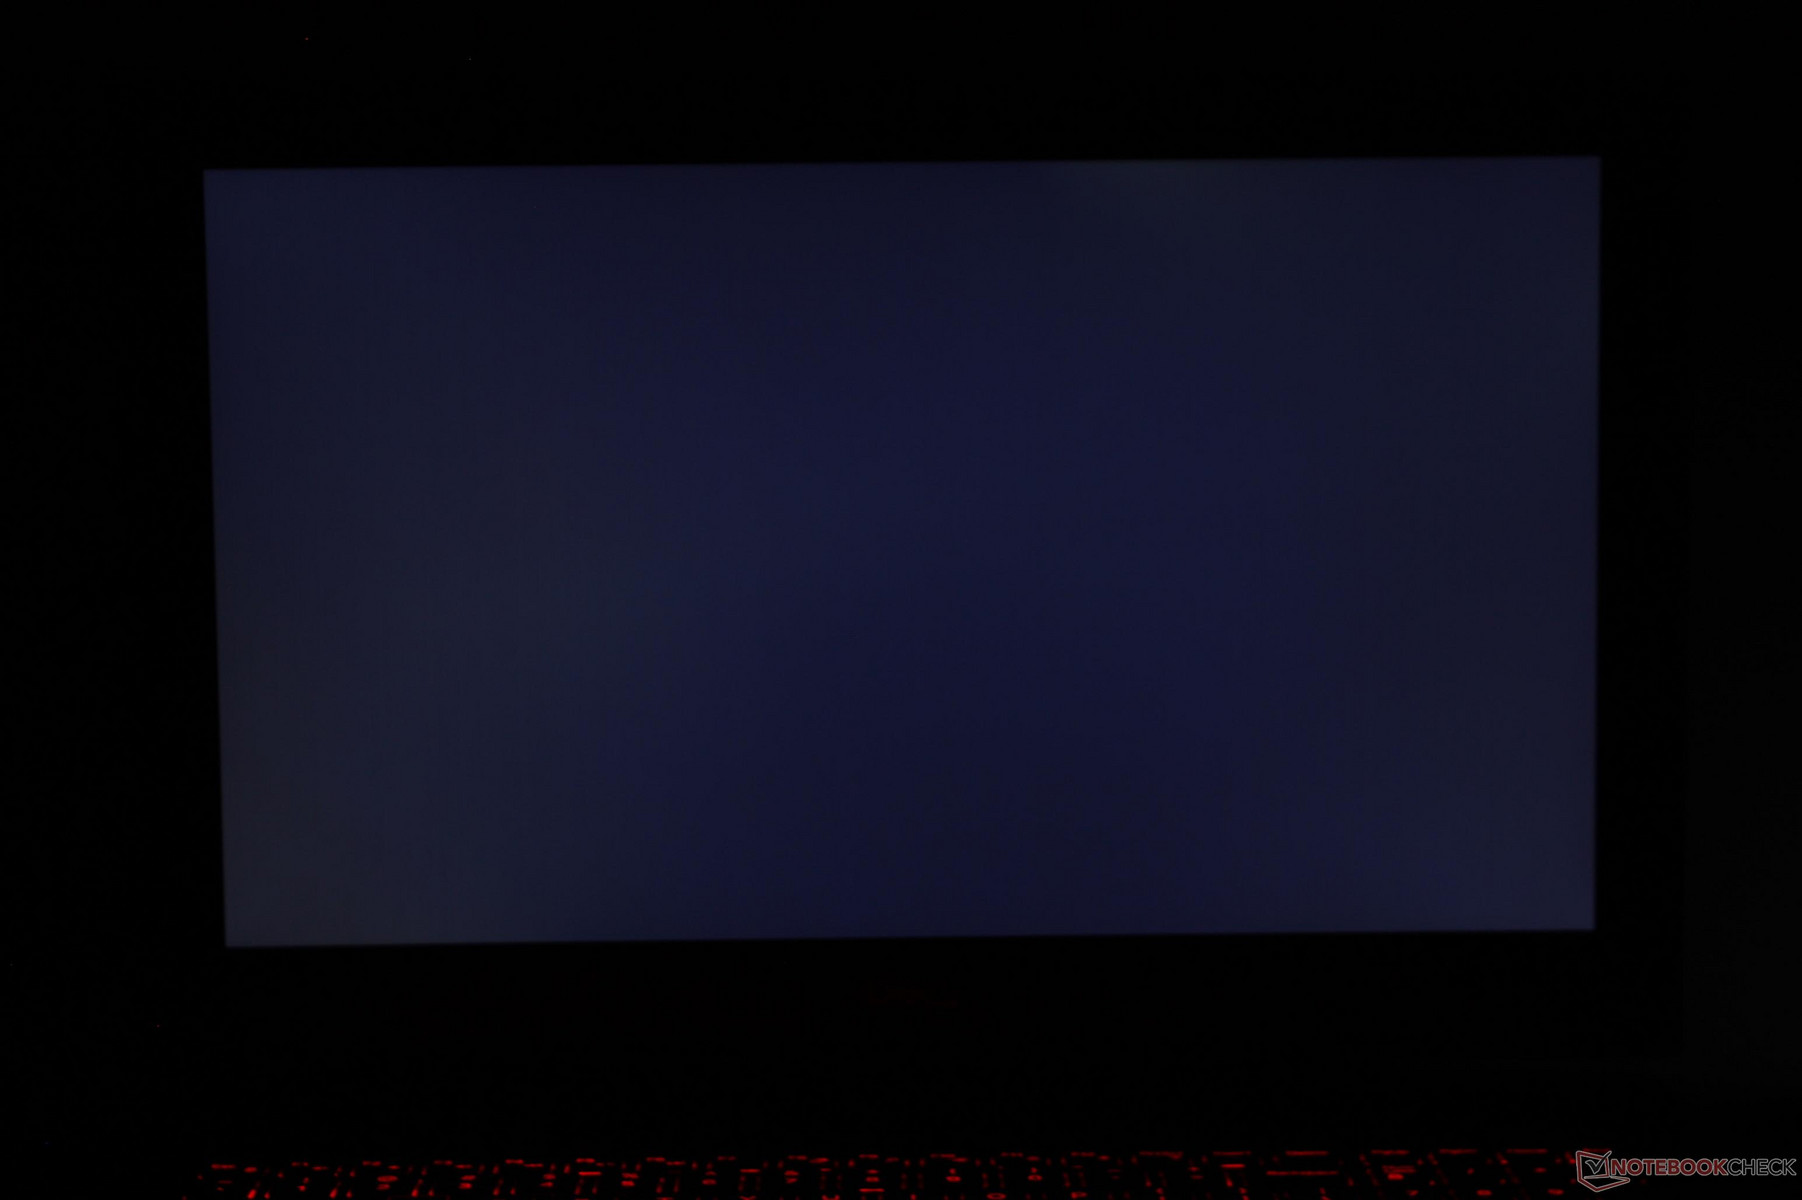
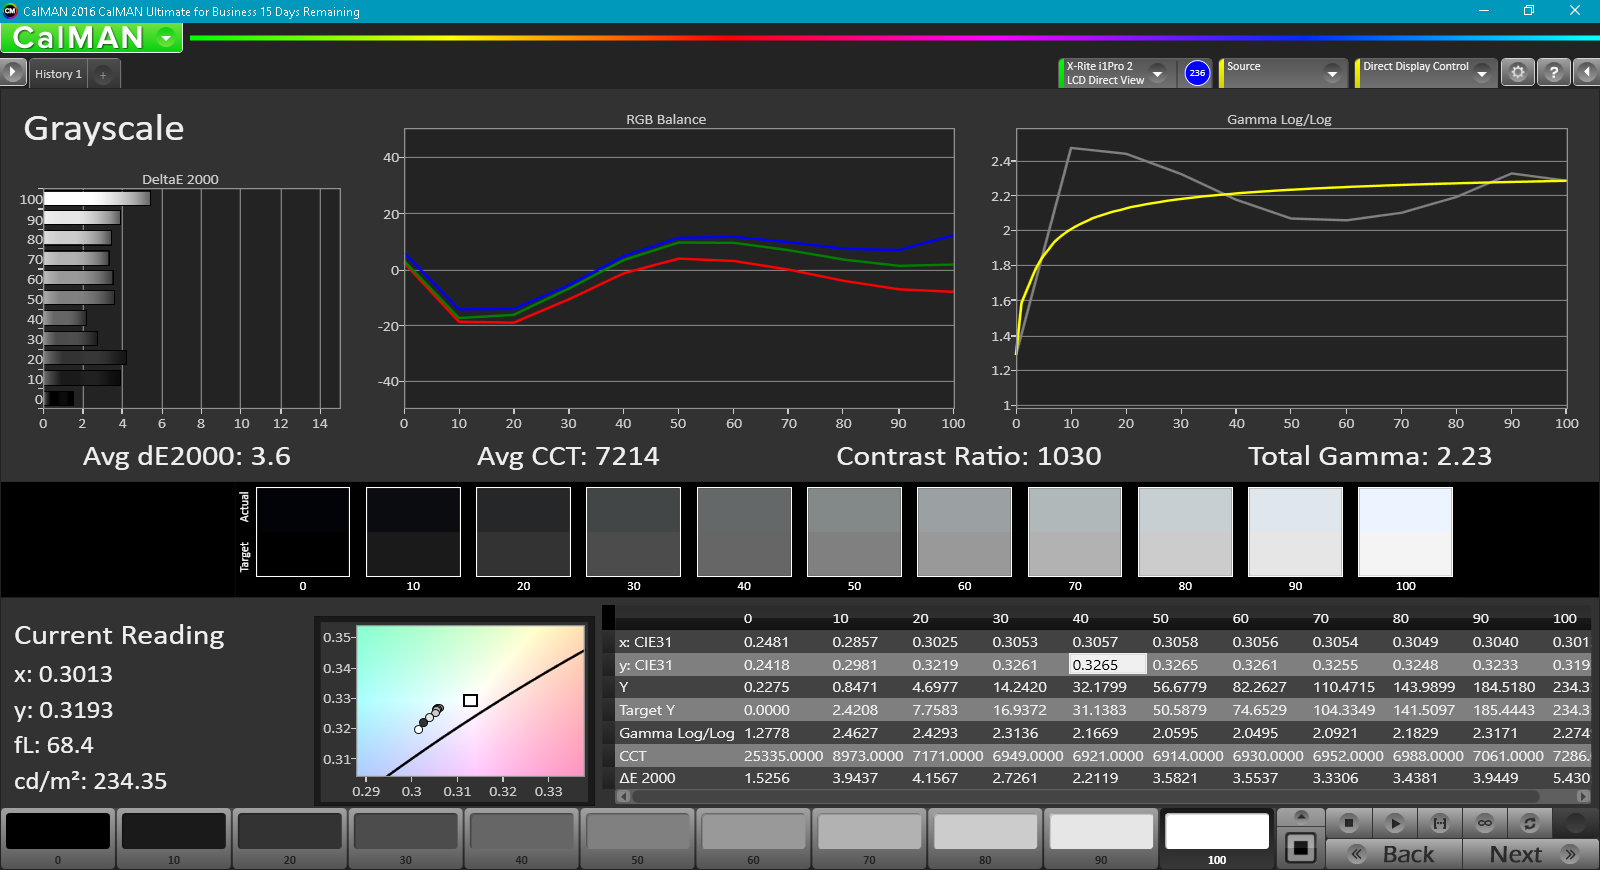
Measured contrast is respectable at about 800:1 and colors are indeed more accurate out of the box compared to the older TN configuration. While the 7577 display is now more comparable to the displays of its closest competitors, Dell has not upped the intensity of the backlight at all. Most other gaming notebooks and Ultrabooks have significantly brighter displays than our Inspiron.
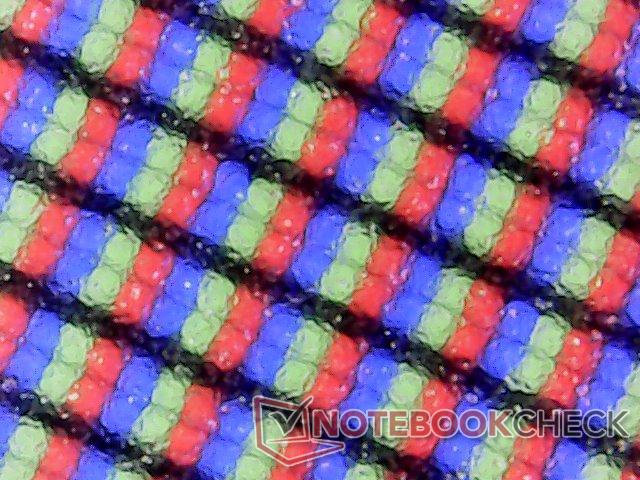
Subjectively, the matte panel is very sharp with almost no graininess issues unlike on the majority of matte displays. Uneven backlight bleeding is kept to a bare minimum and is essentially unnoticeable when gaming or during movie playback.
Note that our measurements below reflect only the FHD IPS display. We will try and perform these same tests on a second Inspiron 7577 SKU with the 4K UHD panel at a future date.
| |||||||||||||||||||||||||
Brightness Distribution: 91 %
Center on Battery: 235.4 cd/m²
Contrast: 841:1 (Black: 0.28 cd/m²)
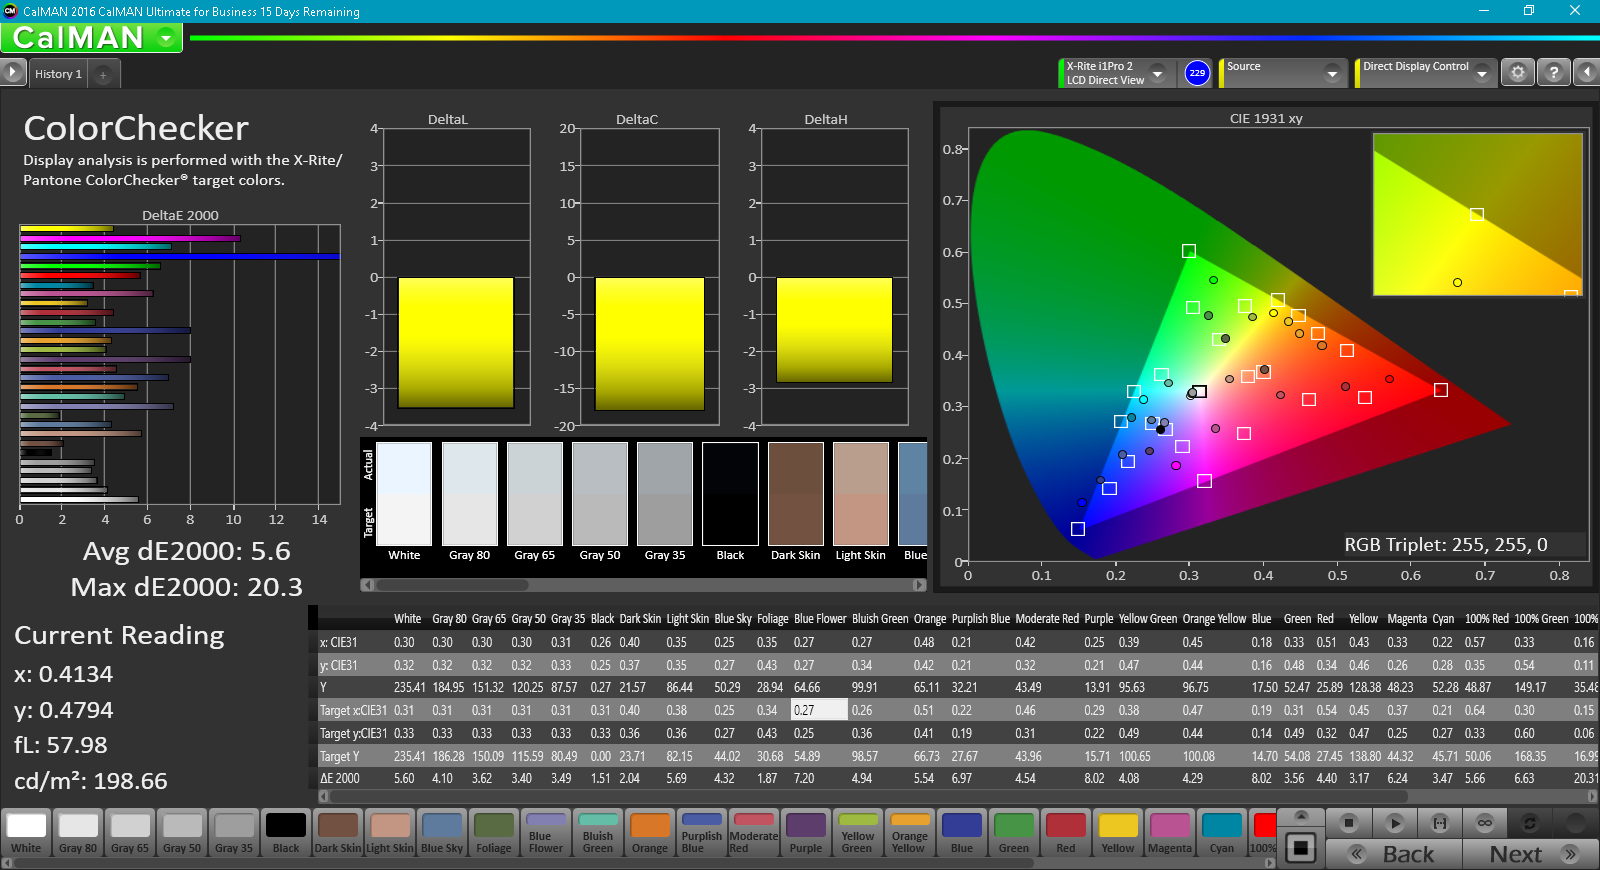
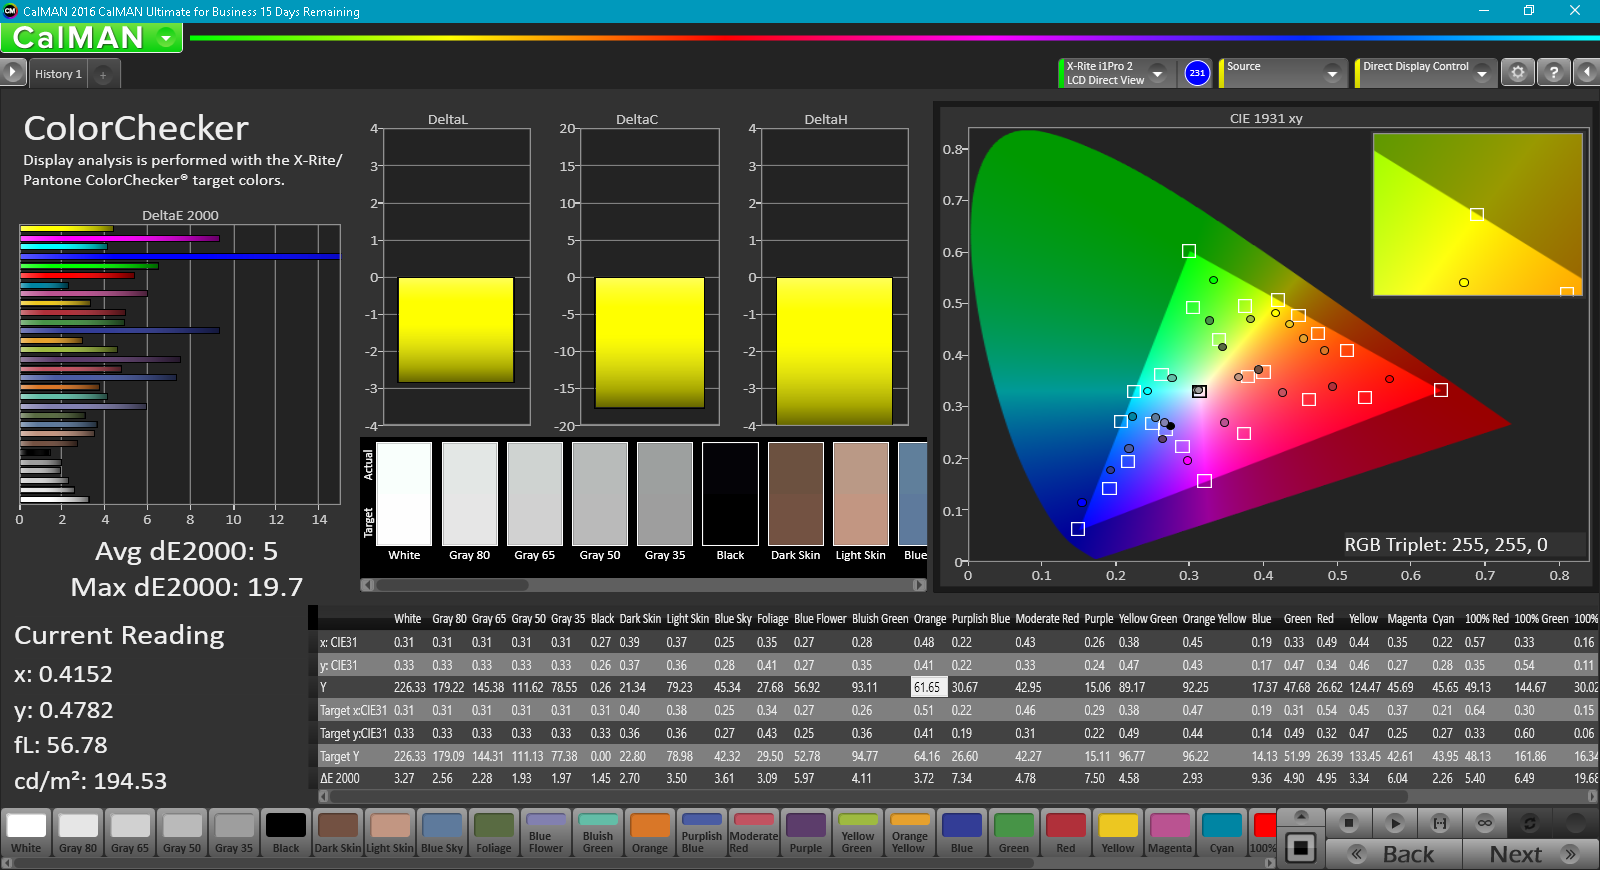
ΔE ColorChecker Calman: 5.6 | ∀{0.5-29.43 Ø4.72}
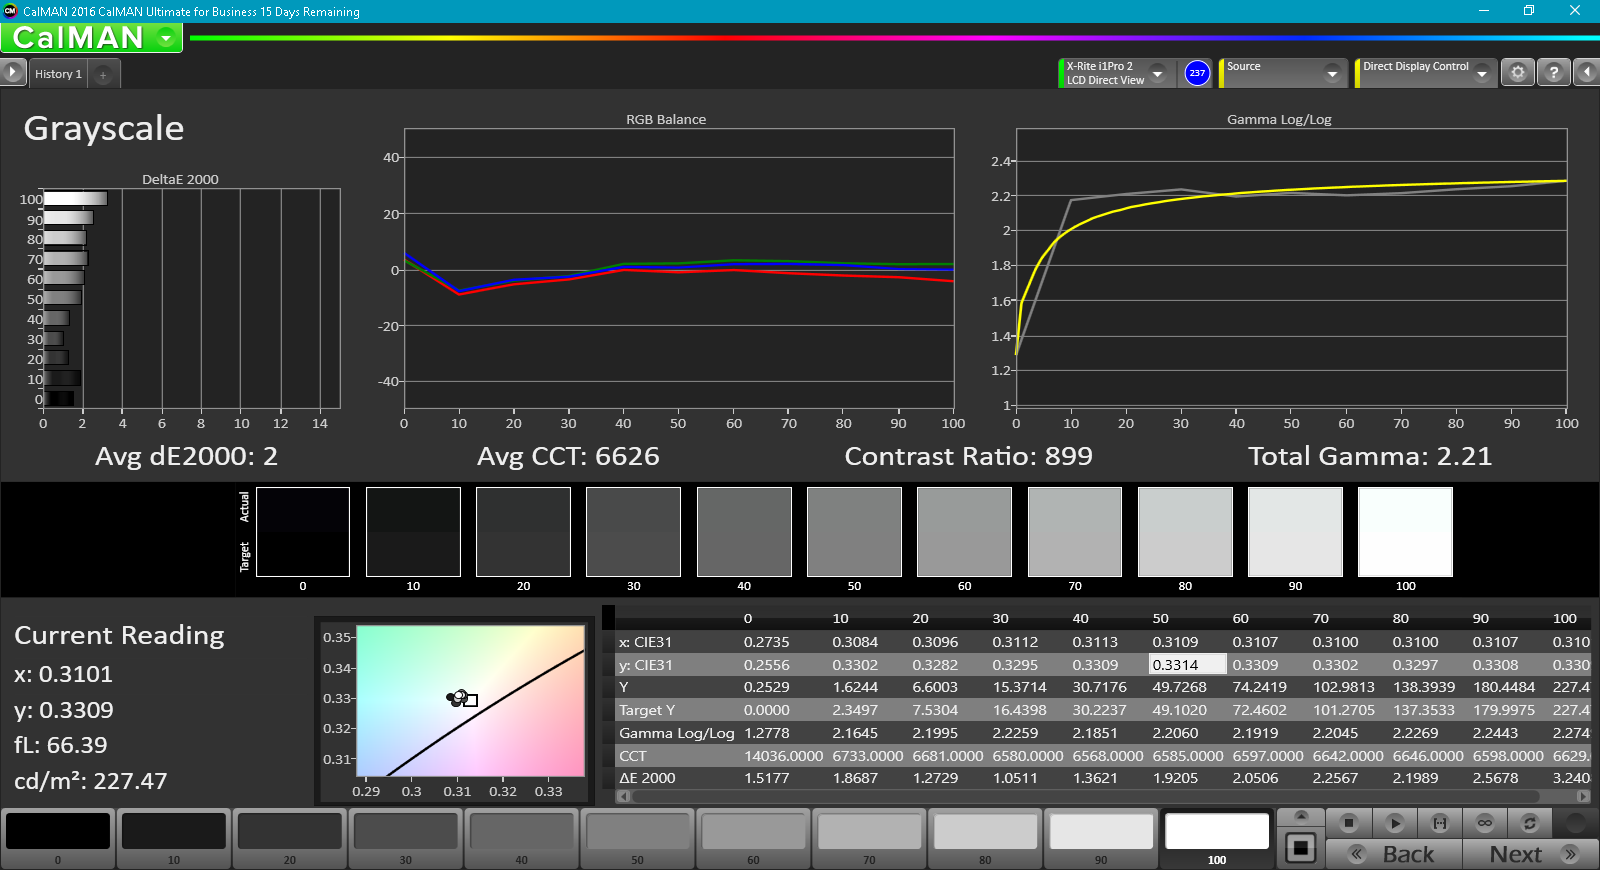
ΔE Greyscale Calman: 3.6 | ∀{0.09-98 Ø4.97}
55.4% sRGB (Argyll 1.6.3 3D)
35.2% AdobeRGB 1998 (Argyll 1.6.3 3D)
38.32% AdobeRGB 1998 (Argyll 3D)
55.6% sRGB (Argyll 3D)
37.07% Display P3 (Argyll 3D)
Gamma: 2.23
CCT: 7214 K
| Dell Inspiron 15 7000 7577 ID: LG Philips LGD053F, Name: 156WF6, Dell P/N: 4XK13, IPS, 15.6", 1920x1080 | Dell Inspiron 15 7000 7567 AU Optronics AUO38ED B156HTN 28H80, TN, 15.6", 1920x1080 | Acer Nitro 5 AN515-51-788E LG Philips LP156WF6-SPK6, IPS, 15.6", 1920x1080 | HP Omen 15-ce002ng AUO42ED, IPS, 15.6", 1920x1080 | Lenovo Legion Y520-15IKBN-80WK001KUS LP156WF6-SPK3, IPS, 15.6", 1920x1080 | |
|---|---|---|---|---|---|
| Display | -2% | 12% | 72% | ||
| Display P3 Coverage (%) | 37.07 | 36.42 -2% | 41.7 12% | 65.8 78% | |
| sRGB Coverage (%) | 55.6 | 54.9 -1% | 62.2 12% | 90.9 63% | |
| AdobeRGB 1998 Coverage (%) | 38.32 | 37.62 -2% | 43.17 13% | 66.5 74% | |
| Response Times | -16% | 11% | -17% | -48% | |
| Response Time Grey 50% / Grey 80% * (ms) | 35.6 ? | 36 ? -1% | 35 ? 2% | 43.2 ? -21% | 58.8 ? -65% |
| Response Time Black / White * (ms) | 27.6 ? | 36 ? -30% | 22 ? 20% | 31.2 ? -13% | 36 ? -30% |
| PWM Frequency (Hz) | 21550 ? | ||||
| Screen | -61% | 9% | 36% | -13% | |
| Brightness middle (cd/m²) | 235.4 | 246 5% | 276 17% | 304 29% | 239 2% |
| Brightness (cd/m²) | 223 | 235 5% | 265 19% | 289 30% | 244 9% |
| Brightness Distribution (%) | 91 | 75 -18% | 91 0% | 86 -5% | 88 -3% |
| Black Level * (cd/m²) | 0.28 | 0.55 -96% | 0.25 11% | 0.26 7% | 0.35 -25% |
| Contrast (:1) | 841 | 447 -47% | 1104 31% | 1169 39% | 683 -19% |
| Colorchecker dE 2000 * | 5.6 | 10.97 -96% | 5.06 10% | 3.46 38% | 7.3 -30% |
| Colorchecker dE 2000 max. * | 20.3 | 10.13 50% | 7.72 62% | 24.7 -22% | |
| Greyscale dE 2000 * | 3.6 | 14.25 -296% | 6.25 -74% | 2.46 32% | 4.9 -36% |
| Gamma | 2.23 99% | 1.83 120% | 1.76 125% | 2.38 92% | 2.19 100% |
| CCT | 7214 90% | 11200 58% | 6873 95% | 6915 94% | 7332 89% |
| Color Space (Percent of AdobeRGB 1998) (%) | 35.2 | 35 -1% | 40 14% | 59 68% | 35 -1% |
| Color Space (Percent of sRGB) (%) | 55.4 | 55 -1% | 62 12% | 91 64% | 55 -1% |
| Total Average (Program / Settings) | -26% /
-42% | 11% /
10% | 30% /
36% | -31% /
-18% |
* ... smaller is better
Color space is only 55 percent and 35 percent of the sRGB and AdobeRGB standards, respectively, compared to over 91 percent and 59 percent on the AU Optronics panel found on the Omen 15. It's disappointing to see that gamut has not improved at all over the outgoing Inspiron 7567. The limited color space matters little for gaming and browsing, but most Ultrabooks and costlier gaming notebooks like the Asus UX550 series offer deeper and potentially more accurate colors for users who demand them.
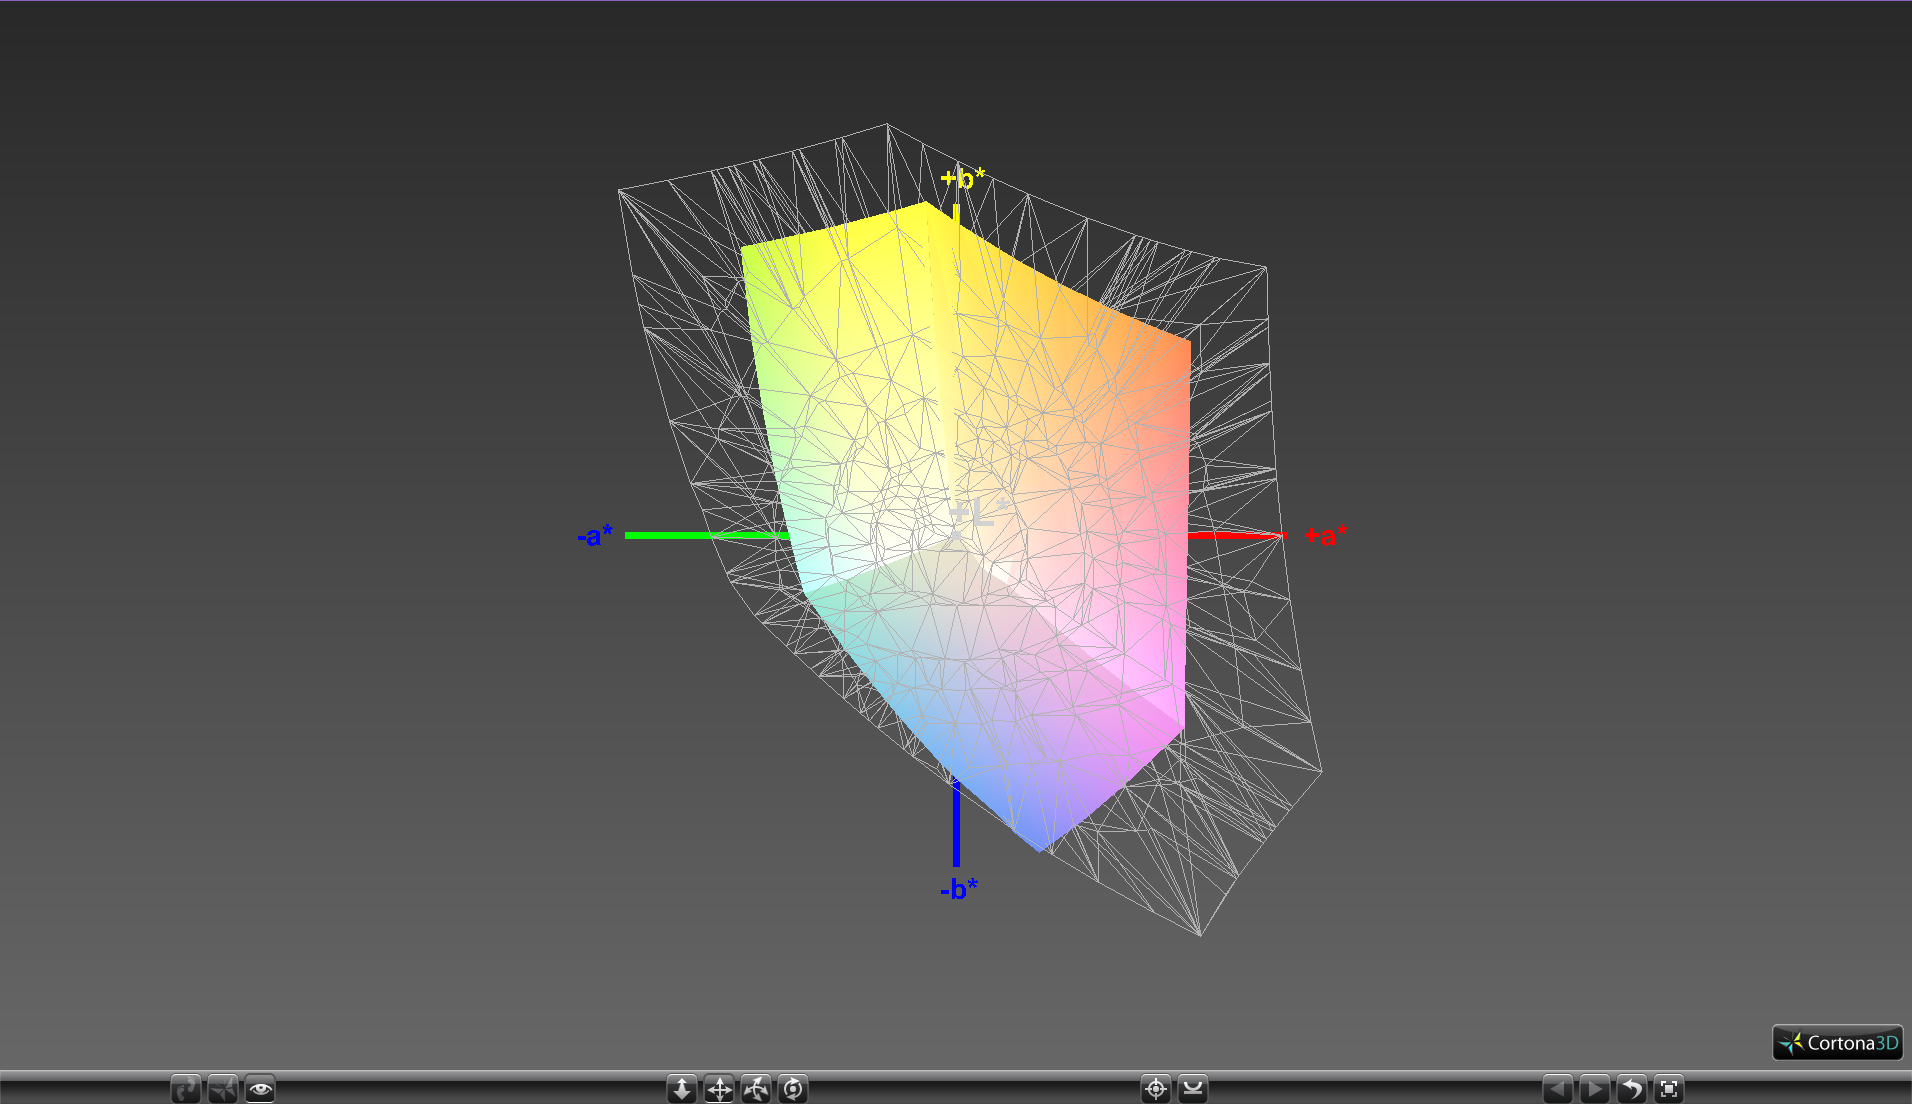
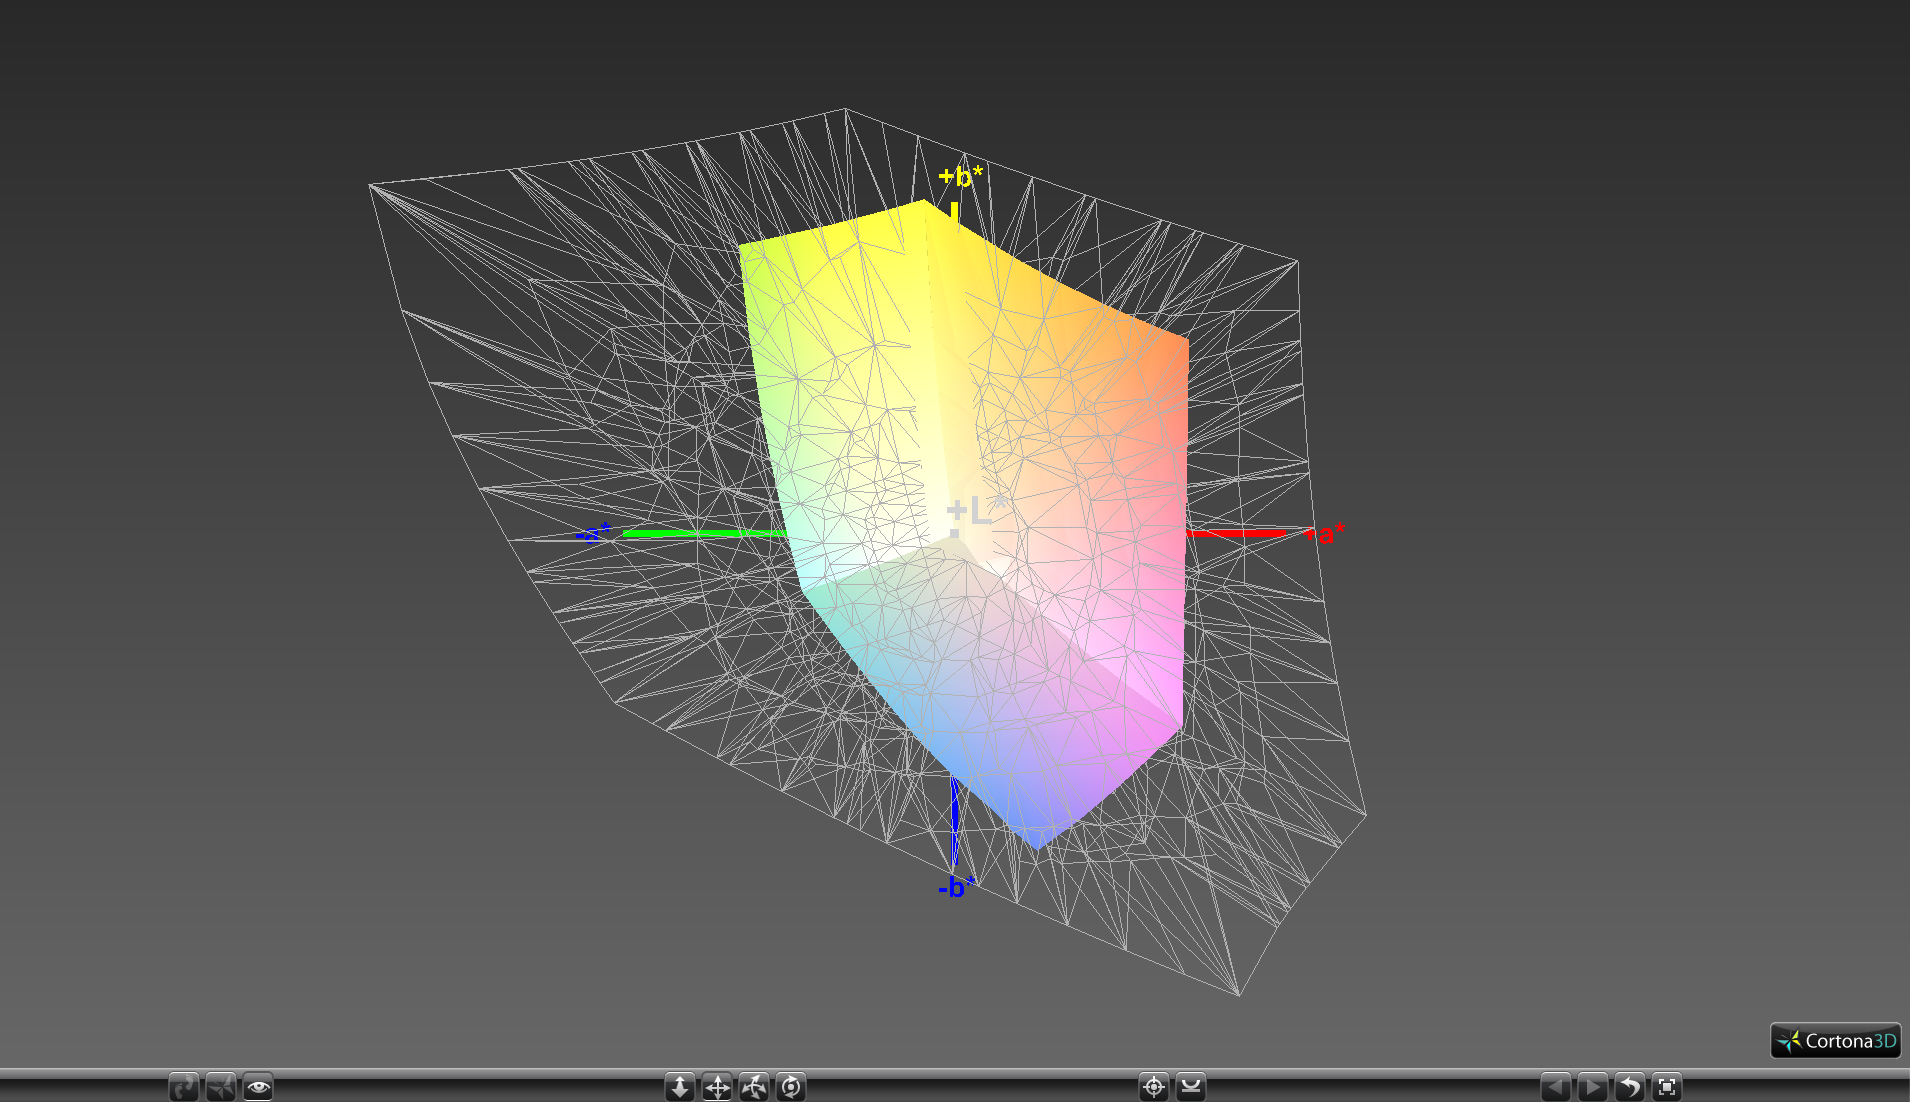
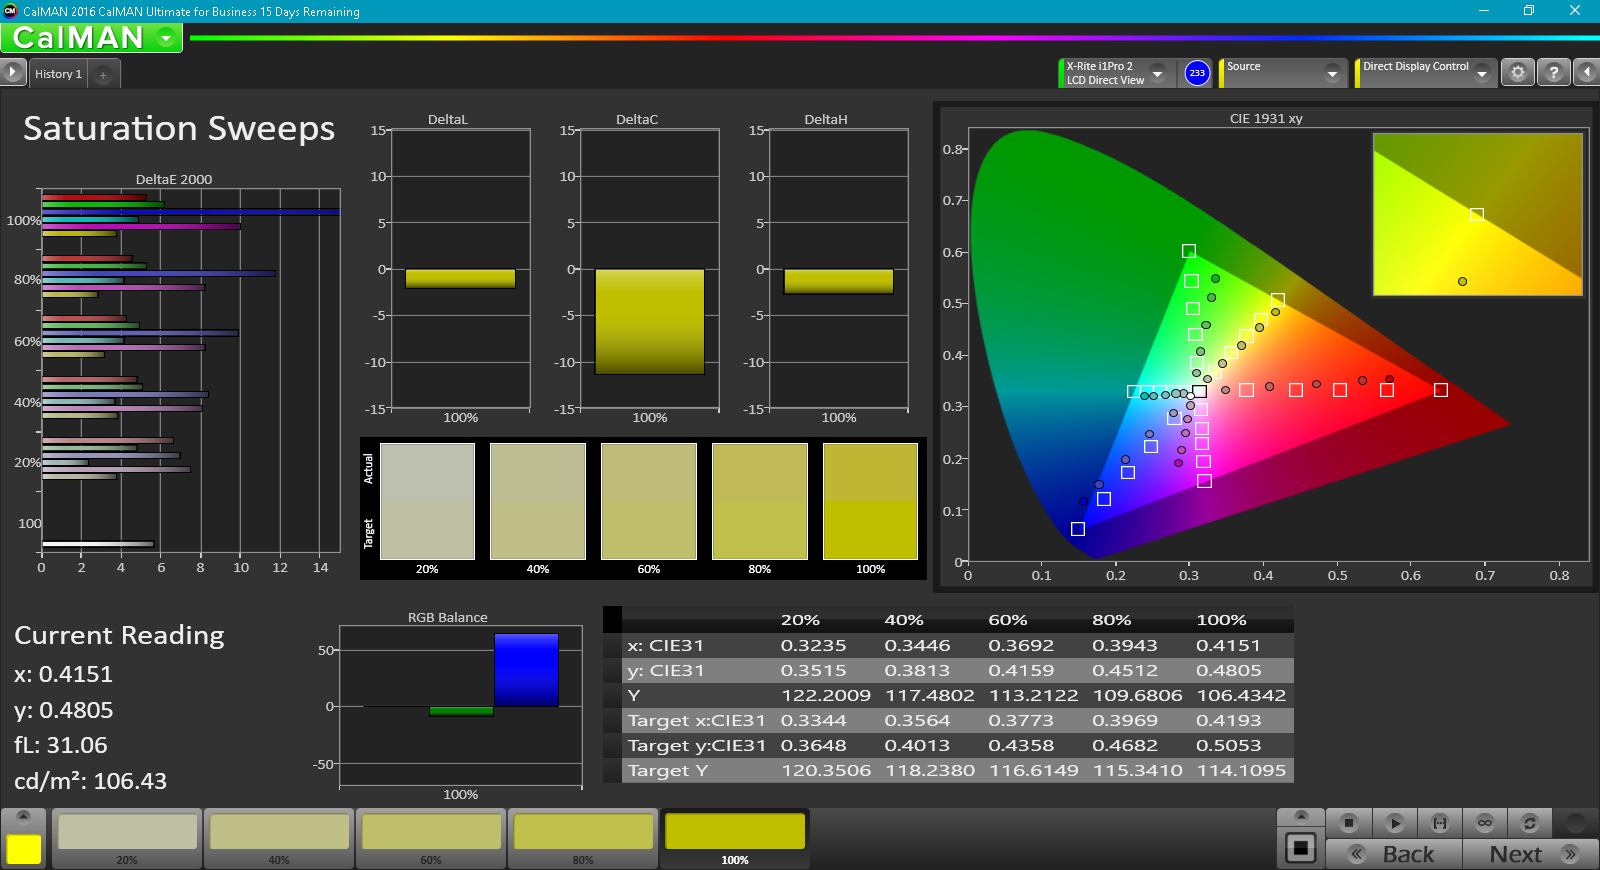
Further measurements with a X-Rite spectrophotometer reveal moderately imbalanced colors and an average grayscale. Colors like Yellow and Teal are relatively stable across all saturation levels while others like Magenta and especially Blue become more inaccurate the higher the saturation level. The color unevenness and limited gamut make for a poor display for digital artists.
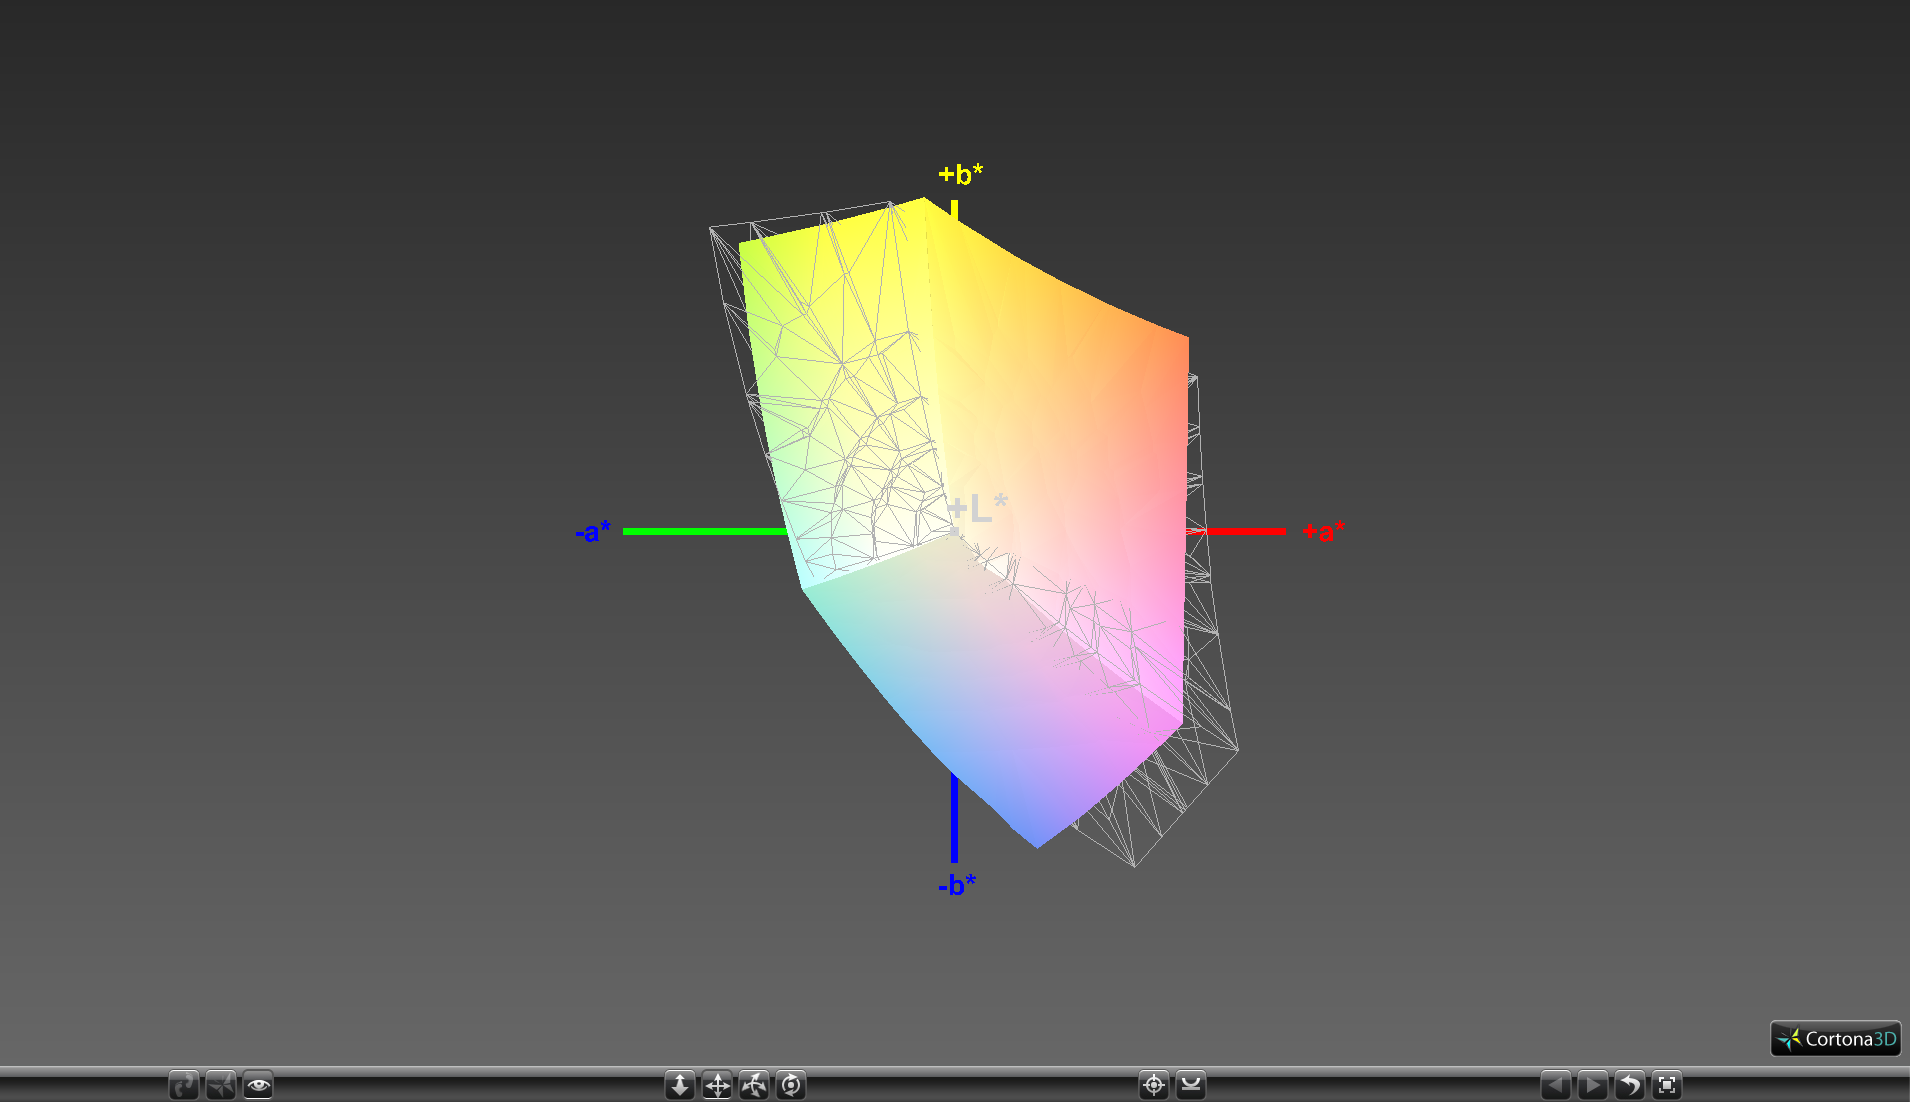
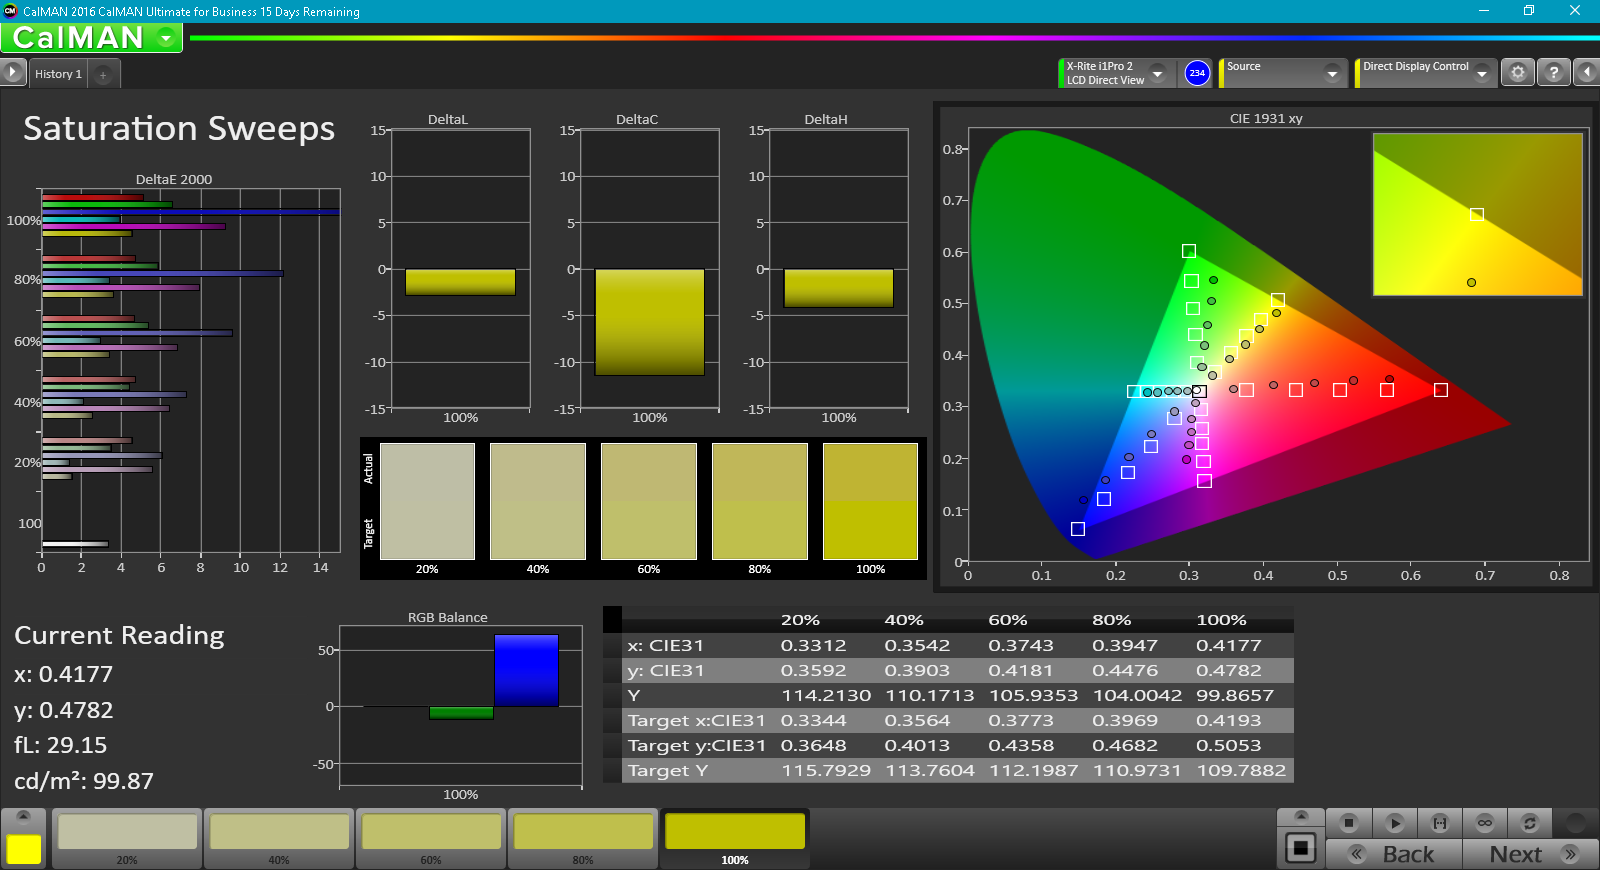
Grayscale and colors improve noticeably after calibration. Nonetheless, colors still become increasingly inaccurate at higher saturation levels due to the narrow gamut of the panel. Magenta and Blue in particular remain the most inaccurate colors.
Display Response Times
| ↔ Response Time Black to White | ||
|---|---|---|
| 27.6 ms ... rise ↗ and fall ↘ combined | ↗ 15.6 ms rise | 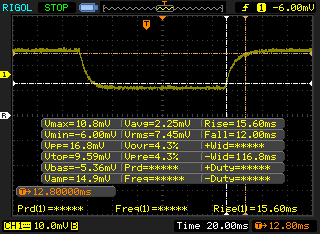 |
| ↘ 12 ms fall | ||
| The screen shows relatively slow response rates in our tests and may be too slow for gamers. In comparison, all tested devices range from 0.1 (minimum) to 240 (maximum) ms. » 70 % of all devices are better. This means that the measured response time is worse than the average of all tested devices (19.8 ms). | ||
| ↔ Response Time 50% Grey to 80% Grey | ||
| 35.6 ms ... rise ↗ and fall ↘ combined | ↗ 20 ms rise | 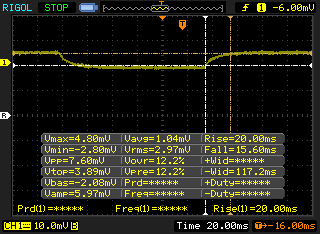 |
| ↘ 15.6 ms fall | ||
| The screen shows slow response rates in our tests and will be unsatisfactory for gamers. In comparison, all tested devices range from 0.165 (minimum) to 636 (maximum) ms. » 50 % of all devices are better. This means that the measured response time is worse than the average of all tested devices (31 ms). | ||
Screen Flickering / PWM (Pulse-Width Modulation)
| Screen flickering / PWM not detected | 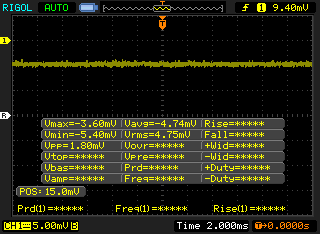 | ||
In comparison: 52 % of all tested devices do not use PWM to dim the display. If PWM was detected, an average of 7750 (minimum: 5 - maximum: 343500) Hz was measured. | |||
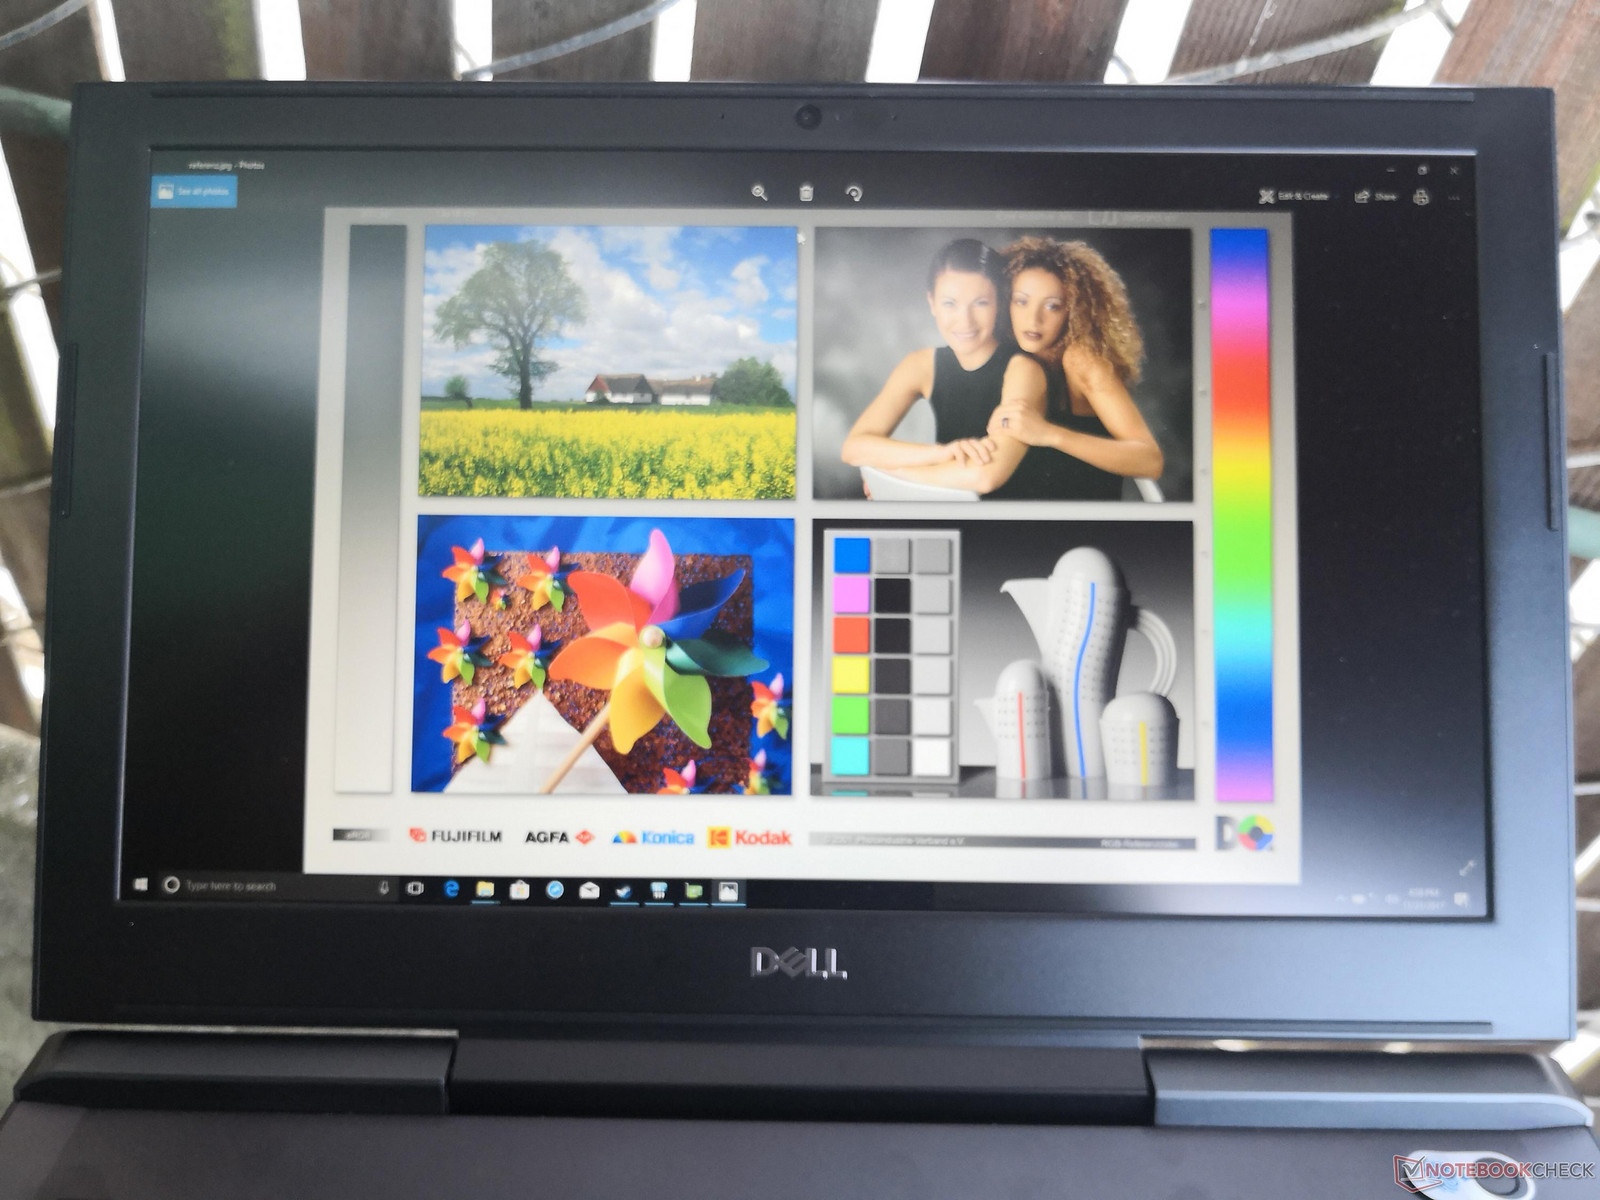
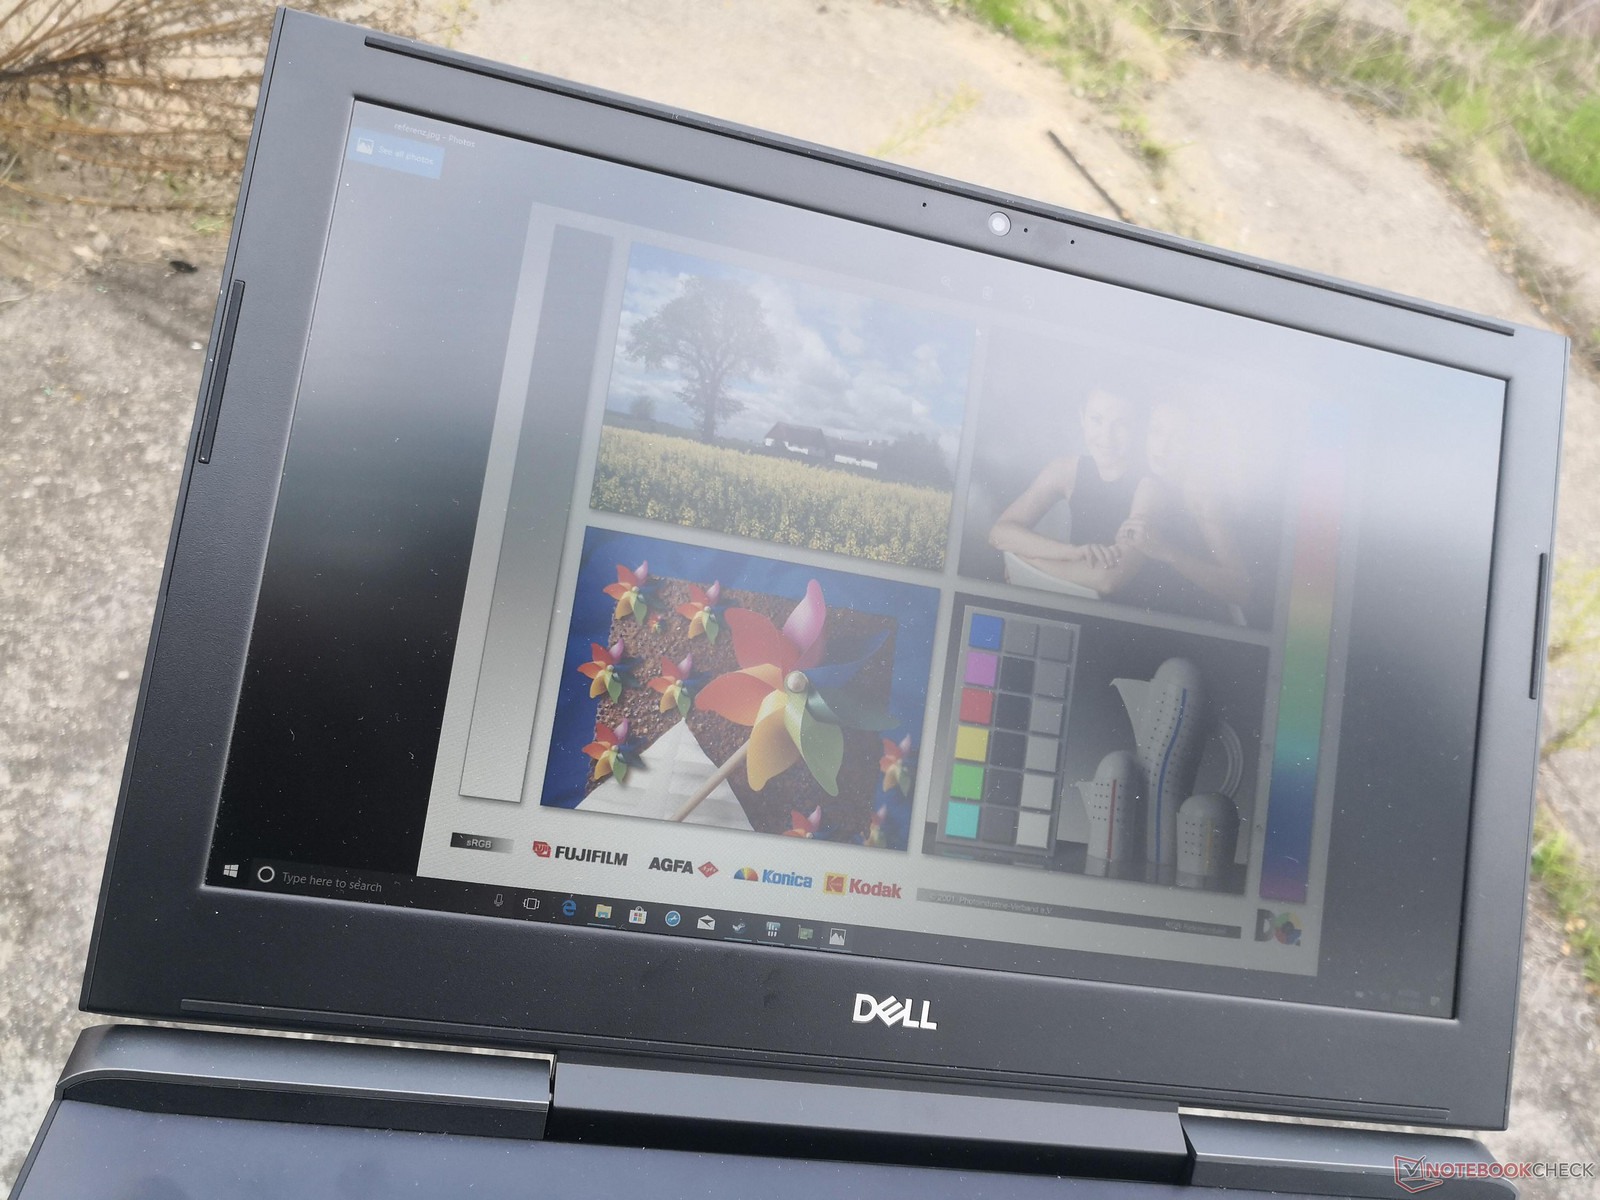
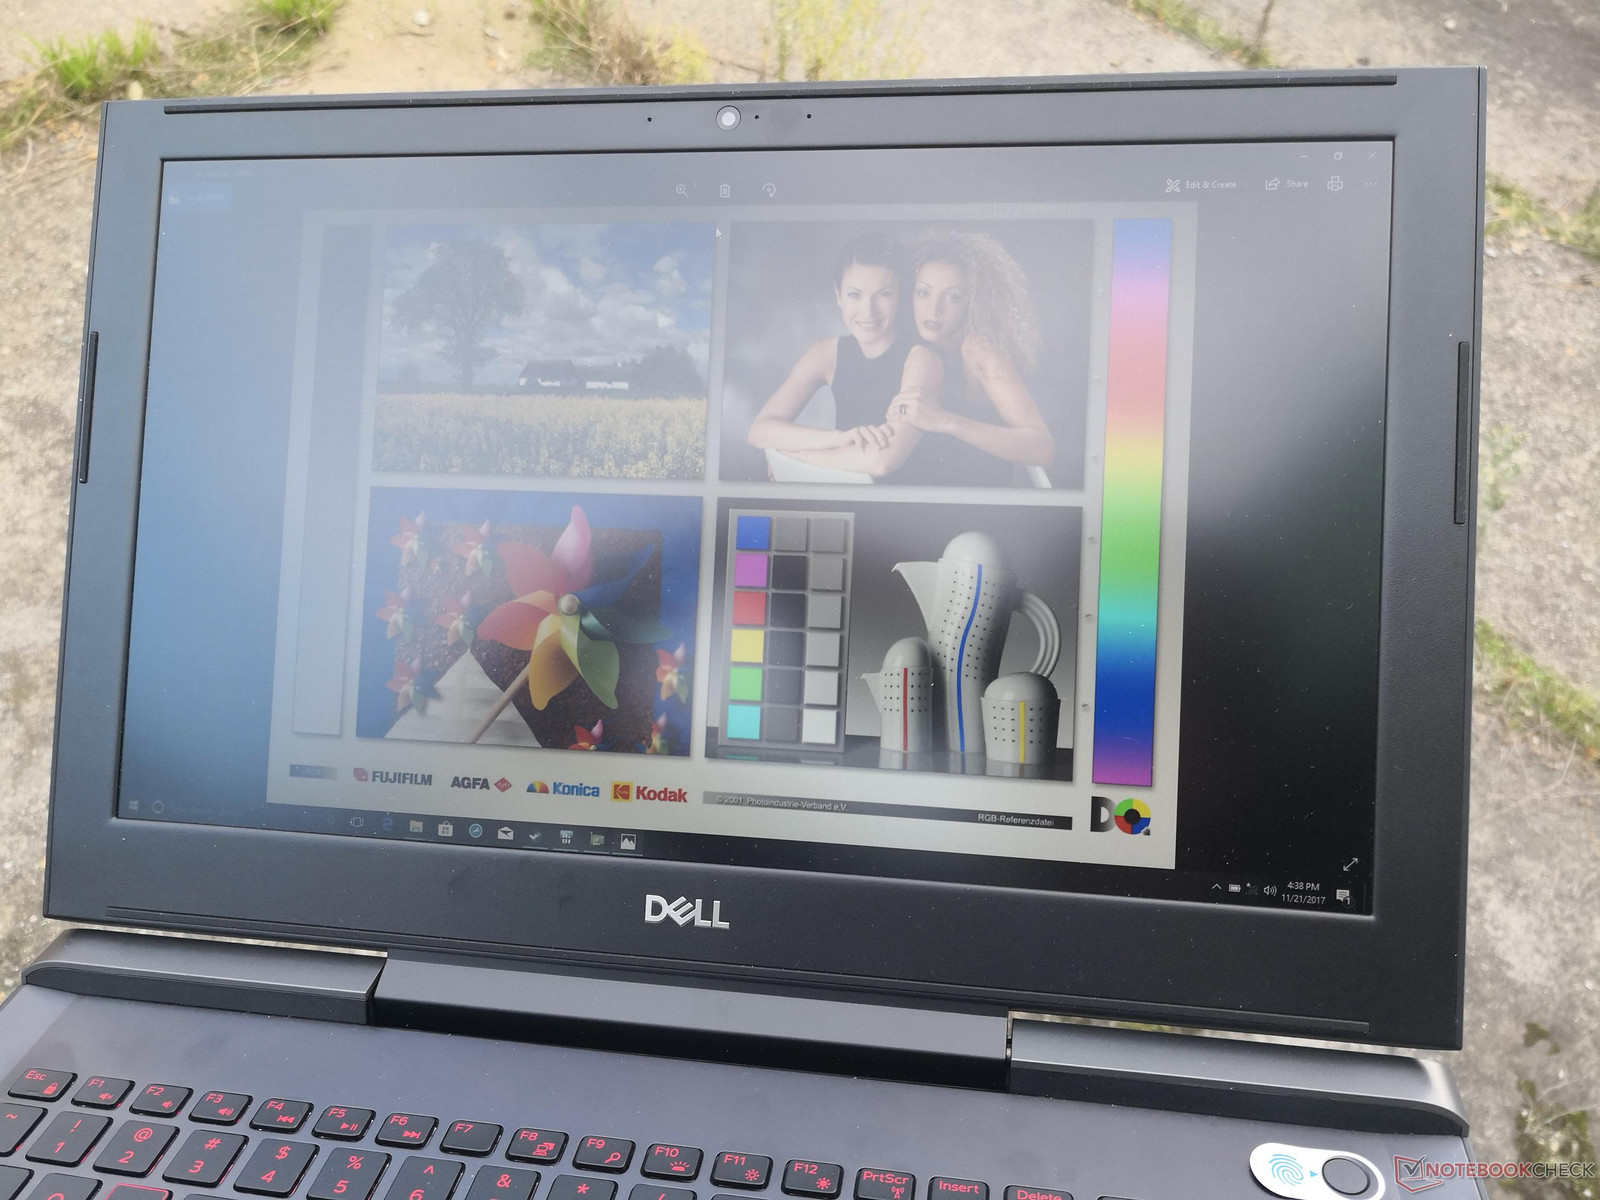
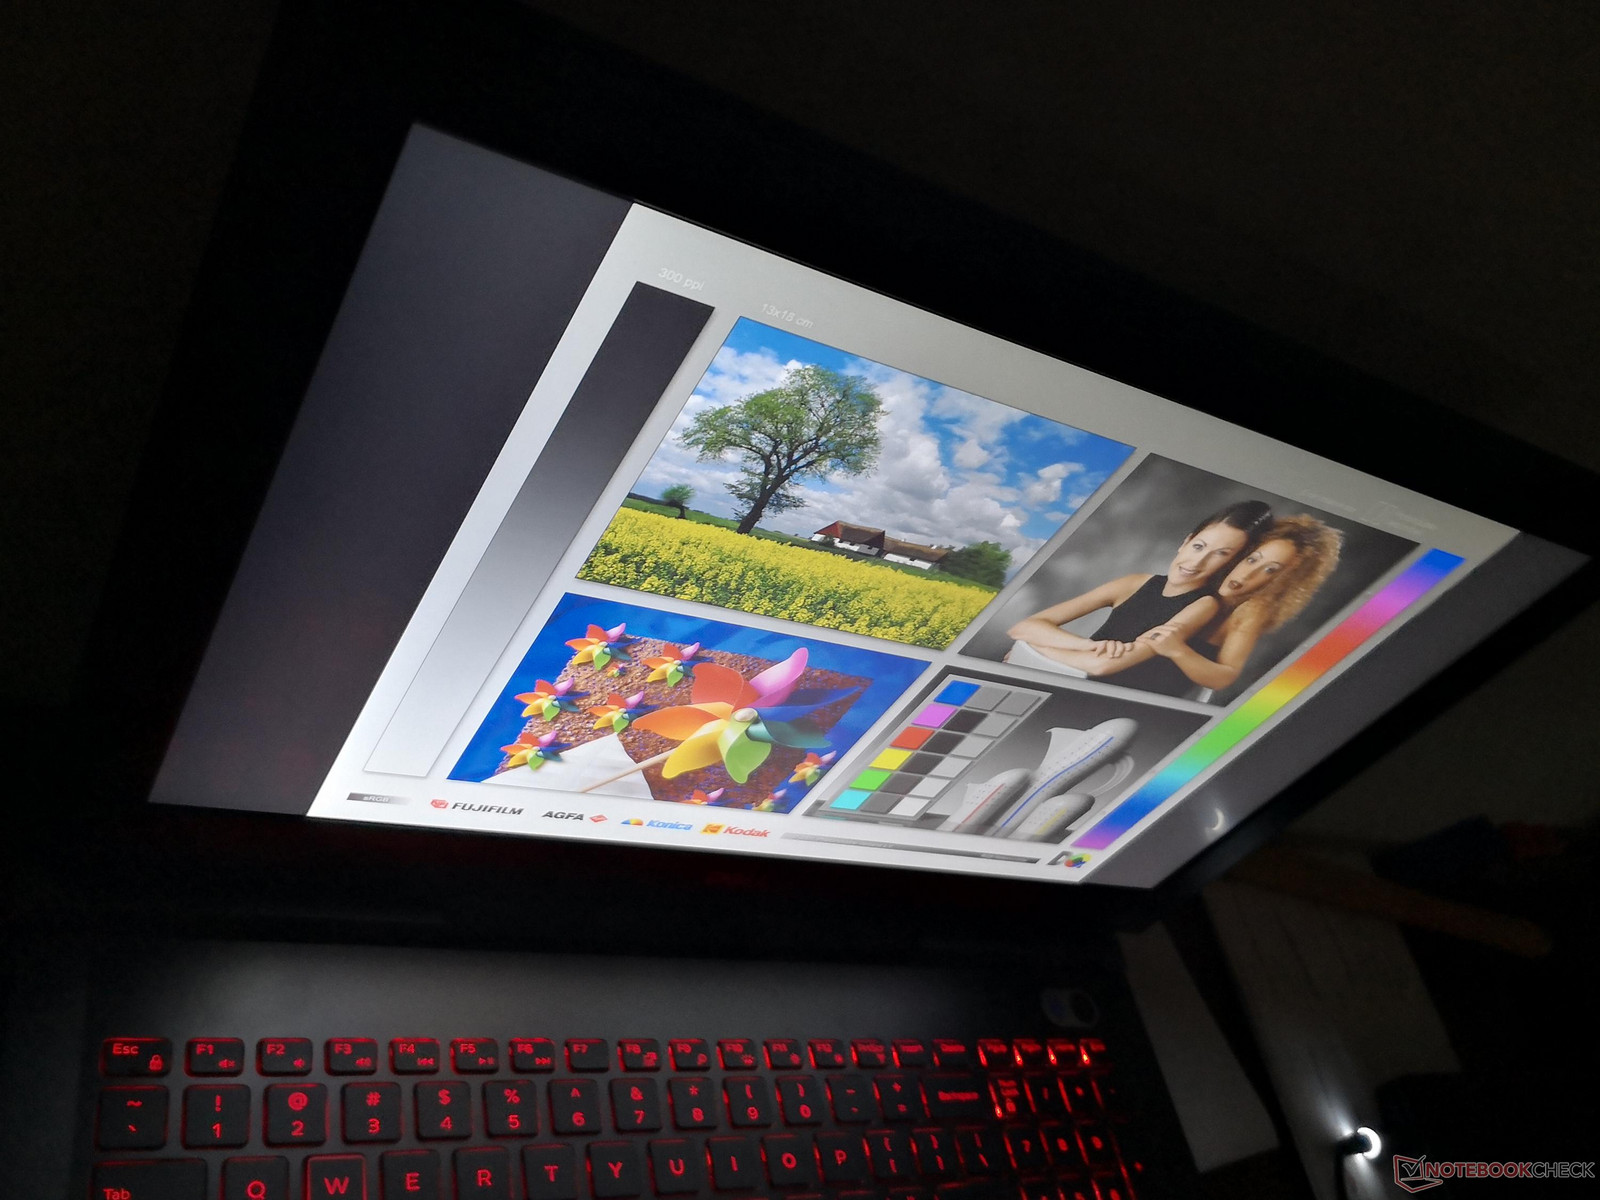
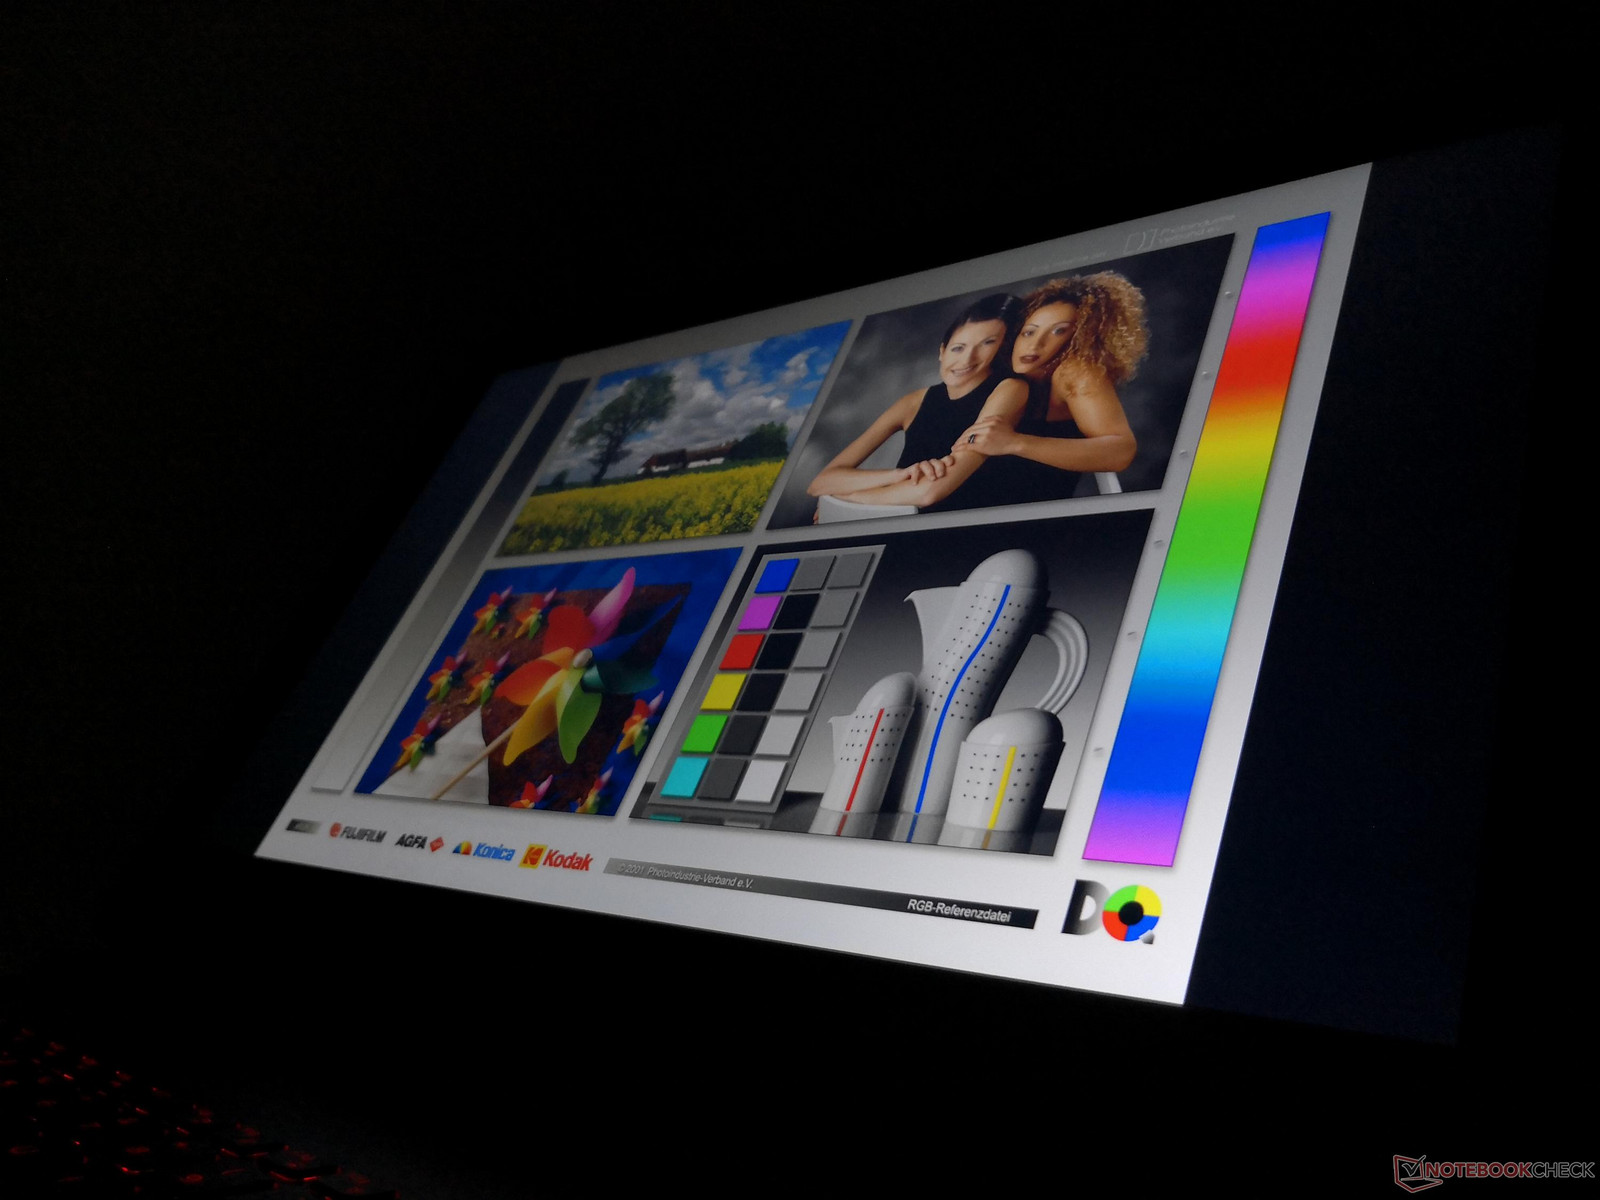
Outdoor visibility is passable under shade as the matte panel helps in reducing glare. Any brighter and colors immediately become washed out from the overwhelming ambient light. It's clear that the notebook was not designed for frequent outdoor use based solely on its middling backlight brightness. Viewing angles are otherwise very wide with no major yellowing or color shifting from extreme angles.
Performance
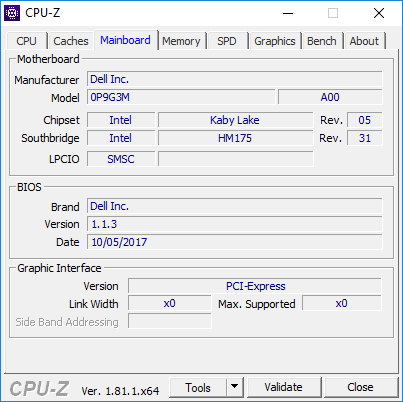
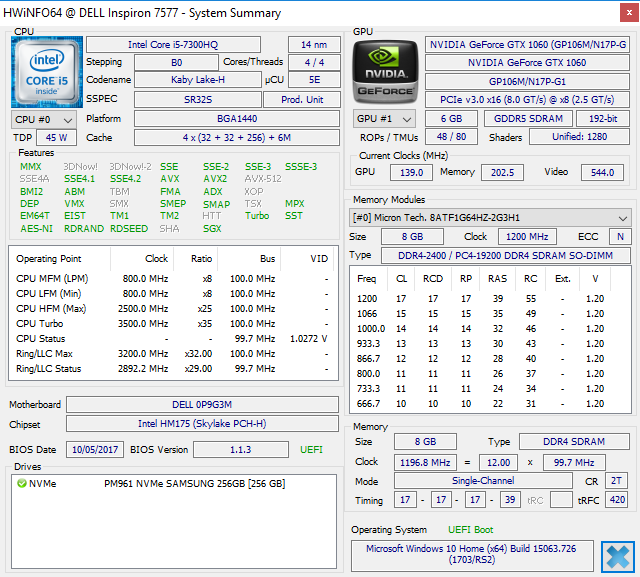
There have been no processor changes from the Inspiron 7567. The same quad-core i5-7300HQ and quad-core i7-7700HQ options remain just like on essentially every other gaming notebook of this year in the mainstream to high-end categories. We don't expect this to change anytime soon at least until both Ryzen Mobile and 45 W Coffee Lake CPUs become readily available.
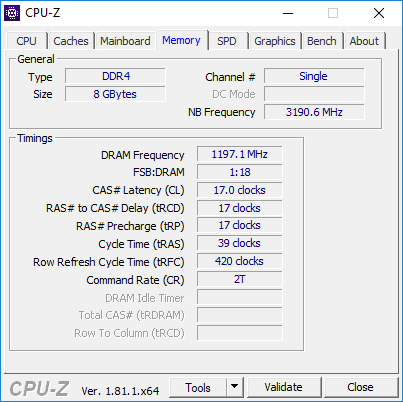
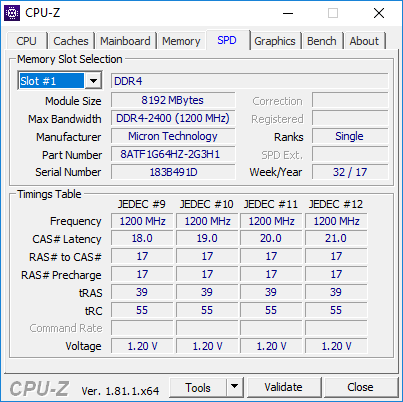
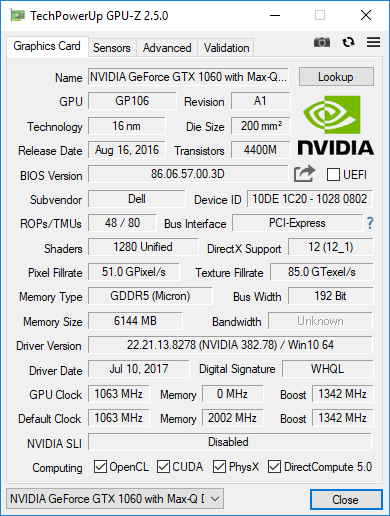
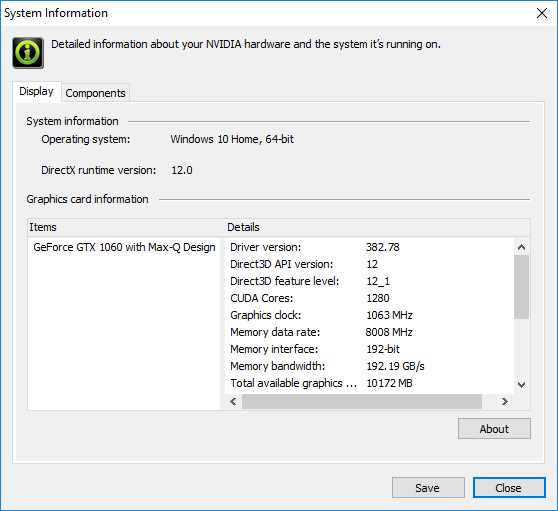
RAM options range from 8 GB up to 32 GB. Our test unit is equipped with only a single 8 GB module for single-channel performance. All SKUs share the same 6 GB GTX 1060 Max-Q GPU with Optimus, which is surprising as manufacturers will typically equip lower-end configurations with half the VRAM to cut costs.
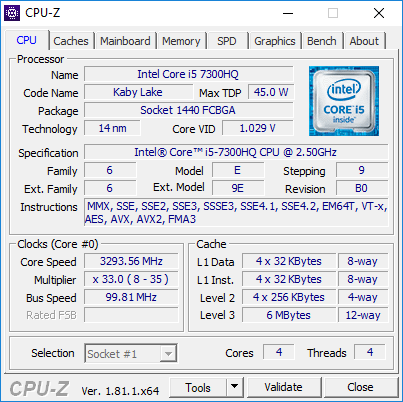
Processor
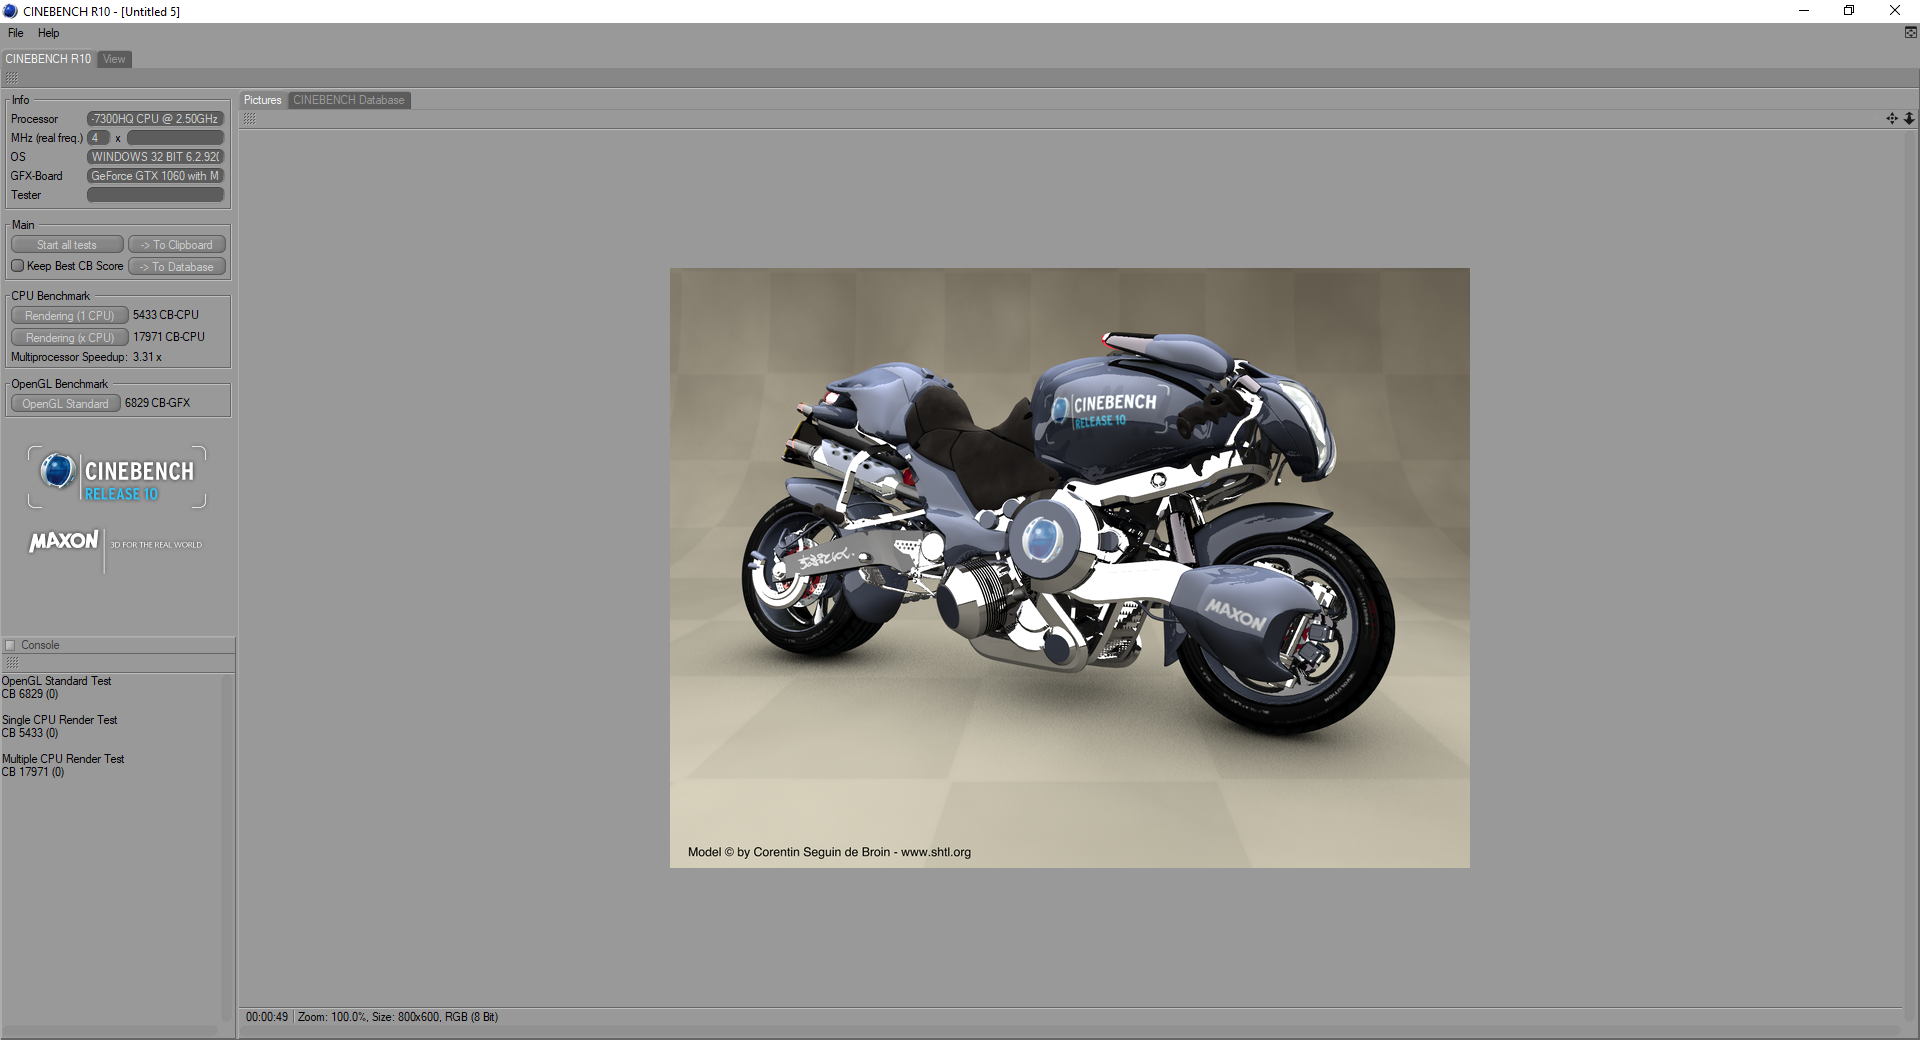
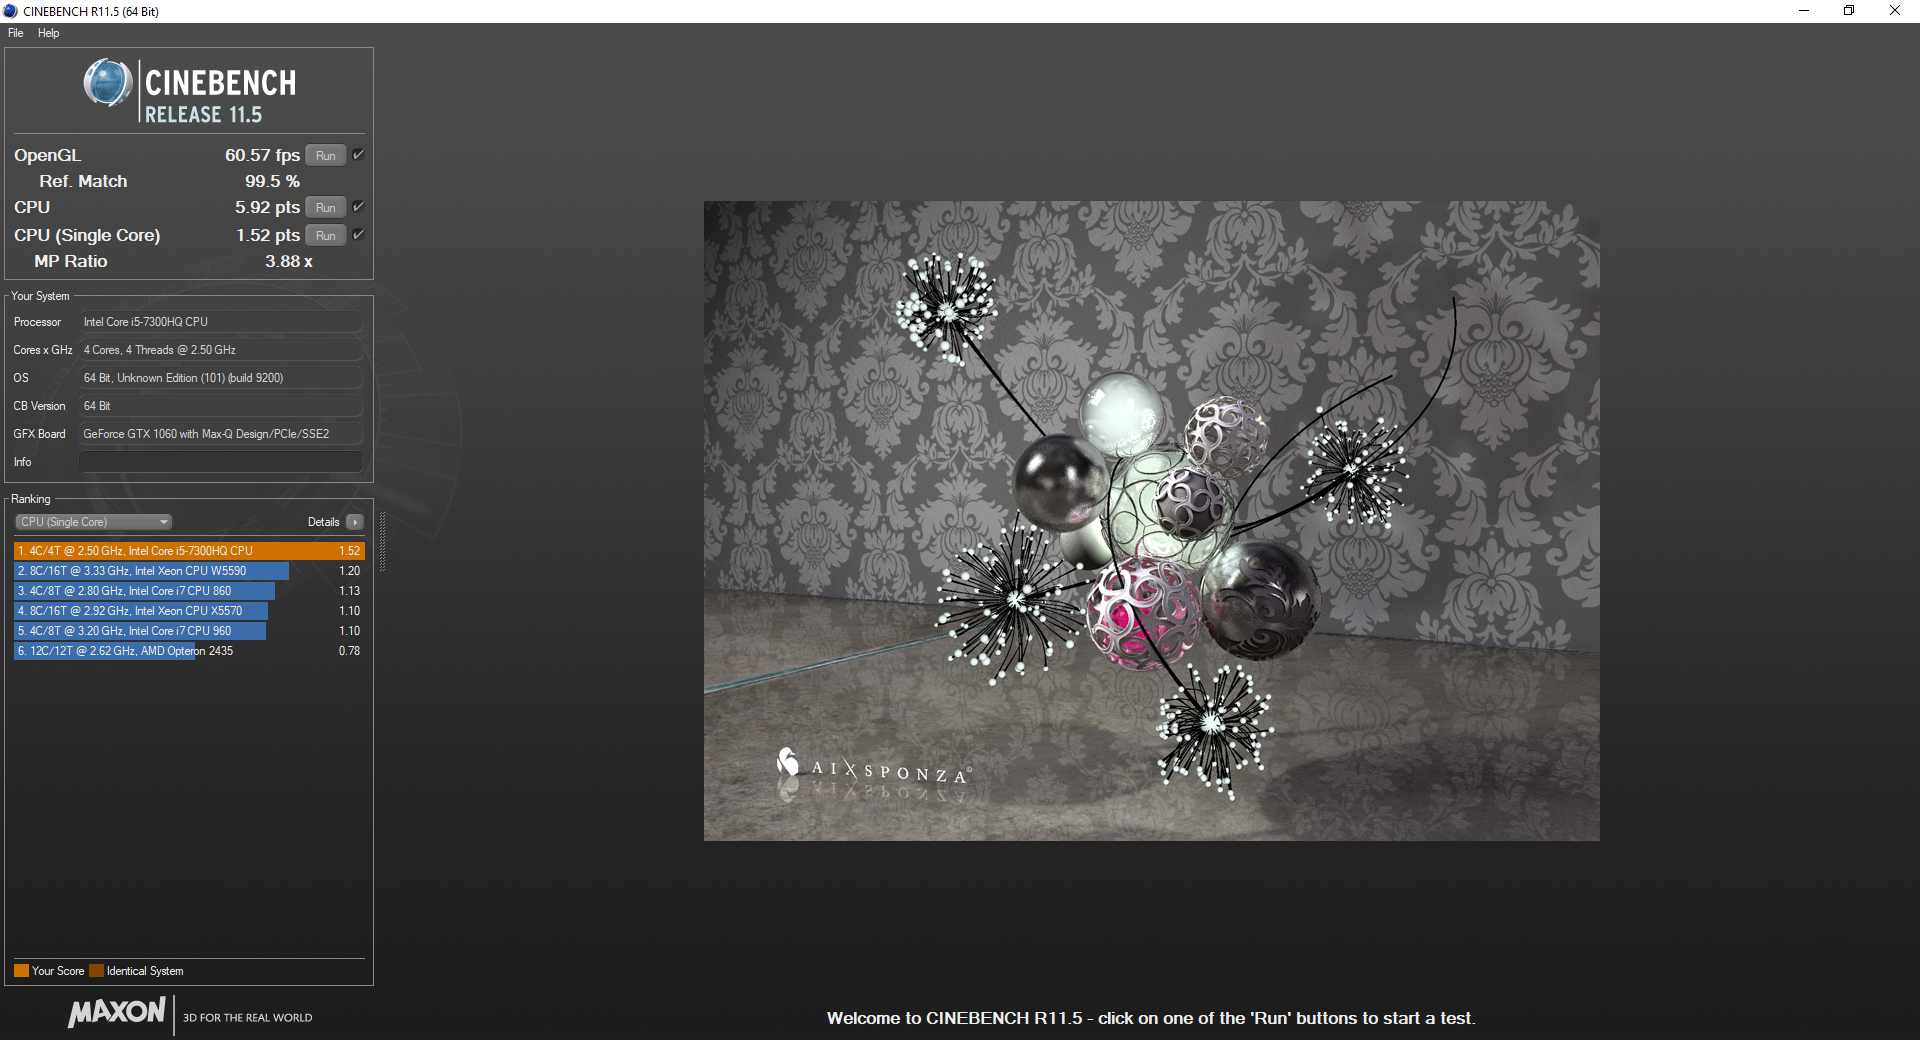
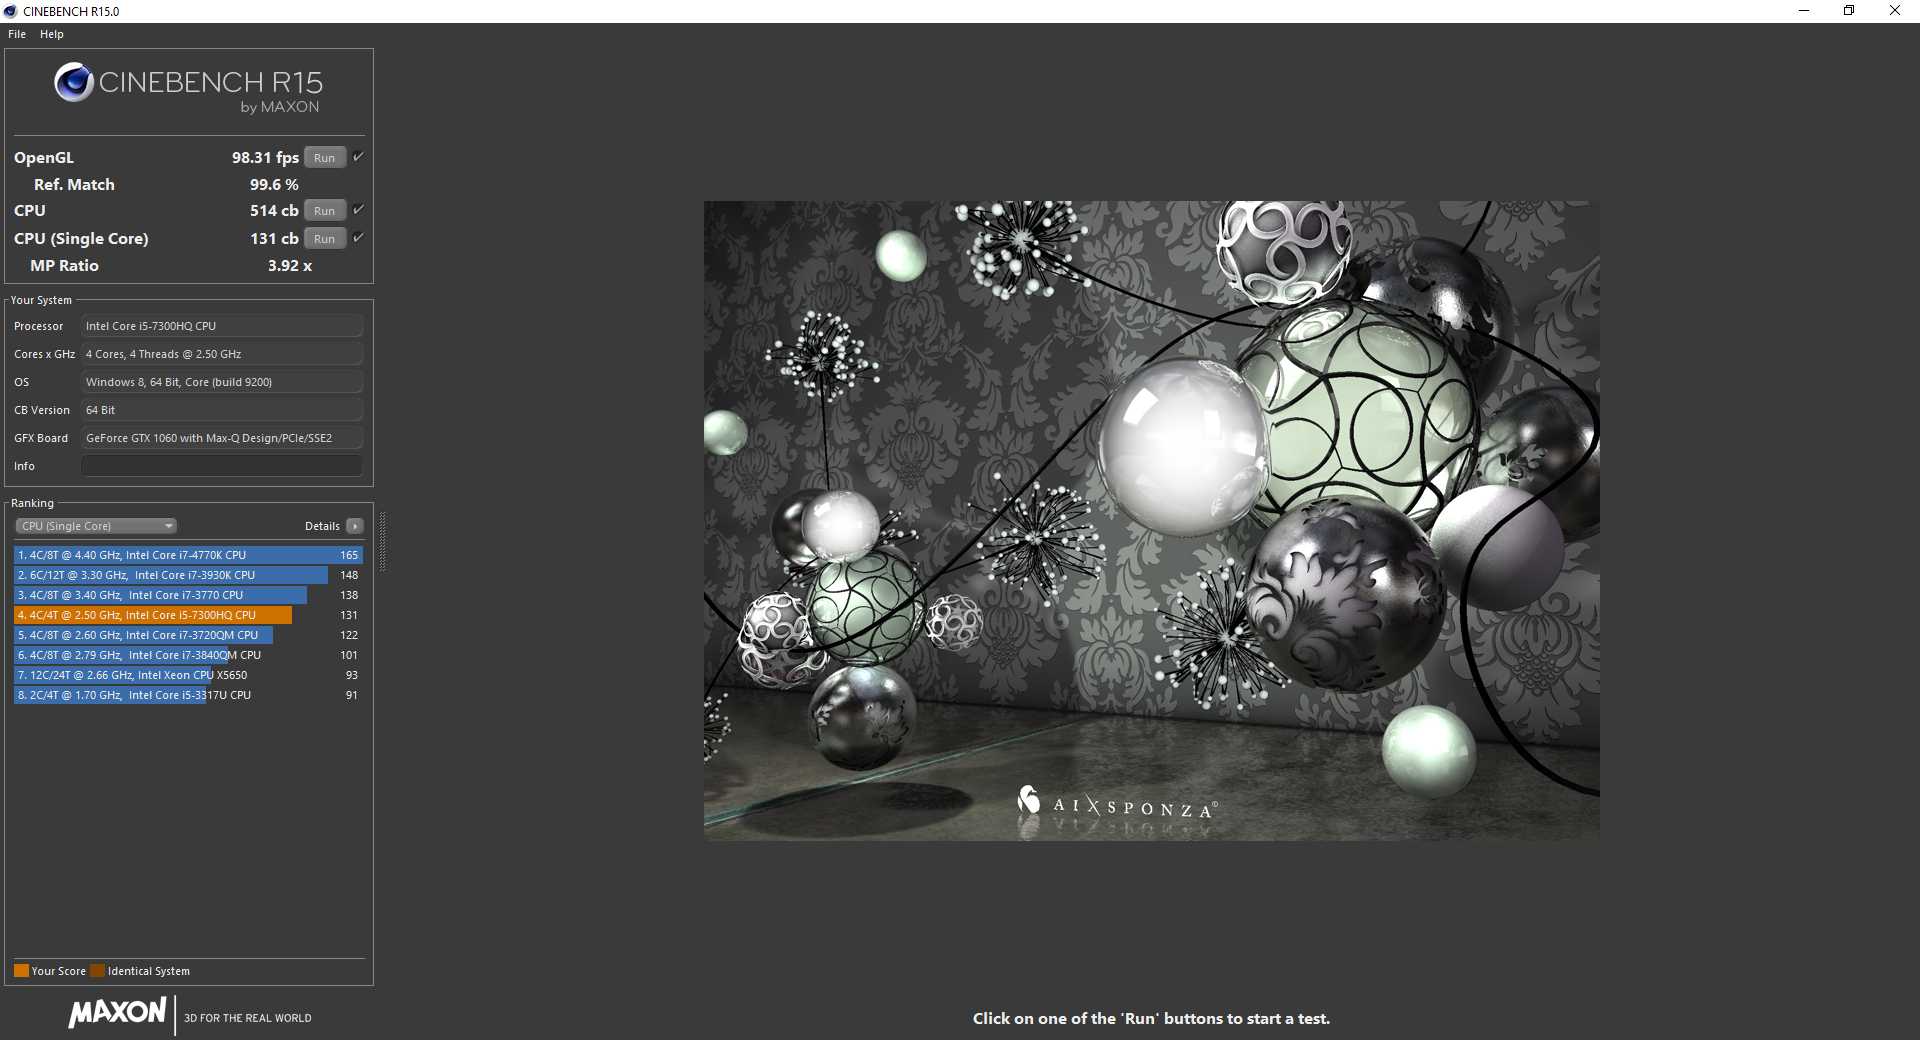
Unsurprisingly, the quad-core i5-7300HQ in the Inspiron 7577 performs similarly to the outgoing Inspiron 7567. Raw performance benefits over the Skylake i5-6300HQ are minimal at best while the more powerful quad-core i7-7700HQ will be anywhere from 25 to 45 percent faster depending on the operation according to CineBench benchmarks. The newer Ryzen 7 1700 and i7-8550U are also significantly faster than the i7-7300HQ in multi-core and single-core operations, respectively. In other words, this particular Core i5 CPU is beginning to show its age now that the next generation of processors from Intel and AMD are emerging.
CPU performance is stable with no throttling over long periods. Running CineBench R15 Multi-Thread in a loop results in stable scores over time as shown by our graph below. One notable outlier fell to as low as 360 points before bouncing back up to normal, but we believe this was due to automatic background activity kicking in rather than the processor itself. We reran the loop test to check and was unable to repeat the dip in score.
See our dedicated CPU page on the Core i5-7300HQ for more technical information and benchmark comparisons.
| wPrime 2.10 - 1024m | |
| Lenovo Yoga 920-13IKB-80Y7 | |
| Dell Inspiron 15 7000 7567 Gaming (Core i5-7300HQ, GTX 1050) | |
| Dell Inspiron 15 7000 7577 | |
| Lenovo IdeaPad Y50 | |
| Razer Blade Pro RZ09-0220 | |
* ... smaller is better
System Performance
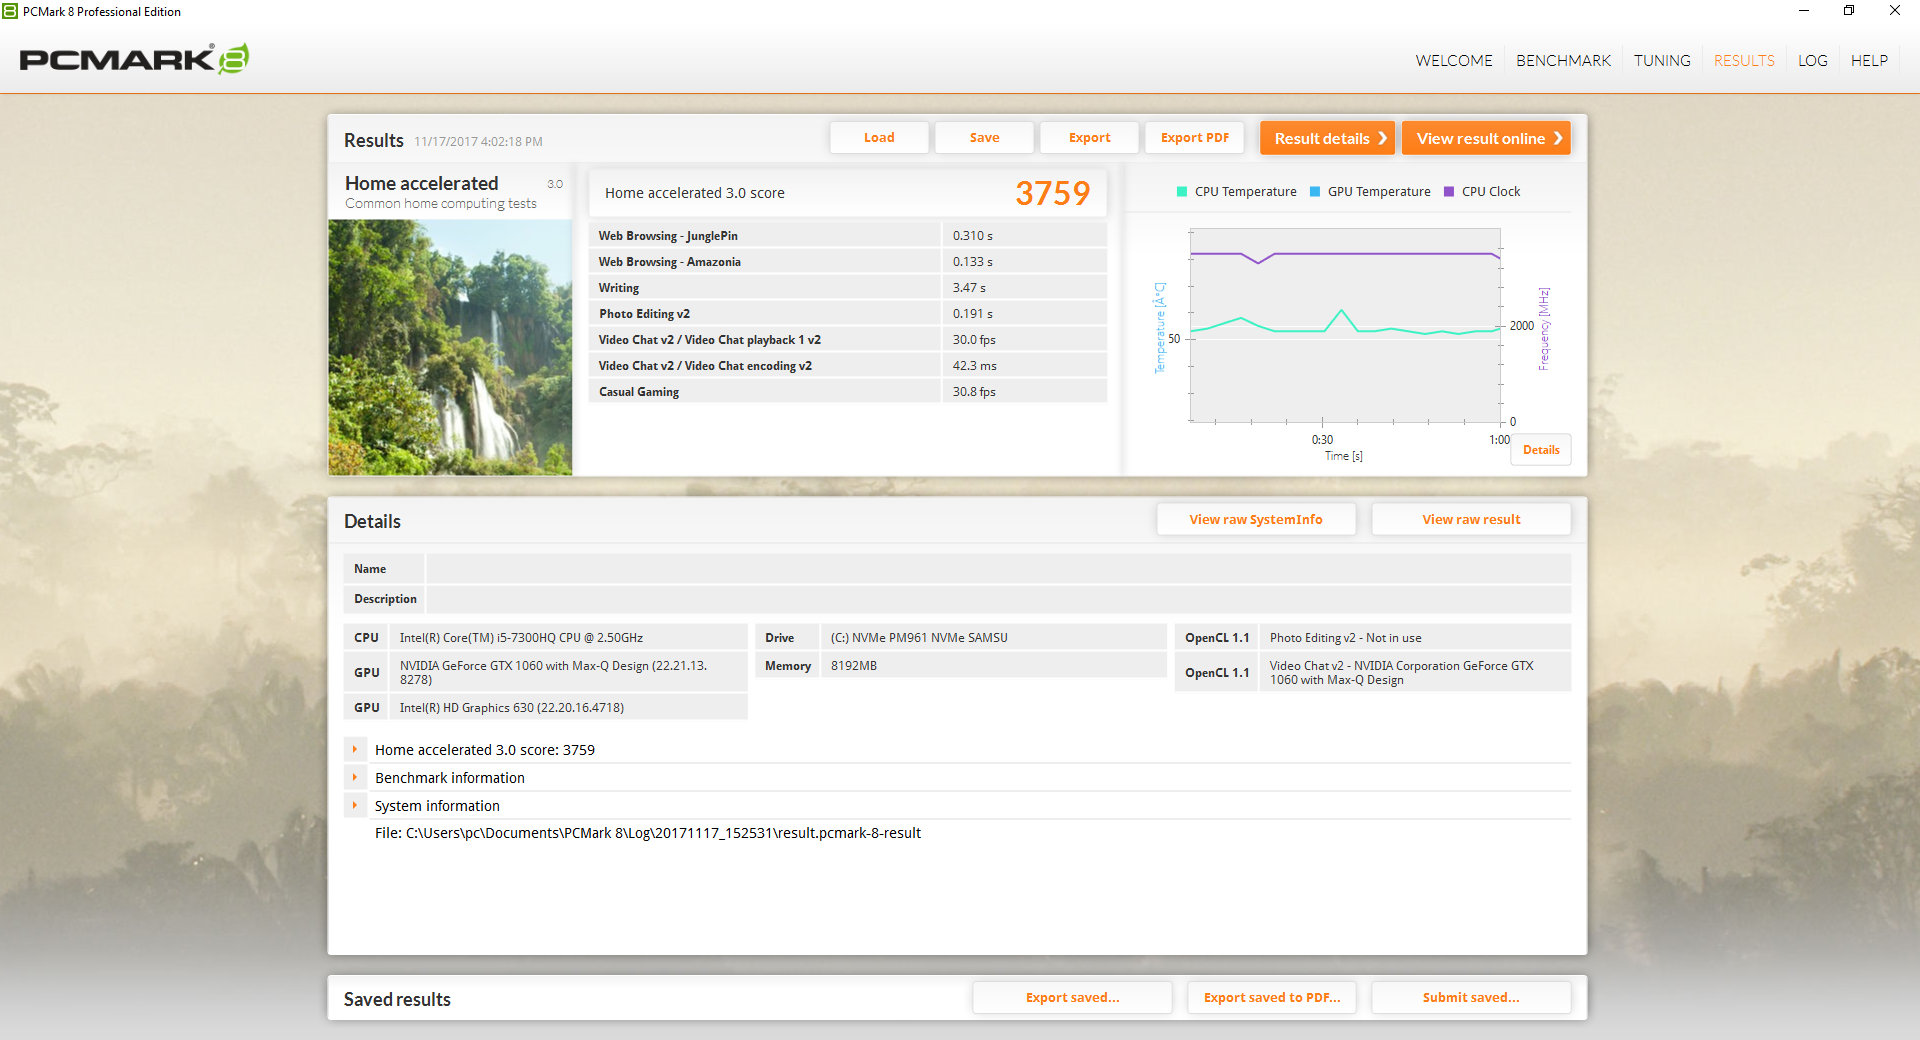
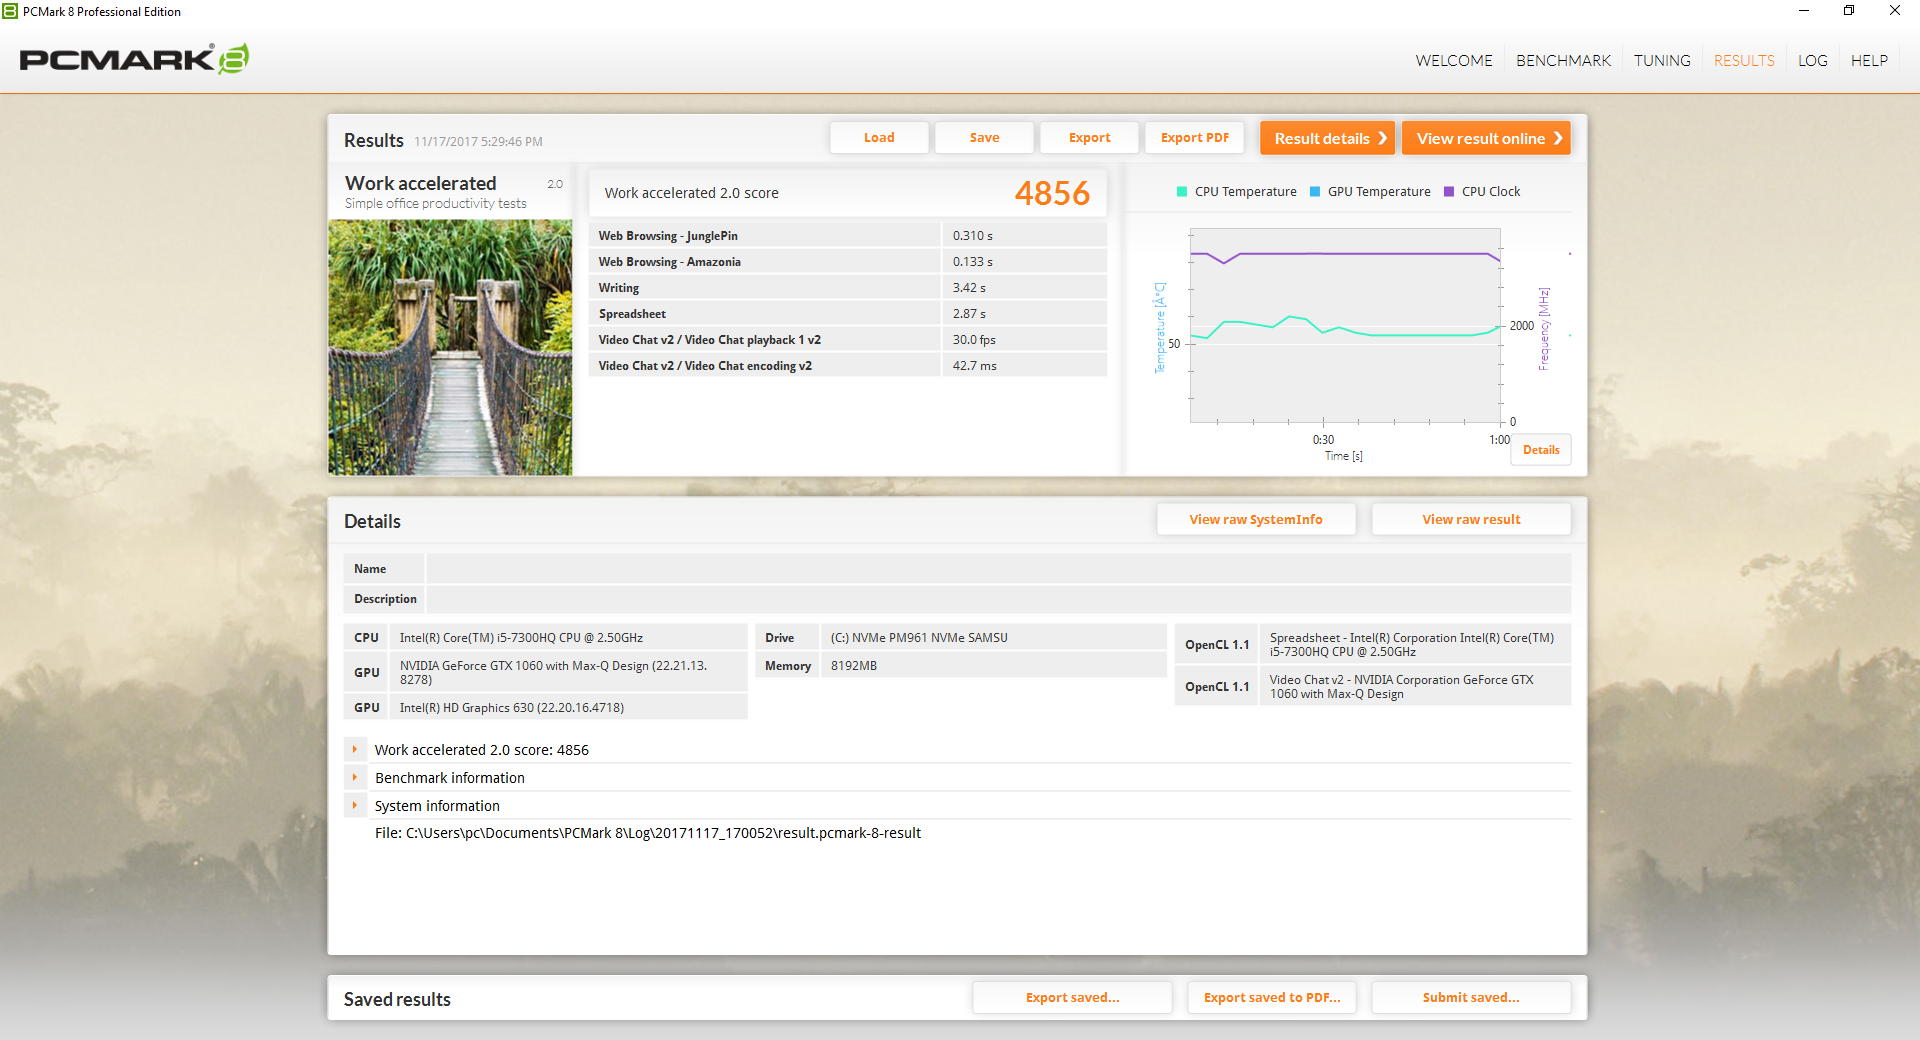
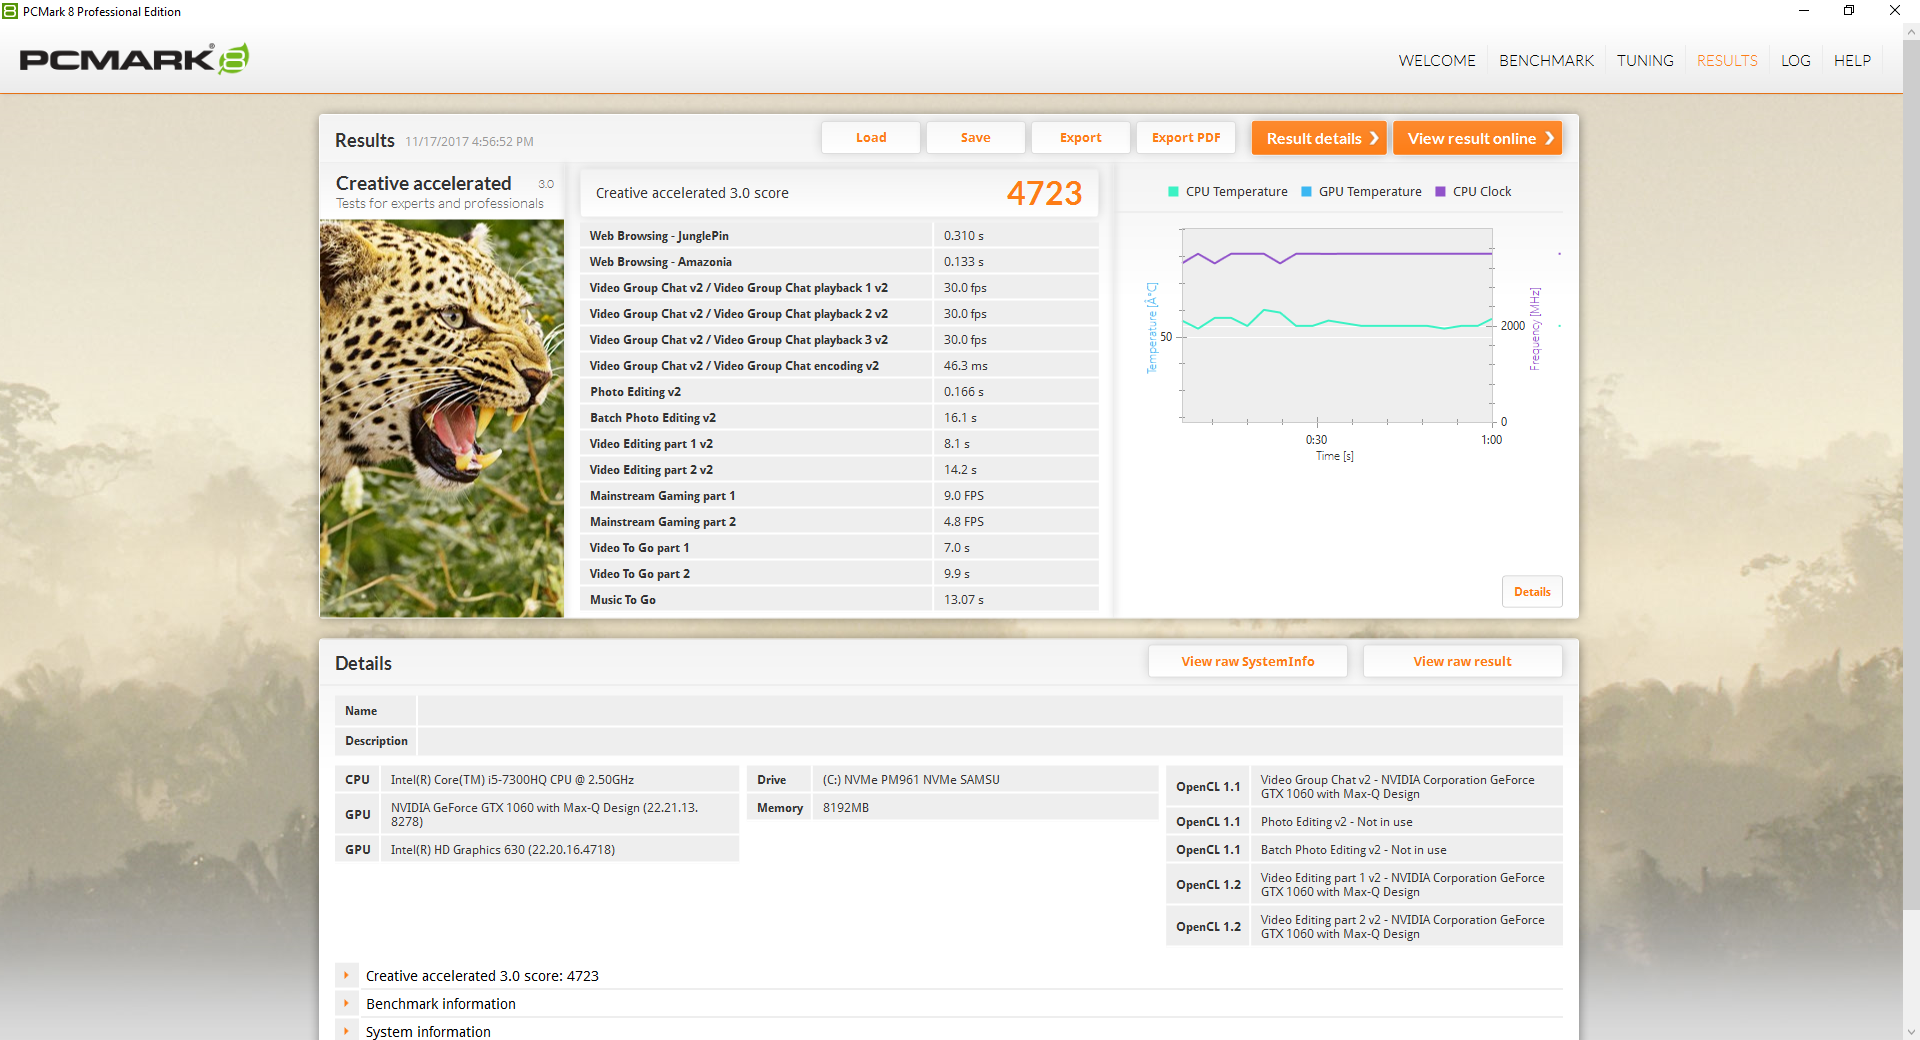
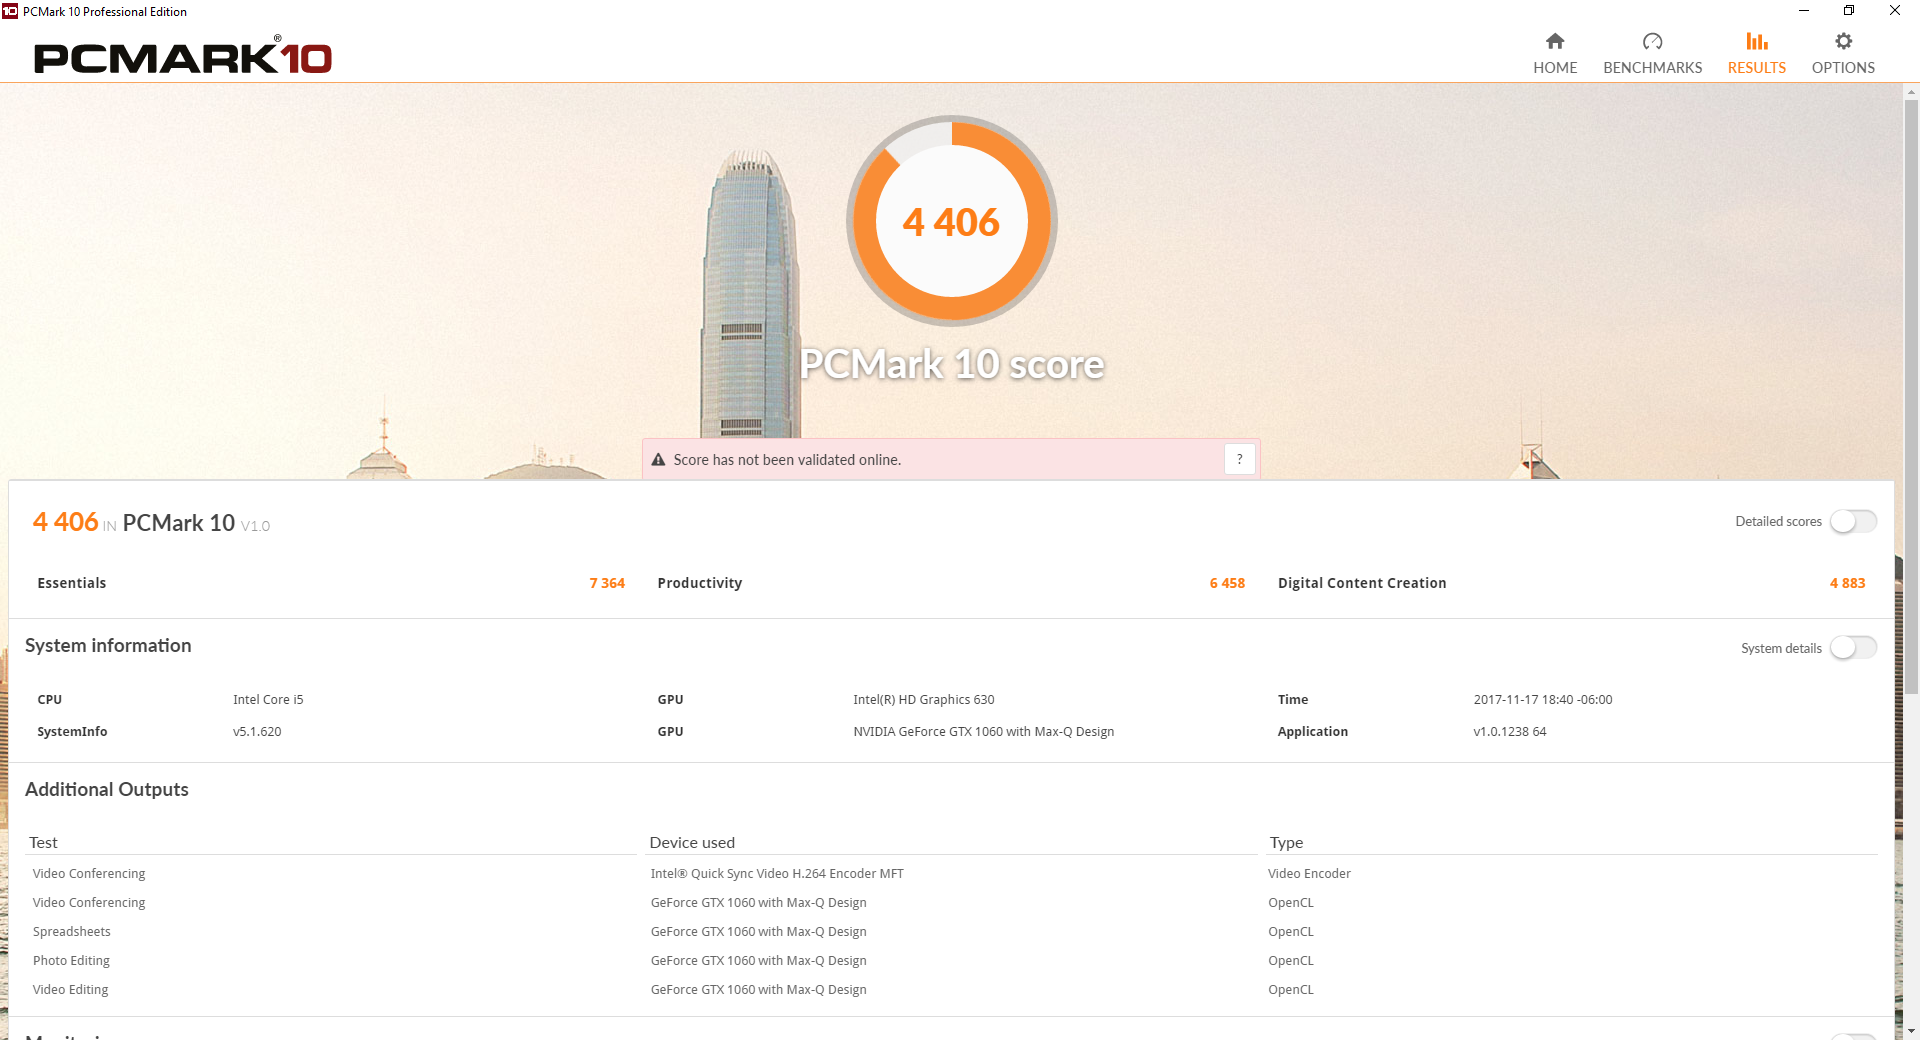
The Inspiron 7577 consistently outperforms the older Inspiron 7567 with the same i5-7300HQ CPU but slower GTX 1050 GPU. The higher-end Inspiron 7567 SKU with the quad-core i7-7700HQ CPU is still the more favorable system to PCMark due to the faster processor. Had our Inspiron 7577 test unit been the i7-7700HQ SKU instead, then our benchmark scores would have likely been higher.
We experienced no notable software hiccups during our time with the unit.
| PCMark 10 - Score | |
| Acer Nitro 5 AN515-51-788E | |
| Dell Inspiron 15 7000 7577 | |
| Dell Inspiron 15 7000 7567 Gaming (Core i5-7300HQ, GTX 1050) | |
| PCMark 8 Home Score Accelerated v2 | 3759 points | |
| PCMark 8 Creative Score Accelerated v2 | 4723 points | |
| PCMark 8 Work Score Accelerated v2 | 4856 points | |
| PCMark 10 Score | 4406 points | |
Help | ||
Storage Devices
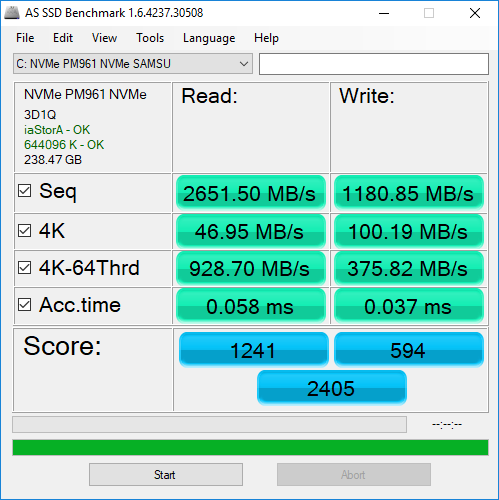
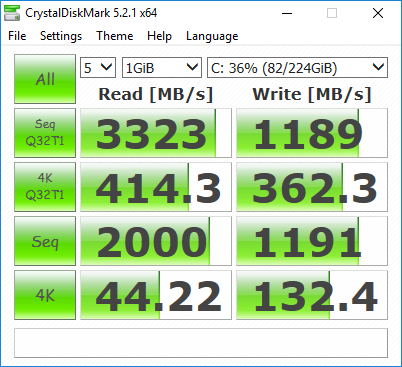
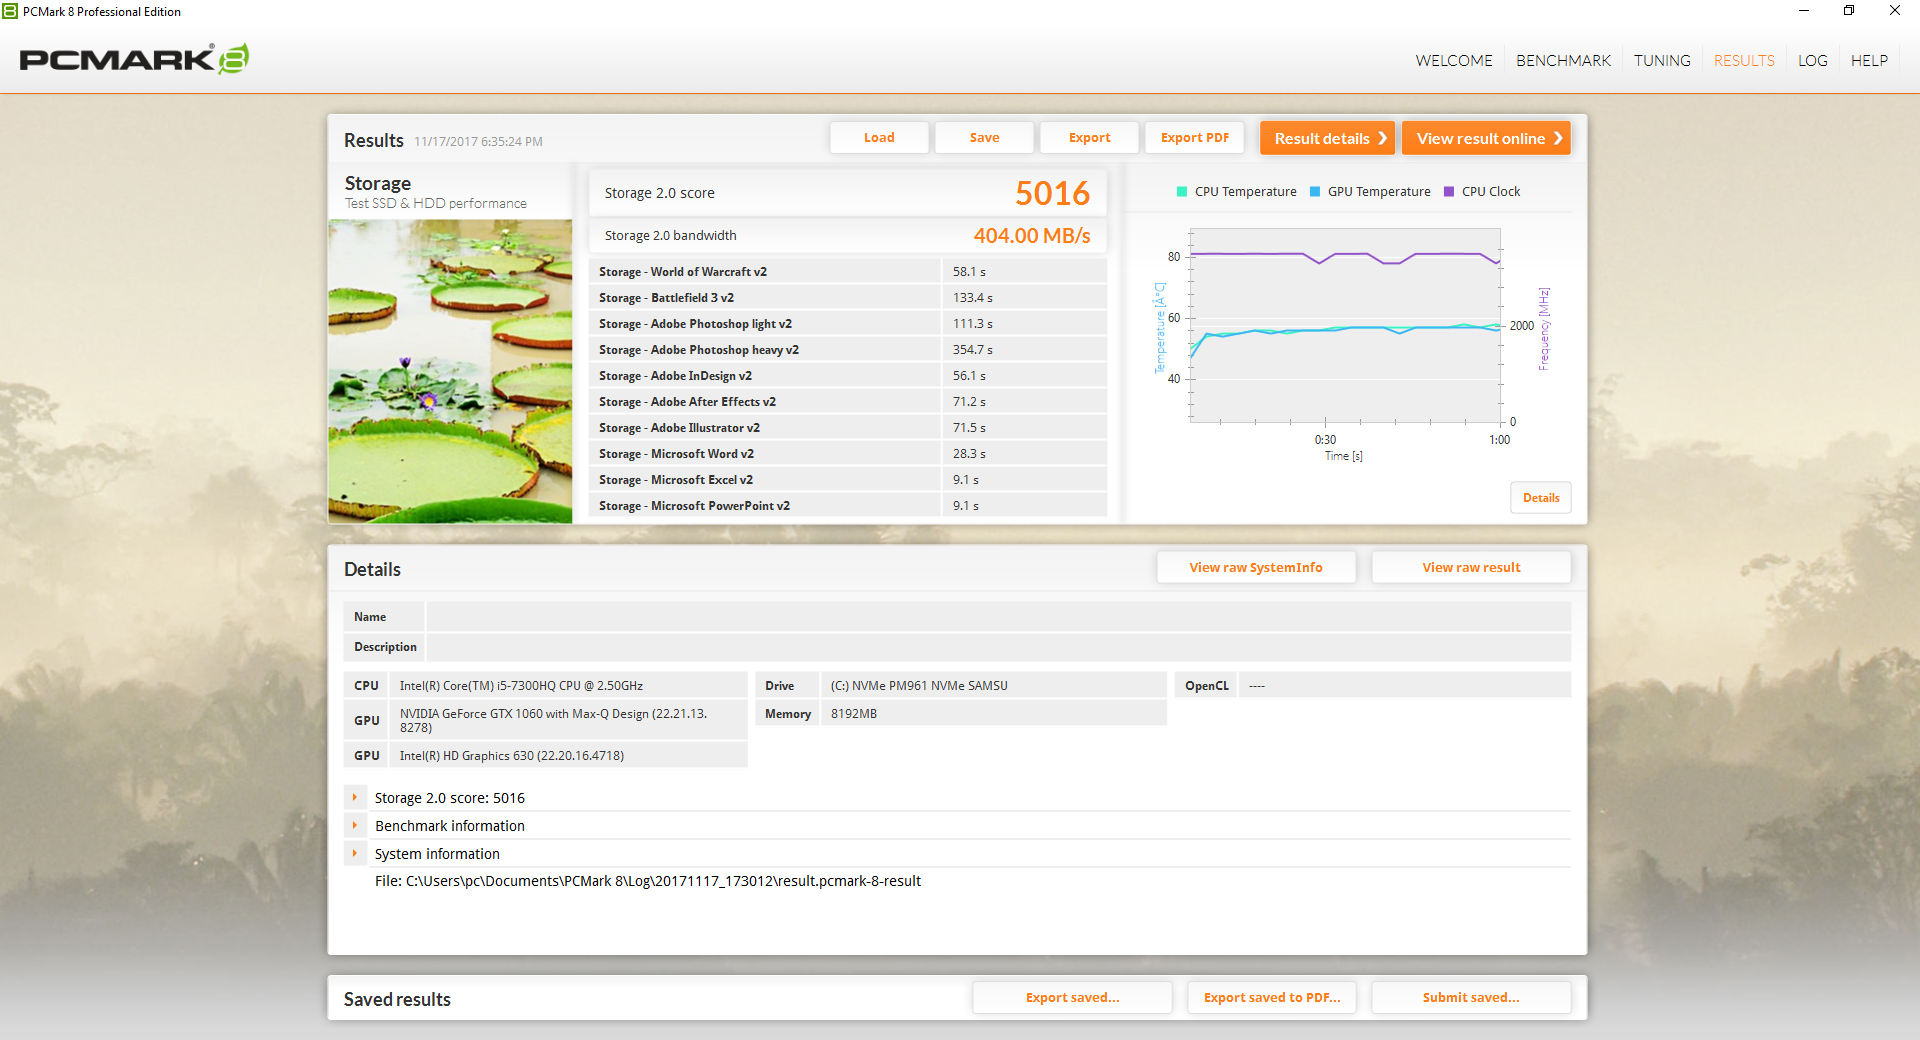
The same M.2 2280 slot and 2.5-inch SATA III bay from the Inspiron 7567 have returned unscathed. Users can configure from a standard 128 GB M.2 SSD up to a 512 GB NVMe SSD with secondary HDD storage up to 1 TB. Our test configuration is equipped just a single 256 GB Samsung PM961 MZVLW256HEHP NVMe SSD. We appreciate the fact that Dell has included a dedicated heat spreader for the NVMe SSD this time around as they are known to run very warm.
Sequential read and write rates from the Samsung SSD are nearly equal to the same Samsung SSD found on our Lenovo Legion Y520 test unit. Our recorded numbers with AS SSD are very close to the advertised sequential read and write rates of 2800 MB/s and 1100 MB/s, respectively, for the PM961. Copy transfer rates are strangely slower on our Dell despite multiple retries.
See our table of SSDs and HDDs for more benchmark comparisons.

| Dell Inspiron 15 7000 7577 Samsung PM961 MZVLW256HEHP | Dell Inspiron 15 7000 7567 Intel SSDSCKKF256H6 | Gigabyte Sabre 15G Liteonit CV3-8D128 | Lenovo Legion Y520-15IKBN-80WK001KUS Samsung PM961 MZVLW256HEHP | HP Omen 17-w100ng SanDisk Z400s SD8SNAT-128G | |
|---|---|---|---|---|---|
| AS SSD | -56% | -64% | 41% | -94% | |
| Copy Game MB/s (MB/s) | 382.5 | 286.2 -25% | 323.5 -15% | 1115 192% | 159.8 -58% |
| Copy Program MB/s (MB/s) | 274.8 | 224 -18% | 195.3 -29% | 502 83% | 80.6 -71% |
| Copy ISO MB/s (MB/s) | 814 | 425.4 -48% | 446.8 -45% | 1912 135% | 233.4 -71% |
| Score Total (Points) | 2405 | 734 -69% | 752 -69% | 2617 9% | 537 -78% |
| Score Write (Points) | 594 | 227 -62% | 234 -61% | 807 36% | 236 -60% |
| Score Read (Points) | 1241 | 332 -73% | 337 -73% | 1232 -1% | 206 -83% |
| Access Time Write * (ms) | 0.037 | 0.057 -54% | 0.073 -97% | 0.027 27% | 0.162 -338% |
| Access Time Read * (ms) | 0.058 | 0.094 -62% | 0.141 -143% | 0.065 -12% | 0.14 -141% |
| 4K-64 Write (MB/s) | 375.8 | 118.3 -69% | 132.2 -65% | 529 41% | 155 -59% |
| 4K-64 Read (MB/s) | 929 | 258.6 -72% | 257 -72% | 919 -1% | 137.4 -85% |
| 4K Write (MB/s) | 100.2 | 66.6 -34% | 53.8 -46% | 139.4 39% | 64.2 -36% |
| 4K Read (MB/s) | 46.95 | 25.16 -46% | 28.3 -40% | 48.57 3% | 17.76 -62% |
| Seq Write (MB/s) | 1181 | 416.1 -65% | 479.8 -59% | 1392 18% | 166.7 -86% |
| Seq Read (MB/s) | 2652 | 481.6 -82% | 516 -81% | 2649 0% | 507 -81% |
* ... smaller is better

GPU Performance
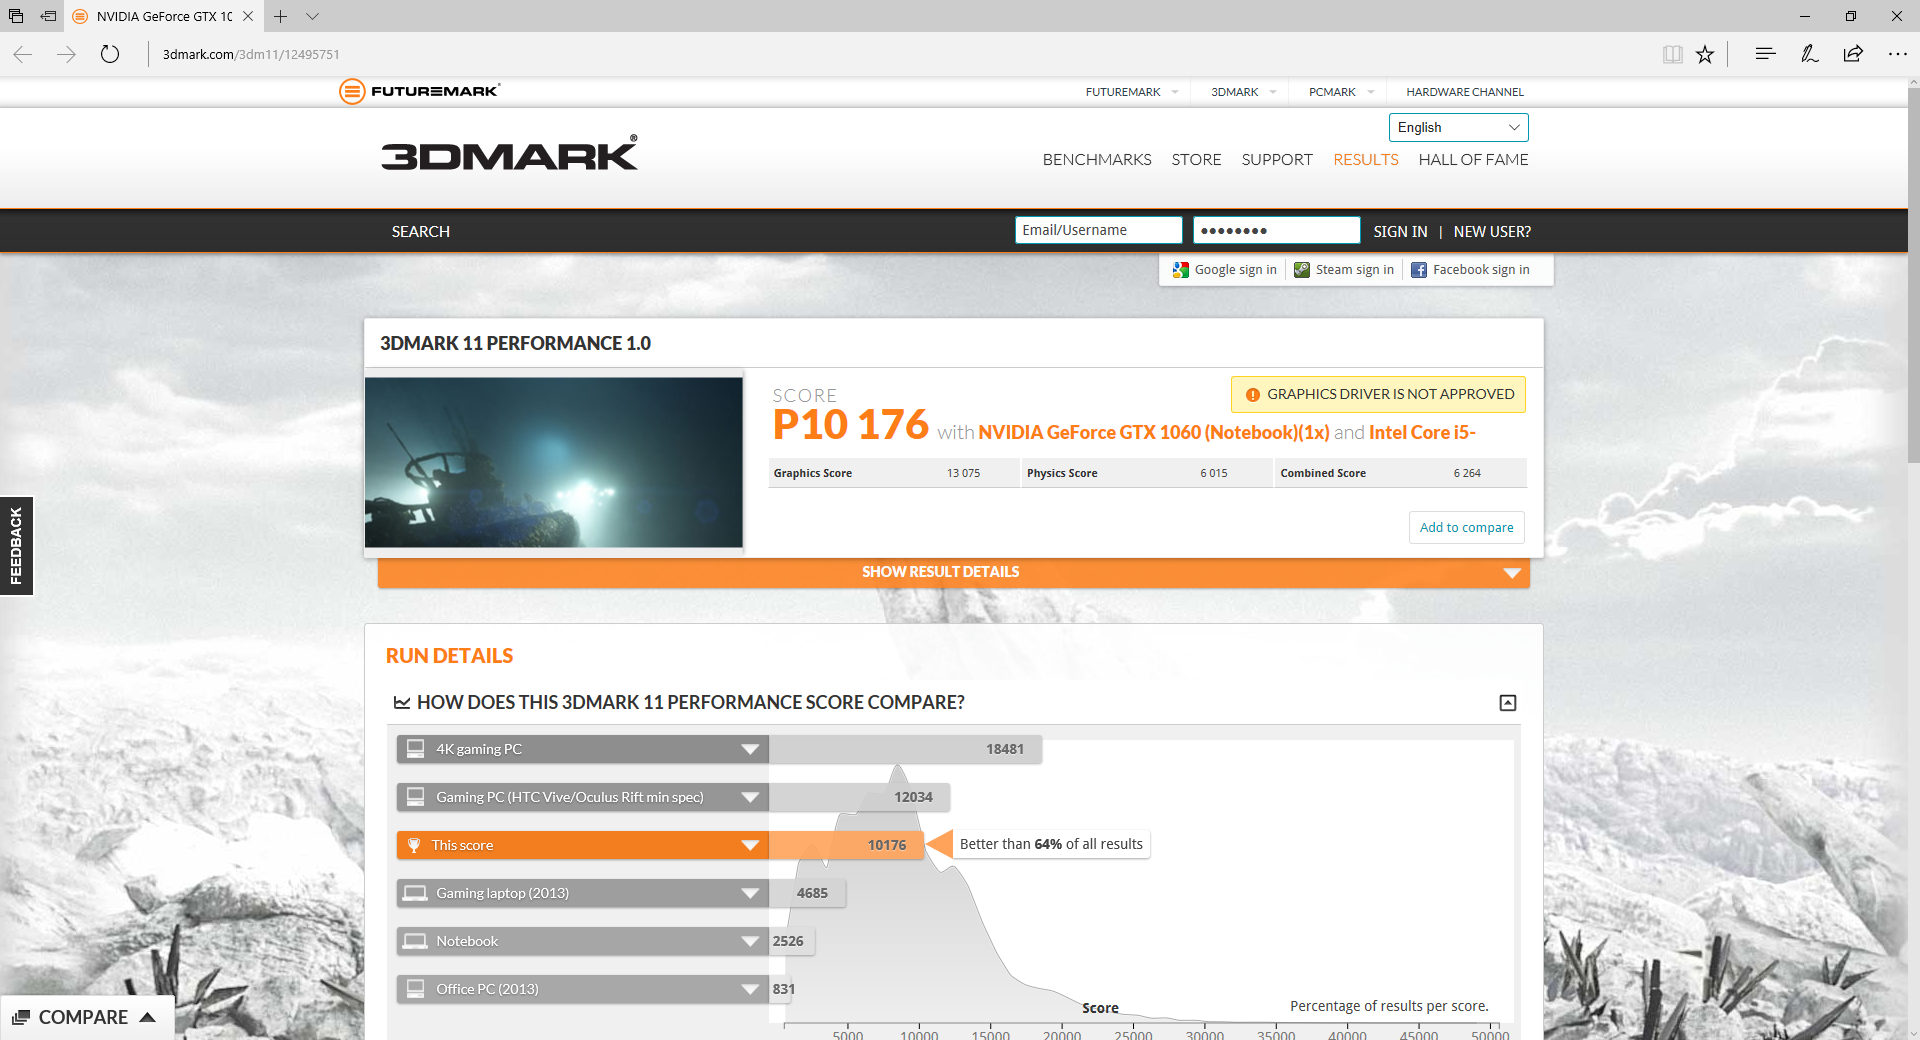
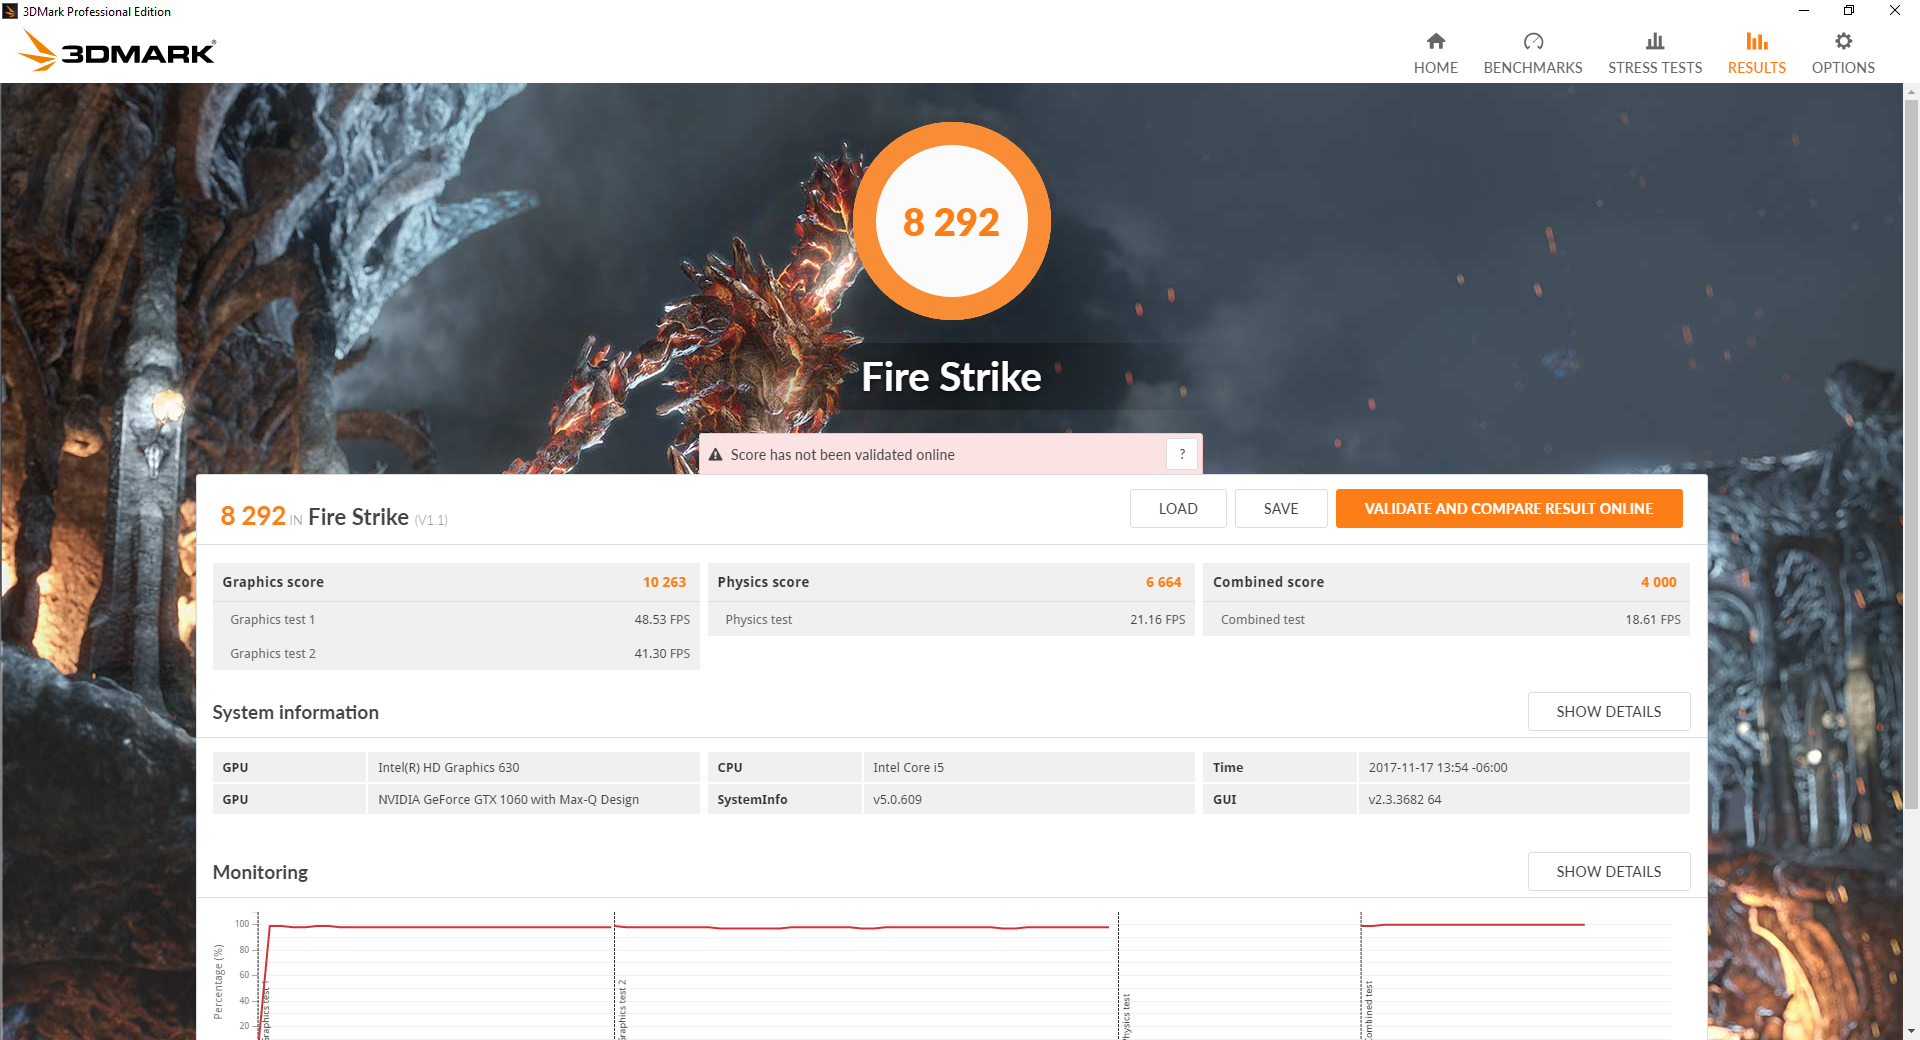
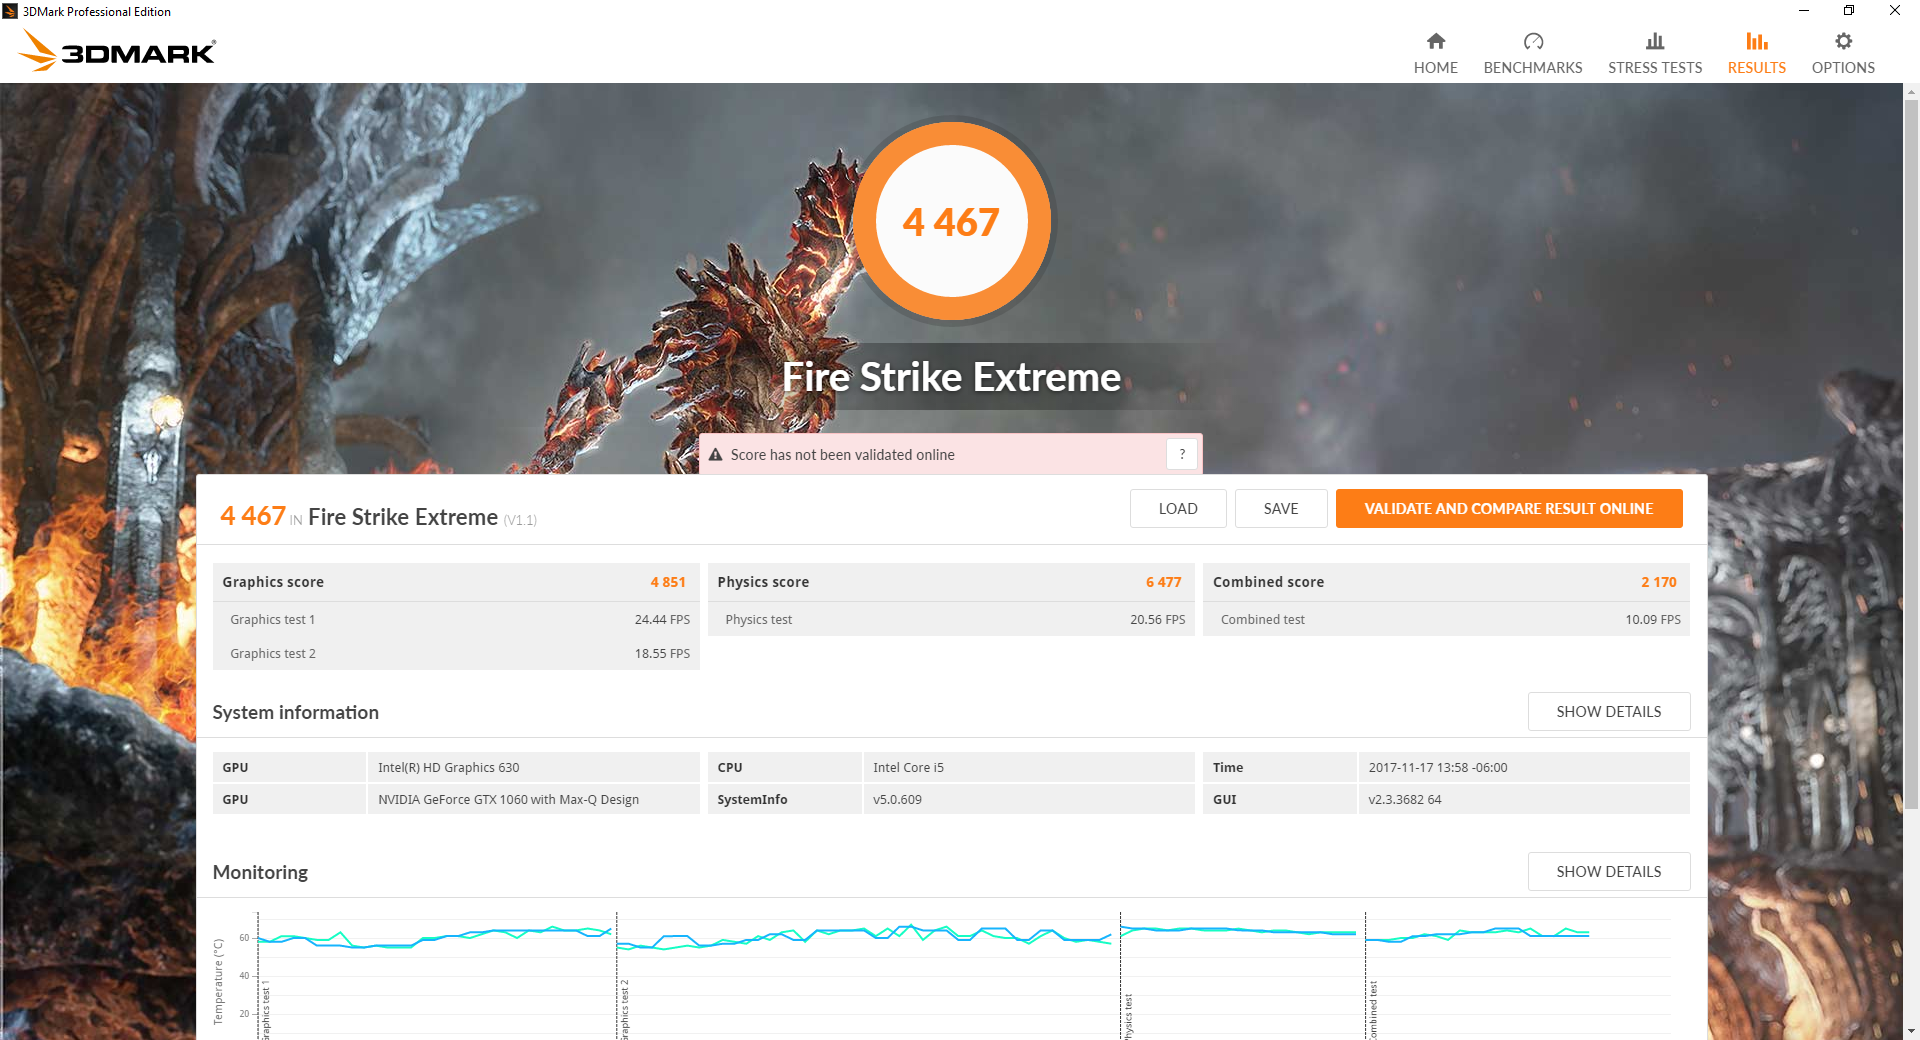
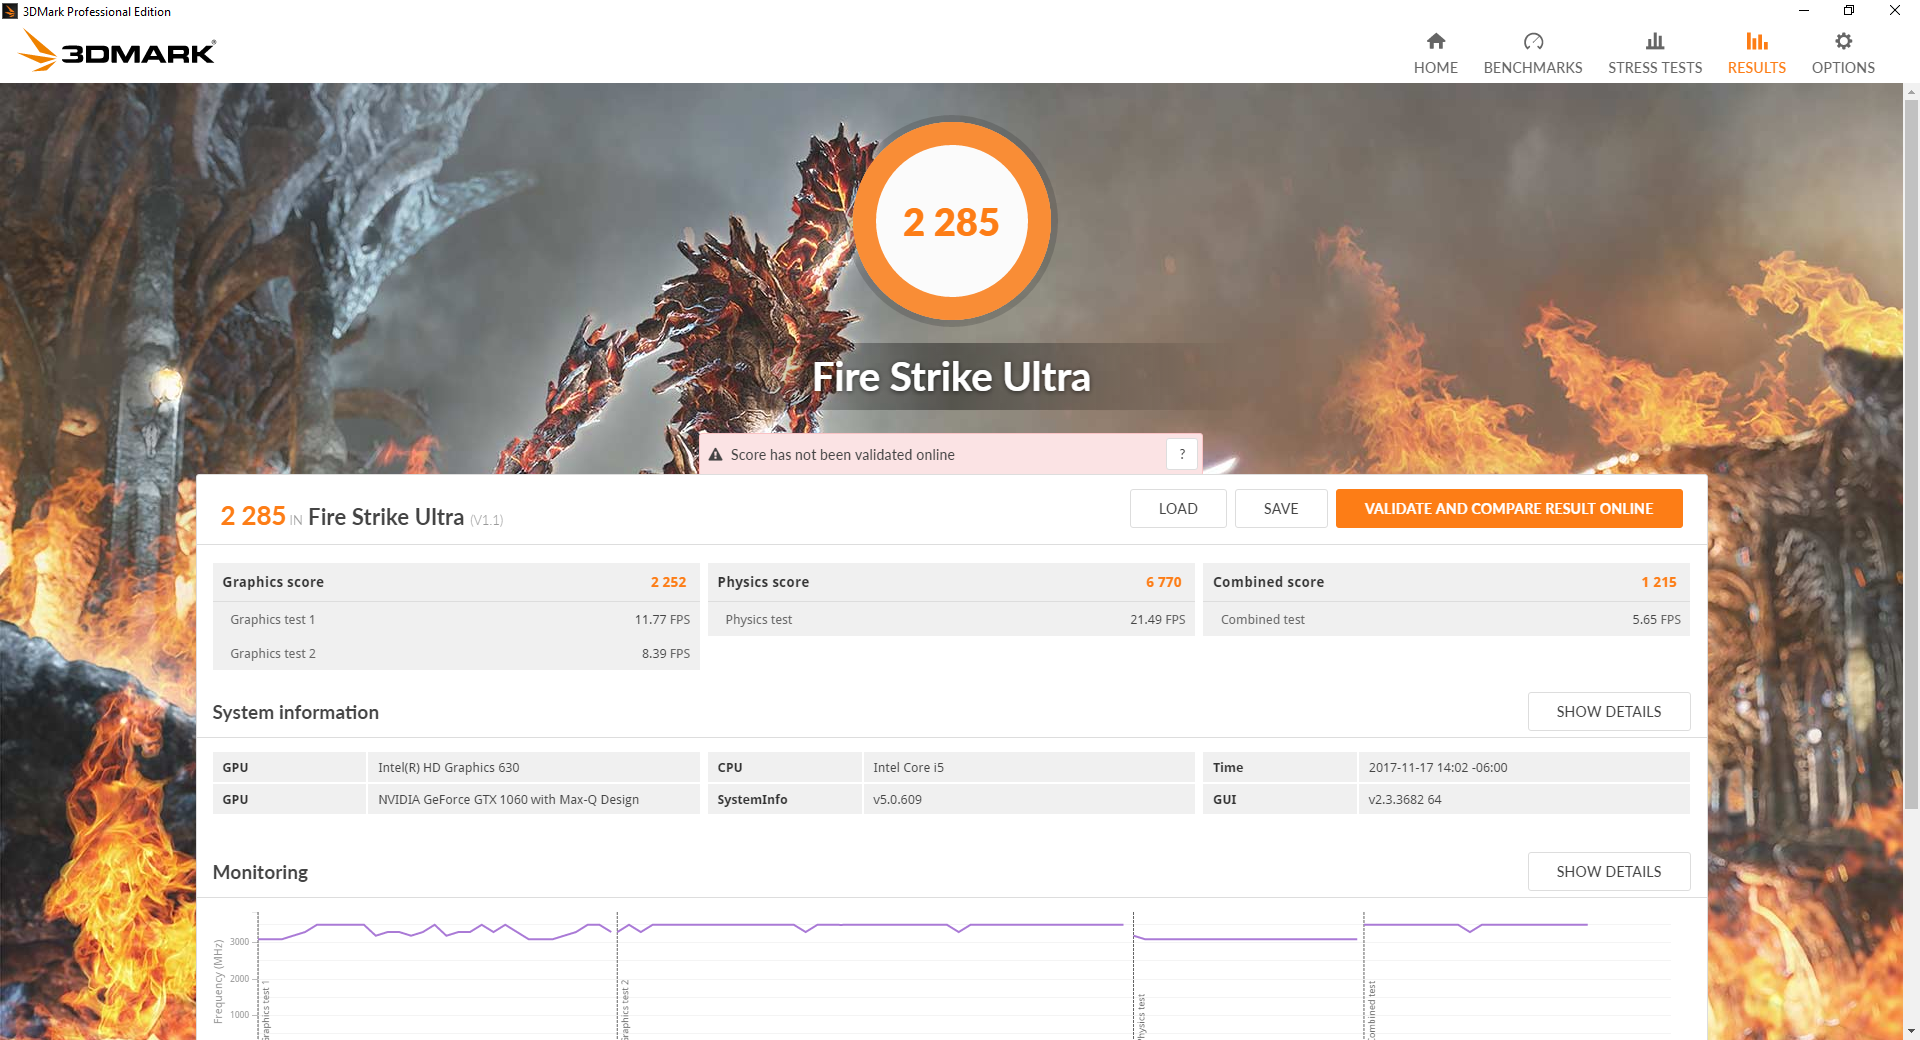
We've already said that the GTX 1060 Max-Q performs very similarly to a standard GTX 1060 with single-digit differences in 3DMark scores. Our Fire Strike data below reconfirms these initial results as the Inspiron 7577 is only about 7 to 9 percent slower than the GTX 1060 in the costlier Razer Blade Pro. The GTX 1060 Max-Q is amazingly still on par with the GTX 980M found on flagship gaming notebooks of the last generation. Users upgrading from a GTX 1050 will see a 70 percent boost in performance while the GTX 1070 Max-Q will bring about another 40 percent boost over the GTX 1060 Max-Q.
See our dedicated page on the GTX 1060 Max-Q GPU for more technical information and benchmark comparisons.
| 3DMark | |
| 1920x1080 Fire Strike Graphics | |
| Asus G701VIK-BA049T | |
| Alienware 15 R3 Max-Q | |
| Aorus X5 v7 | |
| Gigabyte Aero 15X | |
| AMD Radeon RX 480 8 GB Reference | |
| Razer Blade Pro RZ09-0220 | |
| HP Omen 15-ce002ng | |
| Dell Inspiron 15 7000 7577 | |
| EVGA SC17 | |
| Lenovo Legion Y520-15IKBN-80WK001KUS | |
| Asus GL503VD-DB74 | |
| Acer Swift 3 SF315-51G-57E5 | |
| Fire Strike Extreme Graphics | |
| Alienware 15 R3 Max-Q | |
| Gigabyte Aero 15X | |
| AMD Radeon RX 480 8 GB Reference | |
| Razer Blade Pro RZ09-0220 | |
| Dell Inspiron 15 7000 7577 | |
| EVGA SC17 | |
| Lenovo Legion Y520-15IKBN-80WK001KUS | |
| Asus GL503VD-DB74 | |
| 3DMark 11 | |
| 1280x720 Performance GPU | |
| Asus G701VIK-BA049T | |
| Alienware 15 R3 Max-Q | |
| Aorus X5 v7 | |
| Gigabyte Aero 15X | |
| AMD Radeon RX 480 8 GB Reference | |
| Razer Blade Pro RZ09-0220 | |
| HP Omen 15-ce002ng | |
| Dell Inspiron 15 7000 7577 | |
| EVGA SC17 | |
| Asus GL503VD-DB74 | |
| Acer Swift 3 SF315-51G-57E5 | |
| 1280x720 Performance Combined | |
| Asus G701VIK-BA049T | |
| AMD Radeon RX 480 8 GB Reference | |
| Aorus X5 v7 | |
| Alienware 15 R3 Max-Q | |
| EVGA SC17 | |
| Gigabyte Aero 15X | |
| Razer Blade Pro RZ09-0220 | |
| HP Omen 15-ce002ng | |
| Asus GL503VD-DB74 | |
| Dell Inspiron 15 7000 7577 | |
| Acer Swift 3 SF315-51G-57E5 | |
| 3DMark 11 Performance | 10176 points | |
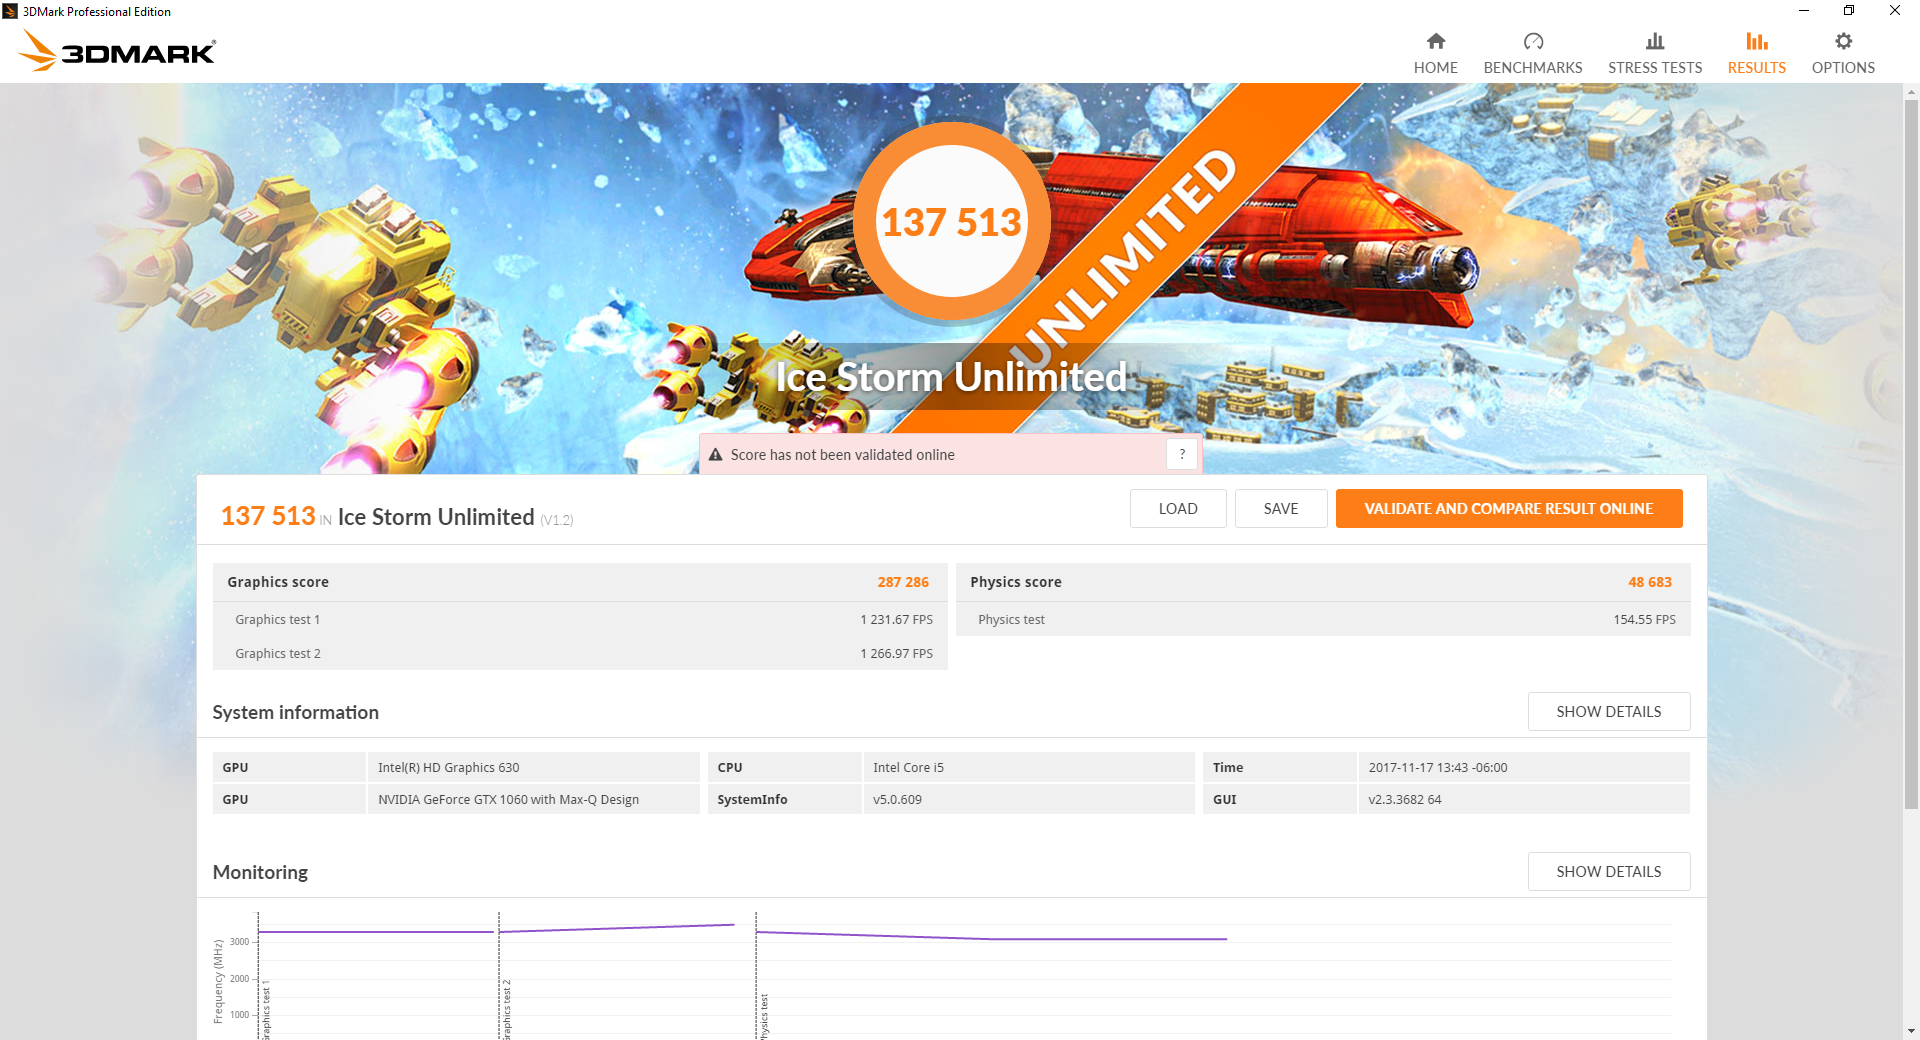
| 3DMark Ice Storm Standard Score | 96790 points | |
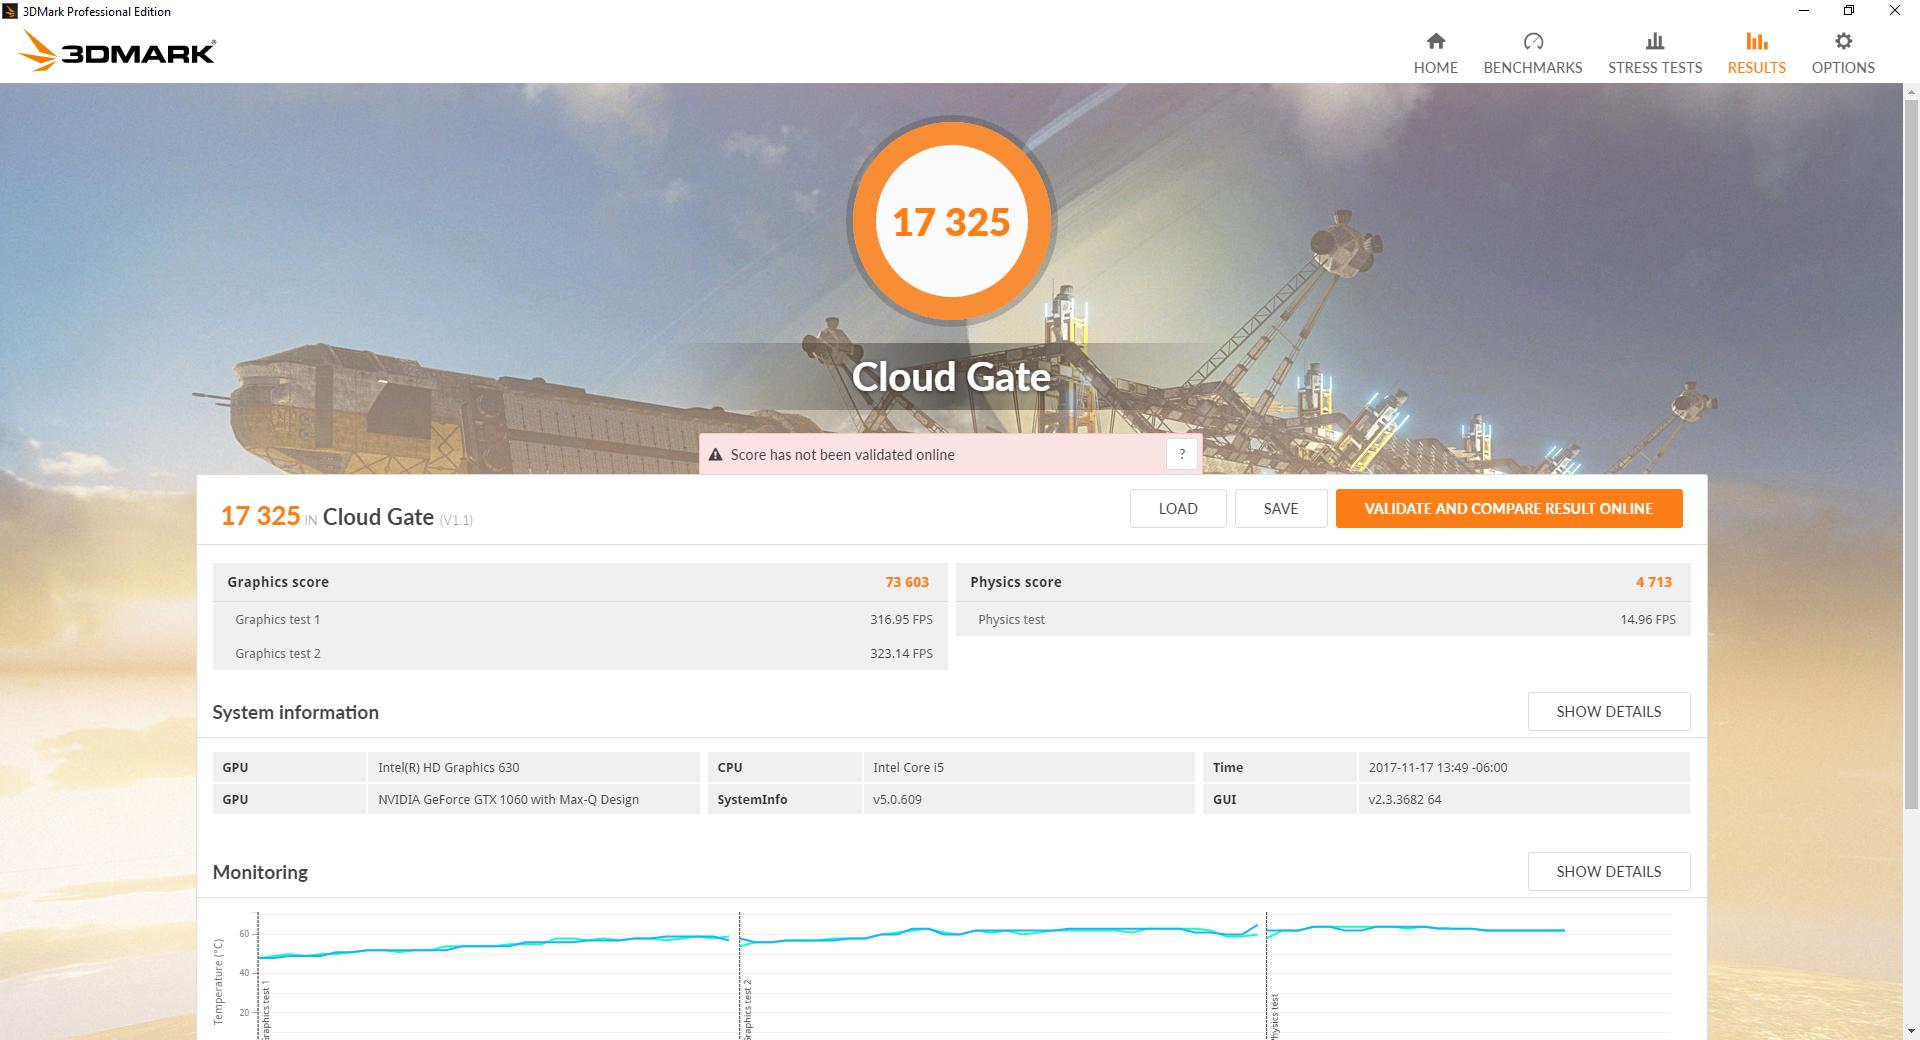
| 3DMark Cloud Gate Standard Score | 17325 points | |
| 3DMark Fire Strike Score | 8292 points | |
| 3DMark Fire Strike Extreme Score | 4467 points | |
Help | ||
Gaming Performance
3DMark performance has always translated well to real-world gaming performance for Nvidia GPUs. In this case, the GTX 1060 Max-Q GPU in the Dell is consistently about 5 to 10 percent slower than a full-fledged GTX 1060 for laptops and 15 percent slower than a 6 GB GTX 1060 for desktops.
The slower i5-7300HQ CPU does not appear to make much of a difference in frame rates for most titles when compared to the Omen 15 with the same GTX 1060 Max-Q GPU but faster quad-core i7-7700HQ. Nearly all tested titles are playable at 1080p and at maximum settings at a locked 30 FPS whereas a desktop GTX 1060 can handle most games at near-maximum settings at a locked 60 FPS. It's still unfortunate that Dell offers no G-Sync options as most titles hover between the 30 and 60 FPS range where the variable refresh rate technology is at its best.
| The Witcher 3 - 1920x1080 Ultra Graphics & Postprocessing (HBAO+) | |
| MSI GE73VR 7RF Raider | |
| Nvidia GeForce GTX 1060 Founders Edition 6 GB | |
| Razer Blade Pro RZ09-0220 | |
| Lenovo Legion Y520-15IKBN-80WK001KUS | |
| Dell Inspiron 15 7000 7577 | |
| HP Omen 15-ce002ng | |
| Gigabyte Sabre 15G | |
| BioShock Infinite - 1920x1080 Ultra Preset, DX11 (DDOF) | |
| MSI GE73VR 7RF Raider | |
| Razer Blade Pro RZ09-0220 | |
| Dell Inspiron 15 7000 7577 | |
| Lenovo Legion Y520-15IKBN-80WK001KUS | |
| Asus Strix GL502VT-DS74 | |
| Gigabyte Sabre 15G | |
| MSI GL72 6QF | |
| low | med. | high | ultra | |
|---|---|---|---|---|
| Guild Wars 2 (2012) | 45.7 | |||
| BioShock Infinite (2013) | 95.3 | |||
| Metro: Last Light (2013) | 64.3 | |||
| Thief (2014) | 64.6 | |||
| The Witcher 3 (2015) | 73.4 | 35.2 | ||
| Batman: Arkham Knight (2015) | 74 | 49 | ||
| Metal Gear Solid V (2015) | 60 | |||
| Fallout 4 (2015) | 73.9 | 61.3 | ||
| Rise of the Tomb Raider (2016) | 67.5 | 55.4 | ||
| Overwatch (2016) | 98.4 | |||
| Mafia 3 (2016) | 36.2 | |||
| Prey (2017) | 97.1 | |||
| Dirt 4 (2017) | 118 | 87.1 | 46.5 | |
| F1 2017 (2017) | 94 | 77 | 56 | |
| Middle-earth: Shadow of War (2017) | 84 | 65 | 48 |
Stress Test
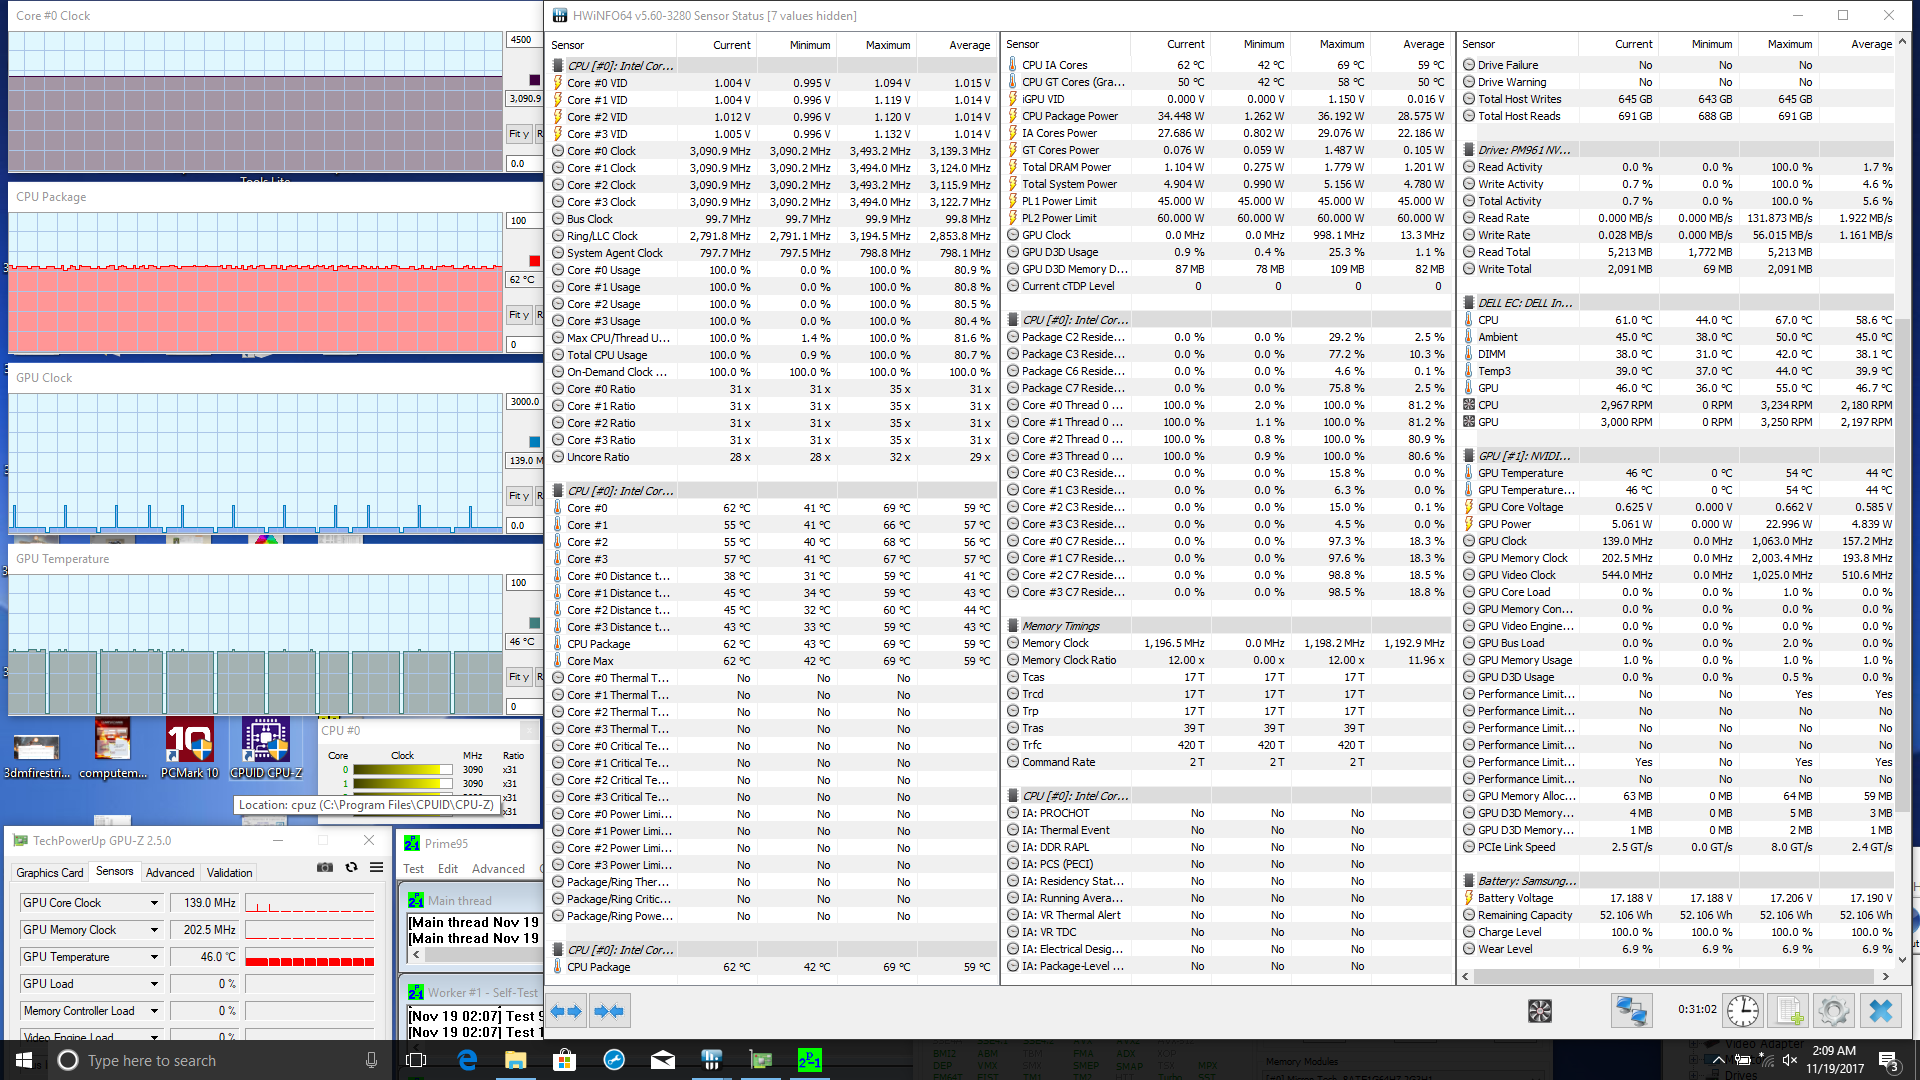
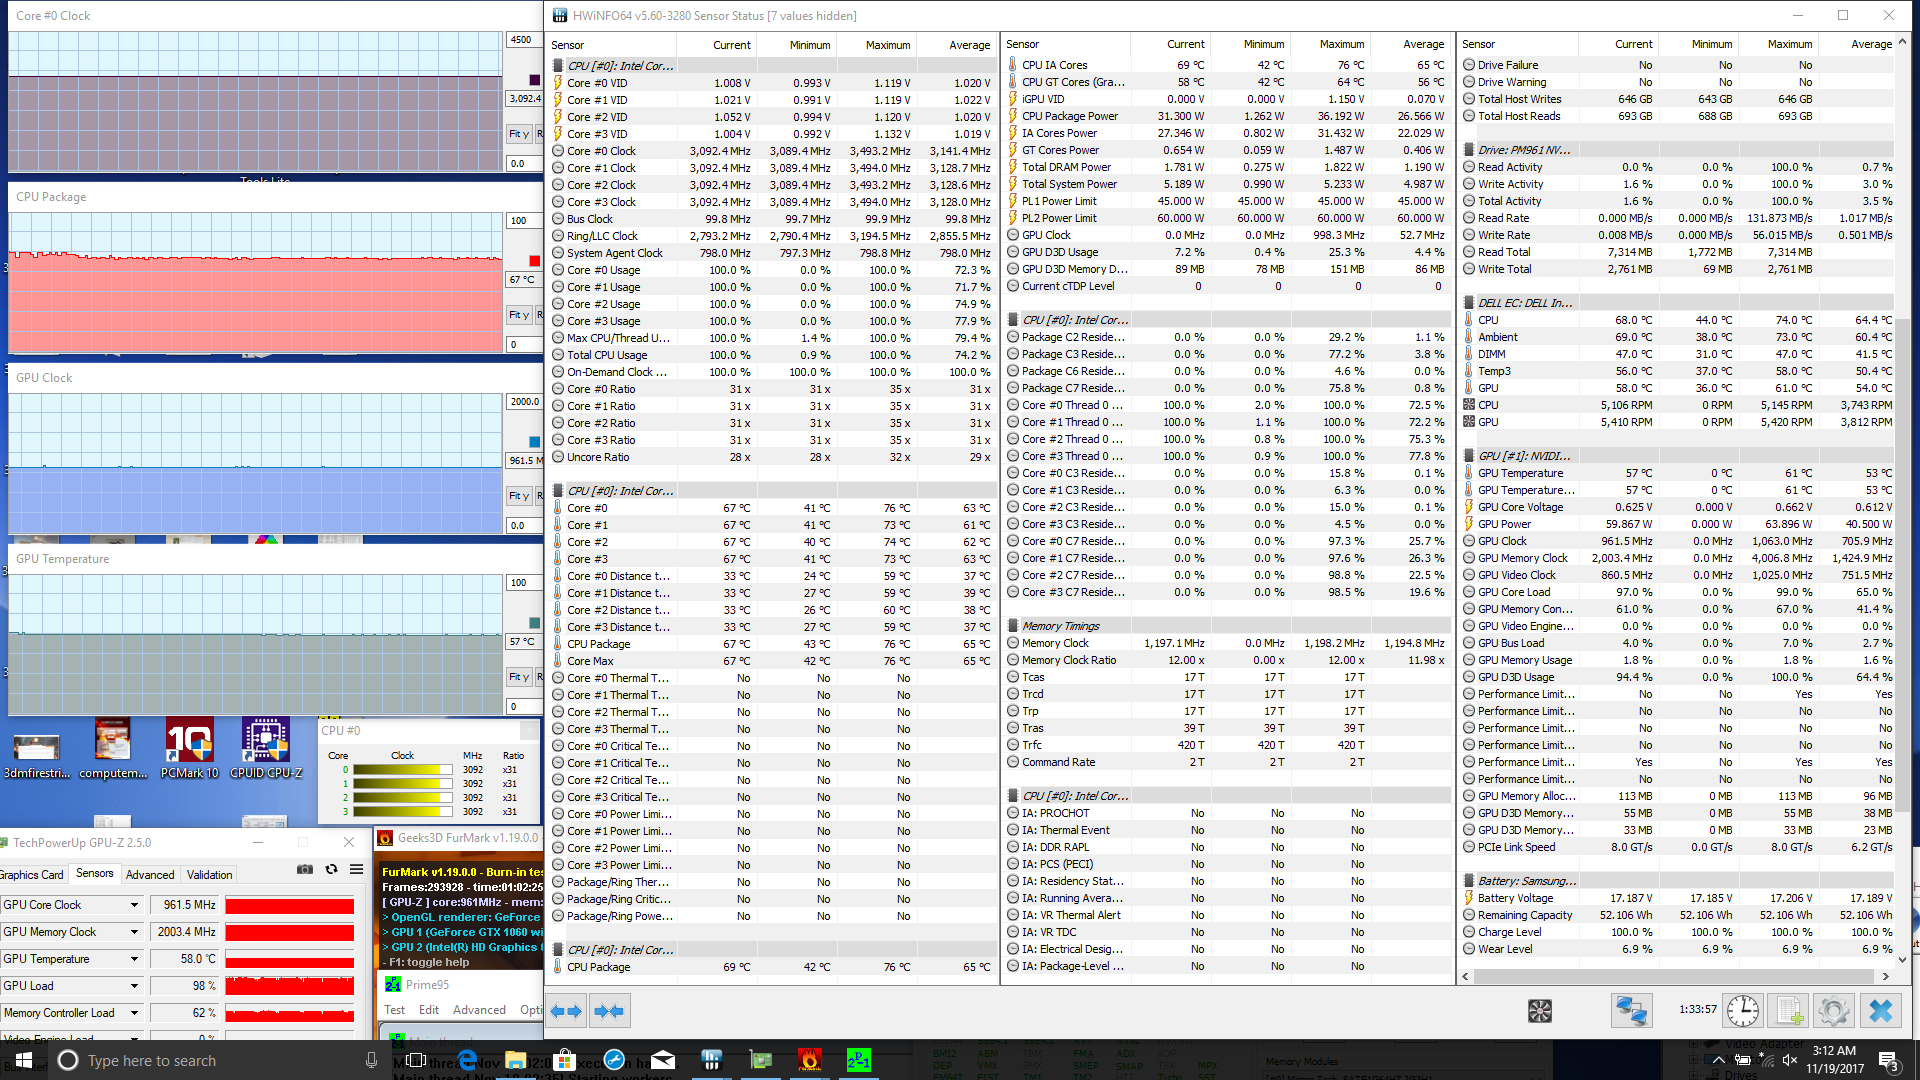
We stress the notebook with unrealistic loads to test for potential hardware issues and throttling. When under Prime95 stress, the CPU can be observed running at a stable 3.1 GHz clock rate and a core temperature of 62 C. A 3.1 GHz clock rate is the maximum rated Turbo Boost of all four cores of the i5-7300HQ and so it is excellent to see the CPU operating at peak power reliably on the Dell. Core temperature stabilizes at over 30 C cooler than the quad-core i7-7700HQ in the Sabre 15 when subjected to similar Prime95 loads. Running both Prime95 and FurMark will not throttle the CPU since its core temperature is already quite low by notebook standards.
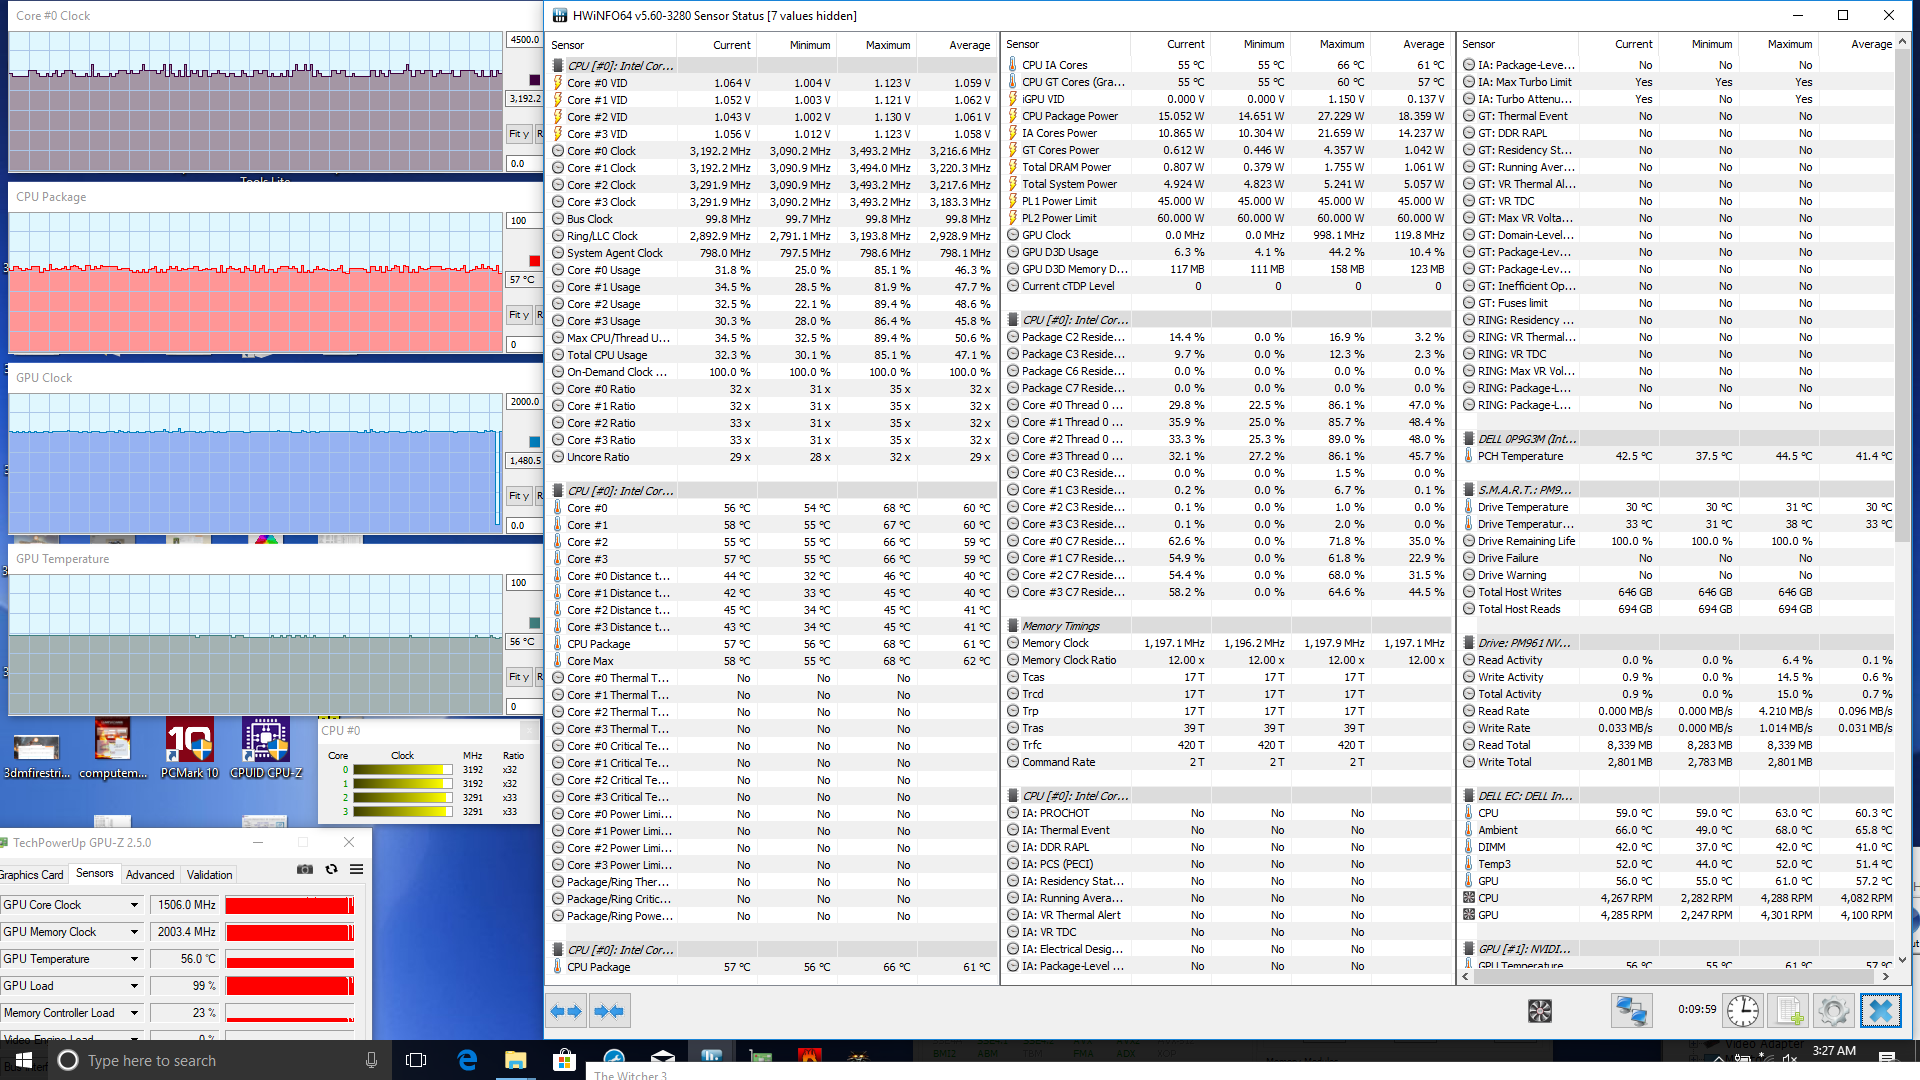
Witcher 3 stress is more representative of gaming loads than the synthetic benchmarks above. The GPU can be observed operating at a stable 1481 MHz against its base clock rate of 1063 MHz and at a cool core temperature of just 56 C. In comparison, the GTX 1050 GPU in the Sabre 15 stabilizes at a much warmer 78 C Wh while the GTX 1050 Ti in the Lenovo Legion Y520 stabilizes at around 66 C under similar Witcher 3 conditions. GPU performance is steady with consistent frame rates when gaming as the graph below shows.
Running on battery power will limit both CPU and GPU potential. A 3DMark 11 run on batteries (High Performance, dGPU enabled) returns Physics and Graphics scores of 3798 and 4826 points, respectively, compared to 6015 and 13075 points when on mains. We noticed odd frame pacing behavior when gaming on batteries that we hope Dell will address in a future update.
| CPU Clock (GHz) | GPU Clock (MHz) | Average CPU Temperature (°C) | Average GPU Temperature (°C) | |
| Prime95 Stress | 3.1 | -- | 62 | 46 |
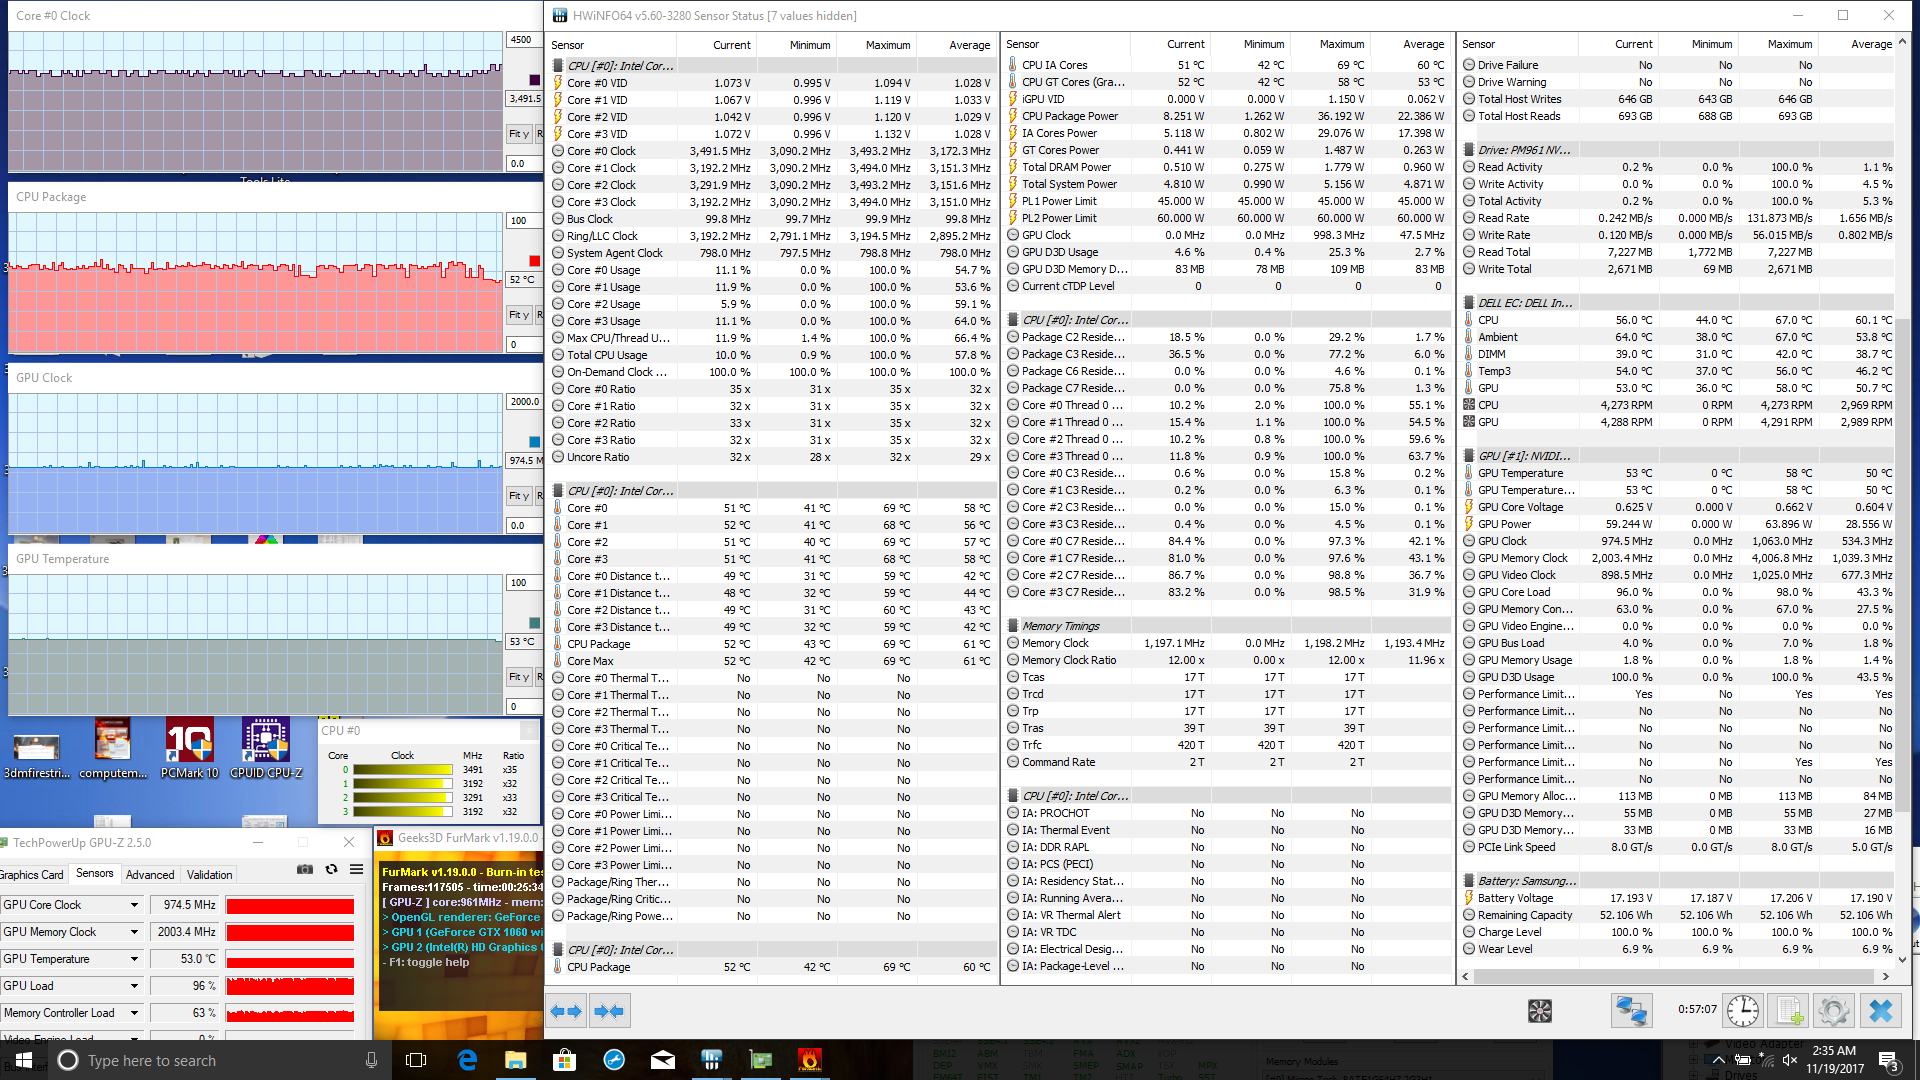
| FurMark Stress | -- | 975 | 55 | 54 |
| Prime95 + FurMark Stress | 3.1 | 962 | 67 | 57 |
| Witcher 3 Stress | ~3.2 | 1481 | 57 | 56 |
Emissions
System Noise
The cooling solution still consists of twin ~50 mm fans and a pair of heat pipes between them. This time, however, the heat pipes appear to be slightly larger than the ones on the Inspiron 7567.
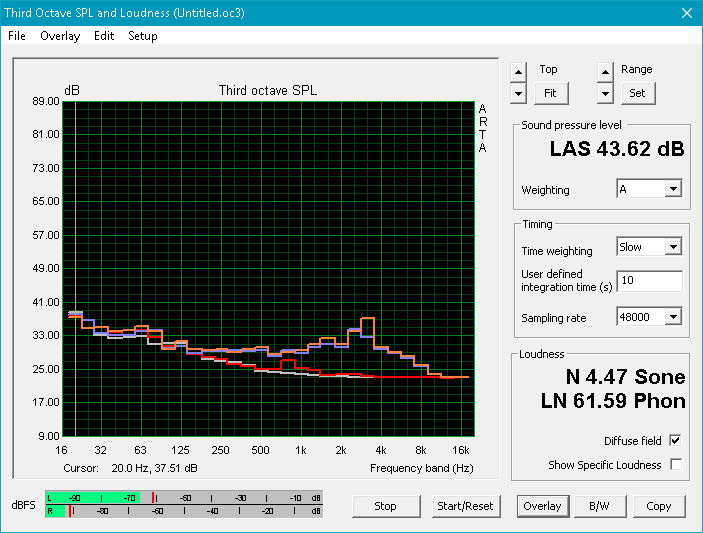
Fan noise is surprisingly quiet for a gaming notebook. Both fans will idle during low loads like word processing or light browsing for a truly silent experience, which is uncommon in this category of notebooks. Competing models like the Sabre 15 or Omen 15 have fans that are almost always active and frequently pulsating no matter the Power Profile setting. Running the first benchmark section of 3DMark06 three times in a row will only cause the fans to spin at a lowly 30.3 dB(A) compared to over 40 dB(A) on the Sabre 15 and older Asus GL502VT.
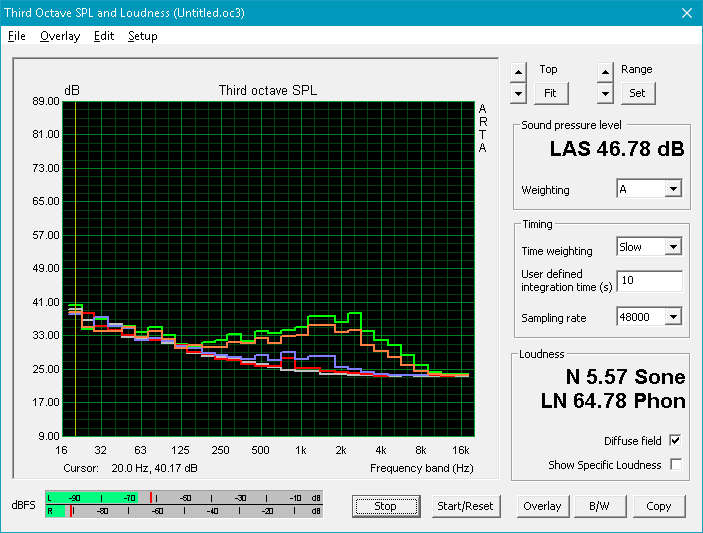
Running Witcher 3 will bump fan noise up significantly to a steady 39.5 dB(A) to be just under the 40 dB(A) limit set forth by Nvidia for all of its Max-Q products. The older Inspiron 7567 is much louder at 46.3 dB(A) when subjected to similar Witcher 3 loads despite its slower GTX 1050 GPU. Extreme CPU and GPU loads with Prime95 and FurMark will cause the fans to be even louder, but this is unrepresentative of real-world loads.
Coil whine or electronic noise is not present at all on our test unit.

Noise level
| Idle |
| 28 / 28 / 28 dB(A) |
| Load |
| 30.3 / 46.5 dB(A) |
 | ||
30 dB silent 40 dB(A) audible 50 dB(A) loud |
||
min: | ||
| Dell Inspiron 15 7000 7577 GeForce GTX 1060 Max-Q, i5-7300HQ, Samsung PM961 MZVLW256HEHP | Dell Inspiron 15 7000 7567 Gaming (Core i5-7300HQ, GTX 1050) GeForce GTX 1050 Mobile, i5-7300HQ, Toshiba MQ02ABD100H | Gigabyte Sabre 15G GeForce GTX 1050 Mobile, i7-7700HQ, Liteonit CV3-8D128 | Lenovo Legion Y520-15IKBN-80WK001KUS GeForce GTX 1050 Ti Mobile, i7-7700HQ, Samsung PM961 MZVLW256HEHP | Asus Strix GL502VT-DS74 GeForce GTX 970M, 6700HQ, Lite-On CV1-8B128 | HP Omen 15-ce002ng GeForce GTX 1060 Max-Q, i7-7700HQ, Samsung PM961 MZVLW256HEHP | |
|---|---|---|---|---|---|---|
| Noise | -12% | -21% | -7% | -12% | -16% | |
| off / environment * (dB) | 28 | 28 -0% | 28.2 -1% | 27.7 1% | 28.7 -2% | 30 -7% |
| Idle Minimum * (dB) | 28 | 31.6 -13% | 33 -18% | 30.5 -9% | 31 -11% | 30 -7% |
| Idle Average * (dB) | 28 | 31.8 -14% | 33.3 -19% | 30.5 -9% | 31 -11% | 33 -18% |
| Idle Maximum * (dB) | 28 | 31.8 -14% | 34.7 -24% | 30.6 -9% | 32 -14% | 37 -32% |
| Load Average * (dB) | 30.3 | 36.3 -20% | 44.5 -47% | 40 -32% | 40.7 -34% | 41 -35% |
| Witcher 3 ultra * (dB) | 39.5 | 46.3 -17% | 49.2 -25% | 40 -1% | 42 -6% | |
| Load Maximum * (dB) | 46.5 | 49 -5% | 52.8 -14% | 42.6 8% | 47.6 -2% | 50 -8% |
* ... smaller is better
Temperature
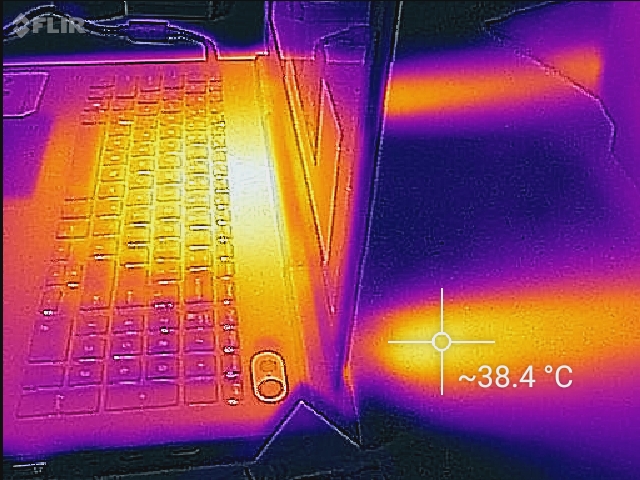
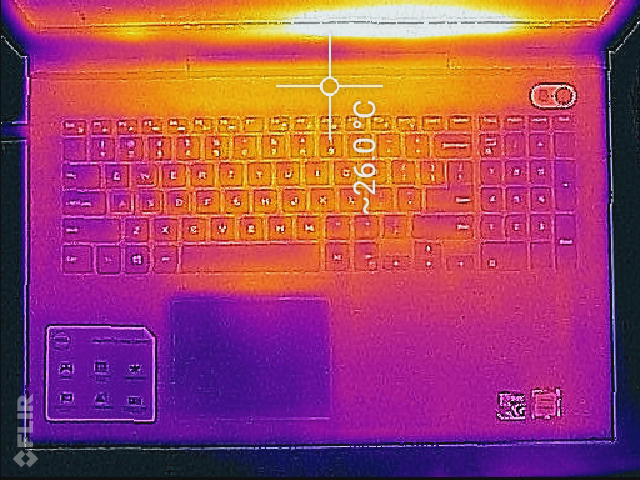
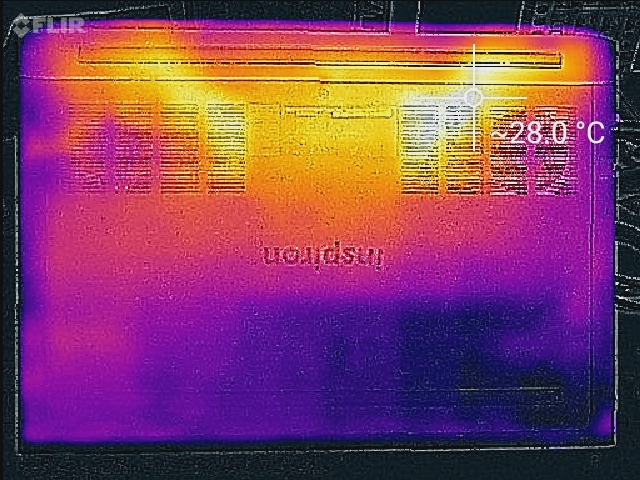
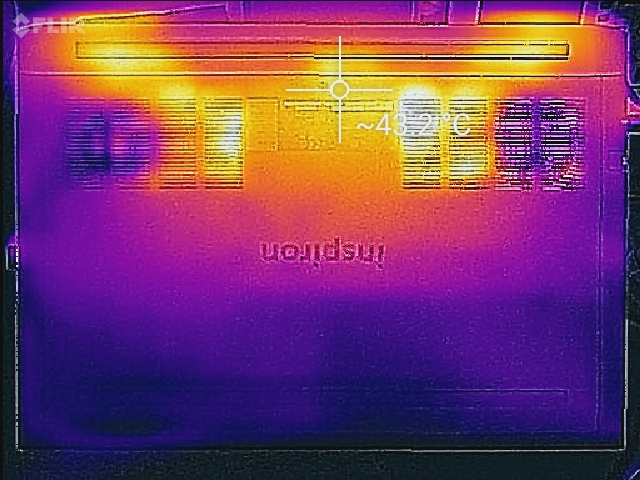
Surface temperatures are flat across the board when idling or during very low processing loads. The hot spot is observed to be directly above the first row of keyboard keys not unlike on the older Inspiron 7567 design to ensure that heat is as far away from the palm rests and commonly used keys as possible. This spot can be as warm as 44 C when under extreme loads but is thankfully much cooler at about 36 C when running Witcher 3. Additionally, the temperature is very localized on the system meaning that more of the notebook surface remains cool whereas the Omen 15 with the same GTX 1060 Max-Q GPU runs warmer on average under similar conditions.
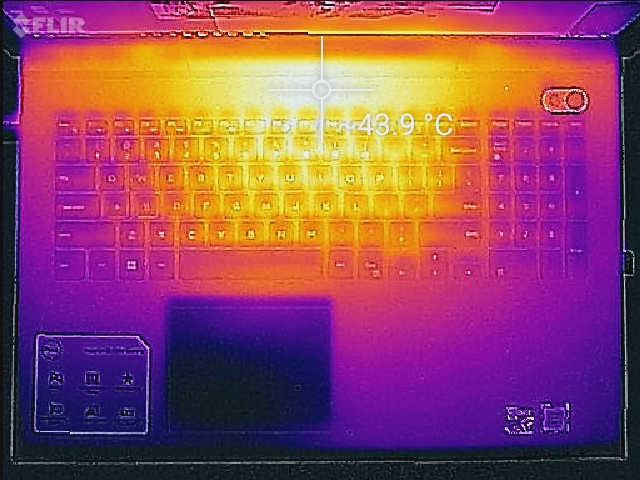
(±) The maximum temperature on the upper side is 44 °C / 111 F, compared to the average of 40.4 °C / 105 F, ranging from 21.2 to 68.8 °C for the class Gaming.
(±) The bottom heats up to a maximum of 43.8 °C / 111 F, compared to the average of 43.2 °C / 110 F
(+) In idle usage, the average temperature for the upper side is 24.7 °C / 76 F, compared to the device average of 33.9 °C / 93 F.
(+) Playing The Witcher 3, the average temperature for the upper side is 27.9 °C / 82 F, compared to the device average of 33.9 °C / 93 F.
(+) The palmrests and touchpad are cooler than skin temperature with a maximum of 29.8 °C / 85.6 F and are therefore cool to the touch.
(±) The average temperature of the palmrest area of similar devices was 28.8 °C / 83.8 F (-1 °C / -1.8 F).
Speakers
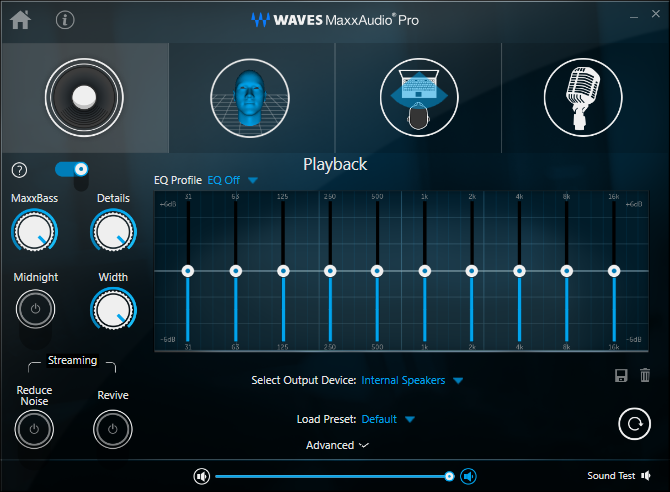
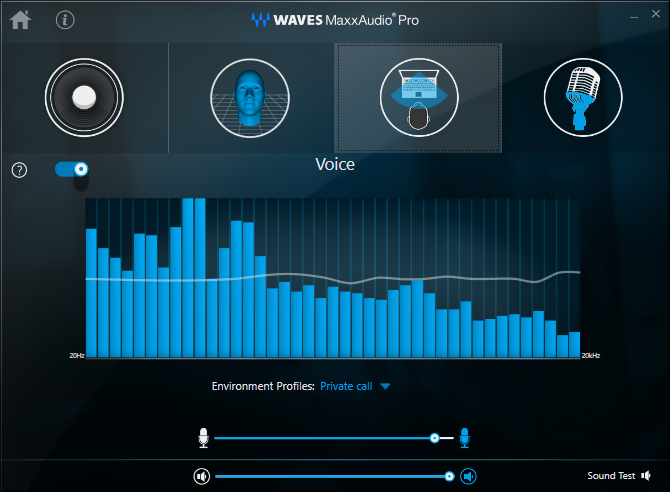
As already mentioned, the Inspiron 7577 drops the dedicated subwoofer found on the 7567. Our pink noise measurements below show that bass has suffered slightly as a result with an overemphasis on treble. The 8k Hz frequency band is particularly loud and strong when the "Details" knob is set to maximum on the pre-installed Waves MaxxAudio Pro software. Adjusting this feature down to around 50 percent will create a more balanced audio experience than on the GS63VR. Maximum volume will slightly reverberate the palm rests but otherwise introduces no static.
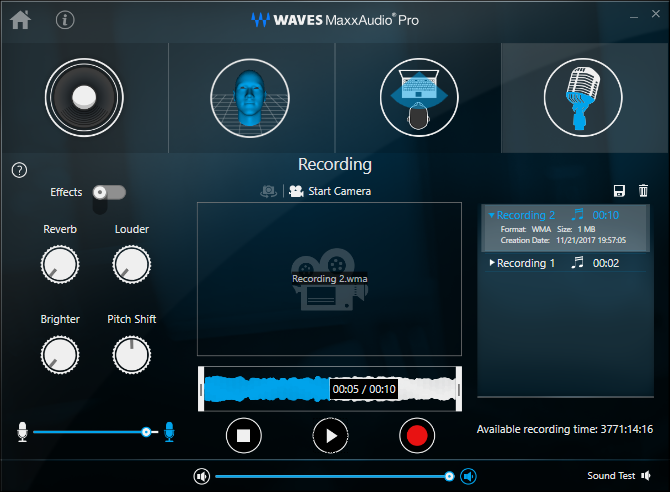
The one-touch voice recording feature is a simple and handy tool in the Waves software. There is noticeable background noise and static that make it poor for video purposes but acceptable in an office meeting environment.
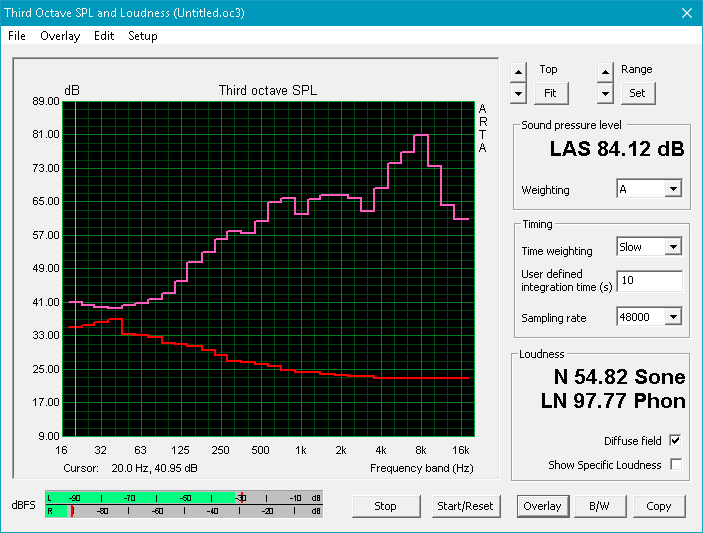
Dell Inspiron 15 7000 7577 audio analysis
(±) | speaker loudness is average but good (80.9 dB)
Bass 100 - 315 Hz
(±) | reduced bass - on average 13% lower than median
(+) | bass is linear (6.8% delta to prev. frequency)
Mids 400 - 2000 Hz
(+) | balanced mids - only 2.7% away from median
(+) | mids are linear (5.3% delta to prev. frequency)
Highs 2 - 16 kHz
(±) | higher highs - on average 8% higher than median
(±) | linearity of highs is average (10.6% delta to prev. frequency)
Overall 100 - 16.000 Hz
(±) | linearity of overall sound is average (18.9% difference to median)
Compared to same class
» 63% of all tested devices in this class were better, 8% similar, 29% worse
» The best had a delta of 6%, average was 18%, worst was 132%
Compared to all devices tested
» 44% of all tested devices were better, 8% similar, 48% worse
» The best had a delta of 4%, average was 23%, worst was 134%
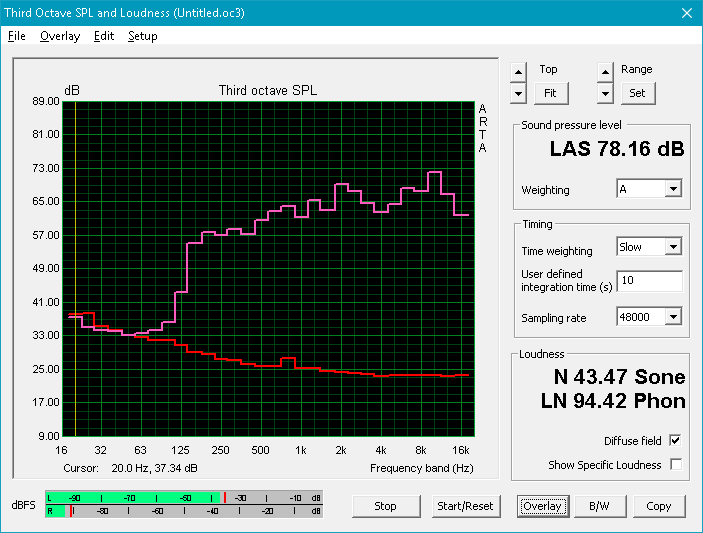
Apple MacBook 12 (Early 2016) 1.1 GHz audio analysis
(+) | speakers can play relatively loud (83.6 dB)
Bass 100 - 315 Hz
(±) | reduced bass - on average 11.3% lower than median
(±) | linearity of bass is average (14.2% delta to prev. frequency)
Mids 400 - 2000 Hz
(+) | balanced mids - only 2.4% away from median
(+) | mids are linear (5.5% delta to prev. frequency)
Highs 2 - 16 kHz
(+) | balanced highs - only 2% away from median
(+) | highs are linear (4.5% delta to prev. frequency)
Overall 100 - 16.000 Hz
(+) | overall sound is linear (10.2% difference to median)
Compared to same class
» 7% of all tested devices in this class were better, 2% similar, 91% worse
» The best had a delta of 5%, average was 18%, worst was 53%
Compared to all devices tested
» 5% of all tested devices were better, 1% similar, 94% worse
» The best had a delta of 4%, average was 23%, worst was 134%
Frequency Comparison (Checkbox selectable!)
Graph 1: Pink Noise 100% Vol.; Graph 2: Audio off
Energy Management
Power Consumption
The power efficiency of the Inspiron 7577 is where the notebook really shines. When compared to the 15.6-inch Asus GL502VY with the GTX 980M GPU, the Inspiron 7577 is over twice as efficient under medium (3DMark06) loads and around 60 percent more efficient when under extreme stress. This is particularly noteworthy because the performance of the GTX 1060 Max-Q is on par with the GTX 980M as our synthetic and gaming benchmarks above have shown, so the jump in performance-per-Watt is massive between the Maxwell and Pascal Max-Q series.
When compared to more recent available models like the Gigabyte Sabre 15G (GTX 1050) or MSI GF62VR (GTX 1060), the Dell is still at an advantage. Running Witcher 3 draws about 89 W on the Dell whereas the same benchmark draws 95 W and 126 W from the Gigabyte and MSI, respectively. The GTX 1060 Max-Q offers a 35 percent graphics boost over the GTX 1050 Ti without necessarily drawing more power when taking into account the entire notebook.
Maximum load with Prime95 and FurMark will draw about 113 W from a medium-sized (~15.5 x 7.3 x 3.0 cm) 180 W AC adapter. In comparison, the Inspiron 7567 shipped with a smaller 130 W adapter. We were expecting much higher consumption rates from the Dell system as the Omen 15 (7700HQ, GTX 1060 Max-Q) draws about 158 W under similar maximum loads. We can observe no abnormal throttling to explain the very low readings even after double-checking the data.
| Off / Standby | |
| Idle | |
| Load |
|
Key:
min: | |
| Dell Inspiron 15 7000 7577 i5-7300HQ, GeForce GTX 1060 Max-Q, Samsung PM961 MZVLW256HEHP, IPS, 1920x1080, 15.6" | Dell Inspiron 15 7000 7567 i7-7700HQ, GeForce GTX 1050 Ti Mobile, Intel SSDSCKKF256H6, TN, 1920x1080, 15.6" | Gigabyte Sabre 15G i7-7700HQ, GeForce GTX 1050 Mobile, Liteonit CV3-8D128, IPS, 1920x1080, 15.6" | MSI GF62VR 7RF-877 i7-7700HQ, GeForce GTX 1060 Mobile, Intel SSD 600p SSDPEKKW256G7, TN LED, 1920x1080, 15.6" | Asus Strix GL502VY-DS71 6700HQ, GeForce GTX 980M, SanDisk SD8SN8U1T001122, IPS, 1920x1080, 15.6" | |
|---|---|---|---|---|---|
| Power Consumption | 1% | -19% | -85% | -144% | |
| Idle Minimum * (Watt) | 7.1 | 4.4 38% | 8 -13% | 16.2 -128% | 20.6 -190% |
| Idle Average * (Watt) | 7.6 | 6.8 11% | 10.9 -43% | 18.2 -139% | 22.1 -191% |
| Idle Maximum * (Watt) | 8.6 | 8.3 3% | 11 -28% | 18.9 -120% | 22.5 -162% |
| Load Average * (Watt) | 59.5 | 81 -36% | 76.7 -29% | 82.7 -39% | 130.6 -119% |
| Witcher 3 ultra * (Watt) | 89 | 94.9 -7% | 125.7 -41% | ||
| Load Maximum * (Watt) | 112.8 | 127 -13% | 106.4 6% | 162.3 -44% | 177.2 -57% |
* ... smaller is better
Battery Life
The system ships with a 24 percent smaller battery capacity than on the outgoing Inspiron 7567 and even the older Inspiron 7559. Battery life has suffered as a result from over 10 hours on the Inspiron 7567 to "just" 7 hours on the new Inspiron 7577 when subjected to similar WLAN conditions.
When looking more closely at the battery life changes, we can begin to predict why Dell decided to reduce the cell count from 6 to 4. The 74 Wh battery in the Inspiron 7567 was very large for its price category and runtimes were already hours longer than its closest competitors. By moving to a smaller battery for the 7577 series, Dell can still boast longer runtimes than the competition while likely cutting costs simultaneously.
Charging from near empty to full capacity will take about 2 hours.
| Dell Inspiron 15 7000 7577 i5-7300HQ, GeForce GTX 1060 Max-Q, 56 Wh | Dell Inspiron 15 7000 7567 i7-7700HQ, GeForce GTX 1050 Ti Mobile, 74 Wh | Gigabyte Sabre 15G i7-7700HQ, GeForce GTX 1050 Mobile, 47 Wh | Lenovo Legion Y520-15IKBN-80WK001KUS i7-7700HQ, GeForce GTX 1050 Ti Mobile, 45 Wh | Asus Strix GL502VT-DS74 6700HQ, GeForce GTX 970M, 64 Wh | MSI GF62VR 7RF-877 i7-7700HQ, GeForce GTX 1060 Mobile, 41 Wh | |
|---|---|---|---|---|---|---|
| Battery runtime | 39% | -27% | -38% | -23% | -68% | |
| Reader / Idle (h) | 11 | 19.6 78% | 8.2 -25% | 8.5 -23% | 9.7 -12% | 2.8 -75% |
| WiFi v1.3 (h) | 6.9 | 10.4 51% | 4.4 -36% | 4 -42% | 5.9 -14% | 1.9 -72% |
| Load (h) | 1.6 | 1.4 -13% | 1.3 -19% | 0.8 -50% | 0.9 -44% | 0.7 -56% |
Pros
Cons
Verdict
The Inspiron 7577 is an amazing gaming system for the price all thanks to its strong base, accessible internals, and GTX 1060 Max-Q GPU. The GPU swap alone has made the machine run quieter and faster and more efficiently than all SKUs of the Inspiron 7567. It's not everyday that an immediate successor offers a 35 to 70 percent boost in graphics performance for a meager 5 to 10 percent higher power consumption and still manage to have quieter fans when gaming.
When compared to competitors like the Omen 15 (7700HQ, GTX 1060 Max-Q) or MSI GF62VR (7700HQ, GTX 1060), the Dell easily outclasses both overall. Power consumption is lower than the MSI by about 40 percent for a very small 5 to 10 percent reduction in graphics performance. In turn, fan noise is reduced significantly and battery life is hours longer. The system even manages to be quieter than the Omen 15 despite having the same Max-Q GPU and same 3D performance scores. Throw in Thunderbolt 3 and a low starting price of $900 USD and the Inspiron 7577 has quickly become our favorite gaming notebook for under a grand.
Some key drawbacks separate the Inspiron 7577 from costlier models like the Alienware 15 or Aorus X5. Firstly, the 1080p display is lacking in features. Colors are no match for the panels on the aforementioned systems where >90 percent of sRGB coverage is possible. As crisp as they are on the Dell, the colors just aren't as deep as they could have been. We would have gladly given up the 4K UHD panel on the higher-end Inspiron 7577 configuration if it had meant G-Sync, faster display response times, more accurate colors, and a brighter display backlight for the series. Secondly, the keyboard keys are softer than expected from a 15-inch gaming notebook. We already know that Dell can do better than this as proven by the superior keyboards of the Latitude and XPS series, so there's no reason why the Inspiron shouldn't get a similar treatment. Other smaller complaints like the lack of per-key RGB lighting, very slow SD card reader, weaker speakers, and a relatively heavy weight are less crucial to the gaming experience compared to keyboard comfort, display, noise, and performance.
The Inspiron 7577 is the best gaming notebook for users on a tight budget. It's surprisingly quiet and long-lasting with strong graphics performance that go beyond its asking price. The display and keyboard are the two aspects that feel "budget-grade" in this otherwise exceptional mainstream offering.
Dell Inspiron 15 7000 7577
- 01/03/2018 v6 (old)
Allen Ngo
Price comparison
