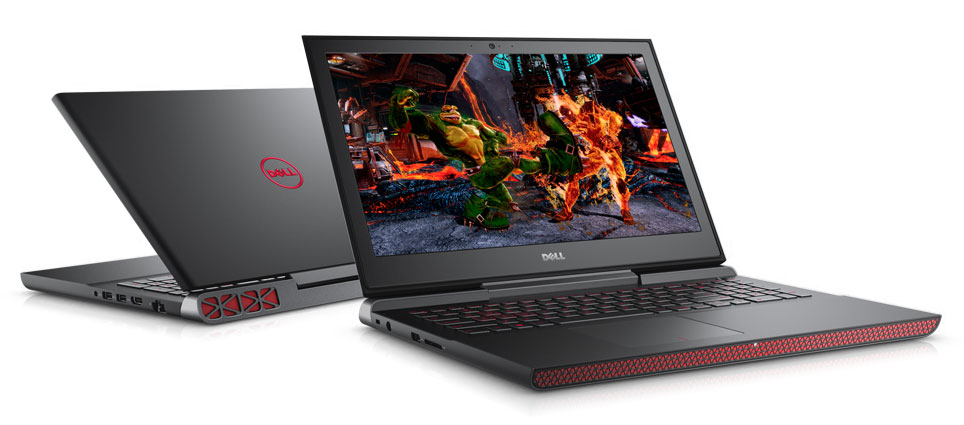
Dell Inspiron 15 7000 7567 Gaming (i5-7300HQ, GTX 1050) Laptop Review
About six months ago we reviewed the Dell Inspiron 15 7000 7567 Gaming with Intel Core i7-7700HQ, Nvidia GeForce GTX 1050 Ti, 16 GB of RAM and 256 GB SSD + 1 TB HDD. Except for the display, we came away impressed: the gaming notebook looks great, offers a lot of bang for the buck and the battery life is simply outstanding. Our test unit this around is the most basic version in the series with Core i5-7300HQ, Nvida GeForce GTX 1050, 8 GB of RAM and a 1 TB, platter-based hard drive. At the time of writing, this particular notebook costs $750 when purchased directly from Dell.
The Dell competes with a host of other entry-level gaming rigs ranging from the Acer Aspire VX5-591G, Lenovo Legion Y520 15IKBN, Samsung Odyssey NP800G5M, and Asus ROG Strix GL553VD to the Gigabyte Sabre 15. All these systems are equipped with either the GTX 1050 or GTX 1050 Ti, but feature the higher-end Intel Core i7-7700HQ processor, so we can expect the Inspiron to lose some ground when it comes to raw processing power. Only the Acer Aspire VX15 VX5-591G-589S is also equipped with the same - and slower - Core i5 CPU.
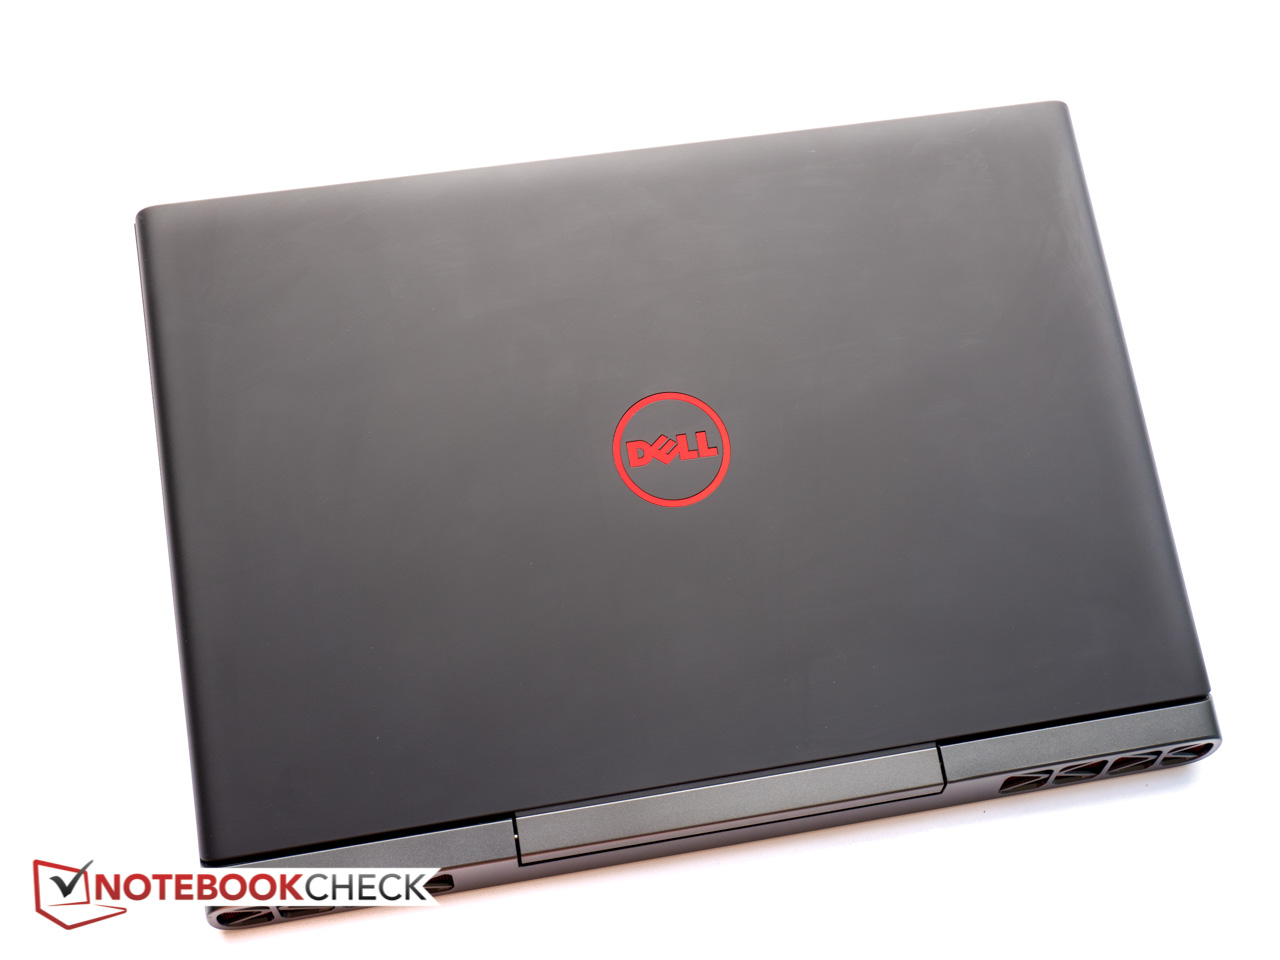
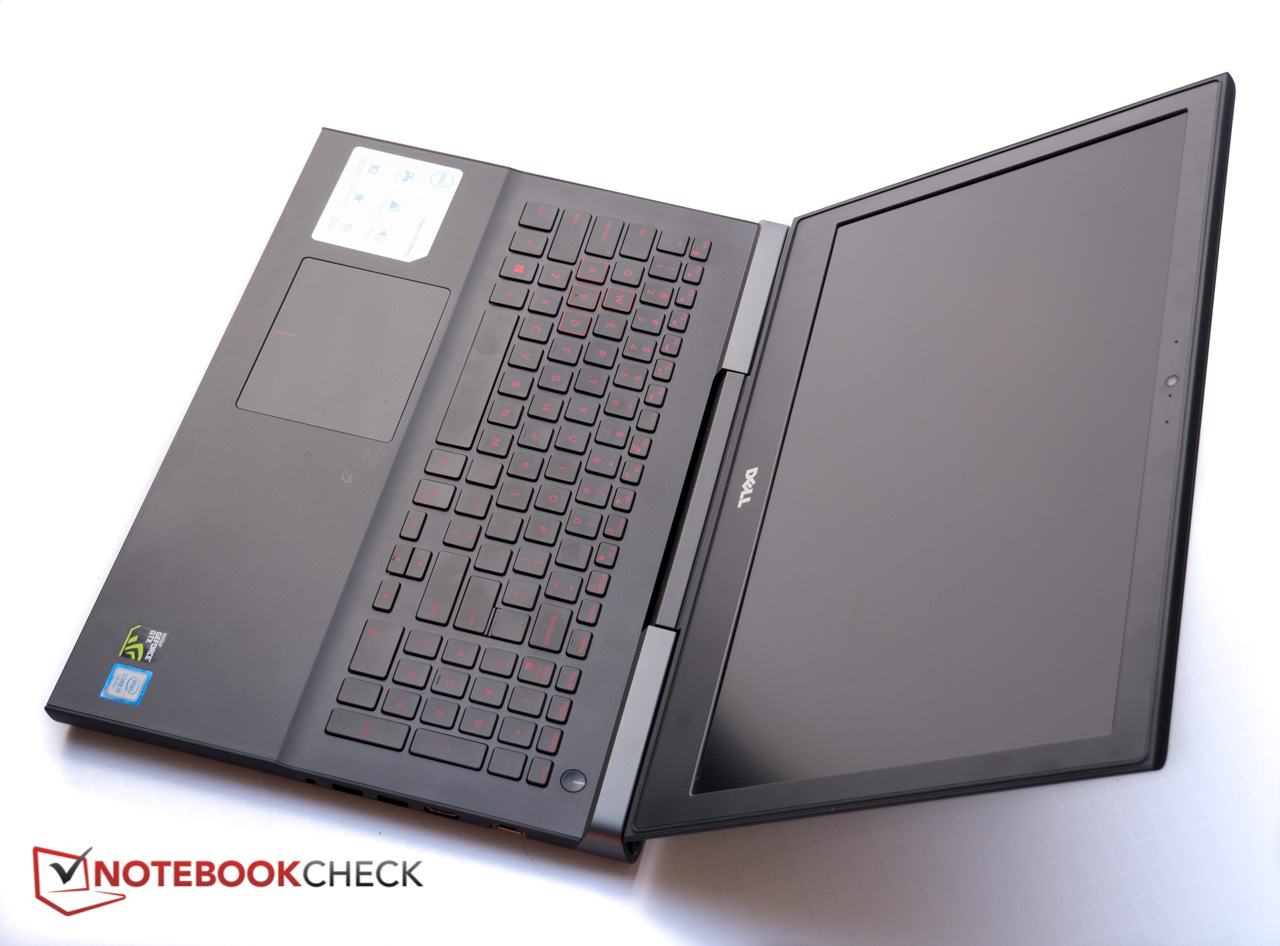
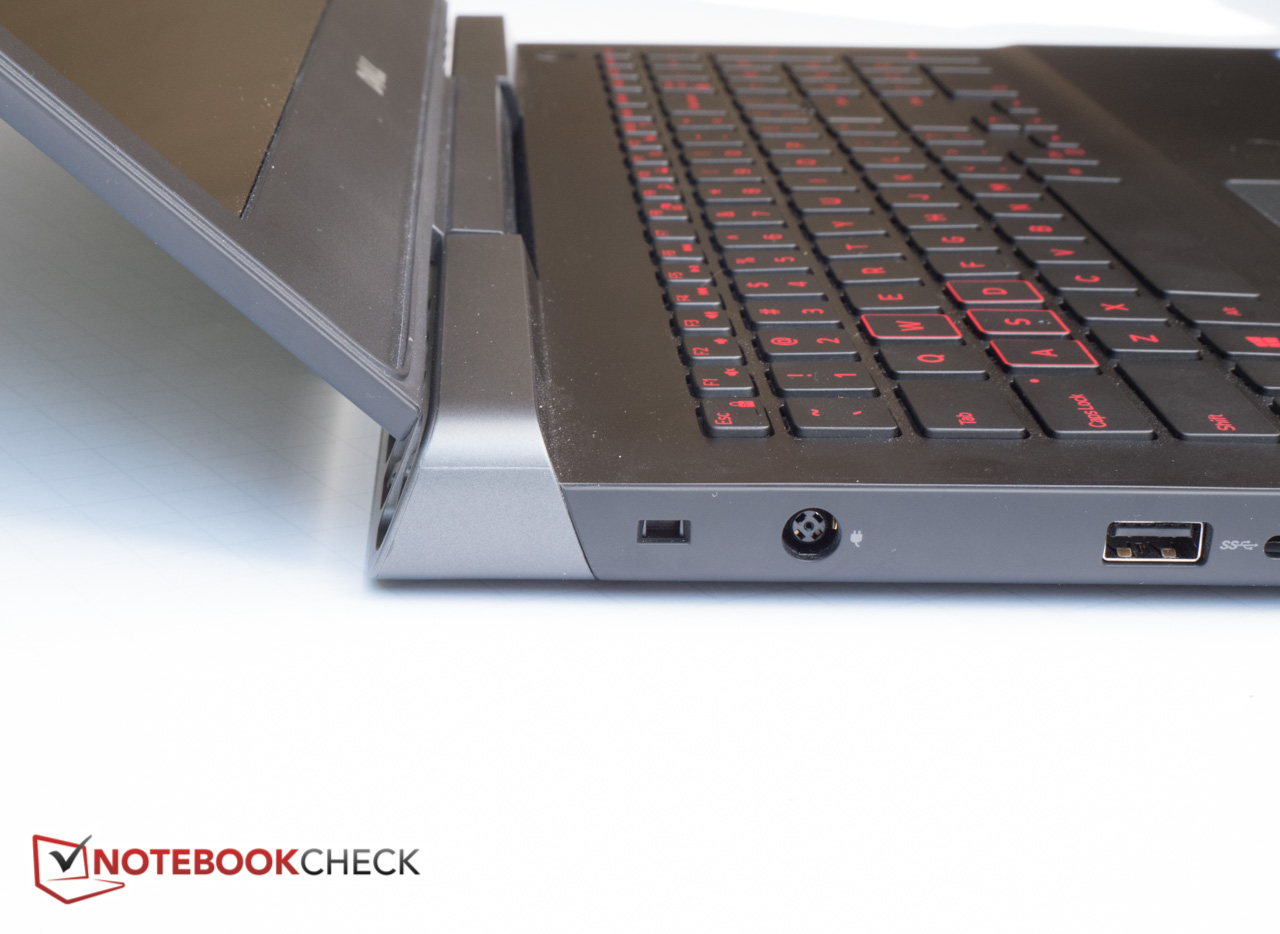
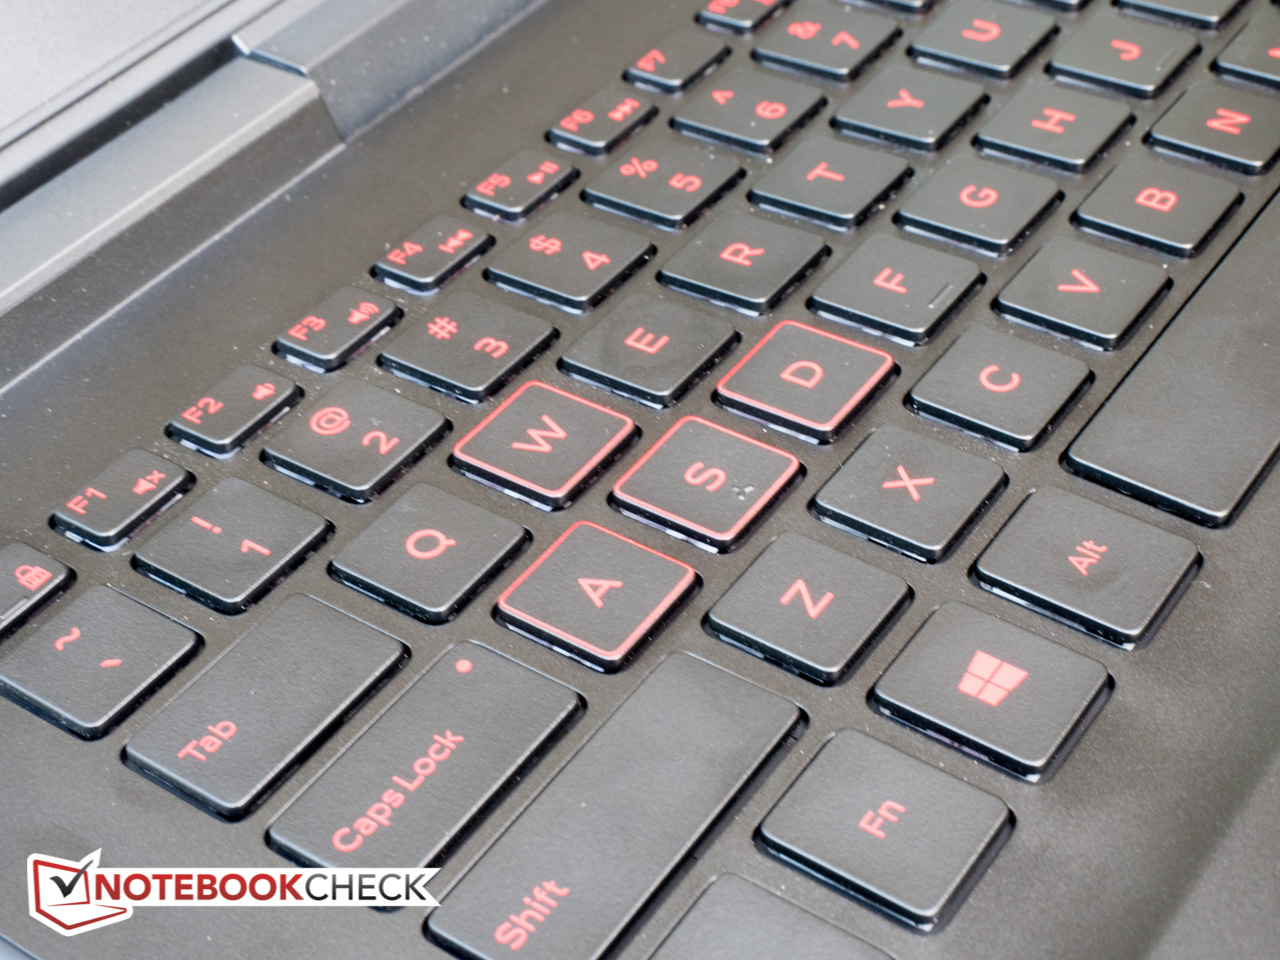
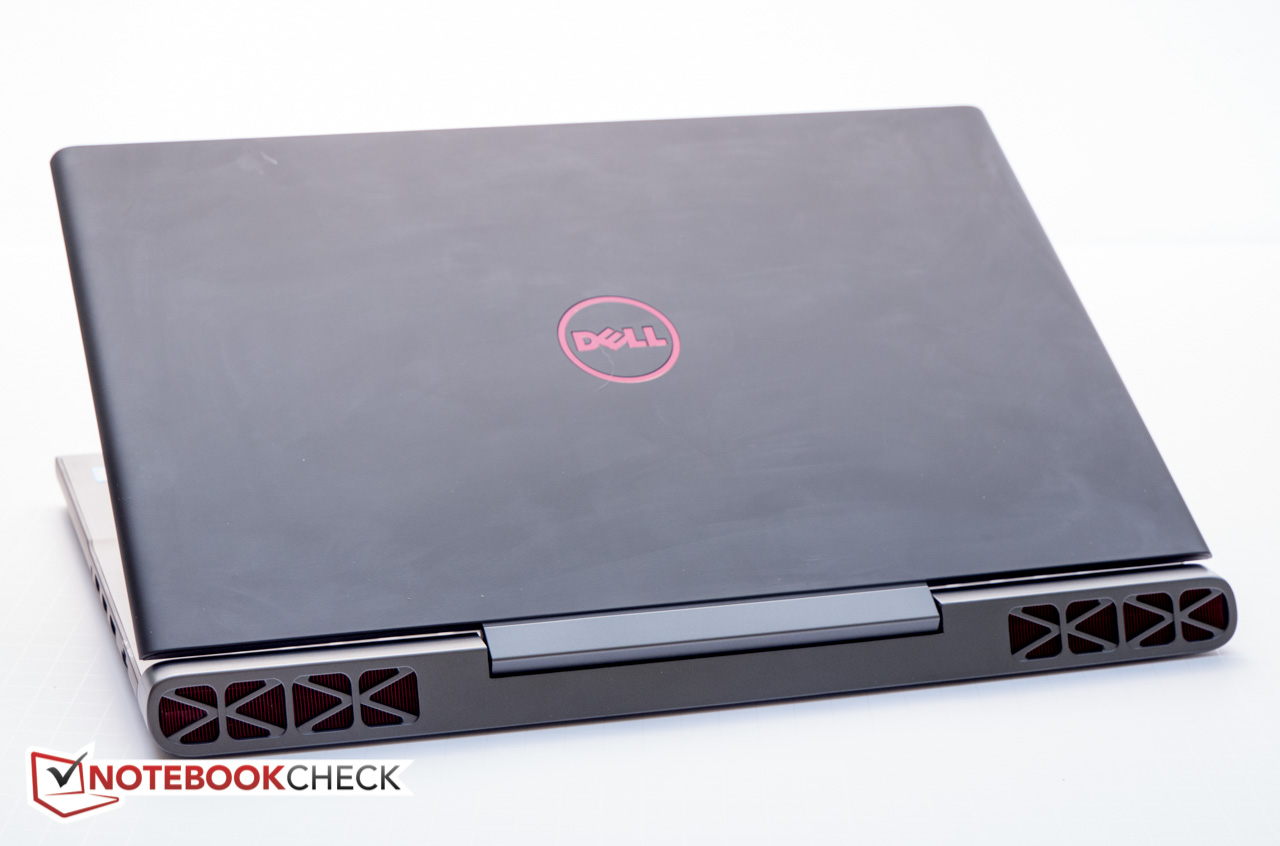
Since the two systems are otherwise identical, we’ll only touch upon the sections which merit a more detailed look and will skip the ones dealing with the case, connectivity and input devices entirely.

SD Card Reader
As before, the SD card reader – which we test using our Toshiba Exceria Pro SDXC 64 GB UHS-II reference memory card – returns middling results with AS SSD reporting a transfer rate of under 30 MB/s. Copying 1 GB of jpg files (roughly 5 MB each) to the desktop takes about 41 seconds. The Gigabyte Sabre 15 accomplishes the same task almost 30 seconds faster.
Communication
Like its more powerful sibling, our Inspiron is equipped with a 1x1 Intel Dual Band Wireless AC 3165 wireless module with Bluetooth 4.2 on board. The wireless card tops out at 314 and 326 Mbit/s for send and receive, respectively when the laptop is placed one meter from our Linksys EA8500 test router. Many budget gaming systems aren’t much faster, so we can’t complain too much about the performance here. During our time with the notebook we didn't experience any connectivity problems or similar issues.
Maintenance
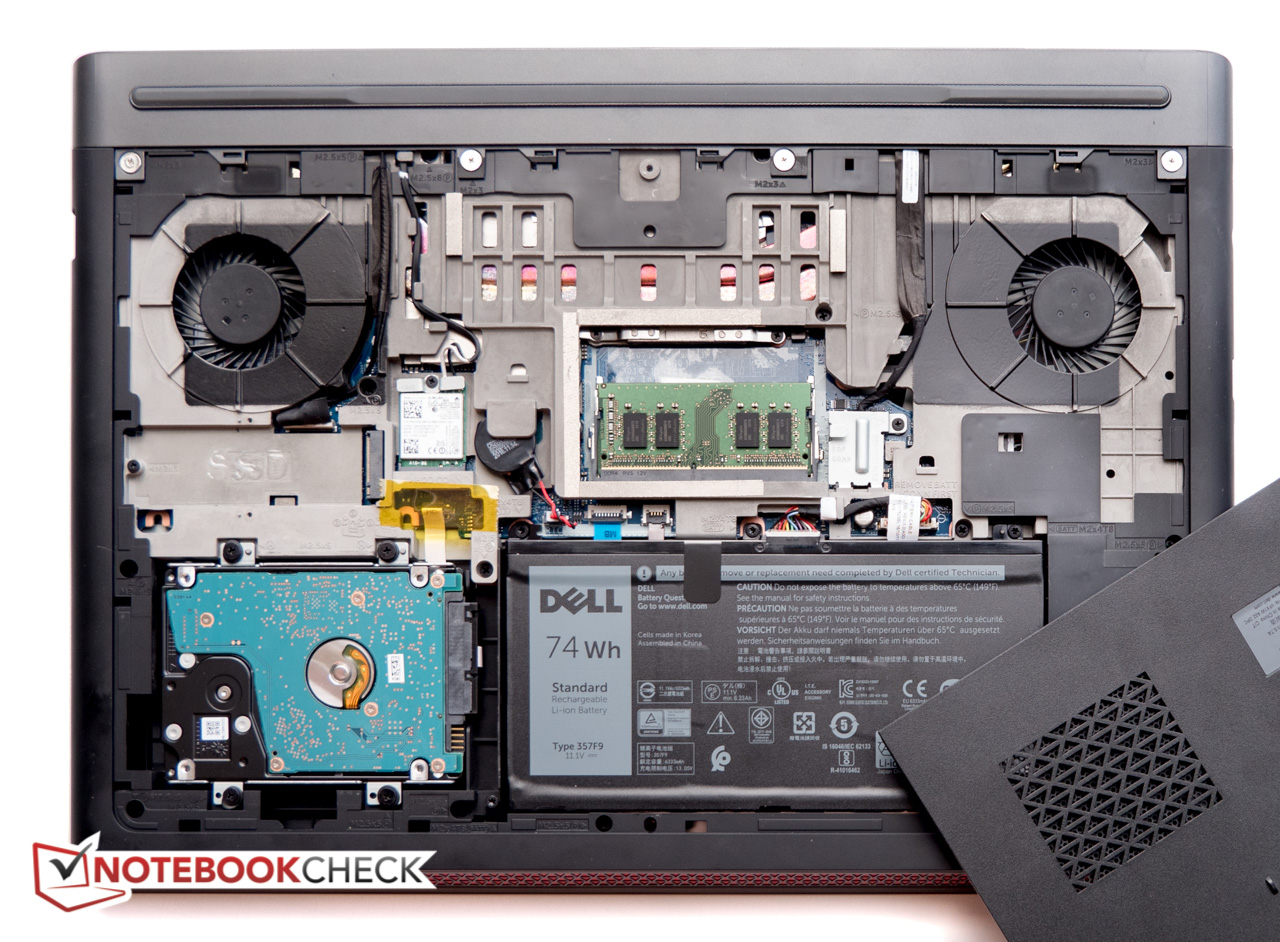
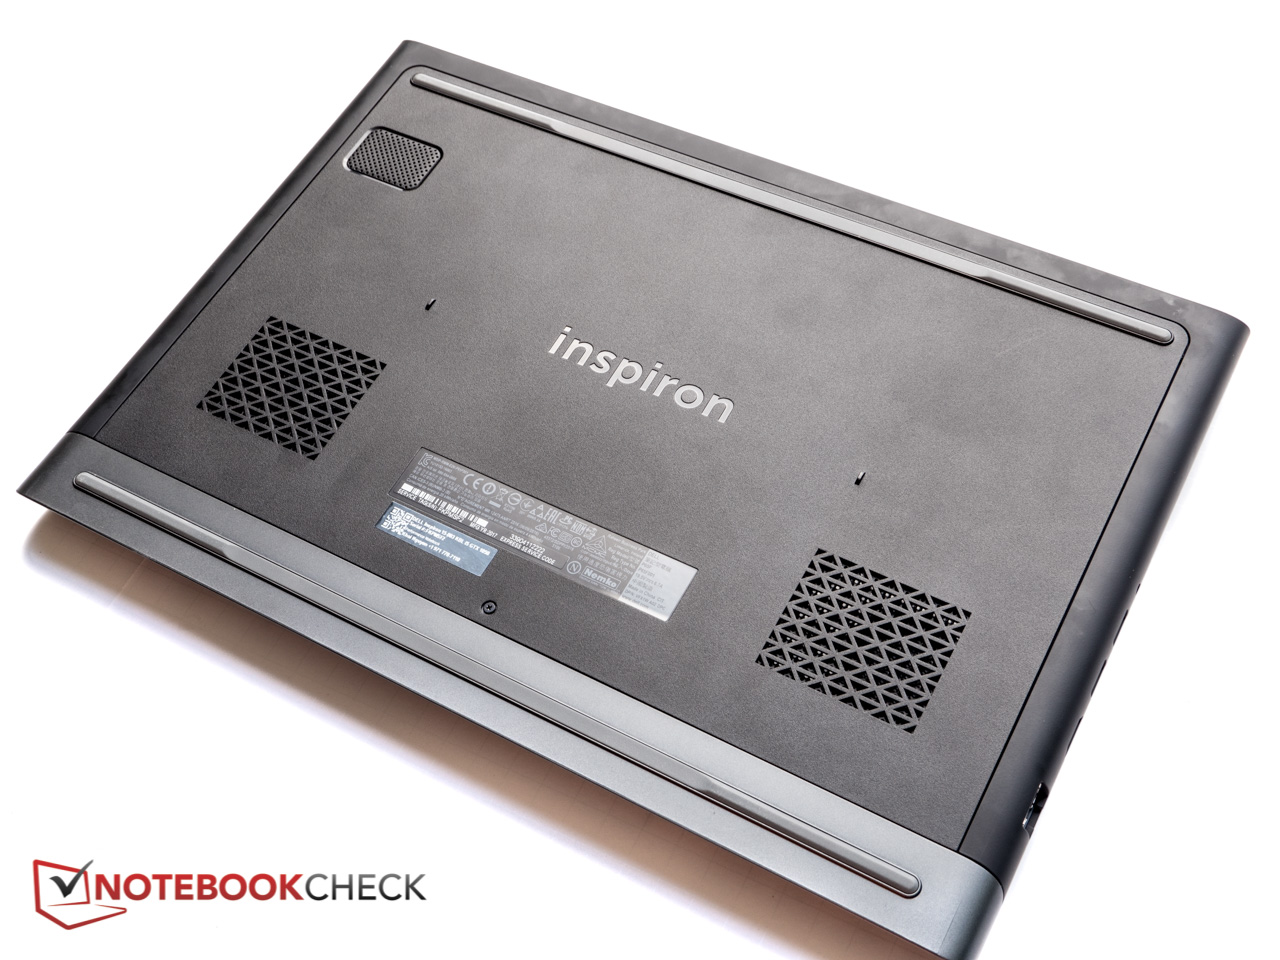
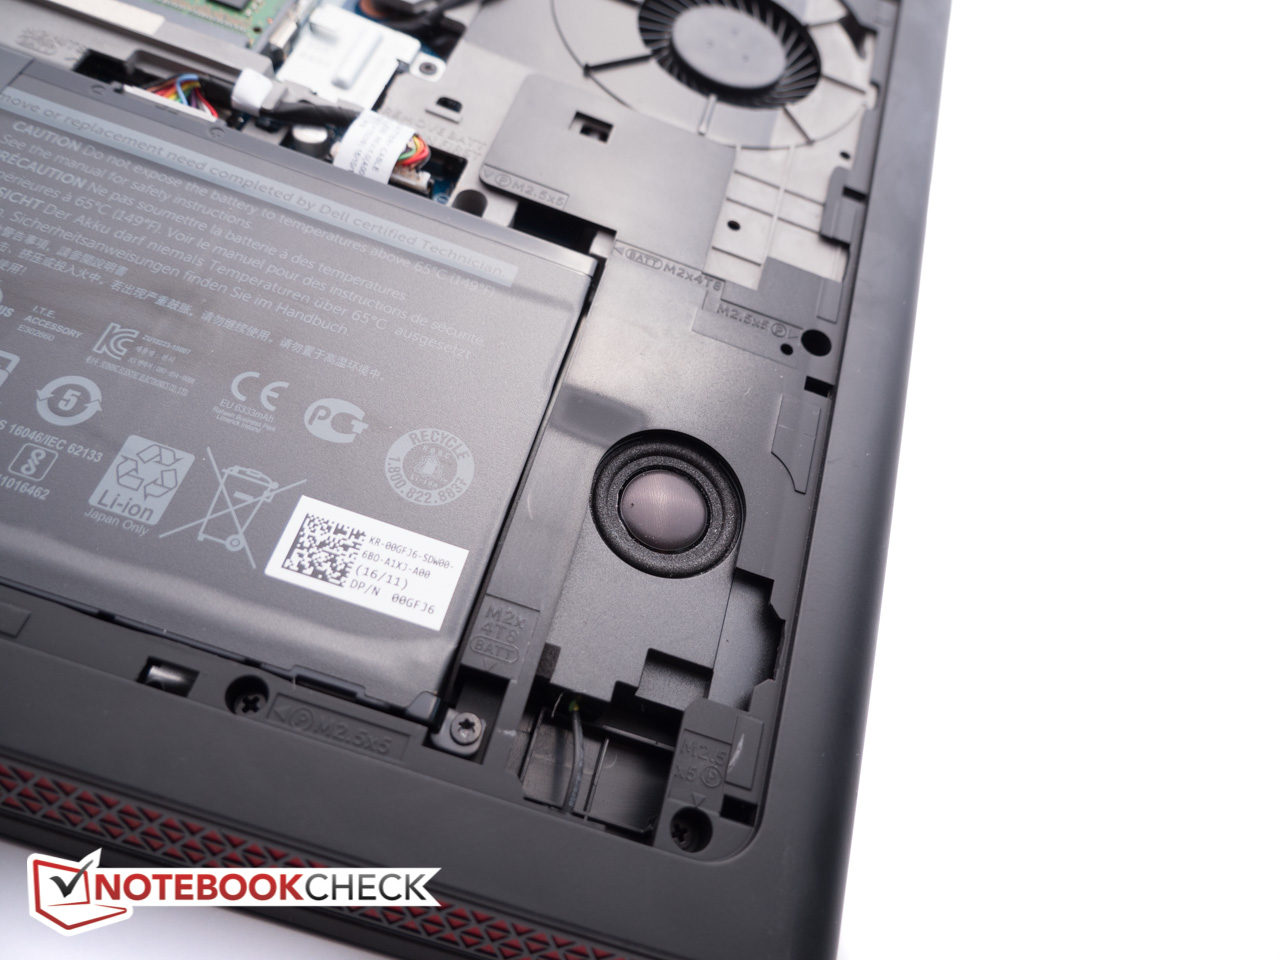
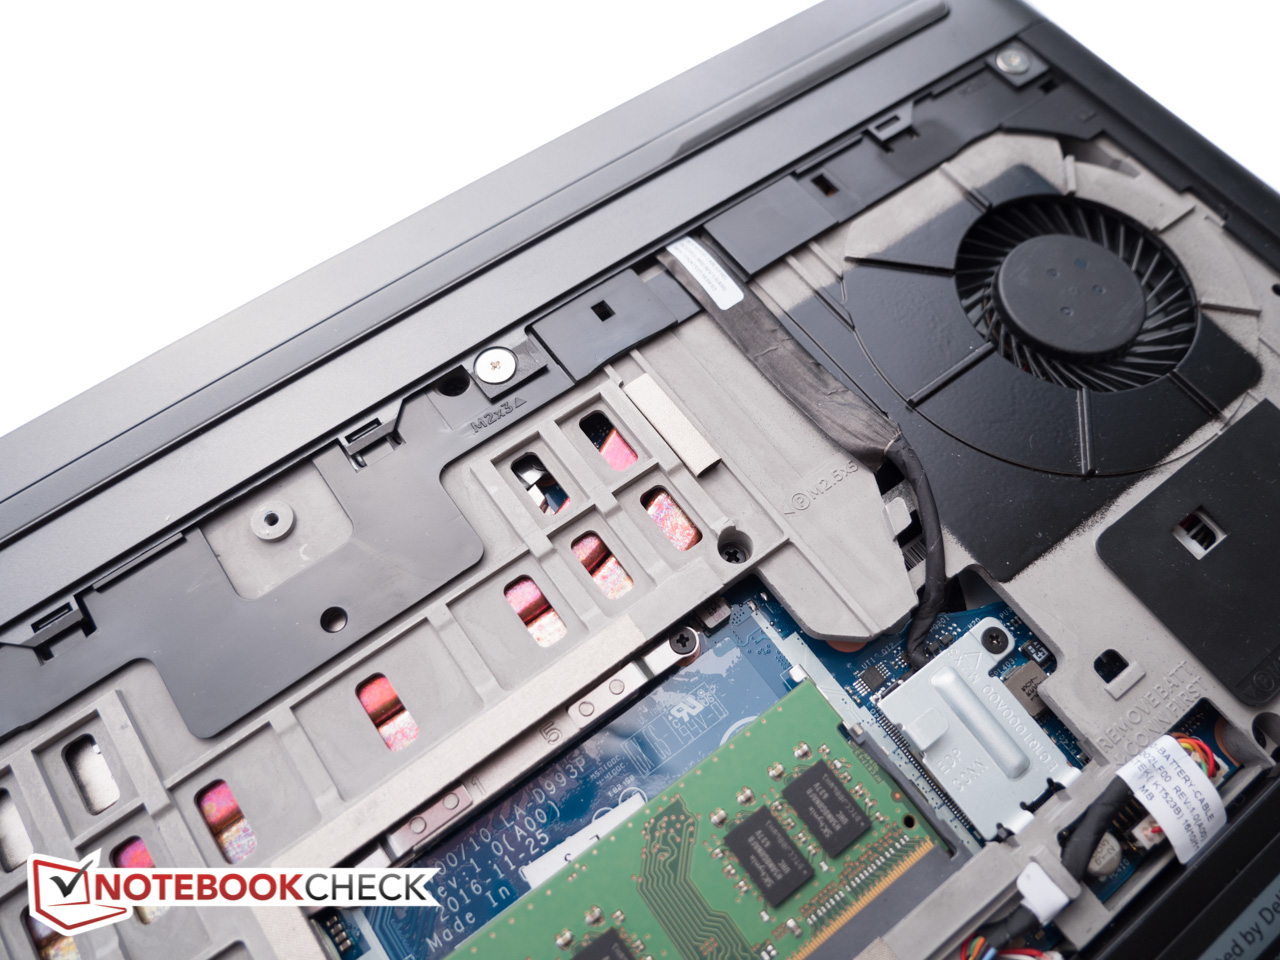
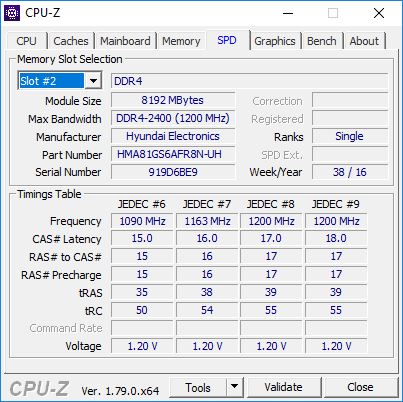
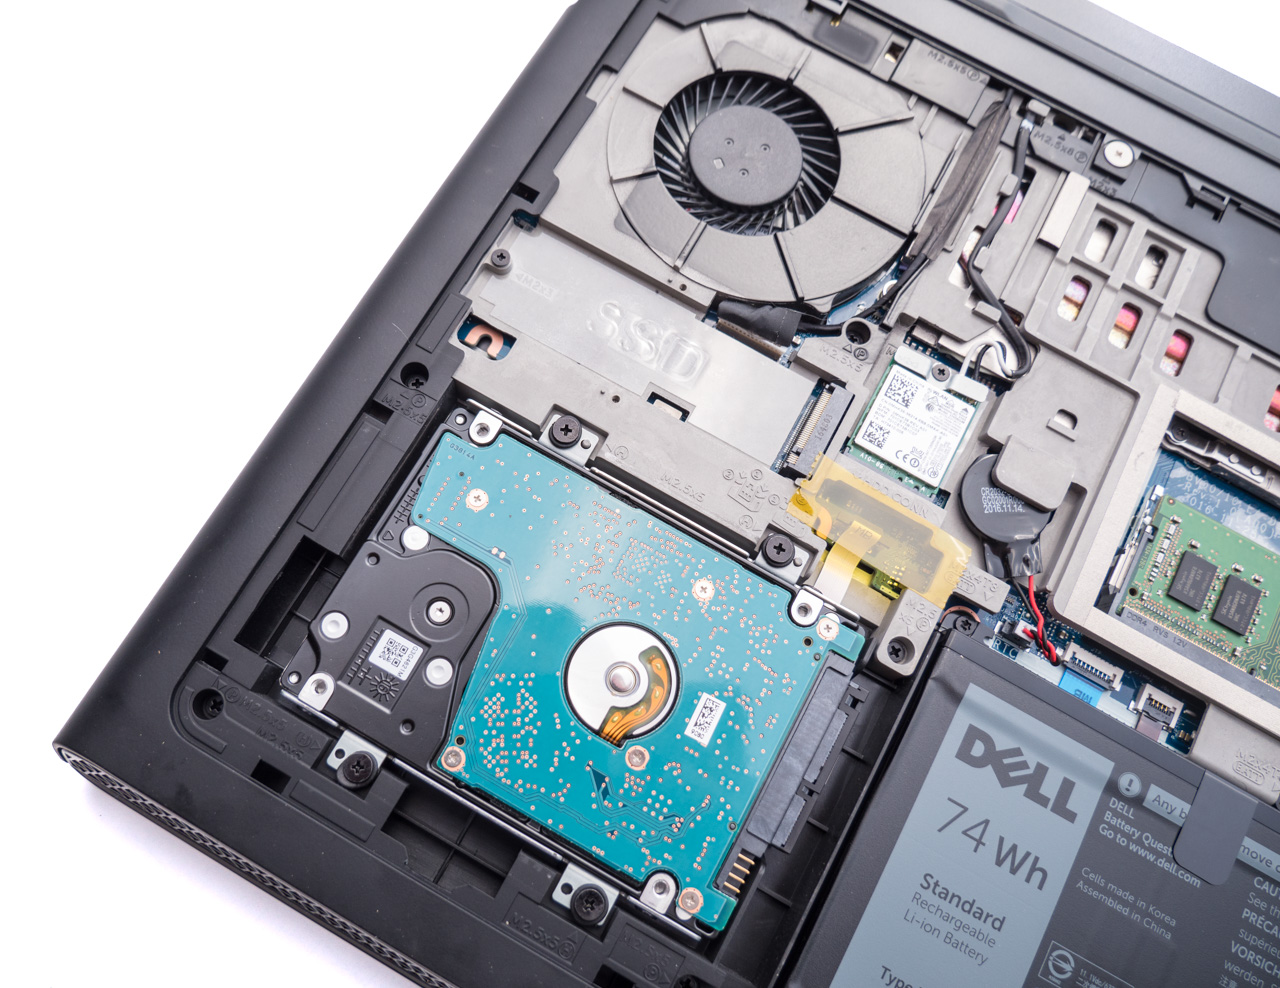
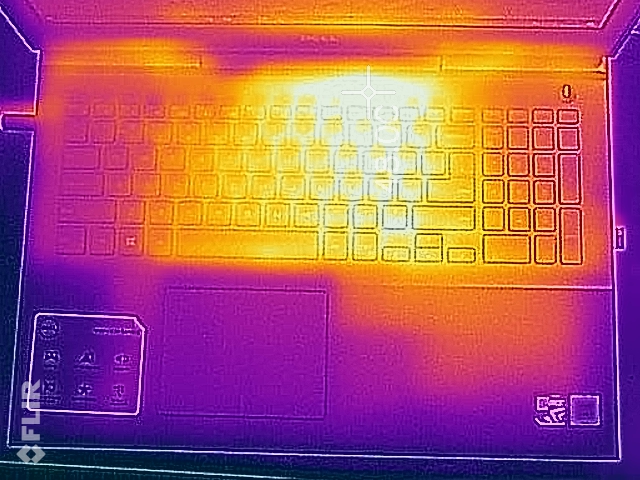
Since our review notebook is only equipped with a 2.5-inch platter-based drive – the higher-end Inspiron 15 Gaming we reviewed in February featured both an SSD and a 1 TB HDD - we decided to take a look at the inside once more. The bottom panel is secured by one single screw, which makes access to the hardware quite easy. The plastic tabs holding the bottom panel to the base unit don't seem to be very sturdy, so gentle handling is required. Good news: even though our Inspiron only comes with a conventional hard drive, it also features an M.2 slot for those who’d like to install their own SSD. Users have access to the two DDR4 RAM slots (one occupied), the WLAN module, and the BIOS battery. The dual fan system is in plain view as well and very easy to clean.
Warranty
In the US, the Inspiron is covered against manufacturer’s defects for a period of 12 months. Dell offers many upgrades including 3 Years of Premium Support with Onsite Service for $150. 3 Years Accidental Damage Service add an additional $80. Please see our Guarantees, Return policies and Warranties FAQ for country-specific information.
Display
Four SKUs of the Inspiron 15 7000 Gaming feature 1080p displays with a resolution of 1920x1080 pixels. Our review notebook, which is the least expensive model in the lineup, is still only offered with a TN display, while all other versions feature panels based on IPS technology. When our colleagues reviewed the higher-end Inspiron, the TN panel was the sole option. Dell likely responded to complaints from its customer base - definitely a step in the right direction. The highest-end Inspiron 15 7000 Gaming features a 15.6-inch UHD (3840x2160) IPS display.
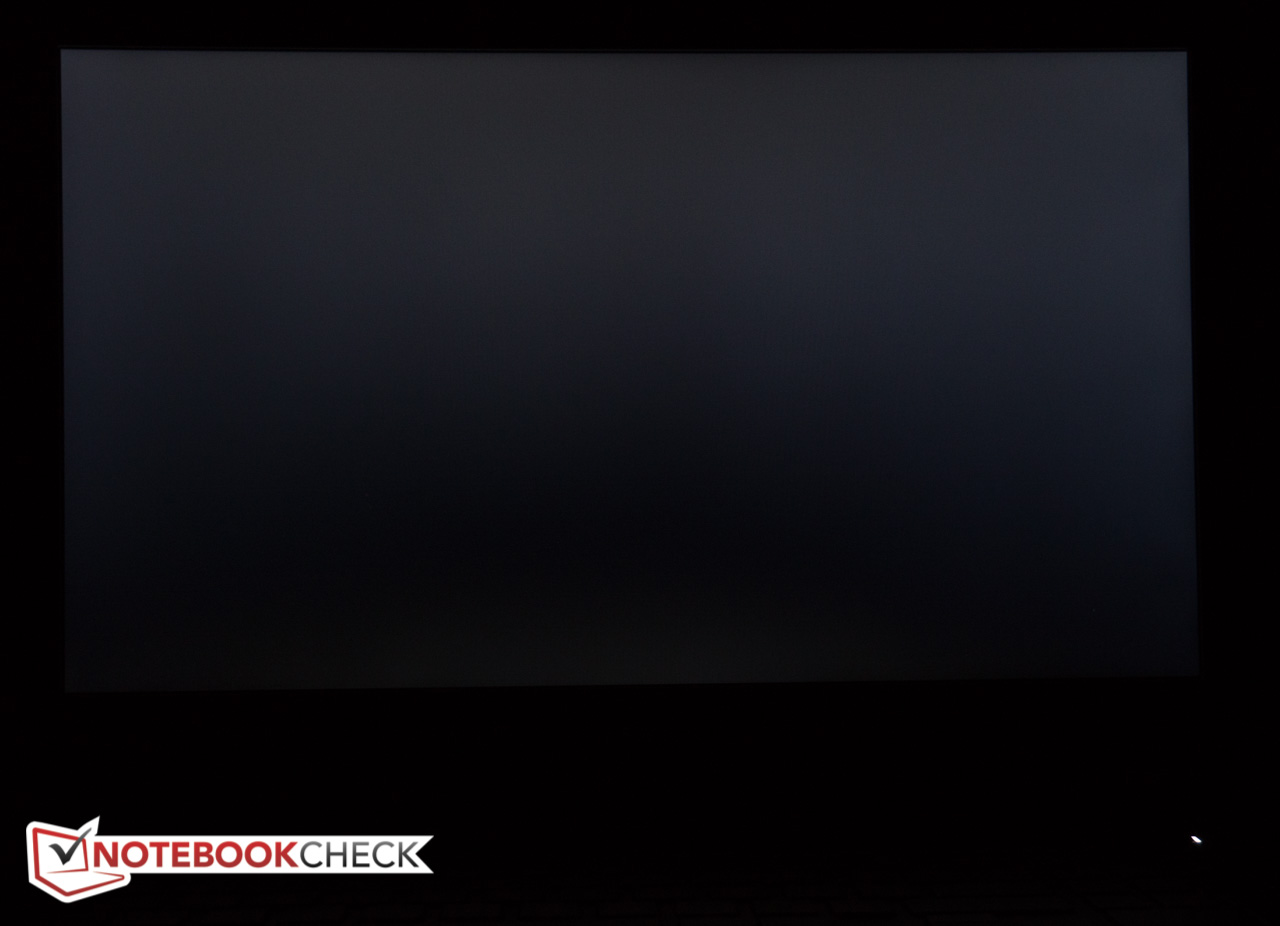
The AU Optronics AUO38ED B156H TN panel is the same one we encountered during our review of the higher-end sibling with the brightness, contrast and gamut at very similar, subpar levels. At 235 nits, the display brightness is average for a gaming notebook, although the contrast ratio is the lowest one in our comparison.Thankfully, Dell does not use PWM to control the brightness.
Given that this is a TN display, backlight bleeding isn’t much of an issue, although the panel does look grayish when displaying black.
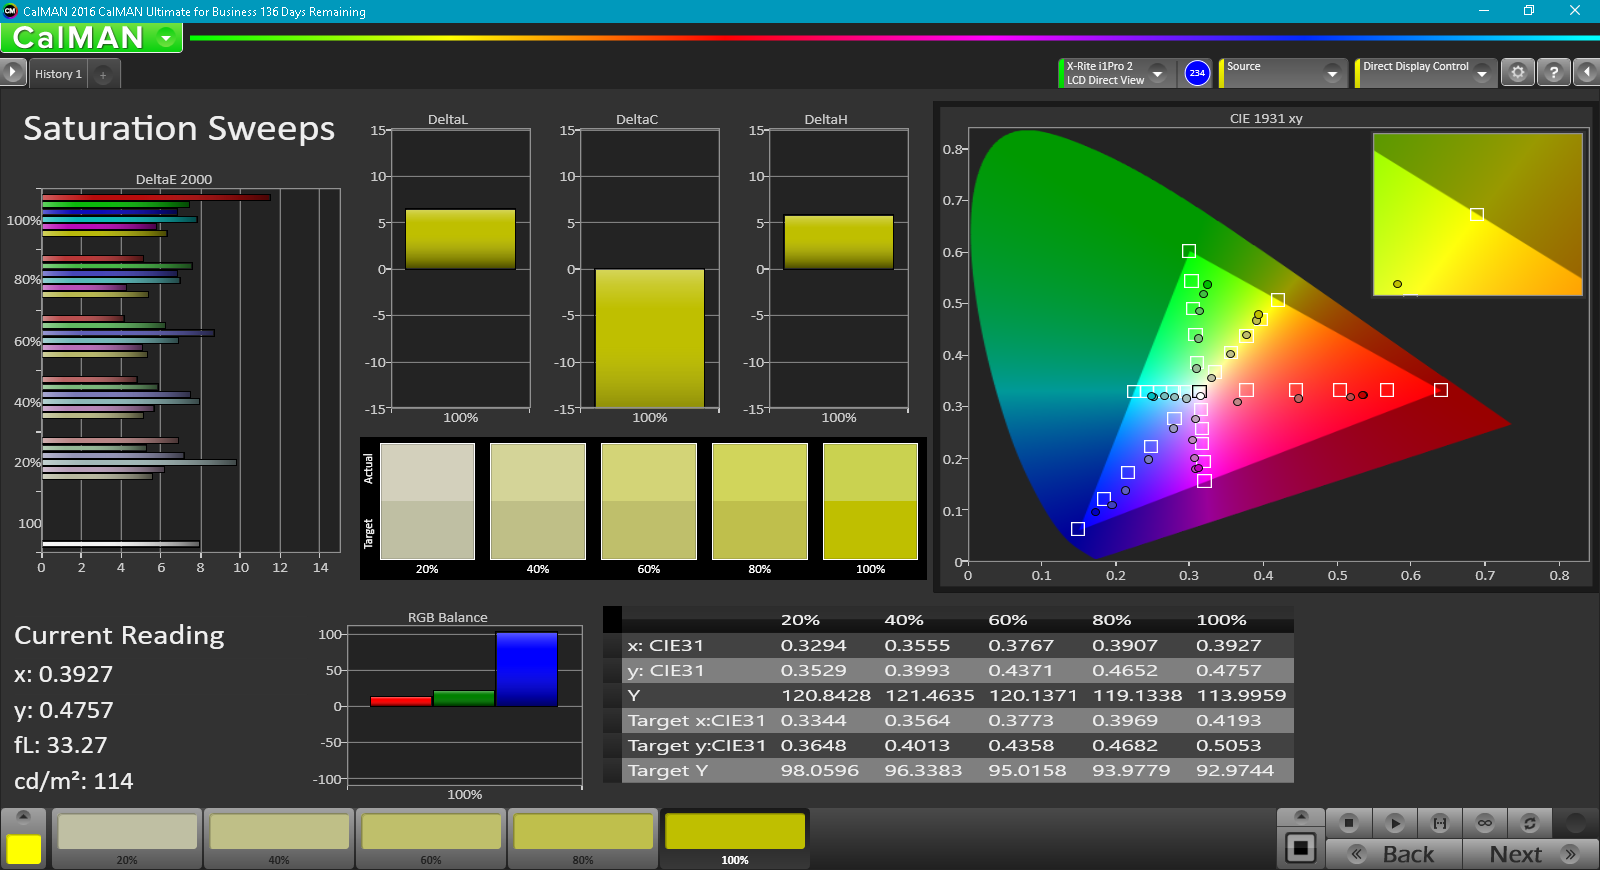
Update 08/09/2017: Our colleagues had the chance to re-review the higher-end Inspiron (Core i7-7700HQ, GTX 1050 Ti) with a Full HD IPS panel from LG Philips instead of the TN display. We've included this model in the display comparison table below. The synopsis: the IPS panel is far from class leading, but it is slightly brighter with much better contrast, more vivid colors and much better viewing angles.
| |||||||||||||||||||||||||
Brightness Distribution: 88 %
Center on Battery: 242.2 cd/m²
Contrast: 351:1 (Black: 0.69 cd/m²)
ΔE ColorChecker Calman: 11.6 | ∀{0.5-29.43 Ø4.72}
ΔE Greyscale Calman: 15.7 | ∀{0.09-98 Ø4.97}
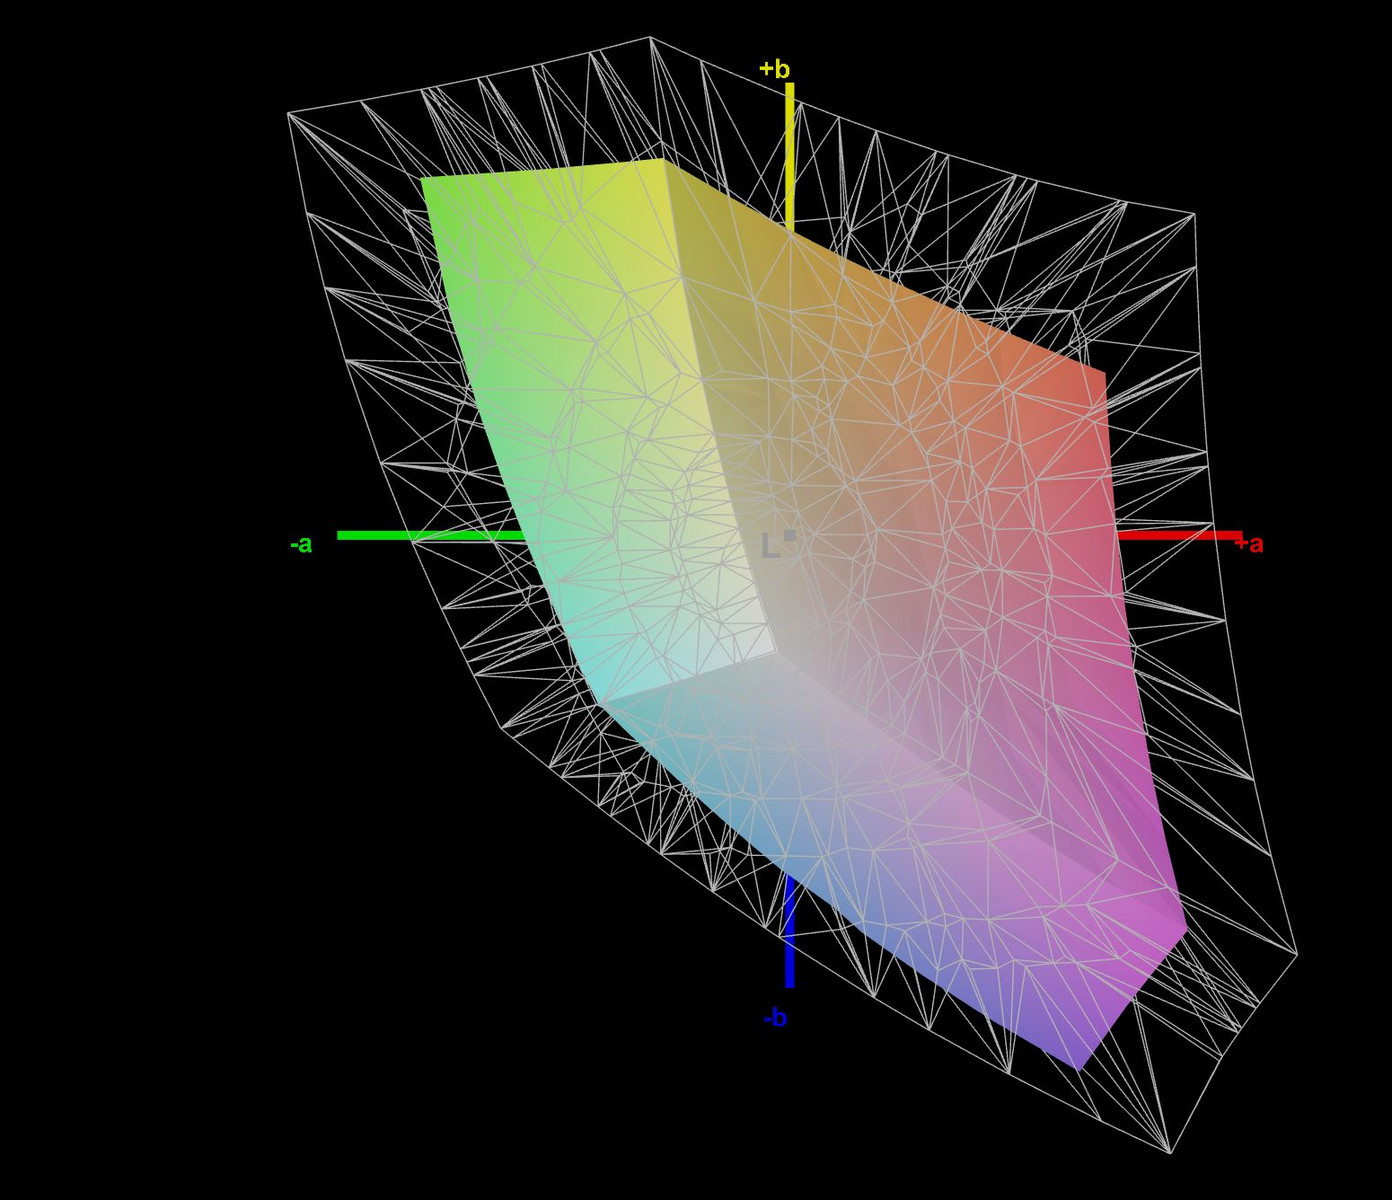
57.55% sRGB (Argyll 1.6.3 3D)
39.47% AdobeRGB 1998 (Argyll 1.6.3 3D)
39.47% AdobeRGB 1998 (Argyll 3D)
57.5% sRGB (Argyll 3D)
38.2% Display P3 (Argyll 3D)
Gamma: 1.57
CCT: 11662 K
| Dell Inspiron 15 7000 7567 Gaming (Core i5-7300HQ, GTX 1050) AU Optronics AUO38ED B156HTN , TN, 15.6", 1920x1080 | Dell Inspiron 15 7000 7567 LG Philips LGD053F (156WF6), , 15.6", 1920x1080 | Lenovo Legion Y520-15IKBN-80WK001KUS LP156WF6-SPK3, IPS, 15.6", 1920x1080 | Samsung Odyssey NP800G5M-X01US IPS, 15.6", 1920x1080 | Asus ROG Strix GL553VD-DS71 BOE HF NV156FHM-N43, IPS, 15.6", 1920x1080 | Gigabyte Sabre 15G ID: LGD0533, Name: LG Display LP156WF6-SPK3, IPS, 15.6", 1920x1080 | Acer Aspire VX15 VX5-591G-589S BOE CQ NV156HFM-N42, IPS, 15.6", 1920x1080 | |
|---|---|---|---|---|---|---|---|
| Display | 8% | 23% | 68% | 2% | 5% | ||
| Display P3 Coverage (%) | 38.2 | 41.49 9% | 47.11 23% | 67.6 77% | 38.97 2% | 40.56 6% | |
| sRGB Coverage (%) | 57.5 | 61.7 7% | 70.4 22% | 90.8 58% | 58.2 1% | 59.4 3% | |
| AdobeRGB 1998 Coverage (%) | 39.47 | 42.98 9% | 48.71 23% | 66.4 68% | 40.3 2% | 41.9 6% | |
| Response Times | -2% | -45% | -14% | -46% | 10% | -24% | |
| Response Time Grey 50% / Grey 80% * (ms) | 36.8 ? | 37.6 ? -2% | 58.8 ? -60% | 38.8 ? -5% | 57.6 ? -57% | 32 ? 13% | 46 ? -25% |
| Response Time Black / White * (ms) | 27.6 ? | 28 ? -1% | 36 ? -30% | 33.6 ? -22% | 37.2 ? -35% | 25.6 ? 7% | 34 ? -23% |
| PWM Frequency (Hz) | 21550 ? | 19230 ? | 20000 ? | 20000 ? | |||
| Screen | 46% | 21% | 25% | 62% | 25% | 49% | |
| Brightness middle (cd/m²) | 242.2 | 272 12% | 239 -1% | 255.9 6% | 289.3 19% | 248.4 3% | 277 14% |
| Brightness (cd/m²) | 235 | 251 7% | 244 4% | 249 6% | 280 19% | 241 3% | 268 14% |
| Brightness Distribution (%) | 88 | 85 -3% | 88 0% | 90 2% | 93 6% | 84 -5% | 91 3% |
| Black Level * (cd/m²) | 0.69 | 0.23 67% | 0.35 49% | 0.48 30% | 0.29 58% | 0.3 57% | 0.26 62% |
| Contrast (:1) | 351 | 1183 237% | 683 95% | 533 52% | 998 184% | 828 136% | 1065 203% |
| Colorchecker dE 2000 * | 11.6 | 6.7 42% | 7.3 37% | 5.9 49% | 3.1 73% | 7.5 35% | 5.05 56% |
| Colorchecker dE 2000 max. * | 19.4 | 13.5 30% | 24.7 -27% | 18.9 3% | 7.1 63% | 25.2 -30% | 8.93 54% |
| Greyscale dE 2000 * | 15.7 | 6.8 57% | 4.9 69% | 5.6 64% | 2.1 87% | 6.5 59% | 2.97 81% |
| Gamma | 1.57 140% | 2.18 101% | 2.19 100% | 2.21 100% | 2.22 99% | 2.19 100% | 2.39 92% |
| CCT | 11662 56% | 6476 100% | 7332 89% | 7250 90% | 6226 104% | 7852 83% | 6466 101% |
| Color Space (Percent of AdobeRGB 1998) (%) | 39.47 | 39.5 0% | 35 -11% | 44.8 14% | 59 49% | 37 -6% | 38 -4% |
| Color Space (Percent of sRGB) (%) | 57.55 | 61.4 7% | 55 -4% | 70.1 22% | 91 58% | 57.9 1% | 59 3% |
| Total Average (Program / Settings) | 17% /
32% | -12% /
10% | 11% /
19% | 28% /
48% | 12% /
19% | 10% /
30% |
* ... smaller is better
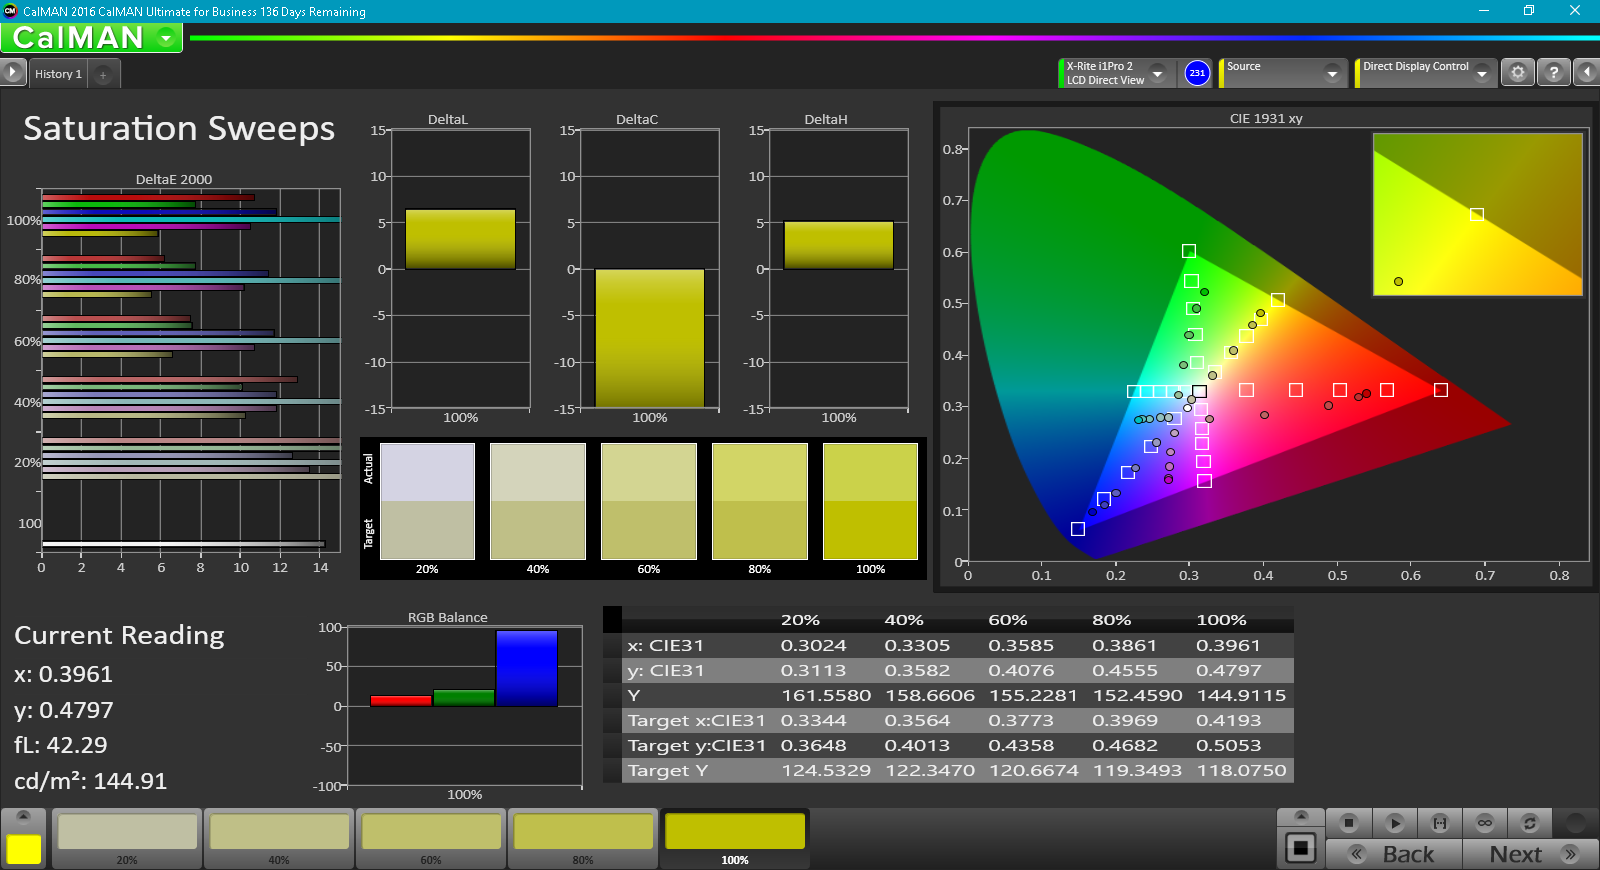
At 39 and 58 percent of the AdobeRGB and sRGB standards, color coverage is fairly dismal. None of the entry-level gaming units fare much better, so this seems to be par for the course. Needless to say that even basic photo editing is not really recommended. The Dell XPS 15 2017 9560 has exactly the same processor and graphics card as the review laptop and offers close to 100 % sRGB coverage, but it is also significantly more expensive.
With high average DeltaE deviations for both color and grayscale according to our measurements with the X-Rite spectrophotometer and CalMAN software, the display is visibly bluish in nature. Calibration does improve the display significantly, although the result is still middling even when compared to other entry-level displays in their uncalibrated state.

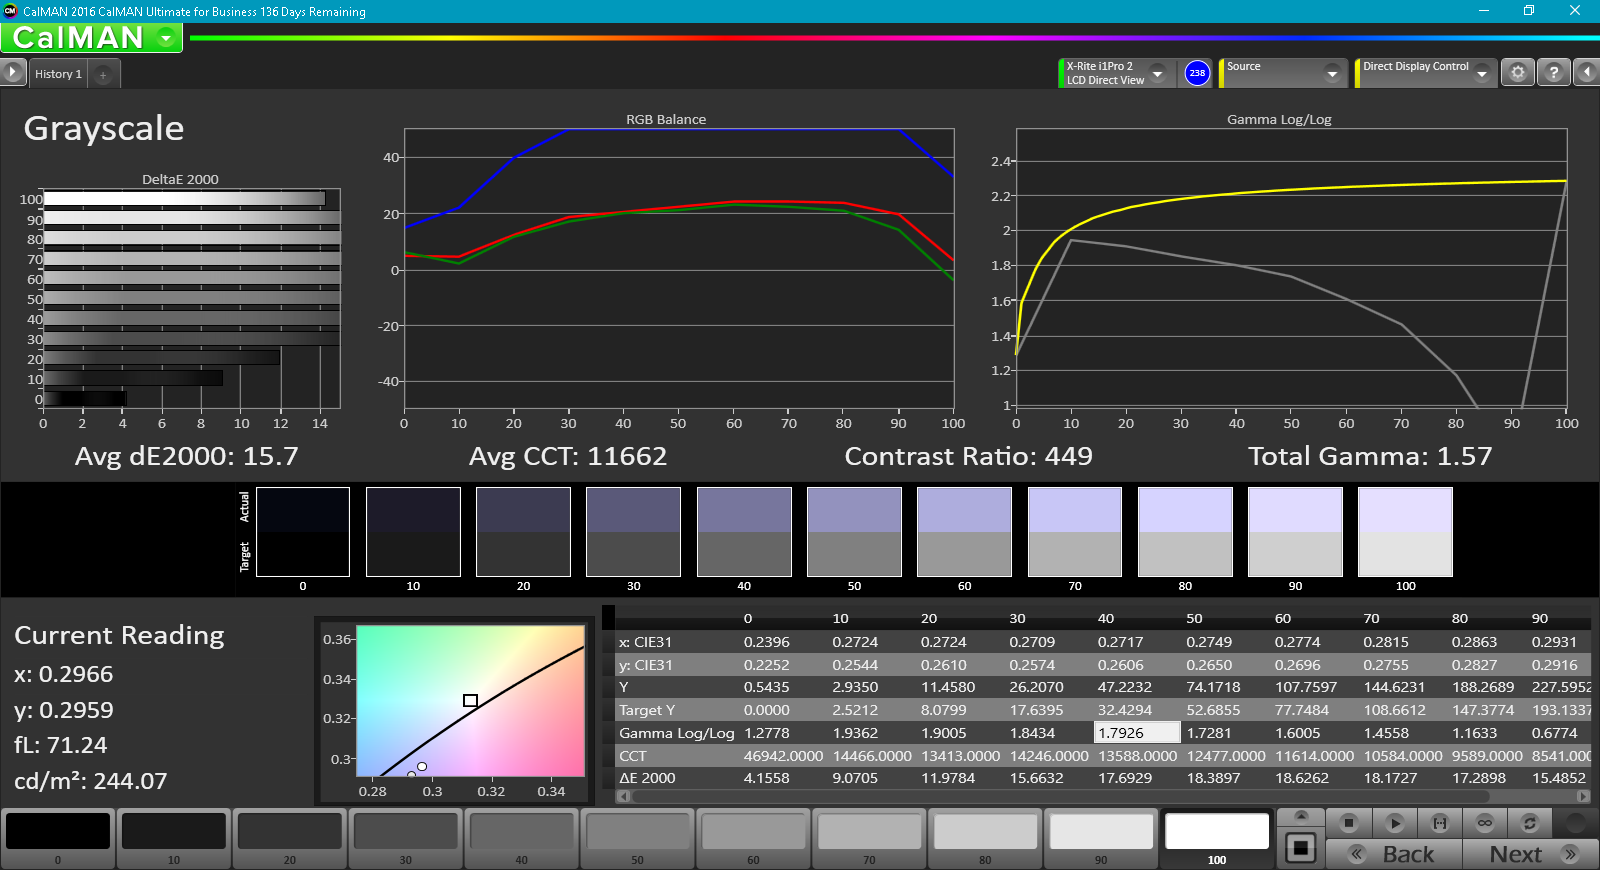

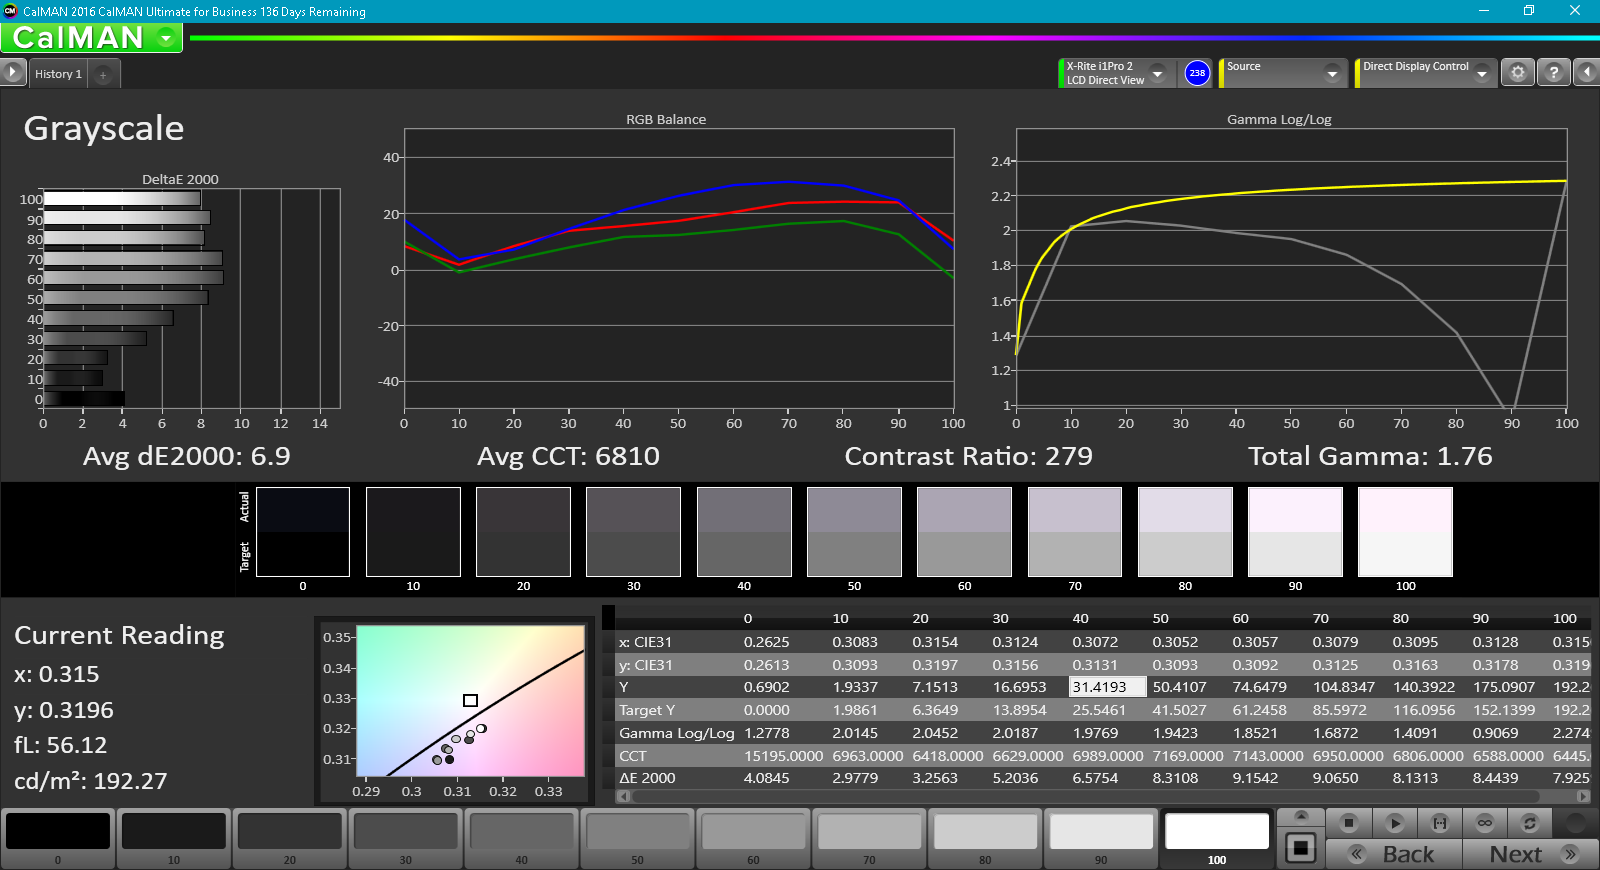
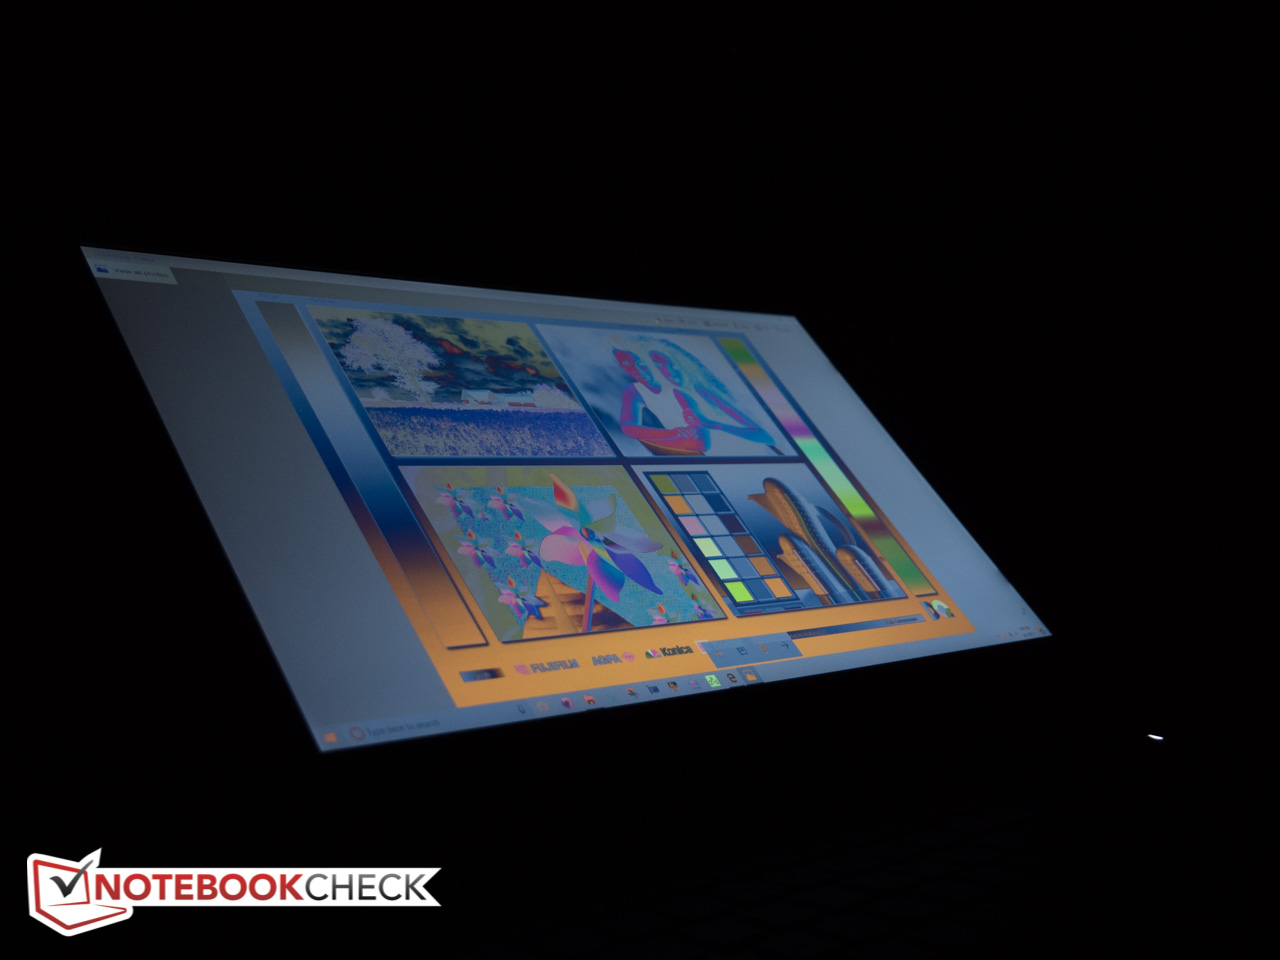
Outdoor visibility is not great courtesy of the comparatively low brightness and lackluster contrast. Thanks to the matte panel, working in the shade is possible provided the display is carefully adjusted, but overcast skies and especially sunlight make deciphering the screen either hard or next to impossible. Since this is a gaming unit, suitability for outdoor use is of a lower priority.
Viewing angle stability is atrocious with substantial screen darkening and color inversions even at more moderate angles. Notebooks with IPS displays fare much better in this regard.
Display Response Times
| ↔ Response Time Black to White | ||
|---|---|---|
| 27.6 ms ... rise ↗ and fall ↘ combined | ↗ 24.4 ms rise | 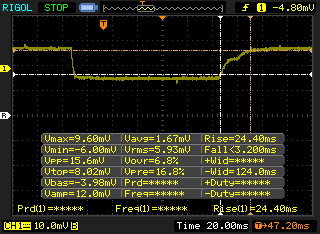 |
| ↘ 3.2 ms fall | ||
| The screen shows relatively slow response rates in our tests and may be too slow for gamers. In comparison, all tested devices range from 0.1 (minimum) to 240 (maximum) ms. » 70 % of all devices are better. This means that the measured response time is worse than the average of all tested devices (19.8 ms). | ||
| ↔ Response Time 50% Grey to 80% Grey | ||
| 36.8 ms ... rise ↗ and fall ↘ combined | ↗ 17.2 ms rise | 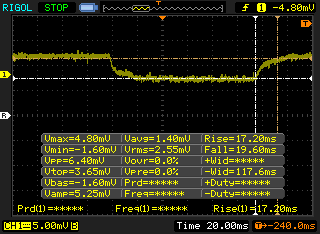 |
| ↘ 19.6 ms fall | ||
| The screen shows slow response rates in our tests and will be unsatisfactory for gamers. In comparison, all tested devices range from 0.165 (minimum) to 636 (maximum) ms. » 53 % of all devices are better. This means that the measured response time is worse than the average of all tested devices (31 ms). | ||
Screen Flickering / PWM (Pulse-Width Modulation)
| Screen flickering / PWM not detected | 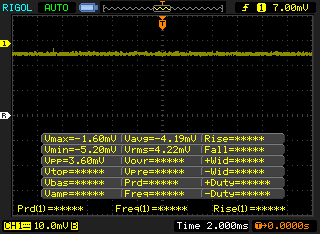 | ||
In comparison: 52 % of all tested devices do not use PWM to dim the display. If PWM was detected, an average of 7778 (minimum: 5 - maximum: 343500) Hz was measured. | |||
Performance
Our review unit doesn't comes equipped with the very common i7-7700HQ CPU like many gaming systems, but features the somewhat less popular - but also less expensive - Intel Core i5-7300HQ instead. The two bottom SKUs available in Dell's Online store feature this processor; the remaining three SKUs come with the more powerful i7 CPU. The top-of-the-line Inspiron 15 7000 Gaming features 16 GB of RAM, a 512GB PCIe NVMe M.2 SSD, a higher-end GeForce GTX 1050Ti GPU and a 15.6-inch UHD (3840 x 2160) IPS display for $1200.
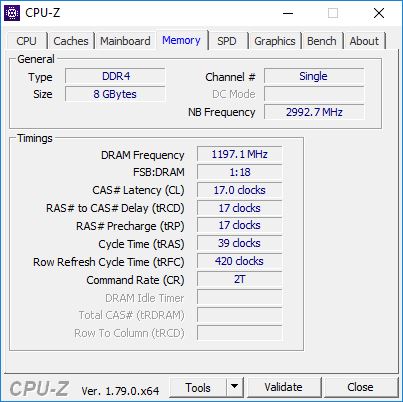
We should note here that our review system is equipped with 8 GB of single-channel DDR4 RAM. Users can install a second 8 GB DDR4 module for a small performance boost, as two modules would allow the RAM to run in dual-channel mode.
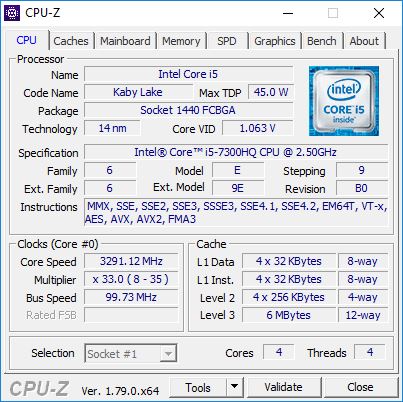
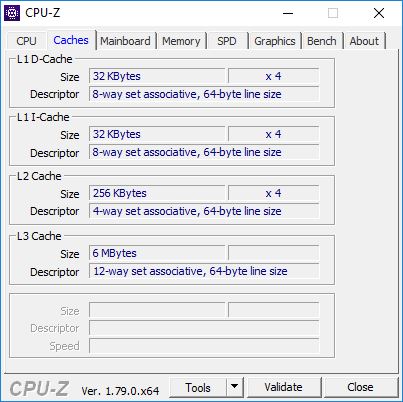

Processor
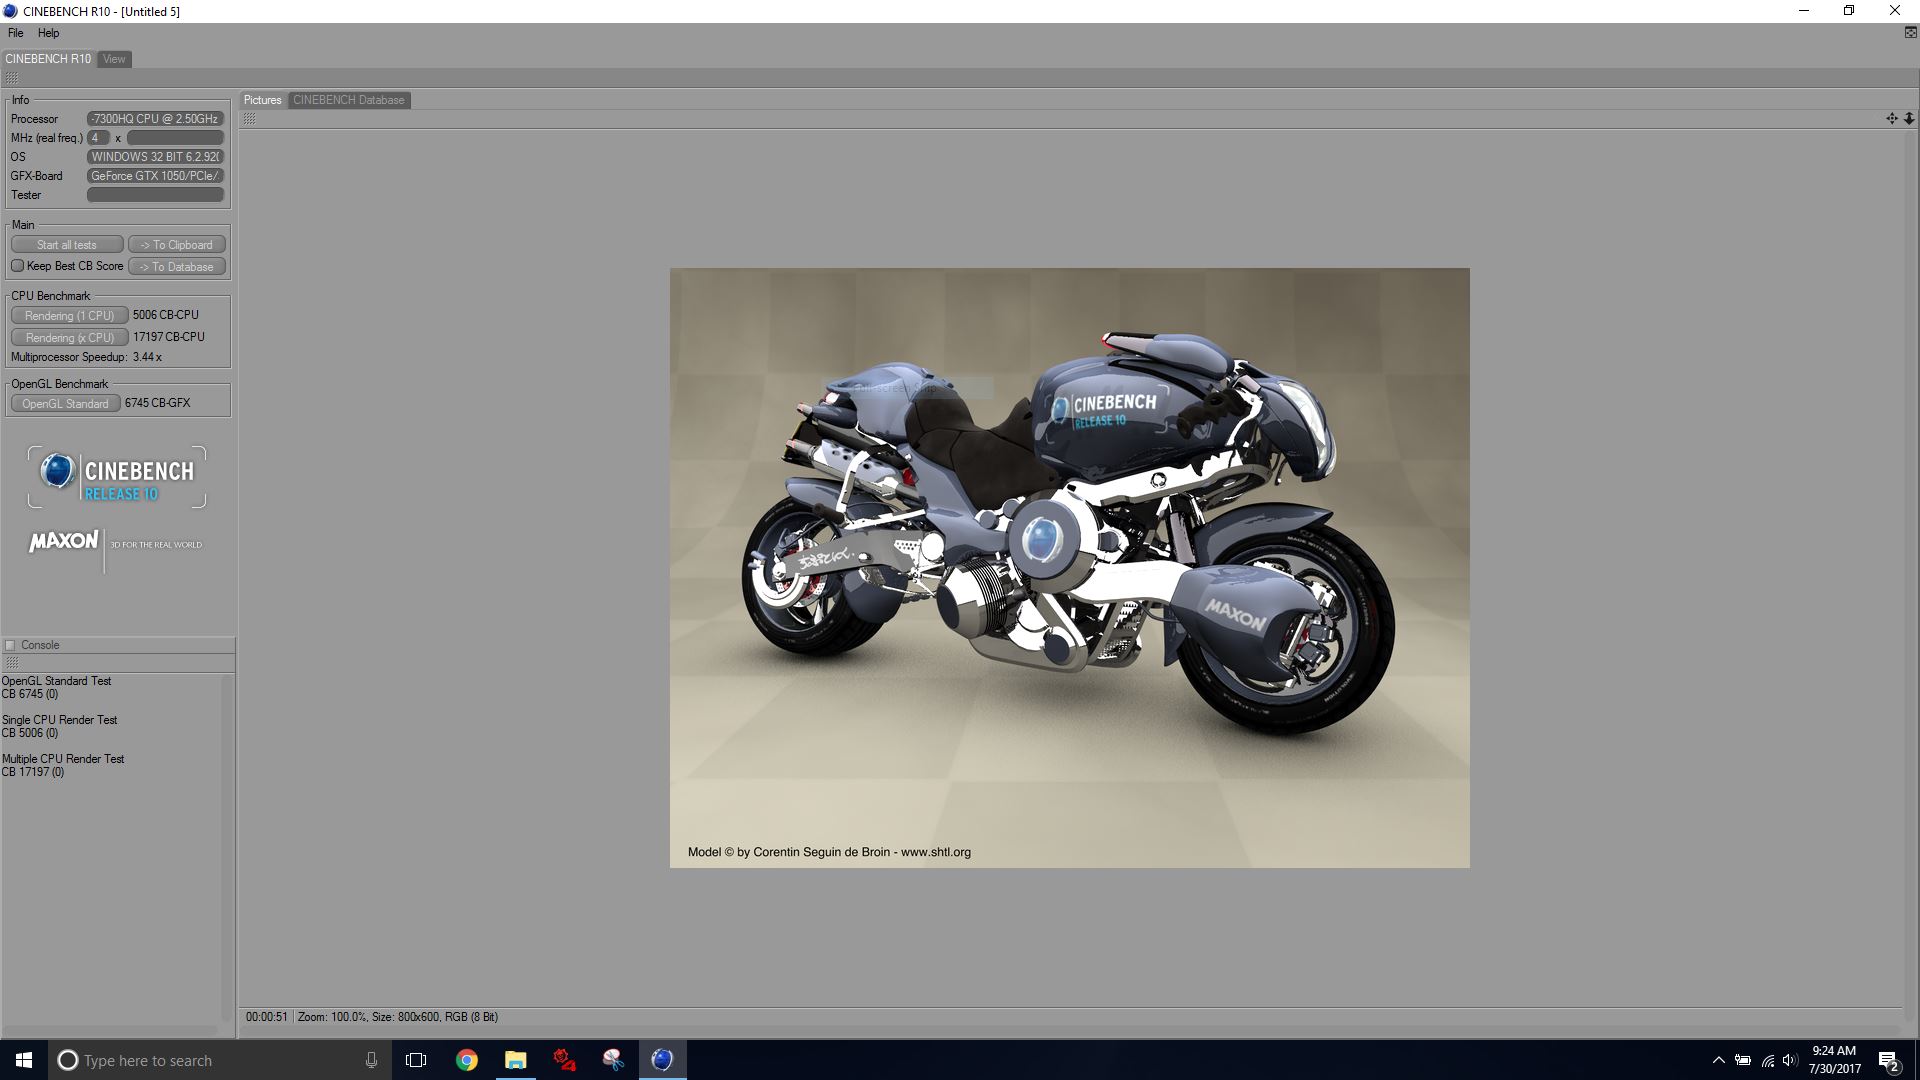
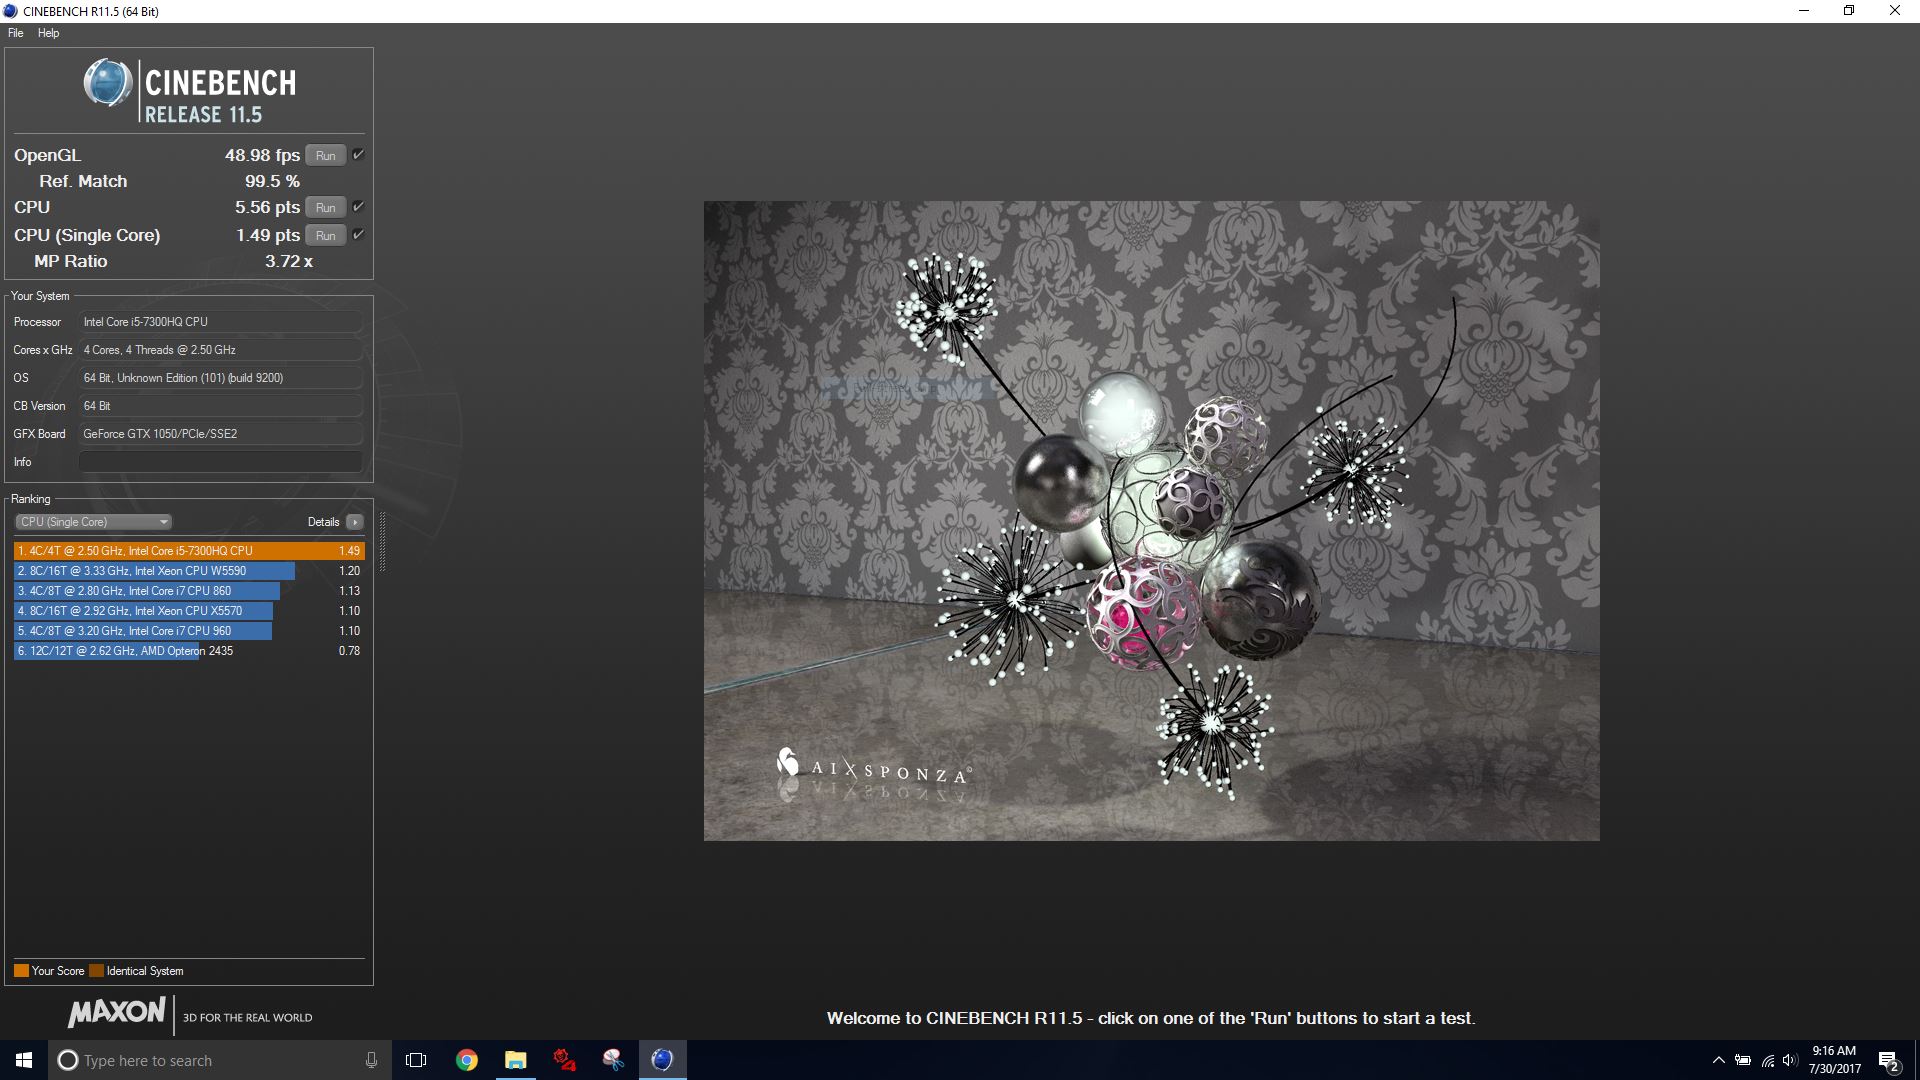
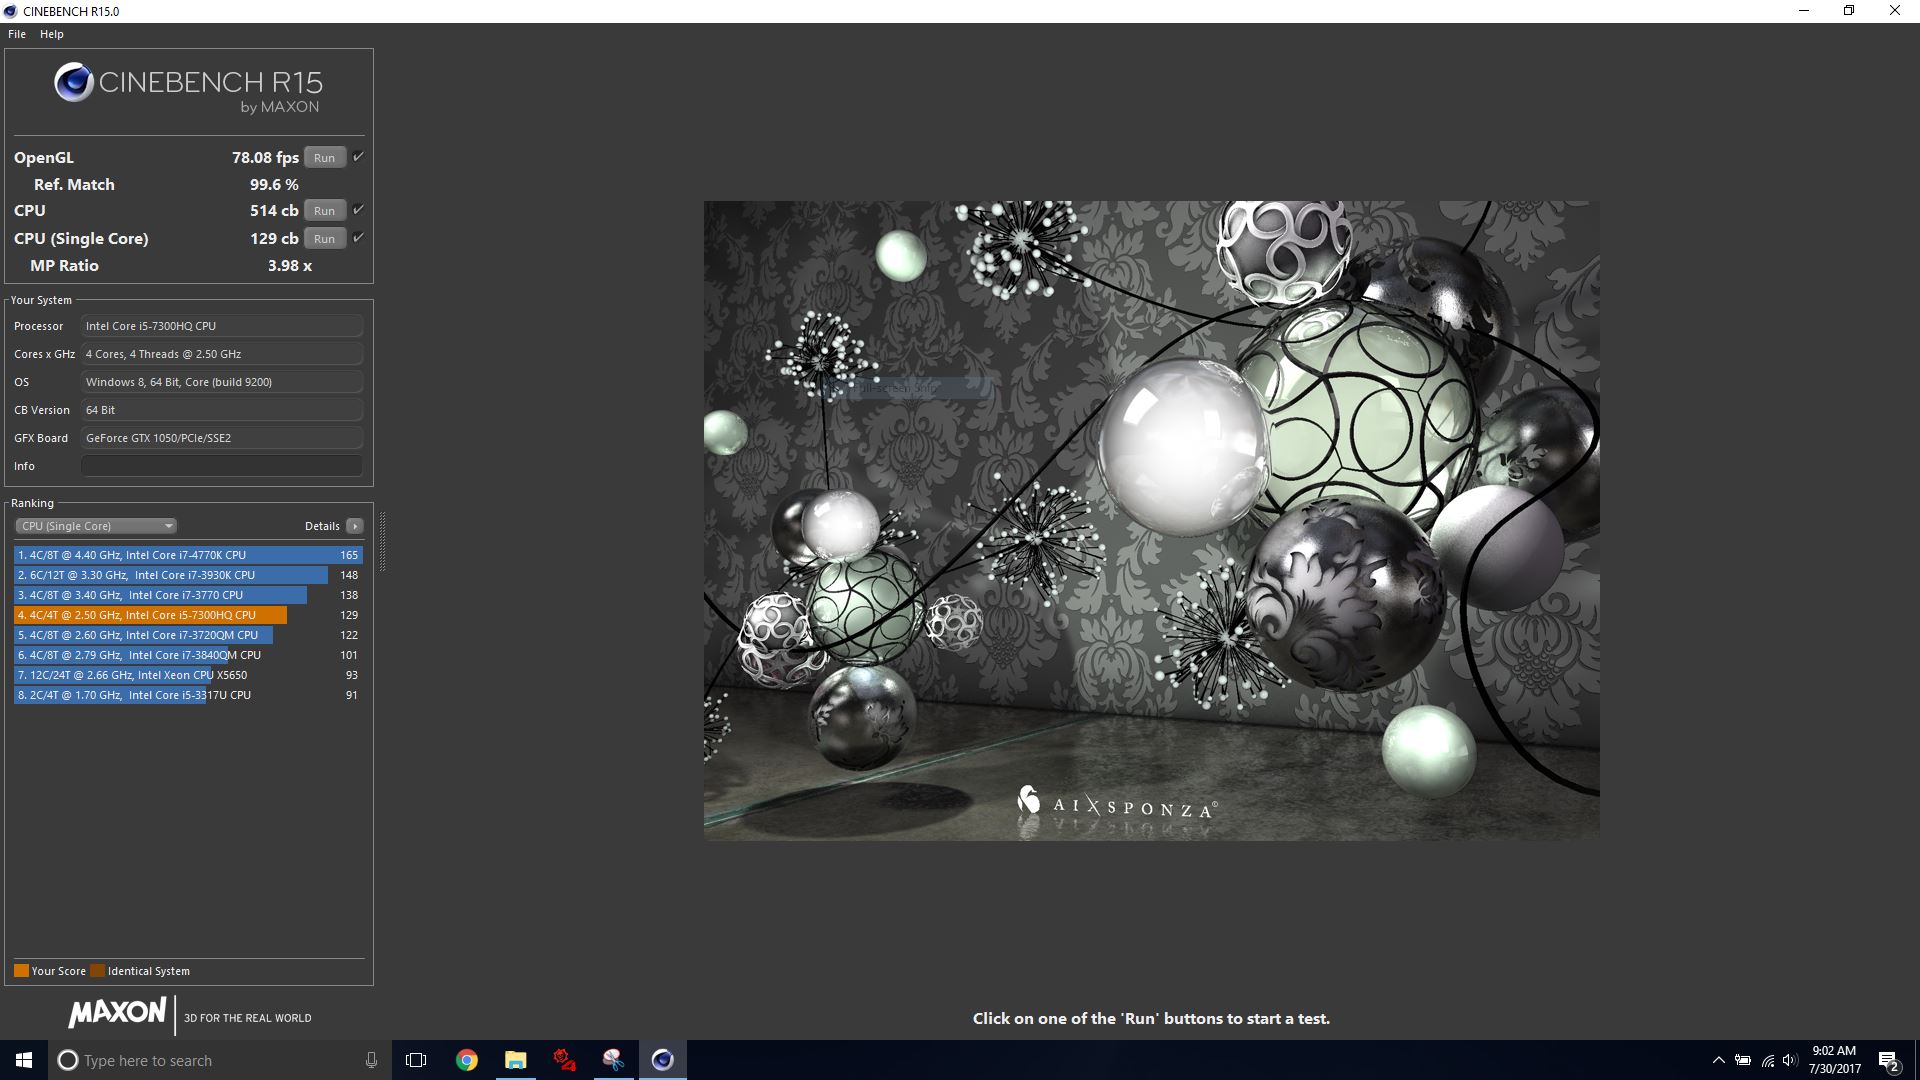
Although most of the entry-level gaming systems in our comparison feature the Intel Core i7-7700HQ, our Inspiron is equipped with the Intel Core i5-7300HQ quad-core processor. Both processors have a TDP rating of 45 W, but the Core i5 CPU does not support Hyper-Threading. The processor performs a little below expectations with single-core performance lagging behind laptops equipped with the same CPU - like the Acer Aspire VX 15 VX5-591G and the (admittedly much more expensive) Dell XPS 15 2017 9560 - by about 15 % according to Cinebench. Multi-core performance, on the other hand, is much closer and can be sustained for extended periods of time with only minor dips according to our Cinebench Multi CPU loop test (see graph below).
Competing notebooks with the Intel Core i7-7700HQ offer about 15-25% better single-core performance; multi-core performance is up to 45 % better.
| wPrime 2.10 - 1024m | |
| Dell Inspiron 15 7000 7567 Gaming (Core i5-7300HQ, GTX 1050) | |
| Asus ROG Strix GL553VD-DS71 | |
| Gigabyte Sabre 15G | |
| Samsung Odyssey NP800G5M-X01US | |
* ... smaller is better
System Performance
PCMark performance is solid and at times even ahead of the Asus ROG Strix GL553VD-DS71, which is also equipped with a platter-based hard drive and the same GPU, but features the higher-end i7 CPU. Other entry-level gaming notebooks with the i7 CPU and SSDs are up to 25 % faster depending on the subtest.
Perceived performance is not bad, but is held back a little by the conventional hard drive especially when launching programs for the first time.
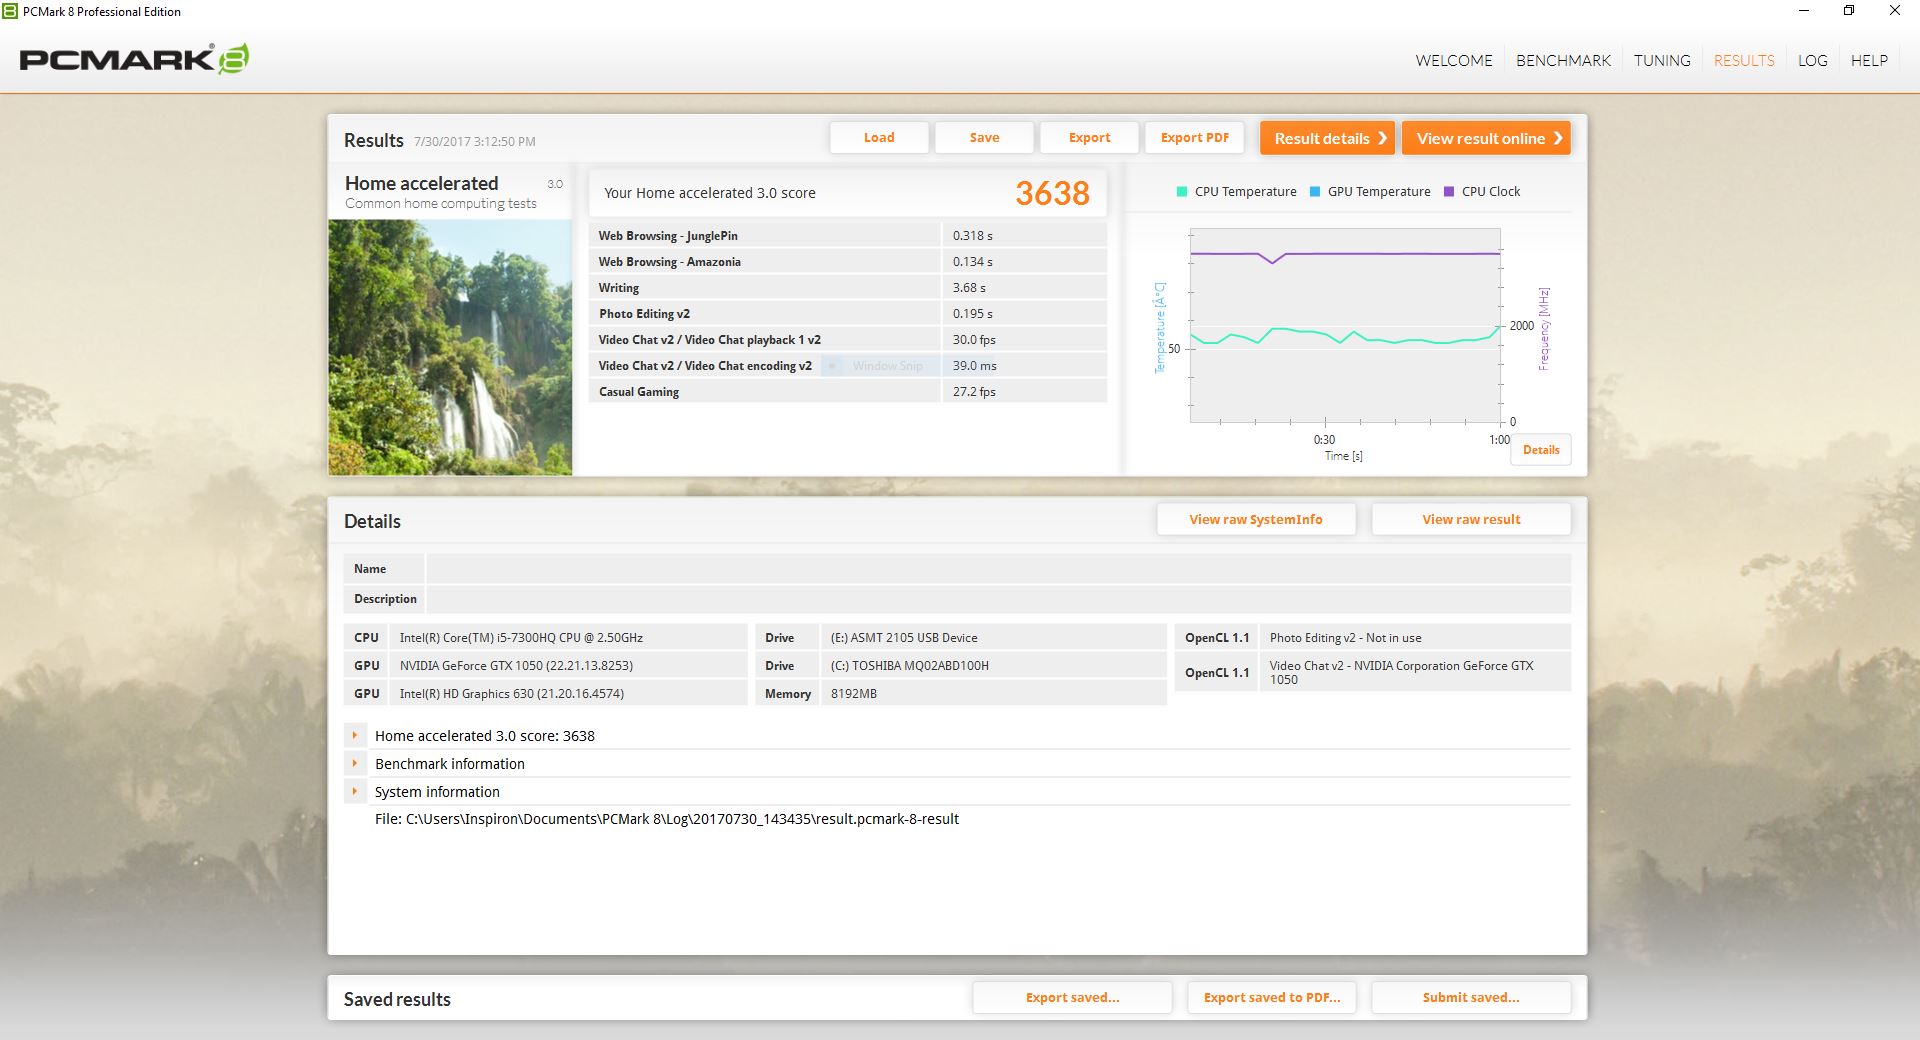
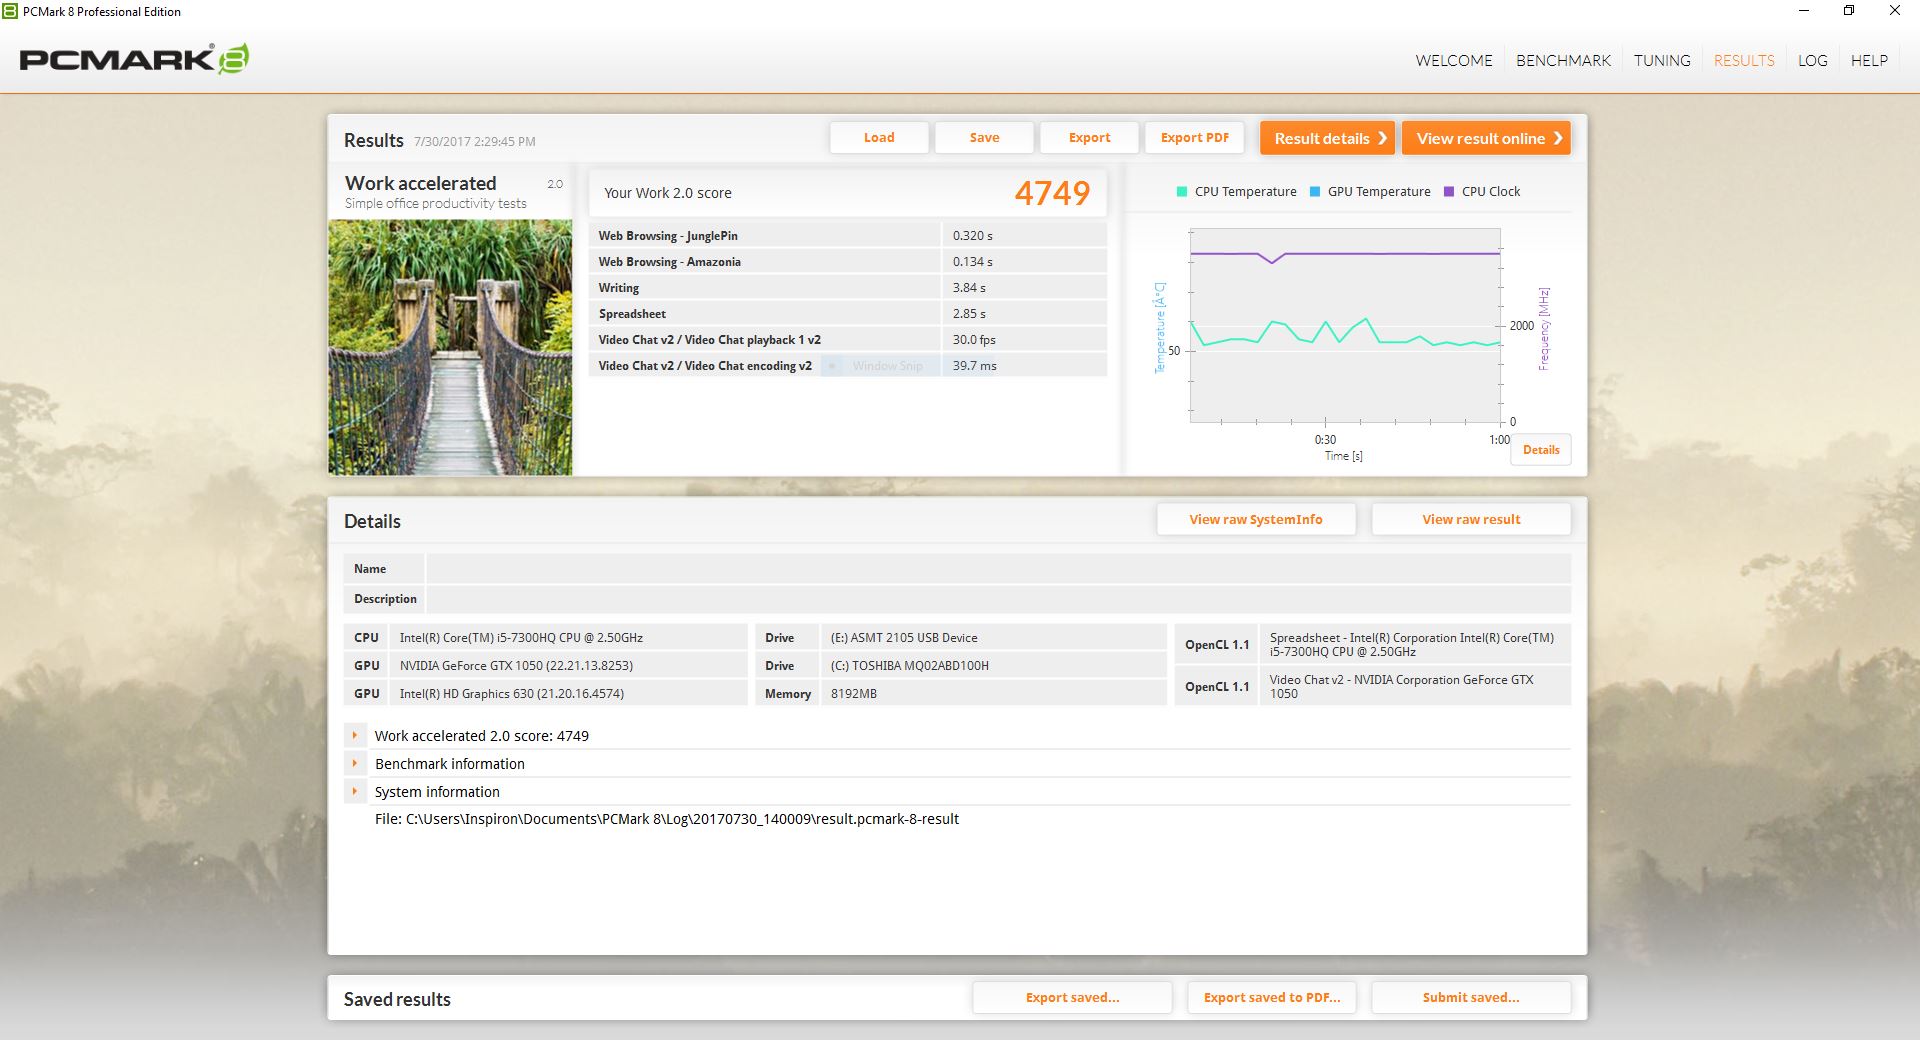
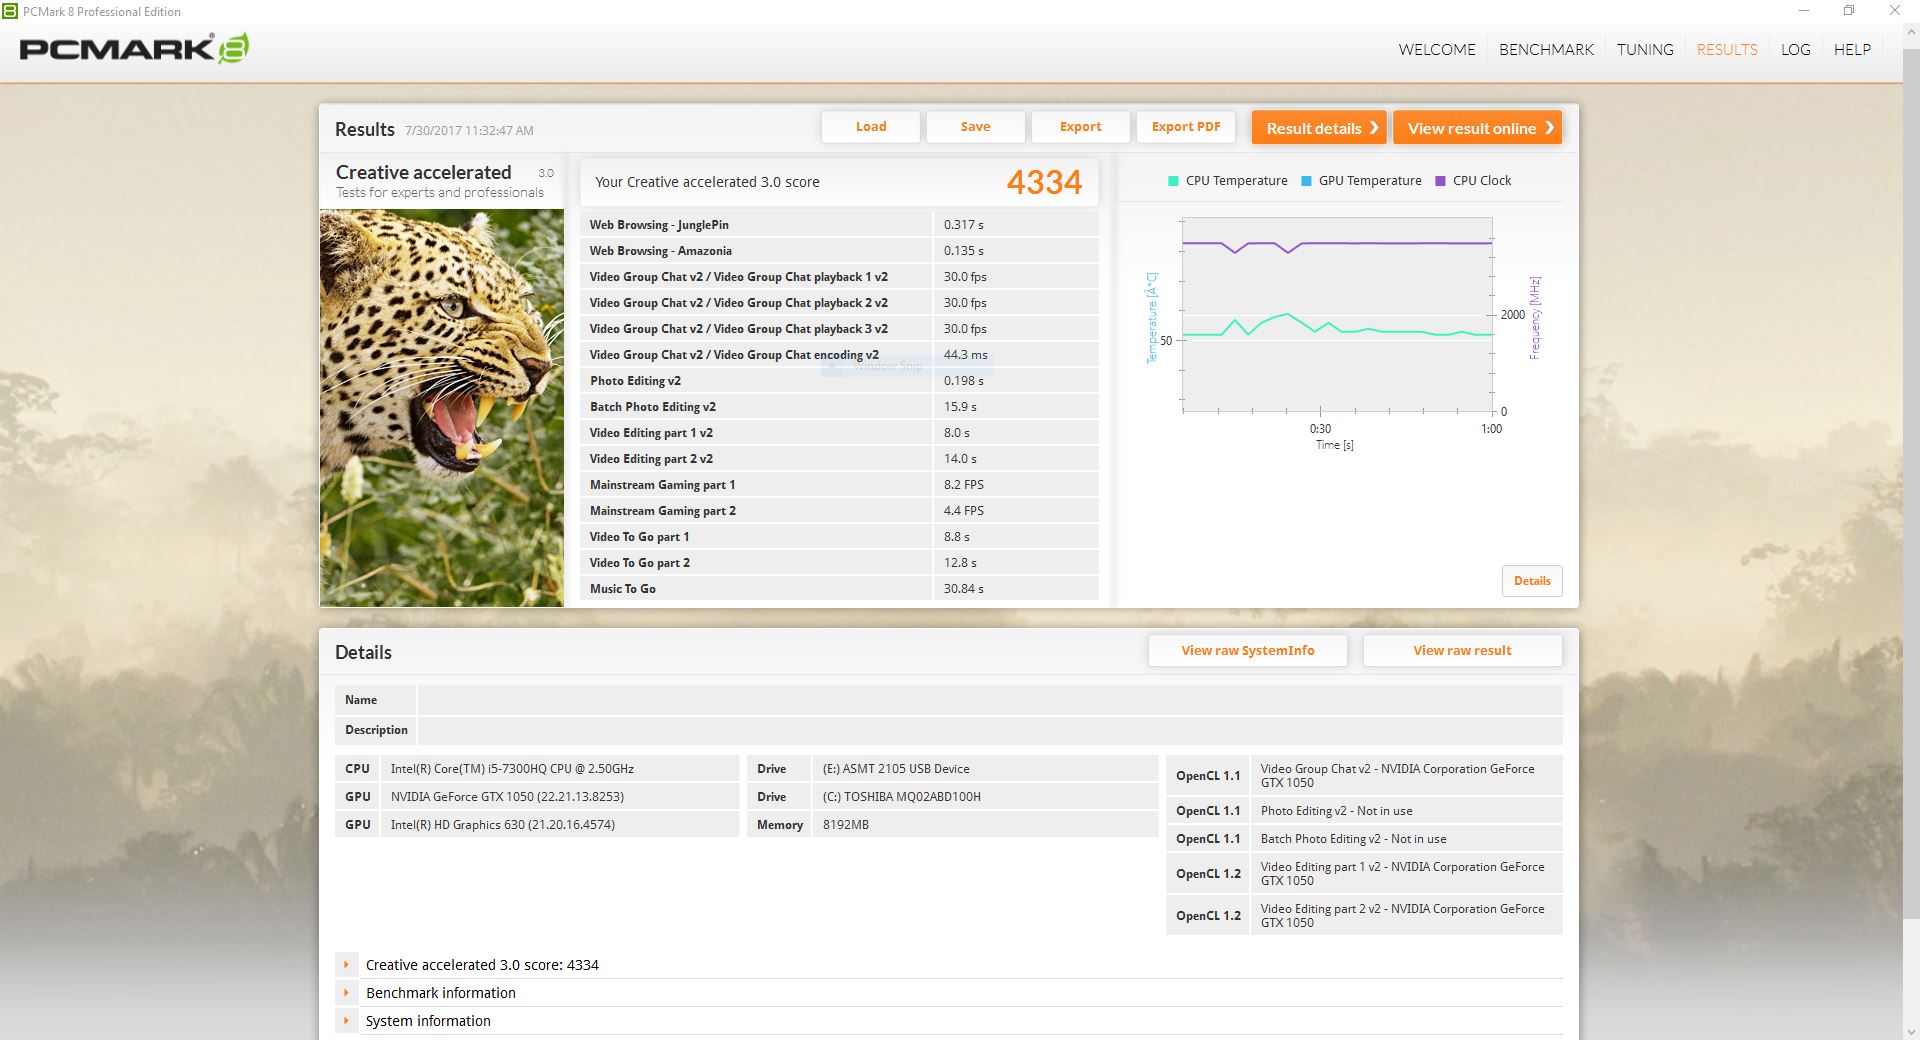
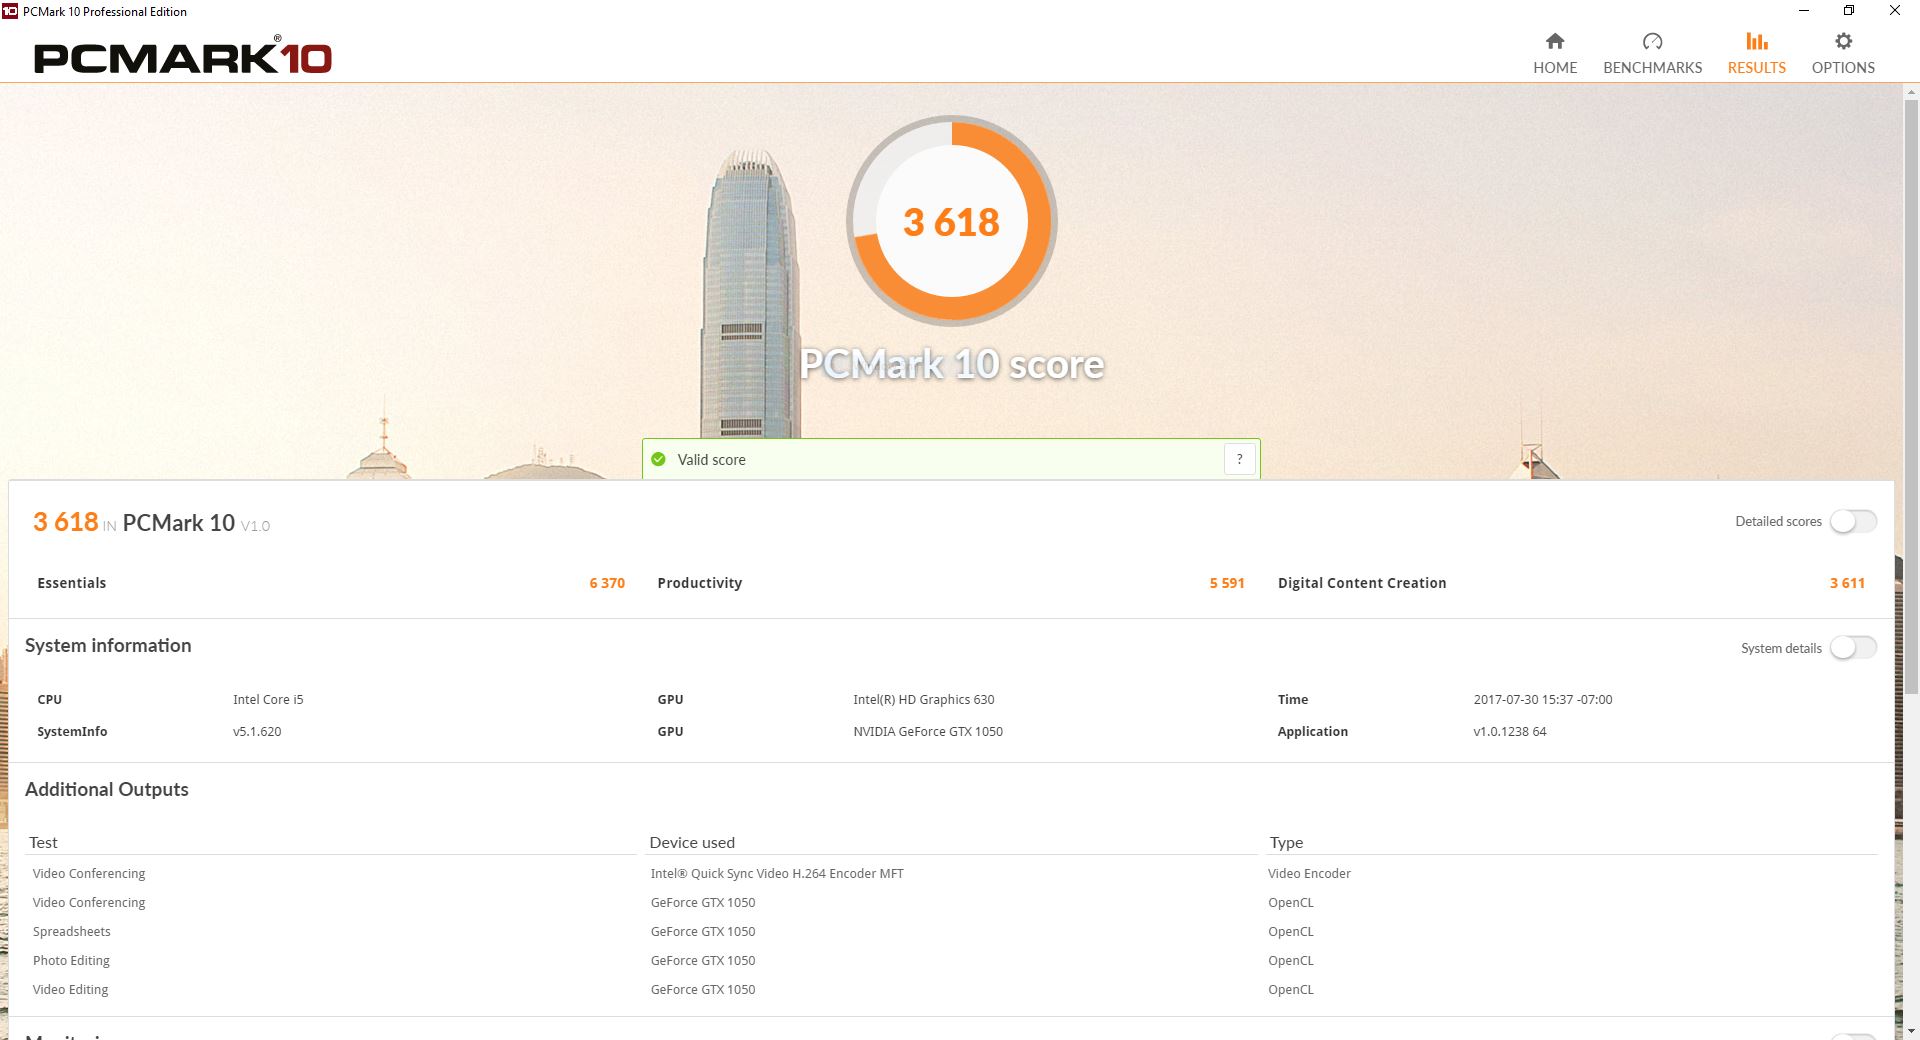
| PCMark 8 Home Score Accelerated v2 | 3638 points | |
| PCMark 8 Creative Score Accelerated v2 | 4334 points | |
| PCMark 8 Work Score Accelerated v2 | 4749 points | |
| PCMark 10 Score | 3618 points | |
Help | ||
Storage Devices
The Toshiba MQ02ABD100H with a 64MB buffer and 8GB of NAND flash spins at a rather pedestrian 5400 RPM. Even though this is a hybrid drive, the performance trails that of the 7200 RPM Travelstar 7K1000 in the Asus ROG Strix in all areas except for 4K reads - here the two drives perform very similar. As our table below shows, any notebook equipped with SSD primary storage runs circles around our test candidate.
As we mentioned earlier, even though our review notebook is the least expensive option in the lineup and only equipped with a single 2.5-inch hard drive, the M.2 slot is open, so experienced user can certainly install an SSD if so inclined.
| Dell Inspiron 15 7000 7567 Gaming (Core i5-7300HQ, GTX 1050) Toshiba MQ02ABD100H | Lenovo Legion Y520-15IKBN-80WK001KUS Samsung PM961 MZVLW256HEHP | Samsung Odyssey NP800G5M-X01US Samsung PM961 NVMe MZVLW128HEGR | Asus ROG Strix GL553VD-DS71 HGST Travelstar 7K1000 HTS721010A9E630 | Acer Aspire VX15 VX5-591G-589S Hynix HFS128G39TND | |
|---|---|---|---|---|---|
| CrystalDiskMark 3.0 | 21400% | 15742% | 56% | 11511% | |
| Read Seq (MB/s) | 84.7 | 2170 2462% | 1518 1692% | 93.5 10% | 510 502% |
| Write Seq (MB/s) | 65.4 | 1202 1738% | 798 1120% | 89.6 37% | 137.6 110% |
| Read 512 (MB/s) | 19.86 | 786 3858% | 460.5 2219% | 39.06 97% | 362.1 1723% |
| Write 512 (MB/s) | 28.43 | 822 2791% | 195.8 589% | 51.1 80% | 137.2 383% |
| Read 4k (MB/s) | 0.531 | 58.9 10992% | 47.16 8781% | 0.57 7% | 35.18 6525% |
| Write 4k (MB/s) | 0.481 | 146.4 30337% | 143.1 29651% | 1.05 118% | 104.8 21688% |
| Read 4k QD32 (MB/s) | 1.105 | 457.7 41321% | 521 47049% | 1.06 -4% | 375.8 33909% |
| Write 4k QD32 (MB/s) | 0.505 | 392.9 77702% | 176.4 34831% | 1.04 106% | 138.1 27247% |

GPU Performance
Our Inspiron is equipped with an Nvidia GeForce GTX 1050 with 4 GB of GDDR5 RAM. Performance according to the various 3DMark benchmarks ranges from slightly faster (3DMark 11 Performance GPU: +3 % vs. Dell XPS 15 2017 9560) to quite a bit slower (Ice Storm Extreme Graphics: -22 % vs. Gigabyte Sabre 15). Notebooks equipped with the GTX 1050 Ti will outperform the review gamer by an additional 35 %; systems with the GTX 1060 can offer double the performance.
Please check out our dedicated page for the Nvidia GeForce GTX 1050 for more technical information.
| 3DMark 11 Performance | 7170 points | |
| 3DMark Cloud Gate Standard Score | 13473 points | |
| 3DMark Fire Strike Score | 5085 points | |
| 3DMark Fire Strike Extreme Score | 2512 points | |
Help | ||
Gaming Performance
Gaming performance is mid-pack to a little below average for a GTX 1050 notebook. The Gigabyte Sabre 15 with quad-core i7 CPU and the same GPU with only 2 GB of RAM performs about the same as our test laptop or slightly better when running Witcher 3 and other games; the much more expensive Dell XPS 15 outperforms the others and offers frame rates that are at least 15 % higher. As the table below shows, most older games are playable at Full-HD resolution and maximum details.
| The Witcher 3 | |
| 1024x768 Low Graphics & Postprocessing (sort by value) | |
| Dell Inspiron 15 7000 7567 Gaming (Core i5-7300HQ, GTX 1050) | |
| Dell XPS 15 2017 9560 (7300HQ, Full-HD) | |
| 1366x768 Medium Graphics & Postprocessing (sort by value) | |
| Dell Inspiron 15 7000 7567 Gaming (Core i5-7300HQ, GTX 1050) | |
| Dell XPS 15 2017 9560 (7300HQ, Full-HD) | |
| 1920x1080 High Graphics & Postprocessing (Nvidia HairWorks Off) (sort by value) | |
| Dell Inspiron 15 7000 7567 Gaming (Core i5-7300HQ, GTX 1050) | |
| Samsung Odyssey NP800G5M-X01US | |
| Gigabyte Sabre 15G | |
| Dell XPS 15 2017 9560 (7300HQ, Full-HD) | |
| Acer Aspire VX5-591G-75C4 VX15 | |
| 1920x1080 Ultra Graphics & Postprocessing (HBAO+) (sort by value) | |
| Dell Inspiron 15 7000 7567 Gaming (Core i5-7300HQ, GTX 1050) | |
| Lenovo Legion Y520-15IKBN-80WK001KUS | |
| Samsung Odyssey NP800G5M-X01US | |
| Gigabyte Sabre 15G | |
| Dell XPS 15 2017 9560 (7300HQ, Full-HD) | |
| Acer Aspire VX5-591G-75C4 VX15 | |
| low | med. | high | ultra | |
|---|---|---|---|---|
| Metro 2033 (2010) | 85.5 | 80.7 | 72.7 | 44.6 |
| Dirt 3 (2011) | 194.4 | 106.9 | 127.4 | 101 |
| Sleeping Dogs (2012) | 174.9 | 135.8 | 114.6 | 98.5 |
| Hitman: Absolution (2012) | 79.1 | 73.9 | 66.8 | 41.8 |
| Tomb Raider (2013) | 252.5 | 208.6 | 167.7 | 79.9 |
| BioShock Infinite (2013) | 173.5 | 149.6 | 139.2 | 64.9 |
| GRID 2 (2013) | 120.4 | 103 | 96.2 | 75.3 |
| Company of Heroes 2 (2013) | 52.4 | 50.7 | 47.4 | 26 |
| Thief (2014) | 58 | 56.6 | 53.8 | 41.8 |
| GRID: Autosport (2014) | 141.6 | 98.7 | 87 | 71.3 |
| Middle-earth: Shadow of Mordor (2014) | 122.8 | 99 | 58.8 | 45.8 |
| The Witcher 3 (2015) | 95.9 | 69.2 | 39 | 21.9 |
| Batman: Arkham Knight (2015) | 80 | 76 | 50 | 32 |
| Rise of the Tomb Raider (2016) | 105.5 | 64.5 | 35.8 | 30.9 |
| Ashes of the Singularity (2016) | 37.1 | 31 | 28.6 |
Stress Test
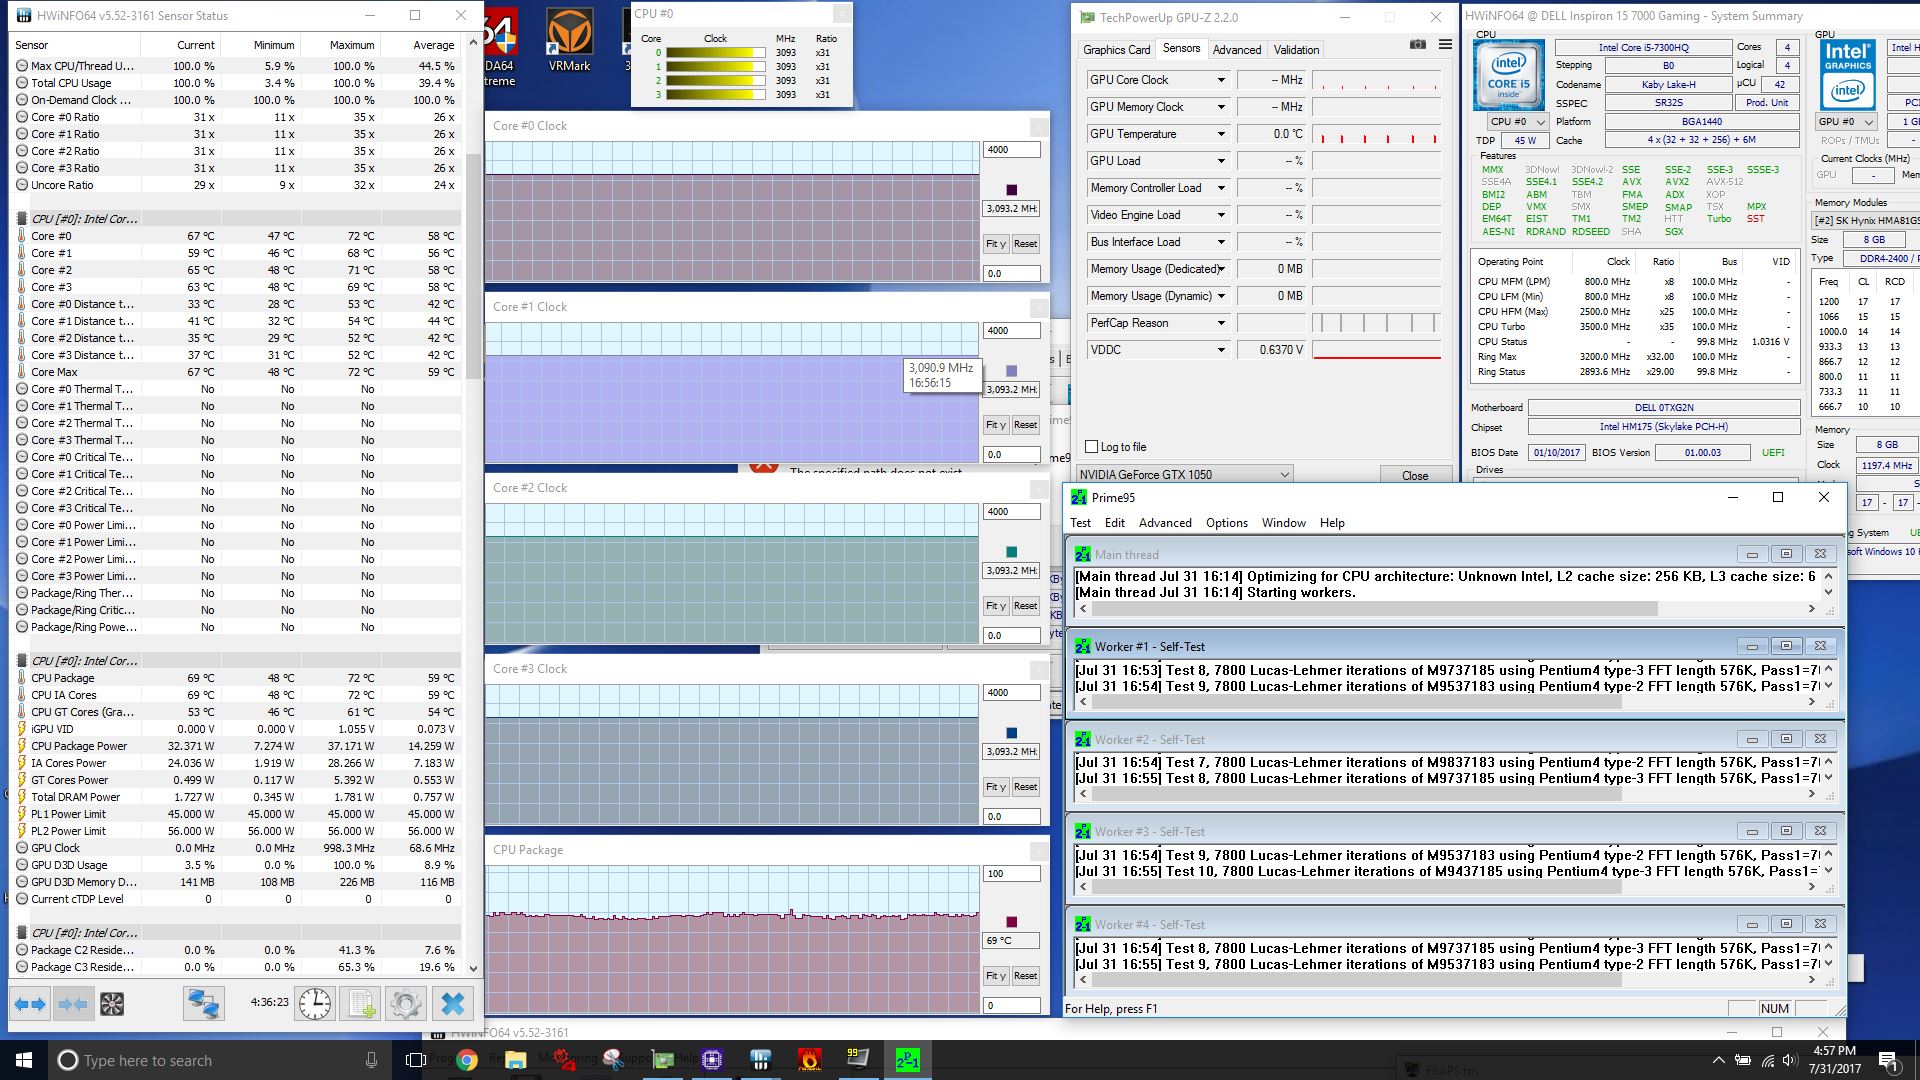
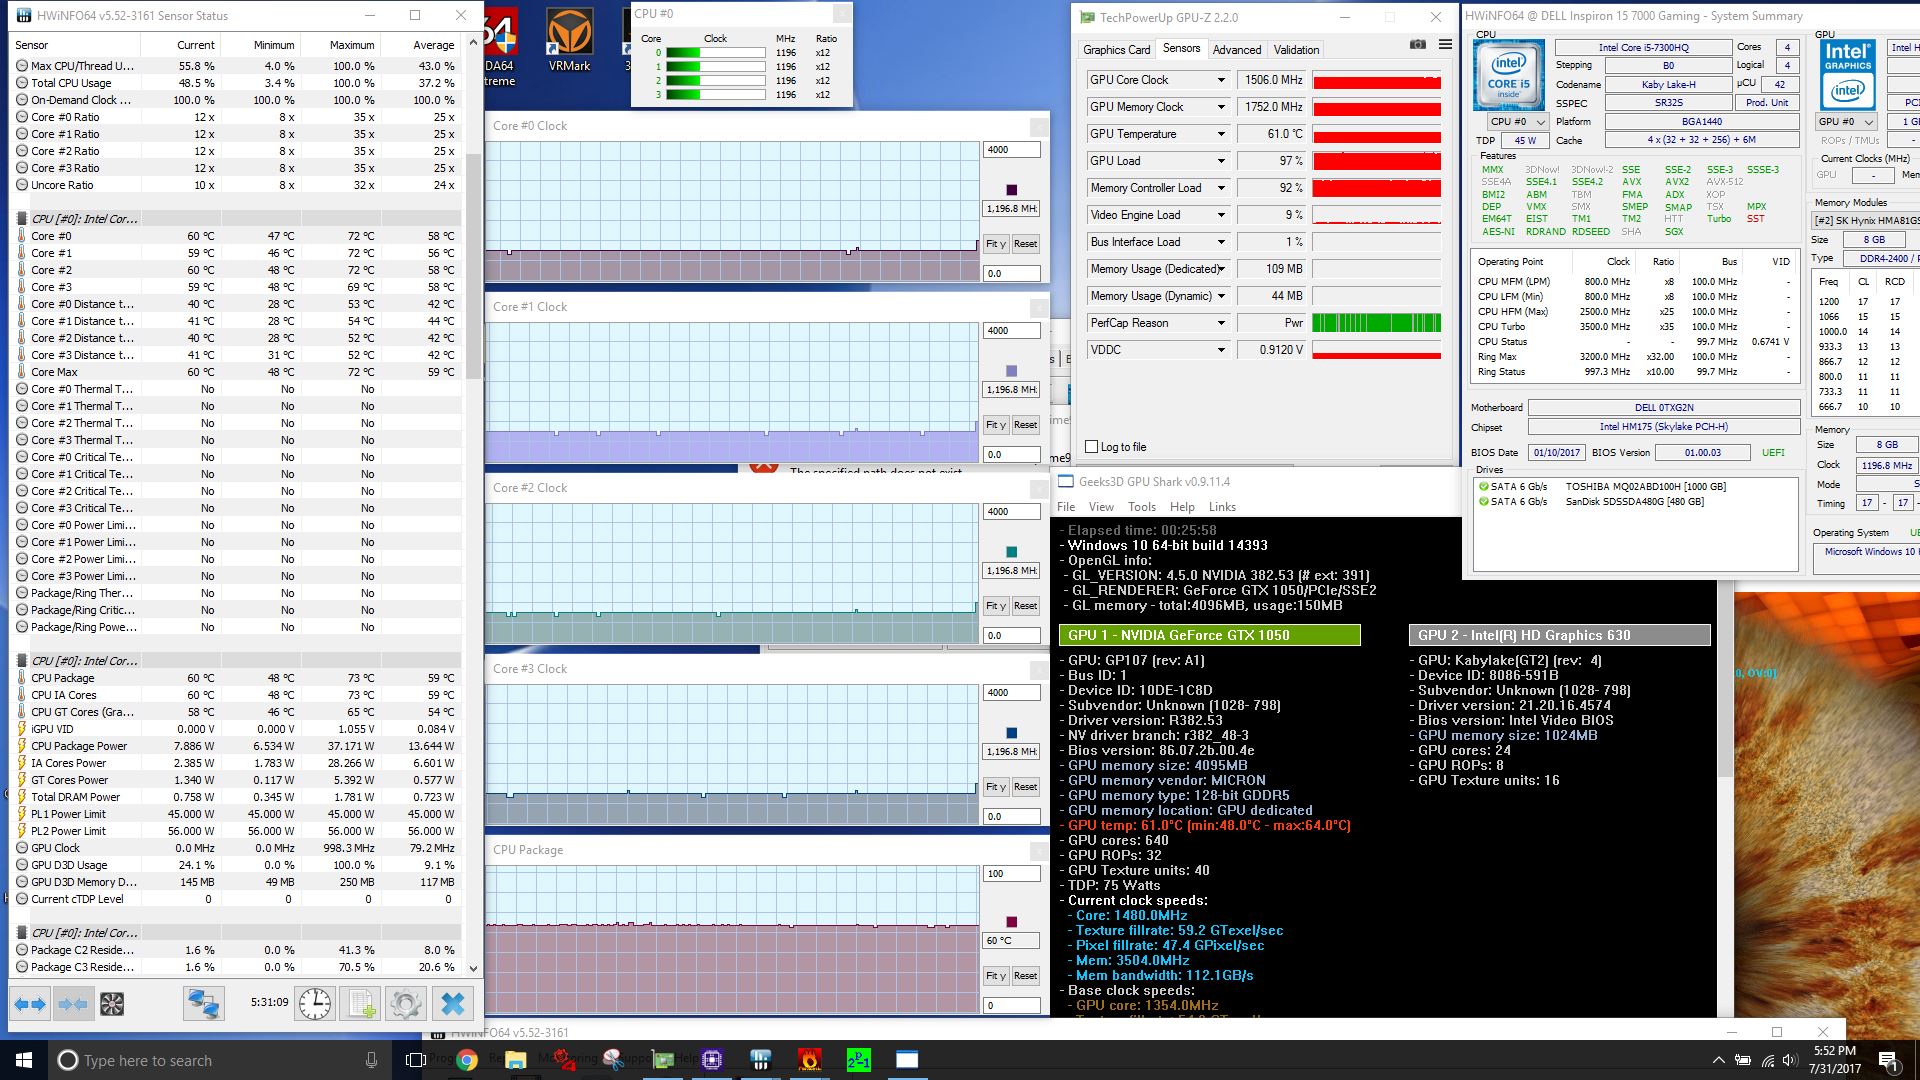
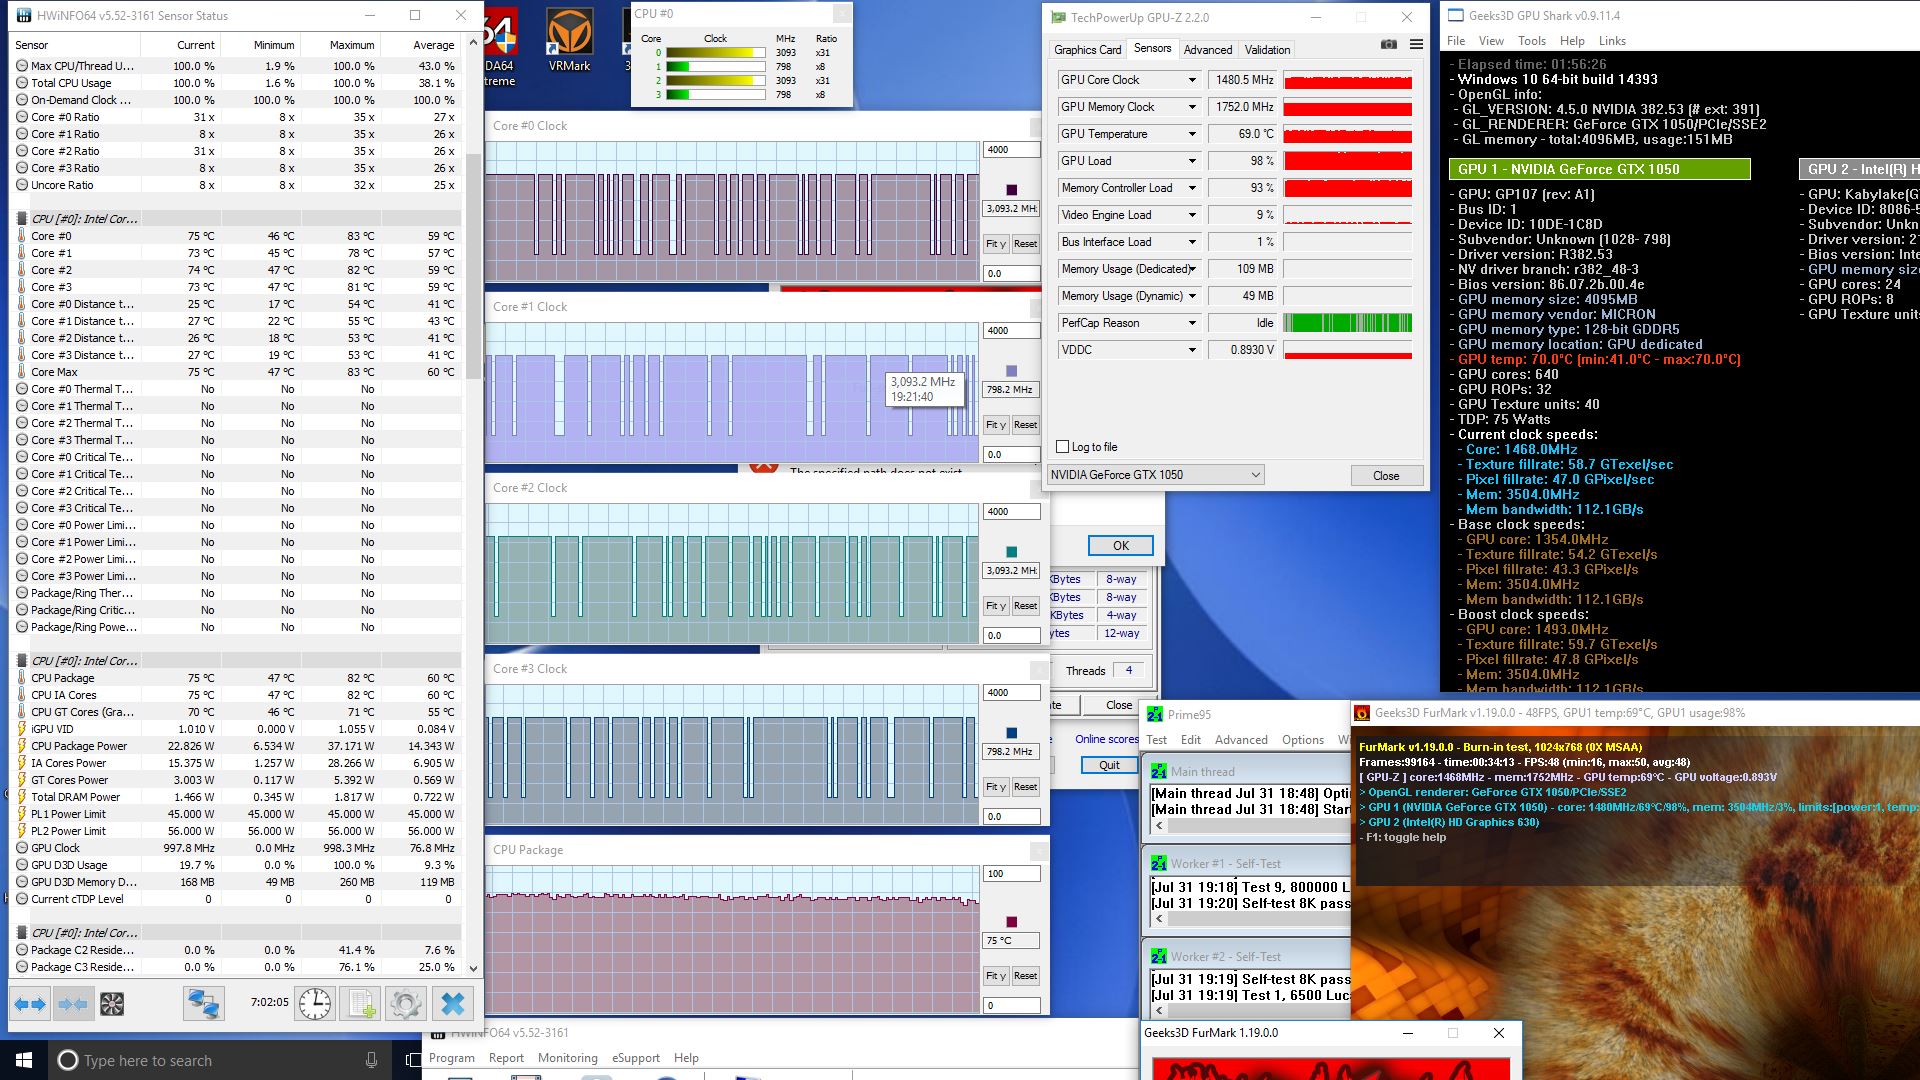
We use the synthetic benchmarks Prime95 and Furmark to stress the CPU and GPU to identify potential stability issues as well as throttling. With Prime 95 running, the Core i5 processor returned a solid 3.1 GHz at 68 C and is thus able to maintain the maximum Turbo Boost under load. When only Furmark is active, the GPU runs at 1493-1506 at 61 C. Running both Prime95 and Furmark in parallel results in an initial CPU clock rate of 3.1 GHz with one or two cores dipping to 800 MHz for split seconds at a temperature of 73 C. The GPU maintains 1493 MHz at 61 C. Ten minutes later, the CPU still shows the same behavior with the occasional, but now longer dips to 800 MHz at a temperature of 79 C, while the GPU still maintains 1493 MHz with occasional dips to 1455 MHz at 69 C. Our Witcher 3 stress test, which is a more accurate representation of gaming loads, had the GPU running at 1708 MHz with the temperature staying at a rock steady 59 C. For the CPU cores, we saw ranges from 1.7 – 1.8 GHz at just under 60 C as well.
Running the notebook on battery power only affects GPU performance. Our run of 3DMark 11 on batteries returns an near-identical Physics, but much lower Graphics score. Overall performance drops by about 15 %.
| CPU Clock (GHz) | GPU Clock (MHz) | Average CPU Temperature (°C) | Average GPU Temperature (°C) | |
| Prime95 Stress | 3.1 | - | 68 | - |
| FurMark Stress | - | 1493-1506 | - | 61 |
| Prime95 + FurMark Stress | 0.8-3.1 | 1455-1493 | 79 | 69 |
| Witcher 3 Stress | 1.7-1.8 | 1708 | 59 | 59 |
Emissions
System Noise
The Inspiron is near-silent in idle mode, although the heard drive is audible at all times. At 49 dB under maximum load, the review notebook actually even tops the higher-end Inspiron 15 7000 7567 Gaming with Intel Core i7-7700HQ and Nvidia GeForce GTX 1050 Ti, which reaches 47 dB. The Samsung Odyssey and the Asus ROG Strix are similarly loud; at 39 dB, the Acer Aspire VX15 VX5-591G is much less obtrusive and a better choice for quiet environments. We should point out thought that under normal operation, the Inspiron never gets particularly annoying.
Noise level
| Idle |
| 31.6 / 31.8 / 31.8 dB(A) |
| Load |
| 36.3 / 49 dB(A) |
 | ||
30 dB silent 40 dB(A) audible 50 dB(A) loud |
||
min: | ||
| Dell Inspiron 15 7000 7567 Gaming (Core i5-7300HQ, GTX 1050) GeForce GTX 1050 Mobile, i5-7300HQ, Toshiba MQ02ABD100H | Lenovo Legion Y520-15IKBN-80WK001KUS GeForce GTX 1050 Ti Mobile, i7-7700HQ, Samsung PM961 MZVLW256HEHP | Samsung Odyssey NP800G5M-X01US GeForce GTX 1050 Mobile, i7-7700HQ, Samsung PM961 NVMe MZVLW128HEGR | Asus ROG Strix GL553VD-DS71 GeForce GTX 1050 Mobile, i7-7700HQ, HGST Travelstar 7K1000 HTS721010A9E630 | Acer Aspire VX15 VX5-591G-589S GeForce GTX 1050 Mobile, i5-7300HQ, Hynix HFS128G39TND | Gigabyte Sabre 15G GeForce GTX 1050 Mobile, i7-7700HQ, Liteonit CV3-8D128 | Dell XPS 15 2017 9560 (7300HQ, Full-HD) GeForce GTX 1050 Mobile, i5-7300HQ, WDC WD10SPCX-75KHST0 + SanDisk Z400s M.2 2242 32 GB Cache | |
|---|---|---|---|---|---|---|---|
| Noise | 4% | -2% | -9% | 7% | -8% | -7% | |
| off / environment * (dB) | 28 | 27.7 1% | 28.1 -0% | 30.6 -9% | 30 -7% | 28.2 -1% | 30.3 -8% |
| Idle Minimum * (dB) | 31.6 | 30.5 3% | 28.1 11% | 33.4 -6% | 30 5% | 33 -4% | 31.6 -0% |
| Idle Average * (dB) | 31.8 | 30.5 4% | 29.1 8% | 33.4 -5% | 30 6% | 33.3 -5% | 31.6 1% |
| Idle Maximum * (dB) | 31.8 | 30.6 4% | 29.1 8% | 33.4 -5% | 31.1 2% | 34.7 -9% | 33.4 -5% |
| Load Average * (dB) | 36.3 | 40 -10% | 49.2 -36% | 46.5 -28% | 31.3 14% | 44.5 -23% | 47.8 -32% |
| Witcher 3 ultra * (dB) | 46.3 | 40 14% | 49.2 -6% | ||||
| Load Maximum * (dB) | 49 | 42.6 13% | 49.2 -0% | 49.6 -1% | 38.9 21% | 52.8 -8% | 47.8 2% |
* ... smaller is better
Temperature
Despite the slightly higher noise level compared to the more powerful sibling, our review notebook actually not only gets louder, but also runs hotter as well - a somewhat bewildering result, since the CPU cores of the Inspiron 15 7000 7567 Gaming with Intel Core i7-7700HQ reach temperatures of 90 C and above, while our Inspiron only exceeded 80 C for very brief bursts.
During our stress test, the rear center section of the keyboard reached 47 C. Tests with Witcher 3 show a more reasonable 40 C in the same area, which is perfectly acceptable for a gaming notebook. Due to the number pad, the keyboard is shifted left, so it's the right third that heats up more. The WASD keys and the number pad remain somewhat cooler, so fingers won't likely get as sweaty.
Note: several of the recorded test results during the review period left us scratching our heads. While fluctuations are not out of the ordinary and might be attributed to measurement inaccuracies, environmental differences or unit variation, it doesn't quite make sense that the base version of the Inspiron is not only noisier, but also runs warmer than its more powerful sibling. One possible explanation could be the fact that our particular Inspiron isn't a brand-new notebook directly from the Dell, but rather a review unit from Intel with a plethora of preinstalled applications. Unfortunately, we are not in a position where we can do a reformat / reinstall to see if the results change in any way. We should emphasize here that none of our findings are particularly troublesome and thus shouldn't be considered deal breakers.
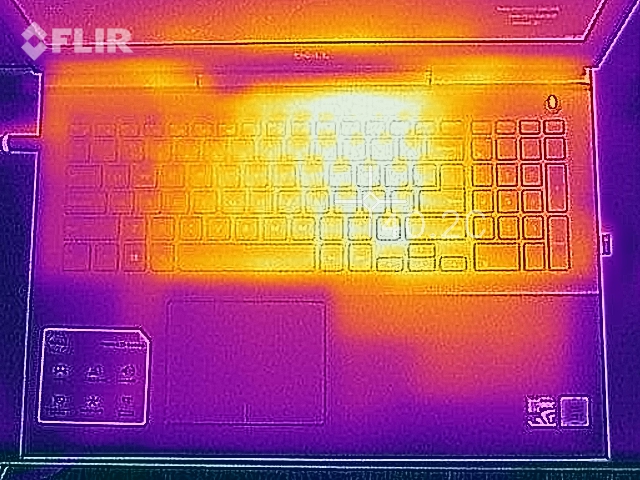
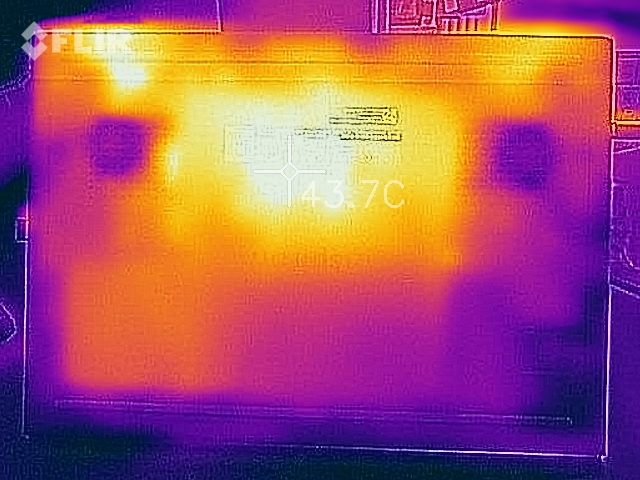
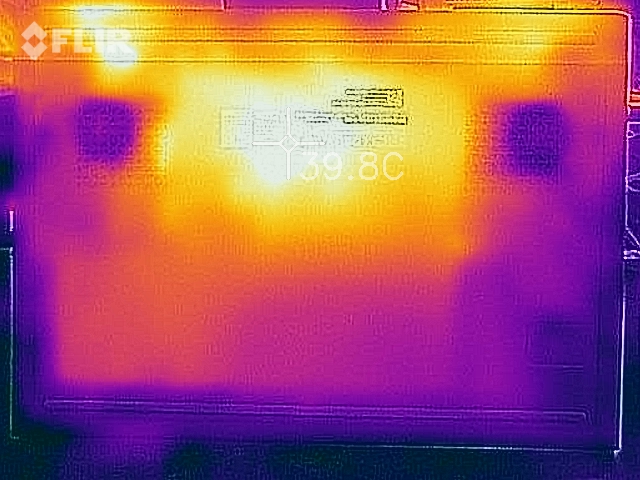
(-) The maximum temperature on the upper side is 47.2 °C / 117 F, compared to the average of 40.4 °C / 105 F, ranging from 21.2 to 68.8 °C for the class Gaming.
(±) The bottom heats up to a maximum of 43.2 °C / 110 F, compared to the average of 43.2 °C / 110 F
(+) In idle usage, the average temperature for the upper side is 26.4 °C / 80 F, compared to the device average of 33.9 °C / 93 F.
(+) Playing The Witcher 3, the average temperature for the upper side is 29.5 °C / 85 F, compared to the device average of 33.9 °C / 93 F.
(±) The palmrests and touchpad can get very hot to the touch with a maximum of 36.6 °C / 97.9 F.
(-) The average temperature of the palmrest area of similar devices was 28.8 °C / 83.8 F (-7.8 °C / -14.1 F).
Speakers
Although the Inspiron is equipped with a subwoofer, the sound quality isn't quite as good as we had hoped for, but still decent nonetheless. Bass doesn't drop off before the 125 Hz mark and mids and highs are surprisingly well-balanced. The speakers get loud enough and don't distort even at maximum volume levels, which is important since gaming systems can get very noisy under load. For extensive gaming or listening to music we still recommend a good pair of headphones, however.
")

Dell Inspiron 15 7000 7567 Gaming (Core i5-7300HQ, GTX 1050) audio analysis
(±) | speaker loudness is average but good (78.2 dB)
Bass 100 - 315 Hz
(±) | reduced bass - on average 11.4% lower than median
(±) | linearity of bass is average (11.2% delta to prev. frequency)
Mids 400 - 2000 Hz
(+) | balanced mids - only 2.4% away from median
(±) | linearity of mids is average (7.8% delta to prev. frequency)
Highs 2 - 16 kHz
(+) | balanced highs - only 4.1% away from median
(+) | highs are linear (6.7% delta to prev. frequency)
Overall 100 - 16.000 Hz
(±) | linearity of overall sound is average (16.6% difference to median)
Compared to same class
» 43% of all tested devices in this class were better, 7% similar, 50% worse
» The best had a delta of 6%, average was 18%, worst was 132%
Compared to all devices tested
» 29% of all tested devices were better, 6% similar, 65% worse
» The best had a delta of 4%, average was 24%, worst was 134%
Apple MacBook 12 (Early 2016) 1.1 GHz audio analysis
(+) | speakers can play relatively loud (83.6 dB)
Bass 100 - 315 Hz
(±) | reduced bass - on average 11.3% lower than median
(±) | linearity of bass is average (14.2% delta to prev. frequency)
Mids 400 - 2000 Hz
(+) | balanced mids - only 2.4% away from median
(+) | mids are linear (5.5% delta to prev. frequency)
Highs 2 - 16 kHz
(+) | balanced highs - only 2% away from median
(+) | highs are linear (4.5% delta to prev. frequency)
Overall 100 - 16.000 Hz
(+) | overall sound is linear (10.2% difference to median)
Compared to same class
» 7% of all tested devices in this class were better, 2% similar, 91% worse
» The best had a delta of 5%, average was 18%, worst was 53%
Compared to all devices tested
» 5% of all tested devices were better, 1% similar, 94% worse
» The best had a delta of 4%, average was 24%, worst was 134%
Frequency Comparison (Checkbox selectable!)
Graph 1: Pink Noise 100% Vol.; Graph 2: Audio off
Energy Management
Power Consumption
Strangely enough, the power consumption during idle and and very low load levels is significantly higher than that of the more powerful Inspiron 15 7000 7567 Gaming, which consumes between 35 - 50 % less. The platter-based hard drive likely consumes a little more than a primary SSD would, but since this is a low-power 5400 RPM unit, we wouldn't expect it to add more than an average of 2.5 W to the total power draw. At this time, we have no explanation for this behavior aside from what we've stated in the "Temperature" section of our review. At moderately-high to very high loads, the higher-end Inspiron does require more power, although the differences are not significant and in line with what we would expect given the more powerful hardware.
| Off / Standby | |
| Idle | |
| Load |
|
Key:
min: | |
| Dell Inspiron 15 7000 7567 Gaming (Core i5-7300HQ, GTX 1050) i5-7300HQ, GeForce GTX 1050 Mobile, Toshiba MQ02ABD100H, TN, 1920x1080, 15.6" | Dell Inspiron 15 7000 7567 i7-7700HQ, GeForce GTX 1050 Ti Mobile, Intel SSDSCKKF256H6, TN, 1920x1080, 15.6" | Lenovo Legion Y520-15IKBN-80WK001KUS i7-7700HQ, GeForce GTX 1050 Ti Mobile, Samsung PM961 MZVLW256HEHP, IPS, 1920x1080, 15.6" | Samsung Odyssey NP800G5M-X01US i7-7700HQ, GeForce GTX 1050 Mobile, Samsung PM961 NVMe MZVLW128HEGR, IPS, 1920x1080, 15.6" | Asus ROG Strix GL553VD-DS71 i7-7700HQ, GeForce GTX 1050 Mobile, HGST Travelstar 7K1000 HTS721010A9E630, IPS, 1920x1080, 15.6" | Acer Aspire VX15 VX5-591G-589S i5-7300HQ, GeForce GTX 1050 Mobile, Hynix HFS128G39TND, IPS, 1920x1080, 15.6" | Gigabyte Sabre 15G i7-7700HQ, GeForce GTX 1050 Mobile, Liteonit CV3-8D128, IPS, 1920x1080, 15.6" | |
|---|---|---|---|---|---|---|---|
| Power Consumption | 21% | 3% | 5% | -2% | 2% | 3% | |
| Idle Minimum * (Watt) | 9.1 | 4.4 52% | 8.5 7% | 6.7 26% | 7.7 15% | 8.4 8% | 8 12% |
| Idle Average * (Watt) | 10.3 | 6.8 34% | 9.1 12% | 8.9 14% | 11.7 -14% | 13.1 -27% | 10.9 -6% |
| Idle Maximum * (Watt) | 13 | 8.3 36% | 9.7 25% | 10.8 17% | 12 8% | 14.2 -9% | 11 15% |
| Load Average * (Watt) | 75.6 | 81 -7% | 79.9 -6% | 81.8 -8% | 80.5 -6% | 50 34% | 76.7 -1% |
| Witcher 3 ultra * (Watt) | 83.8 | 97.7 -17% | 92.2 -10% | 94.9 -13% | |||
| Load Maximum * (Watt) | 115.2 | 127 -10% | 121.5 -5% | 122.7 -7% | 128.4 -11% | 111 4% | 106.4 8% |
* ... smaller is better
Battery Life
Given the higher power draw at lower loads in combination with the same battery capacity (74 Wh) as the higher-end Inspiron 7000 Gaming, it's not surprising that the battery life takes a hit. Still, 9.5 hours of real-world WLAN usage (screen brightness set to 150 nits, balanced profile) is nothing to sneeze at, as the review laptop easily bests all competitors except for the more powerful sibling. Since the maximum power consumption is lower, our system does beat the Inspiron 15 7000 7567 Gaming when running the Battery Eater Classic test. For a gaming system, the Inspiron is way above average for its class, making it a good choice for students who use the notebook for school during the day but want to be able to play games as well when all work is done.
| Dell Inspiron 15 7000 7567 Gaming (Core i5-7300HQ, GTX 1050) i5-7300HQ, GeForce GTX 1050 Mobile, 74 Wh | Dell Inspiron 15 7000 7567 i7-7700HQ, GeForce GTX 1050 Ti Mobile, 74 Wh | Lenovo Legion Y520-15IKBN-80WK001KUS i7-7700HQ, GeForce GTX 1050 Ti Mobile, 45 Wh | Samsung Odyssey NP800G5M-X01US i7-7700HQ, GeForce GTX 1050 Mobile, 43 Wh | Asus ROG Strix GL553VD-DS71 i7-7700HQ, GeForce GTX 1050 Mobile, 48 Wh | Acer Aspire VX15 VX5-591G-589S i5-7300HQ, GeForce GTX 1050 Mobile, 52.5 Wh | Gigabyte Sabre 15G i7-7700HQ, GeForce GTX 1050 Mobile, 47 Wh | |
|---|---|---|---|---|---|---|---|
| Battery runtime | -4% | -57% | -44% | -57% | -42% | -48% | |
| Reader / Idle (h) | 18.2 | 19.6 8% | 8.5 -53% | 10.2 -44% | 7.3 -60% | 8.2 -55% | |
| WiFi v1.3 (h) | 9.5 | 10.4 9% | 4 -58% | 4.4 -54% | 4.6 -52% | 5.5 -42% | 4.4 -54% |
| Load (h) | 2 | 1.4 -30% | 0.8 -60% | 1.3 -35% | 0.8 -60% | 1.3 -35% |
Pros
Cons
Verdict
In some ways, our review of the Dell Inspiron 15 7000 7567 Gaming with i5-7300HQ and GTX 1050 wasn't quite as straight forward as we expected it to be: on paper, the review laptop is simply a less powerful version of the higher-end sibling. While the performance is indeed lower and just about where we would expect it to be, it's baffling that the system is noisier, louder, runs hotter and has a slightly shorter battery life as well. This list might sound like it should be a deal breaker, but it really isn't: the Inspiron is well built, sturdy, looks good, offers decent performance and easily lasts an entire day when performing every-day tasks. The one real downfall is the TN display which is reasonably bright, but suffers from poor contrast, inaccurate colors and very poor viewing angles.
The Inspiron 15 7000 Gaming is one of the longest-lasting budget gaming systems out there. The price is of $750 seems more than fair as well.
For $850 at the time of writing, the Inspiron 15 7000 Gaming can be ordered with a 256 GB SSD in addition to the GTX 1050 Ti and a 15.6-inch FHD (1920 x 1080) IPS display. Given the lackluster TN display of the review notebook, this is an absolute no-brainer in our opinion should the budget permit the added expense.
Dell Inspiron 15 7000 7567 Gaming (Core i5-7300HQ, GTX 1050)
- 08/07/2017 v6 (old)
Bernie Pechlaner
Price comparison