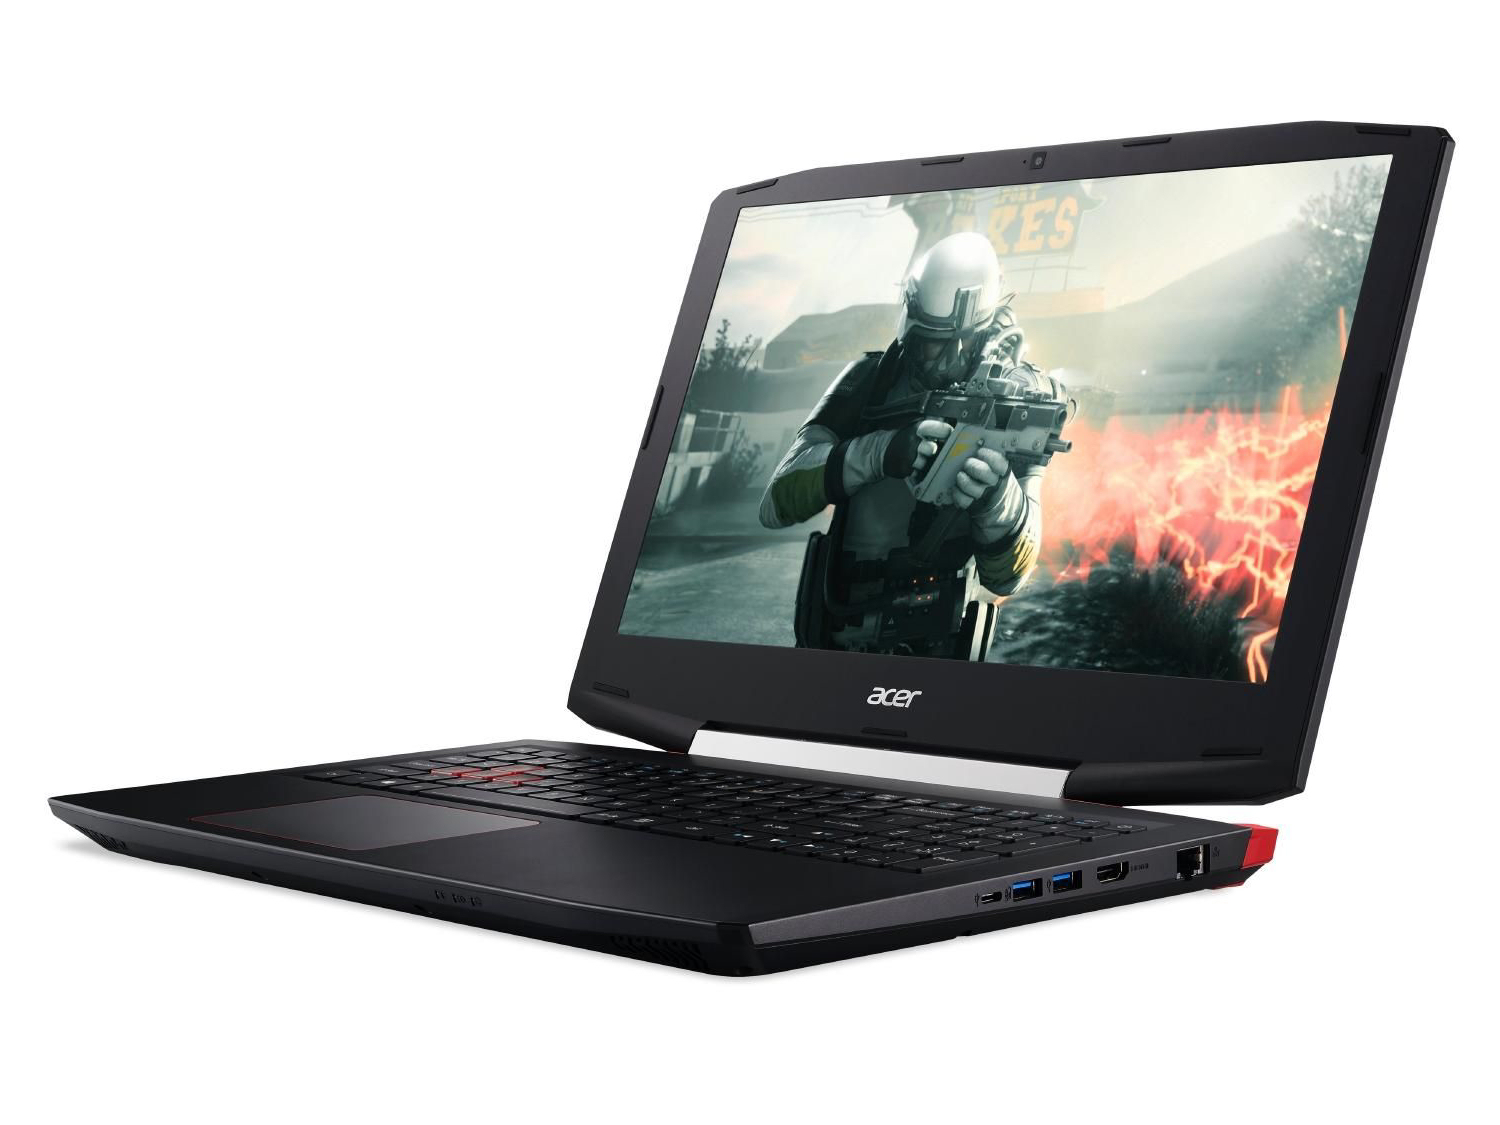
Acer Aspire VX 15 VX5-591G (7300HQ, GTX 1050, Full HD) Laptop Review

For the original German review, click here.
The Aspire VX 15 VX5-591G-58DD is currently the cheapest model of the VX-15 series. The device is familiar to us, as we have already tested a sister version with the same build - the VX5-591G-75C4. The difference between the two devices is in the hardware. While the model we already tested was equipped with a Core i7-7700HQ processor and a GeForce GTX 1050 Ti GPU, today's test unit has a Core i5-7300HQ processor and a GeForce GTX 1050 GPU. Some of the device's competitors are the Asus FX553VD, the HP Pavilion 15 and the Dell Inspiron 15 7567.
As both VX-15 models have the same build, we will not go into details about the case, connectivity, input devices or speakers. For more information about those aspects, please see the VX5-591G-75C4 review.
This configuration is currently not available in the US.
| SD Card Reader | |
| average JPG Copy Test (av. of 3 runs) | |
| Asus FX553VD-DM249T | |
| HP Omen 15-ax007ng | |
| HP Pavilion 15t-X7P42AV | |
| Acer Aspire VX15 VX5-591G-589S | |
| Acer Aspire VX5-591G-75C4 VX15 | |
| Dell Inspiron 15 7000 7567 | |
| maximum AS SSD Seq Read Test (1GB) | |
| HP Pavilion 15t-X7P42AV | |
| Asus FX553VD-DM249T | |
| HP Omen 15-ax007ng | |
| Acer Aspire VX5-591G-75C4 VX15 | |
| Dell Inspiron 15 7000 7567 | |
| Acer Aspire VX15 VX5-591G-589S | |
| Networking | |
| iperf3 transmit AX12 | |
| Asus FX553VD-DM249T | |
| Acer Aspire VX5-591G-75C4 VX15 | |
| Acer Aspire VX15 VX5-591G-589S | |
| HP Pavilion 15t-X7P42AV | |
| Dell Inspiron 15 7000 7567 (jseb) | |
| iperf3 receive AX12 | |
| Acer Aspire VX15 VX5-591G-589S | |
| HP Pavilion 15t-X7P42AV | |
| Acer Aspire VX5-591G-75C4 VX15 | |
| Asus FX553VD-DM249T | |
| Dell Inspiron 15 7000 7567 (jseb) | |
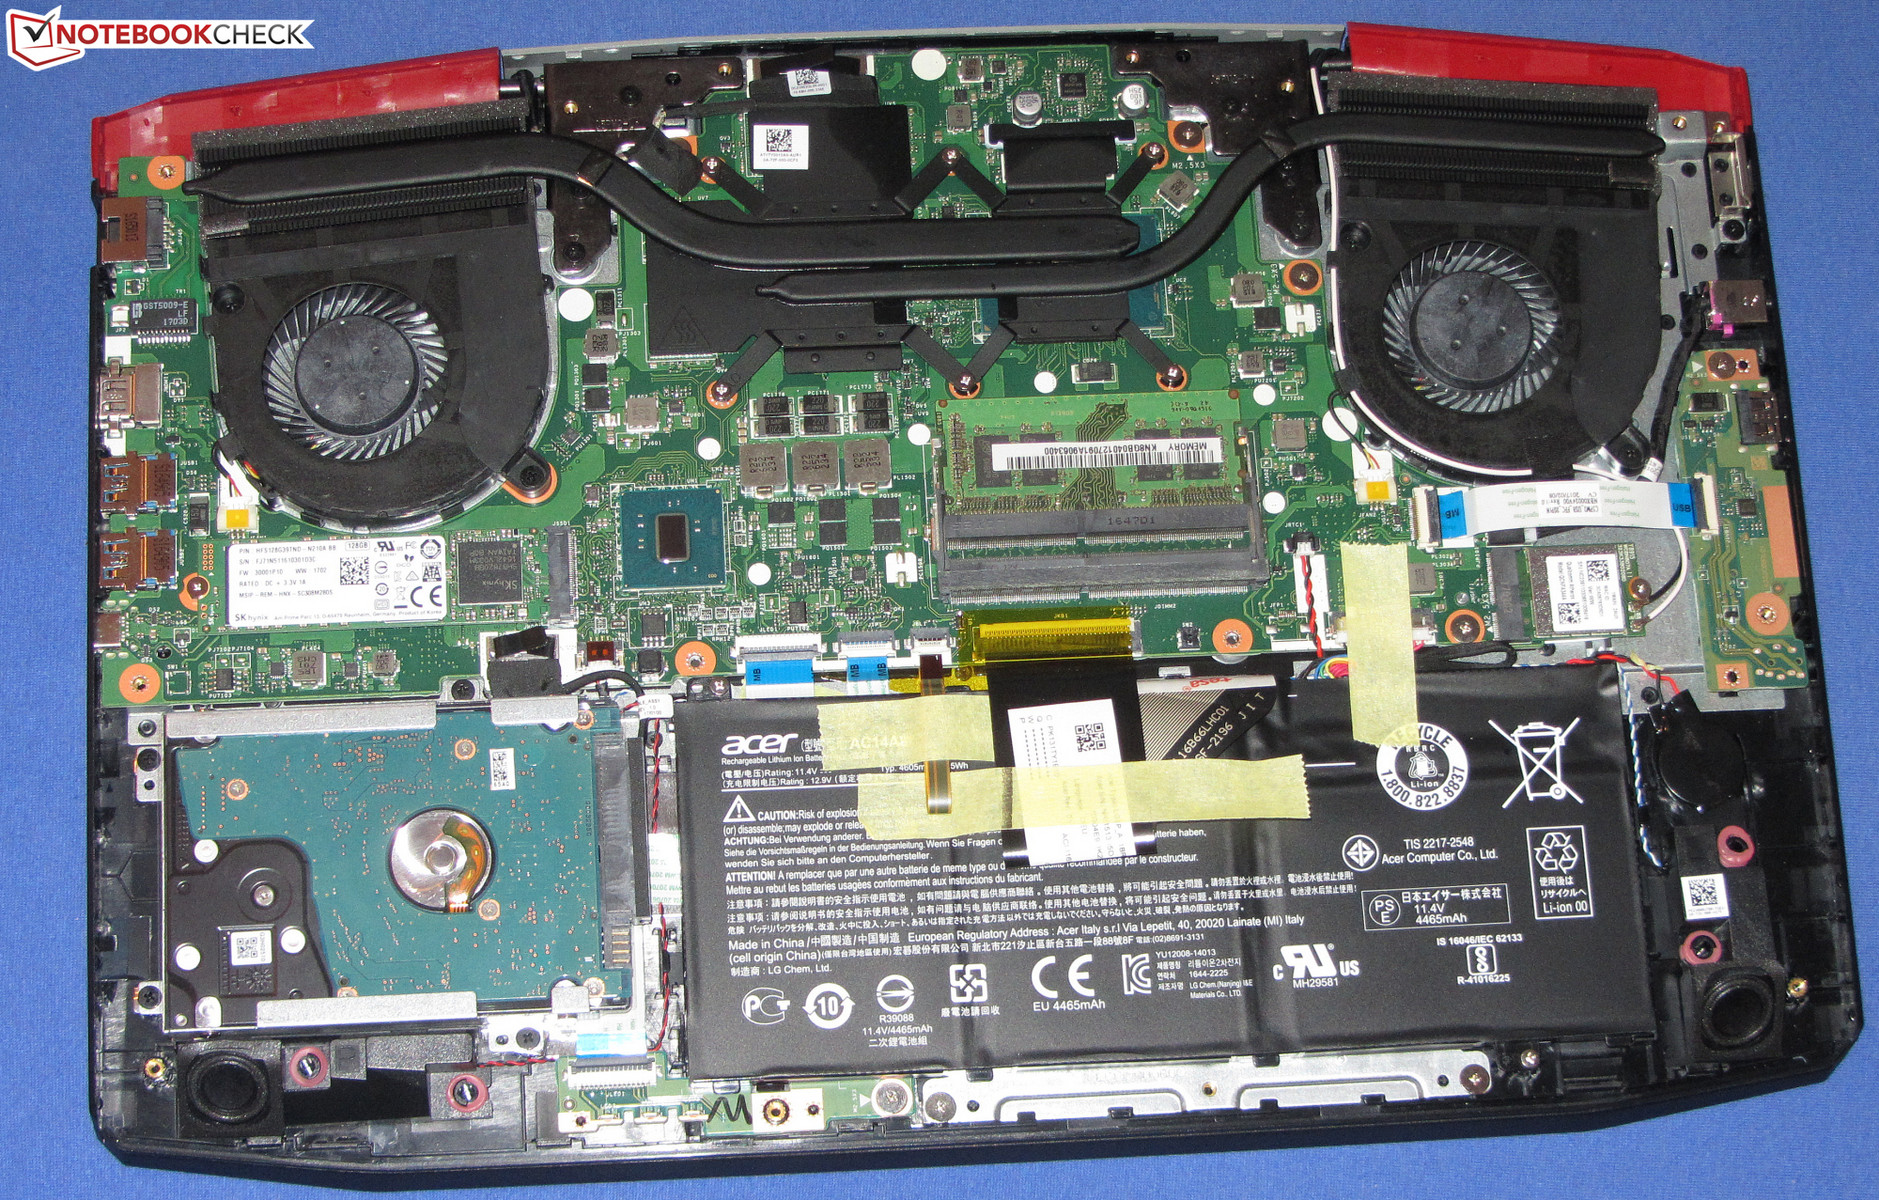
Maintenance
The device has no maintenance hatch, so the bottom of the base unit needs to be removed entirely in order to reach the insides. After unscrewing all the screws, the bottom cover can be lifted off with the help of a flat spatula. It is additionally held in place by plastic clips. Once the cover is removed, all hardware components can be accessed.
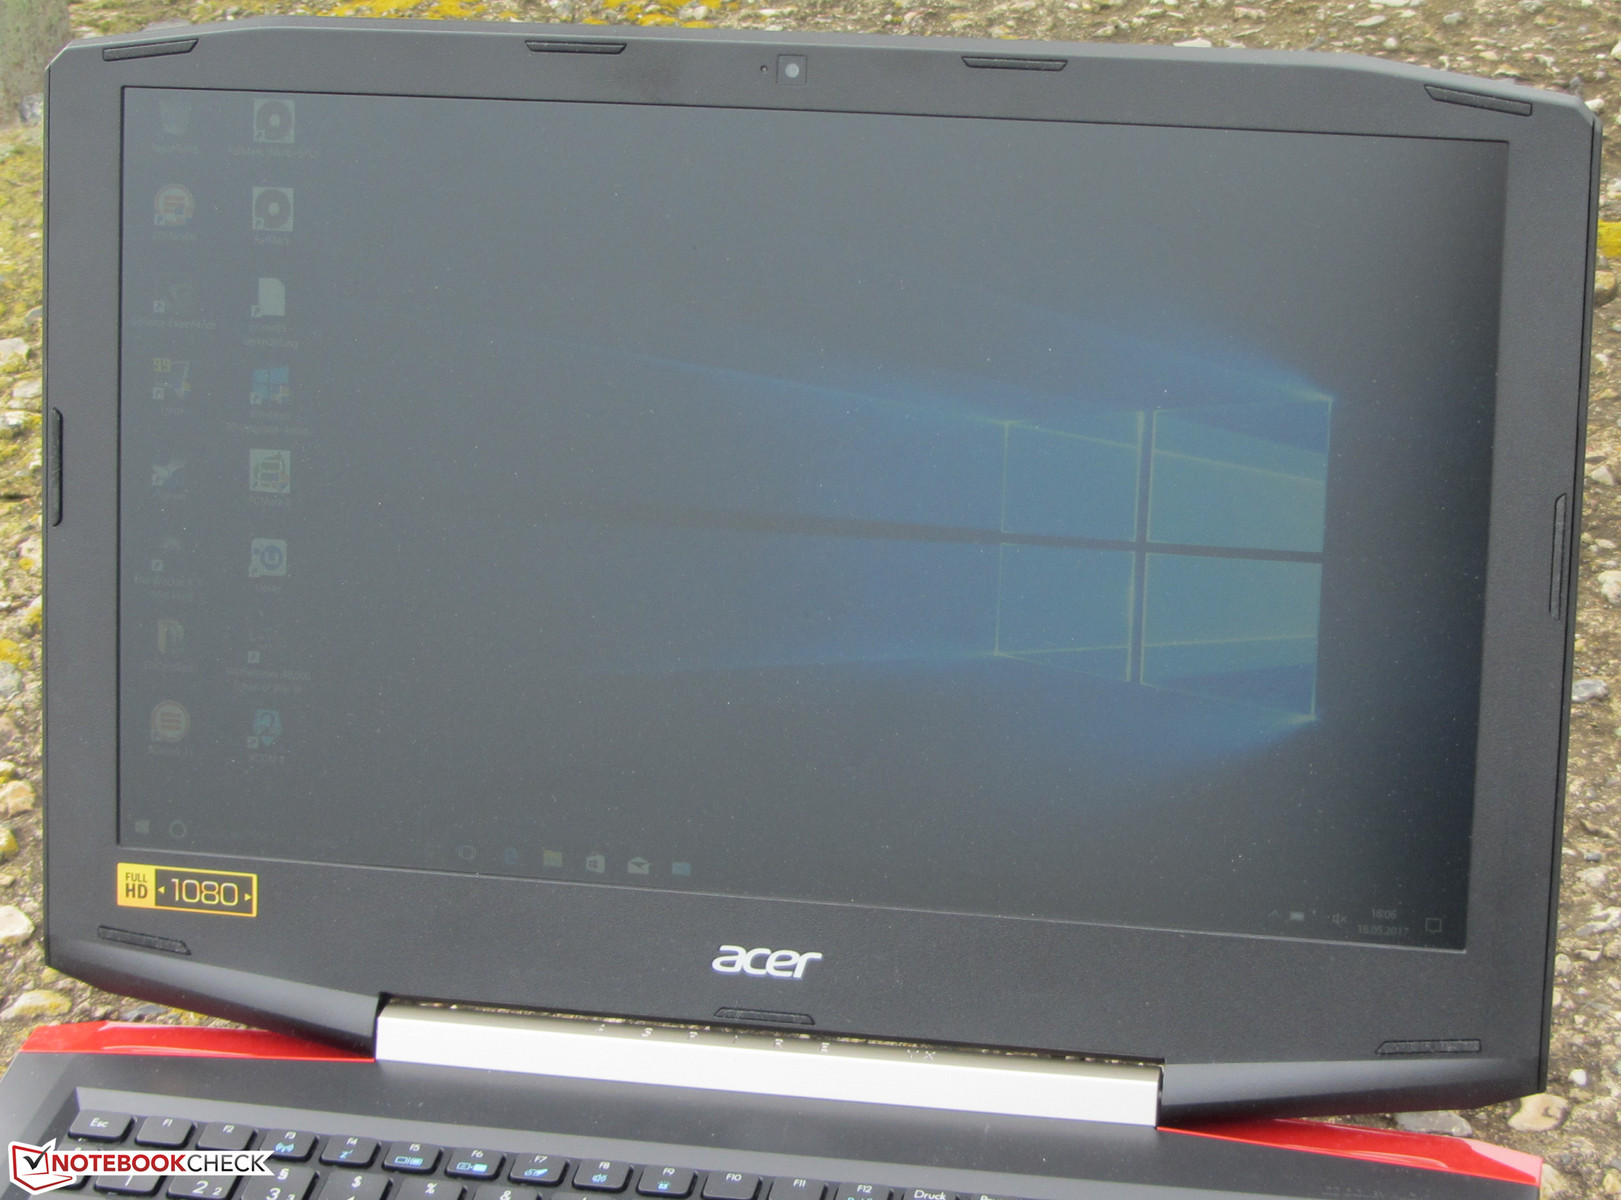
Display

The Aspire's matte 15.6-inch display has a native resolution of 1920x1080 pixels. It has a good contrast level (1065:1) and an average brightness level (267.9 cd/m2) - which could be higher. Unfortunately, the screen shows PWM-flickering with a frequency of 20,000 Hz at a brightness level of 90% and below. But thanks to this high frequency, this should not lead to headaches or eye problems even for sensitive users.
| |||||||||||||||||||||||||
Brightness Distribution: 91 %
Center on Battery: 281 cd/m²
Contrast: 1065:1 (Black: 0.26 cd/m²)
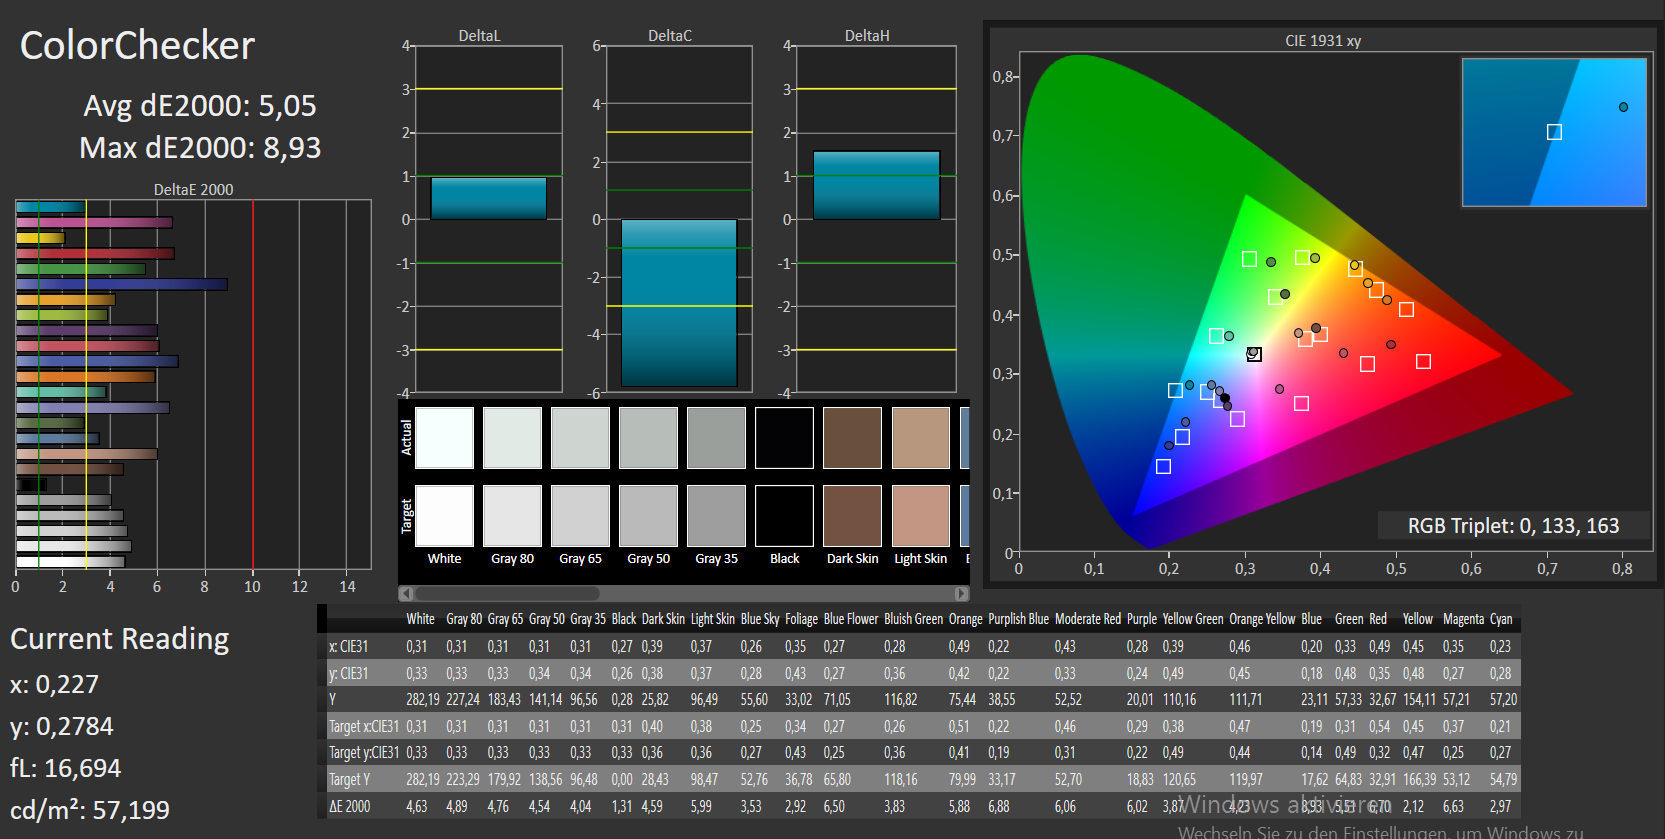
ΔE ColorChecker Calman: 5.05 | ∀{0.5-29.43 Ø4.73}
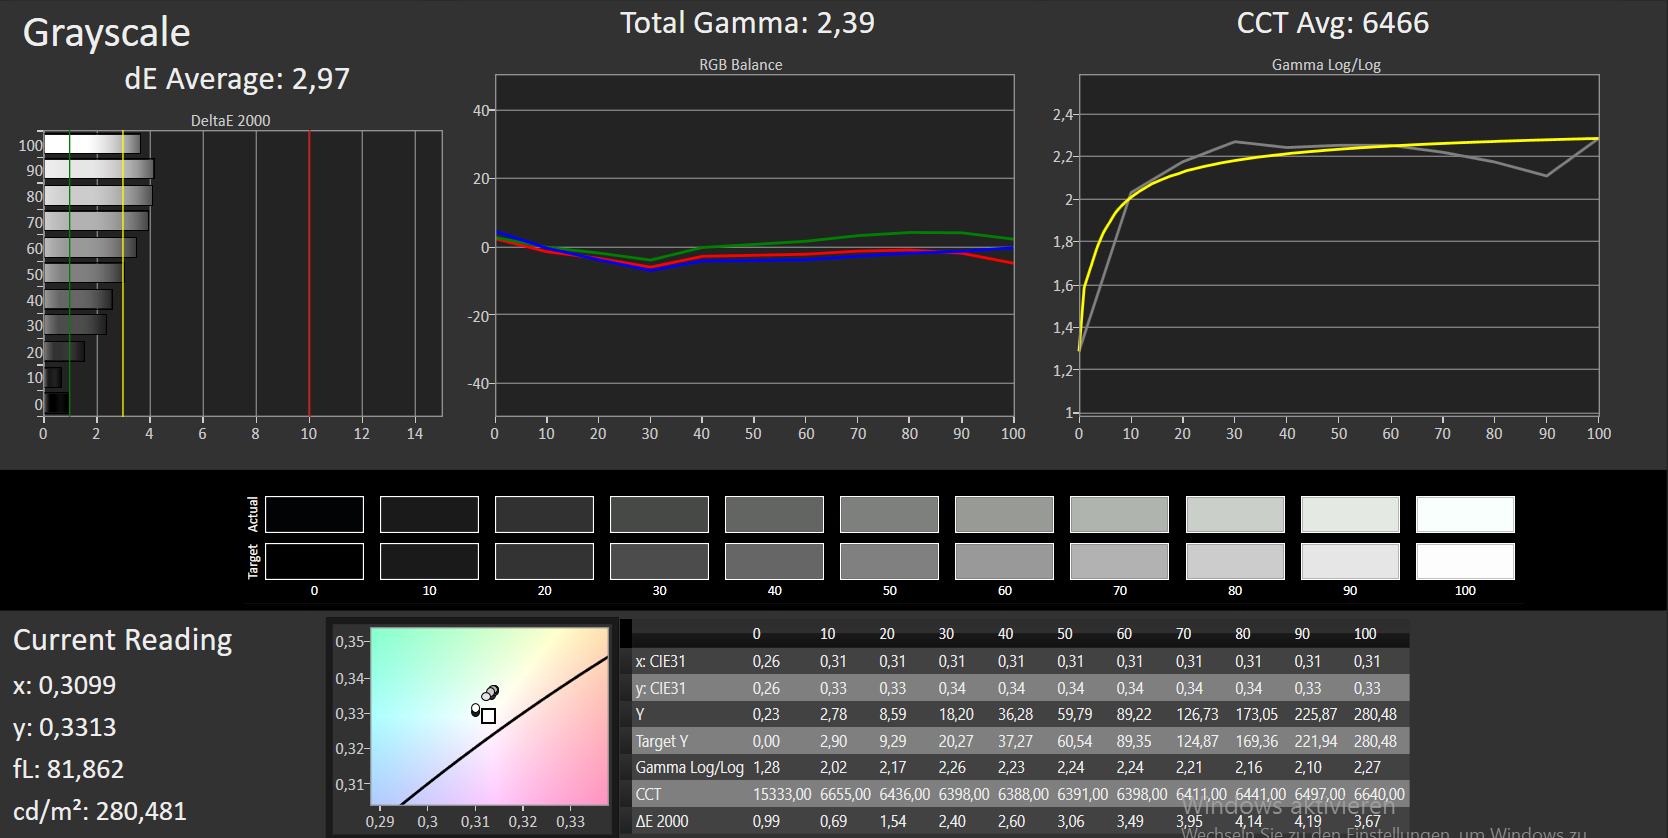
ΔE Greyscale Calman: 2.97 | ∀{0.09-98 Ø4.97}
59% sRGB (Argyll 1.6.3 3D)
38% AdobeRGB 1998 (Argyll 1.6.3 3D)
41.9% AdobeRGB 1998 (Argyll 3D)
59.4% sRGB (Argyll 3D)
40.56% Display P3 (Argyll 3D)
Gamma: 2.39
CCT: 6466 K
| Acer Aspire VX15 VX5-591G-589S IPS, 1920x1080, 15.6" | Acer Aspire VX5-591G-75C4 VX15 IPS, 1920x1080, 15.6" | Asus FX553VD-DM249T TN, 1920x1080, 15.6" | Dell Inspiron 15 7000 7567 TN, 1920x1080, 15.6" | HP Omen 15-ax007ng IPS, 1920x1080, 15.6" | HP Pavilion 15t-X7P42AV IPS, 1920x1080, 15.6" | |
|---|---|---|---|---|---|---|
| Display | -3% | -5% | -9% | 24% | -6% | |
| Display P3 Coverage (%) | 40.56 | 38.88 -4% | 37.98 -6% | 36.42 -10% | 59.9 48% 40.34 -1% | 38.03 -6% |
| sRGB Coverage (%) | 59.4 | 58.2 -2% | 57.1 -4% | 54.9 -8% | 85.9 45% 60.3 2% | 56.5 -5% |
| AdobeRGB 1998 Coverage (%) | 41.9 | 40.2 -4% | 39.24 -6% | 37.62 -10% | 61.6 47% 41.73 0% | 39.29 -6% |
| Response Times | 42% | 38% | 8% | -6% | 12% | |
| Response Time Grey 50% / Grey 80% * (ms) | 46 ? | 22 ? 52% | 43 ? 7% | 36 ? 22% | 55 ? -20% | 44.4 ? 3% |
| Response Time Black / White * (ms) | 34 ? | 23 ? 32% | 11 ? 68% | 36 ? -6% | 31 ? 9% | 27.2 ? 20% |
| PWM Frequency (Hz) | 20000 ? | |||||
| Screen | -11% | -12% | -80% | -25% | -41% | |
| Brightness middle (cd/m²) | 277 | 281 1% | 225 -19% | 246 -11% | 214 -23% | 209.7 -24% |
| Brightness (cd/m²) | 268 | 257 -4% | 215 -20% | 235 -12% | 203 -24% | 193 -28% |
| Brightness Distribution (%) | 91 | 85 -7% | 91 0% | 75 -18% | 79 -13% | 75 -18% |
| Black Level * (cd/m²) | 0.26 | 0.32 -23% | 0.46 -77% | 0.55 -112% | 0.28 -8% | 0.19 27% |
| Contrast (:1) | 1065 | 878 -18% | 489 -54% | 447 -58% | 764 -28% | 1104 4% |
| Colorchecker dE 2000 * | 5.05 | 5.16 -2% | 3.94 22% | 10.97 -117% | 6.04 -20% | 7.8 -54% |
| Colorchecker dE 2000 max. * | 8.93 | 9.09 -2% | 6.83 24% | 12 -34% | 24.1 -170% | |
| Greyscale dE 2000 * | 2.97 | 4.57 -54% | 2.68 10% | 14.25 -380% | 5.91 -99% | 7.3 -146% |
| Gamma | 2.39 92% | 2.59 85% | 2.35 94% | 1.83 120% | 2.44 90% | 2.39 92% |
| CCT | 6466 101% | 6931 94% | 6709 97% | 11200 58% | 7362 88% | 5771 113% |
| Color Space (Percent of AdobeRGB 1998) (%) | 38 | 37 -3% | 36 -5% | 35 -8% | 38 0% | 39.3 3% |
| Color Space (Percent of sRGB) (%) | 59 | 58 -2% | 57 -3% | 55 -7% | 60 2% | 56.5 -4% |
| Total Average (Program / Settings) | 9% /
-3% | 7% /
-4% | -27% /
-53% | -2% /
-7% | -12% /
-27% |
* ... smaller is better
Screen Flickering / PWM (Pulse-Width Modulation)
| Screen flickering / PWM detected | 20000 Hz | ≤ 90 % brightness setting | 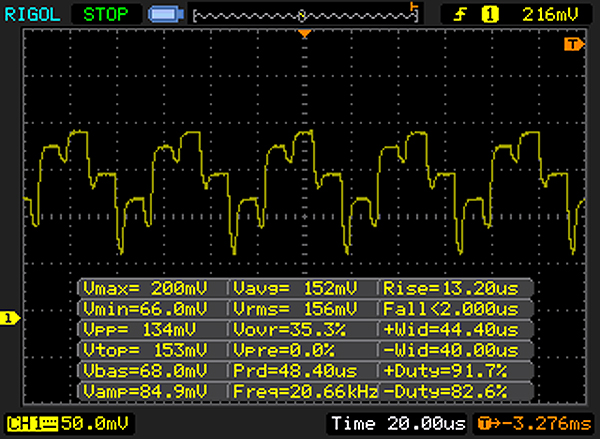 |
The display backlight flickers at 20000 Hz (worst case, e.g., utilizing PWM) Flickering detected at a brightness setting of 90 % and below. There should be no flickering or PWM above this brightness setting. The frequency of 20000 Hz is quite high, so most users sensitive to PWM should not notice any flickering. In comparison: 52 % of all tested devices do not use PWM to dim the display. If PWM was detected, an average of 7798 (minimum: 5 - maximum: 343500) Hz was measured. | |||
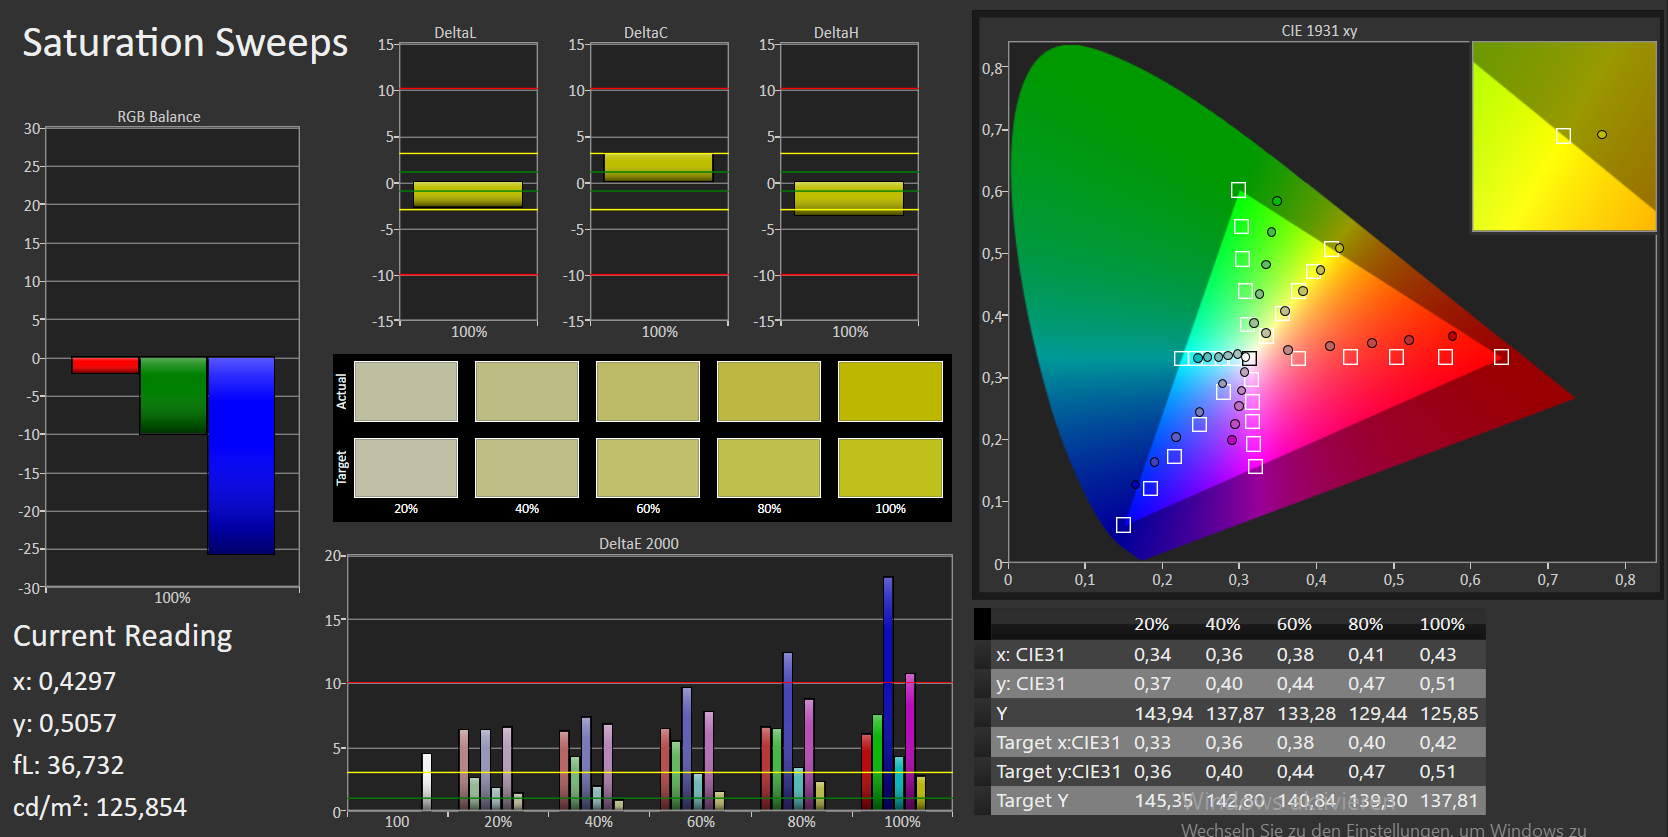
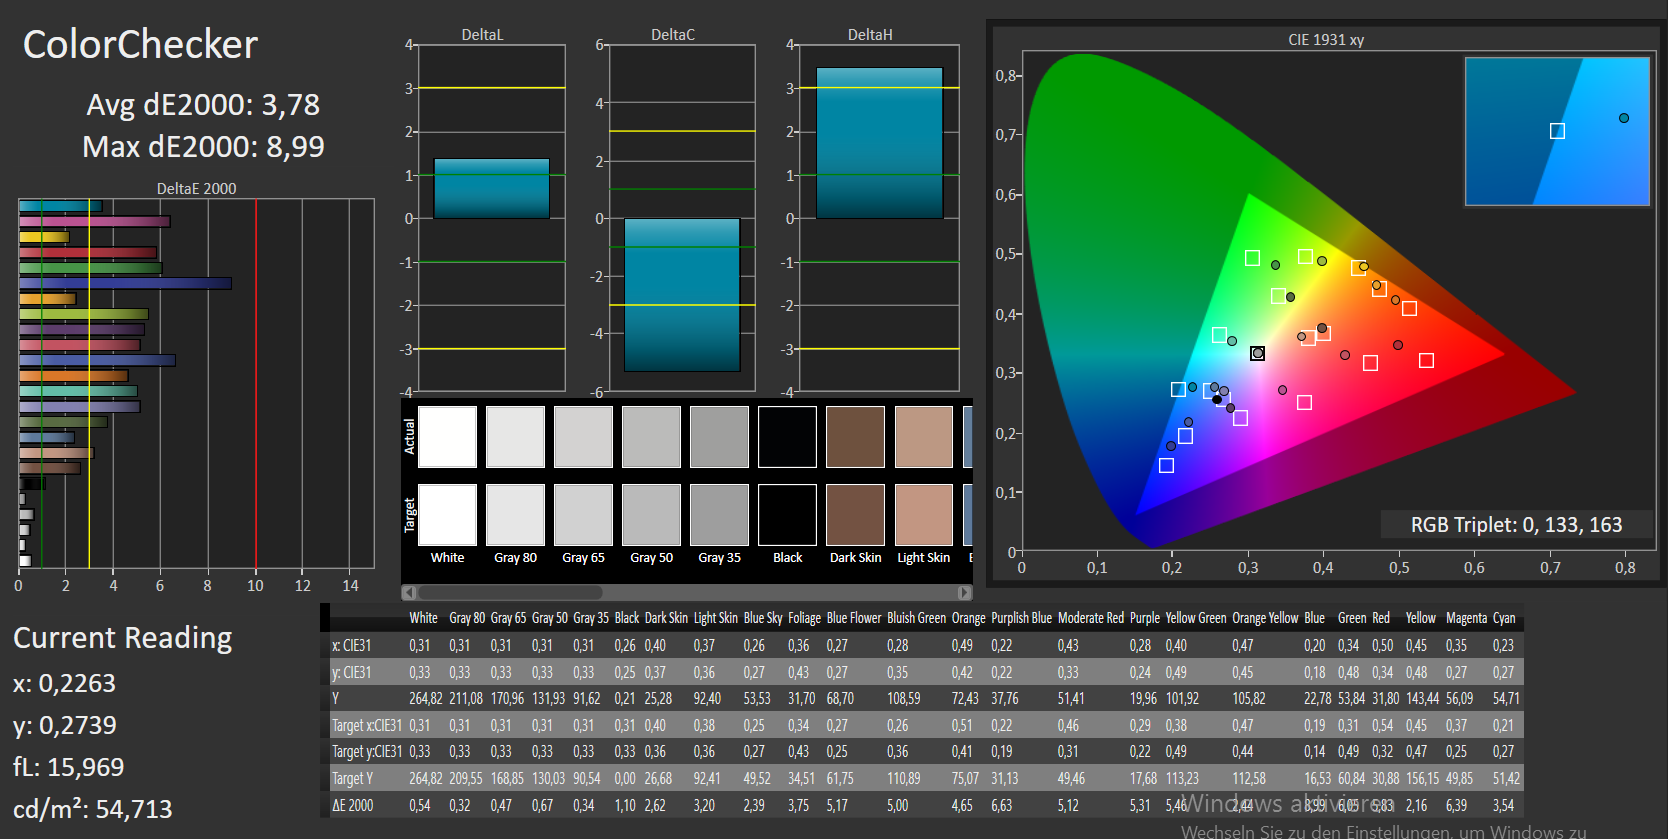
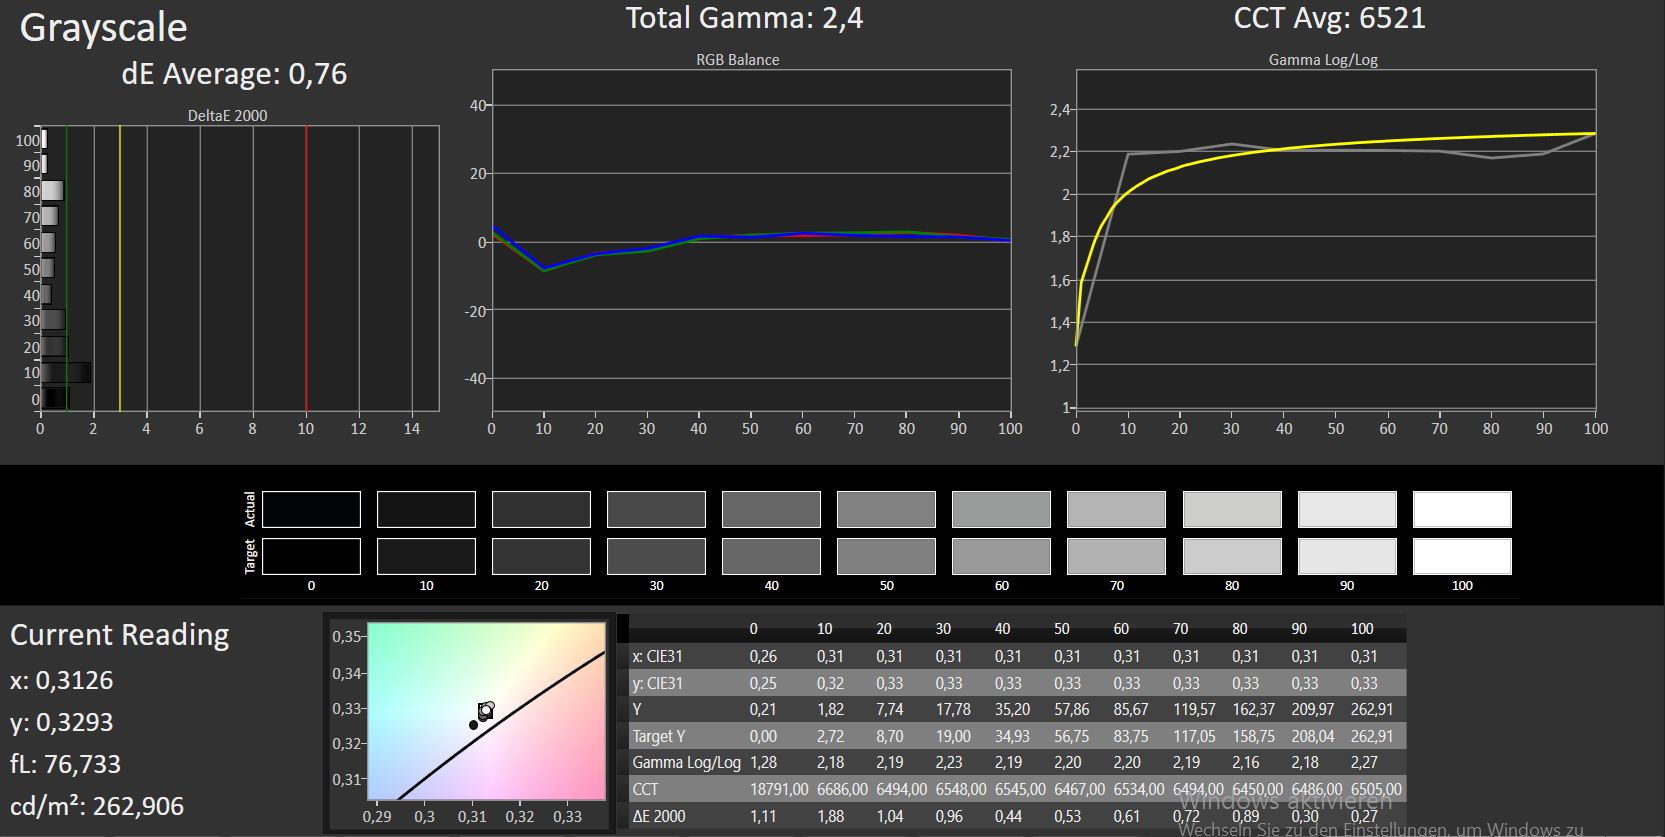
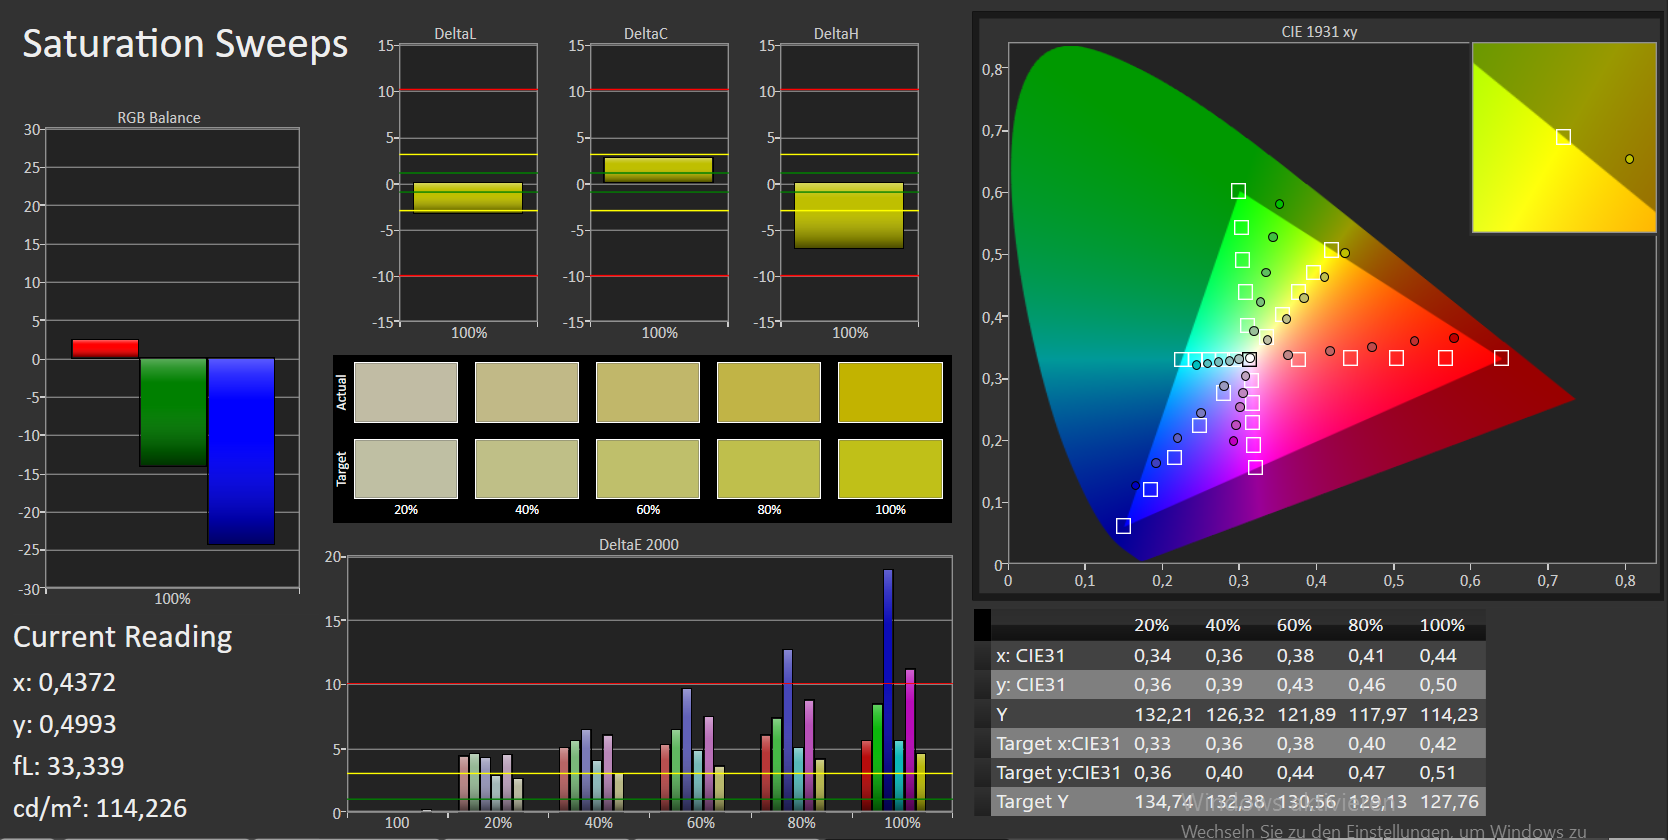
The screen has an ex-works DeltaE-2000 deviation of 5.05. The ideal value would be below 3. The display has no problems with blue cast. Calibrating the display improves the values slightly: the color deviation goes down to 3.78 and grayscale values are more balanced.
Display Response Times
| ↔ Response Time Black to White | ||
|---|---|---|
| 34 ms ... rise ↗ and fall ↘ combined | ↗ 20 ms rise | 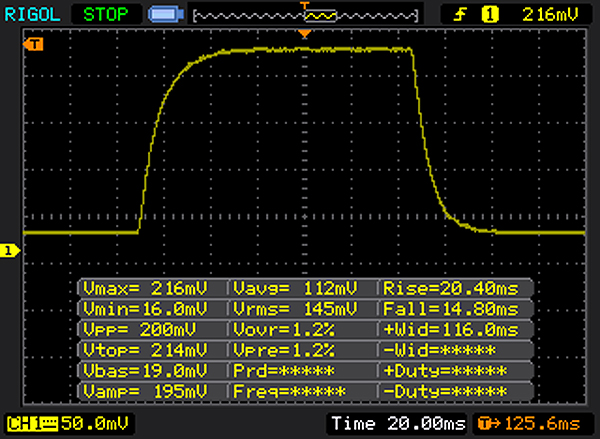 |
| ↘ 14 ms fall | ||
| The screen shows slow response rates in our tests and will be unsatisfactory for gamers. In comparison, all tested devices range from 0.1 (minimum) to 240 (maximum) ms. » 91 % of all devices are better. This means that the measured response time is worse than the average of all tested devices (19.9 ms). | ||
| ↔ Response Time 50% Grey to 80% Grey | ||
| 46 ms ... rise ↗ and fall ↘ combined | ↗ 25 ms rise |  |
| ↘ 21 ms fall | ||
| The screen shows slow response rates in our tests and will be unsatisfactory for gamers. In comparison, all tested devices range from 0.165 (minimum) to 636 (maximum) ms. » 79 % of all devices are better. This means that the measured response time is worse than the average of all tested devices (31.1 ms). | ||
Acer has equipped the Aspire with a wide viewing-angle IPS display. This means the image can be read from any position. However, the notebook can only be used outside when the sun is not too bright.
Performance
With the Aspire VX-15 series, Acer has created a collection of quite reasonably priced 15.6-inch gaming notebooks. But the devices also do a good job in areas other than computer games. Our test unit is currently the cheapest version of the series. It is available for about £800 (~$1035), but many other configuration options are available as well.
Processor
The Aspire has a Core i5-7300HQ (Kaby Lake) quad-core processor. With a TDP of 45 watts the CPU clearly tops Intel's ULV processors (TDP: 15 watts). Unlike the Core i7 quad-core processors, the 7300HQ has no support for Intel's Hyper-Threading (which means that two threads per core can be utilized simultaneously). Therefore, each of the 7300HQ's cores can only work one thread at a time. The quad-core processor works at a base speed of 2.5 GHz. The clock rate can be increased to 3.1 GHz (four cores), 3.3 GHz (two cores) or 3.5 GHz (one core) with the Turbo. This works both on battery and on power supply.
With the help of the multithread Cinebench R15 test running in a loop for 30 minutes, we are able to tell whether the Turbo remains in constant use. The Aspire's results remain consistently on the same level - there is no drop in performance.
| Cinebench R10 | |
| Rendering Multiple CPUs 32Bit | |
| Asus FX553VD-DM249T | |
| HP Pavilion 15t-X7P42AV | |
| Acer Aspire VX15 VX5-591G-589S | |
| Rendering Single 32Bit | |
| Asus FX553VD-DM249T | |
| HP Pavilion 15t-X7P42AV | |
| Acer Aspire VX15 VX5-591G-589S | |
| Geekbench 3 | |
| 32 Bit Multi-Core Score | |
| Acer Aspire VX15 VX5-591G-589S | |
| 32 Bit Single-Core Score | |
| Acer Aspire VX15 VX5-591G-589S | |
| Geekbench 4.0 | |
| 64 Bit Multi-Core Score | |
| Acer Aspire VX15 VX5-591G-589S | |
| 64 Bit Single-Core Score | |
| Acer Aspire VX15 VX5-591G-589S | |
| Geekbench 4.4 | |
| 64 Bit Multi-Core Score | |
| Acer Aspire VX15 VX5-591G-589S | |
| 64 Bit Single-Core Score | |
| Acer Aspire VX15 VX5-591G-589S | |
| JetStream 1.1 - 1.1 Total | |
| HP Pavilion 15t-X7P42AV | |
| Dell Inspiron 15 7000 7567 | |
| Acer Aspire VX15 VX5-591G-589S | |
System Performance
A strong processor and solid state drive make the system run smoothly. The good PCMark results confirm the good impression we got from the device and prove the Aspire has more than enough processing power for all the usual areas of application. The overall performance can only be increased slightly, for example by mounting a second RAM module.
| PCMark 8 Home Score Accelerated v2 | 3661 points | |
Help | ||
Storage Devices
The device's primary storage device is a solid state drive from Hynix. It is an M.2 2280 model with a total capacity of 128 GB. The read rates are good; the write rates are lacking for current standards. The device is also equipped with a 1 TB 2.5-inch hard drive for storing data.

| Acer Aspire VX15 VX5-591G-589S Hynix HFS128G39TND | Acer Aspire VX5-591G-75C4 VX15 Toshiba MQ01ABD100 | Asus FX553VD-DM249T Hynix HFS128G39TND | Dell Inspiron 15 7000 7567 Intel SSDSCKKF256H6 | HP Omen 15-ax007ng Adata IM2S3138E-128GM-B | HP Pavilion 15t-X7P42AV Samsung CM871a MZNTY128HDHP | |
|---|---|---|---|---|---|---|
| CrystalDiskMark 3.0 | -84% | -7% | 42% | -0% | 35% | |
| Read Seq (MB/s) | 510 | 101.5 -80% | 504 -1% | 485.8 -5% | 475.7 -7% | 522 2% |
| Write Seq (MB/s) | 137.6 | 100.6 -27% | 136.2 -1% | 422.8 207% | 169.2 23% | 476.6 246% |
| Read 512 (MB/s) | 362.1 | 28.33 -92% | 340.9 -6% | 338.9 -6% | 327.6 -10% | 399.7 10% |
| Write 512 (MB/s) | 137.2 | 28.31 -79% | 136.9 0% | 304 122% | 169.6 24% | 185.4 35% |
| Read 4k (MB/s) | 35.18 | 0.327 -99% | 29.74 -15% | 27.11 -23% | 33.14 -6% | 33.12 -6% |
| Write 4k (MB/s) | 104.8 | 0.846 -99% | 76.8 -27% | 85.4 -19% | 81.4 -22% | 89.8 -14% |
| Read 4k QD32 (MB/s) | 375.8 | 0.718 -100% | 348.2 -7% | 279.6 -26% | 276.8 -26% | 400.9 7% |
| Write 4k QD32 (MB/s) | 138.1 | 0.893 -99% | 136.4 -1% | 255.1 85% | 168 22% | 140.2 2% |
Graphics
The Aspire is equipped with an upper mid-range GPU - the GeForce GTX 1050. It is based on Nvidia's current Pascal architecture. The GPU supports DirectX 12 and reaches speeds of up to 1759 MHz. It is supported by 4096 MB of GDDR5 memory. For this graphics unit, the results of the 3DMark benchmarks are average. The GTX 1050 GPU is the successor of the GTX 960M, which it can easily beat. The improved version of the GTX 1050 - the GTX 1050 Ti GPU - has higher results. It performs better by about 20 to 30%.
| 3DMark 11 Performance | 7226 points | |
Help | ||
Gaming Performance
The Aspire offers enough processing power to display all the newest computer games smoothly. Most games can be played in Full HD resolution with mid to high (sometimes even maximum) quality settings. Some performance-driven games will need reduced resolutions and/or quality settings. The included GPU is not made for resolutions below Full HD; in this case you might go for a laptop equipped with a GeForce GTX 1070 GPU.
| low | med. | high | ultra | |
|---|---|---|---|---|
| BioShock Infinite (2013) | 206.5 | 160 | 147.5 | 63.6 |
| Mad Max (2015) | 140.4 | 70.1 | 64.3 | |
| Rainbow Six Siege (2015) | 185.2 | 139.7 | 76.4 | 63.6 |
| Just Cause 3 (2015) | 78.6 | 67.1 | 48.3 | 32.2 |
| XCOM 2 (2016) | 78.9 | 42.6 | 28.9 | 13.8 |
| Far Cry Primal (2016) | 90 | 49 | 43 | 31 |
| Resident Evil 7 (2017) | 216.5 | 100.3 | 56.6 | 21.4 |
| For Honor (2017) | 146.8 | 60.1 | 57 | 40.6 |
| Ghost Recon Wildlands (2017) | 81.8 | 36 | 34.4 | 18.5 |
| Mass Effect Andromeda (2017) | 75.7 | 41.5 | 26.4 | 24 |
| Warhammer 40.000: Dawn of War III (2017) | 81 | 36.5 | 23.2 | 20.2 |
| Prey (2017) | 125.2 | 82.5 | 68.1 | 53 |
| BioShock Infinite - 1920x1080 Ultra Preset, DX11 (DDOF) | |
| Dell Inspiron 15 7000 7567 | |
| HP Pavilion 15t-X7P42AV | |
| Acer Aspire VX15 VX5-591G-589S | |
| Lenovo Ideapad Y700 15ISK 80NV | |
Emissions
System Noise
The Aspire is never particularly noisy. The cooling fan runs at low speed while idling, which means you can hardly hear it. Even under load it does not speed up excessively. During the stress test we measured a sound pressure level of only 38.9 dB.
Noise level
| Idle |
| 30 / 30 / 31.1 dB(A) |
| HDD |
| 31.2 dB(A) |
| Load |
| 31.3 / 38.9 dB(A) |
 | ||
30 dB silent 40 dB(A) audible 50 dB(A) loud |
||
min: | ||
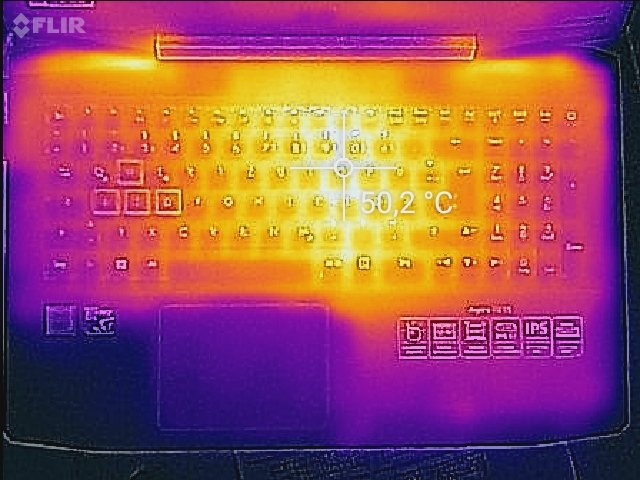
Temperature
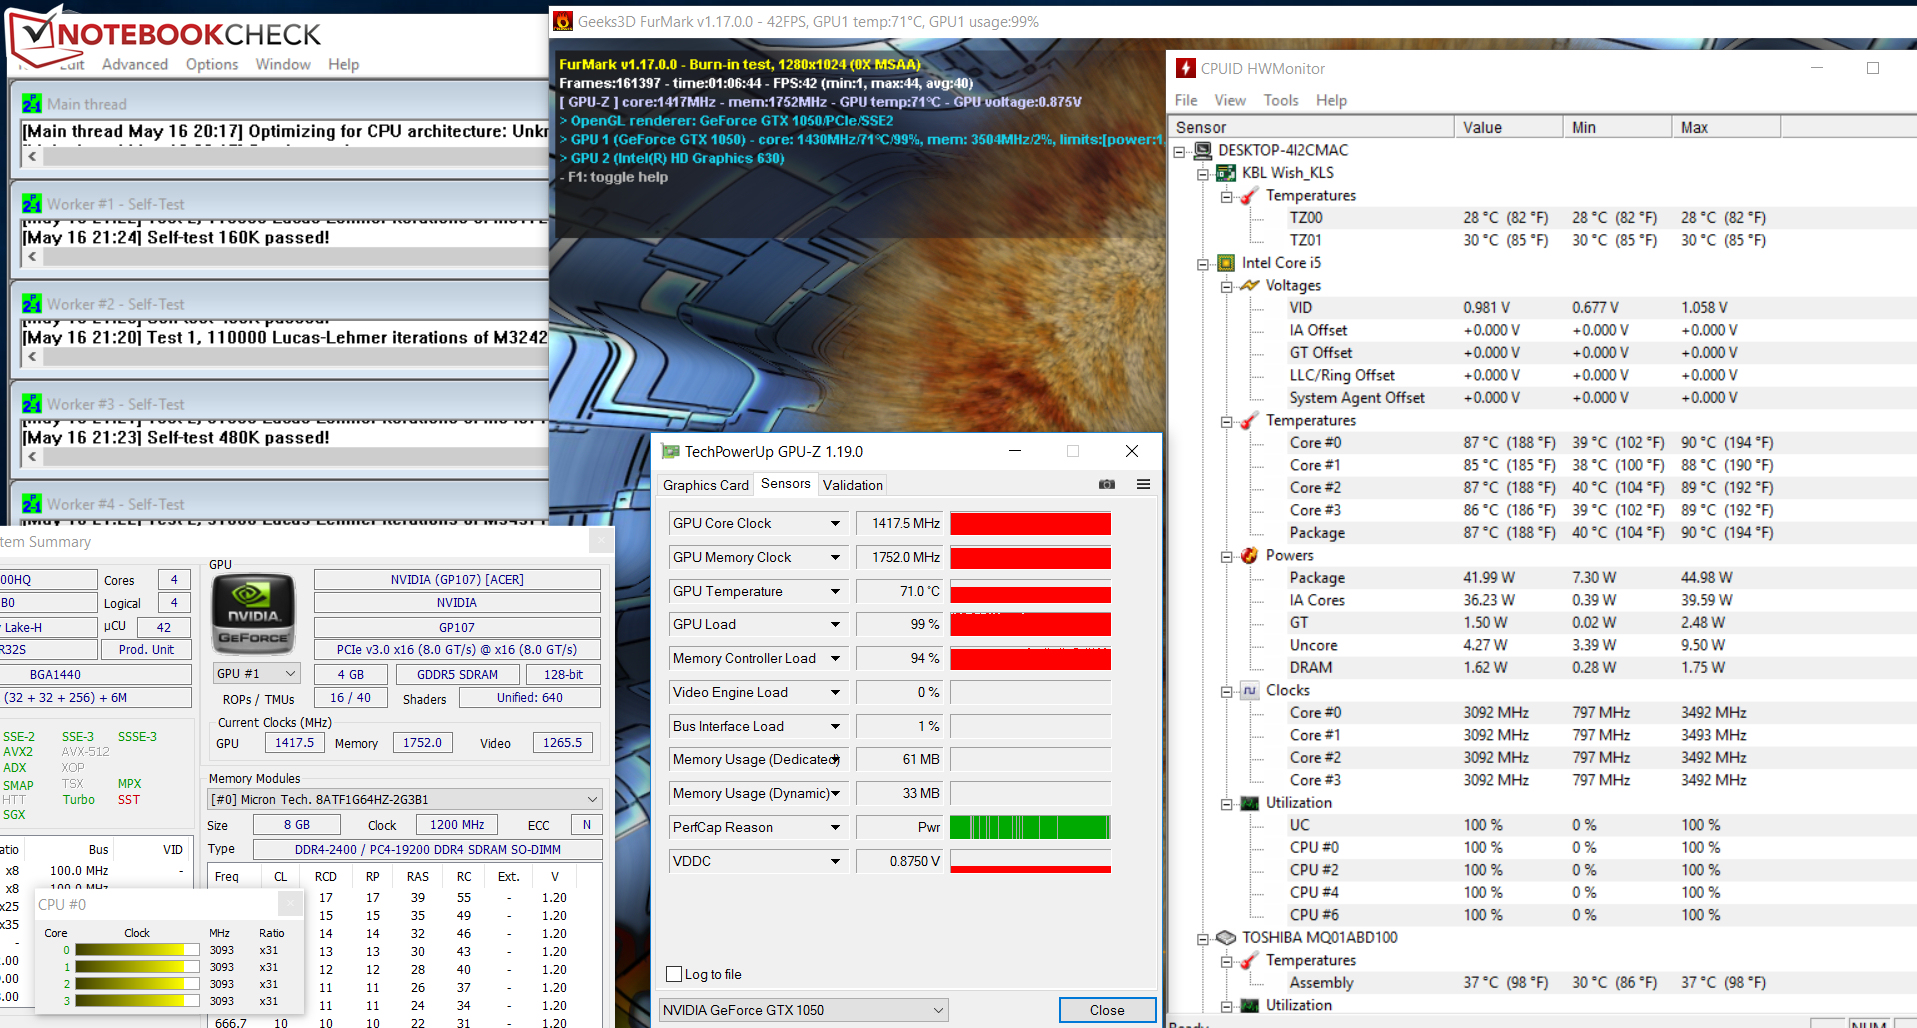
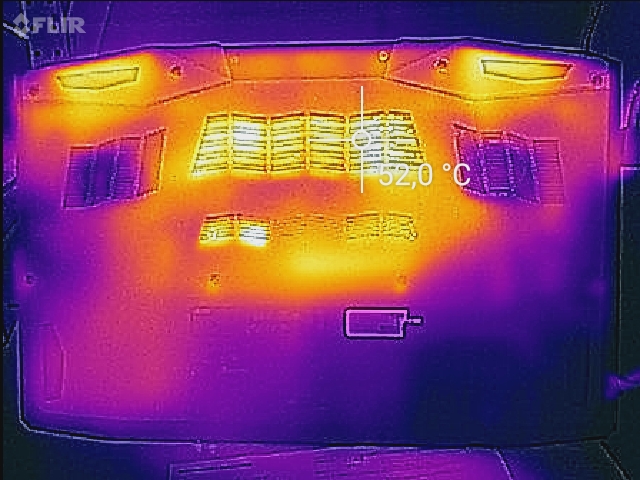
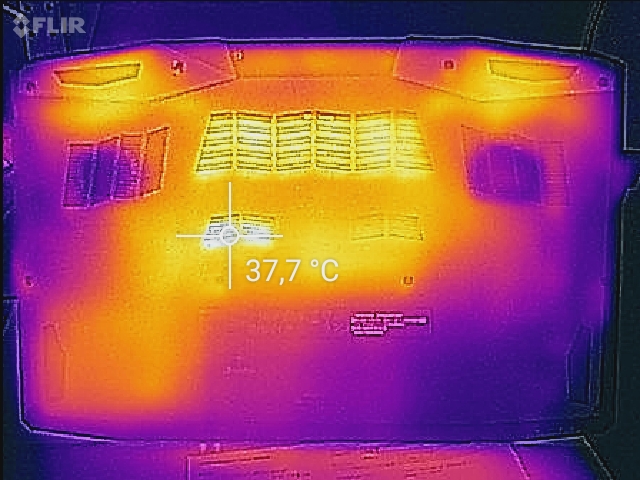
The Aspire reacts differently to our stress test (Prime95 + FurMark run simultaneously for a minimum of one hour) in battery mode and on power supply. On power supply, the processor runs at 3.1 GHz; the GPU reaches a speed between 1400 and 1500 MHz. When the stress test is run on battery, the processor's speed drops quickly to 1.4 to 1.5 GHz and the GPU runs at about 900 MHz. The device does not heat up excessively. The temperatures remained below 50 °C (~122 °F) at all measurement points during the stress test (on power supply).
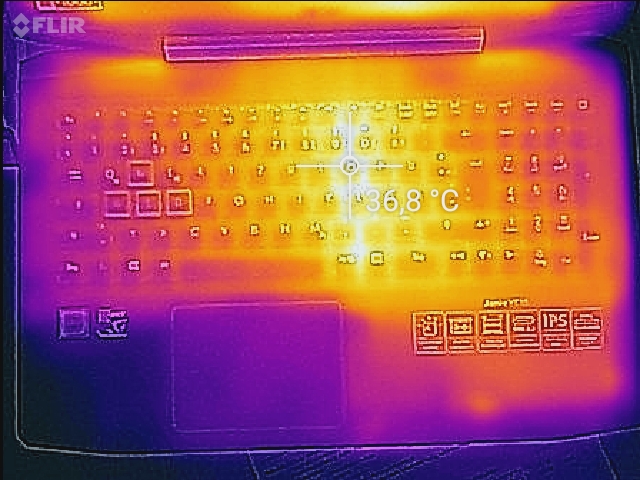
(-) The maximum temperature on the upper side is 47.2 °C / 117 F, compared to the average of 40.4 °C / 105 F, ranging from 21.2 to 68.8 °C for the class Gaming.
(±) The bottom heats up to a maximum of 42.2 °C / 108 F, compared to the average of 43.2 °C / 110 F
(+) In idle usage, the average temperature for the upper side is 27.2 °C / 81 F, compared to the device average of 33.9 °C / 93 F.
(+) The palmrests and touchpad are reaching skin temperature as a maximum (32.2 °C / 90 F) and are therefore not hot.
(-) The average temperature of the palmrest area of similar devices was 28.8 °C / 83.8 F (-3.4 °C / -6.2 F).
Speakers
Acer Aspire VX15 VX5-591G-589S audio analysis
(-) | not very loud speakers (69 dB)
Bass 100 - 315 Hz
(±) | reduced bass - on average 8.1% lower than median
(+) | bass is linear (6.6% delta to prev. frequency)
Mids 400 - 2000 Hz
(+) | balanced mids - only 2.1% away from median
(+) | mids are linear (3.2% delta to prev. frequency)
Highs 2 - 16 kHz
(+) | balanced highs - only 3.8% away from median
(+) | highs are linear (6.5% delta to prev. frequency)
Overall 100 - 16.000 Hz
(+) | overall sound is linear (12.6% difference to median)
Compared to same class
» 16% of all tested devices in this class were better, 3% similar, 81% worse
» The best had a delta of 6%, average was 18%, worst was 132%
Compared to all devices tested
» 11% of all tested devices were better, 2% similar, 86% worse
» The best had a delta of 4%, average was 24%, worst was 134%
Apple MacBook 12 (Early 2016) 1.1 GHz audio analysis
(+) | speakers can play relatively loud (83.6 dB)
Bass 100 - 315 Hz
(±) | reduced bass - on average 11.3% lower than median
(±) | linearity of bass is average (14.2% delta to prev. frequency)
Mids 400 - 2000 Hz
(+) | balanced mids - only 2.4% away from median
(+) | mids are linear (5.5% delta to prev. frequency)
Highs 2 - 16 kHz
(+) | balanced highs - only 2% away from median
(+) | highs are linear (4.5% delta to prev. frequency)
Overall 100 - 16.000 Hz
(+) | overall sound is linear (10.2% difference to median)
Compared to same class
» 7% of all tested devices in this class were better, 2% similar, 91% worse
» The best had a delta of 5%, average was 18%, worst was 53%
Compared to all devices tested
» 5% of all tested devices were better, 1% similar, 94% worse
» The best had a delta of 4%, average was 24%, worst was 134%
Frequency diagram in comparison (checkboxes above can be turned on/off)
Energy Management
Power Consumption
The Aspire has very average power consumption levels. We measured a maximum consumption of 14.2 watts while idling - a normal result for a notebook of this class. The consumption goes up to 111 watts during the stress test, so nothing the 135-watt power supply cannot cope with.
| Off / Standby | |
| Idle | |
| Load |
|
Key:
min: | |
Battery Runtime
Our practical Wi-Fi test simulates power consumption while surfing. The energy profile is set to “balanced”, energy-saving functions are deactivated and the display brightness is set to about 150 cd/m². With these settings, the Aspire has a battery runtime of 5:30 h.
Verdict
Pros
Cons
Acer's entry-level gamer comes at a price of £799.99 (~$1035). In exchange, you get a 15.6-inch notebook with a strong Kaby Lake quad-core processor and a GeForce GTX 1050 graphics processor. The hardware displays all the latest computer games smoothly in high resolution and mid- to high-quality settings. In some (few) cases the resolution and/or quality settings might need to be reduced. The device is quiet while idling and does not heat up particularly. Even under load the emissions do not increase excessively.
The Aspire has no real shortcomings. For £800 (~$1035), you get a well-equipped entry-level device - a great introduction into the world of gaming notebooks.
A solid state drive ensures a fast system. The device also provides the storage space necessary for a gaming notebook with the 2.5-inch hard drive. Both drives are replaceable, which would mean opening the bottom cover - an operation that is not too complicated. The matte IPS display has a stable viewing angle and good contrast. The display brightness is good, but it could be better.
The German test unit came without a Windows operating system. A cheap way to get the Windows 10 operating system would be via Windows 7/8.1. If you install one of the two earlier Windows versions with a used license (£5 to £10, ~$6 to $12), you can then get a free upgrade to Windows 10 with the help of Microsoft's Media Creation Tool.
Acer Aspire VX15 VX5-591G-589S
- 05/22/2017 v6 (old)
Sascha Mölck
Price comparison
