Notebookcheck Logo

Mad Max Notebook Benchmarks

Brilliant. It has been four months since the Hollywood blockbuster was released and now its time for the video game. Unlike many other movie-to-game ports, Mad Max is impressive. Let us take a look at what it has to offer.
Mad Max

For the original German article, see here.

Engine

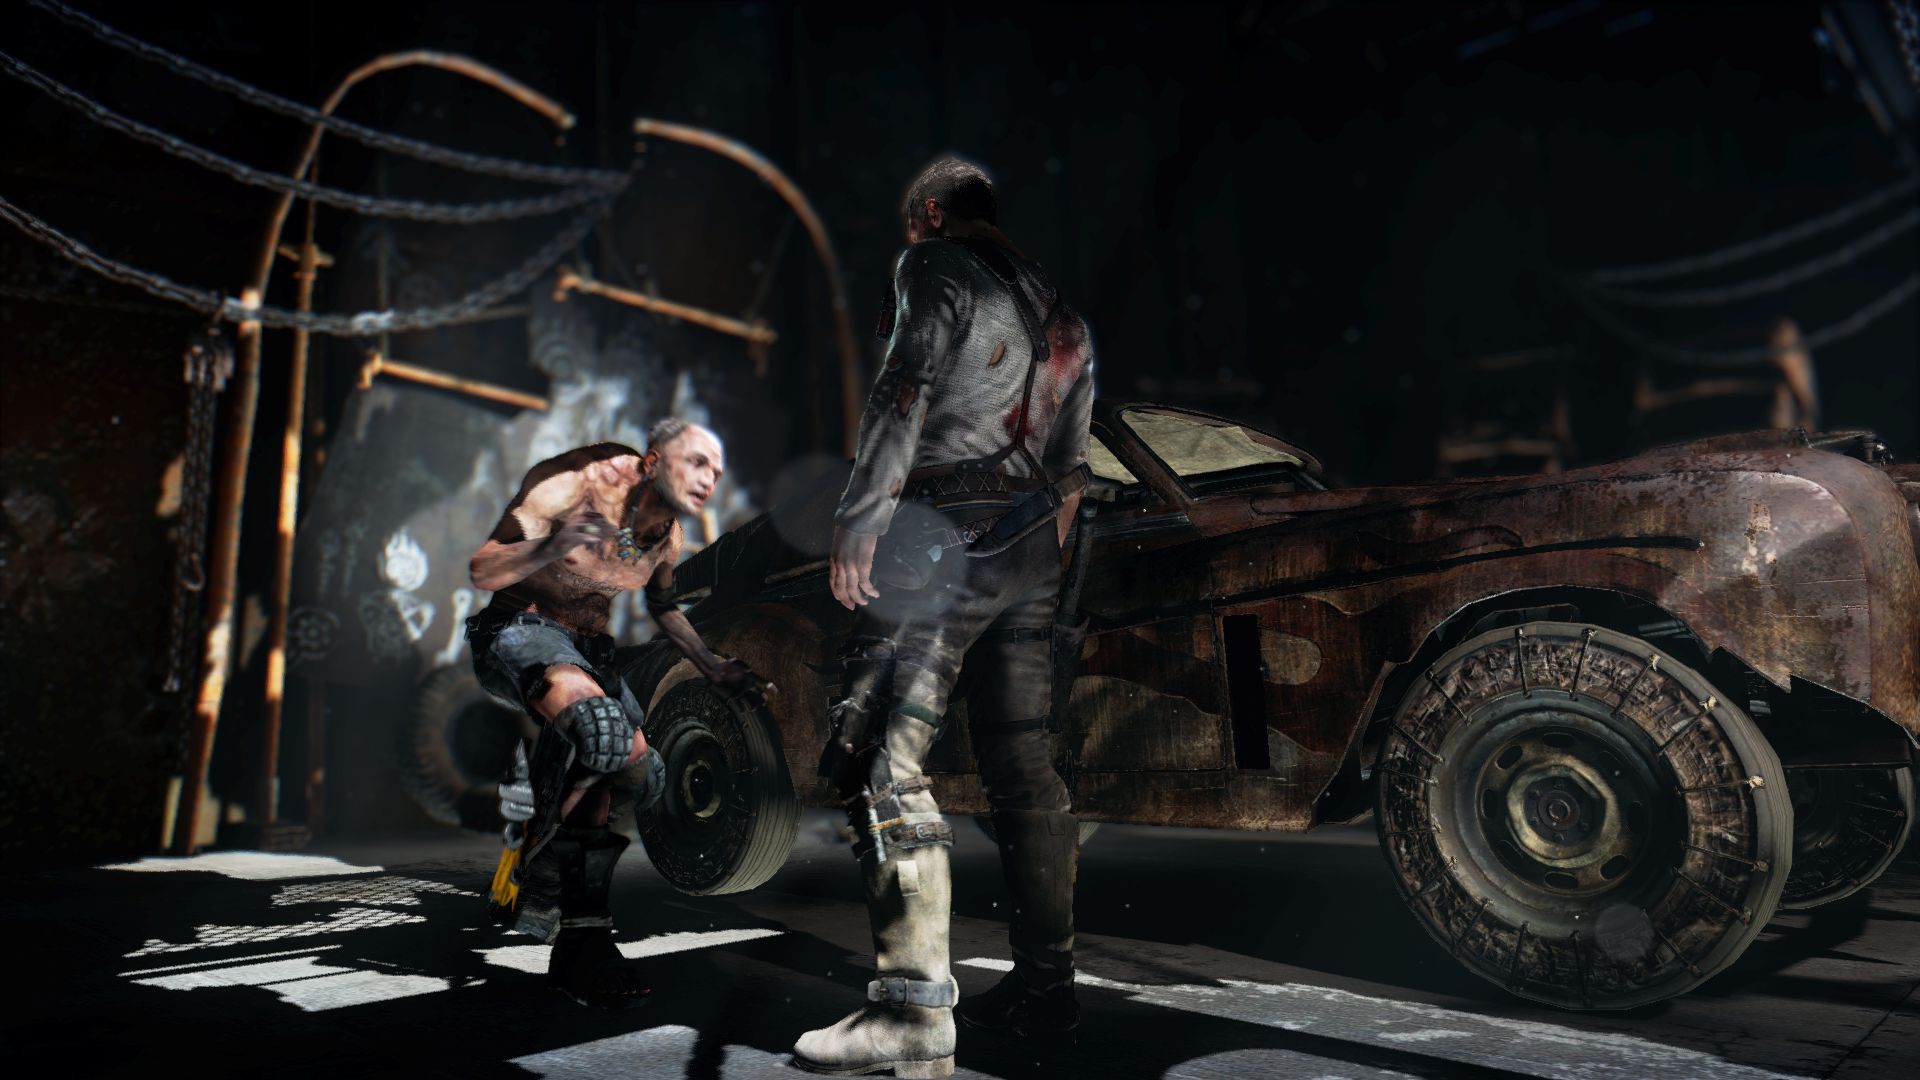
Mad Max was developed by Avalanche Studios. They were also the producers of Just Cause. The game is action-packed from the third-person view. Like the movie, the game is packed with over-the-top effects, like massive explosions, which will no doubt please gamers.

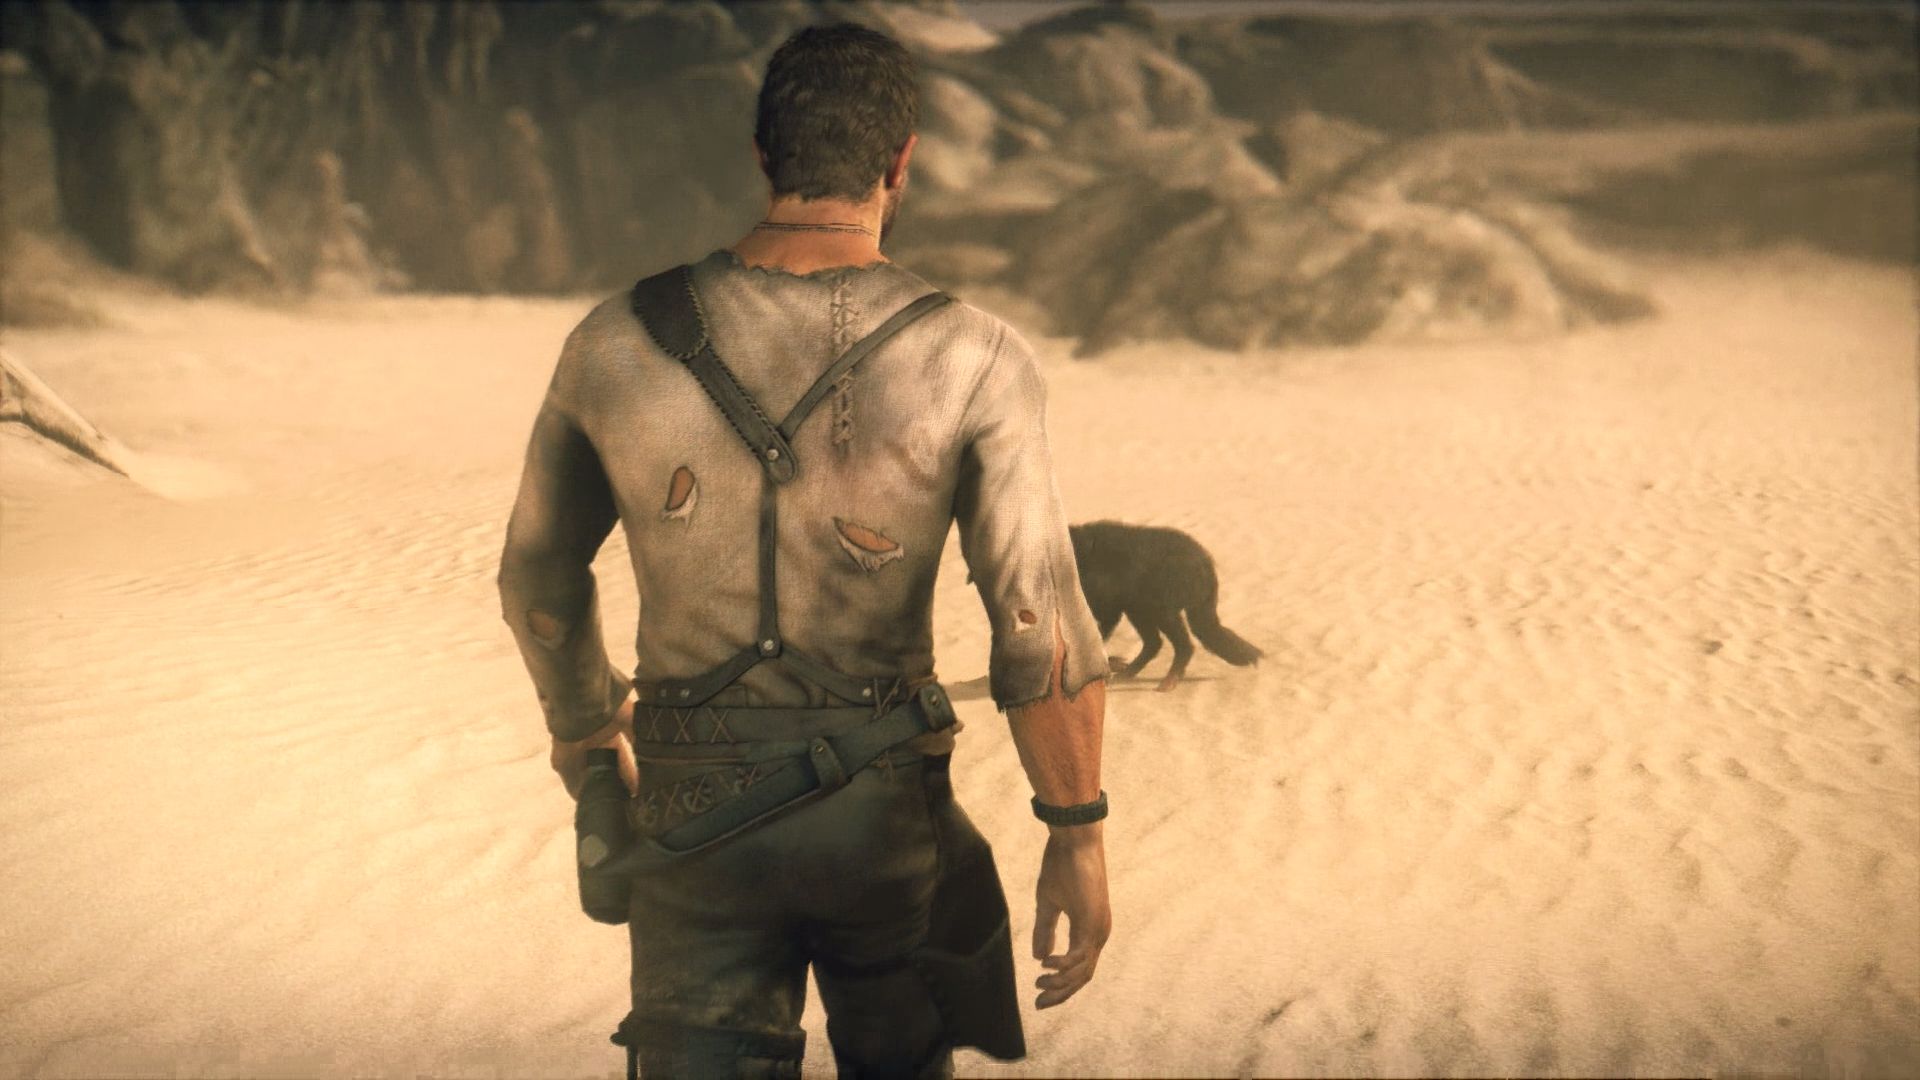
This title qualifies as an Arcade game thanks to the intense fist fights, like those of Batman, and straightforward races. The available gadgets and tuning elements may be a bit demanding, but this is in no way a survival game like The Evil Within. Mad Max is not a hardcore game but is a lot of fun: There is a certain appeal to shutting off the brain for a few hours and racing at full speed through the desert. Overall, the game feels like a mix of Borderlands, Rage and the Pitch Black movie.

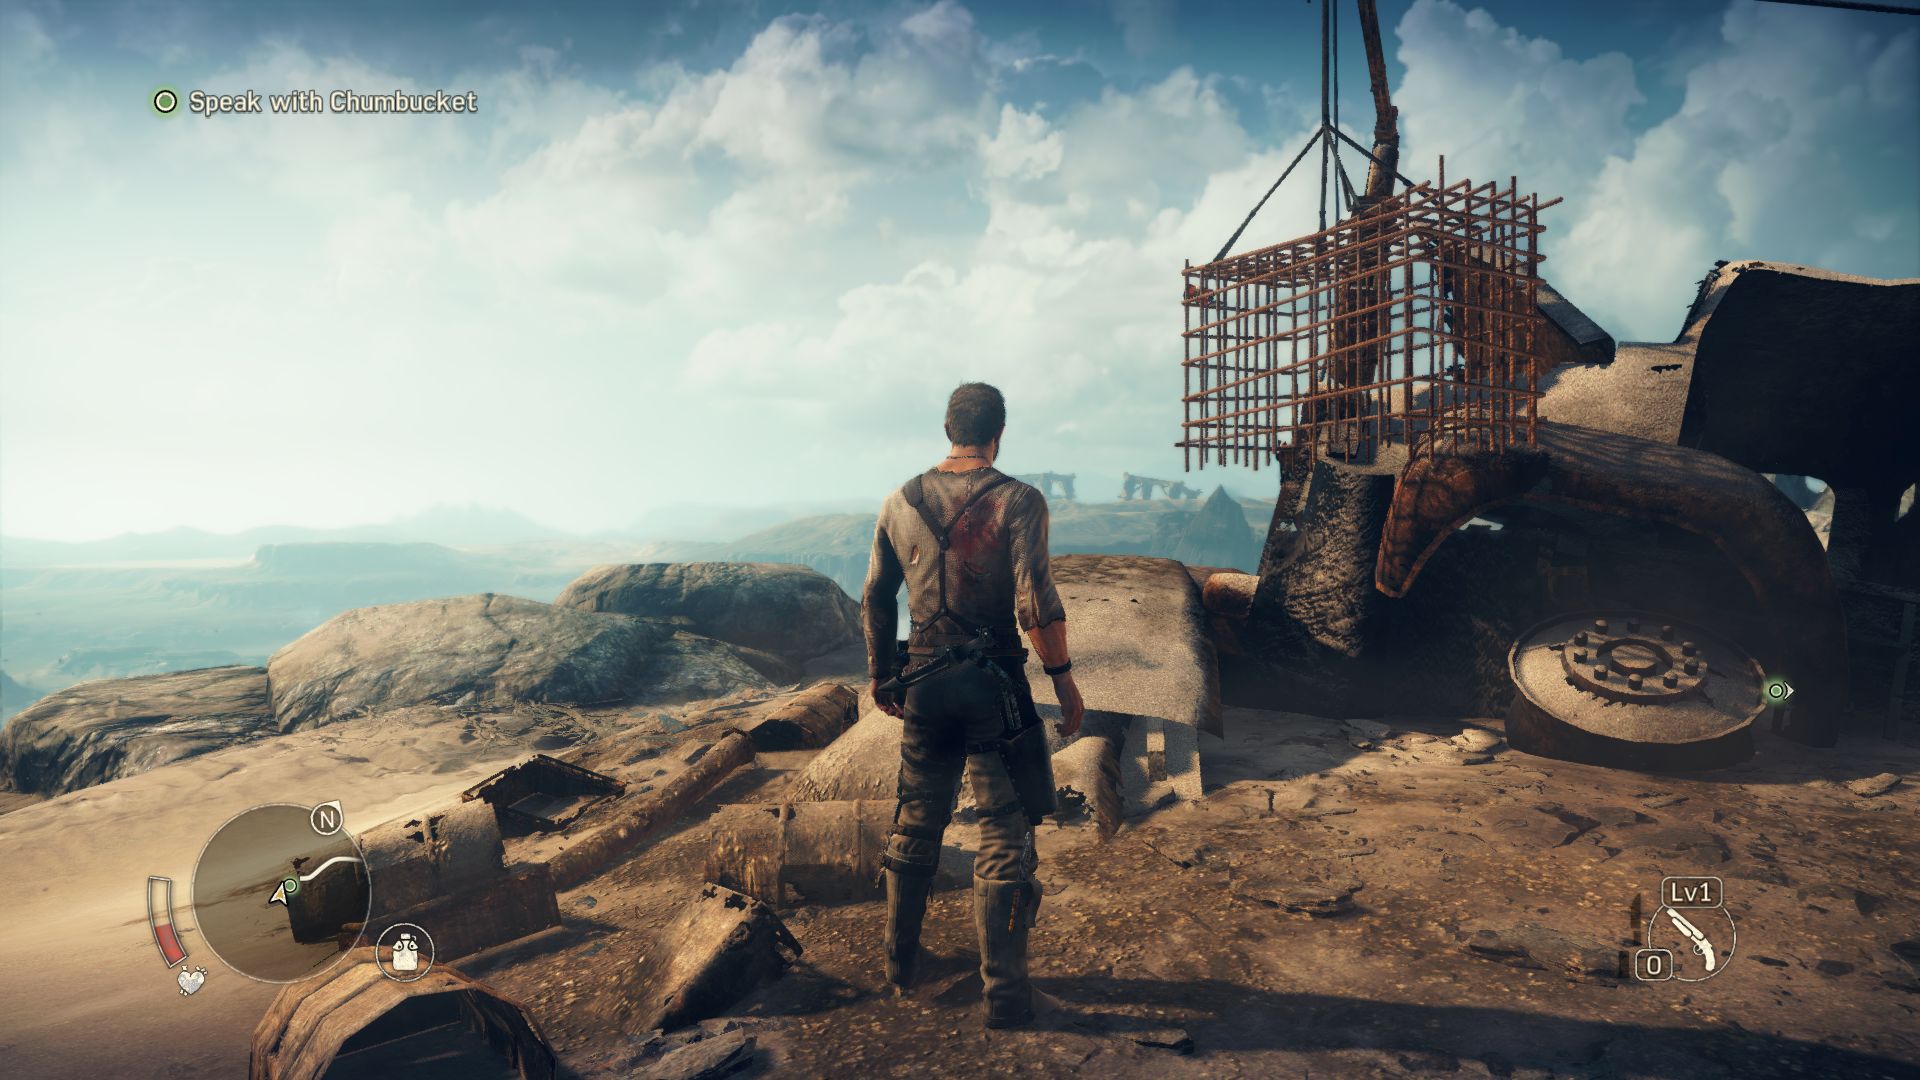
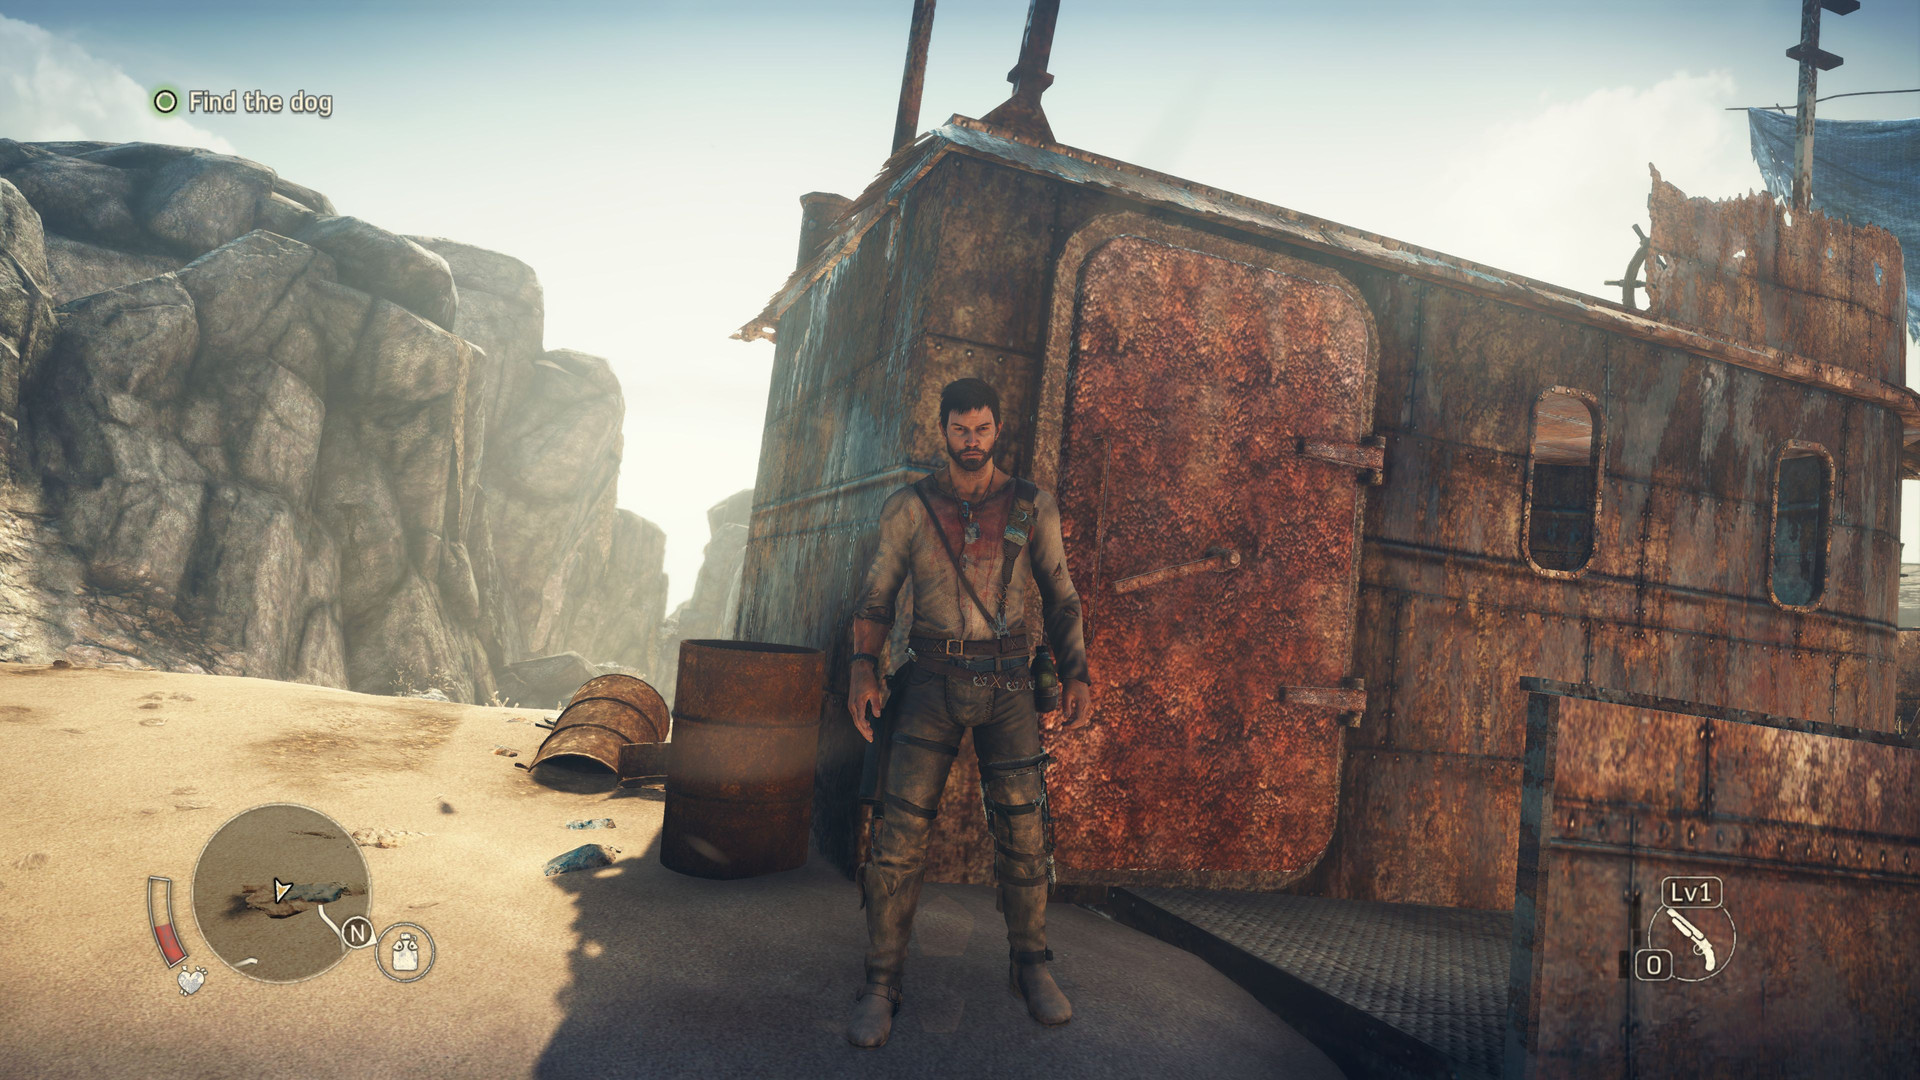
The PC version of Mad Max is very stable. We did not encounter any crashes or other abnormalities during our tests, but some users have complained about massive quest bugs. The engine of the game is well-designed. Although the Avalanche Engine cannot match the quality of a few other open-world games, like The Witcher 3 or Assassin's Creed Unity, it does manage a good job of putting the gamer in the world of Mad Max.

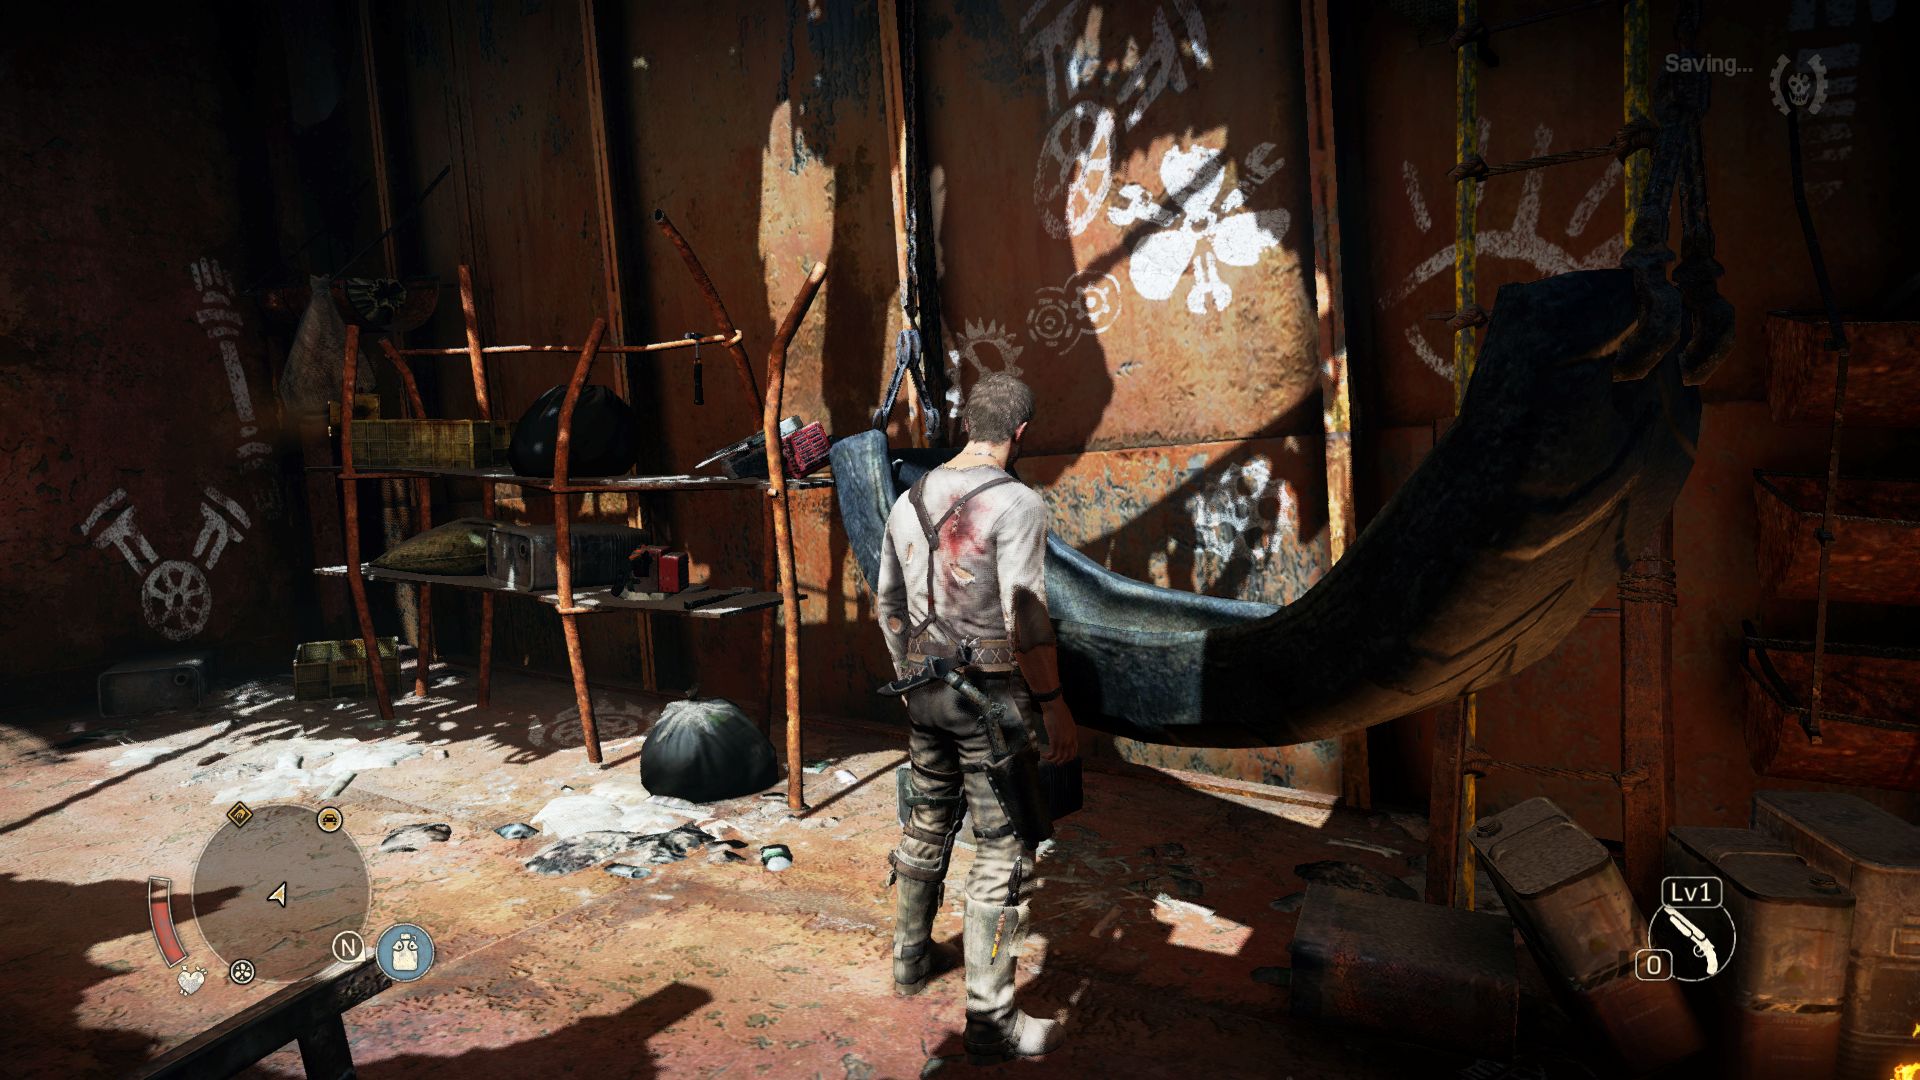
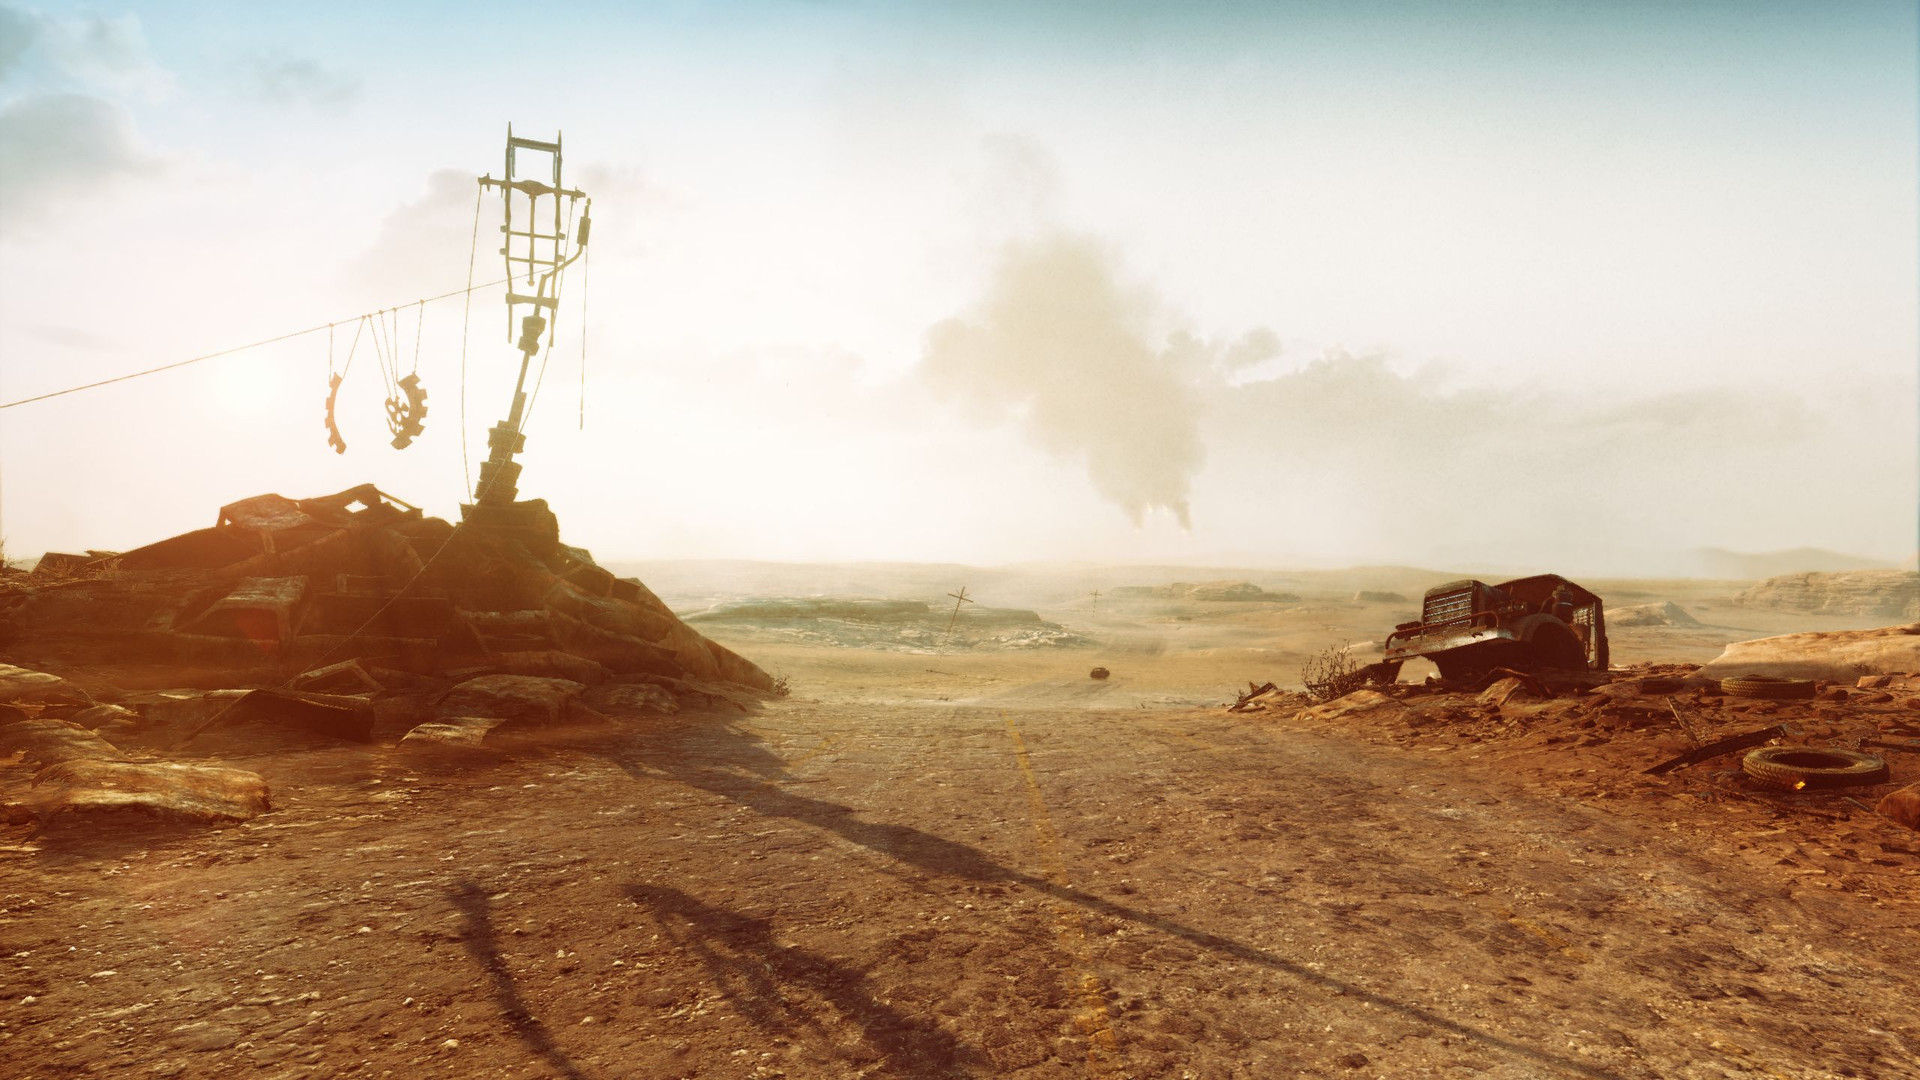
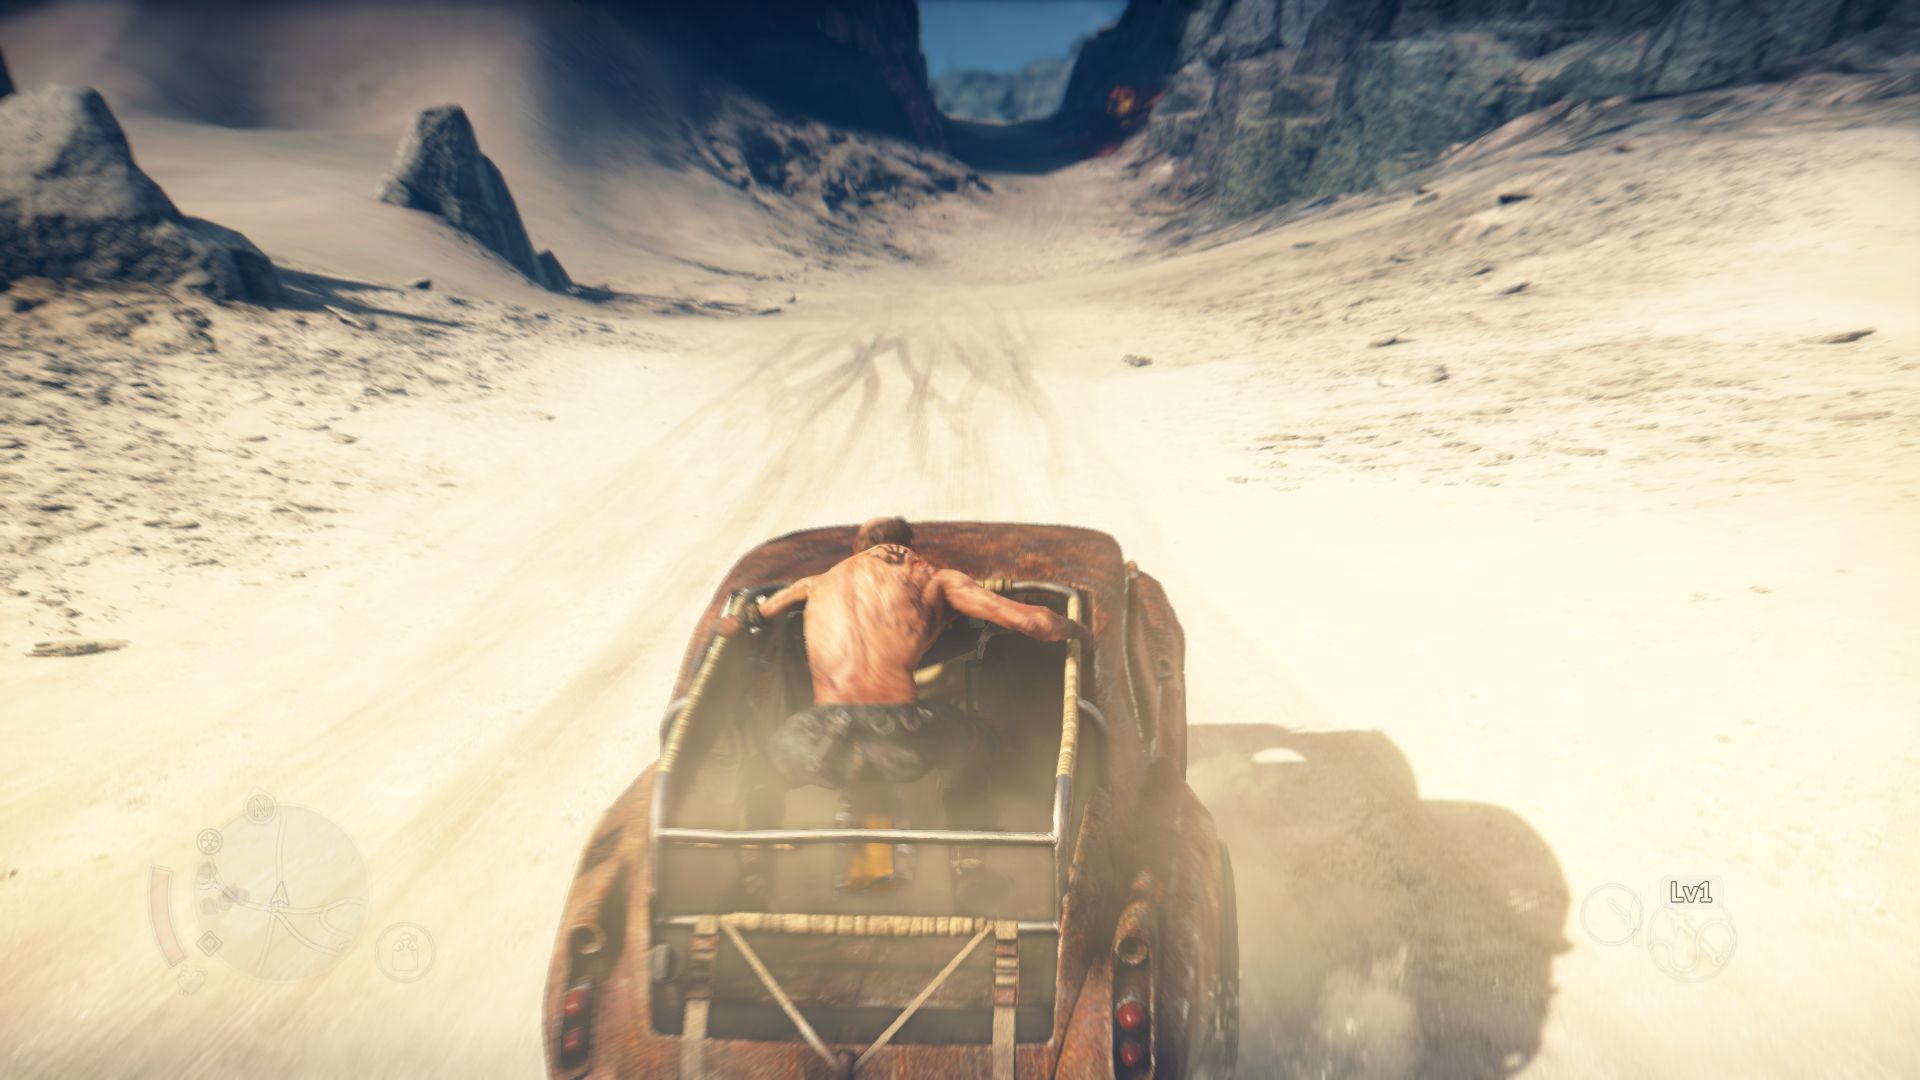
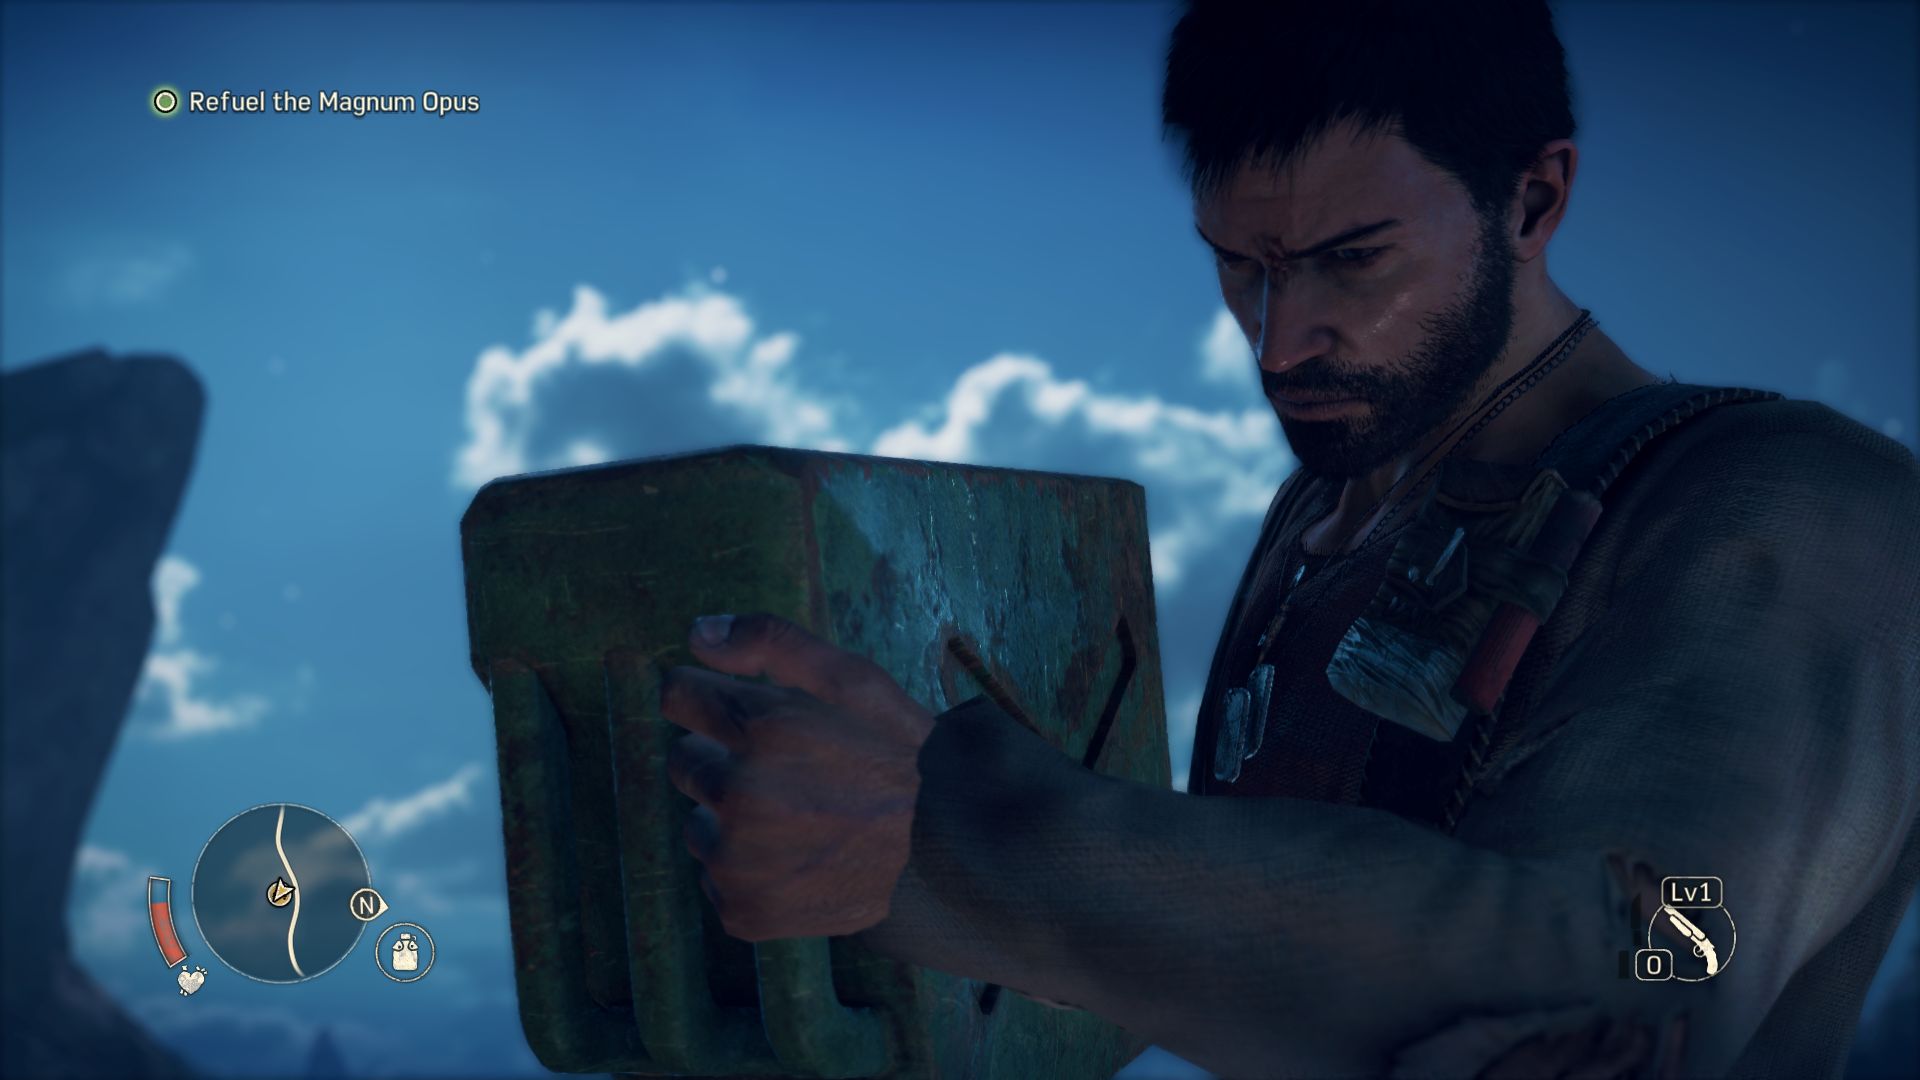
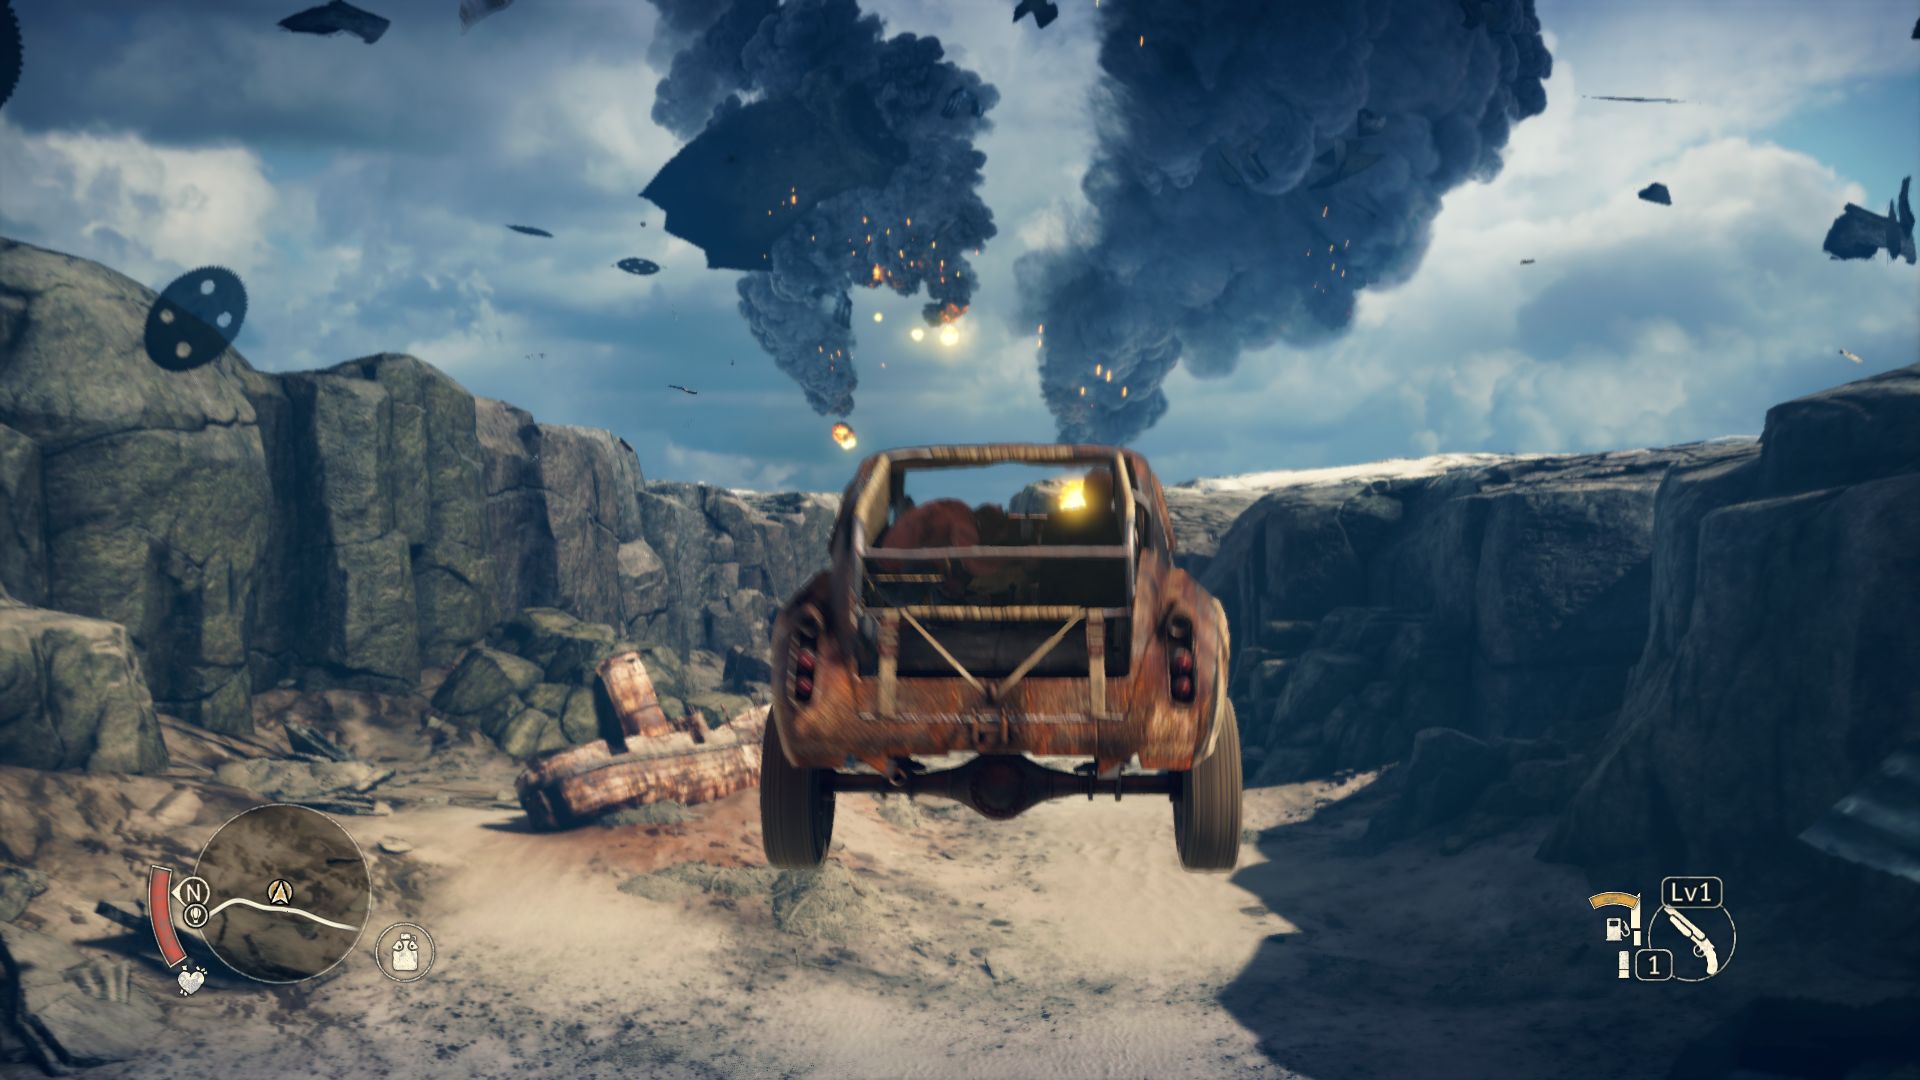
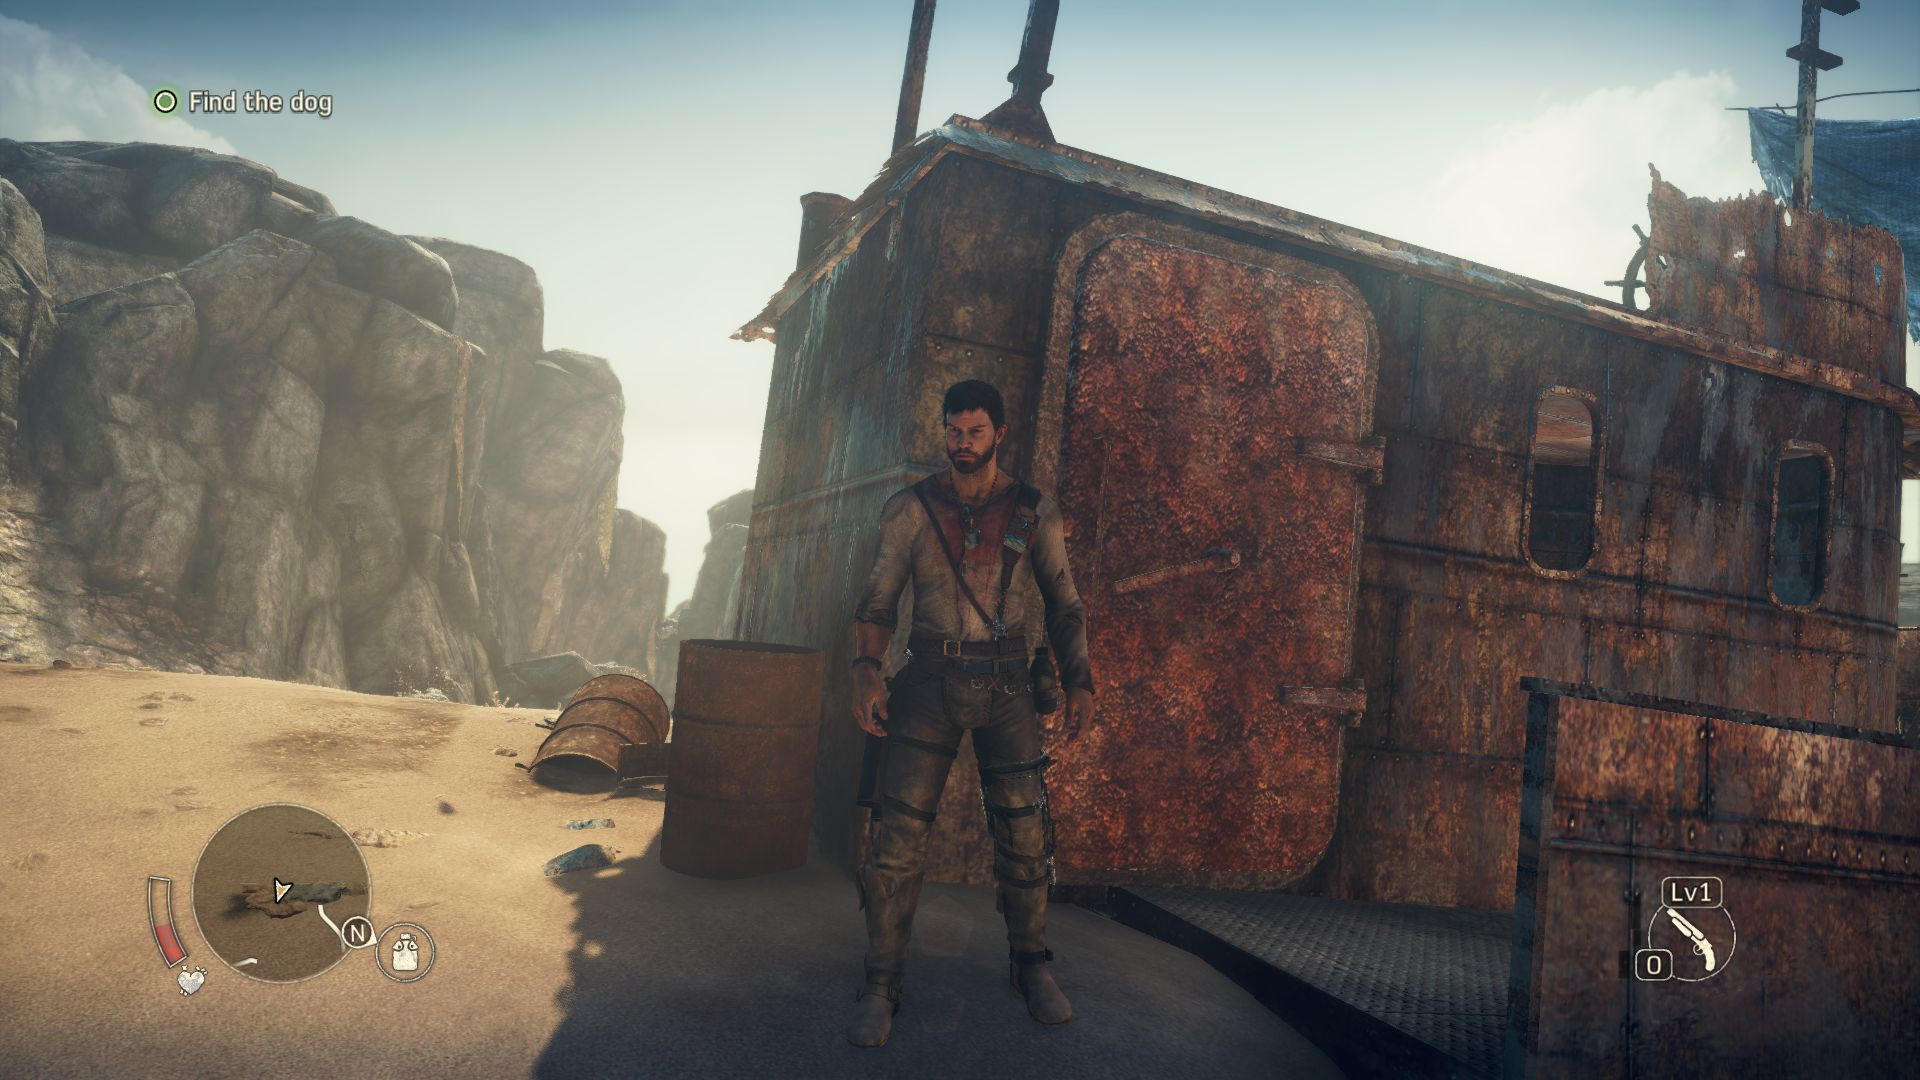
The developers deserve praise for the action and physics effects. Some should be improved, like flames, but overall the effects are very good and make the fights entertaining. Most gamers will keep playing simply due to the beautiful car explosions. The dust and smoke particles, which are created when racing through the landscape, are well done. Sadly, the texture quality of Mad Max is not great. A closer look reveals that many surfaces are blurry. Also, it cannot match the object density of GTA V or Far Cry 4.

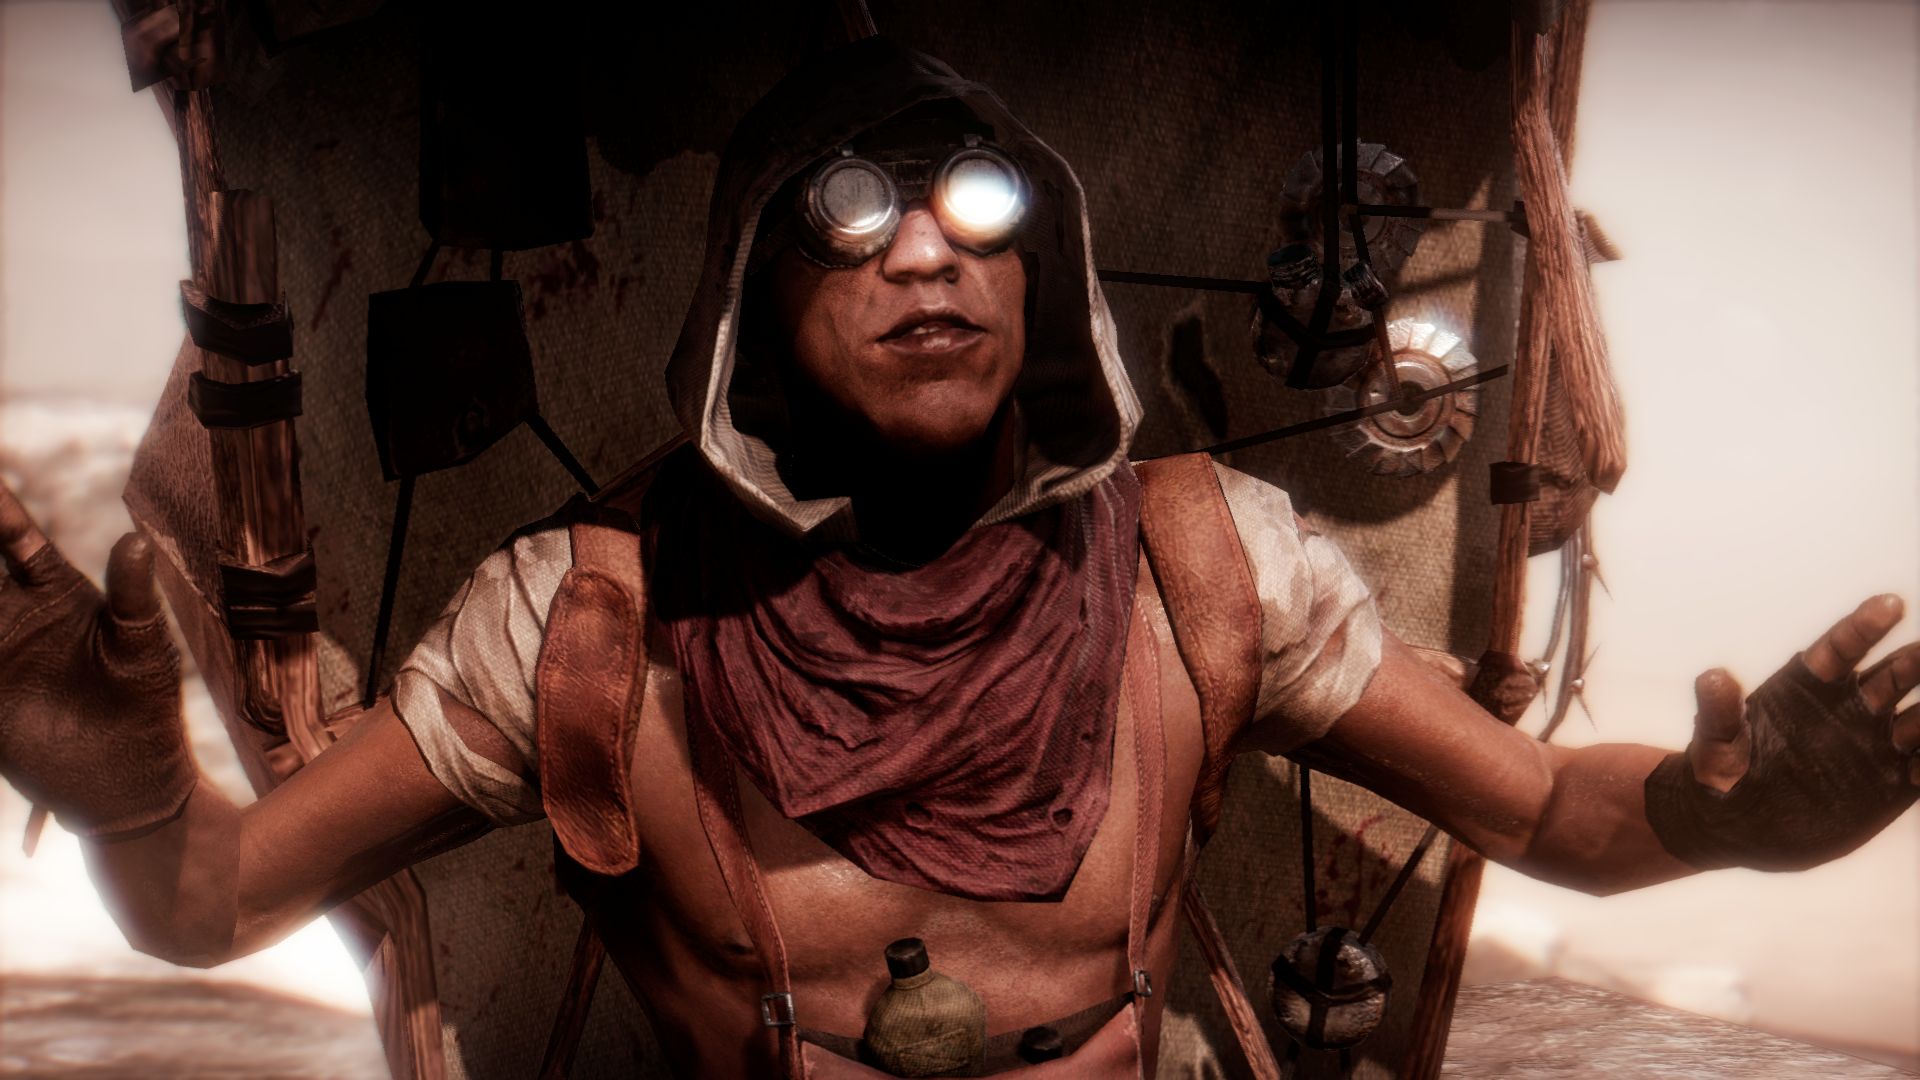
As shown by our benchmarks, the hardware requirements are modest. If the performance is decent, the game will run fluidly. Thanks to the comprehensive tutorial, precise controls and good mechanics, the game quickly immerses players into the environment. The speech quality is a bit poor, which makes the characters sound rather unenthusiastic in the original English audio.

The story is not the focus of this game and can be considered a side dish. Despite fantastic gameplay, Mad Max feels repetitive, as the missions are always quite similar (destroy x, find y, conquer z, etc...). In short: we would have preferred a smaller, yet more detailed world.

Settings

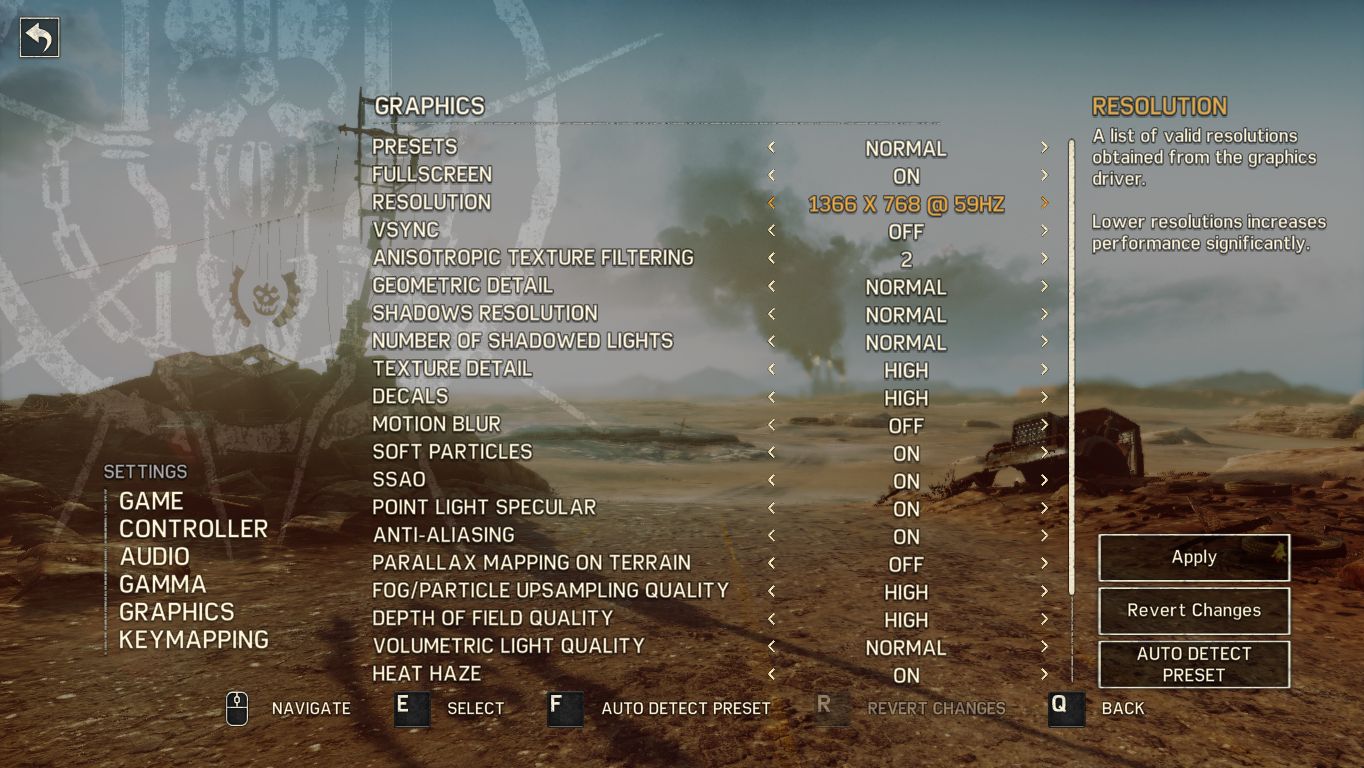
Avalanche Studios deserves praise for its extensive graphics menu: a total of 22 settings. Sadly we found a few problems with these settings. Problem 1: if the keyboard is used to navigate the menu, some options will have to be selected by pressing the "E" key before they can be changed. Problem 2: after confirming the changes by pressing the E key again, the user has to click on "Apply" to implement the new settings. Otherwise, the settings will revert back to the old ones. Problem 3: Mad Max sometimes reduces the Hz frequency of the resolution by itself, but this only affects the menu and will not noticeably affect the gameplay.

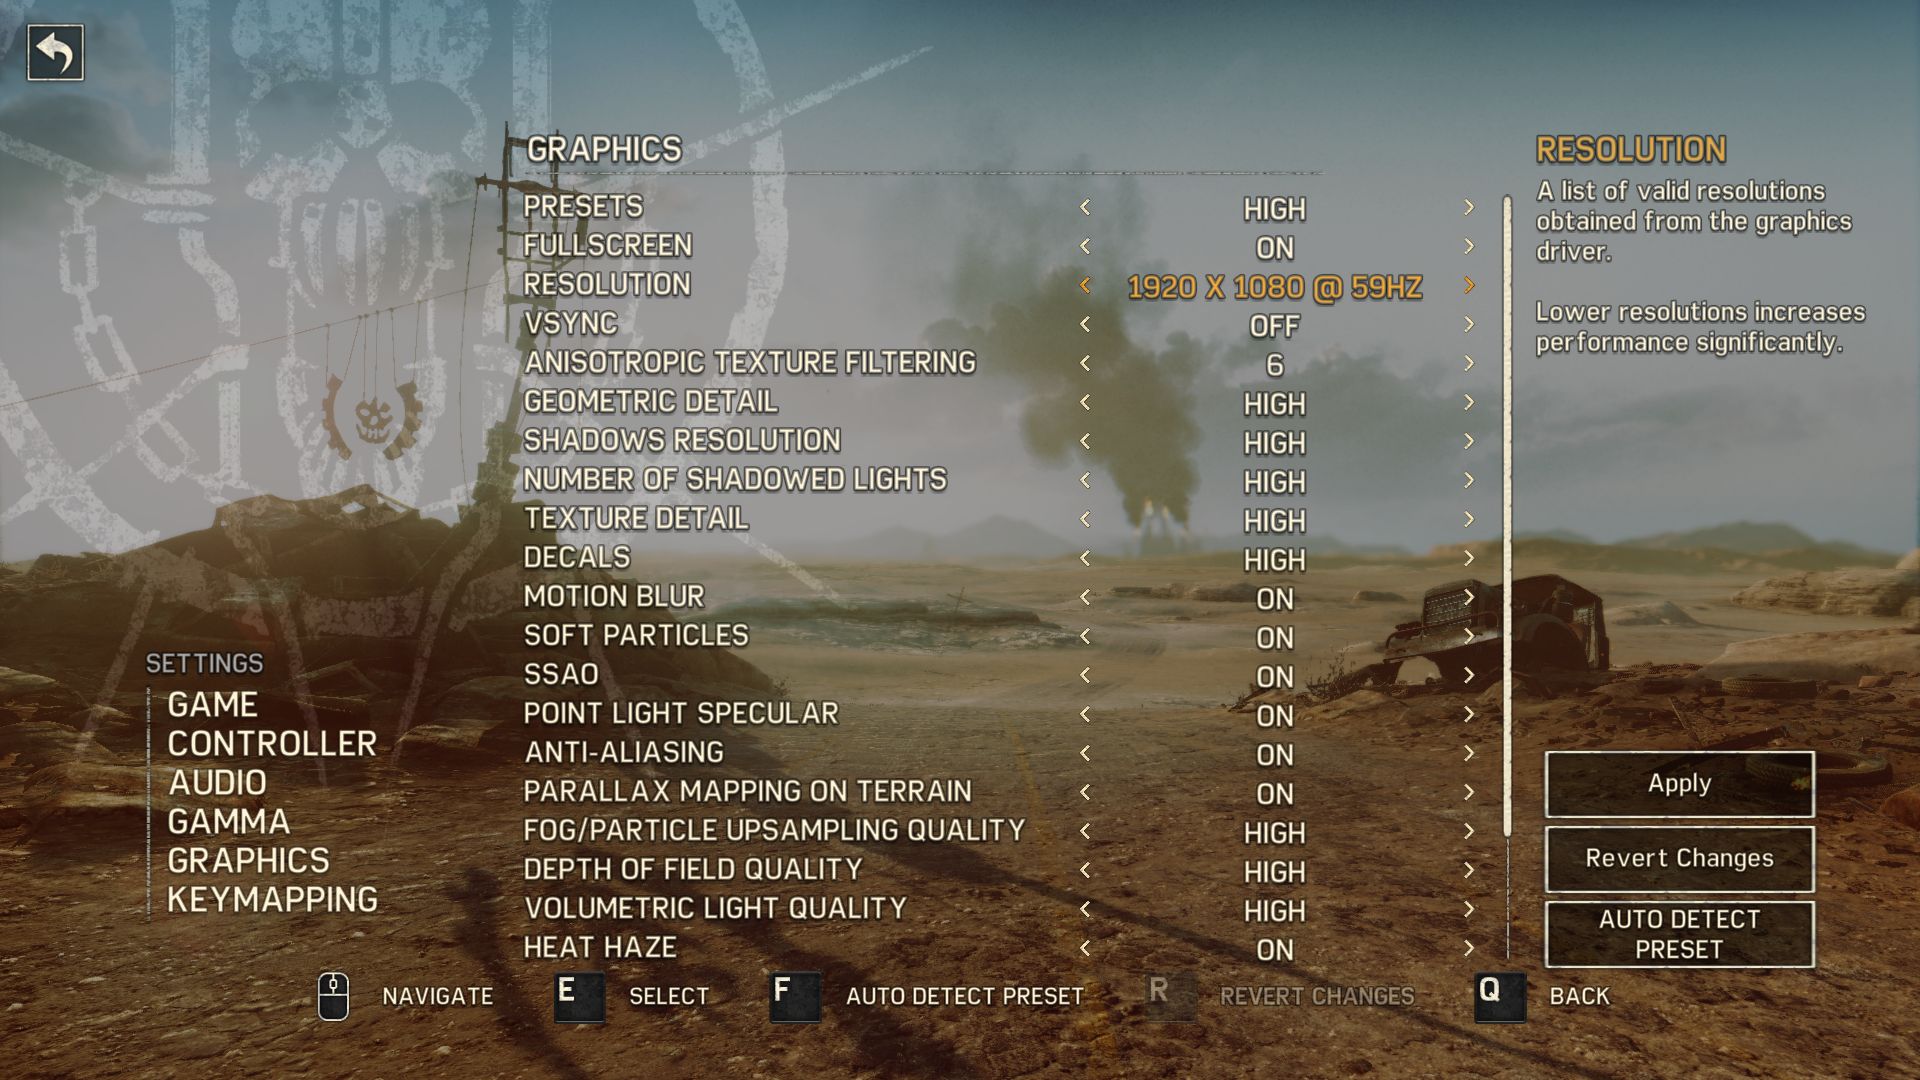
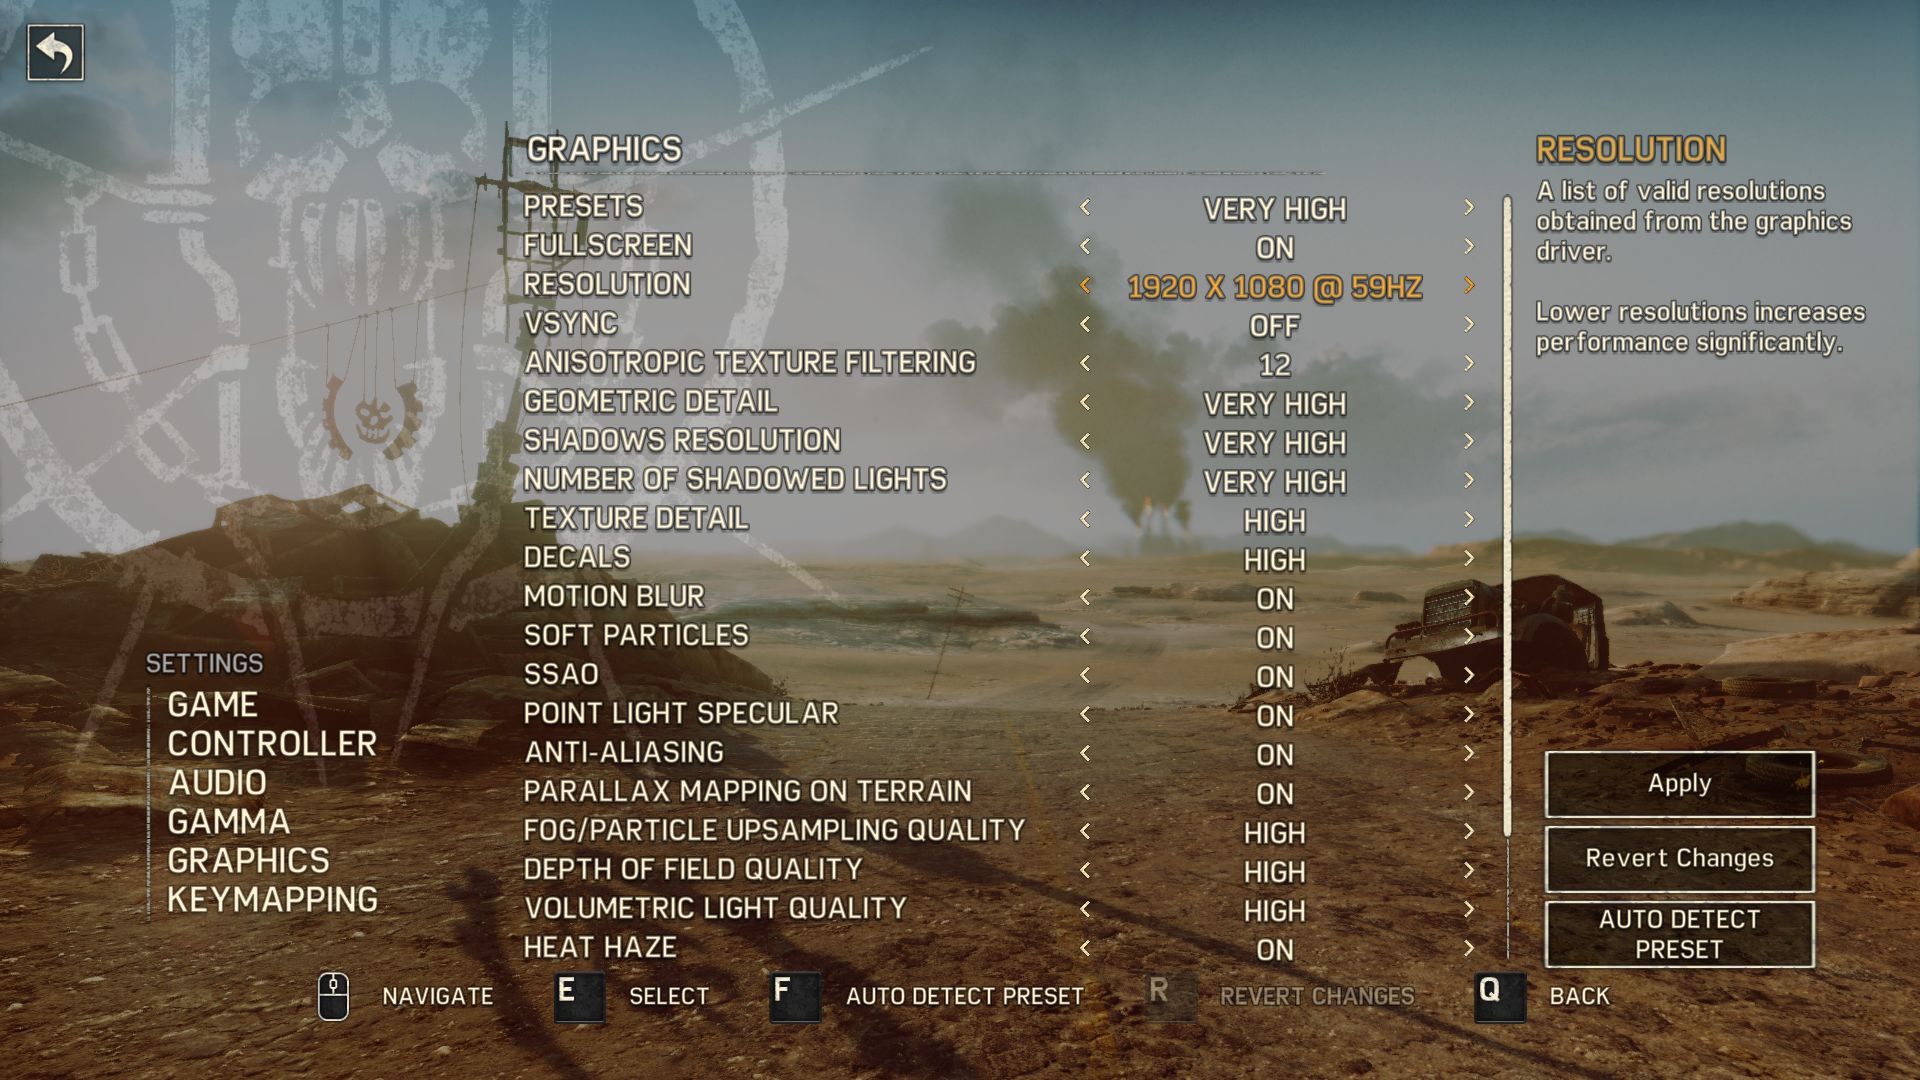
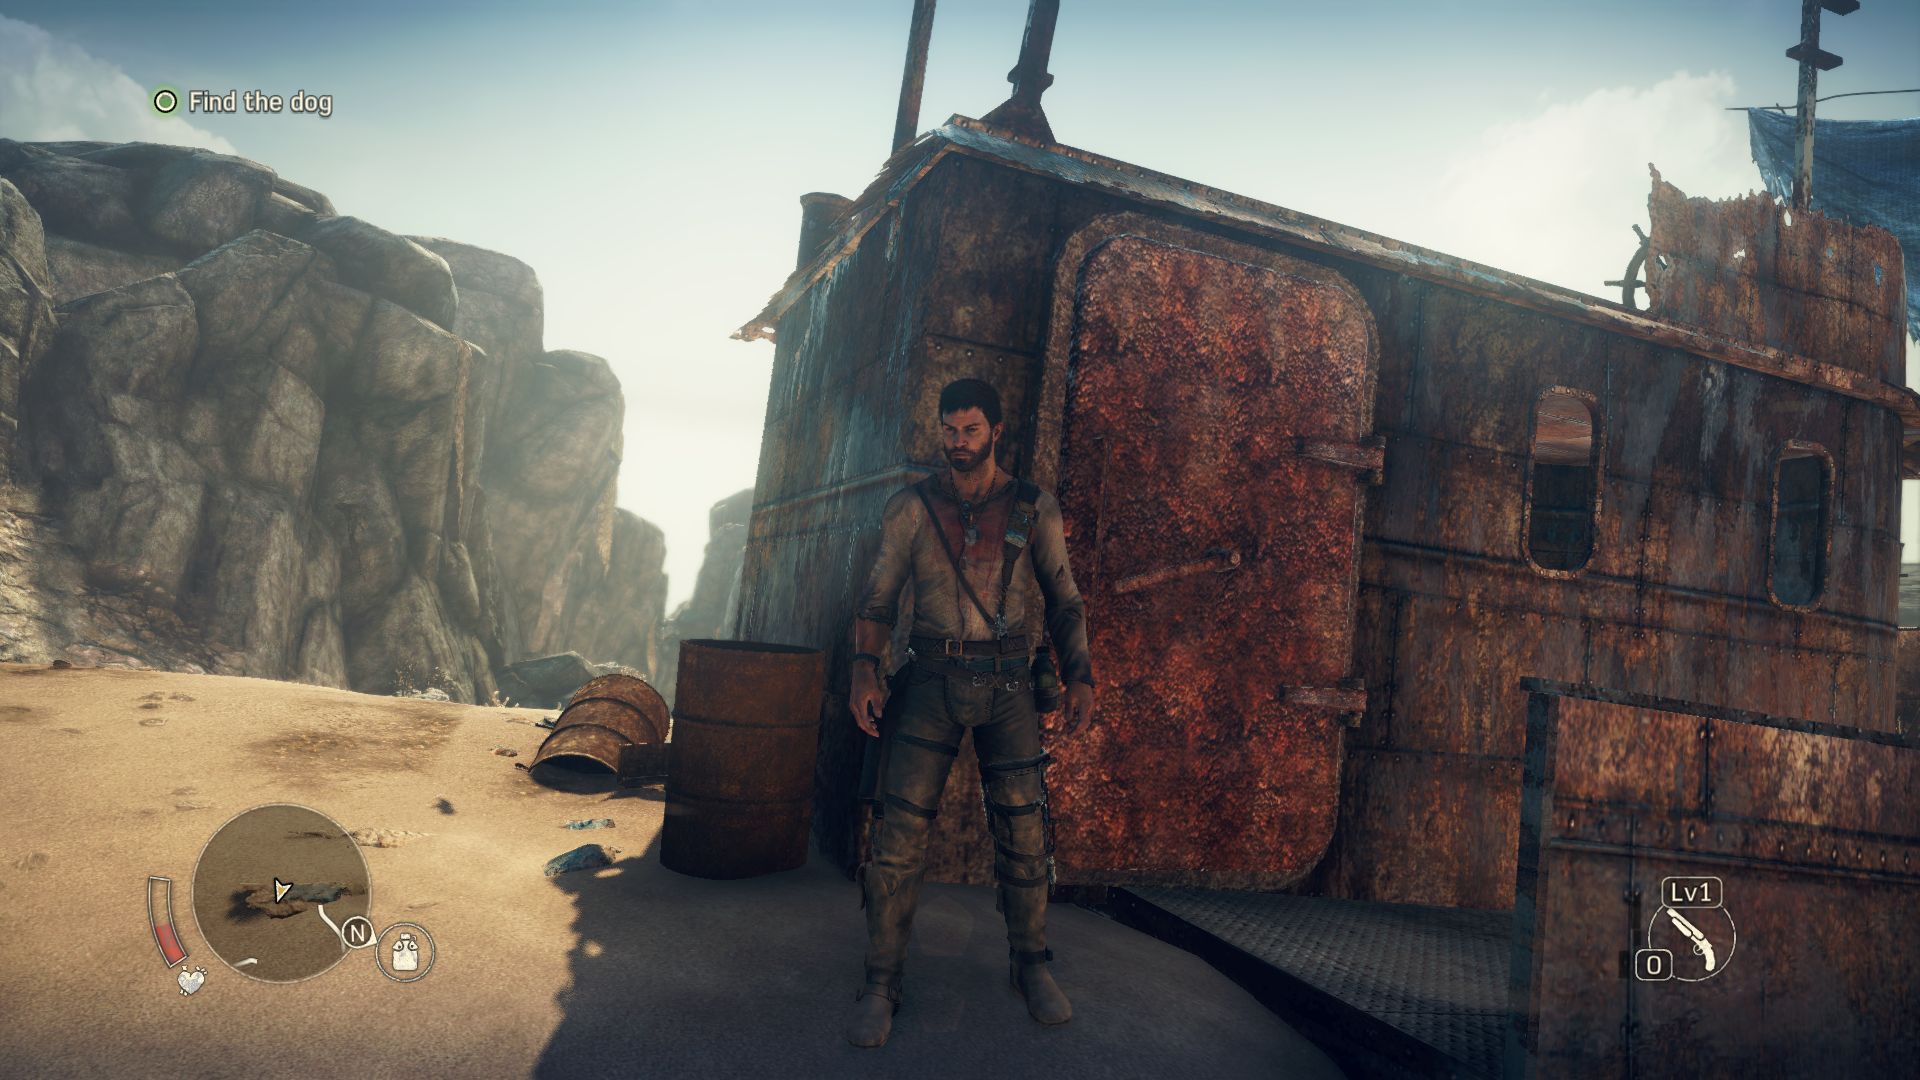
Furthermore, the studio has included very different settings: sometimes the settings offer levels from "Off" to "Max" and sometimes they offer "Normal" to "High". The available presets only cover medium to high settings. If you want to play at minimum or maximum settings, you have to turn every option off/on in the menu by yourself. To avoid mistakes, we chose the 3 presets available for our tests. Annoying: the integrated Anti-Aliasing feature (probably FXAA) does not do a good job. Skewed borders and some objects tend to flicker a lot on levels.

Normal Preset @HD
Normal Preset @HD
High Preset @FHD
High Preset @FHD
Very High Preset @FHD
High Preset @4K
High Preset @4K
Normal Preset @HD
Normal Preset @HD
High Preset @FHD
High Preset @FHD
Very High Preset @FHD
High Preset @4K
High Preset @4K

Benchmark

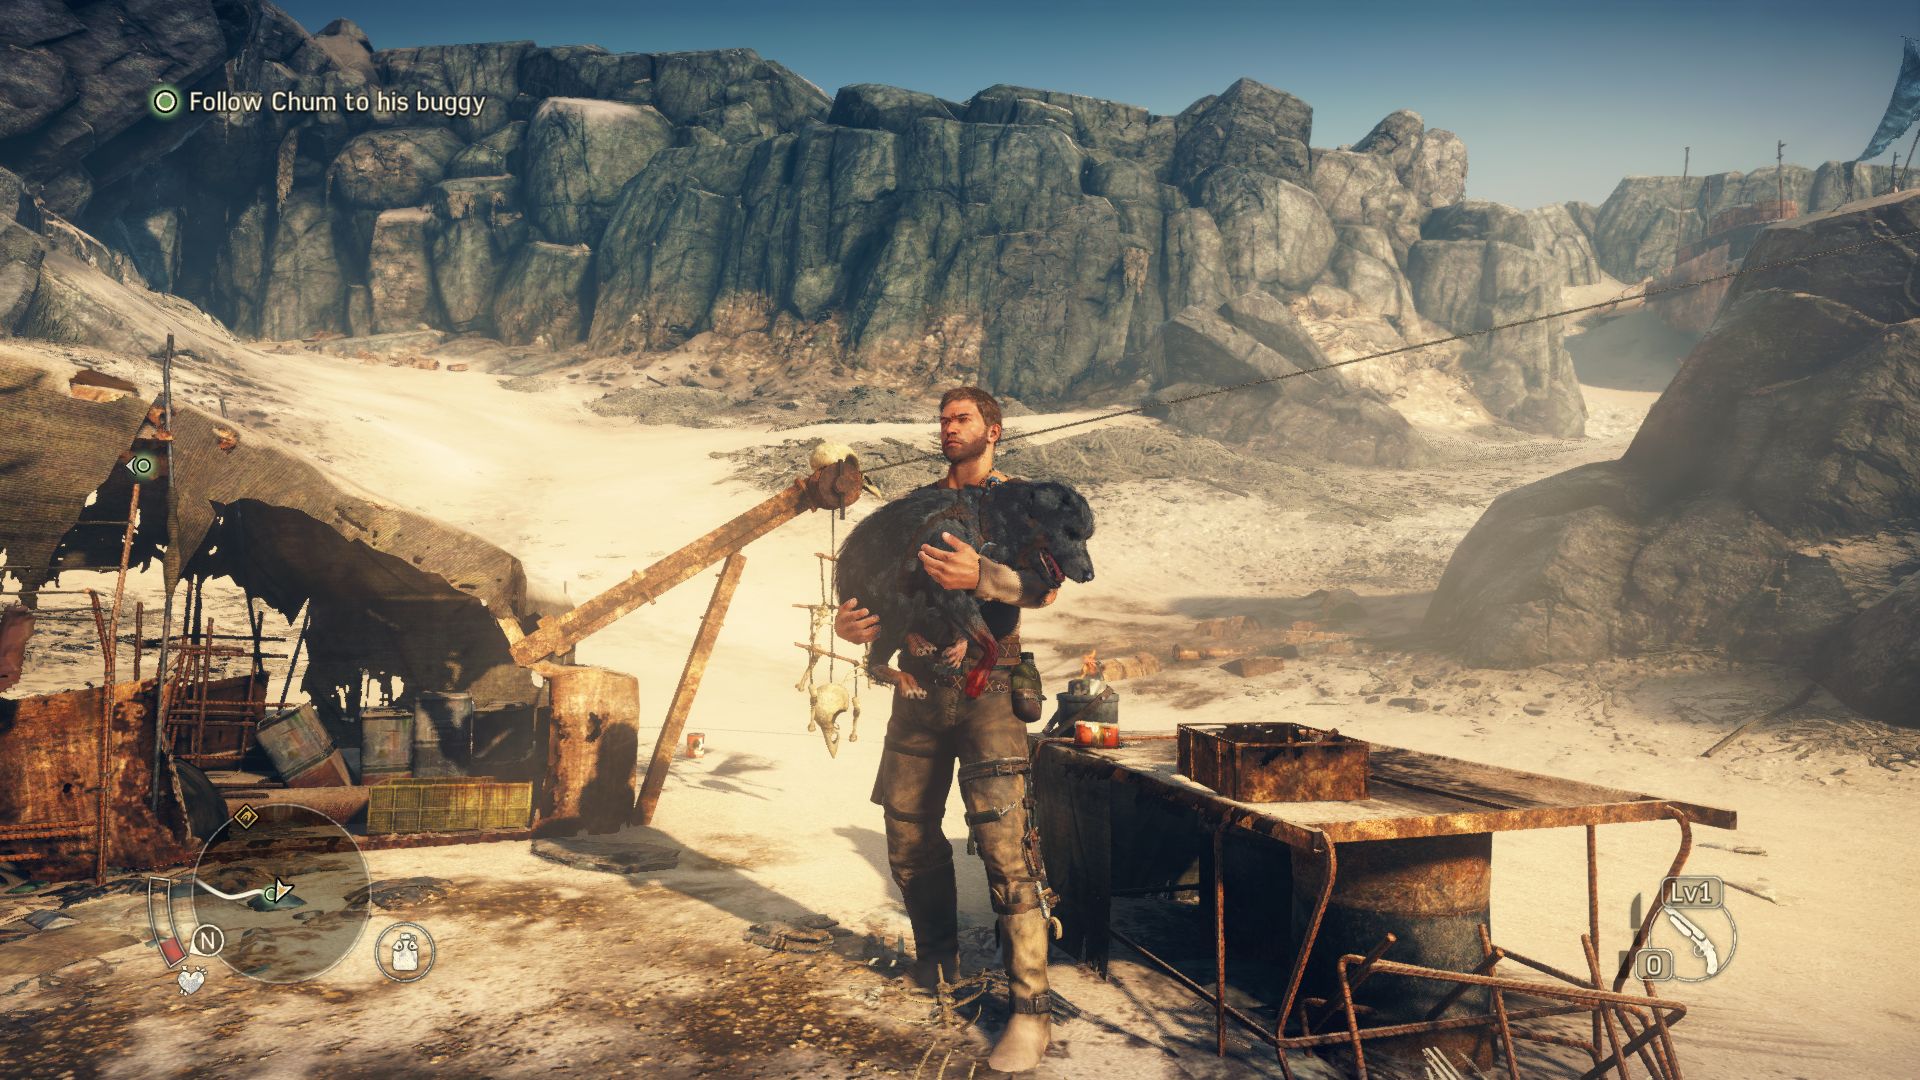
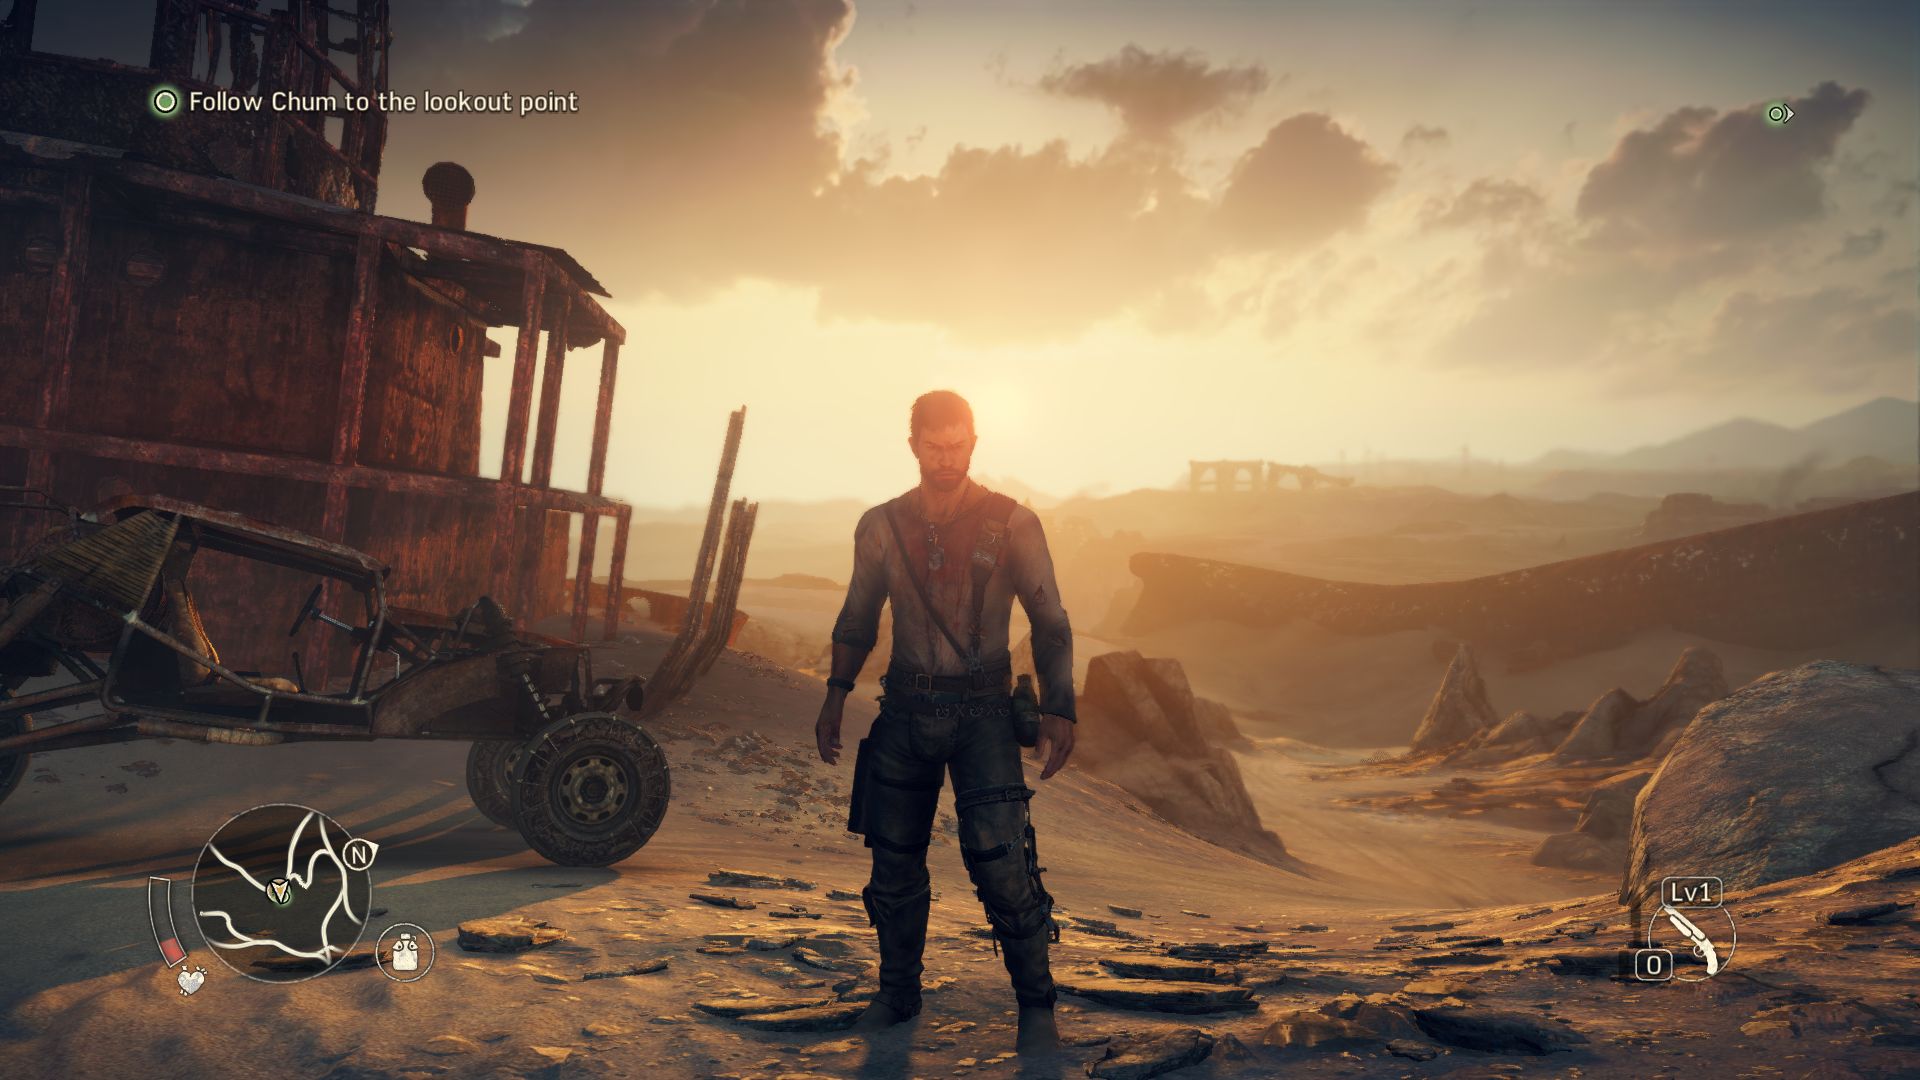
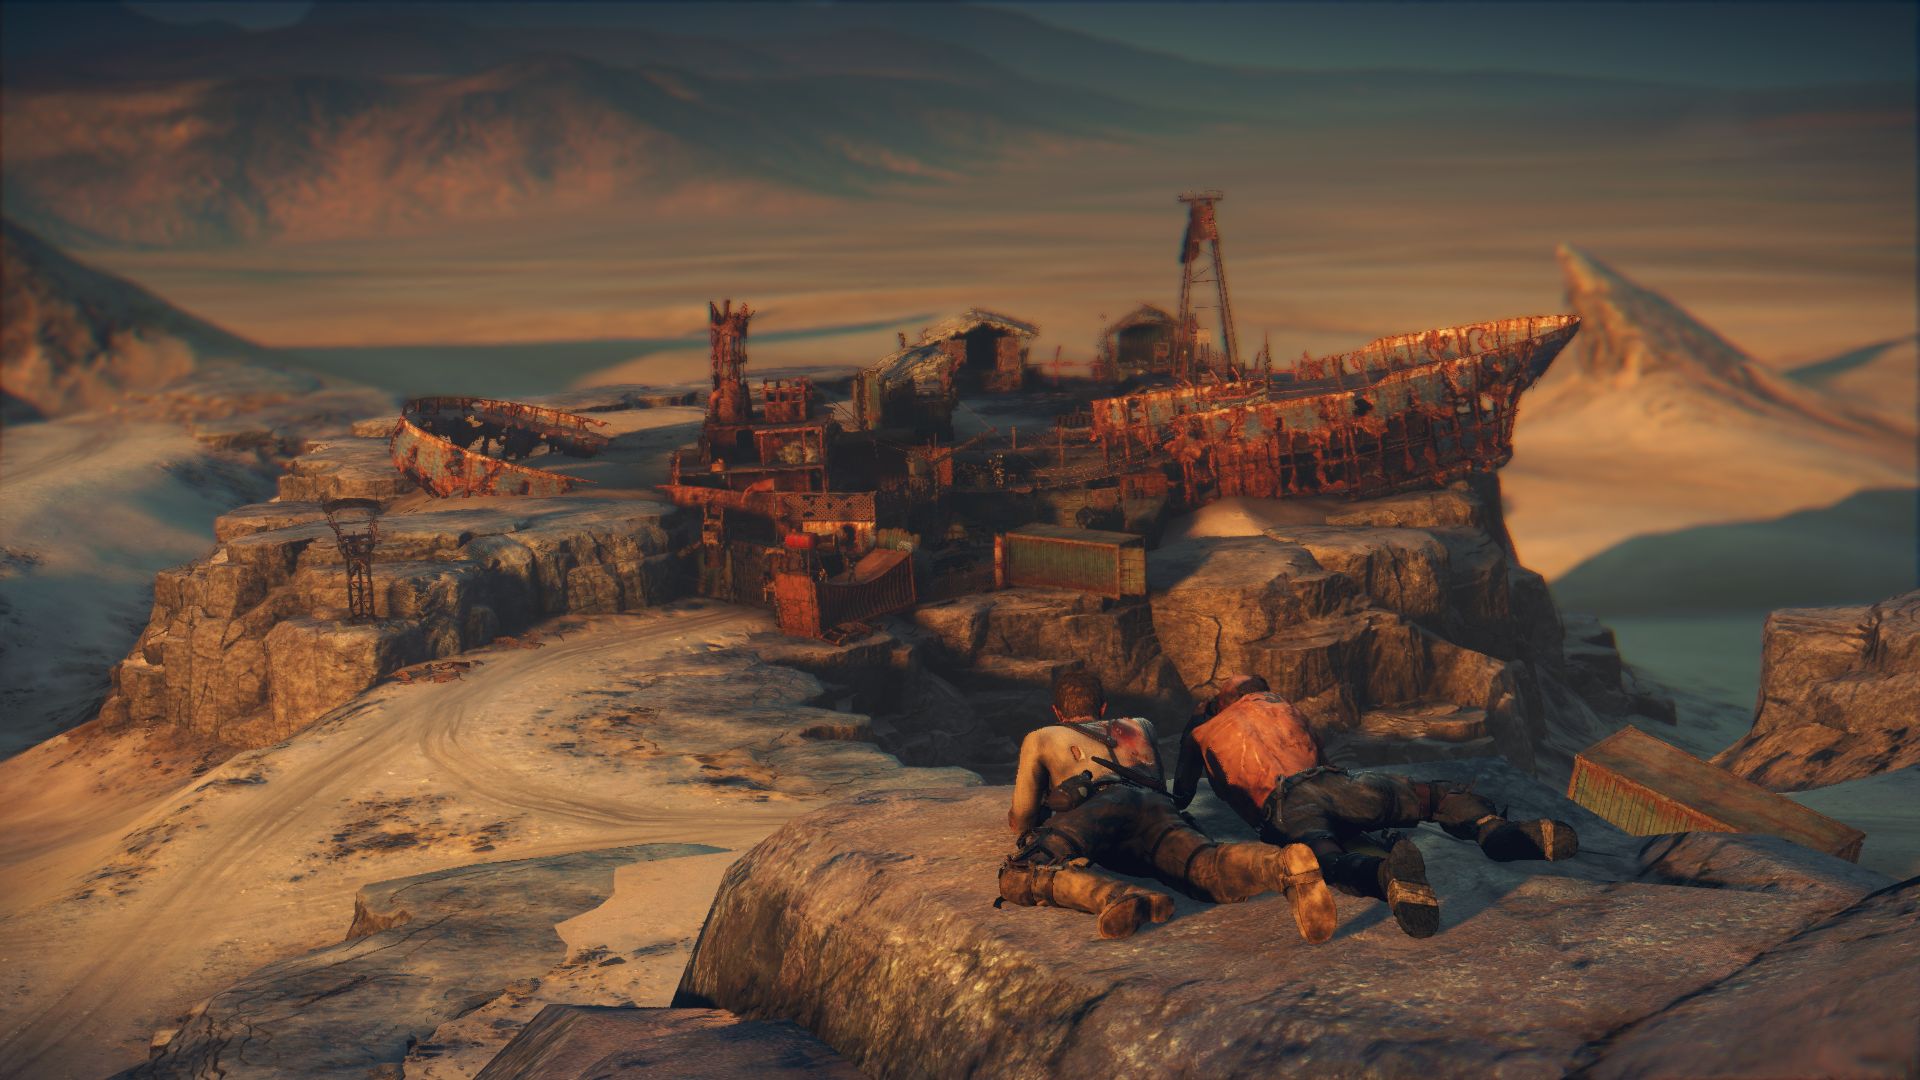
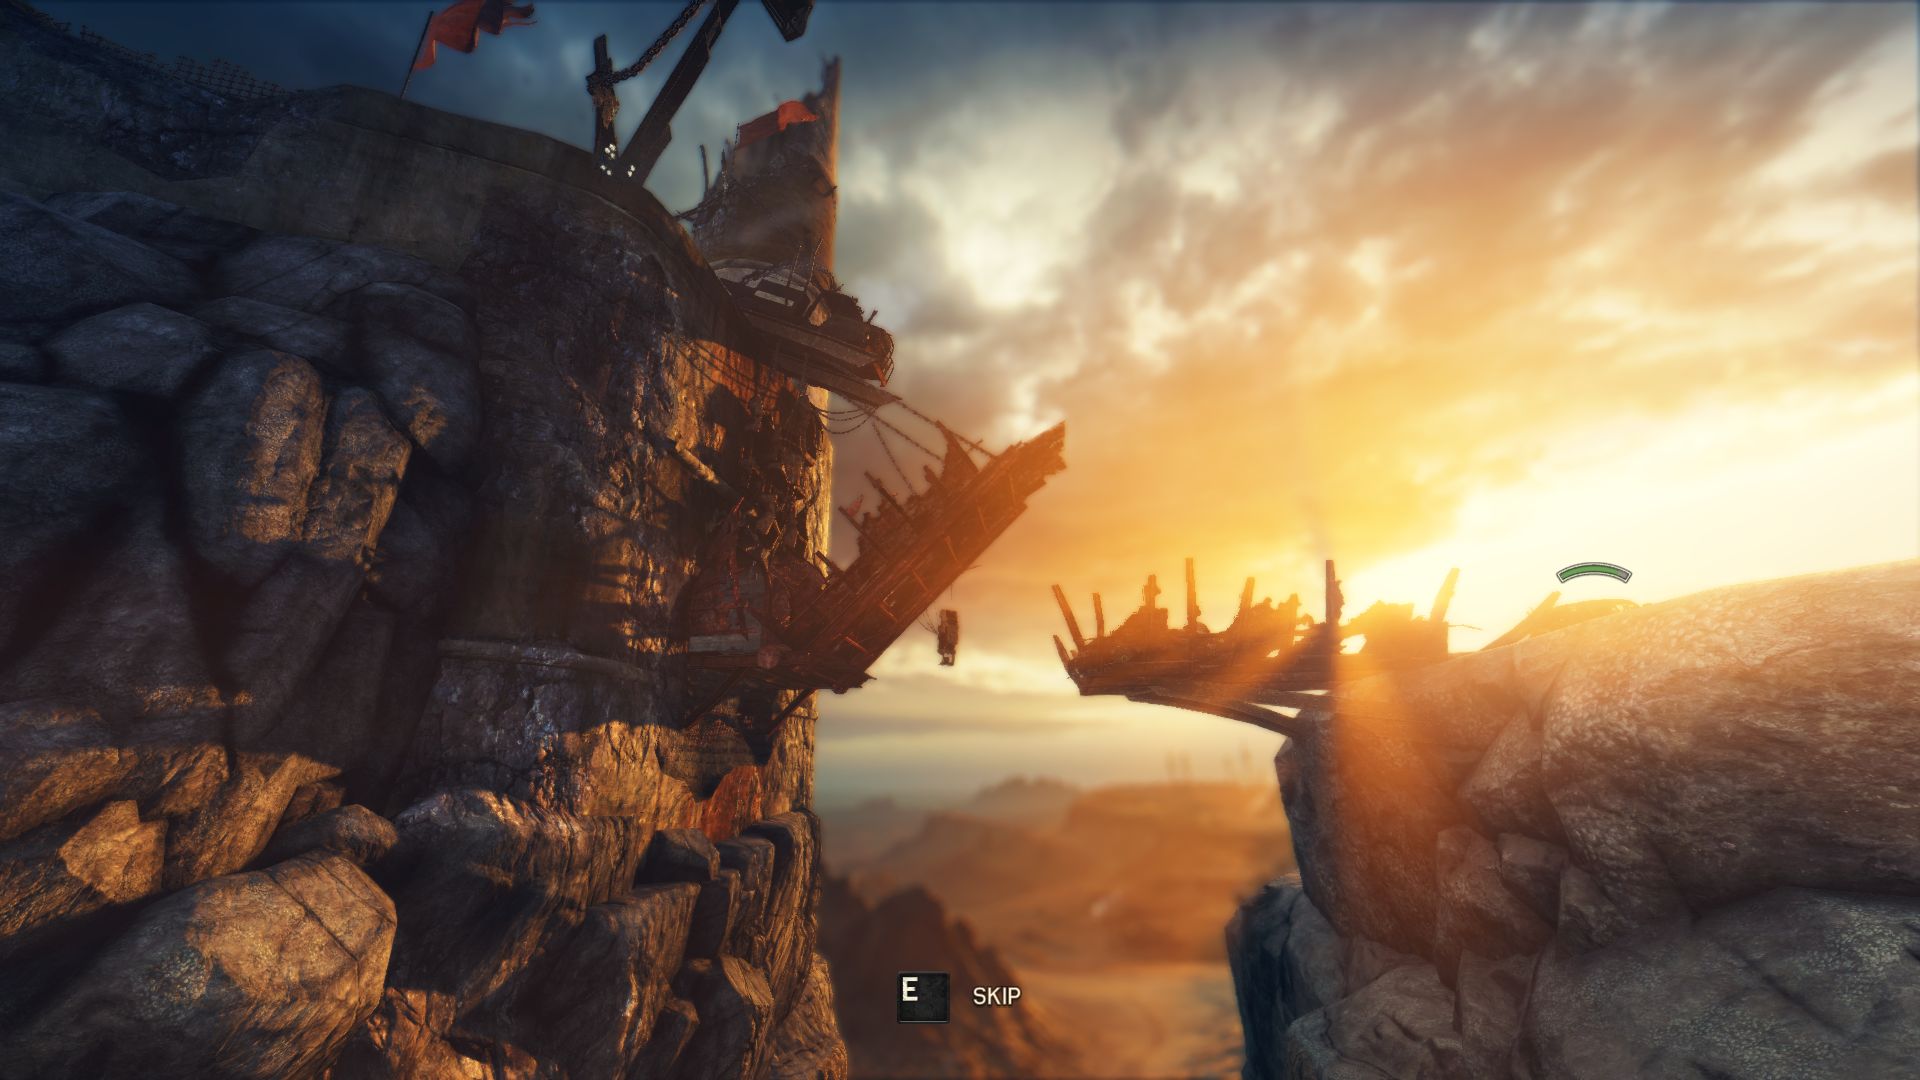
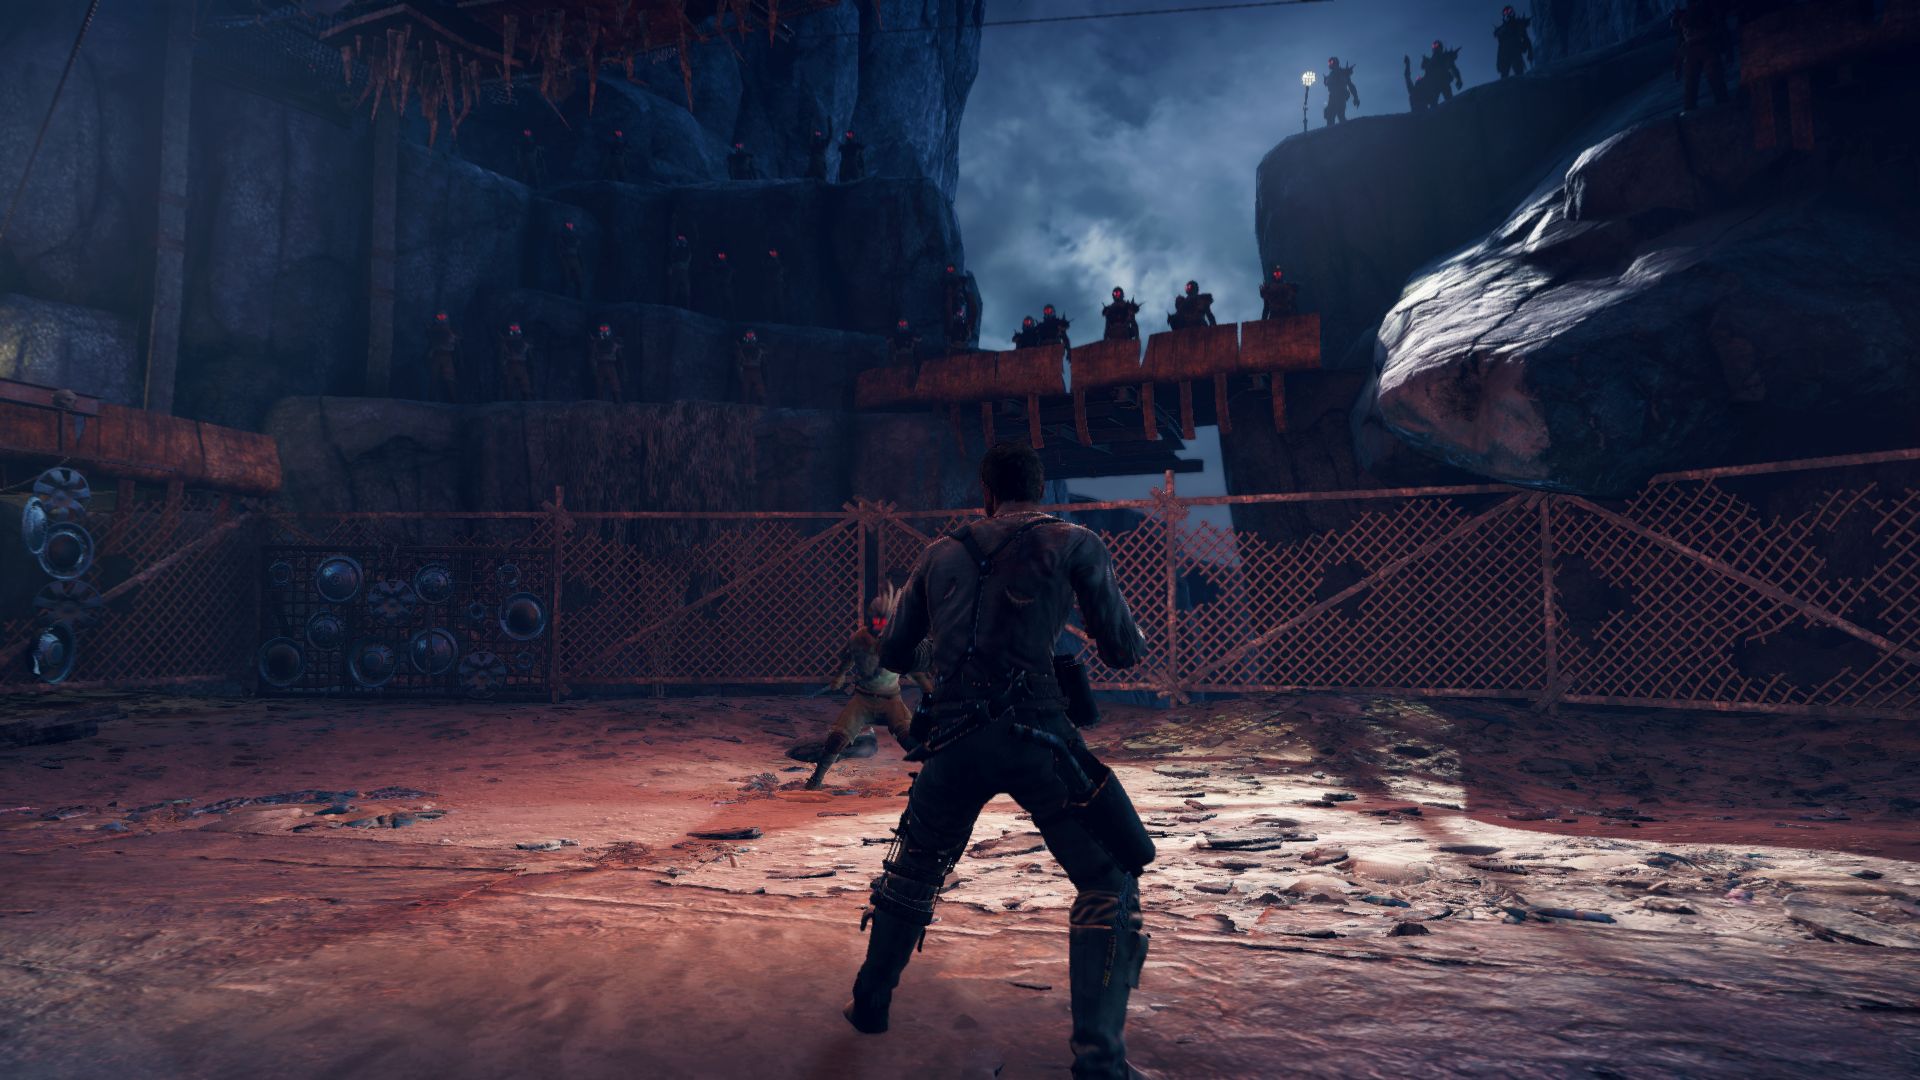
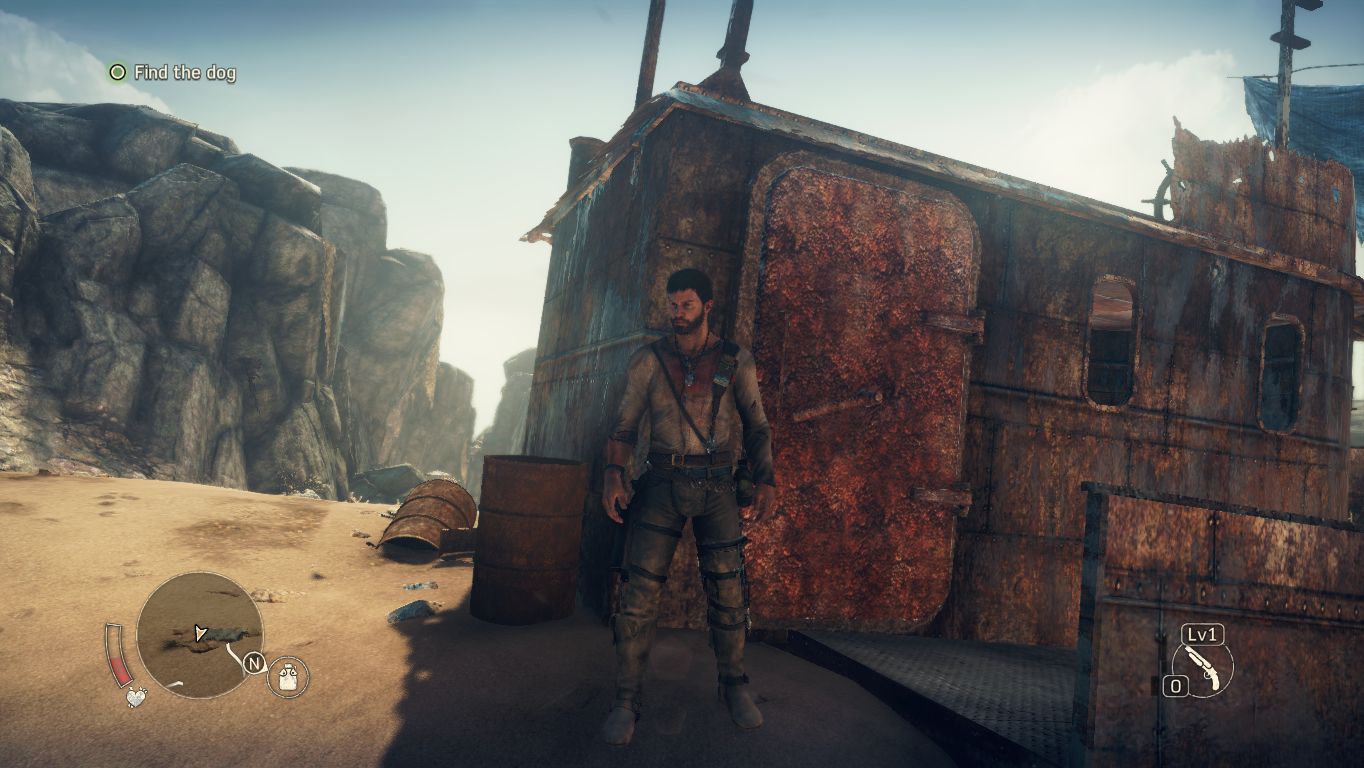
Mad Max overwrites saves without asking when certain checkpoints are reached. As such, finding an appropriate benchmark sequence was quite hard. We chose "Jeet's Stronghold" in the end as it can be unlocked in the first hour of play.

The active quest "Drive to Dead Barrens" leads us through a desolate street in bleak desert. You can see the start and end of our benchmark sequence in the video below. The frame rate of the benchmark is average. In short: there are times when its runs smoothly and then there are times when everything stutters. Due to the fast game pace, we recommend a minimum of 35 fps.

Results

Thanks to the relatively low hardware requirements, weak systems can run Mad Max decently (Metal Gear Solid V is not as kind). At 1024x768 pixels and minimum details, we could run the game at 38 fps on the entry-level HD Graphics 4600 IGP. A multimedia notebook with a GeForce GT 750M or higher is necessary for a resolution of 1366x768 pixels and the preset "Normal." With a resolution of 1920x1080 pixels and the preset "High," the gamer would need a GeForce GTX 850M or better.

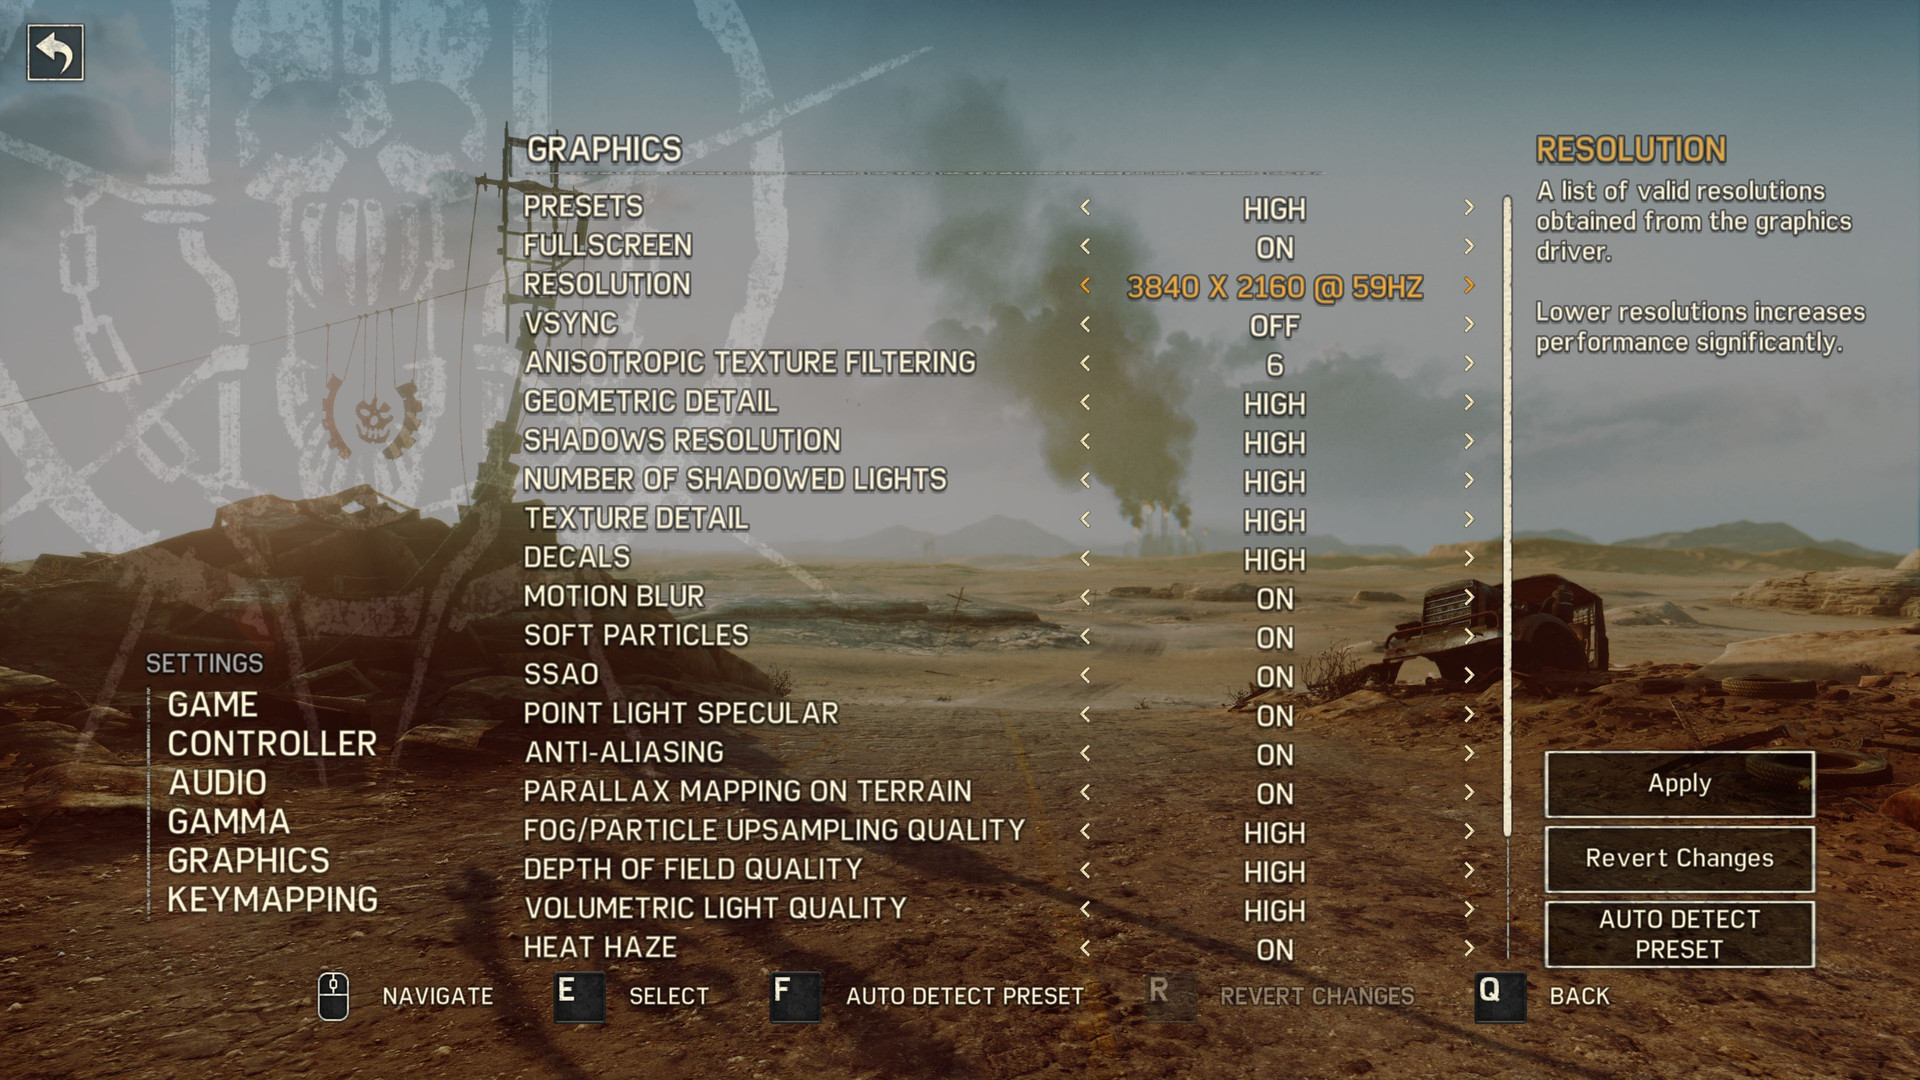
A combination of FHD and max details only runs on true gaming giants, like the GeForce GTX 960M. The performance difference between the "Very High" preset and max settings is not very large. Switching to max settings from the "Very High" preset dropped the frame rate from 56.2 to 48.8 fps on the GeForce GTX 870M (around 13%). Owners of a 4K display will not be happy playing this game on a notebook, as even the GeForce GTX 980M lacks the power to deliver a smooth experience on high details and a resolution of 3840x2160 pixels. The desktop counterpart, the GeForce GTX 980, can deliver 46.6 fps.

Note: AMD GPU performances will be added in the next few days.

Mad Max
    3840x2160 High Preset AF:6x     1920x1080 Very High Preset AF:12x     1920x1080 High Preset AF:6x     1366x768 Normal Preset AF:2x
NVIDIA GeForce GTX 980, 3770K
Desktop-PC
46.6 (43min) fps ∼28%
138.3 (122min) fps ∼53%
140.5 (127min) fps ∼53%
225.6 (176min) fps ∼60%
AMD Radeon R9 290X, 4790K
Sapphire Radeon R9 290X Tri-X OC
47.3 (44min) fps ∼28%
119 (103min) fps ∼45%
138 (89min) fps ∼52%
240 (197min) fps ∼64%
NVIDIA GeForce GTX 980M, 4700MQ
Schenker W504
33 (28min) fps ∼20%
97.9 (75min) fps ∼37%
107.7 (88min) fps ∼41%
189.6 (155min) fps ∼51%
NVIDIA GeForce GTX 970M, 4700MQ
Schenker W504
26 (21min) fps ∼15%
77.9 (64min) fps ∼30%
84.2 (69min) fps ∼32%
169.1 (148min) fps ∼45%
NVIDIA GeForce GTX 880M, 4700MQ
Schenker W504
24.1 (21min) fps ∼14%
67.9 (59min) fps ∼26%
76.6 (68min) fps ∼29%
145.3 (126min) fps ∼39%
NVIDIA GeForce GTX 950, 3770K
Desktop-PC
21.4 (19min) fps ∼13%
64.9 (59min) fps ∼25%
69.6 (64min) fps ∼26%
140.5 (126min) fps ∼37%
NVIDIA GeForce GTX 870M, 4700MQ
Schenker W504
19 (17min) fps ∼11%
56.2 (48min) fps ∼21%
62 (52min) fps ∼23%
122 (105min) fps ∼33%
NVIDIA GeForce GTX 960M, 4720HQ
Schenker XMG A505
14.9 (13min) fps ∼9%
45.6 (41min) fps ∼17%
49.3 (44min) fps ∼19%
98.5 (88min) fps ∼26%
NVIDIA GeForce GTX 850M, 4340M
Schenker M504
11.3 (9min) fps ∼7%
35.6 (30min) fps ∼14%
38.7 (34min) fps ∼15%
78.2 (68min) fps ∼21%
NVIDIA GeForce GTX 860M, 4700MQ
Schenker W504
10.2 (9min) fps ∼6%
29.6 (26min) fps ∼11%
34.1 (30min) fps ∼13%
64.6 (58min) fps ∼17%
NVIDIA GeForce GT 750M, 4702MQ
Schenker M503
17.8 (14min) fps ∼7%
19.6 (16min) fps ∼7%
39.3 (32min) fps ∼10%
AMD Radeon R7 512 Cores (Kaveri Desktop), A10-7850K
A10-7850K Asus A88-XM-PLUS
18.2 (16min) fps ∼7%
35.9 (32min) fps ∼10%
Intel Iris Pro Graphics 5200, 4750HQ
SCHENKER S413
14 (10min) fps ∼5%
31 (24min) fps ∼8%
NVIDIA GeForce GT 640M, 2637M
Acer Aspire M3-581TG
15.6 (12min) fps ∼6%
31.6 (23min) fps ∼8%
NVIDIA GeForce GT 740M, 4200M
HP Envy 15-j011sg
11.2 (9min) fps ∼4%
11.9 (10min) fps ∼4%
26.9 (24min) fps ∼7%
NVIDIA GeForce GT 720M, 4200M
MSI CX61-i572M
4.8 (0min) fps ∼2%
9.1 (0min) fps ∼3%
20.2 (0min) fps ∼5%
NVIDIA GeForce GT 630M, 3720QM
Asus N56VM
20.2 (17min) fps ∼5%
Intel Iris Graphics 5100, 4258U
Apple MacBook Pro Retina 13 inch 2013-10
18.7 (14min) fps ∼5%
Intel HD Graphics 5500, 5010U
Intel NUC Kit NUC5i3RYH
7.4 (6min) fps ∼3%
8.3 (7min) fps ∼3%
18 (15min) fps ∼5%
Intel HD Graphics 4600, 4700MQ
Schenker W504
7.2 (3min) fps ∼3%
8.3 (4min) fps ∼3%
19.2 (15min) fps ∼5%

Test Systems

Four of our test models are from Schenker Technologies (mysn.de):

  • W504 (Core i7-4700MQ, 8 GB DDR3, GeForce GTX 860M, GTX 870M, GTX 880M, GTX 970M, GTX 980M)
  • A505 (Core i7-4720HQ, 8 GB DDR3, GeForce GTX 960M)
  • M504 (Core i5-4340M, 8 GB DDR3, GeForce GTX 850M)
  • M503 (Core i7-4702MQ, 8 GB DDR3, GeForce GT 750M)

Three notebooks were provided by Nvidia:

Intel provided one more:

  • Schenker S413 (Core i7-4750HQ, 8 GB DDR3, Iris Pro Graphics 5200)

The desktop PC uses CPUs/APUs from Intel and AMD, SSDs from Micron, Intel and Samsung, motherboards from Intel and Asus as well as graphics cards from Nvidia, PNY and AMD. For the 4K monitor, we use the Asus PB287Q.

GPU drivers used: Nvidia 355.82, AMD 15.8 Beta, Intel 10.18.14.4264 (Win 7) and 10.18.15.4256 (Win 10).

Overview

Show Restrictions
PosModel< PrevNext >Mad Max
 Mad Max (2015)
med.
1366x768
Normal Preset
2xAF
high
1920x1080
High Preset
6xAF
ultra
1920x1080
Very High Preset
12xAF
4K
3840x2160
High Preset
6xAF
NVIDIA GeForce GTX 1080 SLI (Laptop)
263
261
168
NVIDIA GeForce GTX 1070 SLI (Laptop)
265
262
NVIDIA GeForce GTX 1080 (Desktop)
327
239
215
77
NVIDIA GeForce GTX 1080 Mobile
242
223
82.1
NVIDIA GeForce GTX 980 SLI (Laptop)
277
244.9
230.8
NVIDIA GeForce GTX 1070 (Desktop)
187n2
67.75n2
NVIDIA GeForce GTX 1070 Mobile
177
166
NVIDIA GeForce GTX 980 Ti
306
197
180
65
AMD Radeon R9 Fury
247
153
144
55
AMD Radeon R9 Nano
144
52.7
NVIDIA GeForce GTX 980
225.6
140.5
138.3
46.6
NVIDIA GeForce GTX 980 (Laptop)
262.45n2
147.8n2
136.6n2
48n2
AMD Radeon R9 390X
201.5
135.8
116.4
46
NVIDIA GeForce GTX 970M SLI
225
157.4
145.1
49.7
NVIDIA GeForce GTX 1060 (Desktop)
273
144
132
46.8
AMD Radeon RX 480 (Desktop)
133
119
41.1
NVIDIA GeForce GTX 1060 Mobile
124
114
41.3
NVIDIA GeForce GTX 970
237.9
139.3
126.05n2
44
AMD Radeon R9 290X
240
138
119
47.3
PosModel< PrevNext >Mad Max
med. high ultra 4K
NVIDIA GeForce GTX 980M
204.5n3
107.6n3
97.9n3
33.7n3
AMD Radeon R9 280X
190
107
91.4
35.4
AMD Radeon R9 380
175.4
93.4
84
30.3
NVIDIA GeForce GTX 960
172.4
89.2
80.5
27.6
NVIDIA GeForce GTX 1050 Ti Mobile
89.7
82.7
28.6
NVIDIA GeForce GTX 1050 Ti (Desktop)
79
26.9
NVIDIA GeForce GTX 970M
163.6n4
82.9n4
76.35n4
26
NVIDIA GeForce GTX 1050 (Desktop)
69
24.1
NVIDIA GeForce GTX 1050 Mobile
140.4
70.1
64.3
AMD Radeon R7 370
105.4
60
52.2
NVIDIA GeForce GTX 880M
145.3
76.6
67.9
24.1
NVIDIA GeForce GTX 950
140.5
69.6
64.9
21.4
AMD Radeon RX 460 (Desktop)
57.8
NVIDIA GeForce GTX 965M
139.3n3
69.9n3
63.8n3
20.6n2
NVIDIA GeForce GTX 870M
122
62
56.2
19
AMD Radeon R9 M390
111
57
48.8
17.6
NVIDIA GeForce GTX 960M
98.5n3
48.8n3
44.9n3
14.9
NVIDIA GeForce MX150
72.6
37.1
34.5
NVIDIA GeForce GTX 860M
64.6
34.1
29.6
10.2
NVIDIA GeForce GTX 950M
65.1n2
33.1n2
30.85n2
11
PosModel< PrevNext >Mad Max
med. high ultra 4K
AMD Radeon R9 M385X
47.9
32
29.1
NVIDIA GeForce GTX 850M
78.2
38.7
35.6
11.3
AMD Radeon R9 M280X
50.1
28.6
25
NVIDIA GeForce 945M
65.3
31.6
29.4
NVIDIA GeForce GT 750M
39.3
19.6
17.8
NVIDIA GeForce 940MX
41.4n3
20.4n3
21.35n2
AMD Radeon RX Vega 8 (Ryzen 2000/3000)
43.5
22.7
20.7
NVIDIA GeForce 940M
41.5
20.3
AMD Radeon R9 M375
36.3
18.6
AMD Radeon R7 M370
38.4
17.1
13.8
NVIDIA GeForce 840M
34.4
17
15.5
AMD Radeon R7 512 Cores (Kaveri Desktop)
35.9
18.2
Intel Iris Pro Graphics 5200
31
14
NVIDIA GeForce GT 740M
26.9
11.9
11.2
NVIDIA GeForce 930M
34.5
16.4
15.4
Intel Iris Graphics 550
37
17.9
14.9
NVIDIA GeForce 830M
32
15.7
14.5
NVIDIA GeForce 920MX
26.2
14.6
Intel Iris Graphics 540
31.6n2
15.05n2
AMD Radeon R7 M265
32.4
16
13.9
PosModel< PrevNext >Mad Max
med. high ultra 4K
NVIDIA GeForce GT 640M
31.6
15.6
AMD Radeon R7 (Carrizo)
20.8
10.3
9
AMD Radeon R7 (Kaveri)
27.3
AMD Radeon R8 M365DX
17
8.8
AMD Radeon R7 M360
22.05n2
10.65n2
7.1
NVIDIA GeForce 920M
26.9
AMD Radeon R8 M445DX
25.5
11.3
AMD Radeon R7 M440
25.7
12
10
AMD Radeon R7 M340
25.8
11.8
10.2
Intel HD Graphics 630
25.2
11.1
Intel HD Graphics 530
23.5n2
10n2
9.3
AMD Radeon R5 (Bristol Ridge)
19
9.4
Intel HD Graphics 620
23.7
10.2
AMD Radeon R6 (Carrizo)
20.1
9.4
Intel HD Graphics 5600
16.4
7.6
NVIDIA GeForce GT 630M
20.2
AMD Radeon R5 M330
17.4
9.6
Intel HD Graphics 520
20.55n2
9.35n2
Intel Iris Graphics 6100
20.35n2
10
6.1
NVIDIA GeForce GT 720M
20.2
9.1
4.8
PosModel< PrevNext >Mad Max
med. high ultra 4K
AMD Radeon R5 M240
21.1
Intel HD Graphics 6000
19.3
Intel Iris Graphics 5100
18.7
Intel HD Graphics 4600
16.2n2
7n2
5.55n2
Intel HD Graphics 5500
17.1n2
8.1n2
7.4
AMD Radeon HD 7660G
16.8
Intel HD Graphics 610
13.4
Intel HD Graphics 4000
14.6
AMD Radeon R4 (Beema)
9.2
AMD Radeon HD 8350G
11
(-) * Smaller values are better. / n123 Number of benchmarks for this median value / * Approximate position


Legend
5Stutters – This game is very likely to stutter and have poor frame rates. Based on all known benchmarks using the specified graphical settings, average frame rates are expected to fall below 25fps
May Stutter – This graphics card has not been explicitly tested on this game. Based on interpolated information from surrounding graphics cards of similar performance levels, stutters and poor frame rates are expected.
30Fluent – Based on all known benchmarks using the specified graphical settings, this game should run at or above 25fps
40Fluent – Based on all known benchmarks using the specified graphical settings, this game should run at or above 35fps
60Fluent – Based on all known benchmarks using the specified graphical settings, this game should run at or above 58fps
May Run Fluently – This graphics card has not been explicitly tested on this game. Based on interpolated information from surrounding graphics cards of similar performance levels, fluent frame rates are expected.
?Uncertain – This graphics card experienced unexpected performance issues during testing for this game. A slower card may be able to achieve better and more consistent frame rates than this particular GPU running the same benchmark scene.
Uncertain – This graphics card has not been explicitly tested on this game and no reliable interpolation can be made based on the performances of surrounding cards of the same class or family.
The value in the fields displays the average frame rate of all values in the database. Move your cursor over the value to see individual results.
static version load dynamic
Loading Comments
Comment on this article
Please share our article, every link counts!
Florian Glaser, 2015-09-14 (Update: 2015-09-15)