Notebook reviews with Intel HD Graphics 4600 graphics card
Fujitsu Lifebook E544 Notebook Review
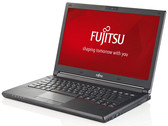
Reliable. Reliability is regarded as the main focus of a business laptop. Fujitsu's Lifebook E544 lineup provides a total package for 700 Euros (~$854). Our test reveals whether the mix of hardware, input devices, and security standards are satisfactory, or whether they are even good.
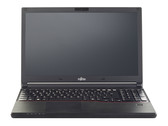
Intel Core i5-4210M, HD Graphics 4600, 14", 2.1 kgFujitsu Lifebook E554 Notebook Review
Not without faults. The Lifebook E554 is primarily aimed at corporate customers. The price level ranging from 600 to 1000 Euros (~$716 to ~$1194) also might make it interesting for private users. We have the current top model of the line at hand. It wants to entice potential customers with plenty of computing power, an IPS screen, a solid state drive, a 3G modem, and a very good battery life.
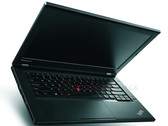
Intel Core i5-4210M, HD Graphics 4600, 15.6", 2.3 kgLenovo ThinkPad L440 20AT004QGE Notebook Review Update
Beefed up. The L-series is the affordable entry into the world of ThinkPads. It offers typing comfort, many interfaces including a docking port, and a rigid, timeless chassis. Lenovo now ships the classic with an SSD and HD+ screen. Will that make the L440 the ultimate laptop among the budget-priced pro-books?
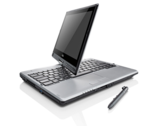
Intel Core i5-4300M, HD Graphics 4600, 14", 2.1 kgFujitsu LifeBook T734 Convertible Review
Old-school business. Versatility and mobility are very important aspects of Fujitsu's latest convertible. Digitizer and multi-touch are new input methods and UMTS provides the necessary mobility. But it is not enough for an impressive result.
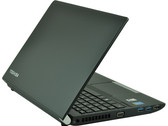
Intel Core i5-4200M, HD Graphics 4600, 12.5", 2 kgToshiba Portégé R30-A-15C Notebook Review
Ambitious. Full HD matte screen, speedy SSD, docking port, light weight, and long battery runtime - has Toshiba strung the perfect office bundle?
Intel Core i7-4600M, HD Graphics 4600, 13.3", 1.4 kgFujitsu LifeBook E744: Intel Core i7-4702MQ, 14.00", 1.7 kg
Review » Fujitsu Lifebook E744 (E7440MXP11DE) Notebook Review Update
Fujitsu Lifebook E734: Intel Core i5-4200M, 13.30", 1.7 kg
Review » Fujitsu Lifebook E734 (E7340MXEA1DE) Notebook Review Update
Fujitsu Lifebook E754: Intel Core i7-4702MQ, 15.60", 1.9 kg
Review » Fujitsu LifeBook E754 (E7540MXP11DE) Notebook Review Update
HP ProBook 650-H5G81ET: Intel Core i5-4200M, 15.60", 2.3 kg
Review » HP ProBook 650 H5G81ET Notebook Review Update
Lenovo G510-59416358: Intel Core i5-4200M, 15.60", 2.5 kg
Review » Lenovo G510 Notebook Review
Schenker B713: Intel Core i5-4310M, 17.30", 3.1 kg
Review » Review Clevo W670SZQ1 (Schenker B713) Barebones Notebook
Lenovo ThinkPad L540 20AV002YGE: Intel Core i5-4200M, 15.60", 2.3 kg
Review » Review Lenovo ThinkPad L540 20AV002YGE Notebook
HP ProBook 640 G1 H5G66ET: Intel Core i5-4200M, 14.00", 2.1 kg
Review » Review HP ProBook 640 G1 H5G66ET Notebook
HP ProBook 450 G1 E9Y58EA: Intel Core i7-4702MQ, 15.60", 2.4 kg
Review » Review Update HP ProBook 450 G1 E9Y58EA Notebook
Fujitsu LifeBook A544: Intel Core i5-4200M, 15.60", 2.2 kg
Review » Review Fujitsu LifeBook A544 Notebook
Lenovo ThinkPad Edge E540 20C60041: Intel Core i3-4000M, 15.60", 2.5 kg
Review » Review Lenovo ThinkPad Edge E540 20C60041 Notebook
HP ProBook 650 G1 H5G74E: Intel Core i3-4000M, 15.60", 2.3 kg
Review » Review HP ProBook 650 G1 H5G74E Notebook
Lenovo Thinkpad L440: Intel Core i5-4330M, 14.00", 2.3 kg
Review » Review Lenovo ThinkPad L440 Notebook
Nexoc B509II Ultra: Intel Core i7-4702MQ, 15.60", 2.2 kg
Review » Review Nexoc B509II Ultra (Clevo W550SU) Notebook
Toshiba Satellite P75-A7200: Intel Core i7-4700MQ, 17.30", 2.9 kg
Review » Review Toshiba Satellite P75-A7200 Notebook
Fujitsu LifeBook E744: Intel Core i5-4200M, 14.00", 1.8 kg
External Review » Fujitsu LifeBook E744
Toshiba Portege R30-A-17H: Intel Core i3-4100M, 13.30", 1.5 kg
External Review » Toshiba Portege R30-A-17H
Asus ASUSPRO Advanced B451JA-WO076G: Intel Core i5-4210M, 14.00", 2.2 kg
External Review » Asus ASUSPRO Advanced B451JA-WO076G
Toshiba Portege R30-A-17R: Intel Core i5-4210M, 13.30", 1.5 kg
External Review » Toshiba Portege R30-A-17R
Fujitsu LifeBook T734: Intel Core i5-4200M, 12.50", 2 kg
External Review » Fujitsu LifeBook T734
MSI CR70 2M: Intel Core i3-4100M, 17.30", 2.7 kg
External Review » MSI CR70 2M
Medion Akoya E6241-MD98562: Intel Core i3-4100M, 15.60", 2.4 kg
External Review » Medion Akoya E6241-MD98562
Lenovo ThinkPad L540-20AU002QGE: Intel Core i5-4330M, 15.60", 2.5 kg
External Review » Lenovo ThinkPad L540-20AU002QGE
Fujitsu Lifebook E544: Intel Core i5-4210M, 14.00", 2.1 kg
External Review » Fujitsu Lifebook E544
Fujitsu LifeBook A544: Intel Core i5-4200M, 15.60", 2.2 kg
External Review » Fujitsu LifeBook A544
Fujitsu LifeBook E554: Intel Core i5-4210M, 15.60", 2.3 kg
External Review » Fujitsu LifeBook E554
Asus K750JA: Intel Core i7-4700HQ, 17.30", 3.1 kg
External Review » Asus K750JA
HP ProBook 640-F1Q08ES: Intel Core i7-4702MQ, 14.00", 2 kg
External Review » HP ProBook 640-F1Q08ES
Toshiba Portege R30-A-15C: Intel Core i7-4600M, 13.30", 1.4 kg
External Review » Toshiba Portege R30-A-15C
Samsung 940X5J-K01US: Intel Core i5-4200U, 15.60", 1.8 kg
External Review » Samsung 940X5J-K01US
Toshiba Portege R30-A-13C: Intel Core i5-4200M, 13.30", 1.5 kg
External Review » Toshiba Portege R30-A-13C
Lenovo G510-59416358: Intel Core i5-4200M, 15.60", 2.5 kg
External Review » Lenovo G510
Lenovo G410-59410763: Intel Core i3-4000M, 14.00", 2.2 kg
External Review » Lenovo G410-59410763
Toshiba Satellite Pro C50-A-1KV: Intel Core i5-4200M, 15.60", 2.3 kg
External Review » Toshiba Satellite Pro C50-A-1KV
Toshiba Portege R30-A1302: Intel Core i7-4600M, 13.30", 1.5 kg
External Review » Toshiba Portege R30-A1302
Toshiba Satellite P50-A-13C: Intel Core i7-4700MQ, 15.60", 1.7 kg
External Review » Toshiba Satellite P50-A-13C
Toshiba Portege R30-A-14K: Intel Core i3-4000M, 13.30", 1.5 kg
External Review » Toshiba Portege R30-A-14K
Lenovo ThinkPad Edge E540 20C60041: Intel Core i3-4000M, 15.60", 2.5 kg
External Review » Lenovo ThinkPad Edge E540 20C60041
HP ProBook 450 G1: Intel Core i5-4200M, 15.60", 2.3 kg
External Review » HP ProBook 450 G1
MSI CR61-i5U45FHDW7: Intel Core i5-4200M, 15.60", 2.5 kg
External Review » MSI CR61-i5U45FHDW7
HP Spectre 13t-3000: Intel Core i5-4200U, 13.30", 1.4 kg
External Review » HP Spectre 13t-3000
Toshiba Satellite C75-A-13P: Intel Core i5-4200M, 17.30", 2.7 kg
External Review » Toshiba Satellite C75-A-13P
HP Split 13-m115sg x2: Intel Core i5-4200U, 13.30", 2.3 kg
External Review » HP Split 13-m115sg x2
Toshiba Satellite P75-A7200: Intel Core i7-4700MQ, 17.30", 2.9 kg
External Review » Toshiba Satellite P75-A7200
MSI CX61-20D-011UK: Intel Core i7-4702MQ, 15.60", 2.4 kg
External Review » MSI CX61-20D-011UK
Lenovo ThinkPad L540 20AV005GGE: Intel Core i5-4300M, 15.60", 2.5 kg
» Windows 10 support ending in 2025: Try out alternative operating systems without installing them
» Windows 10 support to end in 2025 - longer lifespan for older laptops and PCs still possible thanks to Google ChromeOS Flex